Article

Dynamic Factor Analysis of Trends in Temporal–Spatial Patterns of China’s Coal Consumption

1
School of Statistics, Dongbei University of Finance and Economics, Dalian 116025, China
2
School of Statistics, Shandong Institute of Business and Technology, Yantai 264005, China
*
Author to whom correspondence should be addressed.
Sustainability 2015, 7(11), 15119-15135; https://doi.org/10.3390/su71115119
Submission received: 23 September 2015 / Revised: 7 November 2015 / Accepted: 11 November 2015 / Published: 13 November 2015

Abstract

:
This paper analyzes coal consumption in the 31 provinces and regions of China from 1995 to 2012. Using spatial analysis in Arc geographical information systems (ArcGIS) and the concept of the center of gravity in physics, we explore the regional differences in temporal-spatial coal consumption and the factors influencing them. The results show that China’s coal consumption increased yearly, especially after 2003. It exhibits a marked spatial clustering phenomenon; consumption in the south and east exceeded that in the north and west respectively. Moreover, the center of gravity of consumption gradually moved toward the southwest, indicating reducing gaps in coal consumption between the north-south and the east-west regions. Both the level of economic development and coal consumption are positively related with regional coal production. Promoting urbanization and increasing the proportion of the tertiary industry can effectively reduce coal consumption and help readjust coal consumption patterns to sustainable levels.

1. Introduction

Energy forms the material basis for a country’s economic development. A country cannot develop and prosper without adequate energy resources. Energy consumption is known to increase sharply with economic development. Thus, the lack of energy resources can be a bottleneck to economic development and restrict economic growth [1,2]. In this context, while the impact of coal consumption on economic development has received extensive attention from scholars, their conclusions, which could be roughly divided into the following three categories, tend to differ. Some scholars note that there is a unidirectional causal relationship between coal consumption and economic growth. Thus, any reduction in coal consumption could lead to a fall in economic growth. Using the Toda-Yamamoto method, for instance, Bhattacharya et al. [3] confirmed that a causal relationship runs from coal consumption to economic growth. Bloch et al. [4] used data of production and consumption of coal resources and came to the same conclusion. Some scholars think that there is bidirectional causality between coal consumption and economic growth. Zhang and Yang [5] revealed the negative bidirectional causality between China’s coal consumption and economic growth, using the data of China’s coal consumption and GDP from 1978 to 2009. Moreover, they pointed out that the negative relationship between coal consumption and economic growth might be attributed to the shift in economic development toward less energy intensive sectors. However, Gurgul and Lach [6] thought that there is no causal relationship between coal consumption and economic growth, which means that coal consumption does not affect economic growth. Li et al. [7] showed that the relationship between coal consumption and economic growth may differ across countries: they found evidence of a bidirectional causal relationship between coal consumption and economic growth for Germany, Russia, and Japan; a unidirectional causality from economic growth to coal consumption for China; and no causal relationships between coal consumption and economic growth for the USA and India. Scholars have also focused on the relationship between coal resource utilization and society and between coal resource utilization and the environment. Shahbaz et al. [8] used the error correction model to investigate the effects of South Africa’s coal consumption on the country’s environmental performance and showed a strong positive correlation between coal consumption and environmental degradation. Tiwari et al. [9] reached similar conclusions in the Indian context. Besides, Shan et al. [10] provided evidence of an upward trend in the use of coal, which is a significant source of air pollution, for space heating and cooking.
Different areas own different resource endowments and have varying levels of economic development. Both factors impact coal consumption. Chen et al. [11] analyzed the differences in coal consumption across various regions in the Chinese cement industry and found that the eastern region has the highest energy costs. Liu et al. [12] analyzed the relationship between coal consumption and economic growth by constructing a panel data model of China’s eastern, central, and western areas. A comparative analysis indicated that economic growth in the central region had a greater impact on coal consumption than economic growth in other regions, and the industrial structure in the eastern part of the country significantly impacted coal consumption compared to the other regions. Guo et al. [13] used cluster analysis to divide China’s provinces into four zones: high economic growth and high energy consumption zone, low economic growth and high energy consumption zone, low economic growth and low energy consumption zone, and high economic growth and low energy consumption zone. They established an error correction model showing that when investment in fixed assets and proportion of heavy industry increase, regional energy consumption intensity also increases; however, the extent of the impact on the energy consumption intensity varies among regions.
In recent years, geographical information systems (GIS), spatial analysis techniques, and spatial econometric models have become popular, as they allow analyses at the province level and also provide technical support for analyzing the spatial distribution of energy consumption. Chuai et al. [14] and Herrerias et al. [15] used ArcGIS spatial analysis to study the spatial distribution of energy consumption and carbon emissions and the spatial distribution of energy consumption intensity respectively for China’s provinces and regions. In addition, center of gravity models are advantageous as they can demonstrate development trajectories visually and quantitatively. Ren and Li [16] analyzed changing trends in China’s energy consumption. They concluded that the center of gravity of China’s energy consumption was gradually moving toward the southwest, and the gap in energy consumption between the east–west and north–south directions had reduced. Using the same idea of center of gravity and ArcGIS, Zhang et al. [17] showed that coal continued to be the main energy source in the central and western regions of China and that the regions consuming the majority of coal were mainly distributed in developed provinces such as Beijing and Tianjin.
The reviewed research indicates that a detailed analysis of China’s coal consumption is important to understand and predict China’s economic transition. The diverse geography and culture of China’s provinces leads to regional differences in coal consumption. Thus, it is important to conduct a representative analysis of the spatial and temporal distribution of coal consumption. This paper attempts to do this systematically using ArcGIS spatial analysis and the center of gravity calculation method. It also uses space measurement methods to quantitatively analyze the factors influencing coal consumption. In doing so, it hopes to contribute knowledge toward improving the distribution patterns of China’s coal consumption, reducing its overall coal consumption, and promoting the efficient use of coal resources.

2. Materials and Methods

2.1. Methods of Spatial Analysis

Spatial analysis combines the spatial location with attributes of geographical objects, the purpose being the extraction and scientific communication of spatial information, thus solving the practical problems of geographical space. The primary methods of spatial analysis comprise (i) dynamic analysis of space as in the hydrology model, spatial price rivalry model, alternative spaces model, and so on; (ii) spatial analysis of maps, such as the buffer in GIS and overlay analysis; and (iii) spatial analysis based on geographical information, namely, spatial information analysis. This paper utilizes the ArcGIS spatial analysis module to match China’s social and economic attributes pertaining to coal consumption to its geographical attributes [18]. It then analyzes the characteristics of the temporal and spatial evolution of China’s coal consumption.

2.2. Barycenter Model

The concept of the center of gravity originates from physics. It refers to the centralized point of gravitational force generated by various parts of a body. According to the center of gravity model, there is a point in the geographical space where all forces are relatively balanced. The barycenter concept provides a more intuitive depiction of the development path in quantitative and visual terms. Accordingly, it has been widely applied in research pertaining to temporal and spatial distributions. The Americans have used this concept since the 1970s to study geographic distribution in the social and economic context, as well as the field of natural resources, among others. Thereafter, Chinese scholars tried to use the same method to analyze spatial distributions in social and economic areas. For example, Buch et al. [19] used the barycenter model to investigate the foreign investments flowing among European regions. They concluded that these investments were not redirected between regions. Jin et al. [20] used GIS technology and the concept of the barycenter to analyze the environmental effects of foreign trade and its spatial variations in the eastern regions of China. Assuming an area consisting of N secondary regions, the concept of the center of gravity can be used to calculate the attribute of the area as follows:
X = M i X i M i  and  Y = M i Y i M i
In Equation (1), X represents the longitude of the center of gravity for the region, and Y represents the latitude. Xi and Yi respectively represent the longitude and latitude of the center of gravity in the No.i secondary region. Mi represents the attribute value of the No.i secondary region. This paper regards China as a whole, and its 31 provinces as second-level regions. The capitals of the provinces are selected as the second-area centers, and the attribute values are coal consumption and coal production of the 31 provinces.

2.3. Spatial Econometric Model

The term spatial econometric model mainly refers to the spatial lag model (SLM) and the spatial error model (SEM).
(1) The SLM is mainly used to analyze whether a variable has a diffusion effect in one interval. It is expressed as
Y = ρ W y + X β + ε
Y is the dependent variable, X is the n × k matrix of exogenous variables, ρ refers to the coefficient of spatial regression, W is the n × n spatial weight matrix, Wy is the spatial lag dependent variable, and ε denotes the stochastic error vector.
(2) According to the SEM, spatial dependence exists not only in the dependent variable but also in the stochastic error. Therefore,
{ Y = X β + ε ε = λ W ε + μ
In Equation (3), ε presents the stochastic error vector, λ is the spatial error coefficient of the n × 1 section-dependent variable vector, and μ is the stochastic error vector with a normal distribution.

2.4. Theoretical Hypothesis

(1) Hypothesis of the barycenter model
The hypothesis of the barycenter model states that if the geographic coordinates of a central city remain unchanged, the barycenter of coal consumption will change as coal consumption changes. In addition, if the proportion of one region’s consumption is large and grows fast, the barycenter of consumption will move toward that region.
(2) Hypothesis of the SEM
According to spatial econometrics, an economic geographic phenomenon observed in one unit regional space is correlated with the same phenomenon in a neighboring space unit. Over the years, the classic econometrics model has assumed that space is homogeneous by ignoring the spatial effect. The latter generates deviation in the model setting and makes the ordinary least squares estimation invalid [21]. However, spatial autocorrelation is an objective reality, and thus, an SEM must be established to overcome the space dependency that cannot be resolved by the ordinary least squares method.

2.5. Data Sources

This paper uses the coal consumption data of 31 provinces and regions in China during 1995 to 2012 to track the changing temporal and spatial distribution patterns of China’s coal consumption and to study the factors influencing the temporal and spatial distributions. Energy data are mainly sourced from the “China Energy Statistical Yearbook (2013) [22]” and “China Compendium of Statistics 1949–2009 [23].” The economic data are primarily sourced from the “China Statistical Yearbook (2013) [24]”, while data pertaining to the Tibet autonomous region come from the “Development Status and Future Trends Survey of Tibet Energy Industry 2014–2018 (http://www.askci.com)” and “Tibet Statistical Yearbook (2013) [25]”. Since Chongqing was not classified as a municipality until 1997, the data before 1997 are calculated via interpolation, which is based on the average growth rate for many years.

3. Temporal Evolution of China’s Coal Consumption

There are significant regional differences in China’s coal consumption. Further, differences in the levels of economic and technology development among provinces in different periods caused coal consumption patterns to change over time. The following subsections discuss the temporal and spatial characteristics of China’s coal consumption patterns.

3.1. Characteristics of Temporal Evolution

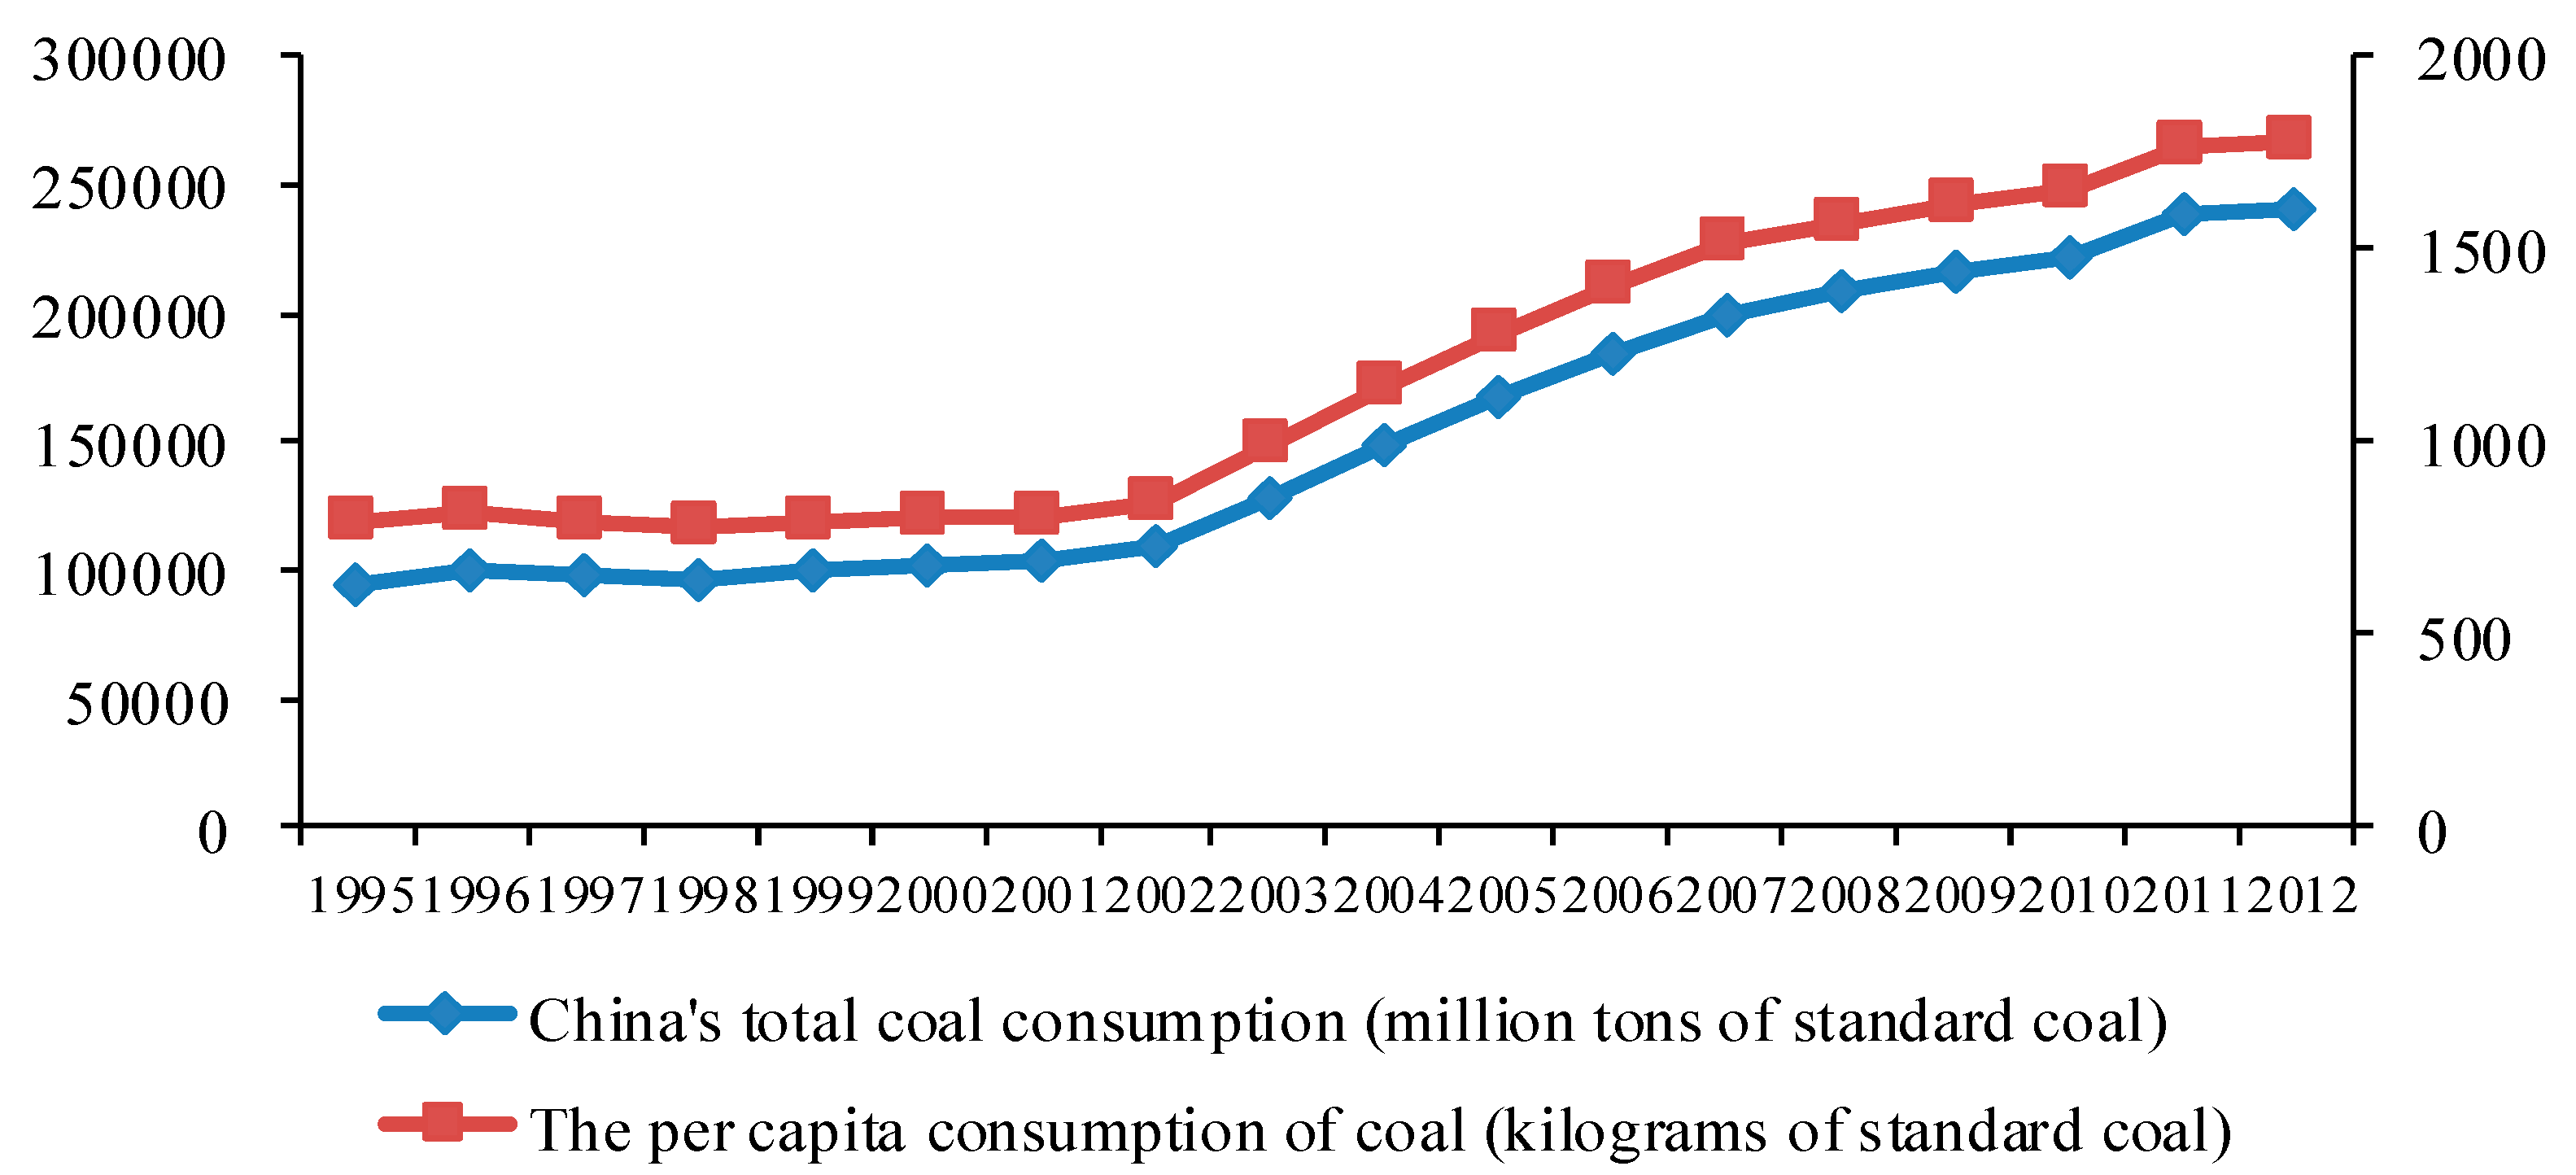
3.1.1. Upward Trends of China’s Total Coal Consumption and Per Capita Consumption

Figure 1 presents line charts of coal consumption and per capita coal consumption in China from 1995 to 2012.
Figure 1. Changes in China’s coal production and per capita coal consumption from 1995 to 2012.
Sustainability 07 15119 g001
The changing trends of China’s total coal consumption and per capita coal consumption are quite similar. From 1995 to 2002, the total coal consumption and per capita coal consumption remained mostly unchanged, showing a slightly declining trend. Notably, total coal consumption reduced between 1996 and 1998, from 994.4 million tons to 966.92 million tons of standard coal. Coal consumption per capita reduced from 812 kilograms to 775 kilograms of standard coal. However, both types of consumption have increased rapidly since 2003. Coal consumption in 2003 was 128,640.67 million tons of standard coal. The figure reached 240,846.36 million tons of standard coal in 2012, which is 1.87 times of that in 2003, showing an annual average growth rate of 7.20%. Thus, the year 2003 marked an important turning point in terms of coal consumption for China.

3.1.2. Significant Spatial Clustering with Regard to China’s Coal Consumption

Moran’s I is an important index used to test whether the attribute value of one element is correlated to that of the neighboring space. It contains three categories: positive correlation, negative correlation, and noncorrelation. When Moran’s I is greater than 0, the elements are positively correlated, suggesting that the same changing trend exists between the attribute value of one unit and that of the neighboring space unit. When Moran’s I is equal to 0, the elements are not correlated, indicating that there is no interaction between two neighboring regions. When Moran’s I is less than 0, they are negatively correlated, indicating opposing trends between two neighboring regions. Table 1 lists Moran’s I values of coal consumption in China’s provinces from 1995 to 2012, which are calculated using the software GeoDa.
Table 1. Moran’s I values of China’s provincial coal consumption.
Years199519961997199819992000200120022003
Moran’s I0.21530.20400.22310.20190.22680.23030.24150.21470.1938
Z-value3.10783.02133.14982.90313.42783.33273.65603.17822.8771
P-value0.0100.0050.0080.0100.0060.0060.0050.0060.012
Years200420052006200720082009201020112012
Moran’s I0.19540.19860.19690.19120.19330.19210.19180.18780.1779
Z-value2.72812.86222.98472.87342.90312.94212.96782.91322.8662
P-value0.0140.0140.0120.0110.0160.0140.0120.0120.011
From 1995 to 2012, Moran’s I values of coal consumption in China’s provinces were positive and passed the significance test at the 95% confidence interval. This shows that China’s coal consumption has been in a state of accumulated development and that neighboring provinces show the same changing trends. Moran’s I values from 1995 to 2002 are greater than 0.2, indicating that there are significant spatial agglomeration effects. After 2003, Moran’s I values decreased continuously, reaching a minimum value of 0.1179 in 2012; however, the spatial agglomeration effects were still significant. Overall, China’s coal consumption shows an unbalanced development trend that has weakened slightly over time, but the spatial agglomeration effects still remain significant.

3.2. Characteristics of Space Pattern Evolution

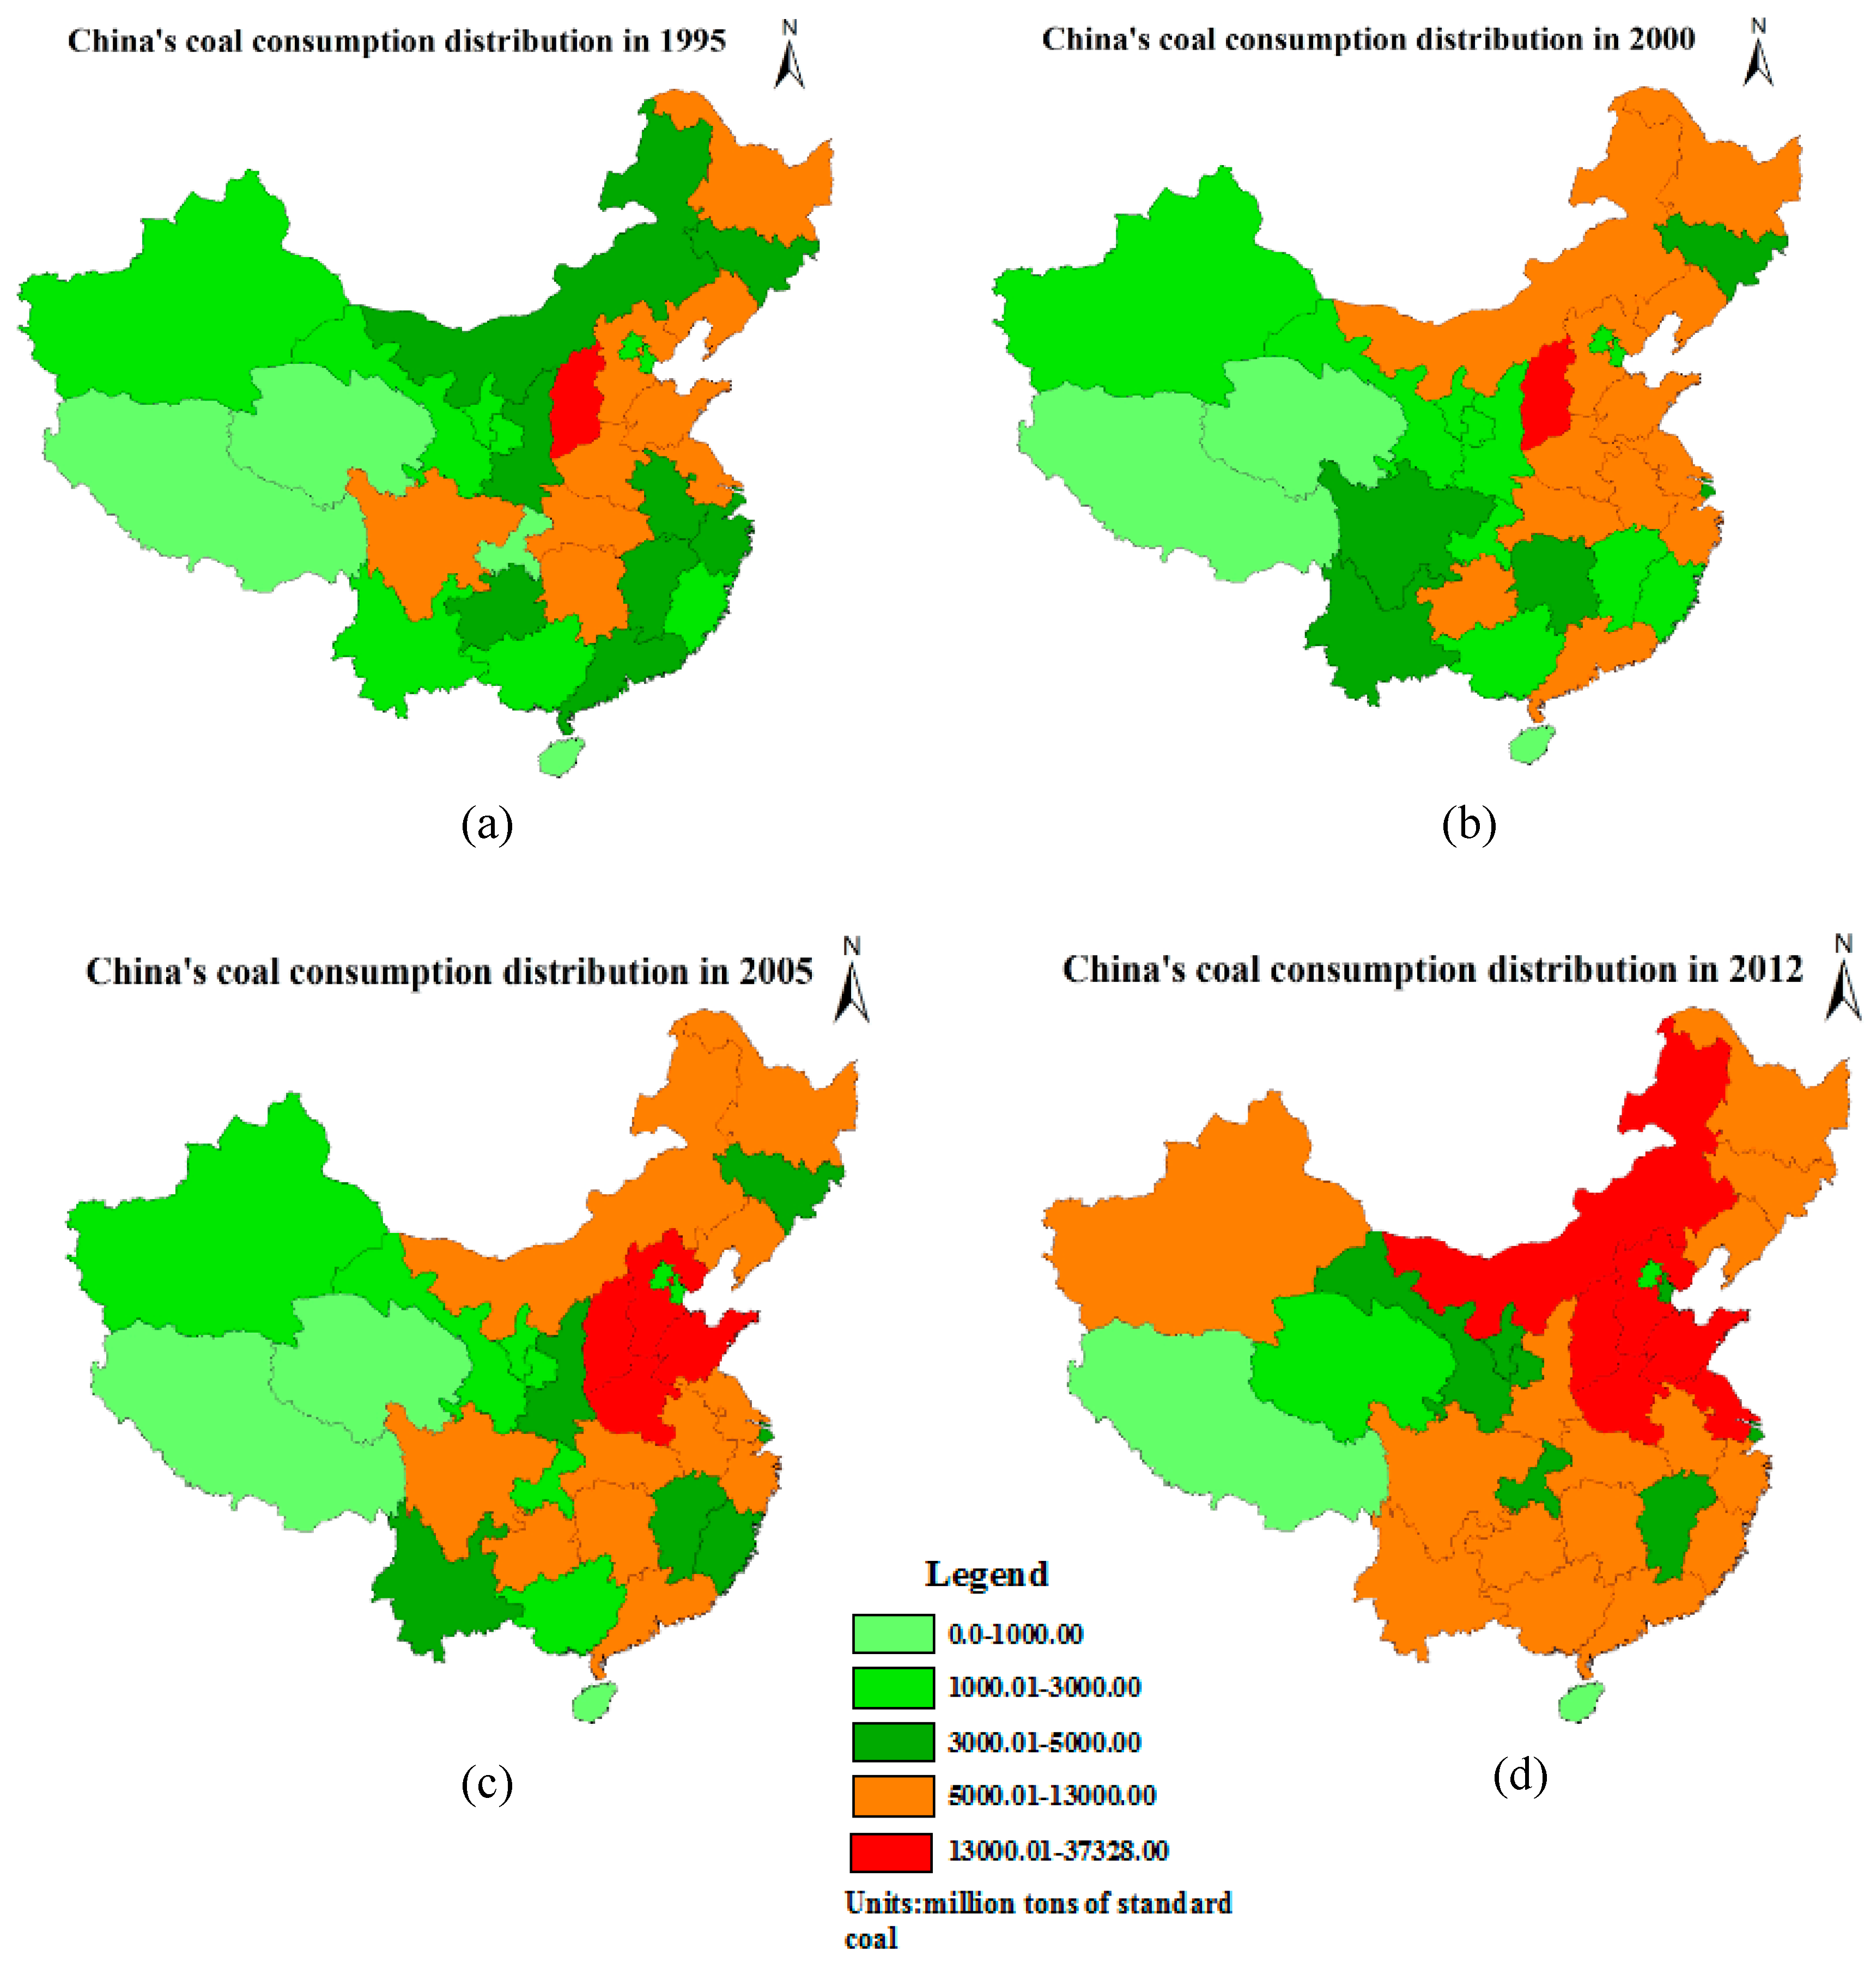
3.2.1. Coal Consumption in Different Provinces and Regions of the Country

Different provinces and regions have their own characteristics of coal consumption, and the differences between them are quite significant. In 1995, the northern region of China (including Shanxi, Hebei, and Inner Mongolia) consumed the majority of the country’s coal, as did northeast China (including Heilongjiang and Liaoning). The top five provinces in terms of coal consumption in 1995 were Shanxi, Hebei, Shandong, Liaoning, and Jiangsu. The total coal consumption of these five provinces reached 386,127,600 tons of standard coal, accounting for 37.34% of the national total consumption (Figure 2a). Compared with 1995, China’s coal consumption patterns for 2000 remained almost unchanged; coal consumption of all provinces grew slightly and even decreased for some provinces such as Shanxi and Heilongjiang (Figure 2b). To some extent, coal consumption of all the provinces in China increased from 2000 to 2005. The consumption of Shandong, Sichuan, and Jiangsu increased rapidly, and thus, increasing coal consumption patterns gradually moved toward the southwest. Initially, Shanxi, Henan, and Hebei were the major centers of coal consumption. Meanwhile, developed provinces in the southern region, like Guangdong and Zhejiang, experienced a rapid increase in coal consumption (Figure 2c). From 2005 to 2012, China’s coal consumption patterns remained stable while the scale of coal consumption continued to increase for each province. By 2012, China’s coal consumption had reached 2,408,463,600 tons of standard coal, an increase of 43.90% over 2005. Accordingly, Shandong, Inner Mongolia, Shanxi, Hebei, and Jiangsu became the top five provinces in terms of coal consumption. The accompanying coal consumption patterns revealed Shanxi, Inner Mongolia, and Henan as the areas where coal consumption is predominantly concentrated in central China. The corresponding areas in the Bohai Coastal Region and the Yangtze Delta Area were Liaoning, Beijing–Tianjin–Hebei, and Shandong, and Jiangsu, Zhejiang, and Shanghai, respectively (Figure 2d).
Figure 2. Regional differences in coal consumption across China’s provinces and regions from 1995 to 2012.
Sustainability 07 15119 g002

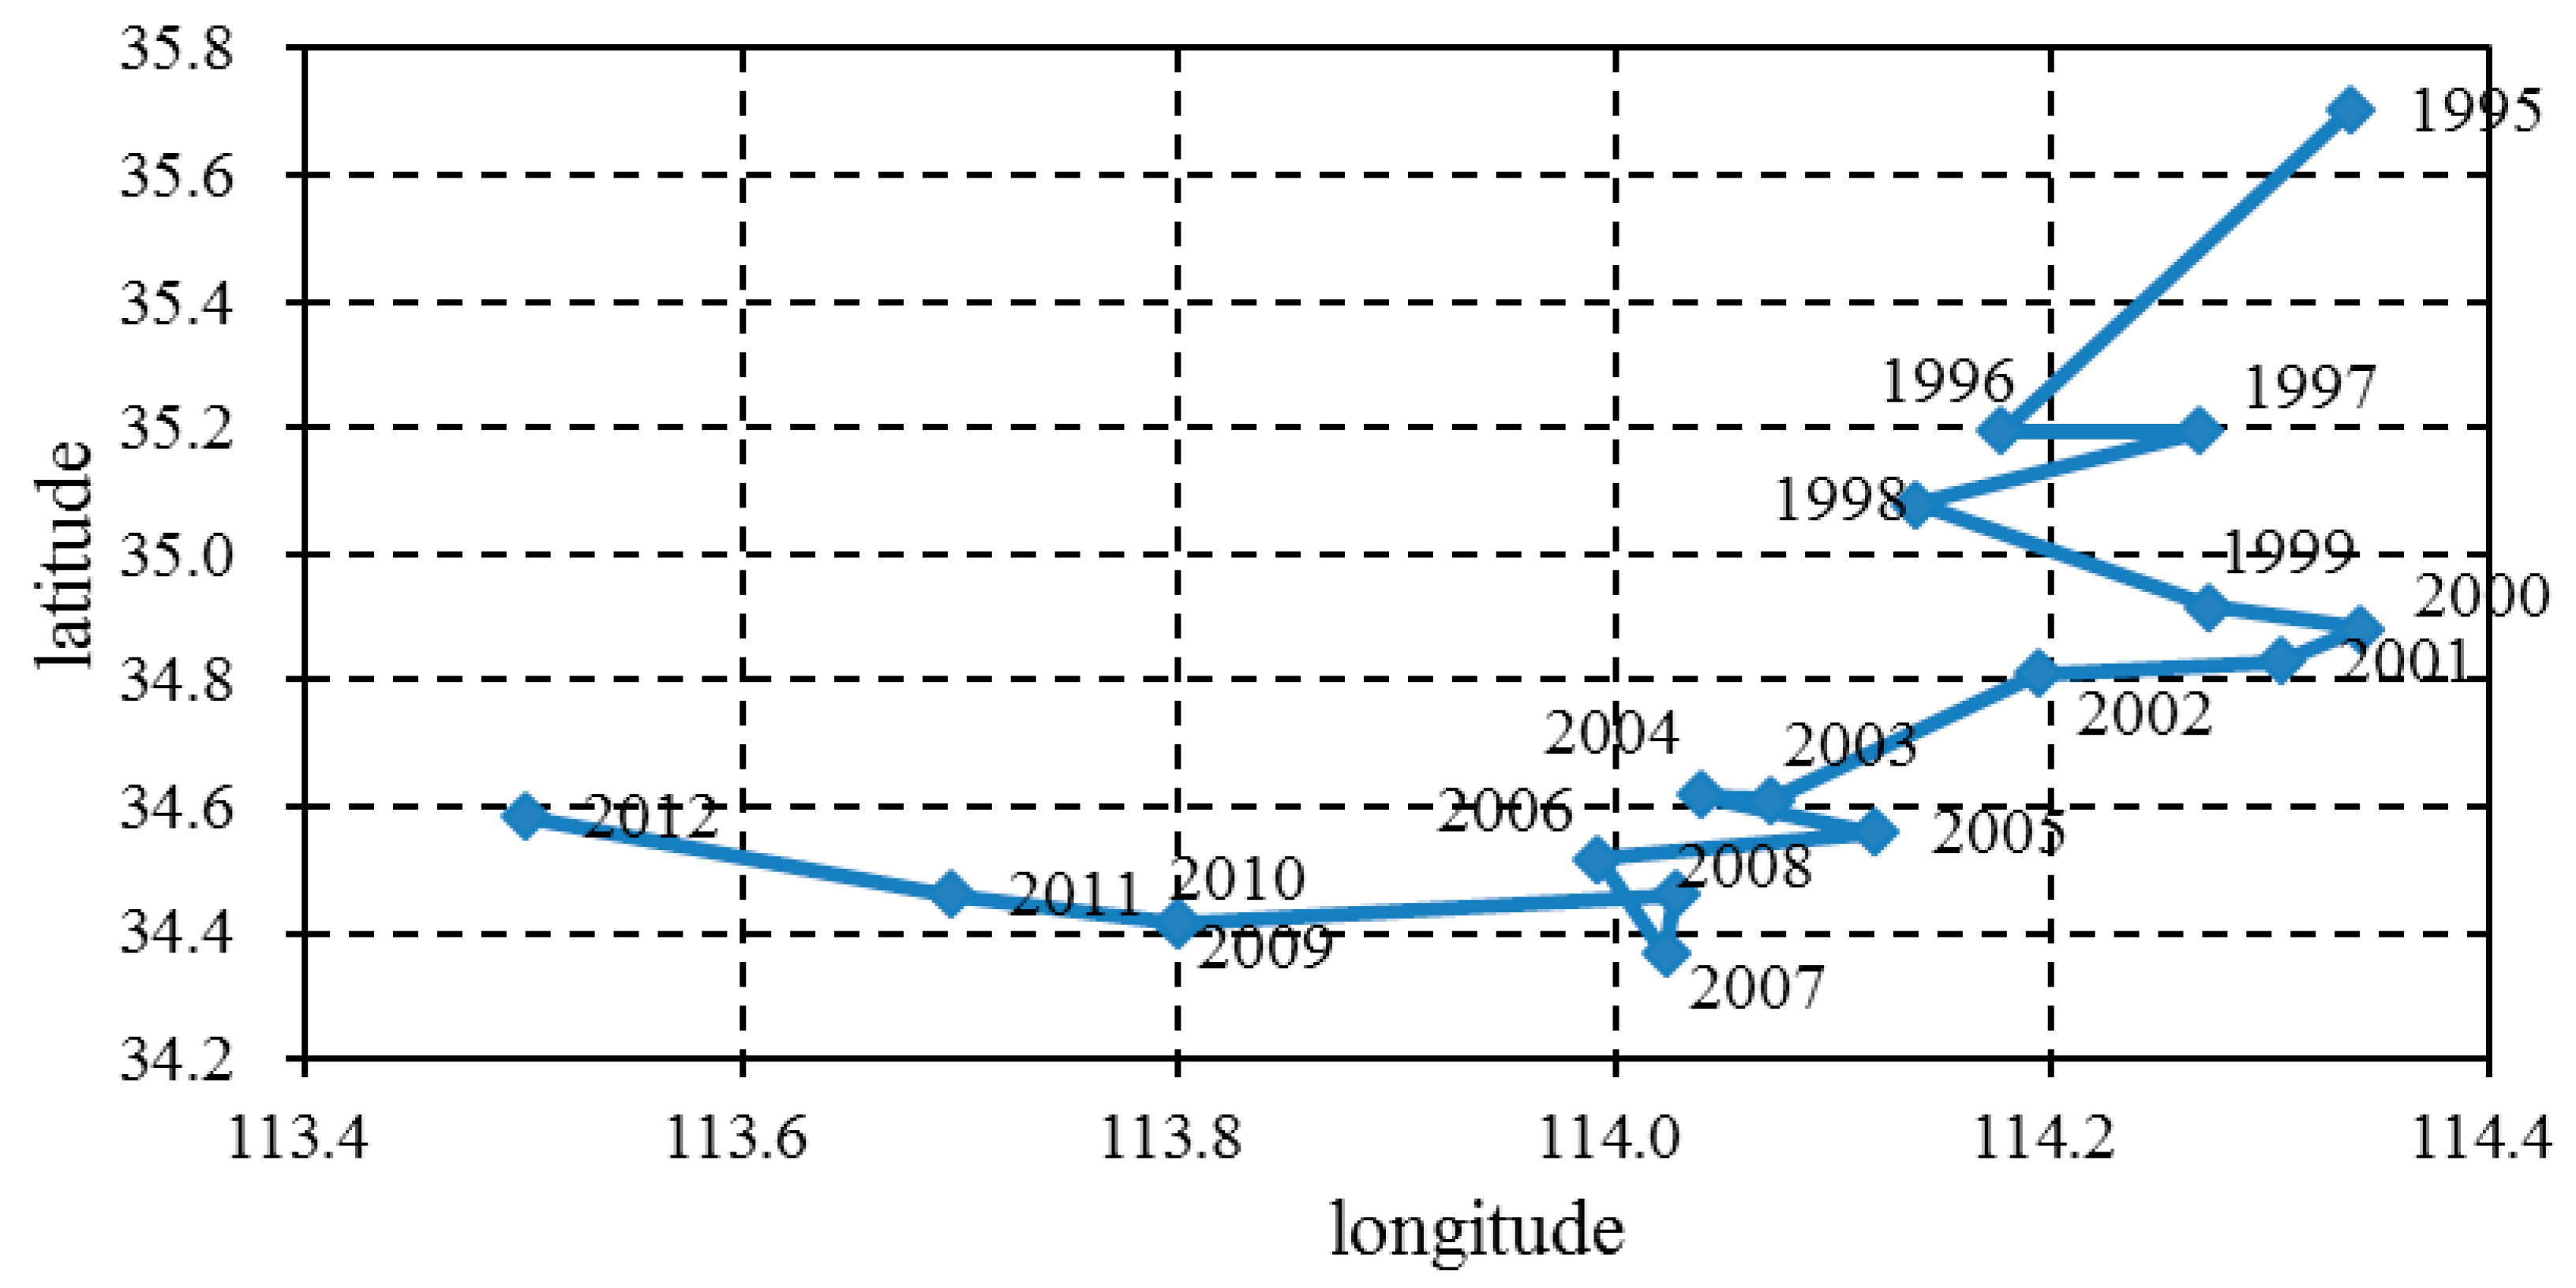
3.2.2. Change in the Center of Gravity of China’s Coal Consumption

Figure 3 is the trajectory map of the barycenter of China’s coal consumption, which is plotted according to the barycenter model and data of coal consumption by China’s provinces and regions from 1995 to 2012.
Figure 3. Tracking the path of the center of gravity of coal consumption in China from 1995 to 2012.
Sustainability 07 15119 g003
Figure 3 shows that the barycenter of China’s coal consumption is moving toward the west-south part of the country. It moved from (114.34° E, 35.10° N) to (113.50° E, 34.58° N), shifting westward by 0.84° and southward by 1.12°, thus revealing the significant reduction in the gaps between coal consumption in the east-west and north-south parts of the country. However, the gap in the north-south direction reduced much faster. This result regarding the changing trends in China’s barycenter of energy consumption is quite consistent with that of Ren and Li (2008) [16]. This phenomenon may be correlated with the fact that coal is the dominant energy resource in China, and thus, the evolution of coal consumption patterns plays an important role in the evolution of energy consumption patterns.
The trajectory of the center of gravity of China’s coal consumption can be roughly divided into three stages. The first stage is from 1995 to 2002, during which the center of gravity of coal consumption moved toward the southwest. The move toward the south is more obvious, with the change in the center of gravity by 0.84°. Northeast China’s total energy consumption (e.g., in Liaoning and Heilongjiang) grew very slowly; some may say it even stagnated. However, it increased in the southern provinces such as Shanghai and Zhejiang. The second stage of the trajectory of the center of gravity of China’s coal consumption is from 2003 to 2008. The center of gravity moved in a disorderly fashion, but its position remained relatively stable on an annual basis. The third stage is from 2009 to 2012, when the center of gravity rapidly moved westward at an average annual pace of up to 0.10°. This phenomenon resulted in the rapid increase of coal consumption in Shanxi and Ningxia.

4. Analysis of Influencing Factors

In order to study the characteristics of the temporal evolution of China’s coal consumption, this paper uses econometric models to quantitatively analyze the factors influencing the temporal changes in the country’s coal consumption patterns.

4.1. Index Selection

China’s coal consumption is influenced by many direct and indirect factors, such as coal resource endowments, the level of economic development, technology changes, and characteristics of industry development. After conducting a literature review, China’s coal consumption (MC) was selected as the dependent variable. The following were selected as independent variables.
(1) Endowment of coal resources
Geological circumstances ensure that the distribution of coal resources in China is extremely uneven. These resources are concentrated in the northern regions of the Kunlun–Qinling–Dabie Mountains. North China contains the majority of the country’s coal resources, accounting for 49.5% of national reserves, followed by Northwest China (30.39%). Coal production and consumption were mainly concentrated in these areas during the early stages of the country’s economic development. For example, the Shanxi and Hebei provinces in North China were the two of the country’s biggest coal producers and consumers in 1995. Therefore, natural endowment of coal resources is the most basic factor influencing coal production and consumption, and it determines the direction of regional development, especially at the early stages of development. Therefore, endowment of coal resources, which is represented by coal production (MP), was selected as one of the independent variables.
(2) Level of economic development
China’s current economic development mainly relies on coal consumption, and the relationship between economic development and coal consumption has aroused much interest in academic circles [3,4,5]. It is essential to analyze the level of economic development when studying coal consumption. In this paper, the gross regional product (GRP) represents the level of economic development.
(3) Urbanization level
Shan et al. showed that China’s rural population of 600 million consumes about 192 million tons of raw coal each year [10]. The rural population directly affects coal consumption, and the urbanization level, in turn, can reflect the changes in China’s rural population. In this paper, the urbanization level is measured in terms of the proportion of the urban population (CP).
(4) Industrial structure
The country’s industrial structure has a direct bearing on its coal consumption. The higher the proportion of the tertiary industry, the lower the coal consumption. In addition, even if the gross regional product remains unchanged, different industrial structures entail varying amounts of coal consumption [12]. Therefore, industrial structure was selected as one of the independent variables, and it is represented by the proportion of tertiary industry output (TE).
In addition, in order to further test for multicollinearity, this paper uses SPSS 19.0 software to calculate the tolerances and variables inflation factors (VIFs) of the four explanatory variables. The results are detailed in Table 2. The tolerances and VIFs are both less than five, and therefore, multicollinearity among the explanatory variables has been eliminated.
Table 2. Test results of multicollinearity among independent variables.
Independent VariableMPGRPCPTE
Tolerance0.8770.8060.6040.643
VIF1.1401.2411.6551.554

4.2. Empirical Process

Table 3 presents the results of the Lagrange multipliers estimated by the least squares method, which could be used as criteria for judging the manner of selection of the space model. The Lagrange multiplier (lag) passes the test at the significance level, but the Lagrange multiplier (error) fails to do so. Thus, compared to the SEM, the SLM is more appropriate.
Table 3. Results of the Lagrange multiplier judgment.
TESTMT/DFVALUEPROB
Moran’s I (error)0.21354.15790.0327
Lagrange Multiplier (lag)14.68640.0367
Robust Lagrange Multiplier (lag)13.52060.0320
Lagrange Multiplier (error)11.10980.5950
Robust Lagrange Multiplier (error)10.01520.4716
Lagrange Multiplier (SARMA)24.70160.0871
According to Table 4, compared with the results by the least squares method, the regression coefficients of the SLM are corrected, and the goodness of fit increases from 0.85 to 0.87. Thus, the explanatory ability is enhanced. Furthermore, the value of the log likelihood significantly increases to some extent, the Akaike information criterion (AIC) and Schwarz criterion (SC) decrease, and the estimated result of the SLM is thus more stable.
Table 4. Maximum likelihood estimation results of the econometric model.
VariableOLSSLM
CoefficientP-ValueCoefficientP-Value
C8111.00.00626642.40.0045
MP1.17440.00001.09660.0000
GRP0.29890.00000.29000.0000
CP38.8610.1247−69.8080.0768
TE−123.04−0.0902−95.9770.0861
ρ--0.31590.0149
R20.8516 0.8735
Log likelihood−297.07 −273.73
AIC584.13 571.47
SC591.30 583.07
The value of ρ in the SLM is 0.3159, and the corresponding P-value is 1.49%, which means that the SLM passes the test at the 5% significance level, and the model is appropriate in the given context. Since the coal production (MP) and gross regional production (GRP) of the model also pass the test at the 1% significance level, and the proportion of urban population (CP) and the proportion of tertiary industry output (TE) pass the test at the 10% significance level, it can be concluded that the model fits well.
Additionally, the Breusch-Pagan test was used to test heteroscedasticity for the spatial lag model. The results provide a test value of 3.6598, and the P-value is 0.4540, indicating that there is no heteroscedasticity in the spatial lag model and that the fitting model coincides well with the theoretical assumption.

4.3. Main Conclusion

(1) There is a significant spatial clustering effect of coal consumption among provinces. The value of ρ in the SLM is 0.3159, which means that the coal consumption of two adjacent provinces follows the same trend; in other words, provinces with high coal consumption cluster together as do those with low coal consumption. Factors such as geographical position, resource endowment, and transportation costs may be attributed to this phenomenon.
(2) The increase in coal production drastically increases coal consumption. There is a significant positive correlation between coal production and coal consumption for all provinces, and the correlation passes the test at the 1% significance level. The regression coefficient of the model is 1.0966, which means that when regional coal production increases by 10,000 tons of standard coal, coal consumption will increase by 10,966 tons of standard coal. The fact that coal consumption is higher than production suggests that a gap exists between the supply and demand of China’s current coal consumption. It is still necessary to import coal, especially in the southeast coastal areas, to completely meet consumption needs. China’s coal imports increased rapidly from 126 million tons in 2009 to 327 million tons in 2013 and increased by 160% in four years since China’s change in role from a net exporter to a net importer of coal. In addition, Wang et al. (2013) predicted that China’s coal production will peak in 2025, its coal demand will reach 612 million tons according to conservative estimates, and imports will rise to 222 million tons, accounting for 36.27% of the coal demand. It is thus increasingly urgent to adjust the structure of China’s energy consumption and reduce its coal consumption.
(3) Some provinces suffer from resource depletion and environmental pollution, which are masked by economic development. Here, the correlation between the level of economic development and coal consumption is positive and significant at the 1% level. In the SLM, the regression coefficient of GRP is 0.2900; thus, when the GRP increases by 100 million yuan, coal consumption will increase by 0.2900 tons of standard coal. However, China’s energy consumption intensity in 2012 was 0.8012 tons of standard coal/ten thousand yuan, which is 3.3 times that of the United States and 2.5 times that of the world average. This result also indirectly confirms that China’s energy consumption is still largely dependent on coal. Rapid economic growth across the country has dramatically increased the consumption of energy resources, particularly coal, which shows that China’s economic development comes at the expense of high energy costs, environmental pollution, and ecological imbalance. Therefore, scholars increasingly focus on advocating a sustainable and environmentally friendly pattern of economic development, and provinces of high-energy consumption should focus on these aspects in particular.
(4) The urbanization level is an important factor affecting coal consumption. To some extent, the proportion of the urban population reflects the level of urbanization, and it is negatively related to coal consumption. In the SLM, the regression coefficient of the proportion of urban population is −69.808 and is significant at the 10% level, showing that when the proportion of the urban population is increased by 1%, coal consumption will reduce by 698,080 tons of standard coal. Coal consumption mainly includes industrial coal and residential coal. Moreover, the use of coal for space heating and cooking in China’s rural areas is increasing [10]. Compared with the urban population, the rural population consumes more coal, thus indicating why the urbanization level affects coal consumption.
(5) There is negative correlation between the proportion of tertiary industry output and coal consumption. In the SLM, the regression coefficient of the proportion of tertiary industry output is −95.977, and it is significant at the 1% level; if the proportion of tertiary industry output is increased by 1%, coal consumption will reduce by 959,770 tons of standard coal. The secondary industry mainly includes the industrial sector and the construction industry, whose energy consumption is very high, especially the heavy industry. In contrast, the tertiary industry consumes less energy. In 2013, China’s first, second, and third industry proportions were 15%, 52%, and 33% respectively, and the corresponding world averages are 5%, 31%, and 64%. These results indicate that China should be proactive in adjusting its industrial structure by promoting the development of the tertiary industry, and reducing energy consumption effectively.

5. Recommendations

The distribution patterns of China’s coal consumption have changed over time. The coal consumption of China’s provinces and regions is increasing, but its growth rates differ across provinces. Thus, the regional differences are narrowing. In addition, the empirical results show that coal production, level of economic development, industrial structure, and other factors have an effect on the distribution patterns of China’s coal consumption. Therefore, after uncovering the characteristics of the temporal and spatial patterns of China’s coal consumption, the results of this paper drive us to make the following recommendations.

5.1. Management of Coal Resources by Regional Differentiation and Improving Interaction among Provinces and Regions

Coal resource endowments obviously differ among China’s provinces and regions. Thus, it is necessary to devise and implement customized management policies concerning coal resources. The northern regions, which are rich in coal resources, should tap them strategically. The manner of utilization of the existing coal resources (e.g., conversion rate) should be improved, and clean energy options should be explored simultaneously. Efforts should be made to conserve coal resources and ensure that sustainable utilization patterns are achieved and maintained. In addition, areas with poor coal resources can tap into other local resources like wind and solar energy. Energy-saving mechanisms and technological advancements can help provinces conserve, develop, and expand their renewable energy resources.
The obvious spatial correlations in China’s coal consumption mean that coal consumption will be affected by that of the neighboring provinces. Thus, policy makers should consider not only the energy environment in the given region but also the influences of neighboring provinces on the coal consumption of that region. Besides, coordinated regional development, strengthened communication between neighboring provinces and regions, and improved technology and skill sets can help overcome the barriers inherent between areas of high-energy consumption and low-energy consumption.

5.2. Improving Coal Transportation Capacity and Alleviating the Imbalance between Coal Supply and Demand

The empirical results show increasing coal production can promote coal consumption on the whole, but the degree to which coal production affects coal consumption varies among the provinces and regions. Comparing coal production and coal consumption among China’s provinces and regions shows that the trends in China’s coal supply and demand are reverse of those indicated by the geographical distribution. Provinces with higher coal production usually have lower coal consumption, such as in Shanxi province and Inner Mongolia, whose coal consumption is far less than the production. Further, provinces with lower coal production usually have higher coal consumption, as in the case of Guangdong province and Jiangsu province, whose coal consumption is significantly greater than their production. The huge spatial mismatch between coal production and consumption is one of the most important causes of the imbalanced distribution patterns of coal consumption.
In order to maintain the balance between coal supply and demand, China has resorted to long-distance coal transportation, which, however, is plagued by various problems such as high cost and low transport efficiency. The government should thus actively improve its coal transportation network and introduce advanced equipment and technology to enhance the efficiency of coal transportation. Such initiatives would ensure the stable development of the coal transportation industry, easing the contradictions between coal supply and demand across China’s provinces and regions.

5.3. Speeding up the Process of Urbanization and Promoting Clean Energy

As stated previously, certain provinces and regions of China have sacrificed the environment and ecological balance in the pursuit of economic development. One of the key reforms of China’s government, urbanization has a decisive influence on the creation of a harmonious society and optimal allocation of resources. Besides, the results of the above analysis show that increasing urbanization is beneficial to reducing coal consumption. Therefore, in order to realign coal consumption patterns, the government should actively promote the urbanization process. Moreover, urbanization should be pursued in a planned scientific manner based on local realities such as resource availability, the level of industrial development, resource consumption, state of the environment, and available scientific knowledge and technology. Additionally, the proportion of coal usage may be reduced significantly by improving coal usage efficiency and promoting clean energy resources such as solar and wind energy.

5.4. Adjusting the Industrial Structure and Raising the Proportion of the Tertiary Industry

Currently, China’s secondary industry accounts for a bigger proportion of its total industry, and the growth in the heavy industry further increases this proportion. Therefore, it is necessary to control the speed and scale of the development of the secondary industry and heavy industry sectors. Industrial applications that require excessive use of iron, steel, and cement require novel technologies to optimize their coal consumption. Simultaneously, the industrial structure should be adjusted reasonably in order to actively promote its transformation into a structure dominated by the tertiary industry. These efforts would help create a “low investment, low consumption, high efficiency” pattern of economic development. It is also necessary to improve industrial productivity and support investment to new industries that can promote economic growth and reduce coal consumption, and realign the regional industry layout.

6. Conclusions

Some scholars, such as Elliott et al. [26], have analyzed economic issues at the city level. However, the manner and type of data collection for coal consumption differ among cities. Moreover, many a time, the data are incomplete, which may influence the accuracy and reasonableness of the model. Improvements in China’s energy data collection will help researchers conduct more detailed analyses on coal consumption at the city level in the near future.

Acknowledgments

This research is supported by the Supporting Project for Characteristic Subject Construction at Dongbei University of Finance and Economics (No: XKT-201413) and the Collaborative Innovation Project for Energy Economics of Shandong Province (No: 2014SDXT013).

Author Contributions

Yuhuan Sun had the original idea for the study. Qian Li was responsible for data collection. Yuhuan Sun, Qian Li, and Ting Chen carried out the analyses. All authors drafted the manuscript and have read and approved the final version.

Conflicts of Interest

The authors declare no conflict of interest.

References

  1. Shahbaz, M.; Hye, Q.M.A.; Tiwari, A.K.; Leitão, N.C. Economic growth, energy consumption, financial development, international trade and CO2 emissions in Indonesia. Renew. Sustain. Enery Rev. 2013, 25, 109–121. [Google Scholar] [CrossRef] [Green Version]
  2. Song, M.L.; Wang, S.H.; Yu, H.Y.; Yang, L.; Wu, L. To reduce energy consumption and to maintain rapid economic growth :Analysis of the condition in China based on expended IPAT model. Renew. Sustain. Enery Rev. 2011, 15, 5129–5234. [Google Scholar] [CrossRef]
  3. Bhattacharya, M.; Rafiq, S.; Bhattacharya, S. The role of technology on the dynamics of coal consumption–economic growth: New evidence from China. Appl. Energy 2015, 154, 686–695. [Google Scholar] [CrossRef]
  4. Bloch, H.; Rafiq, S.; Salim, R. Coal consumption, CO2 emission and economic growth in China: Empirical evidence and policy responses. Energ. Econ. 2012, 34, 518–528. [Google Scholar] [CrossRef]
  5. Zhang, W.; Yang, S. The influence of energy consumption of China on its real GDP from aggregated and disaggregated viewpoints. Enery Policy 2013, 57, 76–81. [Google Scholar] [CrossRef]
  6. Gurgul, H.; Lach, L. The role of coal consumption in the economic growth of the Polish economy in transition. Enery Policy 2011, 39, 2088–2099. [Google Scholar] [CrossRef] [Green Version]
  7. Lei, Y.; Li, L.; Pan, D. Study on the relationships between coal consumption and economic growth of the six biggest coal consumption countries: With coal price as a third variable. Energy Procedia 2014, 61, 624–634. [Google Scholar] [CrossRef]
  8. Shahbaz, M.; Kumar, T.A.; Nasir, M. The effects of financial development, economic growth, coal consumption and trade openness on CO2 emissions in South Africa. Enery Policy 2013, 61, 1452–1459. [Google Scholar] [CrossRef] [Green Version]
  9. Tiwari, A.K.; Shahbaz, M.; Hye, Q.M.A. The environmental Kuznets curve and the role of coal consumption in India: Cointegration and causality analysis in an open economy. Renew. Sust. Energy Rev. 2013, 18, 519–527. [Google Scholar] [CrossRef] [Green Version]
  10. Shan, M.; Wang, P.S.; Li, J.R.; Yue, G.X.; Yang, X.D. Energy and environment in Chinese rural buildings: Situations, challenges, and intervention strategies. Build. Environ. 2015, 31, 271–282. [Google Scholar] [CrossRef]
  11. Chen, F.; Shen, L.; Liu, L.; Gao, T.M. Spatial differences of exergy use of cement manufacturing industry in China based on extended exergy accounting method. J. Geogr. Sci. 2015, 25, 1393–1407. [Google Scholar] [CrossRef]
  12. Liu, M.Z.; Wang, R.; Zhou, M.H.; Zhang, J. The comparative analysis of regional coal consumption effect in China-empirical evidence based on panel data model. Resour. Sci. 2011, 39, 1641–1649. (In Chinese) [Google Scholar]
  13. Guo, J.; Wang, L.; Sun, P. The analysis of influencing factors of Chinese regional energy consumption intensity. Resour. Sci. 2009, 31, 205–213. (In Chinese) [Google Scholar]
  14. Chuai, X.W.; Huang, X.J.; Wang, W.J.; Wen, J.Q.; Chen, Q.; Peng, J.W. Spatial econometric analysis of carbon emissions from energy consumption in China. J. Geogr. Sci. 2012, 22, 630–642. [Google Scholar] [CrossRef]
  15. Herrerias, M.J.; Cuadros, A.; Orts, V. Energy intensity and investment ownership across Chinese provinces. Energ. Econ. 2013, 36, 286–298. [Google Scholar] [CrossRef]
  16. Ren, Z.Y.; Li, Q. The temporal and spatial differences of China’s energy production and consumption since 1978. Acta Geogr. Sin. 2008, 12, 1318–1326. (In Chinese) [Google Scholar]
  17. Zhang, L.X.; Yang, Z.F.; Liang, J.; Cai, Y.P. Spatial variation and distribution of urban energy consumption from cities in China. Energies 2011, 4, 26–38. [Google Scholar] [CrossRef]
  18. Gao, C.; Wang, X.Y.; Jiang, T.; Jin, G. Spatial distribution of archaeological sites in lakeshore of Chaohu Lake in China based on GIS. Chin. Geogr. Sci. 2009, 19, 333–340. [Google Scholar] [CrossRef]
  19. Buch, C.; Kokta, R.; Piazoloc, D. Foreign direct investment in Europe: Is there redirection form the south to the east? J. Comp. Econ. 2003, 31, 94–109. [Google Scholar] [CrossRef]
  20. Jin, X.; Dong, S.; Luo, L.; Li, Y.; Yuan, C.; Shu, K.; Chen, J. Environment effects of foreign trade and its spatial variations in mid-eastern provinces and cities in China. Chin. Geogr. Sci. 2012, 22, 626–636. [Google Scholar] [CrossRef]
  21. Anselin, L. A test for spatial autocorrelation in seemingly unrelated regressions. Econ. Lett. 1988, 28, 335–341. [Google Scholar] [CrossRef]
  22. National Bureau of Energy Statistics Division. China Energy Statistical Yearbook; China Statistics Press: Beijing, China, 2013. (In Chinese) [Google Scholar]
  23. Department of Comprehensive Statistics of National Bureau of Statistics. China Compendium of Statistics 1949–2009; China Statistics Press: Beijing, China, 2009. (In Chinese) [Google Scholar]
  24. Department of Comprehensive Statistics of National Bureau of Statistics. China Statistical Yearbook; China Statistics Press: Beijing, China, 2013. (In Chinese) [Google Scholar]
  25. Bureau of Tibet Autonomous Region. Tibet Statistical Yearbook; China Statistics Press: Beijing, China, 2013. (In Chinese) [Google Scholar]
  26. Elliott, R.J.R.; Sun, P.Y.; Chen, S.Y. Energy intensity and foreign direct investment: A Chinese city-level study. Energy Econ. 2013, 40, 484–494. [Google Scholar] [CrossRef]

