1. Introduction
The last decade has witnessed climate change emerging as one of the most important and legitimate business concerns. An increasing number of firms have begun to consider global warming issues in their strategic management [
1,
2]. A number of countries have increased their levels of effort to mitigate global warming. For instance, China and South Korea, the world’s biggest and 7th biggest greenhouse gas (GHG) emitters as of 2010, respectively, announced their own voluntary medium-term mitigation goals to reduce carbon intensity by 40%–45% the 2005 level and GHG emissions by 30% the business-as-usual level by 2020, respectively [
3].
In response to global warming issues and increasing pressure for GHG emissions reduction, firms have shown different reactions. While some companies were reluctant to adopt carbon reduction activities, some others were willing to take advanced measures [
4,
5,
6]. Some studies have attempted to gain a better understanding of firms’ managerial responses to climate change [
7,
8,
9]. However, previous studies have been limited in the following ways: First, firms’ external stakeholders have been addressed as the strongest influencers for firms to take measures to mitigate global warming; however, the levels of environmental pressure by various stakeholders such as government, customers, competitors and the public on firms to respond to climate change that managers perceive and their actual effects on the adoption/implementation of climate change management practices have not been quantified. Second, there is little understanding about how each climate change management practice has been adopted and implemented across industries. Third, very few studies examined the real effects of a firm’s climate change practices on performance. In light of these gaps in the literature, this article makes three contributions. First, this research presents the extent of perceived pressure by stakeholders on firms to address climate change. Second, this study also assesses how the pressure exerted by each stakeholder actually affects the adoption and implementation of climate change management practices. Third, this article provides evidence that a firm’s practices in response to climate change actually contribute to sustainability performance, including operational performance as well as carbon reduction performance.
The rest of this paper is structured as follows: the next section identifies climate change management practices; stakeholders that may influence the response of a firm to climate change are identified and the expected results of climate change management practices are addressed; the methodology of the research is described, followed by a presentation and discussion of the results; finally, brief conclusions outlining managerial and policy implications are given.
2. Firms’ Climate Change Management Practices
This section identifies and suggests a list of climate change management practices (hereafter CCPs) available to firms in responding to climate change by synthesizing the previous research [
2,
3,
5]. Firms engage in a diverse range of management activities to respond to climate change, specifically to reduce or manage their greenhouse gas (GHG) emissions. Firms have typically focused on efforts to reduce emissions in production processes and their participation in the emission trading scheme (ETS). However, carbon footprint representing the sum of a product’s direct and indirect emissions in a firm’s entire value chain emerged as important, and, therefore, firms increasingly have paid more attention to product improvements and supply chain measures [
5,
10]. Collectively, those activities can be understood as CCPs that a firm can select and utilize in addressing global warming issues. The present article suggests a list of CCPs available to firms in responding to climate change by classifying the practices into six categories: low-carbon product development, process efficiency improvement, energy source substitution, organizational engagement, supply chain partner collaboration, and carbon offsetting.
Low-carbon product development includes activities focusing on the development of less carbon-intensive and more energy-efficient products as well as reducing the environmental burden across the product life cycle [
5,
6]. This practice also includes low-carbon technologies through incremental changes in existing products as well as carbon-free technologies through radical innovations. Sometimes, firms formally assess, monitor and reduce the carbon intensity of their products during the new product design and development process by utilizing “the design for the environment (DfE)” or eco-design tools.
“Process efficiency improvement” includes any activities conducted in a manufacturing site in order to improve the efficiency of existing production processes through better housekeeping and plant retrofit, overhauling the entire production process, energy system optimization, and energy recovery from waste materials [
8,
9,
11]. Process efficiency improvement can be also achieved by adopting the state-of-the art new process technologies; however, such radical innovations are intermittently used in industries as compared to incremental ones such as energy-saving technologies.
“Energy source substitution” is an option that firms can consider when they need to reduce indirect GHG emissions that are generated primarily from the use of electricity. By substituting existing energy sources with less carbon-generating fuels, such as liquid natural gas or renewable energy sources (e.g., photovoltaic and wind power), firms can lower the levels of their carbon inventory. However, the energy source substation depends heavily on the technological progress of the utility industry as well as the cost of substitutable energy sources [
3].
Firms need to increase the awareness of climate change and emissions reduction across the entire organization. Employee education about climate change issues and implementation of an internal emission trading scheme (ETS) can engage organizations in responding to climate change. Under the internal ETS, a firm assigns emission targets to its several plants or departments and allows them to trade their own emission credits when necessary to meet the internal emission reduction targets.
These types of CCPs abovementioned are frequently conducted within an individual firm. However, a firm’s response to the global warming issue often requires cooperation with external partners. “Supply chain partner collaboration” is an extended carbon reduction program to upstream supply chains. Firms share carbon information regarding their products and manufacturing processes with their suppliers in order to profile accurate carbon inventories. Hyundai Motor Company, for example, initiated a carbon management program for its supply chain that induced and supported its major first-tier suppliers to profile their own carbon inventory and implement emission reduction projects [
12]. Furthermore, collaborative R&D between focal firms and their suppliers to develop less carbon-intensive and/or carbon-free products is also an important part of the supply chain partner collaboration [
2].
The “carbon offsetting” includes activities whereby firms can utilize Kyoto Protocol mechanisms such as the ETS and clean development mechanism (CDM). Although it depends on the situation, firms can achieve their emission reduction targets with less effort by participating in and utilizing emission trading markets or carrying out CDM projects with other business partners [
2,
9,
11].
3. Stakeholder Pressure, the Adoption of CCPs, and Sustainability Performance
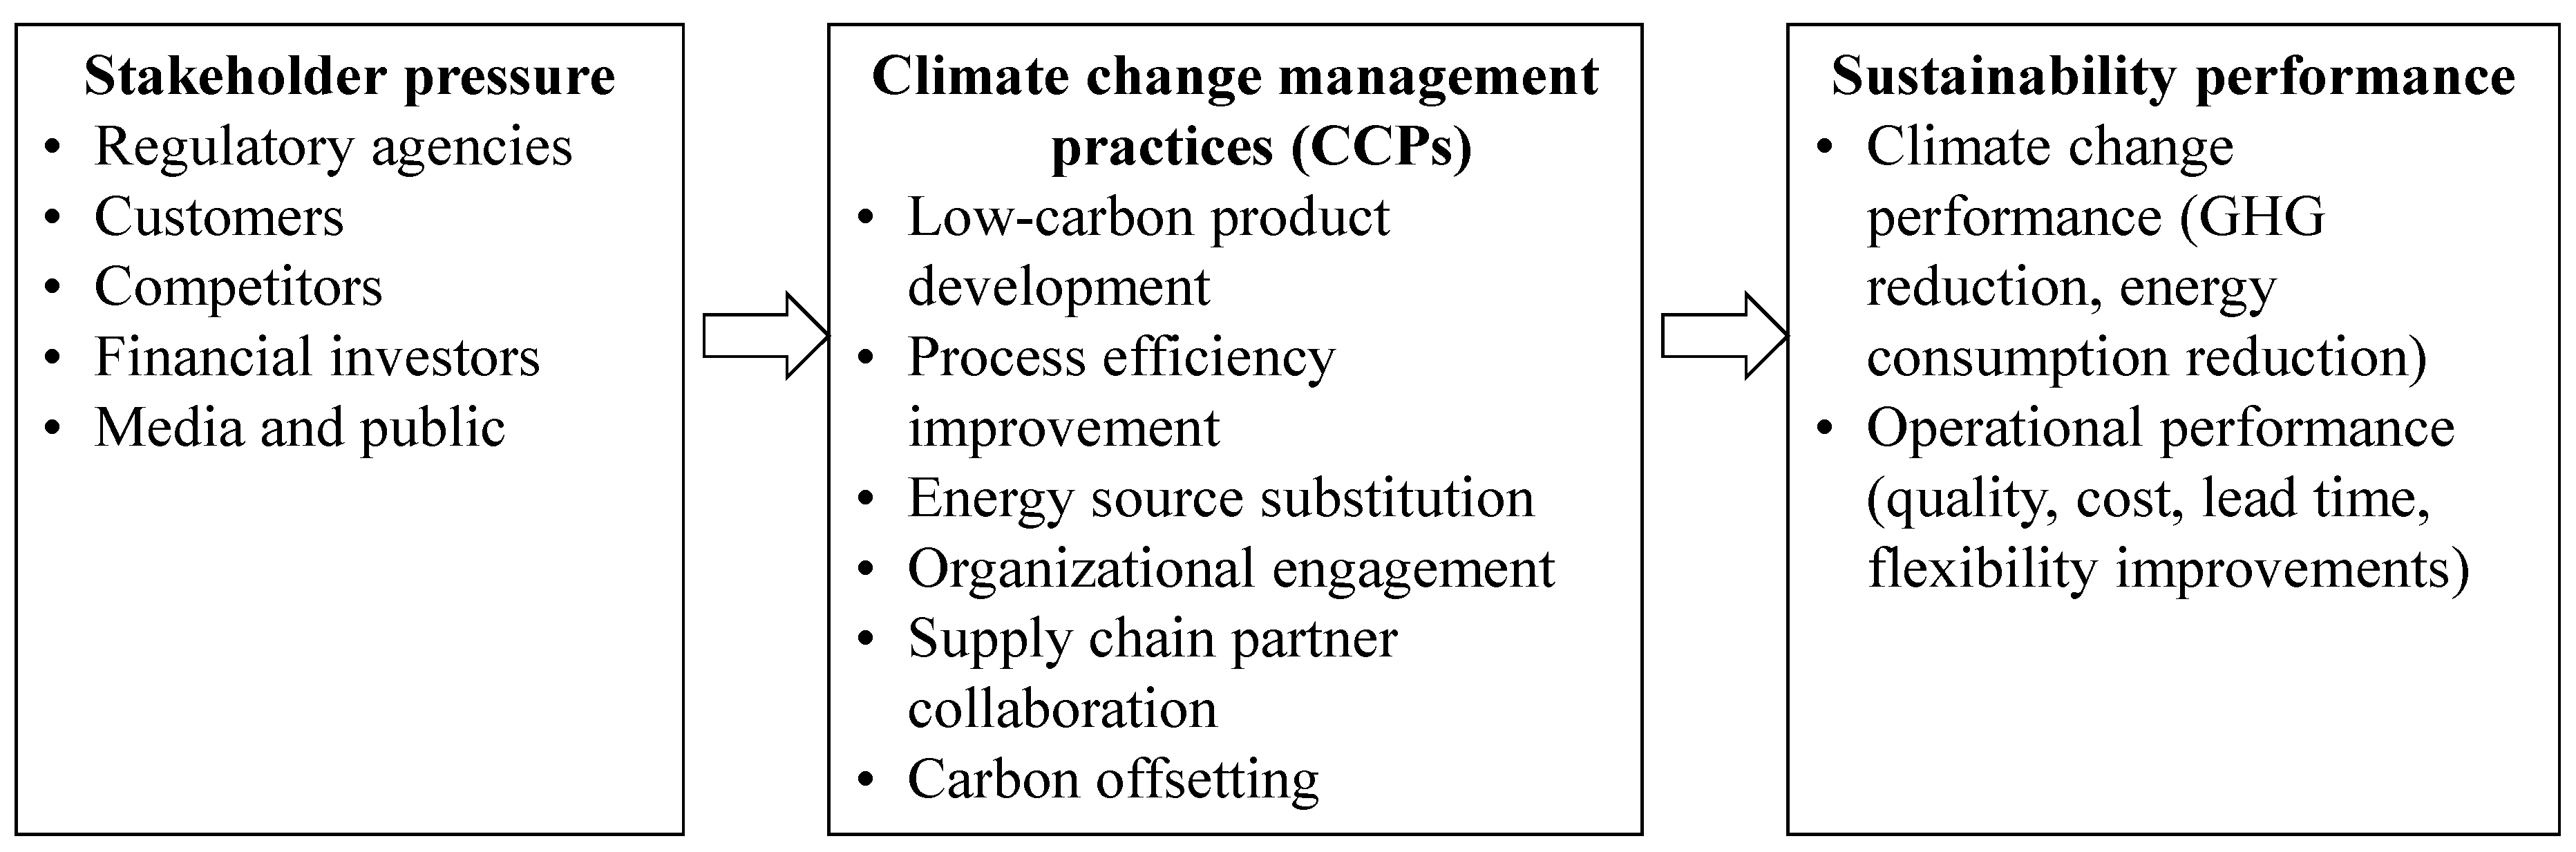
This section provides an outline of the South Korean climate change policies. Then, we classify important stakeholders and the pressure they exert on firms in regards to climate change issues. The effects of the adoption of CCPs on sustainability performance, including emission reduction and operational performance, are addressed. The relationships between stakeholder pressure, CCPs, and sustainability performance are illustrated in
Figure 1.
Figure 1.
Framework of research: stakeholder pressure, climate change management practices (CCPs), and performance.
Figure 1.
Framework of research: stakeholder pressure, climate change management practices (CCPs), and performance.
3.1. South Korean Policies on Climate Change
South Korea adopted the National Strategy for Green Growth in 2009, and its aims are to promote eco-friendly growth and contribute to international efforts to fight global warming. In accordance with this strategy, South Korea announced its national greenhouse gas (GHG) reduction goal of 30% below the business-as-usual projection by 2020. In 2010, the Framework Act on Low Carbon, Green Growth was enacted, which created the legislative framework for mid- and long-term emission reduction targets, cap-and-trade, carbon labeling, carbon disclosure, and other related policies. The Framework Act included a system of mandatory reporting of carbon emissions by all carbon- and energy-intensive industries, and provided a basis for the creation of a carbon trading scheme (ETS). As a precursor to the ETS, the Target Management Scheme (TMS), a greenhouse gas management program with 490 entities and 1570 sites, was introduced in 2010 and implemented in 2012. As of 2011, the TMS covered almost 68% of total GHG emissions in South Korea. It imposed GHG reduction and energy conservation targets on large-scale facilities that emit substantial quantities of GHGs and consume large amounts of energy. Importantly, it obligated them to meet their own targets. The legislation concerning the ETS—the Greenhouse Gas Emission Permit Allocation and Trade Act—was adopted in 2012. The ETS was originally scheduled to come into force in 2012, but the South Korean government delayed the start to give companies more time to prepare for the policy. Trading officially commenced on the South Korea Exchange in January 2013. The ETS is split into three phases: 2015–2017, 2018–2021, and 2022–2026. During the first phase, 525 of the country’s largest emitting companies, including power generators, petrochemical firms, steel producers, automobile makers, and electro-mechanical firms, have been given a fixed amount of permits to cover their emissions for the next three years.
3.2. The Effects of Stakeholder Pressure on Firms’ Responses to Climate Change
A variety of stakeholders maintain relationships with and affect firms. A firm’s attitude and practices towards sustainable development and climate change may change significantly depending on the degree of stakeholders’ concerns [
13,
14,
15]. However, the intensity of external pressure may vary according to country, industry, and stakeholder. With regards to the climate change issues, this article stresses five groups of stakeholders: regulatory agencies, customers, competitors, financial investors, and the media and public [
16].
When it comes to environmental issues including climate change, regulatory agencies are the most influential stakeholders to firms. New regulations and legislation force economy-driven corporate practices to evolve strategies that account for the environment. The role of regulations as an agent of evolution in corporate environmentalism has been reported in both Western [
17] and Asian countries [
18]. For instance, a South Korean report illustrates that firms in the energy-intensive sectors tend to have a more proactive stance than firms in the general manufacturing sector when addressing global warming issues. This is because energy-intensive companies are generally under strong pressure from the government that imposes nationwide regulations and forces these companies to disclose their carbon emissions [
8].
Customers including consumers and industrial customers are clearly becoming of increasing importance in corporate carbon management. The initial corporate response to climate change focused primarily on political and non-market components, usually to postpone the adoption of unfavorable regulations or to comply with newly adopted regulations [
2]. However, the market component continues to increase in importance as customers have increasing concern for climate change. For example, a McKinsey survey found that 55% of worldwide consumers who responded considered climate change as one of the most important issues in the near future [
19].
In the adoption process of environmentally-friendly management practices, peer effects play a pivotal role. Climate change continues to increase the level of uncertainty in the business arena. Firms attempt to reduce such uncertainty in their organizational environment usually by imitating the activities of similar firms [
15,
20]. Imitation enables firms to capitalize on the successes of their peers. Firms are likely to mimic the visible and well-defined activities of others, such as carbon labels, carbon inventory developments and carbon information disclosures. In particular, an industry association plays a critical role for its member firms in undertaking measures against climate change.
Financial investors have emerged as a powerful source of pressure for firms in response to climate change. This was because investors realized that protecting reputation and brand was central to preserving their investments and eventually assuring high returns. Recently, the Carbon Disclosure Project (CDP), a consortium of over 300 institutional investors with $41 trillion in assets, requested the world’s top 500 firms annually to provide detailed information on their GHG emissions, risks, opportunities and management strategies. A changing perspective of the equity market for the transition to a low-carbon global economy is expected to provide significant pressure on firms’ competitiveness and long-term valuation.
Media and the public are other sources of environmental pressure. In many cases, consumers also rely on second-hand information, primarily through the media. In a global survey, the three most influencing factors that were considered by corporate respondents are corporate reputation, media attention to climate change and customer preferences.
3.3. The Effects of Climate Change Management Practices on Sustainability Performance
A firm’s response to climate change, which is visualized as the adoption of specific CCPs, can have positive effects on sustainability performance, including both operational performance improvement and carbon emission reduction. A number of studies on strategic environmental management have provided evidence of and explained the positive correlations between a firm’s climate change response and environmental and economic performance [
21,
22,
23]. There are several categories of mechanisms for explaining such positive links.
The first is “cost savings” which included lower manufacturing cost structure, avoiding environmental fines and liabilities, greater productivity, and higher product quality due to reduced energy, material consumption, and unnecessary waste. In operations, total quality management (TQM), lean production, and environmental management are believed to be fundamentally parallel to one another because all of them emphasize waste reductions, efficient and effective input use, and control of internal processes. The literature has supported this notion by presenting empirical evidence that environmental improvements can enhance delivery performance and reduce overall costs [
24].
The second is “innovation offsets”, which support a win-win scenario by explaining that the benefit of environmental management exceeds its cost because it can facilitate innovation and thus reduce the cost of pollution [
25]. In addition, innovation-driven environmental improvements can reduce regulatory costs. The third is “market gains”, which includes market share gains, experienced-based scale economies, certifications and higher margins [
21]. An increase in the environmentally-friendly demand for products can explain win-win scenarios.
The last is “organizational and technological learning”. Improvements in environmental performance require a high level of technical expertise in production and product design. For example, the life cycle assessment is highly technical in nature and demands the use of material science. Low carbon product design skills such as “design for the environment” and “cradle-to-cradle” design are built on solid conventional capabilities such as engineering skills, design expertise, and product knowledge [
26]. Efforts in reducing carbon footprint or emission reduction can foster organizational and technological learning, which in turn leads to higher operational performance including quality improvement and cost reduction.
4. Methodology
The present research utilizes a survey method. The perceived pressure of the five stakeholders was measured on a seven-point Likert-type scale. The six climate change management practices were measured using the same Likert scale, reflecting the levels of the firm’s adoption and implementation of these practices. The two components of climate change performance, including energy consumption reduction and carbon emissions reduction, and four components of operational performance, including quality improvement, cost reduction, lead time reduction and flexibility improvement, were measured. Collectively, all question items were subjective measures (see
Table A1).
The research conducted a survey using a South Korean sample that was compiled from an exclusive source, the Target Management System (TMS) Sites Directory. Under the TMS, a total of 784 sites in the general industry sector were designated as a heavy carbon emitter and were subject to monitoring by the South Korean government. After excluding 114 sites from the industry sector, because these were just a retail store, a total of 670 plants were finally complied for the survey. As of August 2010, these sites emitted about 214 million tons of CO
2e, which accounted for almost 30.0% of total GHG emissions in South Korea. Finally, a total of 204 responses were used for further analysis, representing a response rate of 30.1%.
Table 1 provides a summary of the respondents.
Descriptive statistics provide the levels of perceived pressure for stakeholders, the adoption and implementation of CCPs, climate change performance, and operational performance (see
Table 2).
Table 2 also shows the correlations between control variable and latent variables. Hierarchical linear regression was performed to examine the effects of stakeholder pressure on the CCPs as well as the effects of CCPs on sustainability performance.
5. Results and Discussion
5.1. Varied Levels of Stakeholders’ Pressure and Climate Change Management Practices
As shown in
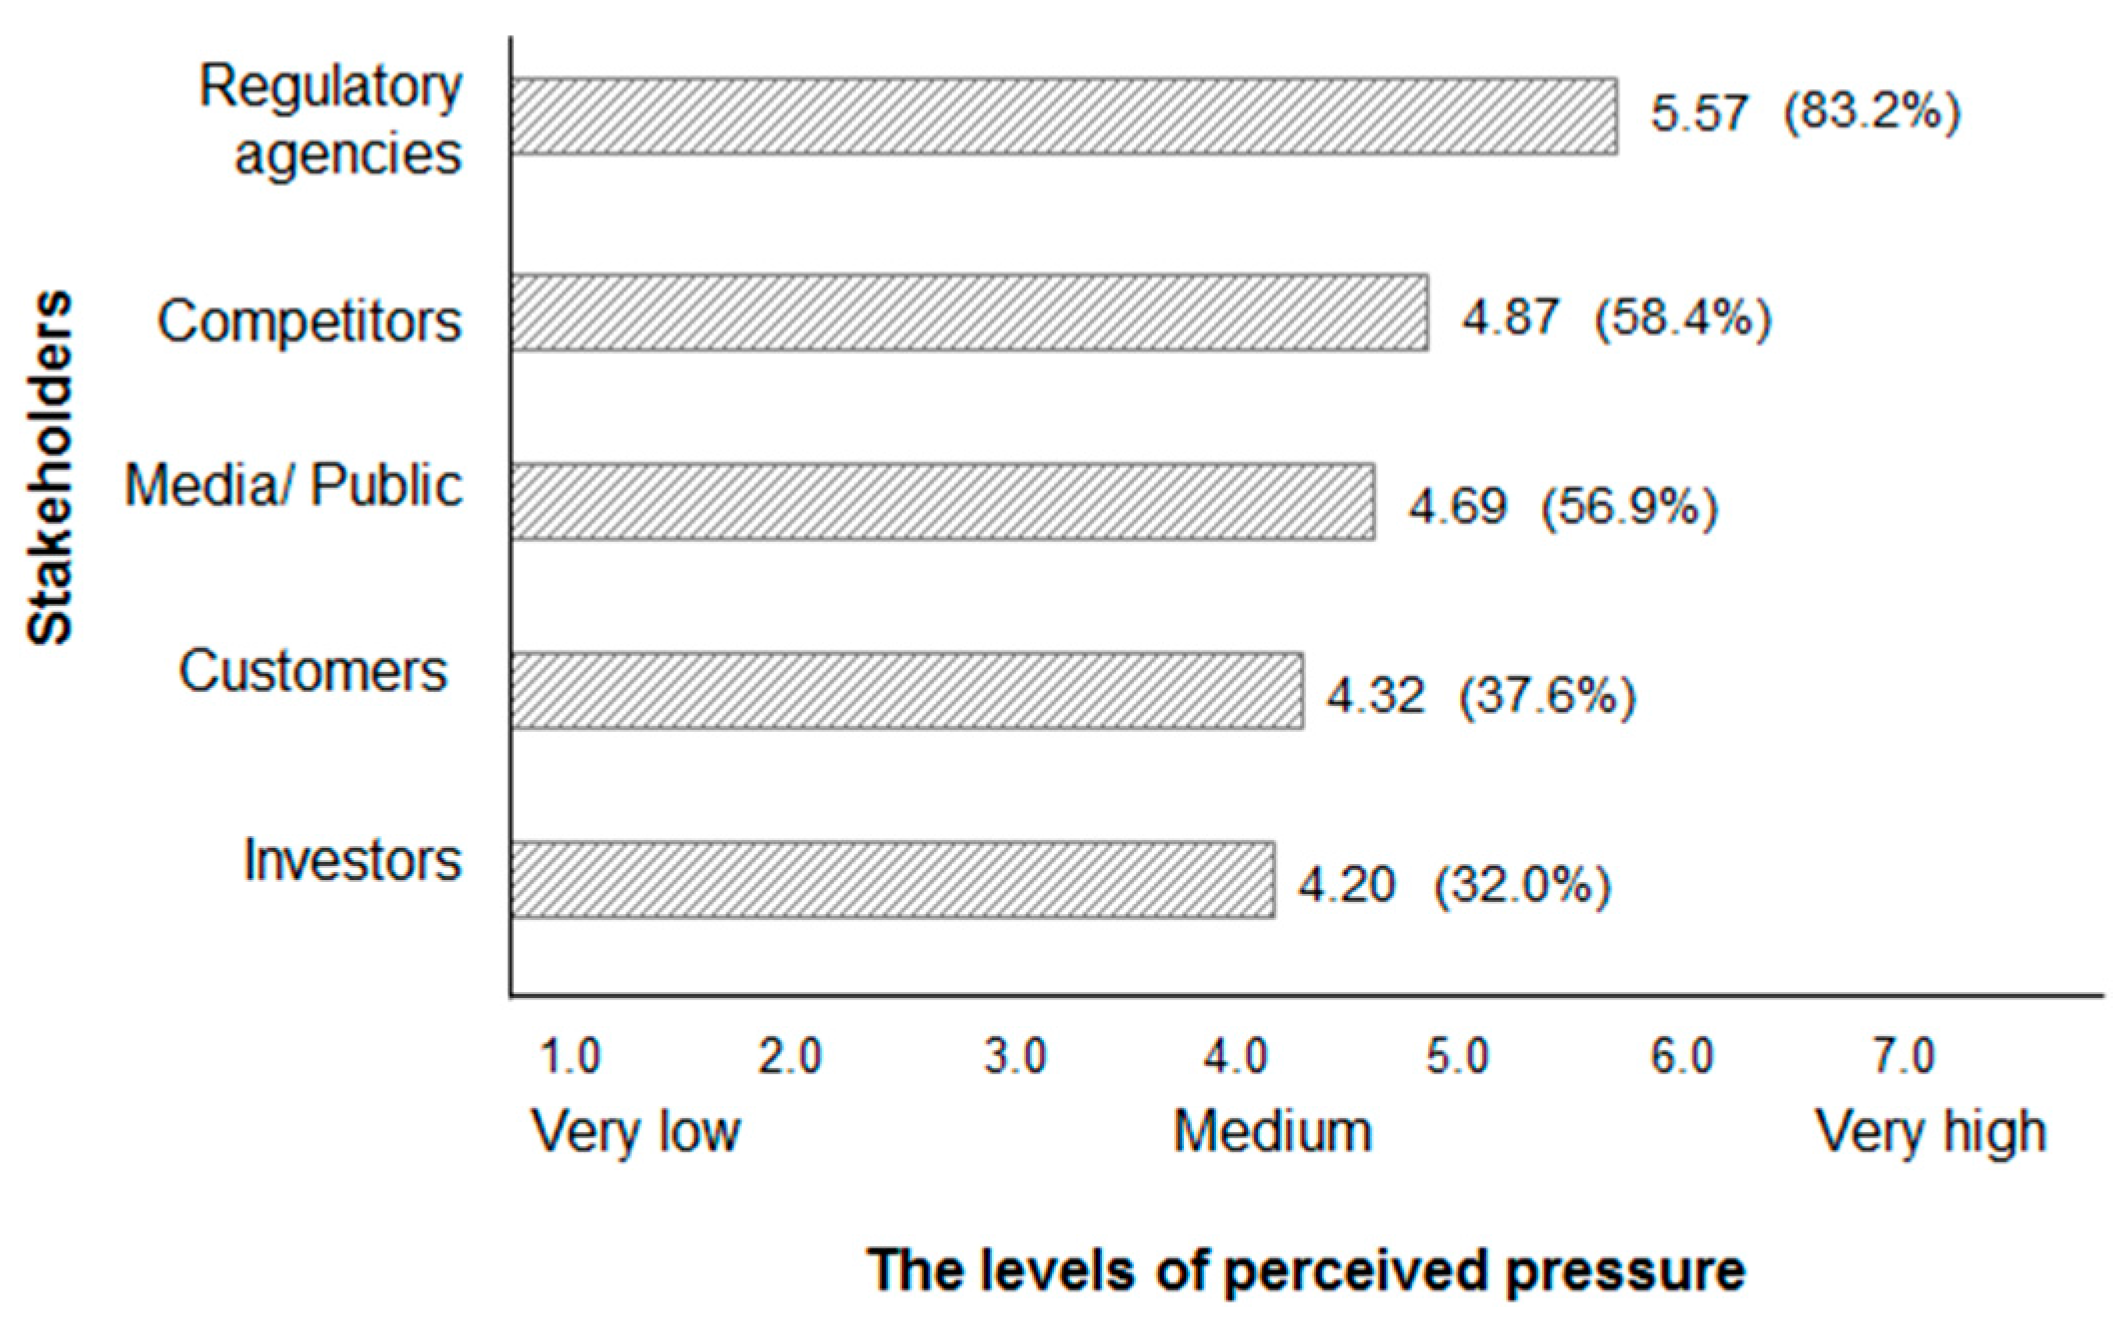
Figure 2, firms have perceived regulatory agencies as the most influential stakeholders to place pressure on management to address global warming issues, with high proportions of responding firms (83%) selecting “very high (7)” “high (6)” or “relatively high (5)” pressure. They were followed by competitors and the media/public, with 58% and 57% of respondents, respectively, selecting “relatively high (5)” or higher. The pressure of customers was found as the second weakest pressure perceived by firms in addressing climate change, with 38% of respondents generally agreeing. Investors were the stakeholder that placed the weakest pressure on firms in regards to global warming.
This result confirms that regulatory agencies, including central and local governments, are the most influential stakeholders and firms are sensitive to their policies, especially when it comes to environmental issues [
13]. Firms’ responses to climate change policies may differ. While some firms are resistant to climate change policies, some others are willing to take a proactive stance. Regardless of such different reactions, firms tend to perceive the pressure of regulatory bodies as the most significant influence. Competitors’ pressure may represent an institutional effect. Institutional researchers argue that firms are more likely to mimic the behavior of other firms within the same industry when they adopt new environmental management practices [
15]. Each industry has different characteristics to each other, which may relate to different regulations, customers, competition, and risk. Firms in a certain industry may perceive different levels of pressure from the others in a different industry, which in turn may lead to competitor pressure [
4].
Table 1.
Summary of survey participants.
Table 1.
Summary of survey participants.
| Industry | Oil, Petrochemical, Chemical | Pulp and Paper | Metal, Mineral | Electric and Electrical | Machinery, Automotive | Cement, Construction Materials | Other Manufacturing | Total (Mean) |
|---|
| Sample size | 217 | 70 | 123 | 59 | 66 | 83 | 52 | 670 |
| Respondents | 64 | 26 | 42 | 6 | 21 | 17 | 26 | 204 |
| No. of employees | 415 | 210 | 494 | 146 | 2992 | 177 | 258 | 659 |
Table 2.
Descriptive analysis and correlation matrix.
Table 2.
Descriptive analysis and correlation matrix.
| Variable | Mean | S.D. | 1 | 2 | 3 | 4 | 5 | 6 | 7 | 8 | 9 | 10 | 11 | 12 | 13 | 14 | 15 | 16 | 17 |
|---|
| 1.Firm size | 5.48 | 1.20 | - | | | | | | | | | | | | | | | | |
| Stakeholder pressure |
| 2. Regulatory agencies | 5.57 | 1.27 | 0.05 | - | | | | | | | | | | | | | | | |
| 3. Customers | 4.32 | 1.40 | 0.01 | 0.19 * | - | | | | | | | | | | | | | | |
| 4. Media/Public | 4.69 | 1.36 | −0.00 | 0.32 ** | 0.45 ** | - | | | | | | | | | | | | | |
| 5. Competitors | 4.87 | 1.22 | 0.11 | 0.39 ** | 0.36 ** | 0.54 ** | - | | | | | | | | | | | | |
| 6. Investors | 4.20 | 1.30 | 0.07 | 0.34 ** | 0.58 ** | 0.59 ** | 0.57 ** | - | | | | | | | | | | | |
| Climate change management practices |
| 7. CCP1 (Product) | 4.66 | 1.60 | 0.17 * | 0.26 ** | 0.35 ** | 0.35 ** | 0.27 ** | 0.48 ** | - | | | | | | | | | | |
| 8. CCP2 (Process) | 5.27 | 1.45 | 0.11 | 0.10 | 0.09 | 0.14 + | 0.09 | 0.15 + | 0.45 ** | - | | | | | | | | | |
| 9. CCP3 (Energy) | 4.11 | 1.87 | 0.05 | 0.01 | 0.22 ** | 0.24 ** | 0.06 | 0.29 ** | 0.31 ** | 0.45 ** | - | | | | | | | | |
| 10. CCP4 (Organization) | 2.77 | 1.90 | −0.02 | 0.03 | 0.40 ** | 0.33 ** | 0.18 * | 0.43 ** | 0.39 ** | 0.04 | 0.26 ** | - | | | | | | | |
| 11. CCP5 (Supply chain) | 3.19 | 1.79 | 0.11 | 0.10 | 0.42 ** | 0.40 ** | 0.31 ** | 0.45 ** | 0.55 ** | 0.24 ** | 0.39 ** | 0.61 ** | - | | | | | | |
| 12. CCP6 (Offsetting) | 3.06 | 2.09 | −0.01 | 0.06 | 0.33 ** | 0.22 ** | 0.16 * | 0.28 ** | 0.37 ** | 0.12 | 0.23 ** | 0.74 ** | 0.60 ** | - | | | | | |
| Sustainability performance |
| 13. Quality | 5.73 | 1.04 | 0.05 | 0.08 | −0.01 | 0.07 | 0.02 | −0.00 | −0.06 | −0.08 | −0.00 | −0.07 | −0.03 | −0.06 | - | | | | |
| 14. Cost | 5.18 | 1.11 | 0.02 | 0.04 | 0.20 * | 0.02 | 0.01 | 0.15 + | 0.06 | 0.06 | 0.16 + | 0.07 | 0.02 | 0.07 | 0.15 + | - | | | |
| 15. Lead time | 5.79 | 0.07 | 0.08 | 0.08 | −0.08 | 0.13 | 0.23 | −0.04 | −0.07 | −0.07 | 0.07 | −0.25 ** | −0.15 + | −0.22 | 0.54 ** | 0.35 ** | - | | |
| 16. Flexibility | 5.59 | 0.91 | 0.05 | 0.21 * | 0.10 | 0.22 ** | 0.23 ** | 0.25 ** | 0.27 ** | 0.27 ** | 0.18 * | 0.08 | 0.19 + | 0.03 | 0.41 ** | 0.43 ** | 0.44 ** | - | |
| 17. Energy | 4.72 | 1.05 | −0.07 | −0.01 | 0.23 ** | 0.20 * | 0.15 + | 0.21 * | 0.21 * | 0.21 * | 0.31 ** | 0.15 + | 0.22 ** | 0.24 ** | 0.04 | 0.31 ** | 0.14 + | 0.22 ** | - |
| 18. Emission | 4.90 | 1.06 | 0.08 | 0.06 | 0.34 ** | 0.29 ** | 0.22 ** | 0.30 ** | 0.41 ** | 0.42 ** | 0.33 ** | 0.30 ** | 0.43 ** | 0.36 ** | 0.03 | 0.25 ** | 0.05 | 0.27 ** | 0.61 ** |
Figure 2.
Stakeholder pressure for firms to address climate change. Note: Brackets show the proportions of respondents selecting “very high (7)”, “high (6)”, and “relatively high (5)”.
Figure 2.
Stakeholder pressure for firms to address climate change. Note: Brackets show the proportions of respondents selecting “very high (7)”, “high (6)”, and “relatively high (5)”.
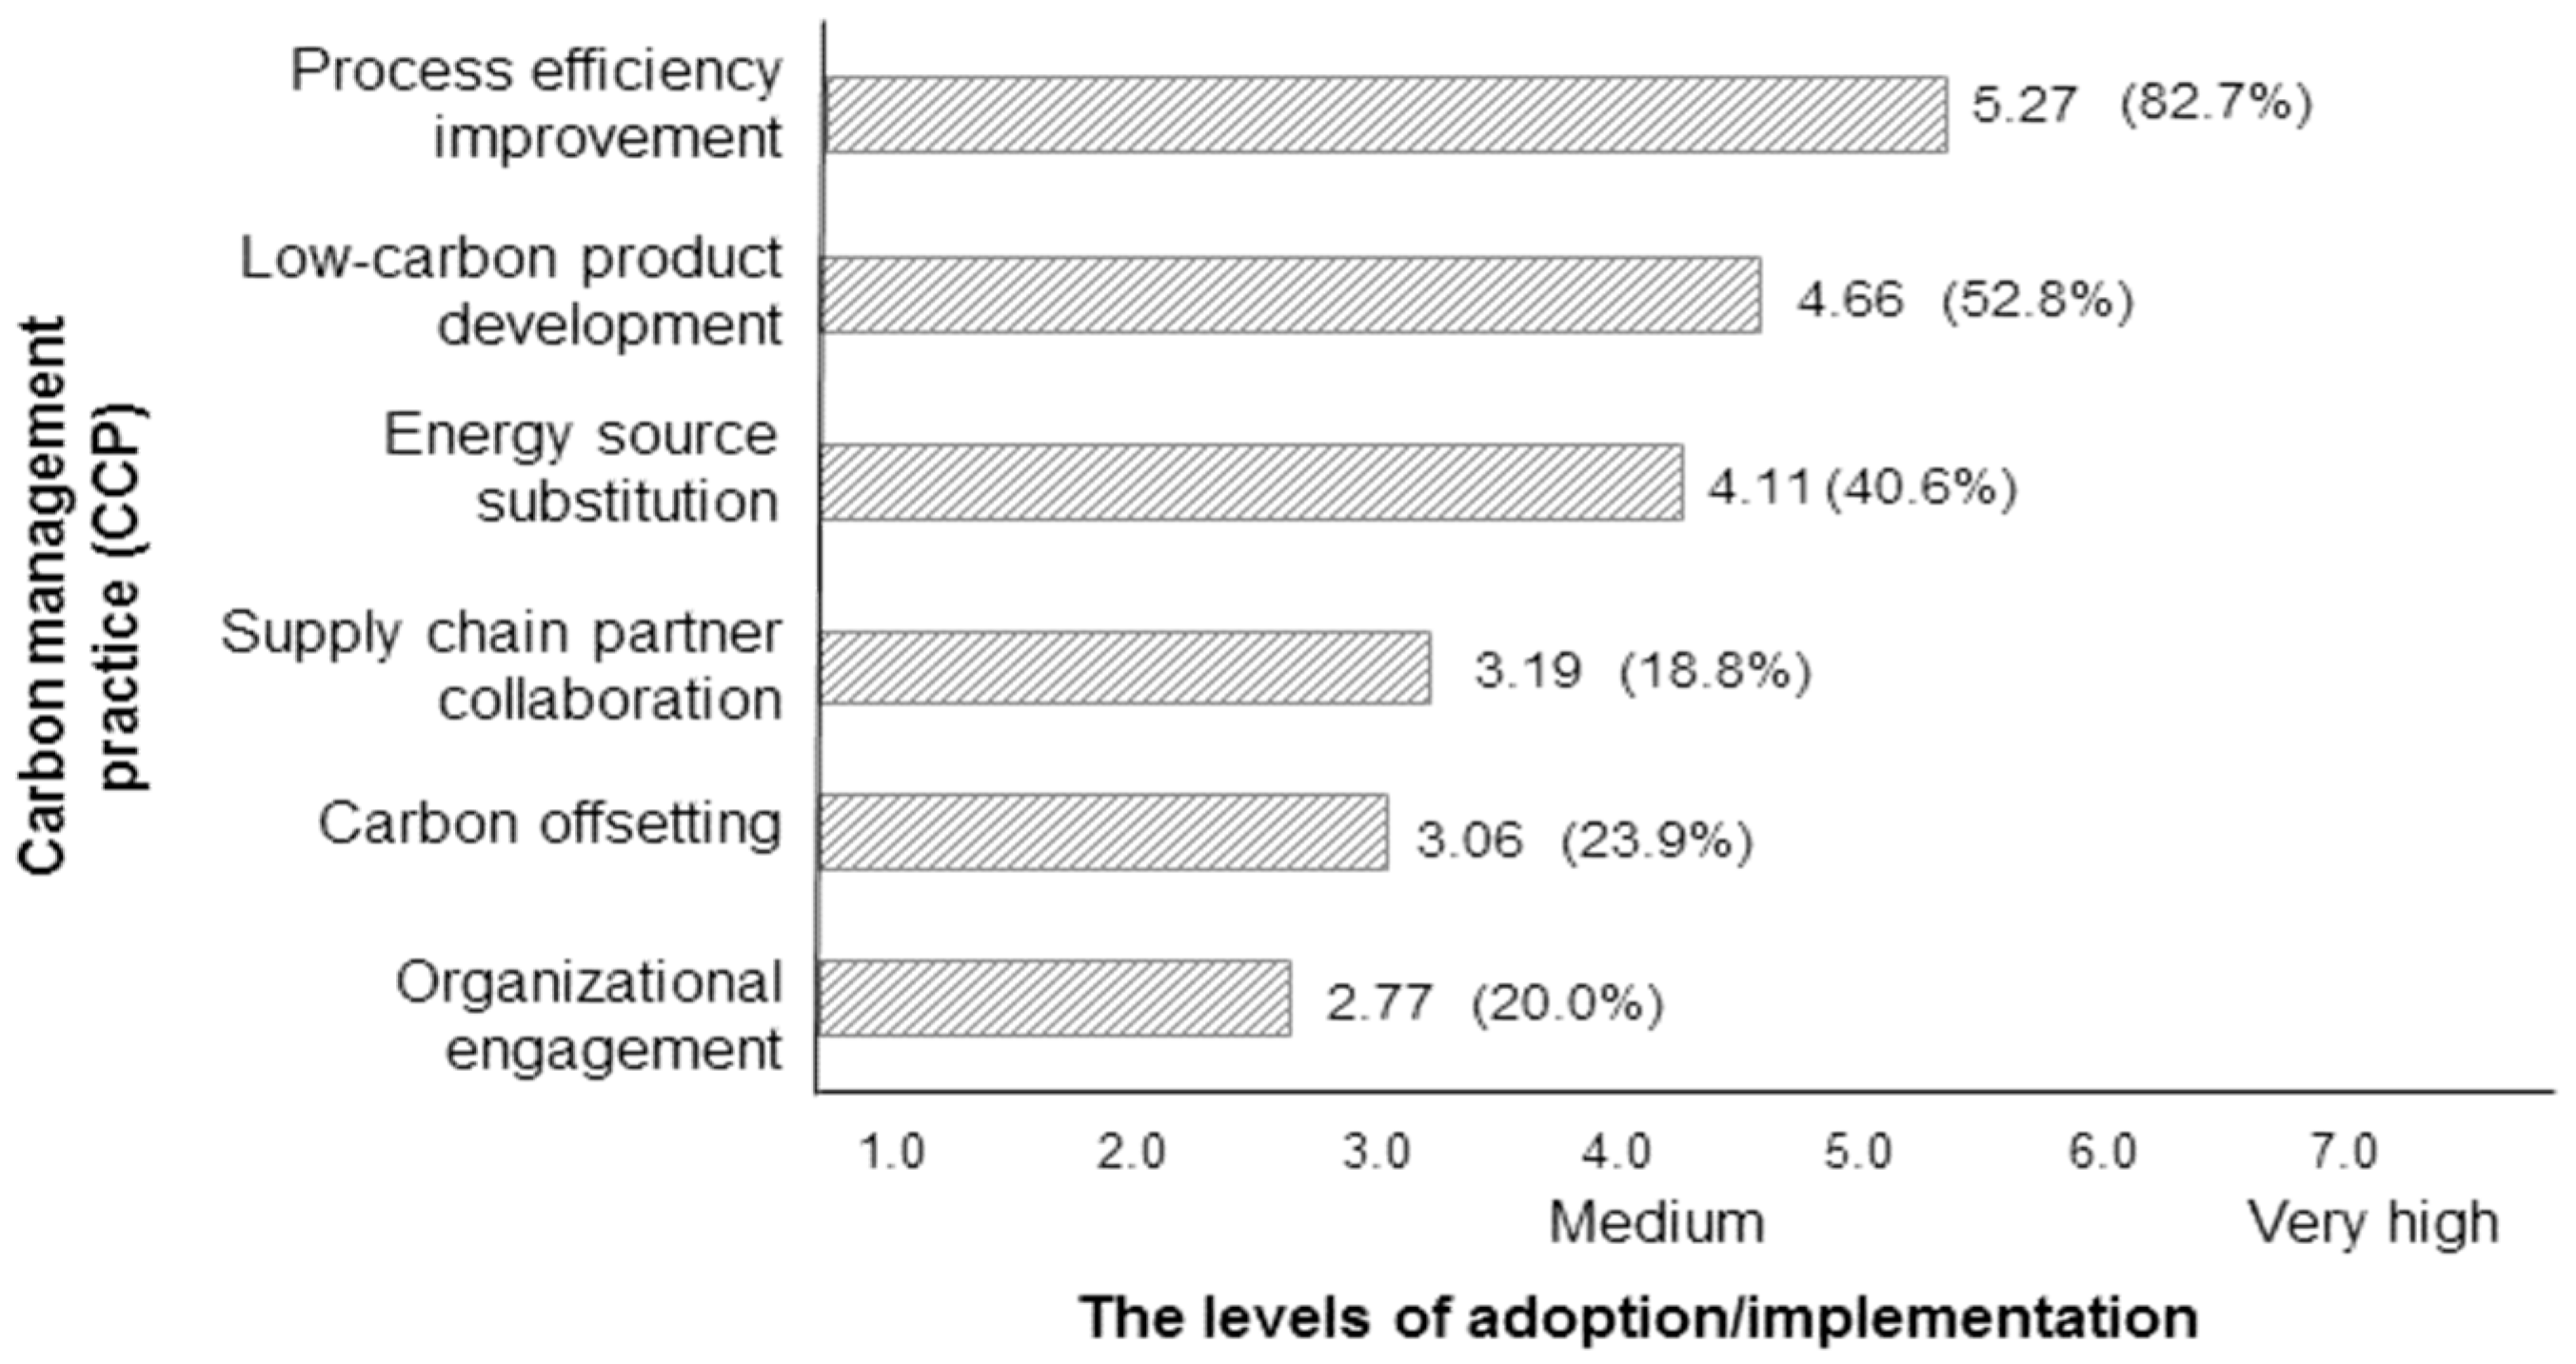
Respondents were asked about the extent to which their firm has adopted and implemented various CCPs over the last two years on a seven-point Likert scale, varying from “not at all (1)” and “moderately (4)” to “very extensive (7)”. CCPs include low-carbon product development, process efficiency improvement, energy source substitution, organizational engagement, supply chain partner collaboration, and carbon offsetting. The results of the descriptive analysis indicate the ways in which each CCP was adopted and implemented by firms in South Korea (
Figure 3). Among the six CCPs, the process efficiency improvement was the most widely adopted, and CCPs were implemented to a larger extent in the business sector of South Korea, with high proportions of responding firms (82.7%) implementing CCPs at a high level than at a moderate level (
i.e., 5, 6, and 7). The low-carbon product development practice was the second most popular CCP adopted in industries, with 52.8% of respondents choosing relatively high levels of adoption. This was followed by energy source substitution practices, which was implemented at a moderate level (4.0 on a seven-point scale). The other CCPs––the supply chain partner collaboration, carbon offsetting, and organizational engagement––were less selected by South Korean firms in addressing climate change (3.19, 3.06 and 2.77 on the Likert scale, respectively).
Figure 3.
The adoption of carbon management practices. Note: Brackets show the proportions of respondents by selecting “very extensive (7)”, “extensive (6)’, and “relatively extensive (5)”.
Figure 3.
The adoption of carbon management practices. Note: Brackets show the proportions of respondents by selecting “very extensive (7)”, “extensive (6)’, and “relatively extensive (5)”.
These results well-illustrate that the process efficiency improvement practices encompassing various ranges of energy-saving activities have been prioritized in the energy-intensive or heavy polluting industries for a long time, and thus, a number of measures with process efficiency potential have already been utilized [
27]. In contrast, the organizational engagement practice and carbon offsetting practices are relatively new approaches, and, therefore, these practices are less likely to be considered. However, South Korean industries, particularly energy-intensive industries, have already achieved a high level of energy efficiency [
8]. As a result, reducing GHG emissions in such a highly efficient manufacturing sector might be very challenging and costly.
5.2. Direct Impacts of Stakeholder Pressure on CCPs
Hierarchical liner regression was used to examine how stakeholder pressures influence the adoption and implementation of a firm’s climate change management practices. In the first step, the control variables (industries dummy and firm size) were regressed against CCPs. Step two examined the predictor variables (stakeholder pressure) against each dependent variable. The results are presented in
Table 3.
Table 3.
Results of the impacts of stakeholder pressure on CCPs.
Table 3.
Results of the impacts of stakeholder pressure on CCPs.
| Variable | Low-Carbon Product Development | Process Efficiency Improvement | Energy Source Substitution | Organizational Engagement | Supply Chain Partner Collaboration | Carbon Offsetting |
|---|
| Controls | Industry dummies and firm size included |
| Stakeholder pressure | | | | | | |
| Regulatory agencies | 0.13 + | 0.08 | 0.08 | −0.13 + | −0.11 | −0.07 |
| Customers | 0.12 | 0.06 | 0.05 | 0.22 * | 0.21 * | 0.23 ** |
| Media/public | 0.00 | −0.06 | −0.06 | 0.15 | 0.14 | 0.02 |
| Competitors | −0.07 | −0.13 | −0.13 | −0.11 | −0.01 | −0.04 |
| Investors | 0.35 ** | 0.20 + | 0.20 + | 0.31 ** | 0.24 * | 0.17 |
| R2 | 0.273 | 0.116 | 0.117 | 0.326 | 0.316 | 0.199 |
| Adj.R2 | 0.214 | 0.045 | 0.045 | 0.271 | 0.260 | 0.135 |
| F | 4.63 ** | 1.63 + | 1.63 + | 5.96 ** | 5.69 ** | 3.07 * |
First, the results provide interesting evidence that financial investors’ pressure has the greatest impact on the adoption and implementation of a firm’s CCPs. Investors’ pressure has positive and significant impacts on low-carbon product development (
β = 0.35), process efficiency improvement (
β = 0.20), energy source substitution (
β = 0.20), organizational engagement (
β = 0.31), and supply chain partner collaboration (
β = 0.24). The descriptive analysis (
Figure 2) indicates that managers received the least pressure from financial investors among stakeholders regarding climate change; however, investors’ pressure has the greatest effect in driving firms to consider climate change issues in their actual management practices. Global initiatives such as the Carbon Disclosure Project (CDP) and the United Nations Environmental Programme Finance Initiative (UNEP FI) are found to have played a pivotal role in changing business activities towards achieving a low-carbon economy.
Second, the environmental pressures of regulatory agencies and customers also have positive and significant influence on CCPs as per our expectations. The effects are somewhat limited to specific CCPs. For example, regulatory agencies’ pressure is significantly and positively associated with the low-carbon product development practice (
β = 0.13), while it is negatively associated with the organizational engagement practice (
β = −0.13). Customers’ pressure has positive impacts on organizational engagement (
β = 0.22), supply chain partner collaboration (
β = 0.21), and carbon offsetting (
β = 0.23). These results indicate regulatory practices are in line with previous reports by providing evidence that environmental regulations have played a critical role in making business practices more sustainable [
6,
7,
18]. Customers tend to be primarily concerned with the traditional factors of quality and price; however, customers have increasingly demanded carbon reductions, as reported in a carbon labeling study [
28].
Third, competitors and the media/public are shown to affect the adoption of CCPs less significantly compared to other stakeholders. The descriptive analysis (
Figure 2) indicates that firms tend to feel pressure from their peers in addressing global warming. The media may play a critical role in generating issues and scrutinizing firms’ activities closely, thereby raising concern among the public regarding climate change. However, the effects of other stakeholders (
i.e., investors, regulatory agencies, and customers) were predominant, and the effects of competitors and media on firms’ adoption and implementation of CCPs were not shown to be significant.
5.3. Direct Impacts of CCPs on Sustainability Performance
Hierarchical liner regression was used to examine the effects of the adoption/implementation of climate change management practices on operational performance as well as climate change performance. The results are presented in
Table 4. Mixed results were found with regard to the relationships between CCPs and sustainability performance. The process efficiency improvement and energy source substitution practices are shown to positively influence energy reduction performance (
β = 0.17 and
β = 0.25) at a cut-off
p-value of 0.1 and 0.01, respectively. The carbon offsetting practice as well as the process efficiency improvement practice is positively related to GHG emission reductions. The energy source substitution practice positively influences cost (
β = 0.25) and delivery performance (
β = 0.25) as well as flexibility performance (
β = 0.16). Low-carbon product development is also positively associated with flexibility performance (
β = 0.26) while organizational engagement leads to low delivery performance. However, the results did not find evidence that CCPs were significantly associated with quality improvement.
The results of this analysis indicate that CCPs have different effects on each dimension of operational performance and climate change performance. The energy source substitution practice has significant and positive effects on a wide range of performance dimensions. Firms are able to achieve manufacturing cost reductions, delivery time reduction and manufacturing flexibility improvement as well as energy savings by substituting conventional fossil-based energy sources with less carbon-intensive fuels or renewable energy such as photovoltaic and wind power. Firms that attempt to curtail energy consumption as well as GHG emissions should pay more attention to process efficiency improvement practices, including better housekeeping, energy recovery, and advanced process technologies. Low-carbon product development leads to manufacturing flexibility improvement. Firms should focus on the development of less carbon-intensive or carbon-free products and technologies within the context of product life cycle. Such a product-related CCP enables firms to quickly respond to rapid demand changes as well as manufacture a greater variety of their products. Supply chain partner collaboration has the greatest effect on GHG emission reductions. Buying firms, in particular, large-sized firms should turn their attention to integrate climate change issues into their supply chain management policies and practices. Environmental procurement, supply chain environmental audits, carbon monitoring systems and engagement in support and collaborative activities to address climate change can foster stronger environmental and climate change performance throughout the supply chain [
29].
Table 4.
Results of the impacts of CCPs on sustainability performance.
Table 4.
Results of the impacts of CCPs on sustainability performance.
| Variable | Operational Performance | Climate Change Performance |
|---|
| Quality | Cost | Delivery | Flexibility | Energy reduction | GHG emission reduction |
|---|
| Controls | Industry dummies and firm size included |
| Climate change management practice | | | | | | |
| Low-carbon product development | −0.01 | 0.06 | 0.10 | 0.26 * | 0.02 | 0.14 |
| Process efficiency improvement | −0.08 | −0.11 | −0.21 | −0.11 | 0.17 + | 0.15 + |
| Energy source substitution | 0.04 | 0.25 * | 0.25 * | 0.16 + | 0.25 ** | 0.12 |
| Organizational engagement | −0.10 | 0.02 | −0.34 ** | 0.04 | −0.06 | −0.00 |
| Supply chain partner collaboration | −0.03 | −0.12 | −0.08 | 0.05 | 0.04 | 0.22 * |
| Carbon offsetting | 0.01 | 0.04 | 0.04 | −0.14 | 0.14 | −0.08 |
| R2 | 0.046 | 0.116 | 0.134 | 0.159 | 0.205 | 0.340 |
| Adj.R2 | - | 0.035 | 0.056 | 0.082 | 0.132 | 0.280 |
| F | 0.52 | 1.43 | 1.70 + | 2.06 * | 2.81 ** | 5.66 ** |
6. Conclusions
Fighting global warming really necessitates the support of the business sector because GHG emissions and carbon footprint can be usually reduced by product redesign, new technology development, and energy-efficiency projects in manufacturing plants as well as upstream supply chains. This is why policy makers, academics and practitioners need to have a better understanding of firms’ attitudes and practices towards climate change. This study conducted a survey of manufacturing firms in South Korea to identify a set of corporate climate change management practices as well as to investigate the pressure stakeholders place on the adoption and implementation of those practices. This article also examined the impact of climate change management practices on operational performance as well as carbon reduction performance. Overall, this study provides evidence that CCPs actually contribute to the reduction of carbon emissions and energy consumption. This study also provides partial support for a win-win possibility, addressing mechanisms by which proactive responses to global warming influence operational performance improvement. To conclude, this article provides guidance for policy makers and managers, particularly in South Korea, by considering how to identify, design and manage the dimensions of CCPs within a firm as well as with other organizations to mitigate climate change.
Firstly, this article recommends South Korean firms to utilize a wider range of CCPs. South Korean firms have relied on process efficiency improvements in addressing climate change. Firms should choose adequate options, including low-carbon product development, energy source substitution, supply chain collaboration, carbon offsetting and organizational engagement, depending on the situation in which they face. For example, for firms that have already achieved the highest levels of manufacturing efficiency, process efficiency improvement cannot be the only strategy because reducing more carbon emissions in their operations is very tough. In this case, substituting new and renewable energy sources such as biomass, photovoltaic, and wind for current fuels can help reduce indirect GHG emissions from the consumption of electricity, heat or steam. Supply chain collaboration also might be a useful CCP. Secondly, South Korean business leaders should acknowledge a win-win scenario between climate change performance and operational performance. There has been massive resistance to the emissions trading scheme from South Korean businesses and industry. South Korean businesses have argued that the ETS would increase their manufacturing costs and harm their competitiveness. They worried Chinese and other international competitors that are not part of an emissions scheme would be able to undercut them. This study, however, provides evidence that proactive responses would lead to higher operational performance. In particular, firms need to focus on product development and energy source substitution practices, which are positively related to higher cost, delivery, and flexibility performance. Thirdly, the South Korean government must provide the means to encourage firms to take a proactive stance towards a low-carbon economy through various nationwide initiatives, which engage a diverse range of stakeholders, especially the financial sector because investors are shown to have the strongest influence on firms in adopting and implementing CCPs. Lastly, firms, governments, NGOs, financial institutions, and academia should exchange views and collectively develop measures to fight global warming.
By clarifying the limitations of this study, this paper suggests the directions for future research. First, this study does not control for potential confounding variables in the model. Future research is required to explore other contributing factors (e.g., the availability of new technologies or firms’ technological capabilities) that may influence the adoption and implementation of CCPs. In addition, future research needs to compare the effects of stakeholders’ pressure and other potential contributing factors. Second, this study considers a limited range of performance (i.e., operational and climate change response performance). The question whether CCPs can generate other sustainability benefits (e.g., financial returns, reputation, and social contribution) besides the GHG reduction and operational performance has to be investigated. Third, the surveys were only administered to South Korean manufacturing firms. Future research should extend this present study to other countries, in which the extents of stakeholder pressure, CCPs and emissions reduction might differ. To explore how institutional differences cause differences in firms’ adoption/implementation of CCPs is very crucial for a better understanding of the attitudes, behavior and responses towards climate change within the business arena.


