1. Introduction
Grape is a highly important fruit crop worldwide with approximately 77.18 million tons of production [
1]. Compared with traditional open-field grape cultivation, protected grape cultivation is a progressive cultivation pattern that exhibits advantages in improving grape quality, adjusting agricultural structure, prolonging supply duration, and increasing vine growers’ income [
2]. Protected grape planting involves the regulation of micro-climate within greenhouses and the corresponding production management; this production mode has become a development trend in viticulture. According to the statistics of the Chinese Agricultural Research System [
3], the total area for Chinese grape protected cultivation has exceeded 130,000 hectares and amounted to 20% of the total area of viticulture, which is the largest globally. In China, grape protected cultivation employs different sub-patterns, such as early-maturing cultivation, delayed cultivation, and rain-shelter cultivation. Each pattern is distinctive in terms of greenhouse structure, grape management, and environmental control, which may be suitable in different production regions.
Driven by the high economic benefits of protected grape cultivation, many farmers have been involved in this venture; however, these attempts lacked overall planning and suffered from a series of sustainable development problems [
4]. Protected grape cultivation is significantly characterized by “high input and output” in cost, energy, labor, and other production elements; in particular, this method uses more materials and energy in the process of greenhouse construction and environmental control [
5,
6]. Some obvious or potential environmental and ecological problems have arisen from the protected agricultural system, such as greenhouse gas emission, excessive energy consumption, and fertility decline. Lei and Shi [
7] and Wang [
8] stated that the ecological greenhouse soil environment in protected cultivation is altered; the soil often experiences high temperatures, high humidity, high evaporation, and lack of rain. These conditions result in some soil problems, including soil salinization, acidification, and increased incidence of soil-borne disease. These issues challenge the harmony between economic development and ecology, as well as the sustainability of the cultivation system. By contrast, some authors reported that protected farming systems are necessary to improve the system’s sustainability [
9,
10]. These observations reveal that no consensus has yet been achieved regarding the sustainability of the protected cultivation system. Therefore, with constantly emerging environmental issues and stronger consciousness on sustainable development, the efficiency of material and energy use must be evaluated, and the sustainability of protected grape cultivation must be assessed from the integrated perspective of the economy, ecology, and environment.
Many theories and methods on sustainable development are currently available to assess and predict sustainable development tendencies, such as emergy analysis [
11], life-cycle analysis [
12,
13,
14,
15], material flow and emergy analyses [
16,
17,
18]. Among these methods, emergy evaluation is a powerful tool that has been widely used in the assessment of sustainable development [
19,
20,
21,
22]. Emergy is defined as the amount of one kind of available energy previously used directly and indirectly to produce a product, resource, or service [
11]. Emergy is usually measured and represented as solar emjoules (sej), and emergy analysis refers to the measurement of energy flows, material flow, and capital flow in an eco-economic system, as well as the mitigation of environmental problems arising in the course of viticulture. In fact, by definition, emergy analysis relies on the conversion of all the process inputs into solar energy which is performed by means of conversion factors called solar transformities, namely the solar energy necessary to obtain one unit of another type of energy [
23]. Therefore, emergy analysis has become an effective and powerful evaluation method for agricultural ecological–economic systems after about 30 years of development. This method is also widely applied in many fruit and crop production systems, including red orange production [
16]; “Four-in-One” peach production system [
18]; production systems of four kinds of southern Chinese fruits (banana, papaya, guava, and wampee) [
24]; banana cropping systems in Guadeloupe [
25]; one coffee farm [
26]; three wetland fish farming systems [
27]; and an Italian sustainable agricultural system [
28].
The use of information systems (IS), artificial intelligence systems (AIS), and decision support systems (DSS) has become a trend in recent years [
29]. These systems integrate data and mathematical models that exhibit flexibility, adaptability, memory, decision-making capability, and the ability to depute “real-world” data to abstract and formal entries [
30]. These systems overcome massive and tedious manual operation and offer greater analysis, operationalization and simplification of the whole assessment process. Hence, they are widely used in production management, business intelligence, and other areas to assist humans in making decisions, such as in aquatic production [
31], cucumber production [
32], and greenhouse seedling production [
33]. The applications of information technology in assessment processes can acquire and transport real-time data on the object of evaluation and significantly increase the timeliness and accuracy of the results.
A complete emergy analysis and sustainability evaluation involves five main steps as follows: acquire the raw data, draw the emergy diagram of the production system, construct emergy analysis tables, establish emergy evaluation indices, and conduct the assessment and analyze the results [
34,
35]. This kind of analysis deals with massive data, including raw data, emergy data, and various transformity data; thus, the traditional method requires a considerable amount of manual labor to conduct data collection, storage, processing and calculation. In this case, the process is time consuming and inefficient, as well as tedious, difficult, and highly error prone. Evidently, traditional emergy analysis is not an intelligent method to conduct emergy and sustainability evaluation and prediction. Hence, exploiting information technology to design and develop an emergy-based sustainability assessment system is highly valuable. This system is projected to reduce manual calculation work and improve the operating efficiency of emergy analysis. Furthermore, by intelligently analyzing the sustainability assessment results, the system can help producers and other stakeholders in making decisions, such as in decreasing the emergy input amount, optimizing the emergy input structure, improving the production system sustainability, and adjusting the industry layout.
Accordingly, this paper aims to design and implement an emergy-based sustainability decision assessment system (ESDAS) for protected grape cultivation, which would allow the automatization of emergy analysis and finally improve the efficiency of sustainability evaluation for the eco-economic system. In this regard, the current study surveyed the production process of protected grape cultivation and identified the corresponding emergy consumption and output. It utilized database, network, and open-source component technologies and adopted LAMP architecture to develop a B/S system for data management, emergy calculation, sustainability evaluation, and decision-making regarding sustainable development for protected grape production.
2. System Analysis
2.1. Survey Procedure
A survey was conducted to understand the production process and emergy inputs/outputs of protected grape cultivation, as well as the system requirements. Information was acquired through the following methods:
Literature analysis and document collection: This included the collection of logs and records of the protected grape cultivation process, as well as literature on emergy-based sustainable assessment, to understand the production process and basic methods.
Field survey: In this method, the main production processes of protected grape cultivation were investigated, including pest control, soil management, irrigation and water management, fertilizer application, and flower and fruit management. The observations were conducted in the sampled 18 vineyards of Hebei and Liaoning provinces.
Interview: This process aimed to obtain the users’ requirements for the ESDAS. The interviews were carried out in the sampled 18 vineyards, and 16 vineyard owners and five experts in protected grape cultivation were selected as the interviewees and were investigated through face-to-face interviews by research staff; they were asked about the specific details of the production process in protected grape cultivation, including the related inputs and outputs, the major difficulties and problems encountered in production, as well as their requirements for the ESDAS.
2.2. Protected Grape Production System Analysis
2.2.1. Production Process Analysis
Through survey, we discovered the components of a typical production process of protected grape cultivation (
Figure 1). The production process can be divided into two stages. The first stage refers to the one-time production stage, which involves the construction of a protected vineyard and the seeding. This stage employs a one-time, fixed-asset investment and should be shared according to the lifetime of the grape vineyard. The second stage refers to the annual production, which requires different management techniques and agricultural operations at different grape growth stages. These two stages bring an abundance of material, capital, and energy flows to the system.
Figure 1.
Production process of protected grape cultivation.
Figure 1.
Production process of protected grape cultivation.
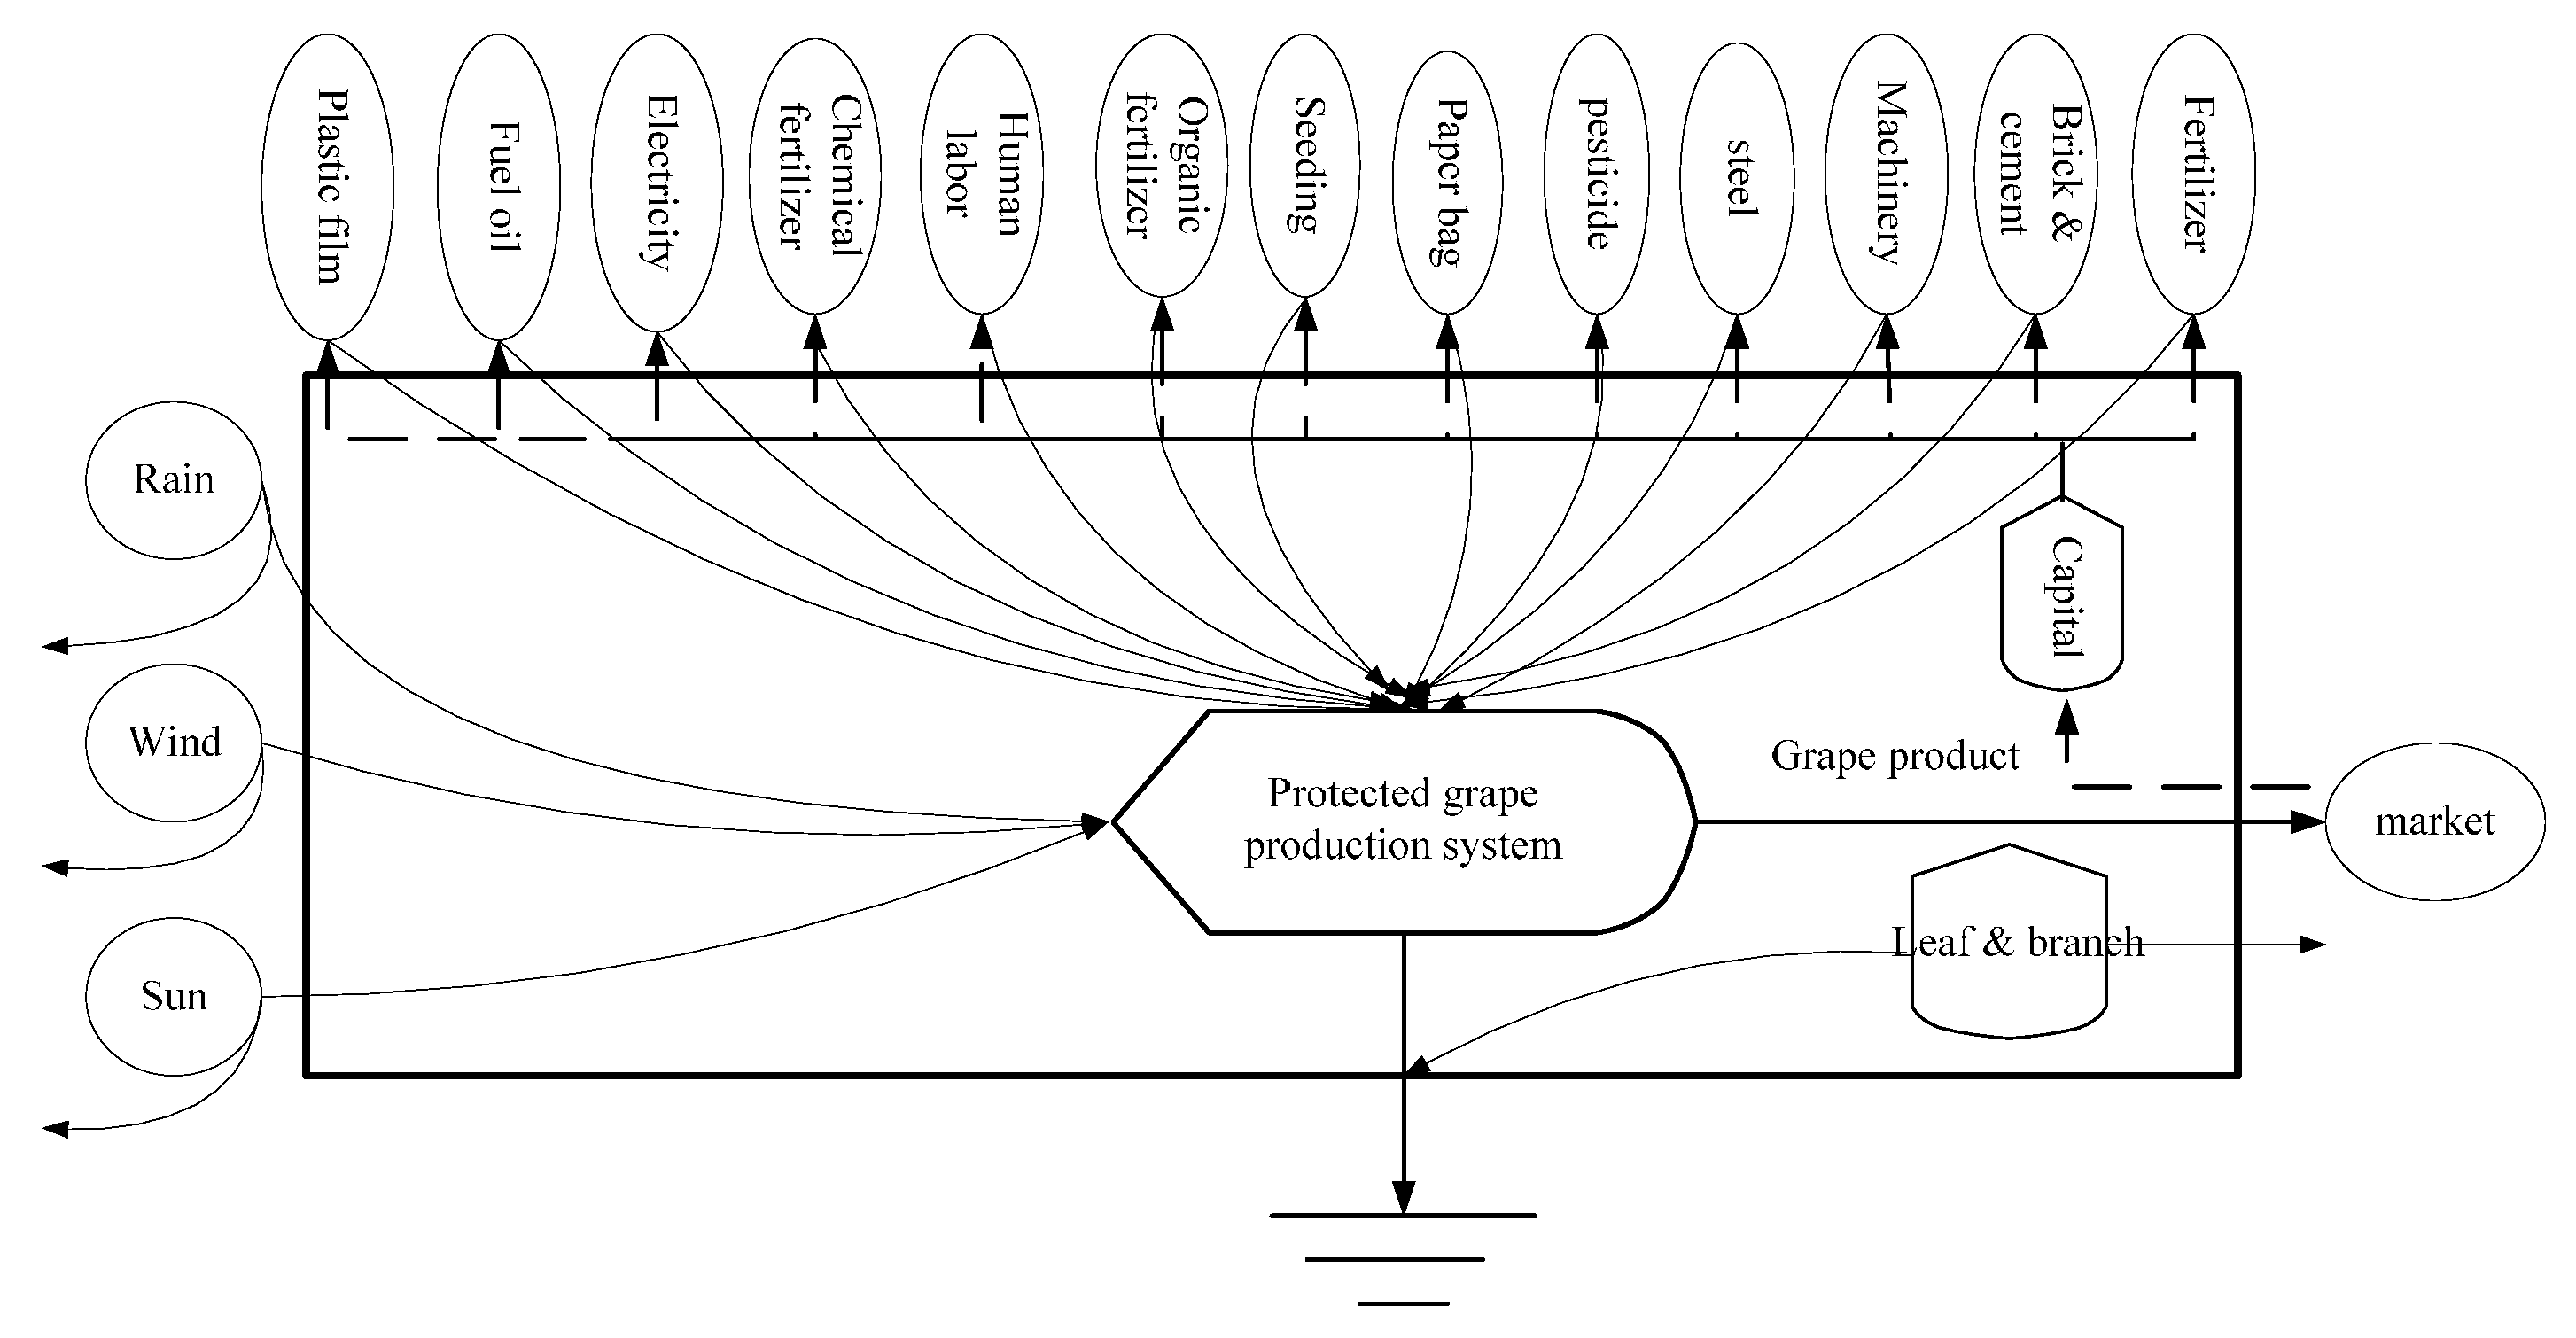
2.2.2. Emergy Diagram Analysis
An emergy diagram is used to clearly show the emergy inputs and outputs of an economic ecosystem. According to the analysis of the protected grape cultivation process, an emergy diagram of the production system was constructed and shown in
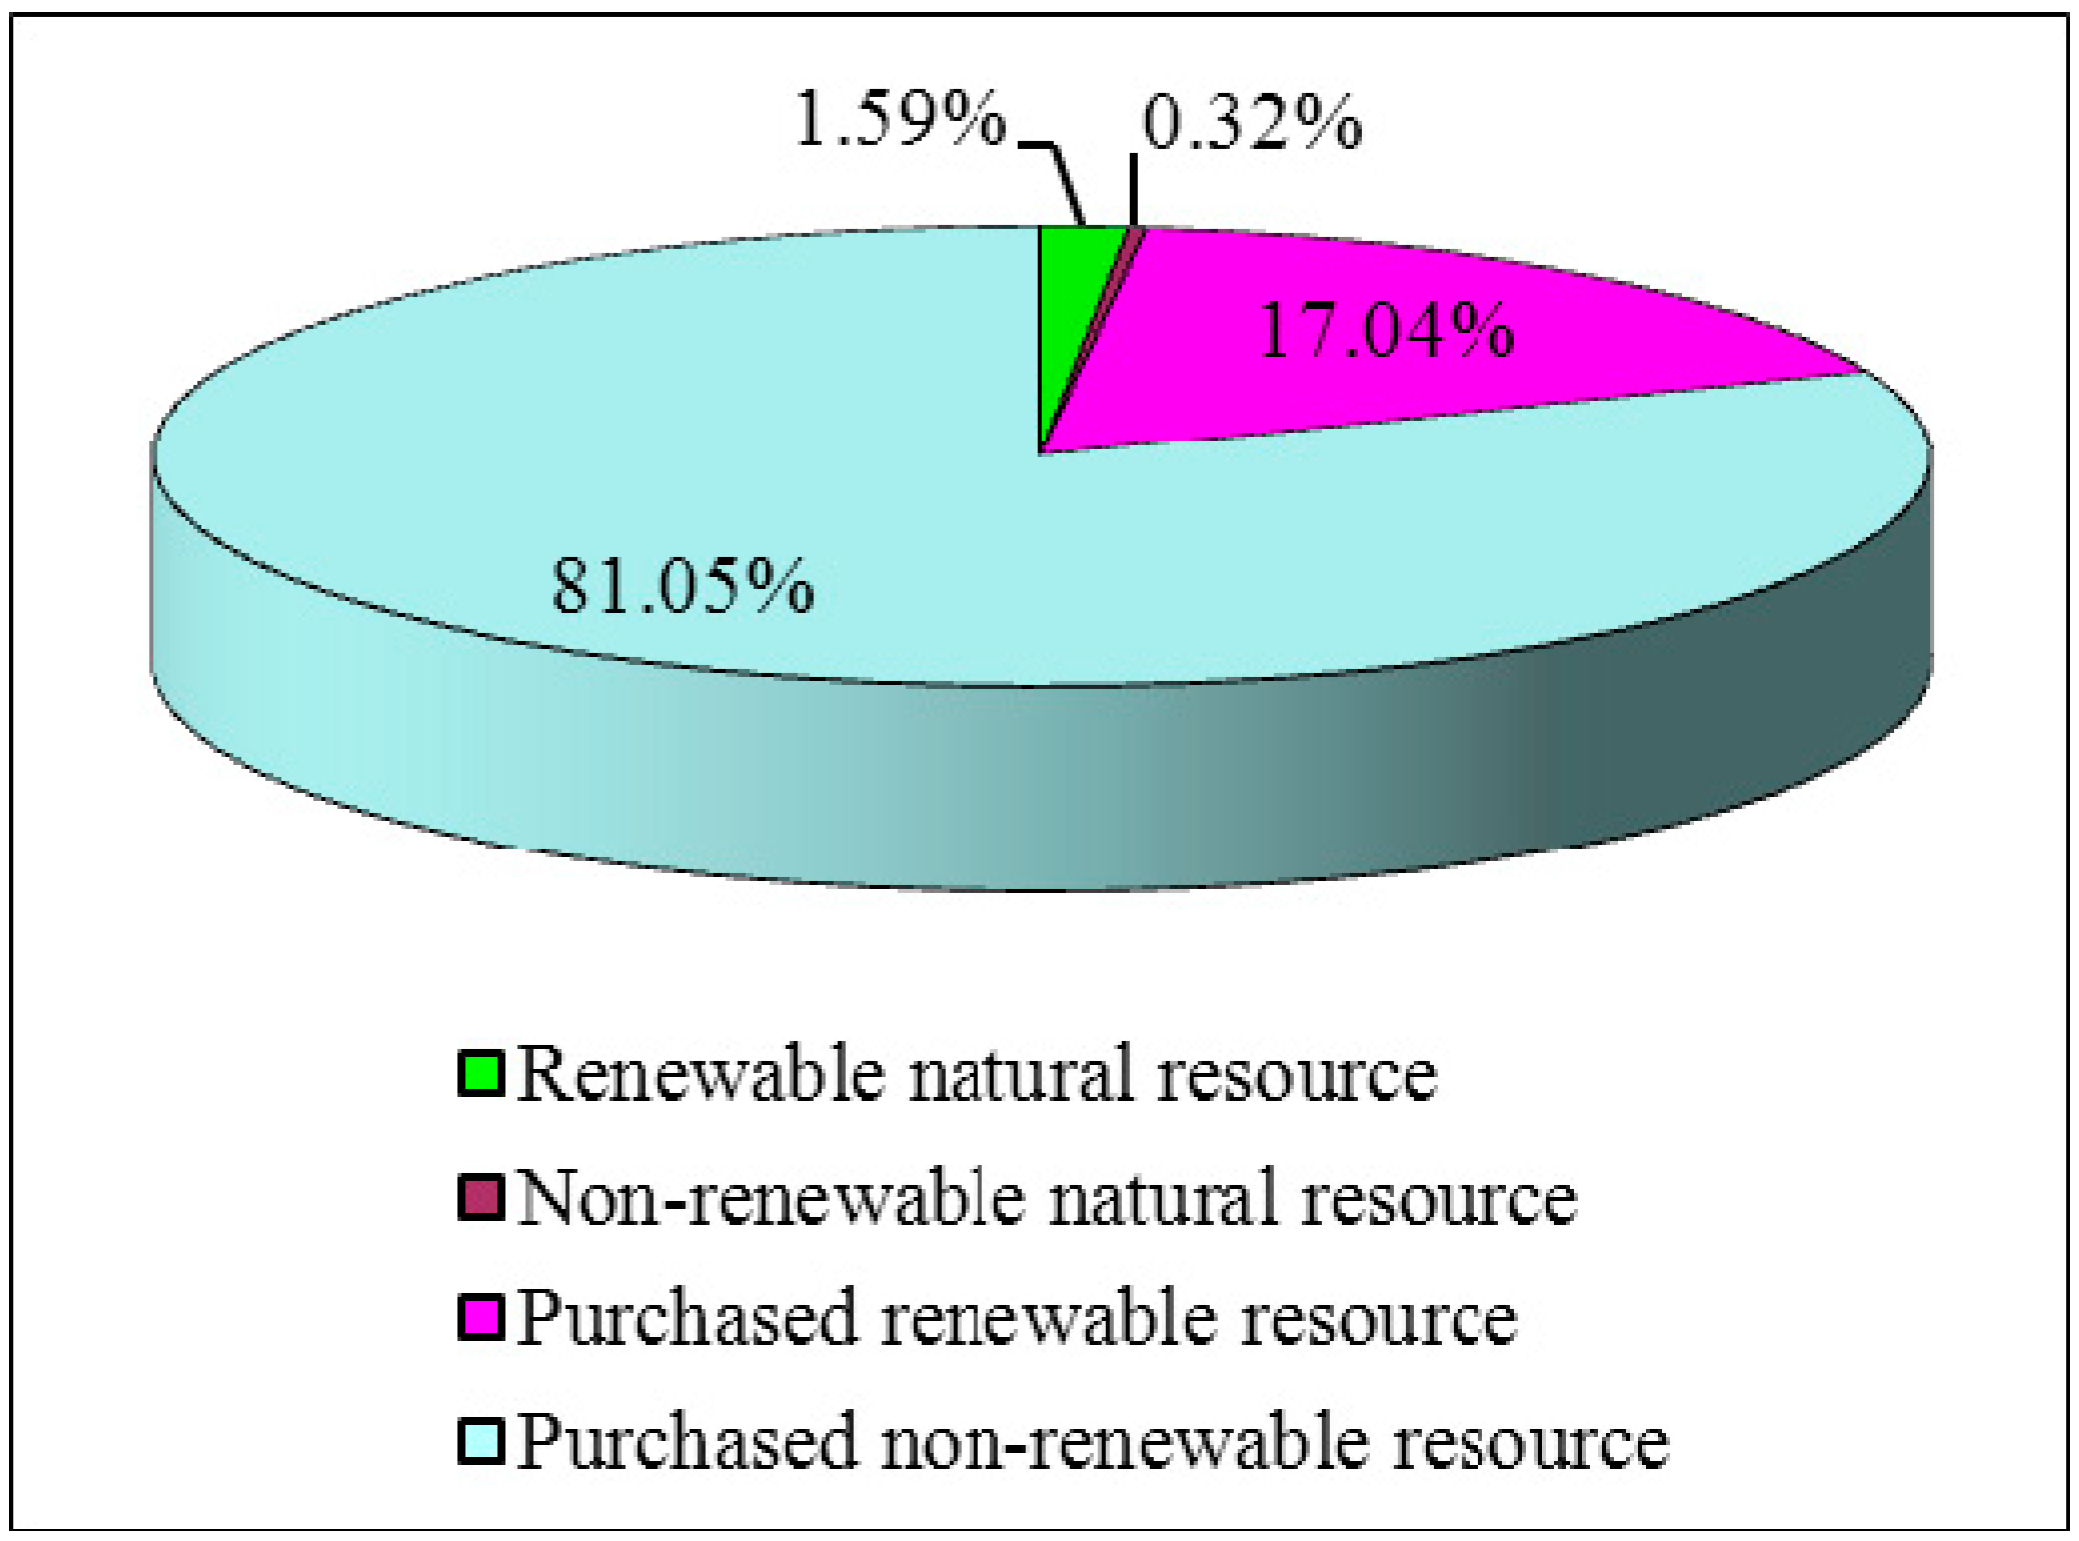
Figure 2. Four kinds of emergy resource inputs were noted in the production process (other emergy inputs were negligible and cannot be considered in the research), which include the following:
renewable natural resources, which refer to the sun, wind, and rain;
non-renewable natural resources, which mainly involve the topsoil loss;
purchased non-renewable resources, which include chemical fertilizers, fuel, pesticides, electricity, growth regulators, among others; and
purchased renewable resources, which comprise seedlings, irrigation water, organic fertilizer, labor, among others.
The system outputs include the grape products, leaves, and branches. Considering economic validity, the emergy output in this study specifically refers to the grape products.
Figure 2.
Emergy diagram of the protected grape production system. Note: 1. The solid line shows the energy flow route, whereas the dotted line shows the currency circulation route; 2. The several emergy input items that account for excessively low ratios in the protected grape cultivation system were omitted.
2.3. User-Type Analysis
The main users of ESDAS are the researchers on the sustainability development of a related field. Other kinds of users are the system administrator whose role is crucial in every information system and protected grape growers. Accordingly, we divided the users into groups and describe their main roles in
Table 1.
Table 1.
ESDAS user types.
Table 1.
ESDAS user types.
| User Type | Role Description |
|---|
| System administrators | In charge of system management and maintenance; with the highest authority. |
| Professional users | Professional researchers of emergy analysis and sustainable development; mainly conduct emergy analysis and sustainable evaluation using ESDAS; utilize the evaluation results according to the decision-making function of the system, such as comparing the results from different vineyards and predicting the development trend in protected grape cultivation in different areas nationwide. |
| Grape growers | Upload the data and information on protected grape production; can view the evaluation results of his vineyard |
2.4. ESDAS Requirement Analysis
The analysis of the user requirements for ESDAS was based on the survey and system analysis; the results are summarized as follows. ESDAS should be a system that:
enables multiple and massive production, careful data acquisition, storage, processing, display, and stewardship. In this regard, the professional users are convenient for querying.
promotes the automatization and computerization of the emergy analysis procedure. Simultaneously, it should provide intelligent analysis, reduce considerable manual calculation, and address the propensity for error of traditional emergy analysis.
allows the researchers of protected grape sustainability to regularly obtain information on the current situation of the system and make some decisions based on the data for future development.
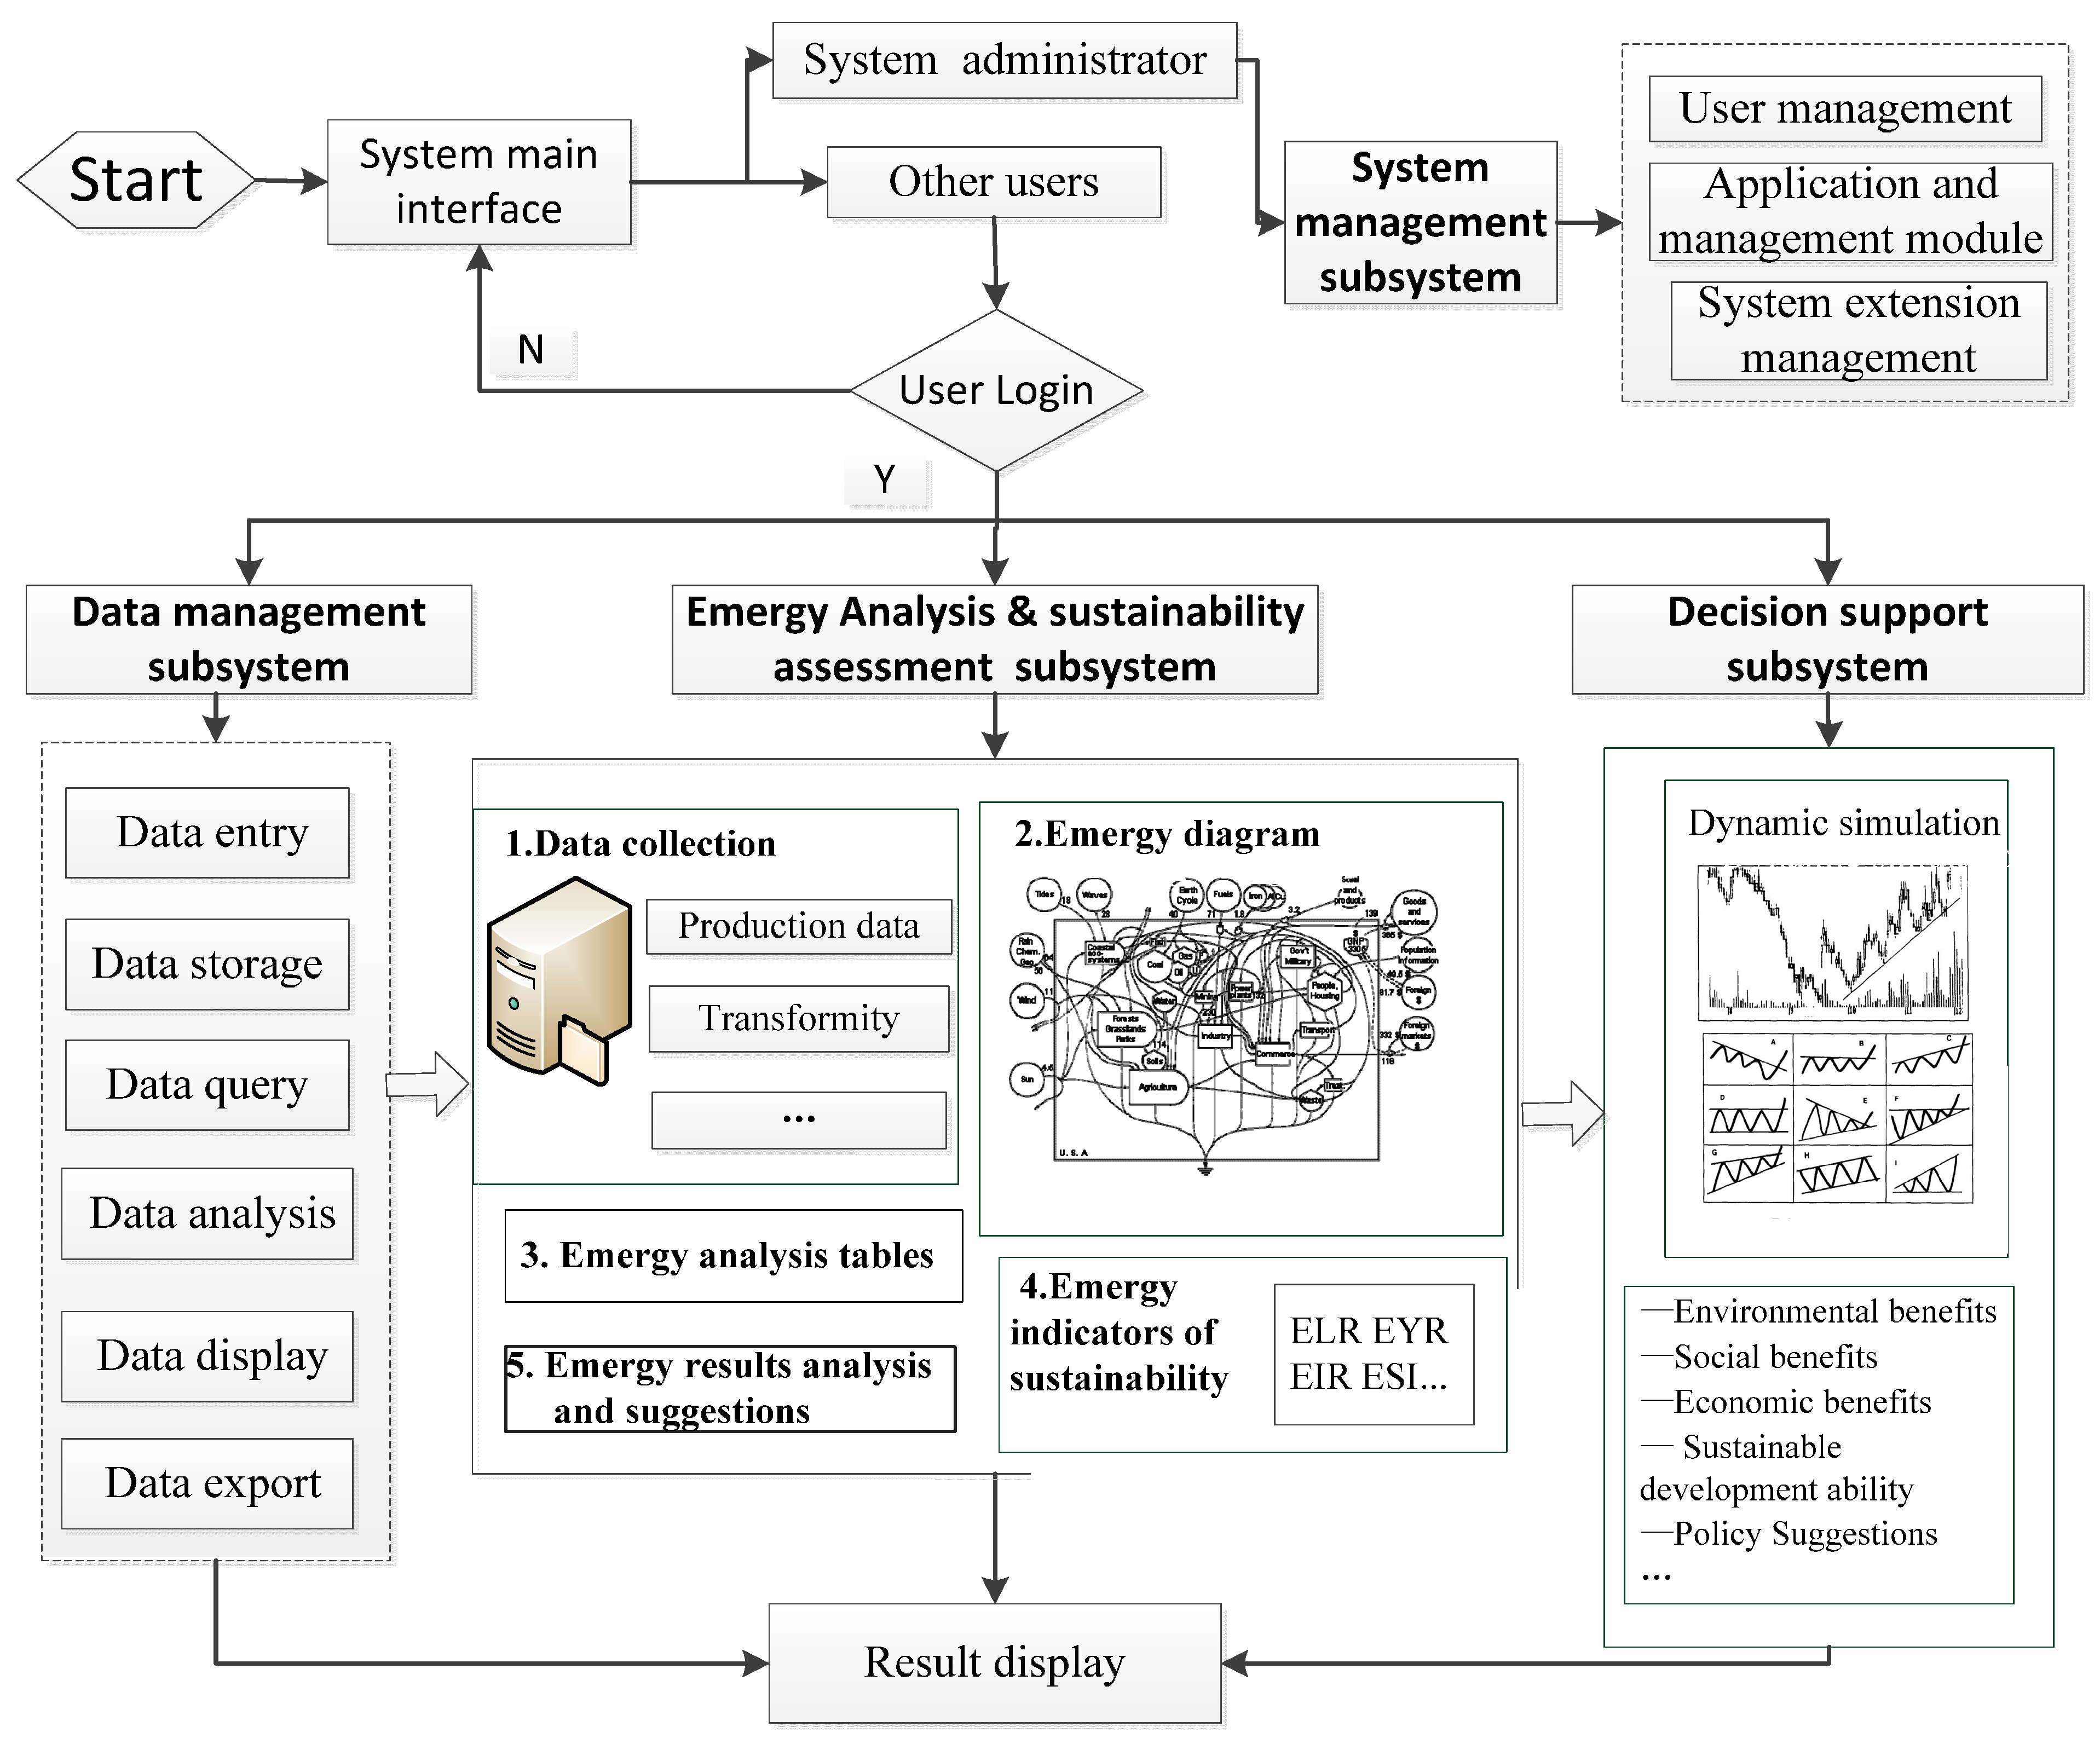
2.5. ESDAS Decision Process Analysis
The most fundamental aim of ESDAS is the automatization of the entire process of emergy evaluation analysis. Through computerized analysis, the ESDAS system would conduct all steps that were traditionally carried out by manual computation.
Figure 3 illustrates the decision process of ESDAS.
The entire ESDAS system involves several basic processes, which comprise the user login, data management, emergy evaluation and decision analysis, system management, and result display.
User login: Three kinds of users can log into the system. One is the system administrator who carries out the user management, system extension management, and other system managements. The grape grower can also log in and upload production data, whereas the third user is the professional user, who has the authority to employ data management, the emergy evaluation and decision analysis functions.
Figure 3.
System decision process analysis.
Figure 3.
System decision process analysis.
Data acquisition: An online survey system was integrated into ESDAS; the grape growers will log in the system and regularly fill out the basic data in accordance with the requirements, including vineyard information (geographical position, scale, and area), grape grower information (name, age, educational level, economic situation, specialization degree of grape growing, etc.), production information (planted varieties, cultivation pattern, etc.), emergy input information (specific input of natural and purchased resources), and emergy output data, which are used for emergy and decision analyses. The transformity information is also determined through this process.
Data warehousing and management: The acquired data are stored in a relational database after a series of treatments, such as data collation and data cleansing (format conversion, format correction, and so on). The system administrators have the highest authority in data management, but their usual functions only involve querying, revising, and deleting data. Meanwhile, a grape grower can only query, revise, and delete the data he/she uploaded, whereas the professional users can query, revise, delete, process, analyze, and display data.
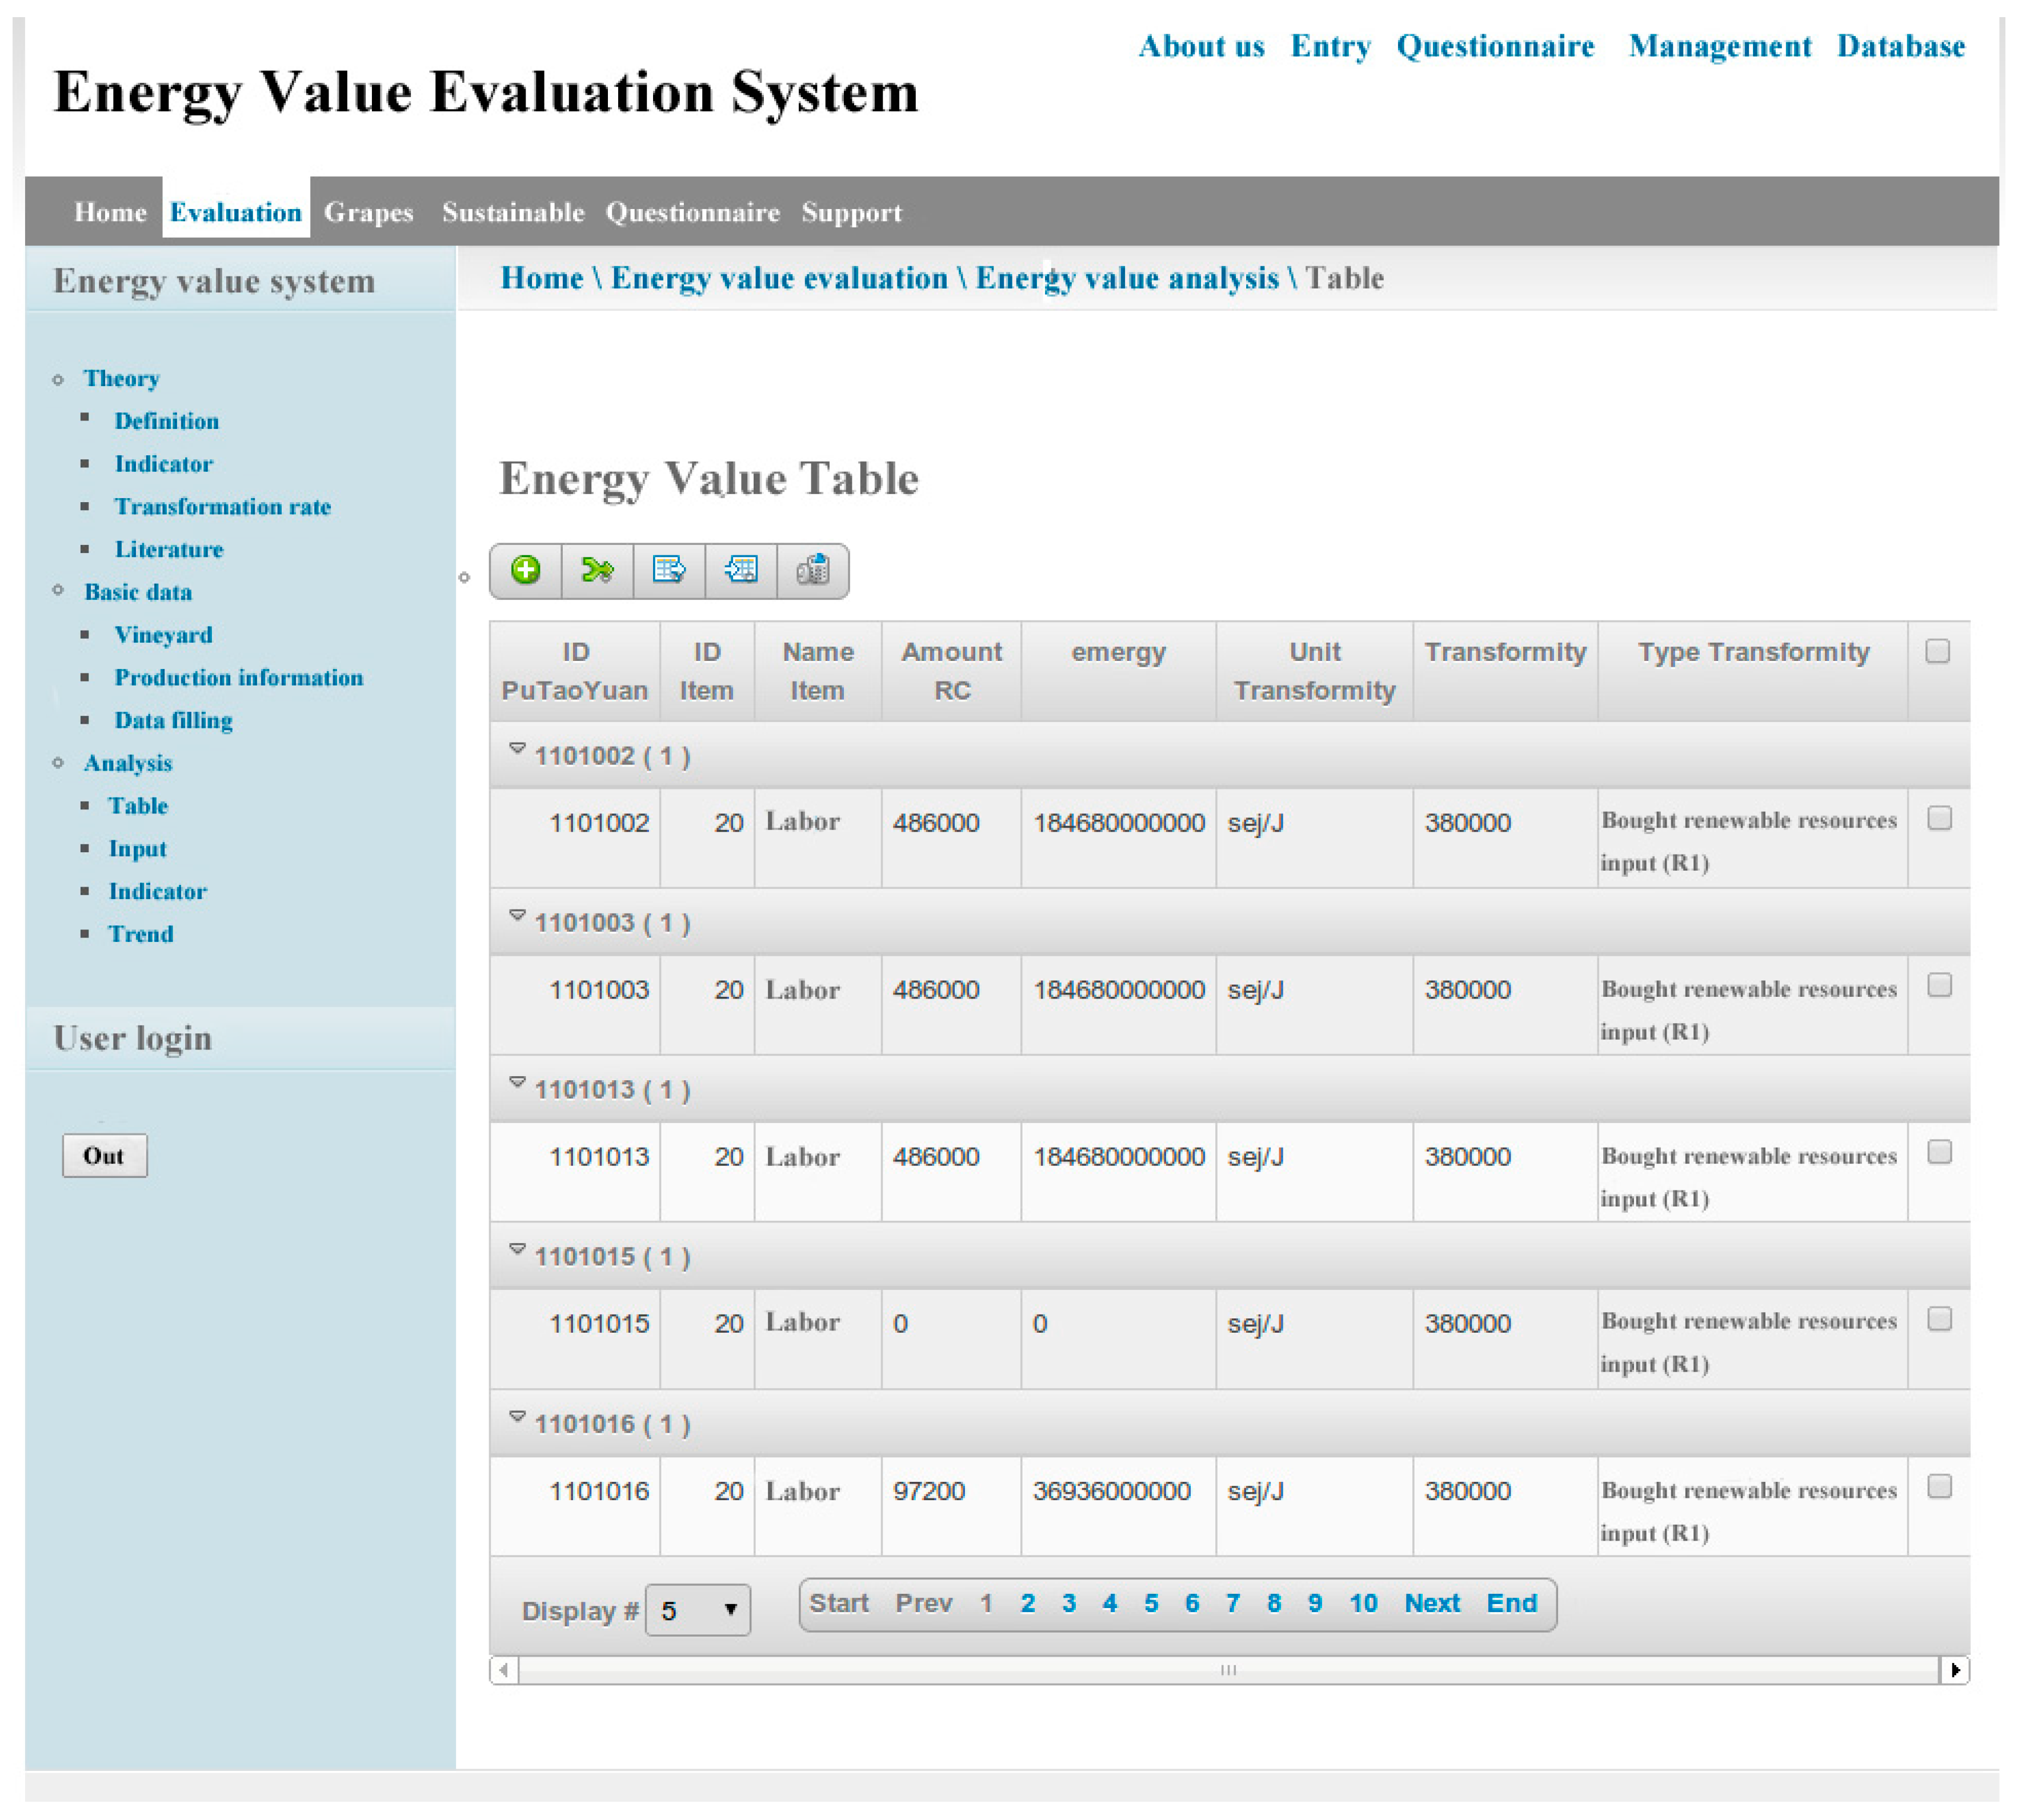
Emergy analysis and sustainability assessment: The five key steps of emergy analysis were intelligently realized in the ESDAS. The critical aspect of emergy evaluation is the determination of transformity and emergy data. By data acquisition and processing, the emergy data and transformity information were obtained, and the emergy analysis table is subsequently generated automatically. From the output of the process, the user can choose related emergy indicators, which the system will instantly use for calculations that include those needed for sustainability evaluation.
Decision support: On the basis of the results of emergy and sustainability evaluation, the system will run the decision support process and provide some decision suggestions related to sustainable development; it may involve comparisons between a number of emergy analyses and sustainability assessment results at a large scale, indicate the differences between various evaluation objects, and supply certain solutions to improve the sustainability of the evaluated vineyard.
Result display: The graphical display of the results is intuitive and aids the users to understand the analysis results for sustainable development and the decision-making processes.
3. System Design
3.1. System Function Design
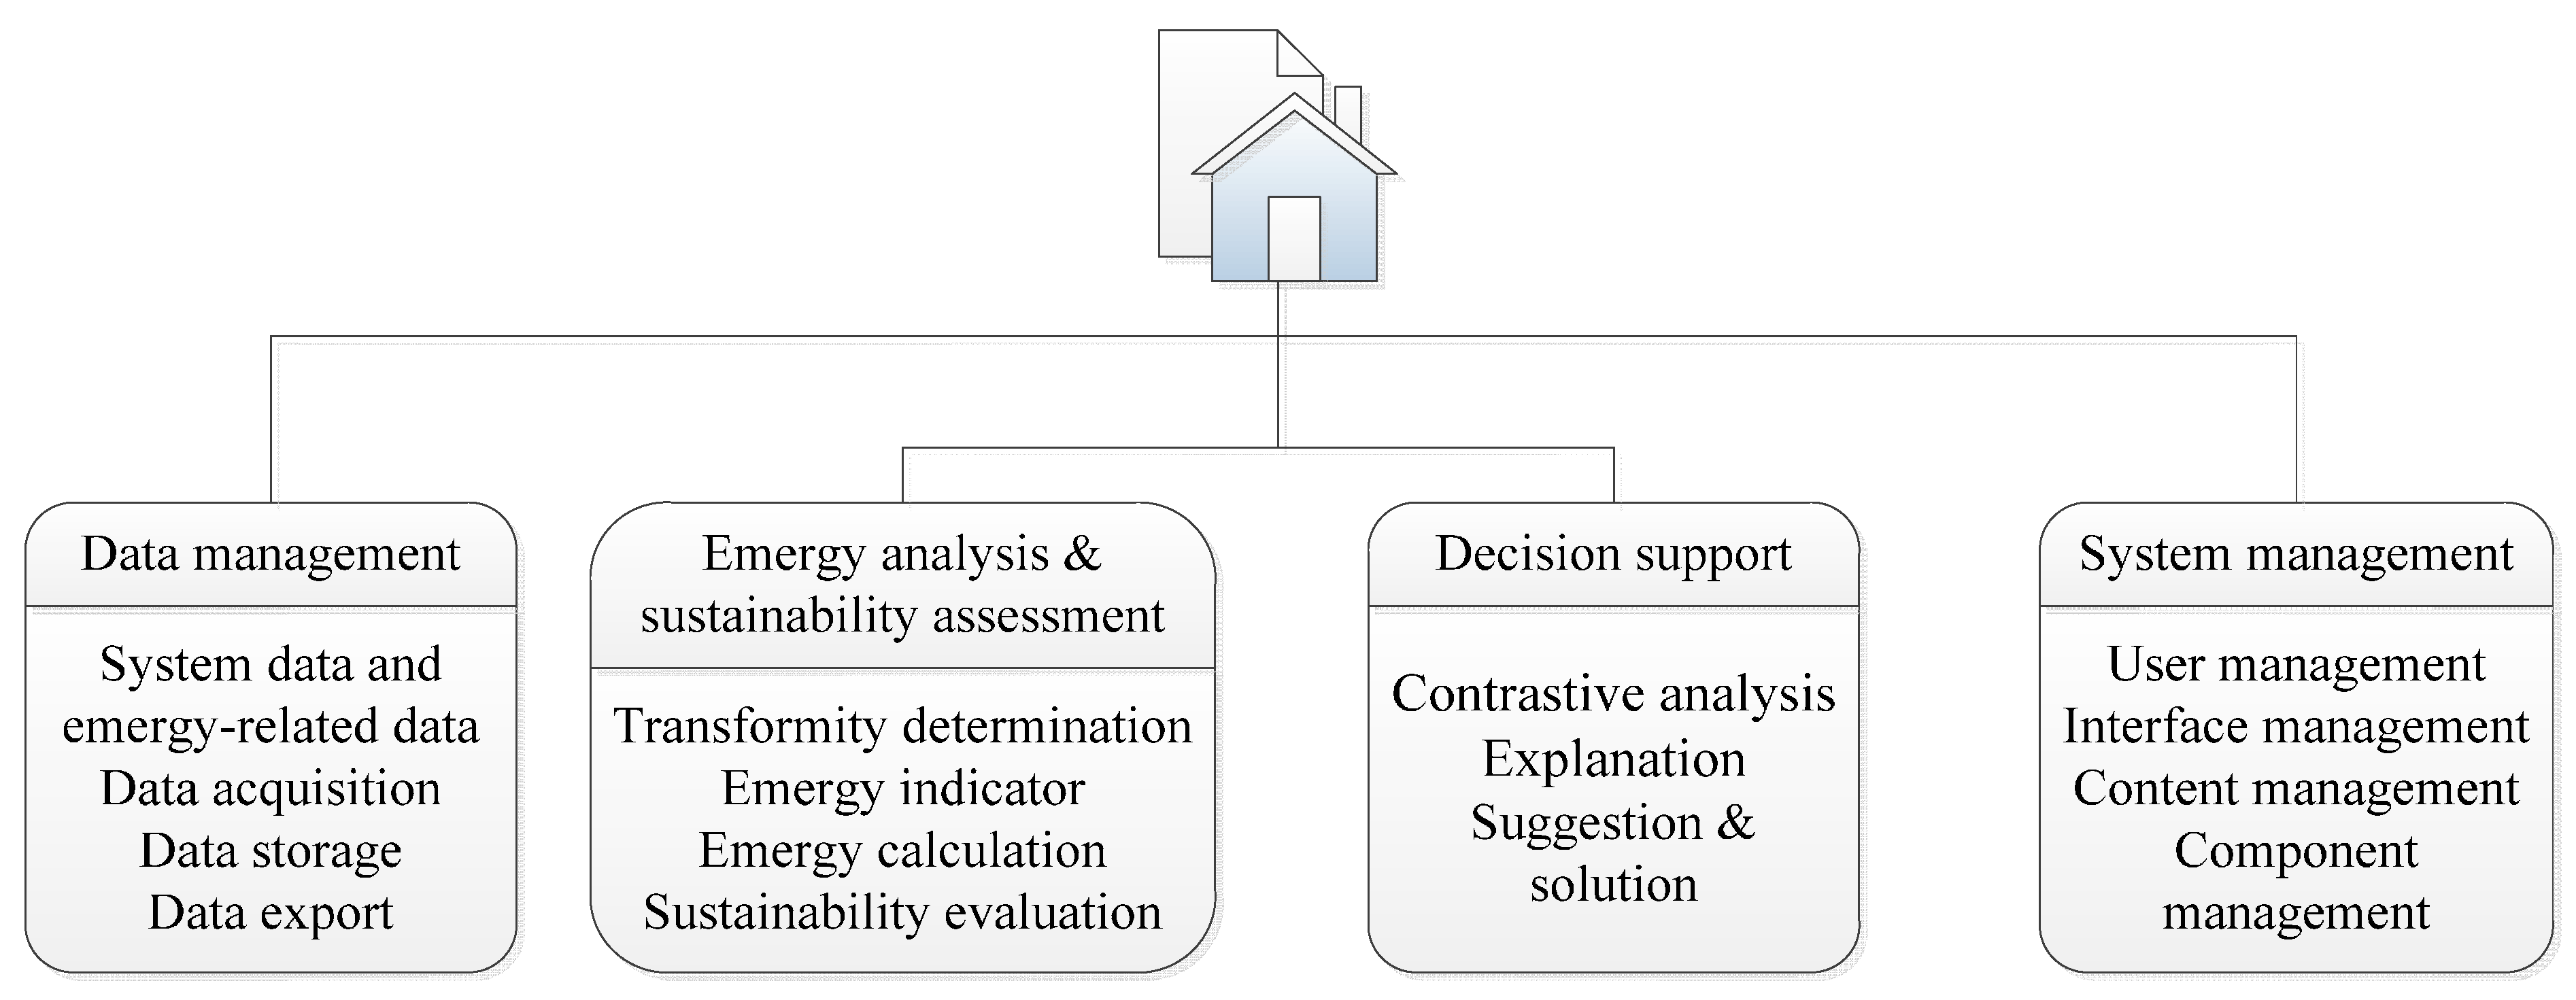
According to the user requirement and process analysis, the ESDAS must be armed with various functions as follows: data acquisition, data entry, data storage, emergy calculation, emergy analysis and sustainability assessment, decision support for sustainable development, results display (visualization), system management, and others. These functions can be divided into four categories: data management, emergy analysis and sustainability assessment, decision support for sustainable development, and system management functions. The descriptions of the four functions are displayed in
Figure 4.
Figure 4.
Main functions of ESDAS.
Figure 4.
Main functions of ESDAS.
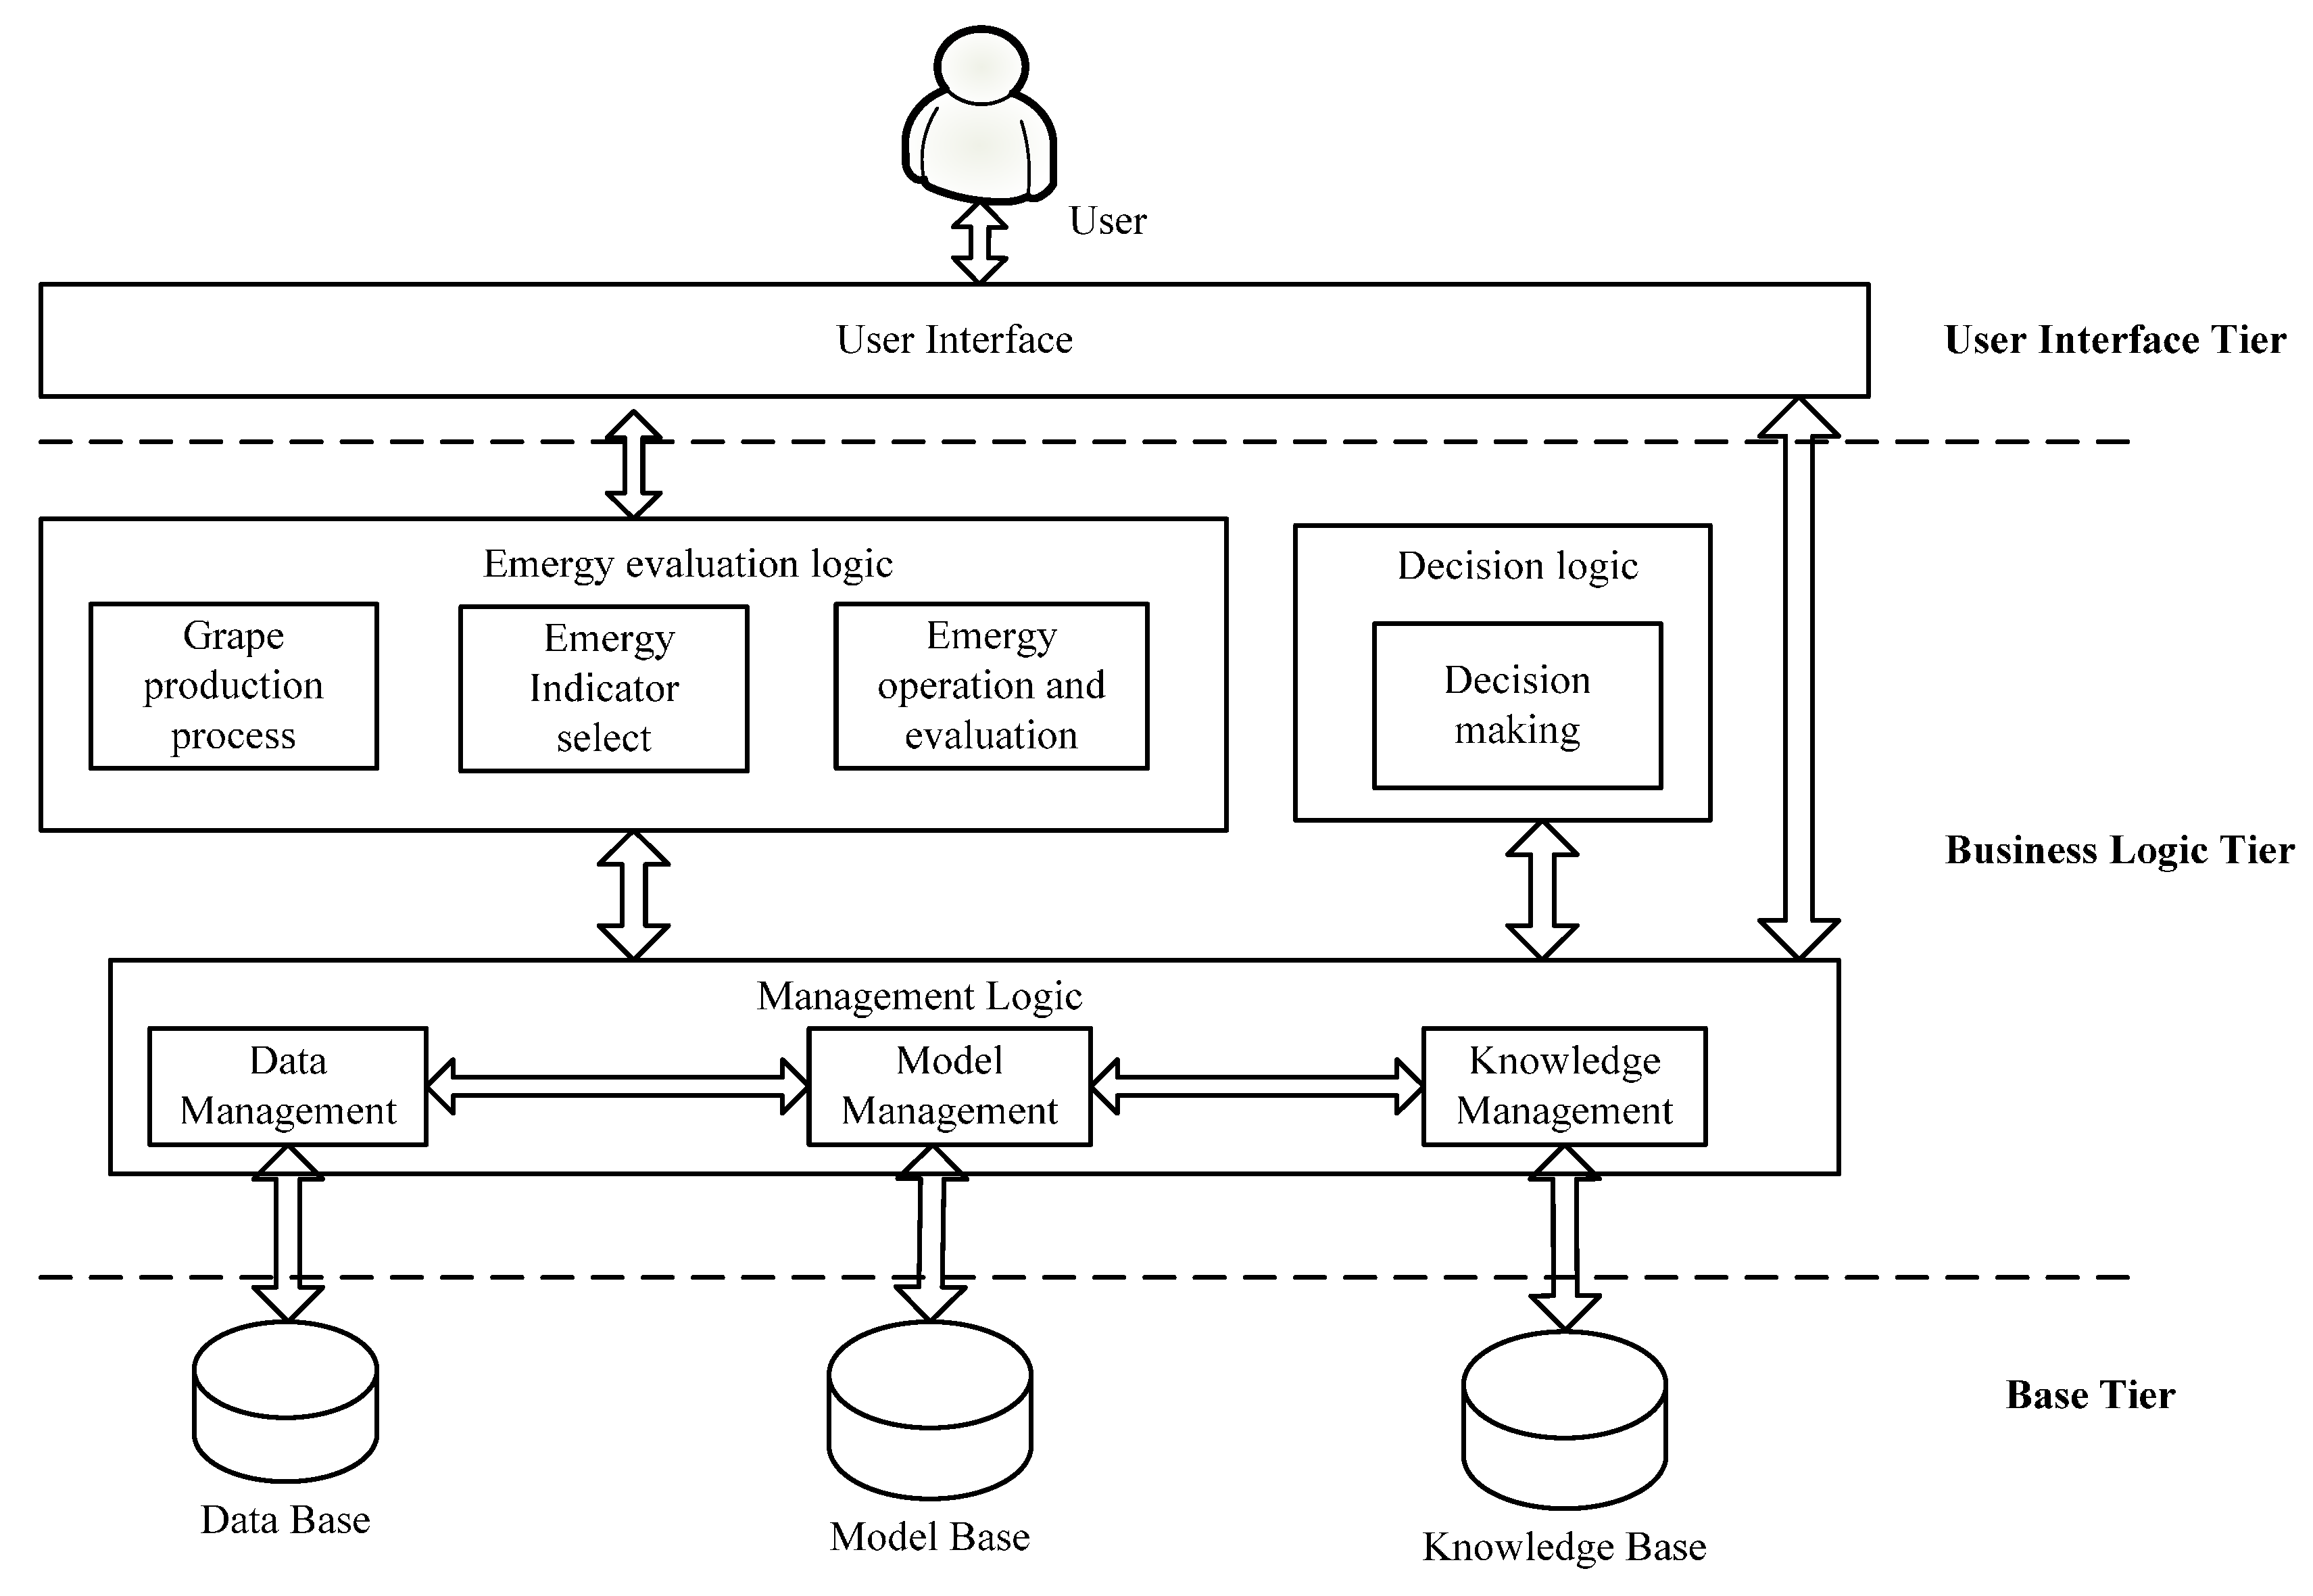
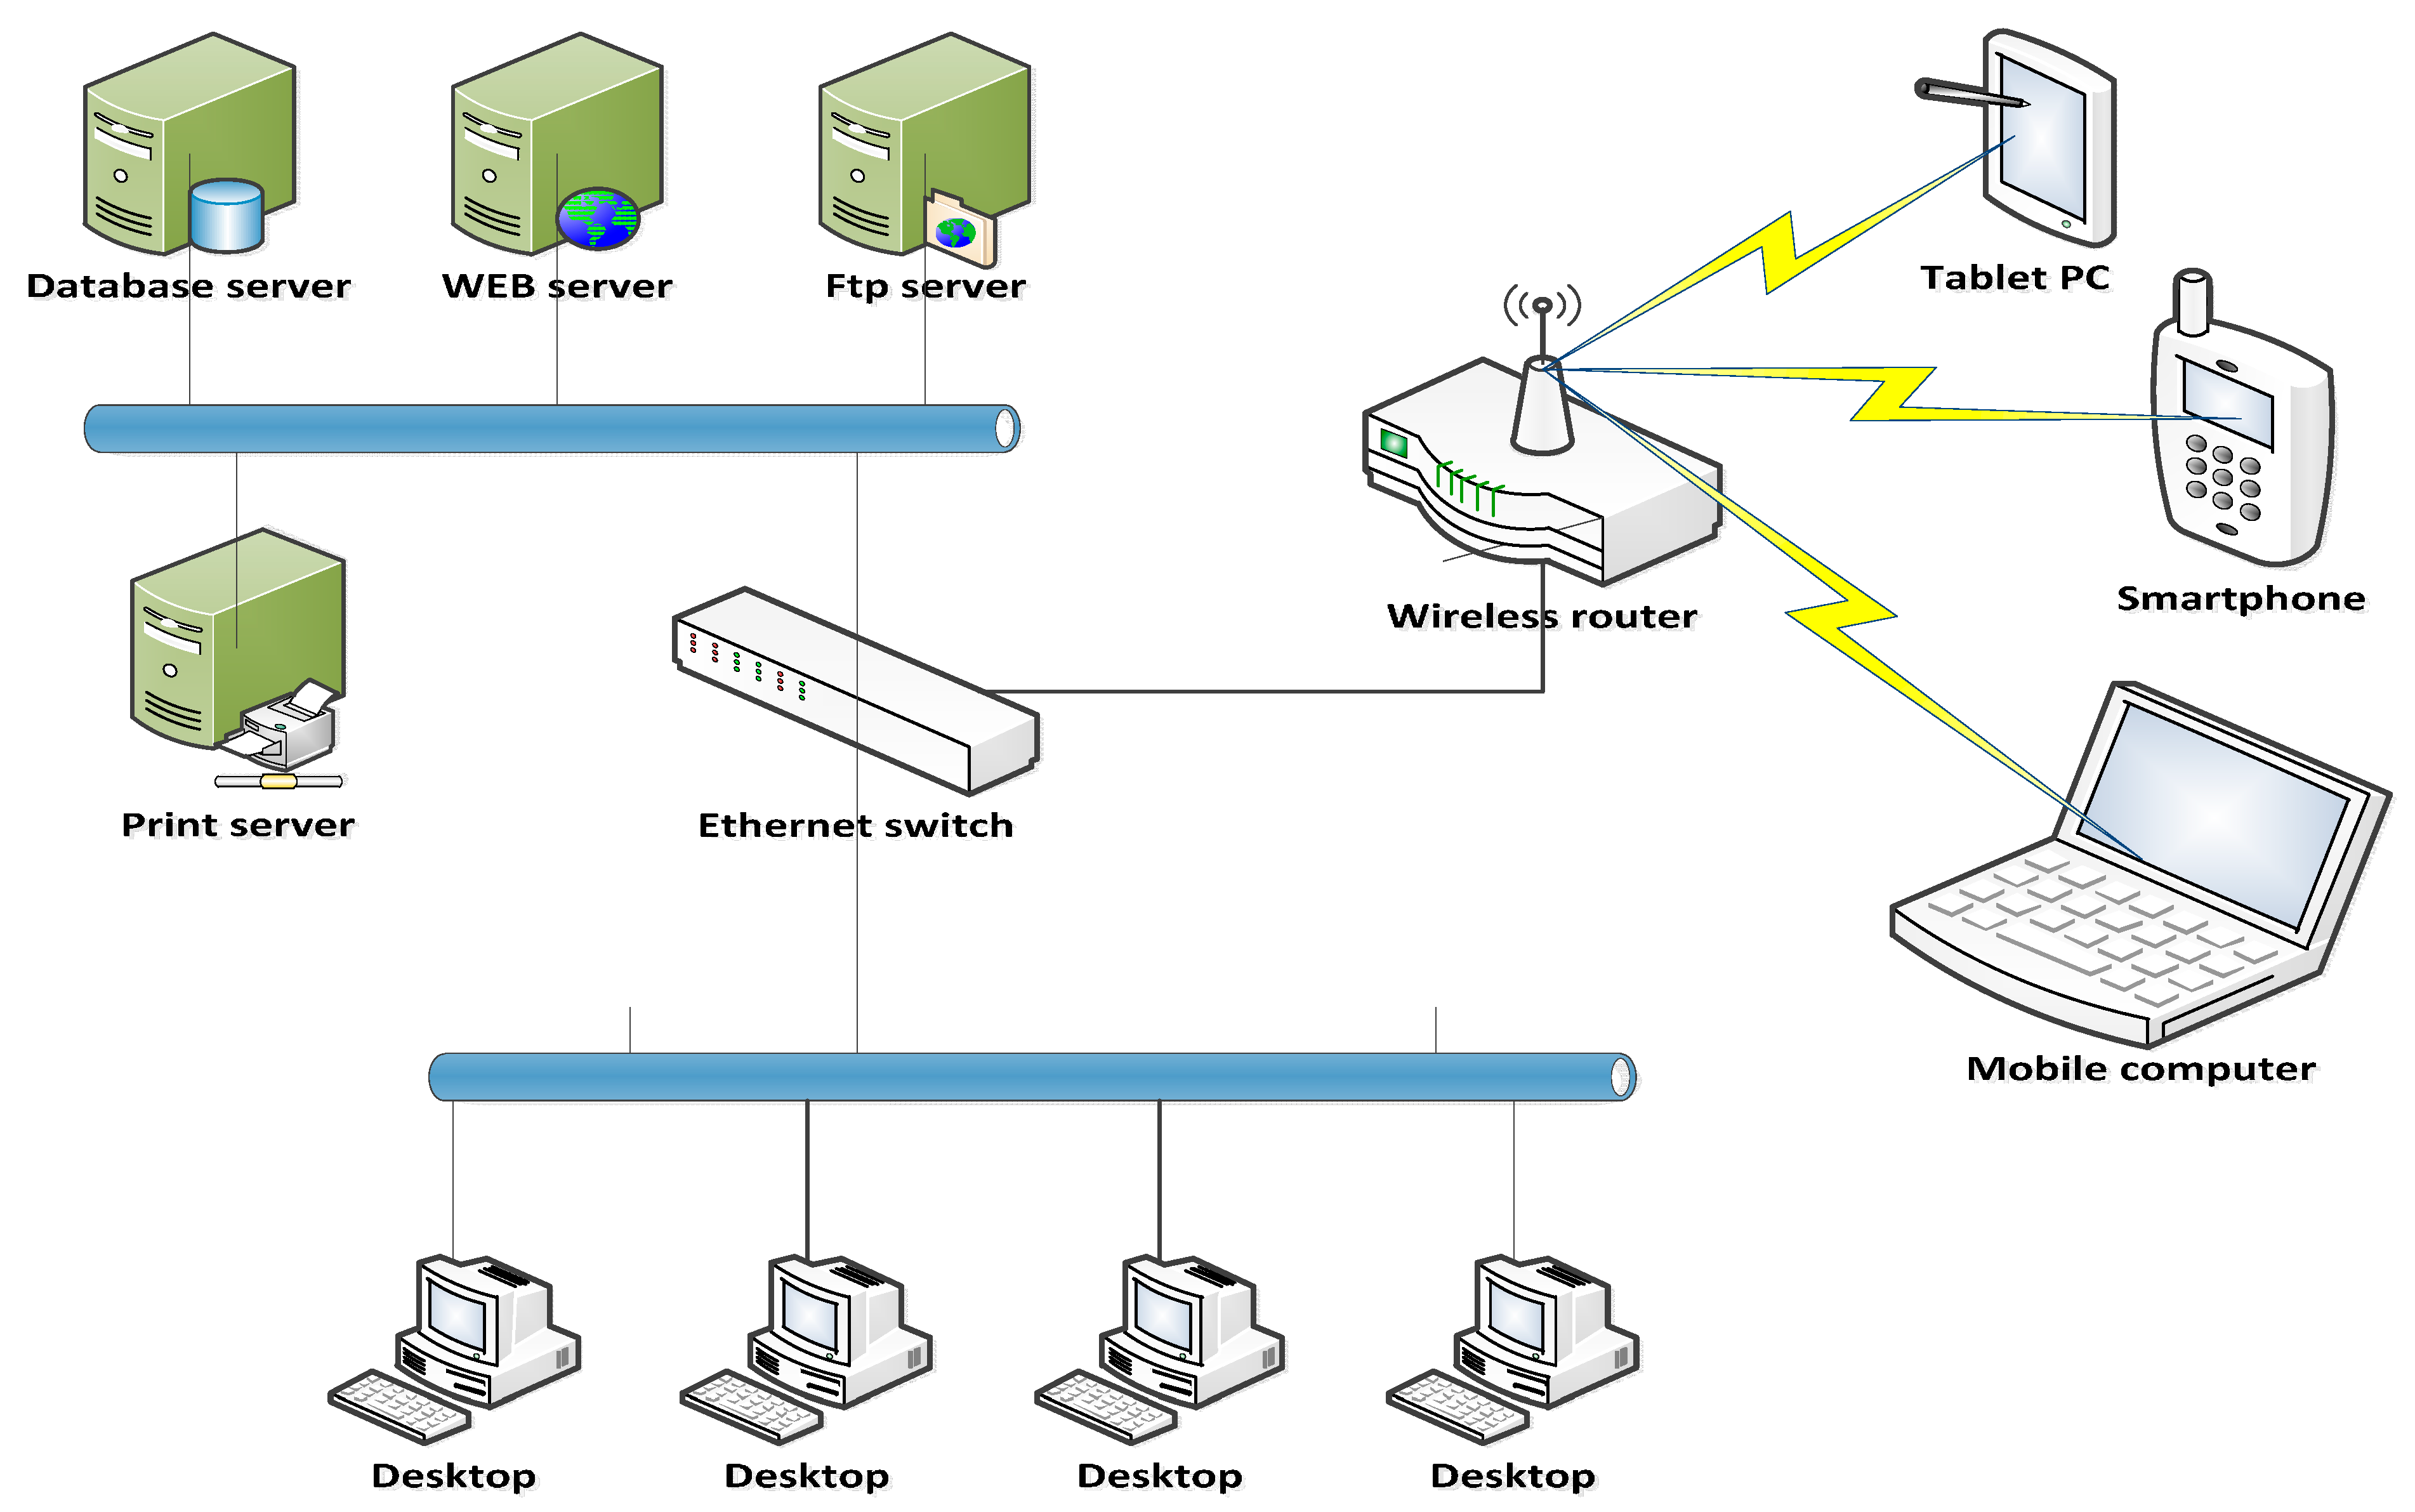
3.2. System Architecture Design
System architecture was designed in accordance with the system function and process. The ESDAS architecture was divided into three tiers, which are illustrated in
Figure 5.
Figure 5.
System architecture design.
Figure 5.
System architecture design.
To realize the main functions of the system, ESDAS comprises four subsystems as follows:
System management subsystem: The fundamental functions incorporate user management, application and management module, and system extension management. User management controls and restricts user privileges in the system. The application and management module can be modified for specific components, such as the opening and closing, the placement settings, and the access levels.
Data management subsystem: This subsystem’s main purpose is to manage various types of data that involve user information, article page, system data during operations, and others. Among these data, vineyard information and the raw emergy-related data are the most important. Raw emergy-related data comprise the transformity information, emergy input and output data, and other entries. The data management subsystem must handle three essential roles, namely, data acquisition and entry, data storage, and data export. Furthermore, the data from information broadcast, which involve viticultural knowledge and emergy professional knowledge, are managed in this subsystem.
Emergy analysis and sustainability assessment subsystem: This subsystem corresponds to the emergy analysis circuit. The related subsystem is composed of four functional modules, particularly, transformity determination, selected emergy indicators, emergy evaluation, and sustainability assessment. Transformity possesses time and space properties; hence, the researcher should initially determine the values of transformity of the specific protected vineyard. The emergy indicator should be selected and the index should be established in accordance with the research aim and the characteristics of the target assessment production system. Using the raw emergy data of the entire protected grape production process which obtained from the data management subsystem, ESDAS will complete the calculation steps in basic emergy analysis, which is the core module of this subsystem. At the end of the emergy analysis, the assessment of sustainability is conducted, and the results will indicate the environmental loading and ability for emergy sustainable development of the system.
Decision support for sustainable development subsystem: This subsystem summarizes the development of the current situation and makes some recommendations on the future development direction. According to the results of emergy analysis and sustainability assessment, ESDAS is capable of accomplishing contrastive analysis on the emergy and sustainability assessments for different vineyards or different production areas. Furthermore, for a specific vineyard, the system will provide the suggested solutions for sustainability improvement, which are based on comparisons with standard parameter values of test points that would explain the sustainability evaluation and production decisions.
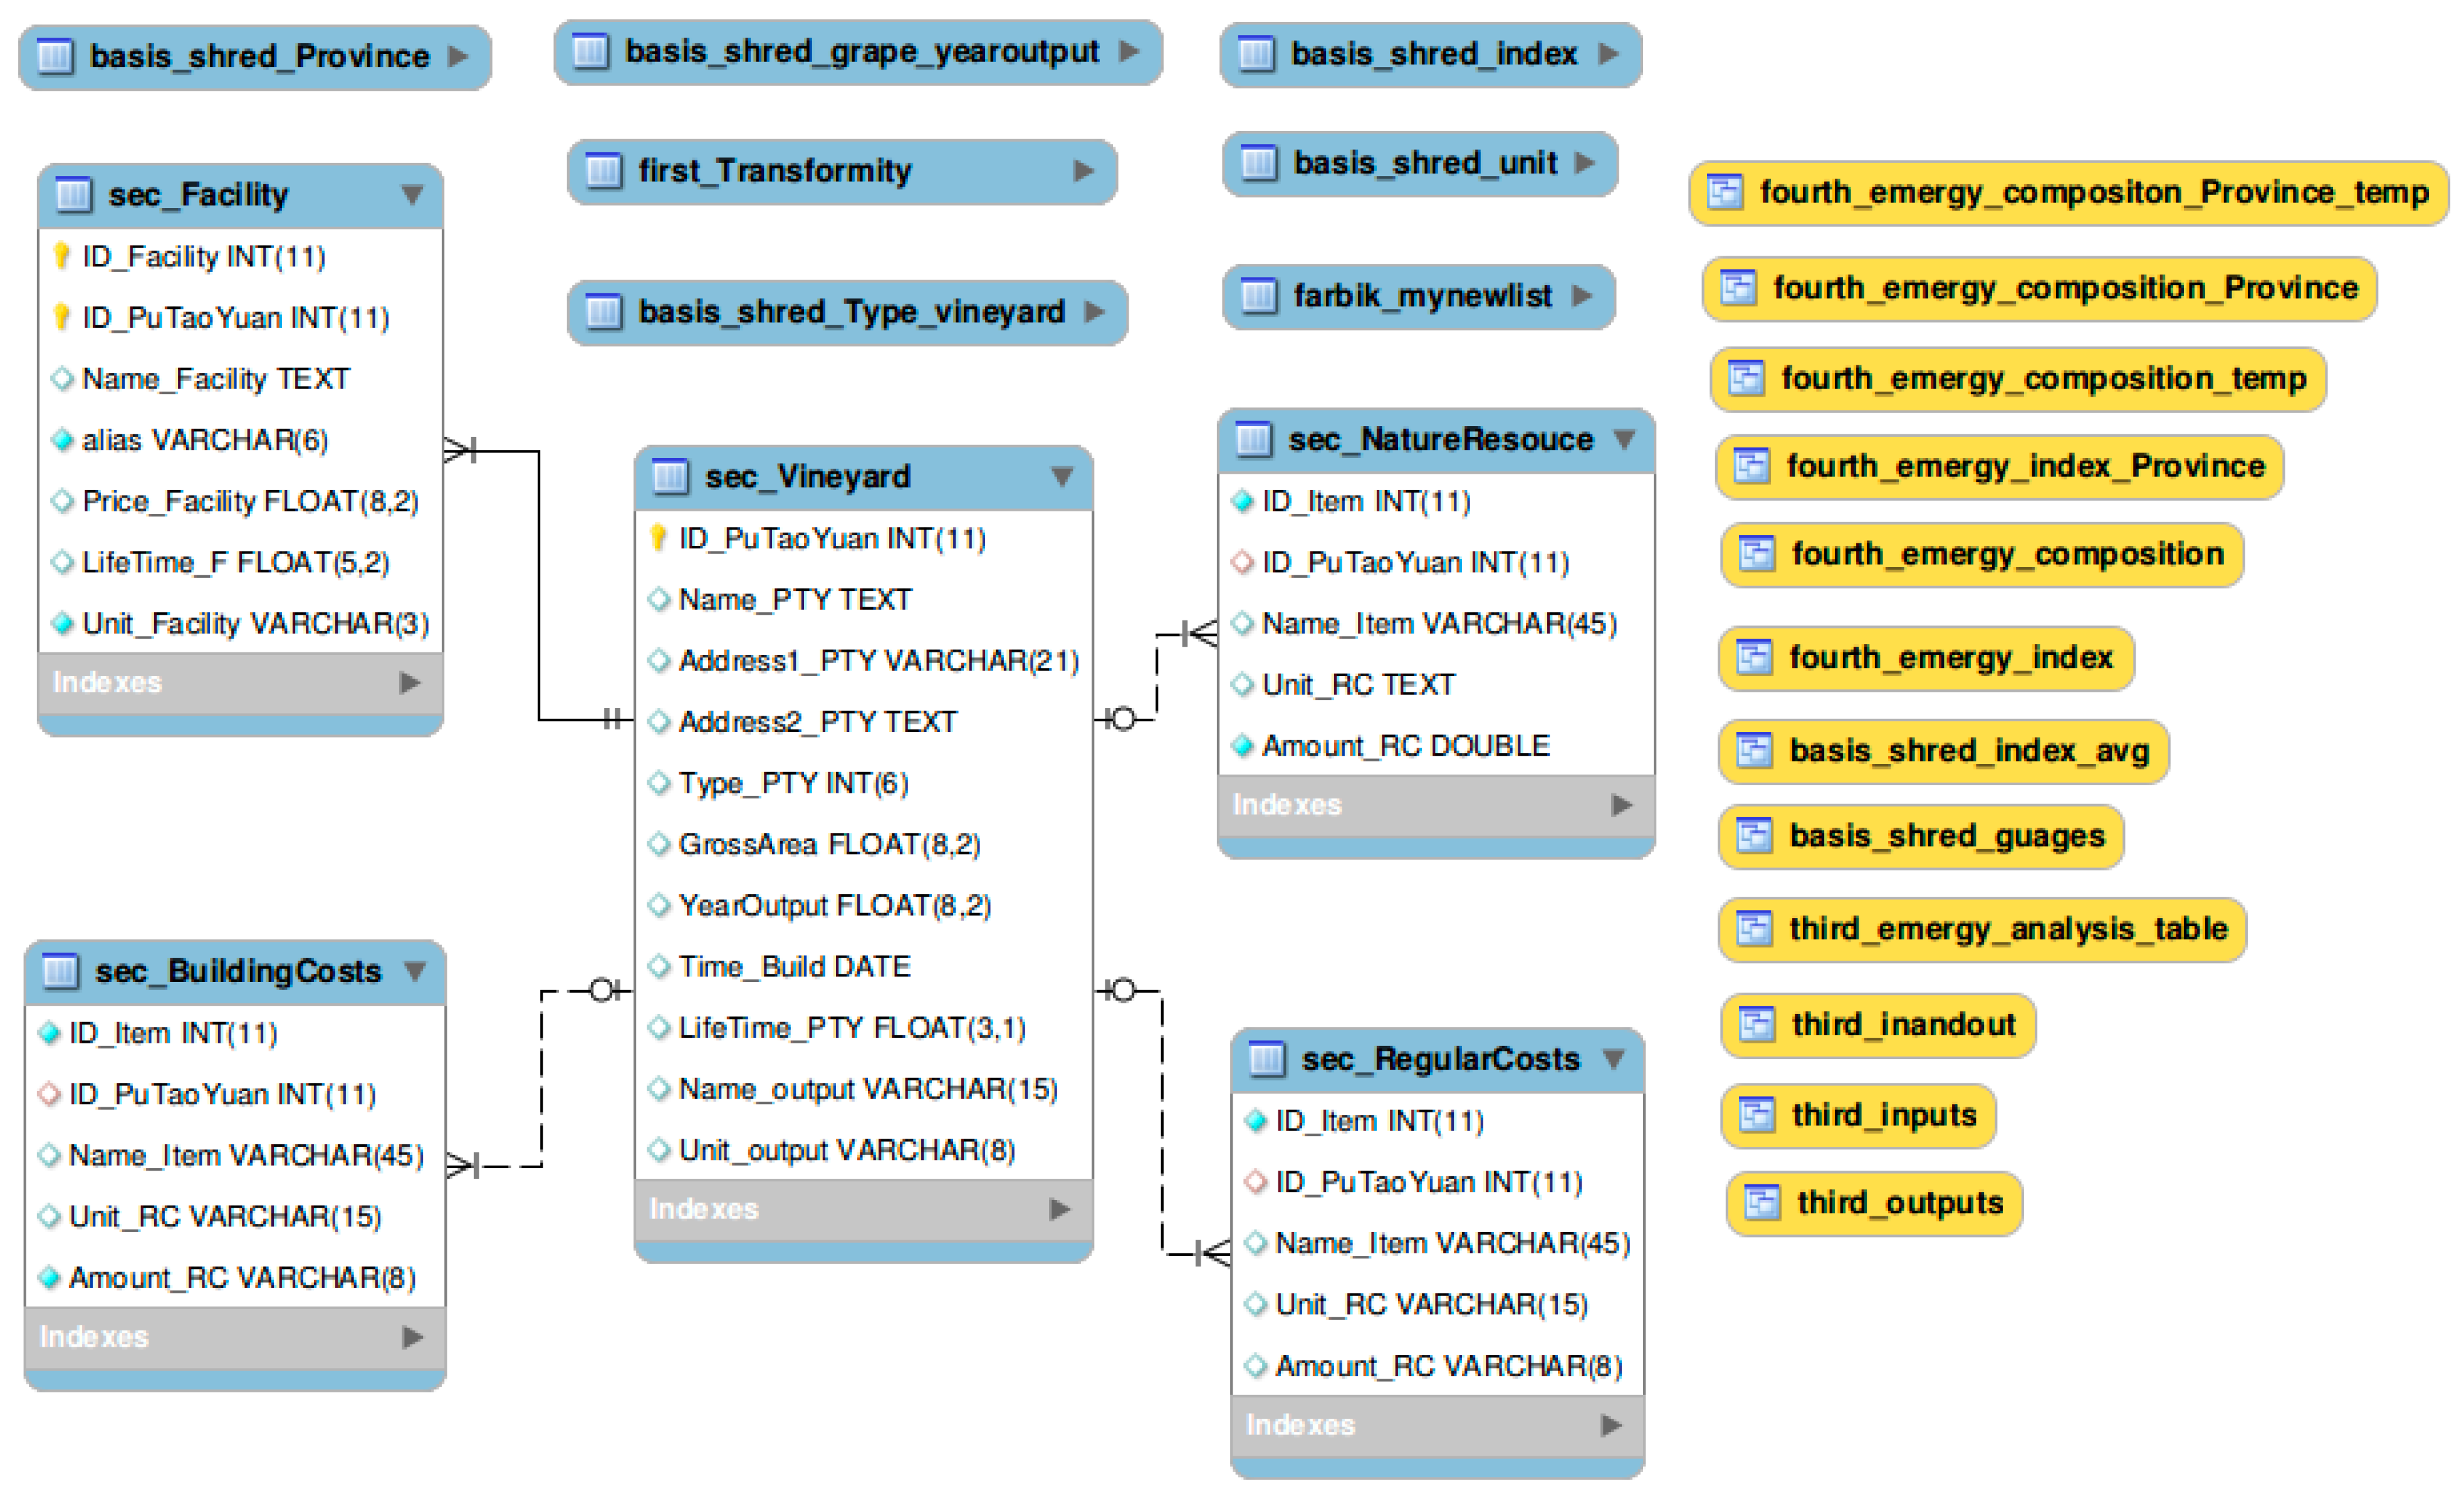
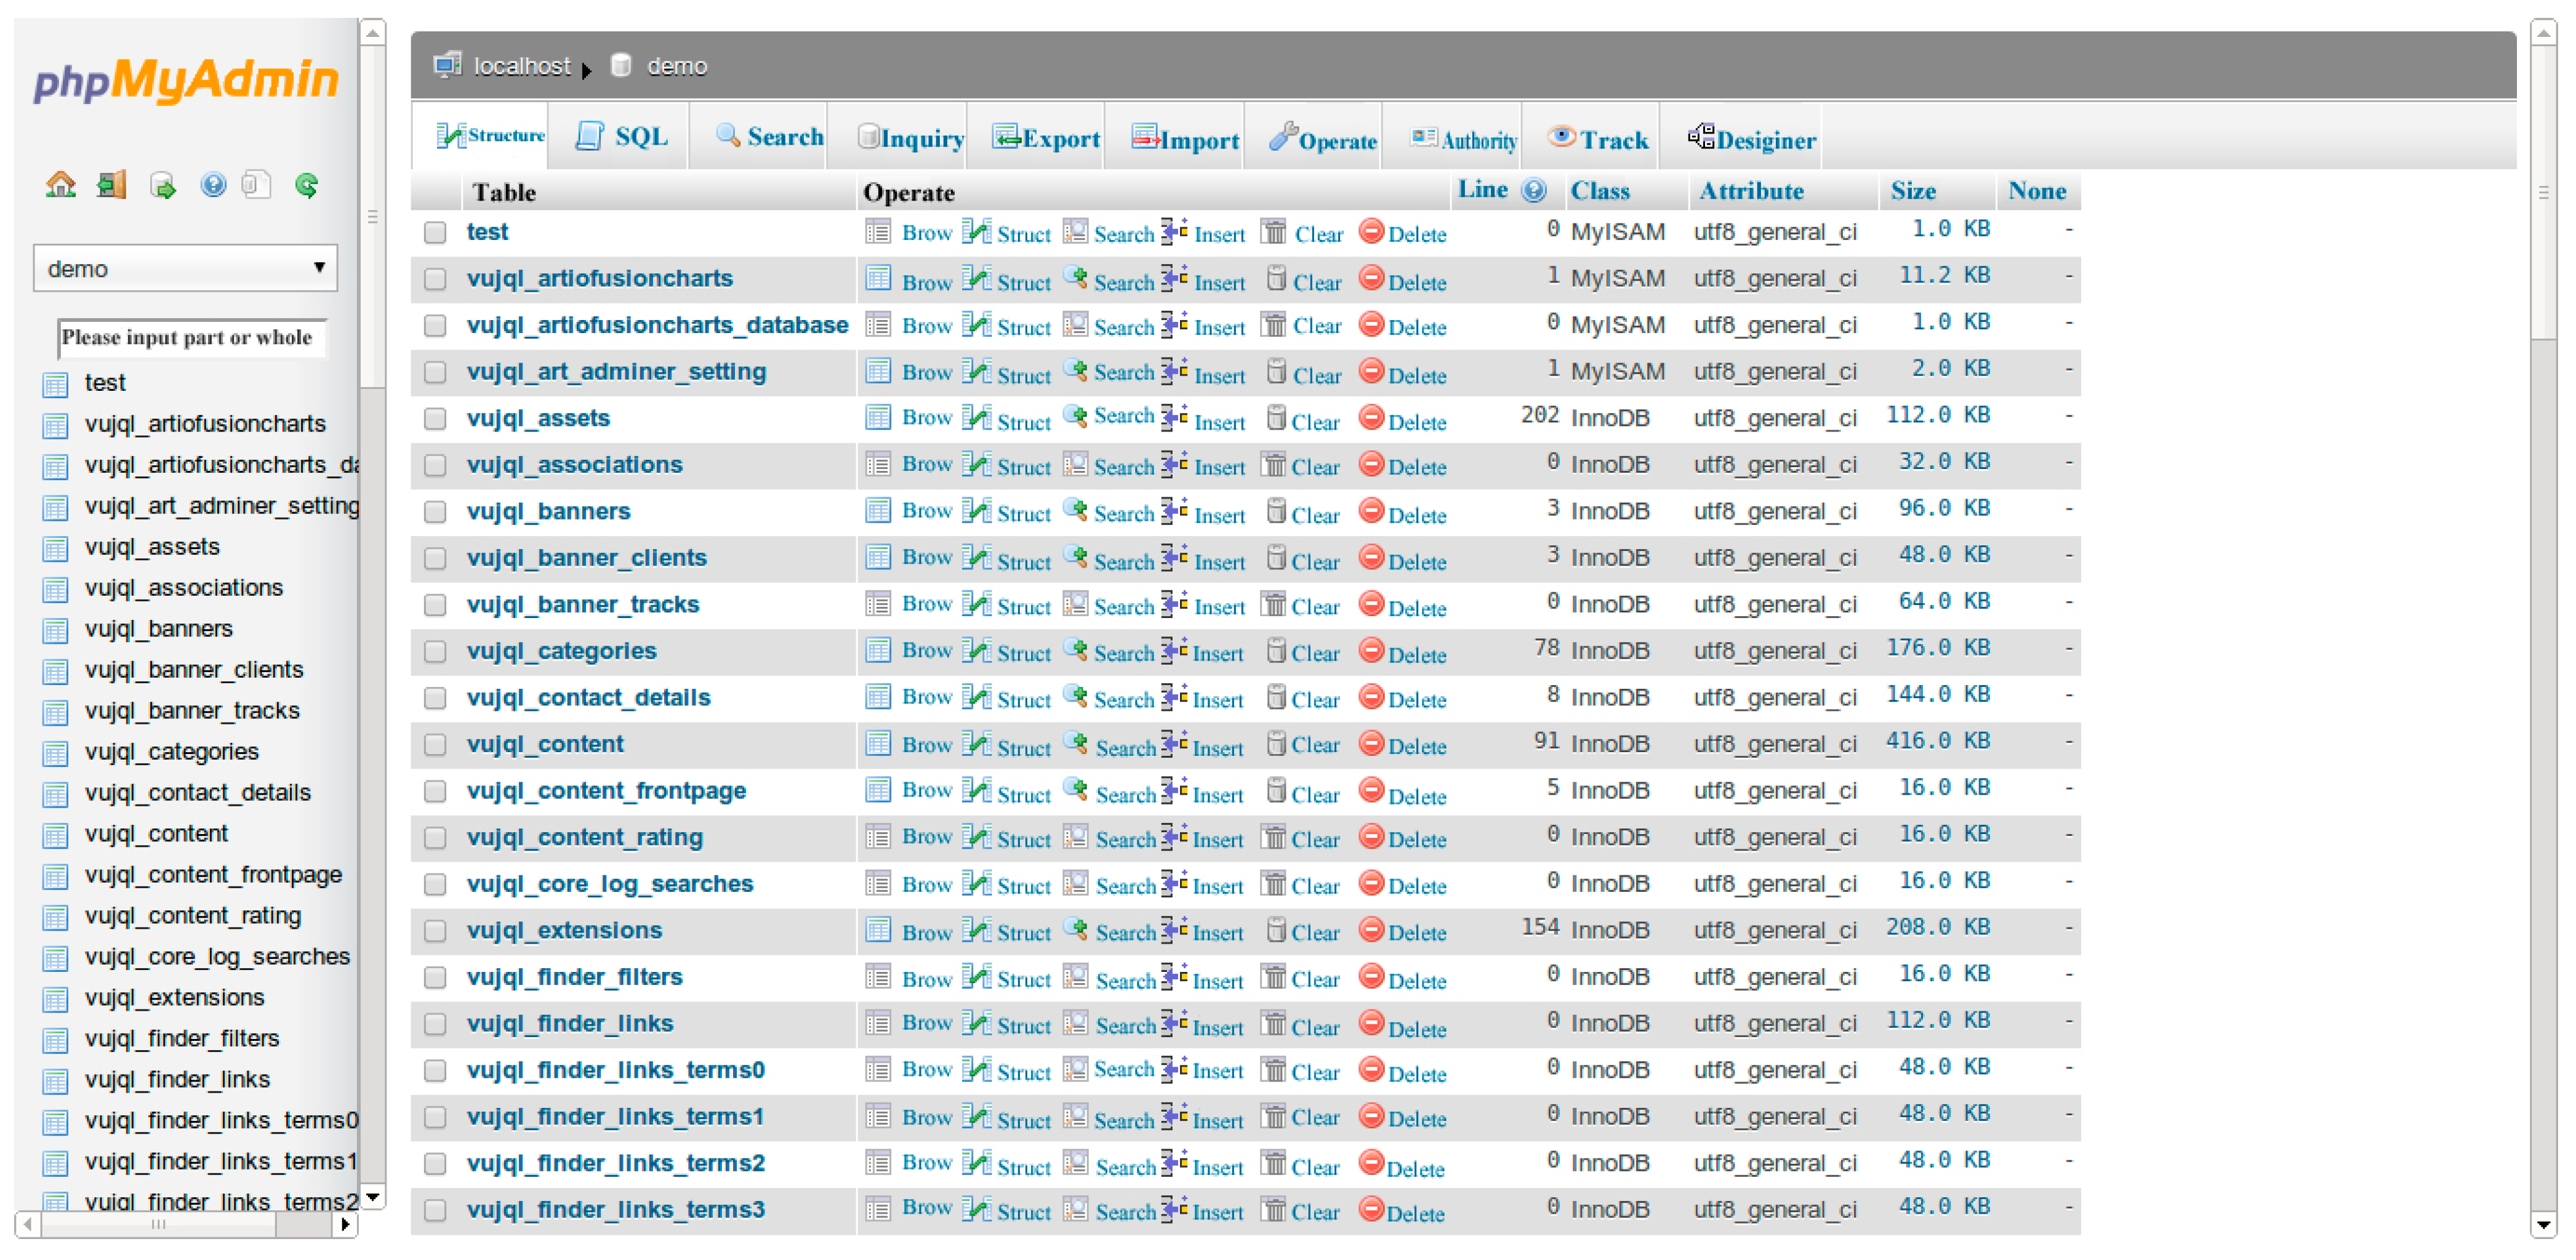
3.3. Database Design
Database design involves system and business database designs. The system database stores the data and information necessary for system operation. By contrast, the business database is used to store knowledge and assessment results by which the emergy information system operates.
Figure 6 illustrates the business database model.
Figure 6.
Business database model.
Figure 6.
Business database model.
To improve the efficiency of the database and reliability of the data and maximally reduce data redundancy, the architecture of the database system was designed to consist of four layers, from the bottom to the top, respectively, as follows: basic data layer, production data layer, evaluation layer, and decision support layer. The transfer of data from the first layer to the top layer is called data abstraction.
3.4. Model Base Design
The model base design is the simulation of emergy analysis and the sustainability assessment process.
3.4.1. Model Basic Data Processing
The raw emergy-related data comprise natural and purchased resources. The emergy calculation involved in purchased resources is relatively straightforward, which corresponds to the purchased material data multiplied by the corresponding transformities. However, the emergy of natural resources is more complicated and must undergo many conversions and treatments to the data directly uploaded by the grape growers.
The main renewable natural resources include sunlight, rain (chemical and geopotential), and wind (kinetic). The non-renewable natural resources mainly refer to the soil with its chemical energy is provided in the form of nutrients to plants. The models used to calculate the natural resource emergy are as follows [
4,
18]:
Sunlight = Grape cultivation area (m
2) × Average solar radiation per unit area (in crop growth period; Mj/m
2/a) × Solar absorption coefficient (0.6 for protected cultivation and 1 for open-field cultivation according to a previous study [
18]);
Rain (chemical) = Grape cultivation area (m2) × Average rainfall (in crop growth period; m/a) × Water density (103 kg/m3) × Gibbs free energy of rain (4.94 J/g);
Rain (geopotential) = Grape cultivation area (m2) × Average elevation (m) × Average rainfall (m/a) × Water density (103 kg/m3) × gravitational acceleration (9.8 m/s2);
Wind = Grape area (m2) × Thickness of the atmosphere (m) × Air density (103 kg/m3) × Wind speed2 (m/s)/2.
For the other emergy items, the calculation model is as follows:
Solar emergy = Raw data × Transformity.
3.4.2. Transformity
Transformity is an extremely important and basic concept in emergy theory. It is the amount of emergy per unit of a type of energy or material. By analogy, solar transformity refers to the amount of solar emergy needed to produce one unit of a product or service, directly or indirectly. The unit for solar transformity is sej/J or sej/g. The transformity values are mostly obtained from literature and are relative to the 15.83 × 10
24 sei/year baseline [
26,
36]. Brief descriptions of the transformities related to this study and the sources are listed in
Table 2.
Table 2.
Transformity list in the model base of ESDAS.
Table 2.
Transformity list in the model base of ESDAS.
| Item | Raw Unit | Transformity (sej/unit) | Source |
|---|
| Sunlight | J | 1.00 | [37] |
| Rain, geopotential | J | 8888 | [38] |
| Rain, chemical | J | 15423 | [38] |
| Wind, kinetic | J | 623 | [38] |
| Topsoil loss | kg | 62,500 | [37] |
| N fertilizer | kg | 4.62 × 10¹² | [37] |
| P fertilizer | kg | 1.78 × 10¹³ | [37] |
| K fertilizer | kg | 2.96 × 10¹² | [37] |
| Pesticide | kg | 1.62 × 10¹² | [37] |
| Steel | kg | 4.13 × 10¹² | [18] |
| Cement | kg | 1.97 × 10¹² | [18] |
| Plastic film | kg | 6.60 × 10⁴ | [39] |
| Electricity | J | 1.59 × 10⁵ | [37] |
| Organic fertilizer | kg | 2.70 × 10⁹ | [37] |
| Human labor | $ | 1.98 × 10¹¹ | [37] |
| Seedings | $ | 1.98 × 10¹¹ | [40] |
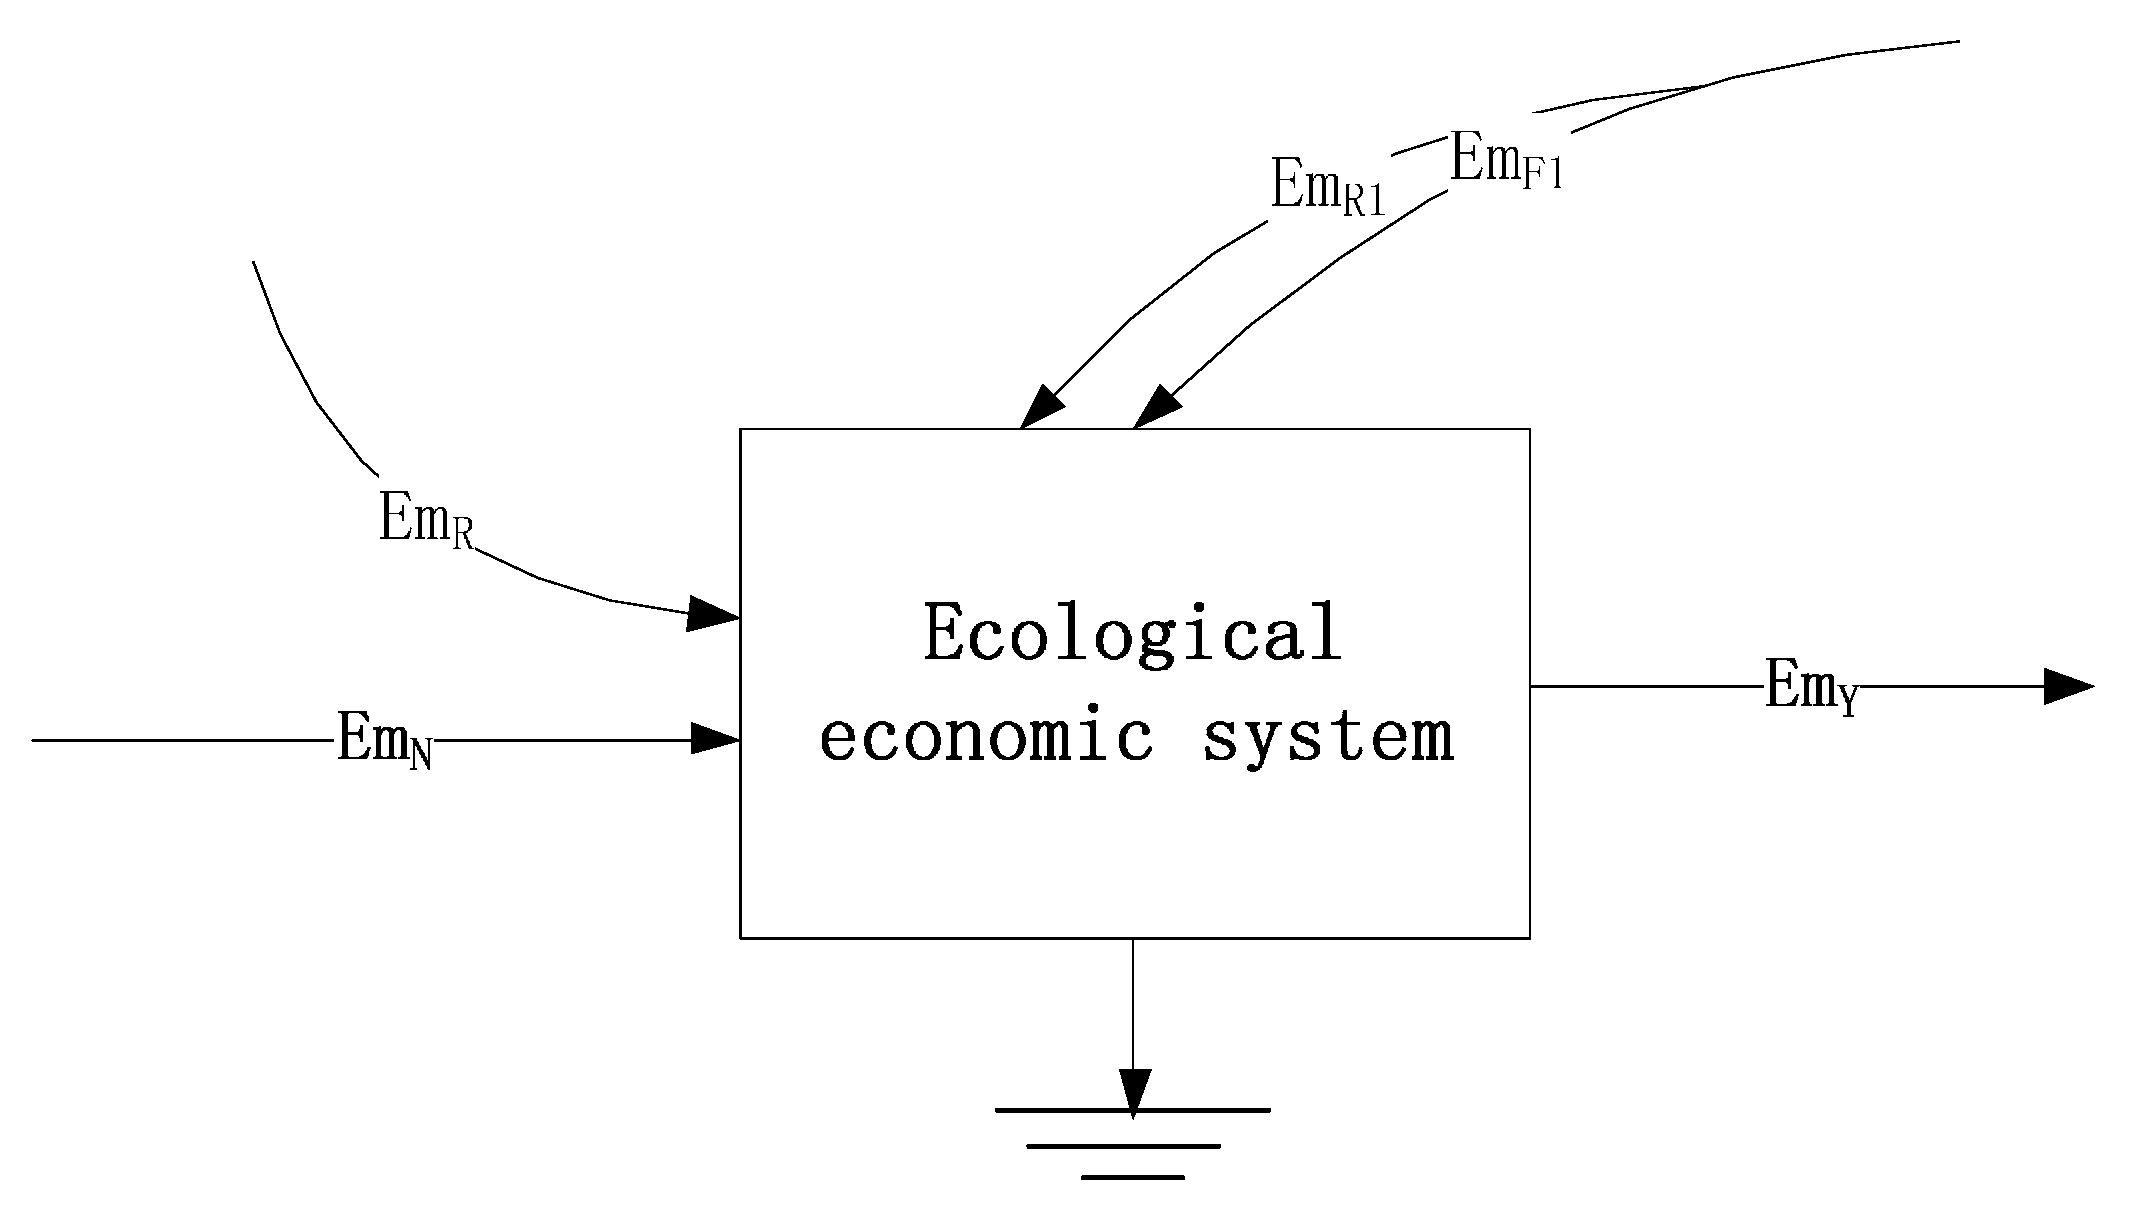
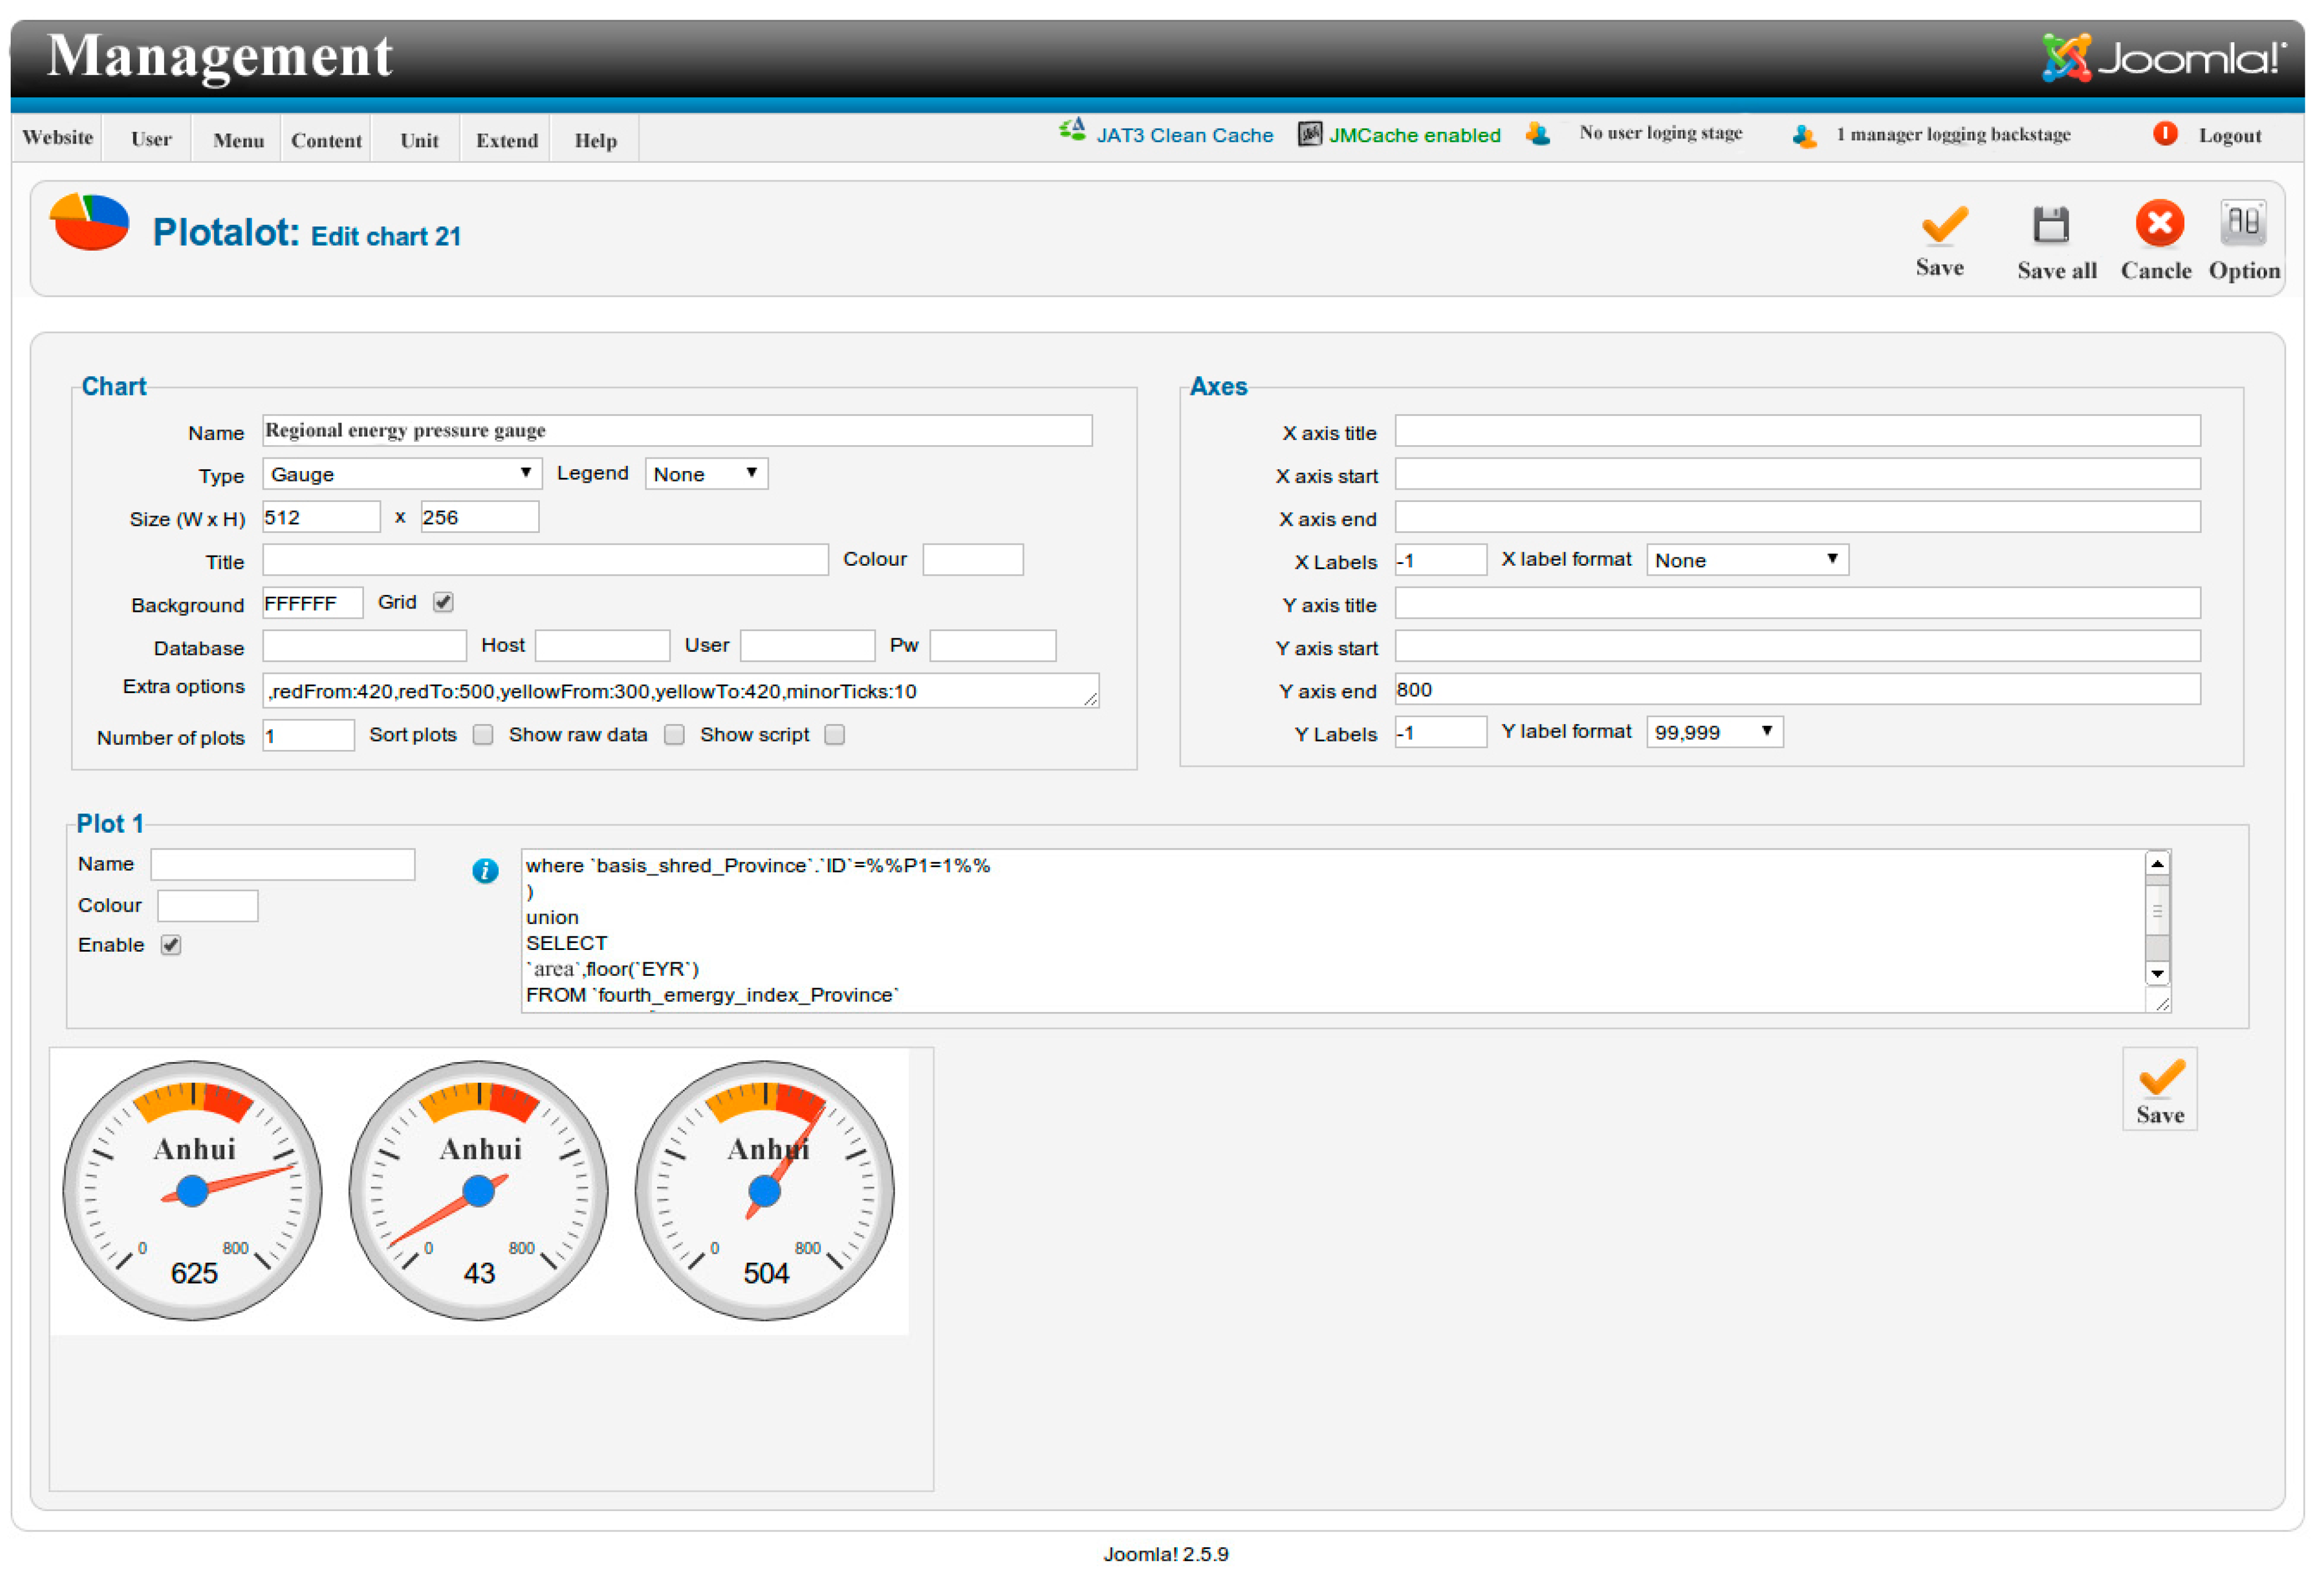
3.4.3. Emergy Indicators of Sustainability Assessment
Emergy indicators can apparently reflect the structure, function, and efficiency of the economic ecosystem of protected grape production. They are the essential foundations for system sustainability assessment and decision-making for development.
Figure 7 describes the emergy input and output for an economic ecosystem system. It can be found that the system consumes natural and purchased resource emergy and produces the output emergy.
Figure 7.
Emergy input and output of ecological–economic system [
37]. Note: Em
R: natural renewable resources input, Em
N: natural non-renewable resources input; Em
F1: purchased non-renewable input; Em
R1: purchased renewable input; and Em
Y: emergy output.
Figure 7.
Emergy input and output of ecological–economic system [
37]. Note: Em
R: natural renewable resources input, Em
N: natural non-renewable resources input; Em
F1: purchased non-renewable input; Em
R1: purchased renewable input; and Em
Y: emergy output.
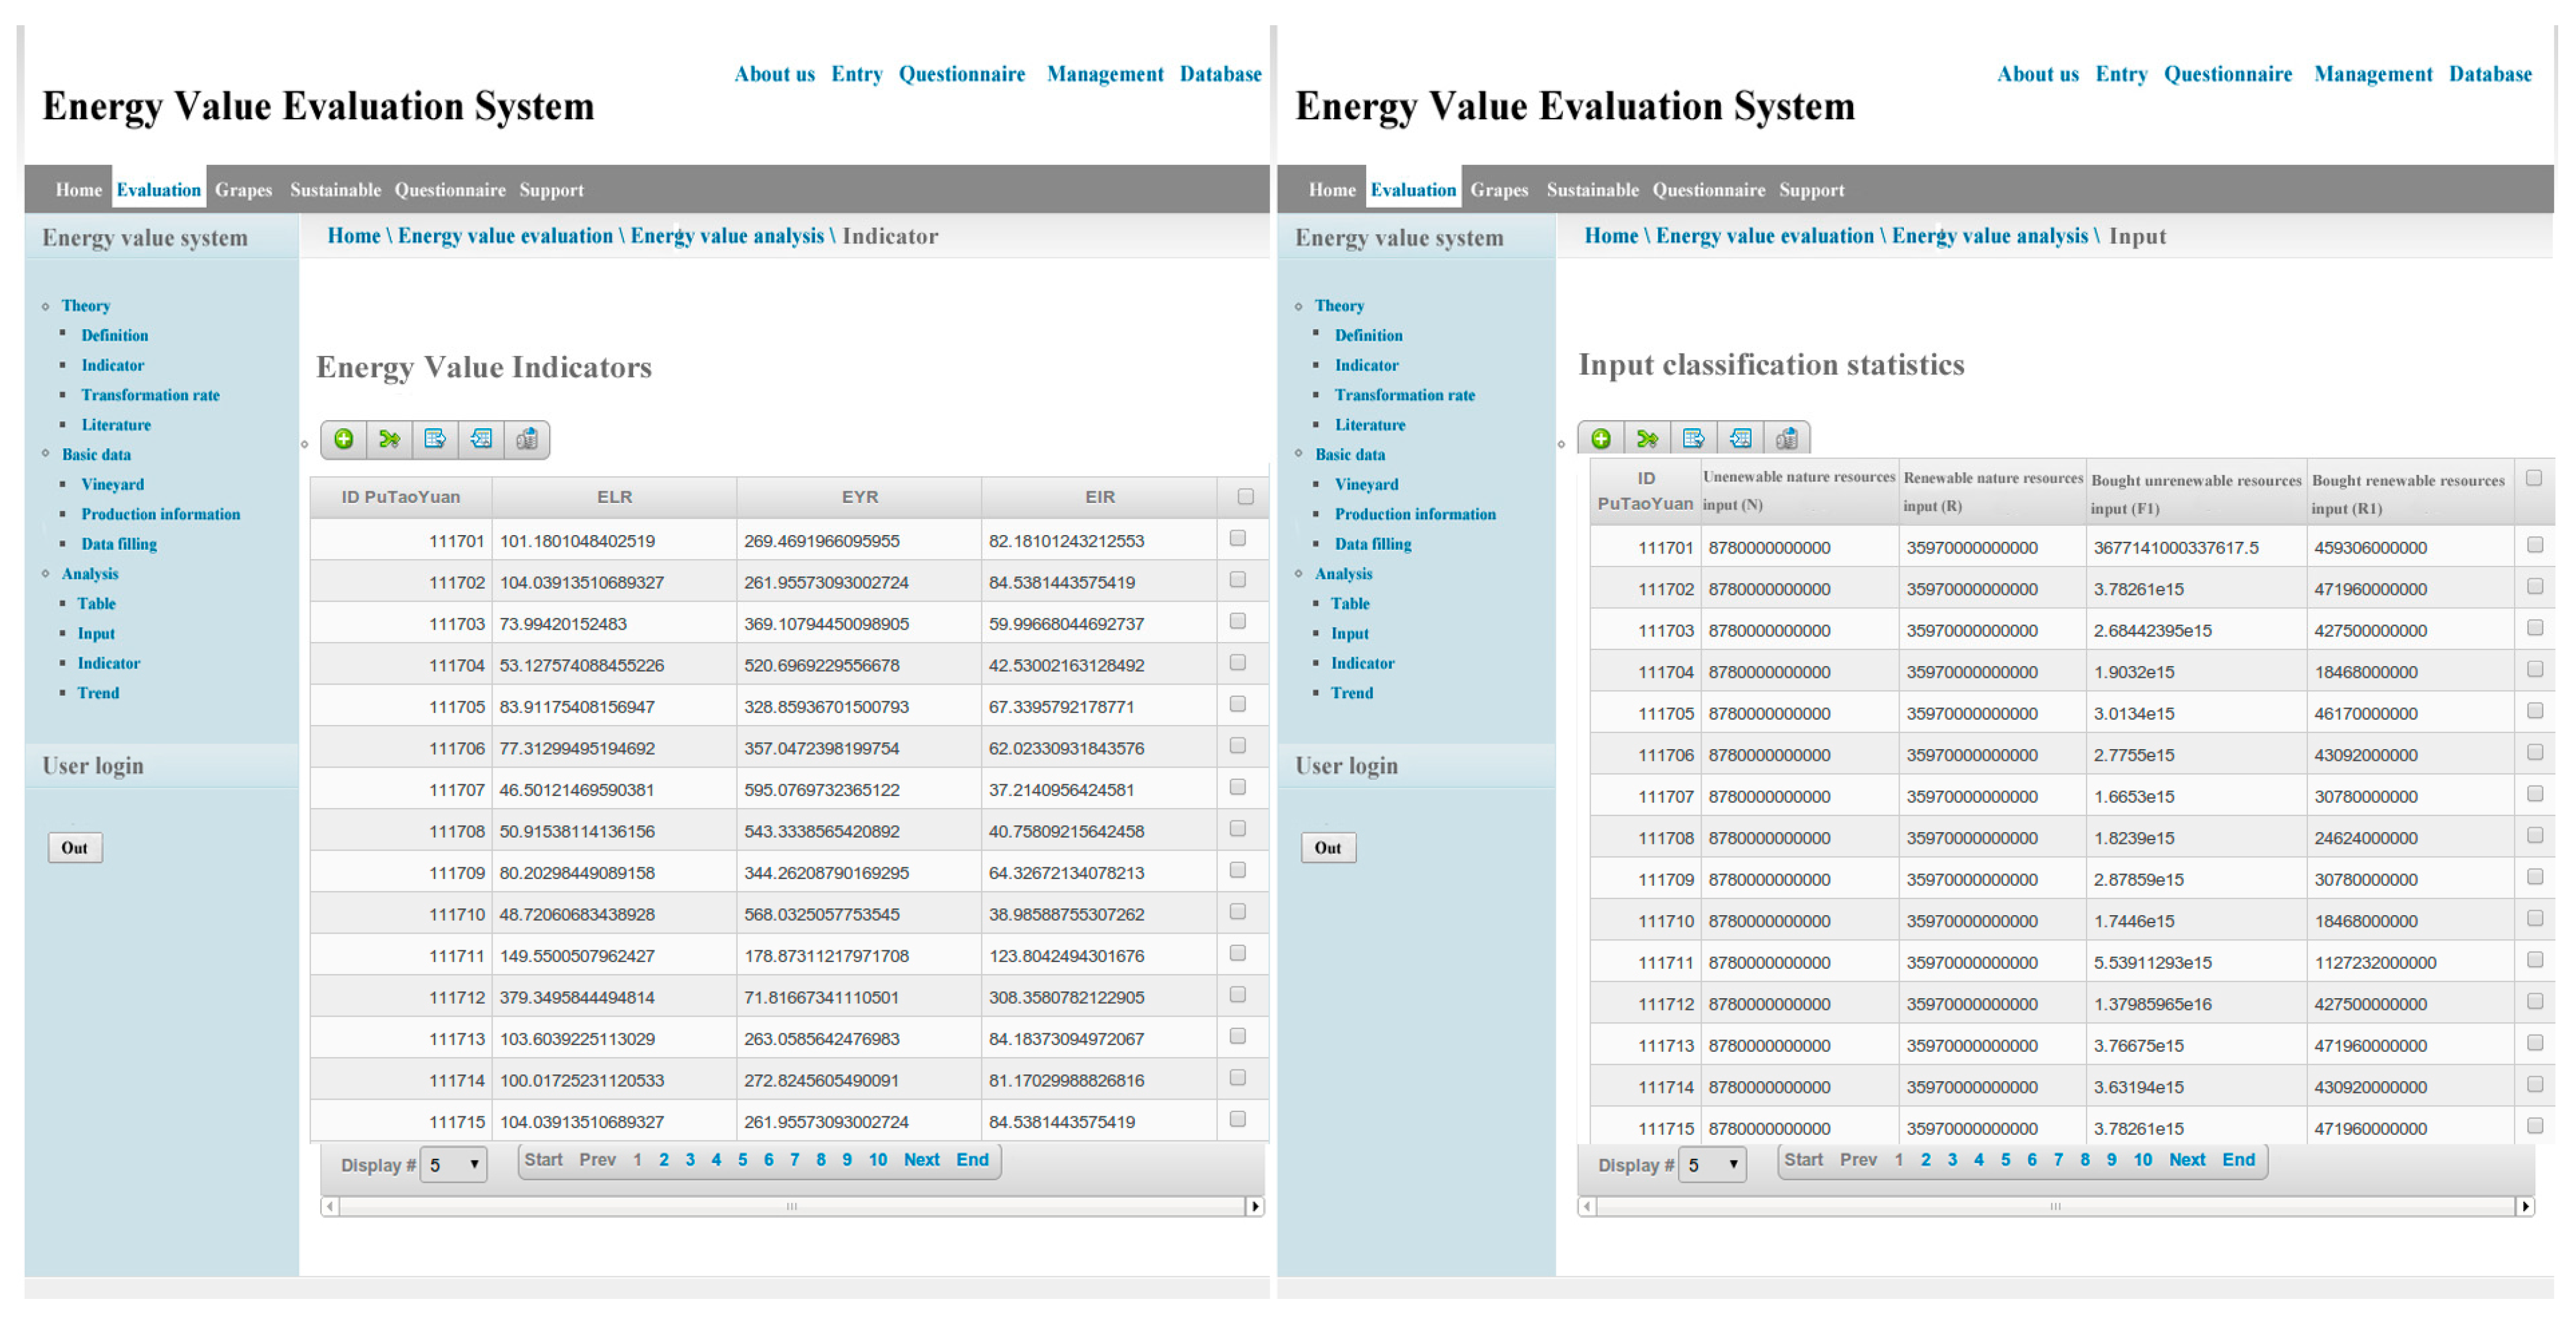
Emergy indicators differ according to the target system. Considering the chief characteristics of these input resources in protected grape cultivation, several emergy-based indices were chosen to evaluate the sustainability of the protected grape production system [
19,
20,
26,
27,
41,
42]. These indicators aim to evaluate two aspects of sustainability for an eco-economic system, particularly, the economic benefits and the environmental effects. These emergy indicators are as follows:
(1) Emergy yield ratio (EYR): EYR is the ratio of output emergy and purchased emergy; it shows the production efficiency of the system.
(2) Emergy investment rate (EIR): EIR is the ratio of the purchased emergy and natural emergy, which indicates the level of economic development and the environmental loads of the production system. Generally, a higher ratio results in a higher economic development level.
(3) Environmental loading ratio (ELR): ELR is the ratio of non-renewable emergy and renewable emergy, which indicates the relationship between the non-renewable and the natural resources. It assesses the environmental effects and the resource utilization efficiency of the production system.
(4) Emergy sustainability Index (ESI): EYR is the ratio of output emergy and environmental loading ratio. It is an indicator of system sustainability that aggregates the measure of yield and environmental loading. It is used to evaluate the possibility for sustainable development of the system. It indicates whether a process suitably contributes to the user with a low environmental pressure.
3.5. Knowledge Base Design
The knowledge base is responsible for storing the knowledge and standards acquired from the literature; it is also used to assess sustainability and provide decision support. Some knowledge bases are embedded into the ESDAS.
EYR: This indicator employs the concept of “ratio of output and input” particularly, a higher EYR represents higher production efficiency. It is a measure of the capability of a process to exploit and make available the local renewable and non-renewable resources by investing in purchased outside resources. A higher EYR denotes that the system can produce more output emergy when the same quantity of purchased emergy is consumed. By contrast, a lower EYR indicates that the system expends excessive emergy and does not have sufficient competitiveness.
EIR: A high EIR denotes a high economic development level, whereas a low EIR indicates a weak economic level and strong dependence on the environment such that the economic inputs outside of the system are insufficient to improve the output of the system.
ELR: This indicator represents the level of economic development and the environmental loads generated by human-dominated non-renewable flows. Thus, the ELR reflects the environmental pressure of the system; a high ELR indicates a strong environmental pressure in the system and a reduction of the potential for further exploitation and utilization of natural resources.
ESI: The system with a high ESI value usually has higher sustainability. ESI reveals two aspects of sustainability, particularly, economic development and ecological sustainability. A system is sustainable when its EYR is high and its ELR is low. It is generally considered that, at ESI < 1, the system is driven by high consumption; at 1 < ESI < 10, the system is vibrant and exhibits the potential for sustainable development; at ESI > 10, the system is economically underdeveloped [
37].
The knowledge base also includes some rules and regulations considered during the decision-making process for sustainability improvements.
5. Conclusions
In accordance with the investigation on the theory of emergy analysis and the protected grape production process, this study developed an emergy-based information system (ESDAS) for emergy analysis and sustainability assessment with open-source components. It pioneered emergy analysis by means of the integration with information technology and solved the shortcomings of the large number of calculations necessary for traditional emergy assessment. For professional users, ESDAS is helpful for the highly efficient assessment of the sustainability of the protected grape cultivation system. Grape growers can use ESDAS as a production management system and store records of interrelated information regarding the protected grape production process into the database. The system test results showed that ESDAS can effectively achieve data management, emergy analysis and sustainability assessment, and decision support for sustainability improvement, as shown in the technical and business tests.
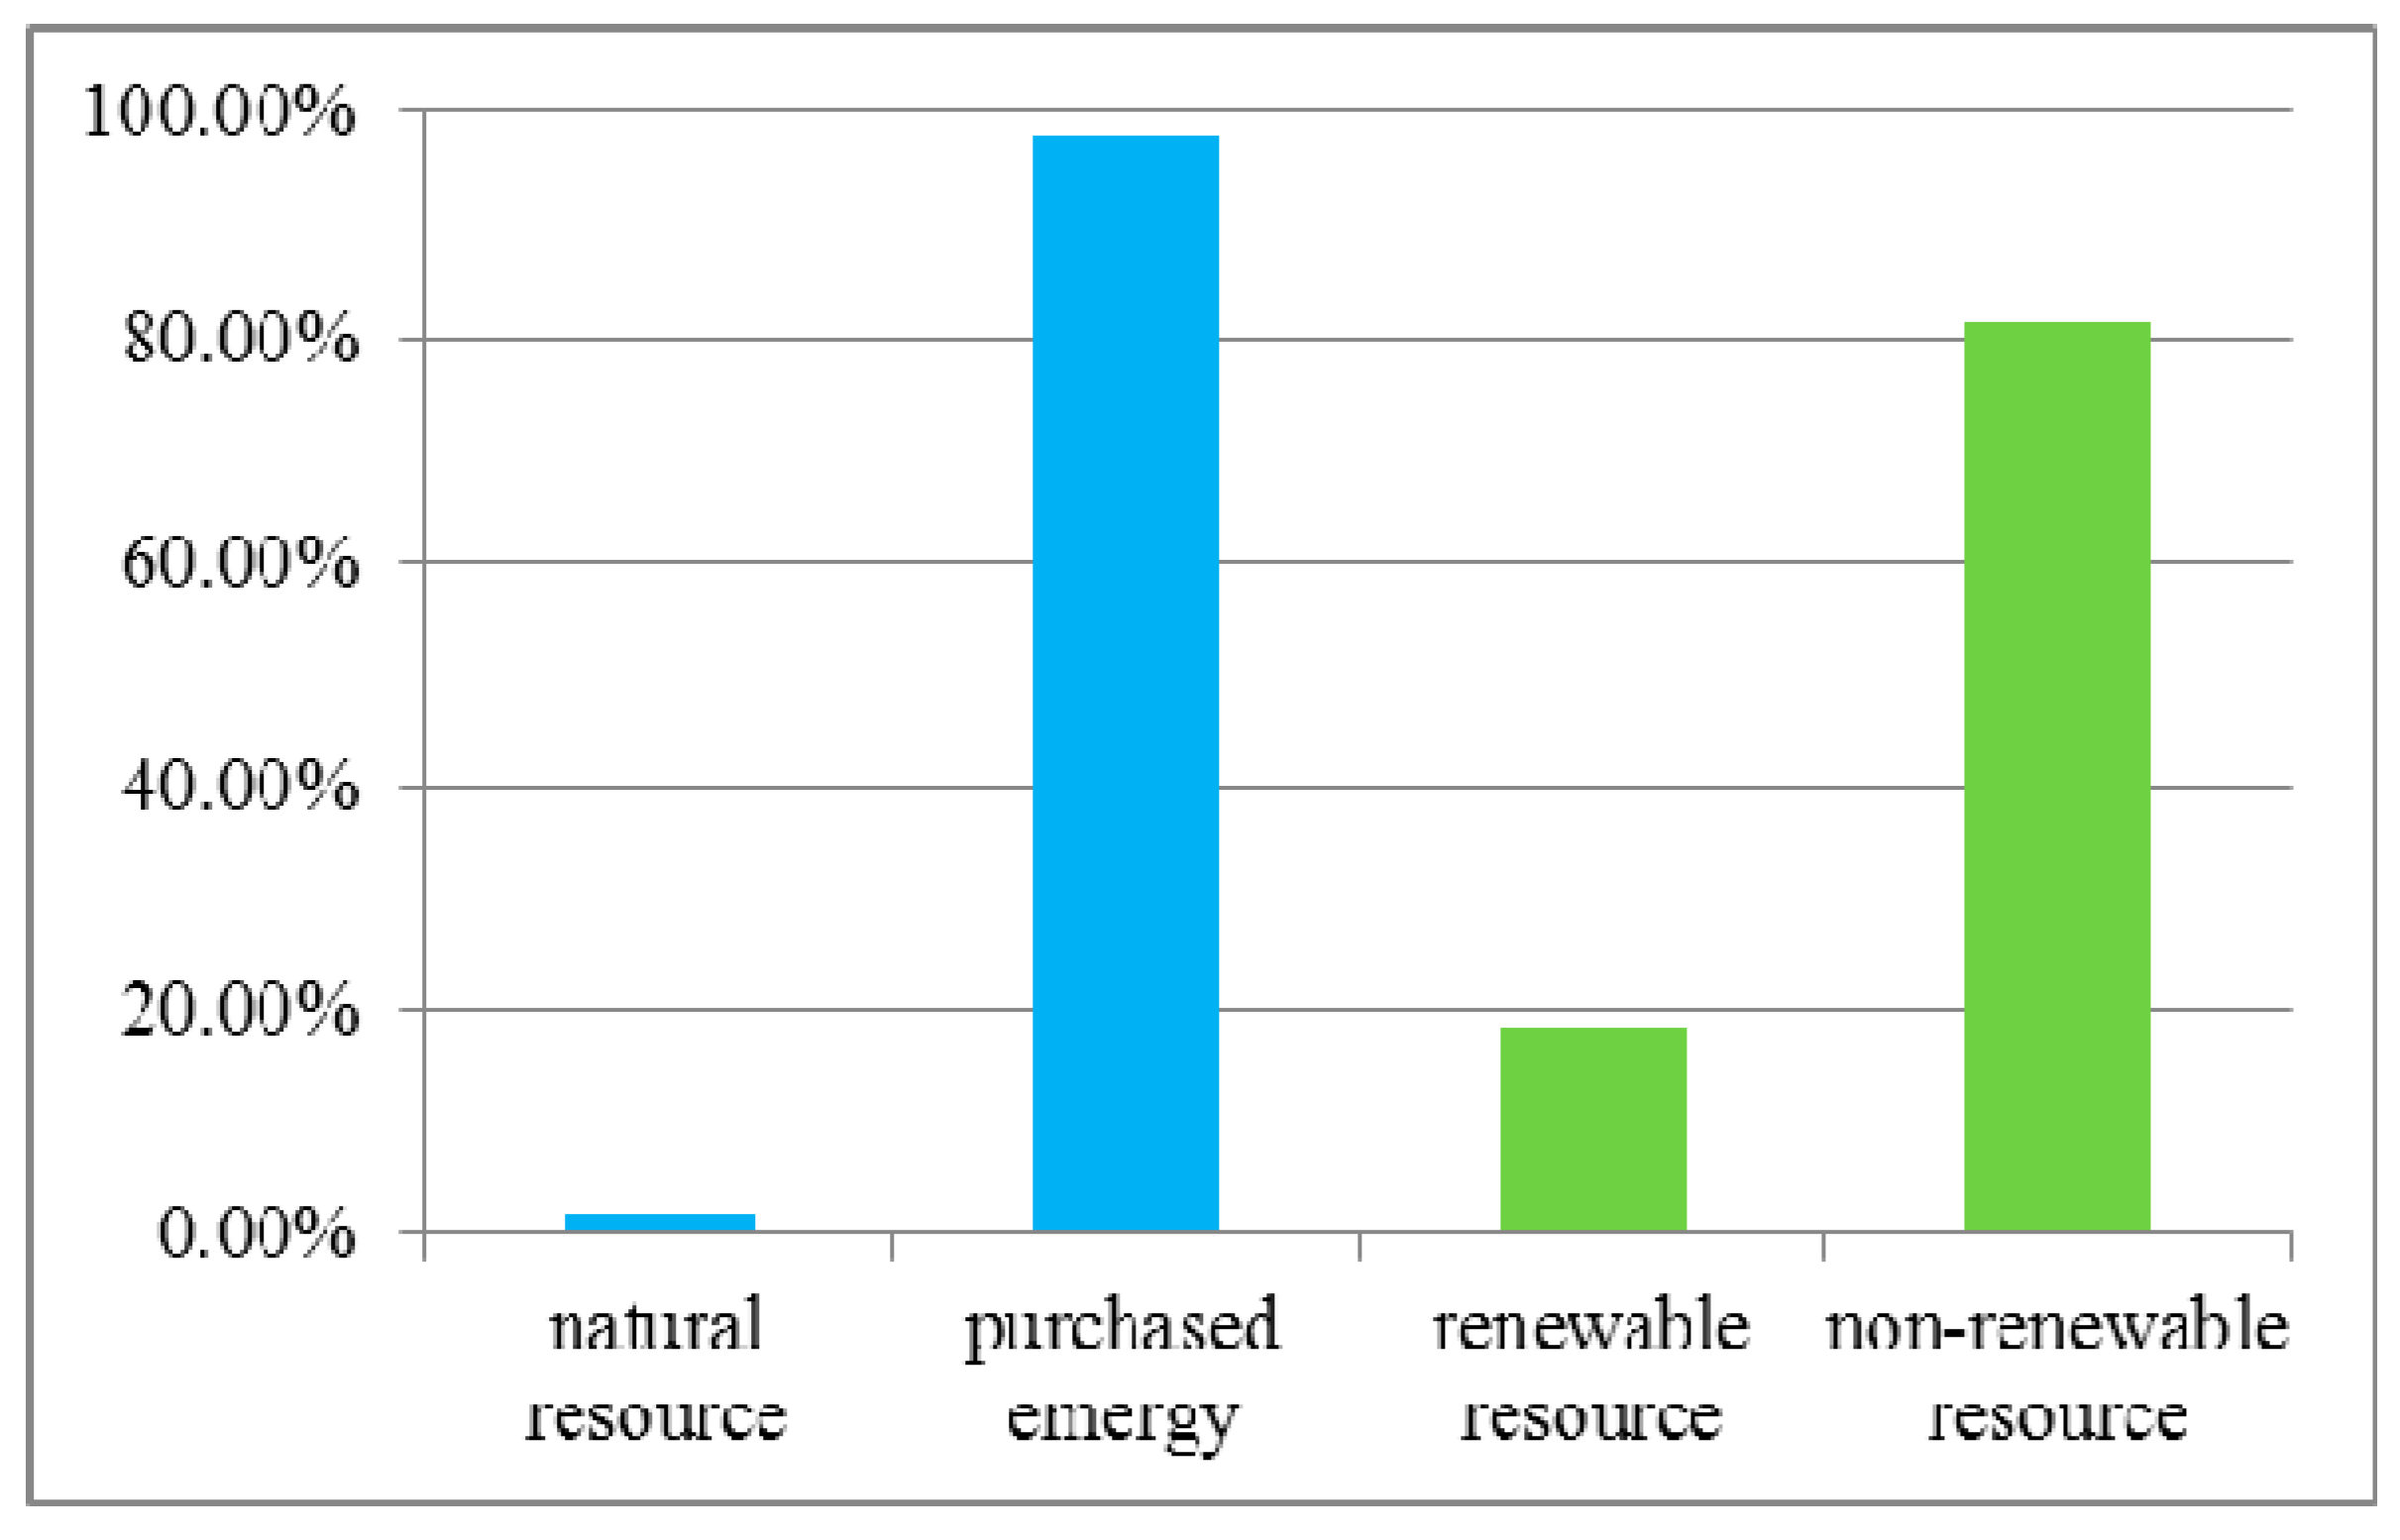
ESDAS was applied to assess the emergy-based sustainability of protected grape cultivation in China, which also served as the testing process of the system. The application results showed that the current grape protected production system consumes excessive non-renewable and purchased emergy resources and is heavily dependent on the outside inputs. Such a kind of emergy consumption structure results in lower EYR, higher EIR, higher ELR, and lower sustainability than many other fruit production systems, indicating that the protected cultivation system results in relatively lower productivity, a higher economic development level, serious pressure on the environment, and weak potential for sustainable development compared with open-field production. Therefore, grape growers must apply some measures to plantations, including the full use of internal resources, mitigation of the environmental load, and promotion of the sustainable development of the protected grape cultivation system. The integrated production pattern is a potential development trend in the future.


