1. Introduction
The study focuses on the analysis of lighting performance in elementary school classrooms given the impact daylight has on the educational experience of the students. Different researchers have shown that the latter increases productivity [
1], positively affects human performance [
2] and has biological effects on the production of the hormone, cortisol, regulating the day-night cycles and the student’s concentration capacity [
3]. Ultimately, this is a relevant environmental aspect to be studied to thus know the daylighting results of different classroom typologies. The research was carried out in Chile, an extensive territory of 4270 km in length, with a wide variety of climates, where there are no dynamic daylight studies that consider these variations.
The objective of the research is developing a methodology to carry out daylight studies in Chile, integrating dynamic light factors, like the different skies, including the time variable, to know the annual performance starting from metrics that allow evaluating daylight based on illuminance ranges, thus absorbing the daylight variations.
Regarding the regulations of lighting standards for visual comfort and energy efficiency criteria in classrooms, it was confirmed that these have a long history in Europe and the United States; however, in Chile, the documents that currently are in charge of the regulation of elementary school classroom design are limited, since they do not consider the dynamics of daylight and the possible savings of using daylight as the main source of lighting. Currently, the main Chilean regulation, the General Ordinance of Urbanism and Construction in Chile, requires, to guarantee daylight, a window to floor-ratio (WFR) for three zones of Chile: the north zone (latitude 18°28′S to 29°54′S) considers 14% WFR; the central zone (latitude 29°54′S to 35°25′S) considers 17% WFR and the south zone (latitude 35°25′S to 53°9′S) considers 20% WFR [
4]. As a complement, Decree DS 548 (“
Decreto Supremo”) of the Ministry of Education of the Government of Chile establishes that these must have a general minimum lighting of 180 lux [
5]. The lack of regulations, in 2012, moved the Public Works Ministry to formalize the Terms of Reference (TDRe) for the construction of public buildings [
6], incorporating, for the first time in Chile, performance criteria, energy efficiency standards and environmental comfort for educational buildings. Referring to daylight in classrooms, minimum illuminance values are established and the daylighting autonomy (DA) metric is incorporated, defining minimum DA percentages for the integration of daylight as a design variable. Alongside this, the Chilean Energy Efficiency Agency publishes the Energy Efficiency Guidelines for Educational Establishments, the purpose of which is to guide the design of classrooms in matters of environmental comfort and energy efficiency. In this document, architectonic design patterns are defined, performing a more comprehensive light analysis; however, the analysis applied was limited to considering some moments of the year based on two sky types: in the case of the classrooms studied for the north and central areas of Chile, these were done under clear and intermediate skies, and for the classrooms studied in the south, intermediate skies and overcast skies were considered [
7]. Despite that this has been an advance, the need arises to carry out a dynamic daylight study to integrate the architectonic design through simple design typologies, at the beginning with climate variables, the different types of skies, in order to report the lighting performance inside the classrooms for the entire year.
The investigation focuses on three areas of Chile, the north, center and south, in one representative city of each zone: Iquique (20°13′00″S 70°10′00″W), Santiago (33°26′16″S 70°39′01″W) and Coyhaique (45°34′00″S 72°04′00″W), respectively. It is expected that the dynamic daylighting studies will be enhanced, developing a methodology that can be replicated in other cities in Chile and/or for other architectonic typologies.
It has been suggested, as a principle for this investigation, that the old daylight analysis methods provide very limited information compared to the dynamic methods that integrate factors like the types of skies and the local light conditions. These methods strengthen the evaluation of the daylight strategies applied and favor an integrated design. This is shown in the design of classrooms when suggesting a dynamic simulation method, which provides quantitative information of the strategies proposed, considering the illuminance levels for the visual tasks of the students.
The methods and metrics that incorporate the climatic variables are studied in order to refine the climate data needed to apply dynamic methodologies. Climate-based daylight modelling (CBDM) allows integrating the different light variations in the lighting simulations in relation to the local climate, generating, for a specific moment, a series of predictions, which, in general, are for each hour of a whole year; this is why this is the starting point for the analysis.
At the same time, passive design as an architectural principle seeks to provide conditions of comfort inside the buildings through the optimization of the design, by integrating environmental factors of the place, thus minimizing the use of active means for that purpose. Complementarily, the design for energy efficiency seeks a determined purpose for this, providing the best environmental conditions to attain visual comfort and a good lighting quality, using the least amount of energy possible. From the architectural design perspective, a poor conception of lighting strategies can have negative implications, such as a greater use of alternative energies, or directly affect the users, creating situations of visual discomfort.
The architectural designs of the classrooms considered relate to the conception of elementary schools in Chile, having as a starting point that developed in the educational space design guidelines [
7]. A revision of the design patterns proposed therein has been made to generate a design alternative for each city, considering the application of passive strategies, like unilateral and bilateral lighting, light shelves and fixed sunlight protections; it was not possible to integrate lighting systems and mobile sunlight protections.
Given the complexity of carrying out an accurate daylight study, base typologies are proposed and their evaluations done to finally express the results simply and clearly, comprehensible for non-specialist architects, building a baseline that allows for guiding the architectural design, understanding the limitations when considering only one orientation and not including the buildings surrounding the classroom.
2. Dynamic Metrics to Evaluate Daylight
The dynamic metrics based on climate data (CBDM) have opened a new perspective for daylight studies, since they respond to the local climate, which account for the amount of daily and seasonal variations of daylight, combined with weather data. These have displaced old daylight metrics, like the daylight factor (DF), whose limitation is that it does not consider the dynamic aspects of light: the latitude, the different seasons, the different times of the day, the variations of the skies and the orientation of the building [
8].
The metrics developed and used in daylight dynamic performance measurements are based on the time interval in which the baseline levels of illuminance and luminance within a building are reached. These time intervals extend typically over the full year, based on external data, such as the annual solar radiation, according to the location of the building [
8]. Among the metrics whose analyses are based on the time variable, we have daylighting autonomy (DA), useful daylight illuminance (UDI) and continuous daylight autonomy (DAcon), which have given a more comprehensive evaluation, based on climate files, of the building’s orientation and the time that this is occupied.
Daylight autonomy (DA) sets an illuminance value to guarantee autonomy to work only with daylight; however, we can have an outstanding autonomy without guaranteeing visual comfort, as by not establishing the upper illuminance limit, we can have too much daylight in certain times of the year. Useful daylighting autonomy defines a range of illuminances that can be said to constitute useful levels of illumination [
9]. What was new about this metric is that the upper and lower limit illuminance values are incorporated, while also fixing compliance intervals integrating the concept of target ranges. The new series defined in 2012 was UDI “fell-short” (UDI-f), when the illuminance is less than 100 lux, UDI supplementary (UDI-s), when illuminance is greater than 100 lux and less than 300 lux, UDI autonomous (UDI-a), when illuminance is greater than 300 lux and less than 3000 lux, UDI combined (UDI-c), when illuminance is greater than 100 lux and less than 3000 lux, and, finally, UDI exceeded (or UDI-e), when the illuminance is greater than 3000 lux [
10].
Starting from the DA, continuous daylight autonomy (DA
con) is developed, which allows providing percentage credits when the illuminance is below the minimum illuminance value, thus generating a transition between compliance and non-compliance, recognizing a partial contribution of daylight to the space [
8]. As a complement, the maximum daylight autonomy (DA
max) is defined to indicate the time percentage in which daylight is excessive, so that it is possible to know the moments when there is a risk of glare. In turn, spatial daylight autonomy (sDA) incorporates the architectonic space, informing the percentage of floor area where daylighting illuminance exceeds a specified illuminance level [
11].
As has been stated, all of these metrics allow for preparing an annual evaluation starting from the climate files, setting illuminance values, whether minimum or maximum, as the design target; however, for the objective of the investigation, for integrating the climatic variations of different geographical zones, considering the variations and frequencies of the different skies, the interest was focused on the methodology proposed for Lightsolve, this being the starting point for the methodology proposed. This uses the weather diversity data through a combination of the sky distribution, using a combination of Perez’s model with CIE skies (Commission Internationale de l’Eclairage), the ASRC-CIE model of four sky types obtained from a file, the typical meteorological year weather climate data (TMY2). In this, the three elements relevant for this research are combined: the four standard sky types (clear, clear-turbid, overcast and intermediate), the time variable reported through the year and the spatial variable reporting the percentage of the area that complies with the target values. This metric shows that the percentages in the areas of interest are within the targeted range of illuminance and their variations over time, along temporal maps. Apart from this, it is structured by establishing the targeted illuminance range, defined by an upper limit and a lower limit of target illuminance, giving 100% of the credit to values that are within the proposed range. An adjacent buffer zone was established to have an upper and lower buffer zone limit, which could be of any size. For the illuminance values in this area, partial credits are given that decrease linearly from 100% until the limit value of 0% at the buffer zone limit [
12].
In short, the integrated concepts used here are, making modifications at the moment of analysis, the segmentation of the year, the illuminance intervals considered, as well as the type of temporal map.
3. Methodology for Assessing Daylighting
The methodology developed was used to evaluate the horizontal illuminance on the student’s workplane. Likewise, this could be applied to estimate the vertical illuminance on the board; however, due to the scope of this study, this was not considered.
The main components to apply the method were the following: First, the definition of the climate files, which describe the types of skies for the cities in the study, is made, to know their frequencies in a standard year. Then, the segmentation of the year is defined, defining the dates for the illuminance calculation. After this, the climate files are integrated with the calculated illuminance values to obtain the weighted final illuminance. The last component specifies the illuminance intervals, defining the target ranges, which allow evaluating the daylighting performance resulting from the different typologies.
3.1. Definition of Frequency of CIE-Skies
The first part consisted of describing the climate data collection methods and how these are organized to determine the predominant skies in each city of the study. Just like in the methodology applied for Lightsolve [
12], the types of skies are key to the application of the method, for which the ASRC-CIE model developed by Pérez was used.
The ASRC-CIE model is considered as the most appropriate model for sky temporal data reduction thanks to its accuracy and the average of different types of sky [
13]. It integrates the four standard models of a CIE sky into one angular distribution of the sky luminance: the clear sky (c) [
14], clear turbid sky (ct), intermediate sky (i) [
15] and overcast sky (o) [
16]. These four skies allow characterizing and absorbing the climate variations, it being relevant to know what frequency these have throughout the year.
The four types of skies included are defined starting from two parameters, the clarity and the brightness of the sky, which are derived from the direct or global diffuse irradiance; the interpolation of these parameters through the luminance distribution of the skies allows determining the type of sky [
17].
Table 1.
Monthly and annual frequency of the four CIE skies: It can be noticed that in Iquique, clear skies (clear sky (c) and clear turbid sky (ct)) are predominant, with a 39% overall presence; for Santiago, these skies have a frequency of 41%; finally, in Coyhaique, overcast (o) is the most frequent sky, with 36%, followed closely by intermediate sky (i) with 31% presence throughout the year (source: our own elaboration, 2014).
| Frequency of occurrence of standard sky for calendar month (%) |
|---|
| | Sky Type | January | February | March | April | May | June | July | August | September | October | November | December | Overall |
|---|
| IQIUIQUE | c | 14% | 8% | 21% | 12% | 5% | 9% | 11% | 7% | 12% | 11% | 18% | 17% | 12% |
| ct | 30% | 52% | 44% | 28% | 23% | 17% | 12% | 12% | 14% | 20% | 27% | 44% | 27% |
| i | 42% | 35% | 25% | 40% | 37% | 32% | 31% | 32% | 34% | 36% | 33% | 30% | 34% |
| o | 14% | 6% | 10% | 20% | 36% | 43% | 45% | 49% | 41% | 33% | 22% | 9% | 27% |
| SANTIAGO | c | 40% | 36% | 26% | 14% | 7% | 5% | 4% | 5% | 11% | 18% | 34% | 30% | 19% |
| ct | 24% | 26% | 27% | 25% | 21% | 19% | 16% | 24% | 17% | 19% | 25% | 23% | 22% |
| i | 22% | 25% | 27% | 27% | 26% | 27% | 32% | 31% | 40% | 26% | 27% | 33% | 29% |
| o | 15% | 13% | 20% | 33% | 46% | 49% | 48% | 40% | 31% | 37% | 14% | 13% | 30% |
| COYAHIQUE | c | 20% | 18% | 21% | 14% | 7% | 9% | 9% | 9% | 18% | 11% | 21% | 21% | 15% |
| ct | 19% | 19% | 13% | 15% | 13% | 15% | 17% | 22% | 22% | 25% | 17% | 20% | 18% |
| i | 32% | 34% | 33% | 32% | 26% | 32% | 34% | 32% | 29% | 36% | 27% | 28% | 31% |
| o | 30% | 28% | 33% | 40% | 54% | 43% | 40% | 38% | 31% | 28% | 35% | 31% | 36% |
Climate data were collected for the studied cities, and a climate database “Typical Meteorological Year” (TMY2) was used, taken from the database of EnergyPlus for the case of Santiago and from the software METEONORM v.7 for the case of Iquique and Coyhaique. These files concentrated the values of global horizontal illuminance and diffuse horizontal illuminance hour-on-hour, which were read later through a script of the MATLAB software to determine the epsilon coefficient (ε), which defines the sky clearness and the delta coefficient (δ), which defines the sky brightness. Various sets of factors were considered: the latitude and longitude of each city, the moment of the year, hour-on-hour, altitude and azimuth. A calculation was made for direct illuminance, zenith luminance and calculation of ASRC model coefficients, coefficients that determine the clear “
bc”, clear-turbid “
bct”, intermediate “
bi” and overcast “
bo” skies, which depend on sky clearness and brightness data for the entire year. These coefficients gave the frequency of each sky in each date and hour, which are averaged to establish the weighted frequency of each sky month-on-month in a standard year. In
Table 1, the results obtained of the weighted values of the four CIE skies, month-on-month, for the cities of Iquique, Santiago and Coyhaique are shown.
3.2. Segmentation of the Year
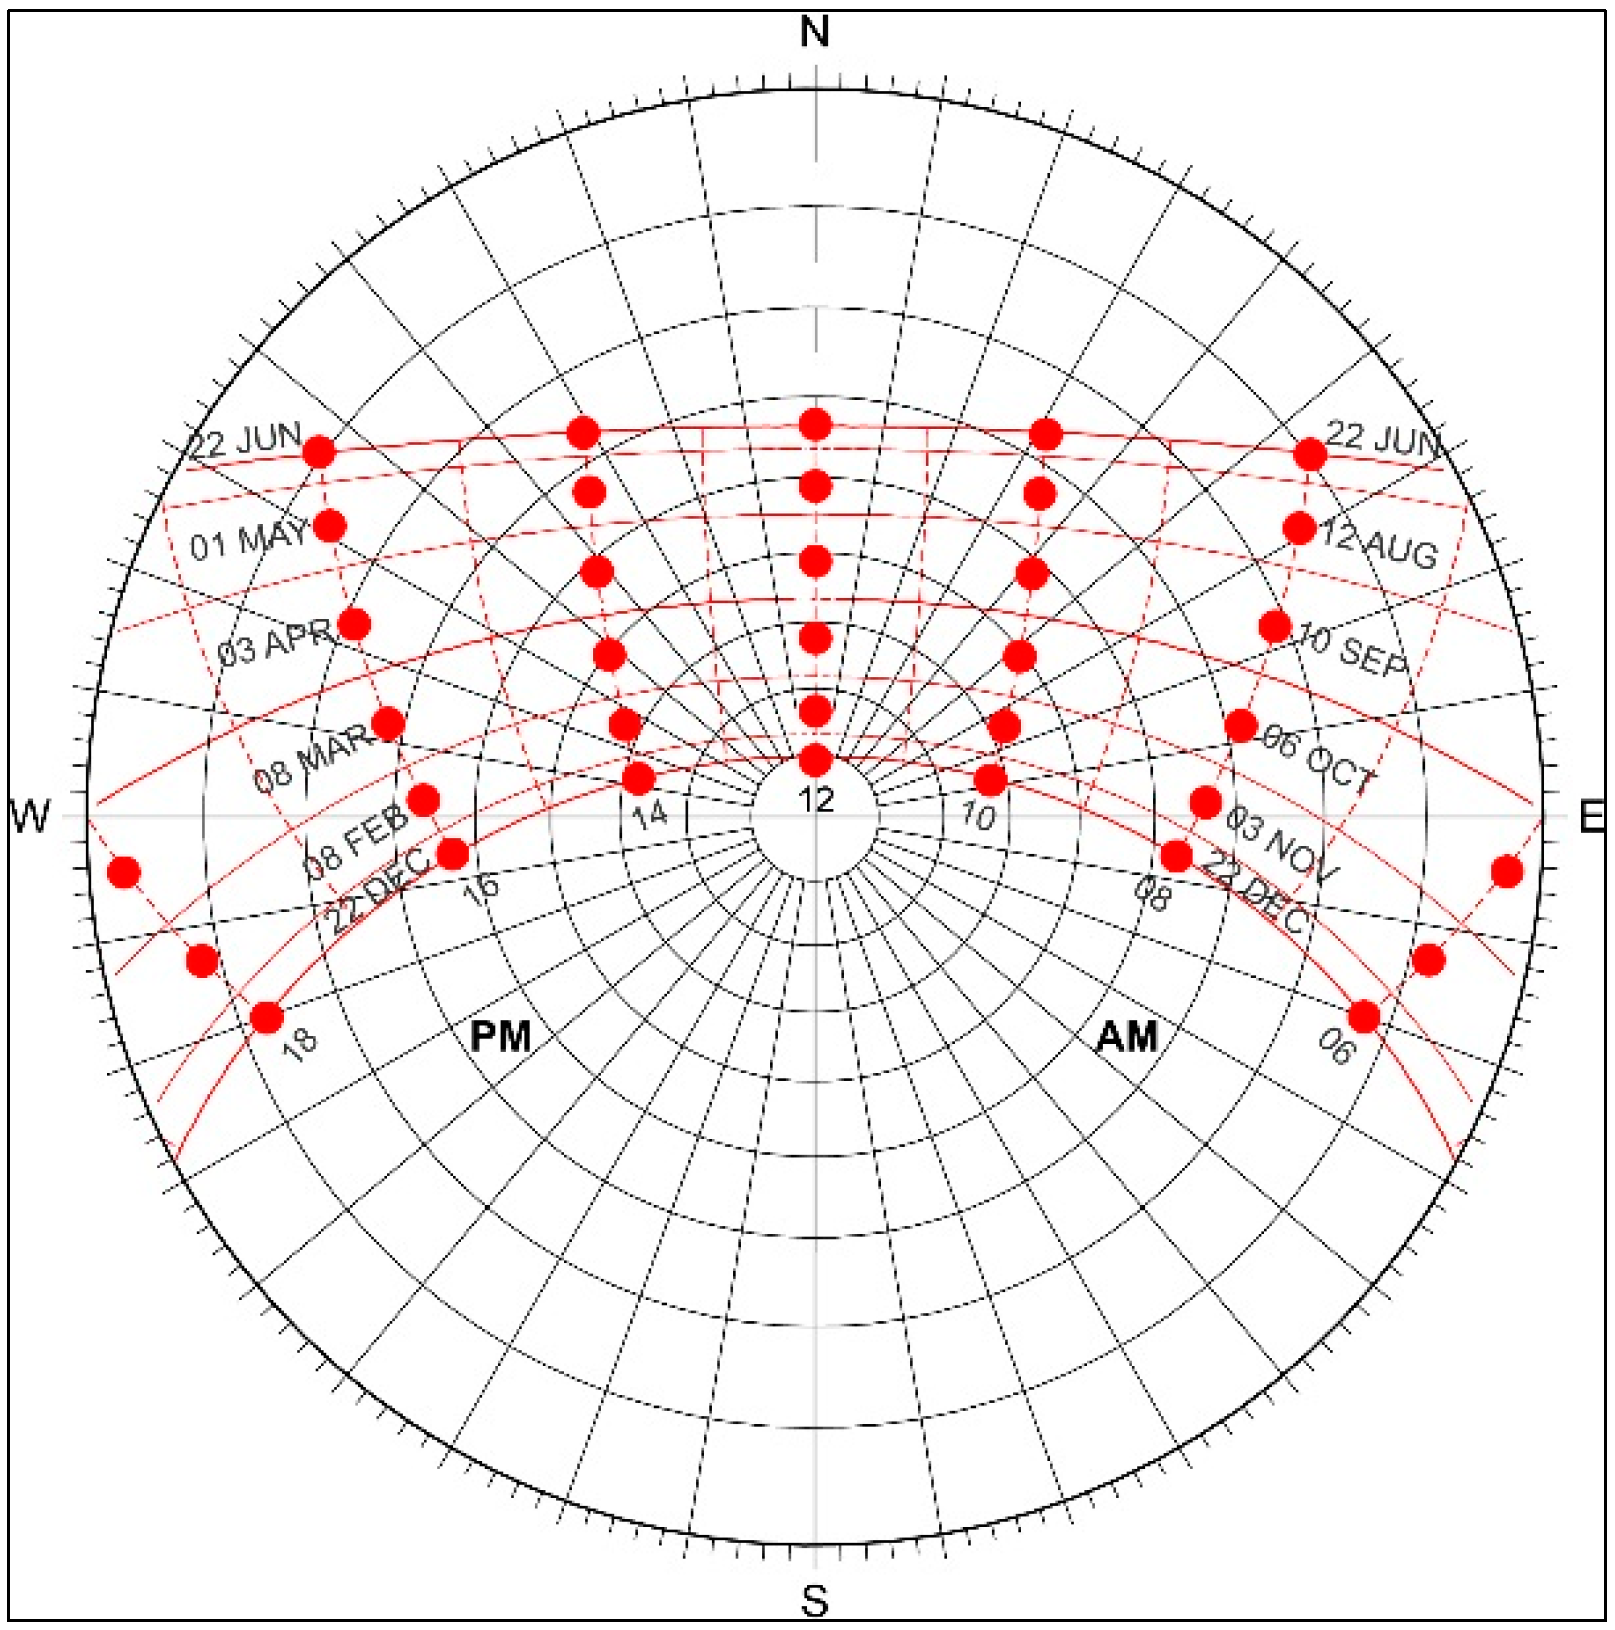
Starting from the segmentation of the year, the moments of the year were defined to represent the different periods and positions of the Sun, and the most representative dates are defined starting from the Sun chart. It is necessary to calculate the illuminance for 70 representative moments of the entire year: ten dates on which each day was divided into 7 intervals of two hours each, from 6 am until 6 pm, represented in
Figure 1, Santiago’s Sun chart.
For each moment, the illuminance values were determined for four light scenarios, each corresponding to one of the four skies, resulting in 280 daylight scenarios for the study.
Figure 1.
Sun path diagram of Santiago city, capital of Chile, showing the moments that were defined for analyzing and then assessing the performance of the proposed typologies (source: our own elaboration, 2014).
Figure 1.
Sun path diagram of Santiago city, capital of Chile, showing the moments that were defined for analyzing and then assessing the performance of the proposed typologies (source: our own elaboration, 2014).
Since the methodology was applied in classrooms, it is important to mention that Chile’s school day runs from 8 am to 4 pm, with this defined period being completely considered. Furthermore, on the academic calendar of elementary schools in Chile, classes begin on the first week of March and end by the second week of December.
3.3. Illuminance Weighting in Workplane
Starting from the daylight scenarios defined for each moment, the illuminance was calculated on an analysis grid on the workplane. The final illuminance in each sensor of the grid is the illuminance obtained under the four skies analyzed, weighted according to their monthly weight resulting from the aforementioned climate analysis. These are added to obtain the final weighted illuminance (E
w), following the ASRC-CIE model formula [
18], according to Equation (1):
where E
w represents the illuminance on the sensor or measurement point and E
c’, E
ct’, E
i’ and E
o’ are the values of illuminance measured under the four defined skies. The factor “b” is a weighted factor of
bc,
bct,
bi and
bo, obtained from climate data.
3.4. Target Values of Illuminance for Daylight Metrics
The final weighted illuminances were analyzed considering the illuminance ranges in compliance, for which the ranges to be considered were defined. The methodology applied in Lightsolve considers three analysis intervals: “too high” to indicate that the illuminances are too high; “in range”, which defines the compliance range considering the illuminances suitable for visual tasks; and “too low”, when the illuminances are not suitable. A buffer zone of these intervals is established, to which partial credits are granted. These intervals were modified, incorporating two new ranges that gather the intermediate illuminance values, finally obtaining the following ranges: “too high”, “high”, “in range”, “low”, “too low”.
The illuminance values are defined based on the object of study, classrooms, for which a revision of the regulatory and standard aspects was carried out to define the illuminances considered for the “in range” values: target illuminance (see
Table 2). A minimum limit value of 300 lux (simple task) and a maximum limit value of 2000 lux (accurate visual perception) are established as defined by Illuminating Engineering Society of North America (IESNA) [
19].
Table 2.
Illuminance values for general classrooms in Chile, the United Kingdom, the European community and the United States (source: our own elaboration, 2014).
Table 2.
Illuminance values for general classrooms in Chile, the United Kingdom, the European community and the United States (source: our own elaboration, 2014).
| Regulation for Elementary schools | Chile | U.K. | European | USA |
|---|
| DS 548 | BB 90 | EN 12464-1 | IESNA |
|---|
| Classrooms general-lux | >180 | 300 | 300 Em | 1500–2000 Emax; 300 Emin |
The “high” limit values are defined, aiming at recognizing the percentage of the area and/or time in which the classroom is at the risk of glare. Based on the first UDI definition, where it is stated that there is risk of glare above 2000 lux [
9], this limit value was later reformulated to a higher illuminance value, considering an excessive UDI above 3000 lux [
10]; starting from this interval, it is established that between 2000 and 3000 lux, there is a glare risk threshold. Identifying the percentage within this range will allow recognizing the need for integrating design strategies or architectural elements to prevent glare, thus taking its values to the “in range” illuminance. As a consequence, as the top limit value for this study, those illuminance values above 3000 lux (“too high”) are set. To define the “low” limit value set at 200 lux, the minimum value established by the European norm for workspaces with continuous norm was taken as the reference [
21] with the interval between 200–300 lux being an intermediate zone. Finally, the illuminance values of the ranges are: “too low” < 200 lux, “low” ≥ 200 lux to < 300 lux, “in range” ≥ 300 lux to < 2000 lux, “high” ≥ 2000 lux to < 3000 lux and “too high” ≥ 3000 lux.
3.5. Analysis of Final Weight Illuminances
These five ranges allow the analysis of the final weighted illuminances in two ways: the first is to inform the annual average percentage in each one of the ranges, in order to guide the design, knowing the compliance percentage, and the second was knowing the surface percentage “in range” through the year, graphed in the temporal maps, which represent the temporal evolution of the weighted horizontal internal illuminance on desks. With the illuminance ranges defined, the next step was analyzing the weighted illuminance values, which were plotted with MATLAB software.
The average of the five ranges defined was also determined, thus allowing determining a percentage for each range, representing the percentage of time (year) located in those intervals. This average can synthesize all of the information in a single value, information that allows us to evaluate the effectiveness of the designs and to compare the results among the strategies.
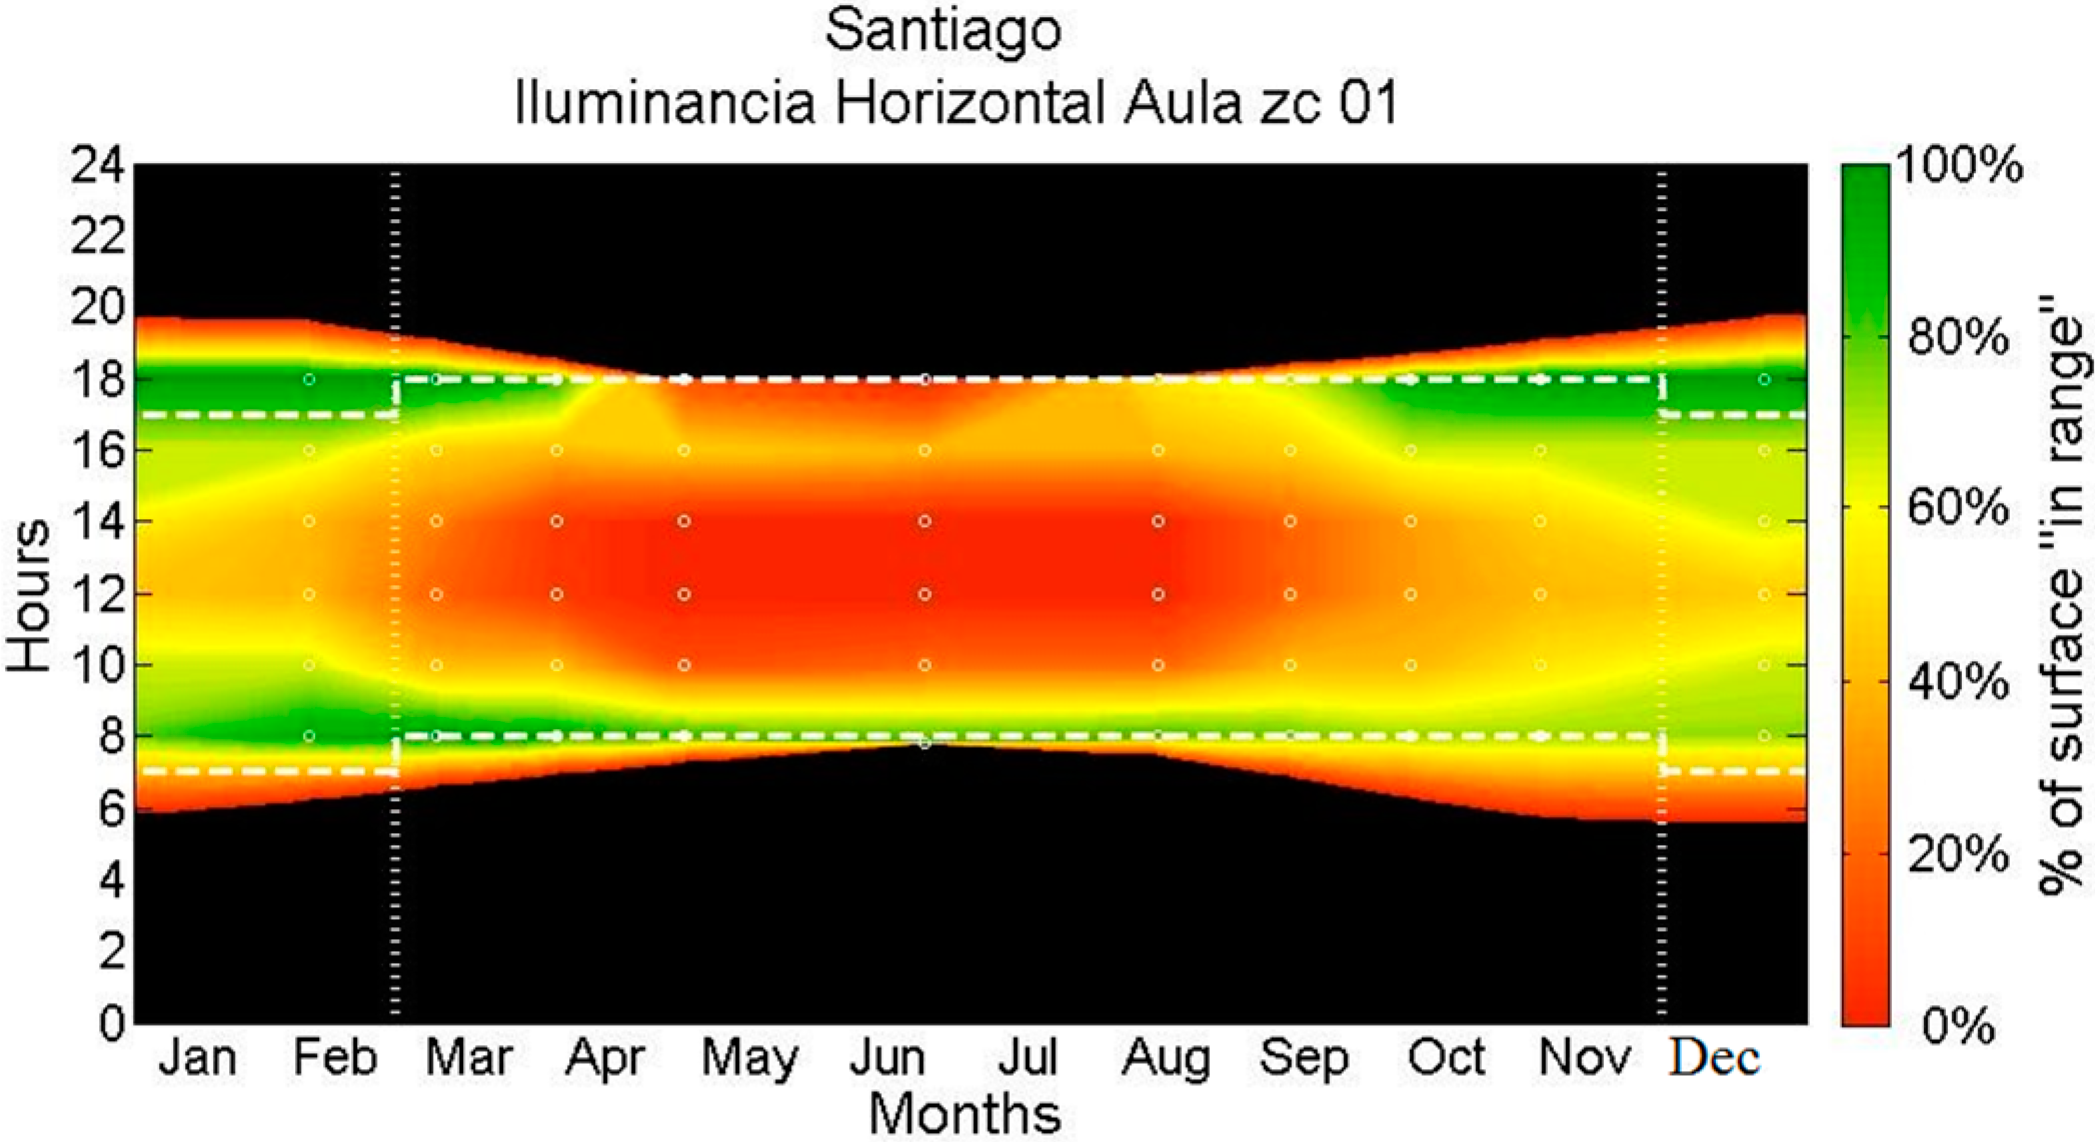
Temporal maps of internal illuminances were drawn in order to integrate the objective values, following a goal-oriented approach. The aim of the goal-oriented approach is to set a target range of values (in range) and to assess the percentage of space, whose performance is within that range. This approach has the advantage of including both spatial and temporal information in one graph, representing the percentage of the work plane that meets the objective that has been defined between 300 and 2000 lux. The structure of the temporal maps is as follows: the month of the year is plotted along the x-axis and the hours of the day along the y-axis. To make their reading easier, the hours are represented as standard (standard time, EST), as shown in
Figure 2.
Figure 2.
This temporal map represents the percentage of the classroom’s surface that is “in range” (between 300 and 2000 lux) throughout the year. The white dashed lines define the boundaries of the academic year (source: our own elaboration, 2014).
Figure 2.
This temporal map represents the percentage of the classroom’s surface that is “in range” (between 300 and 2000 lux) throughout the year. The white dashed lines define the boundaries of the academic year (source: our own elaboration, 2014).
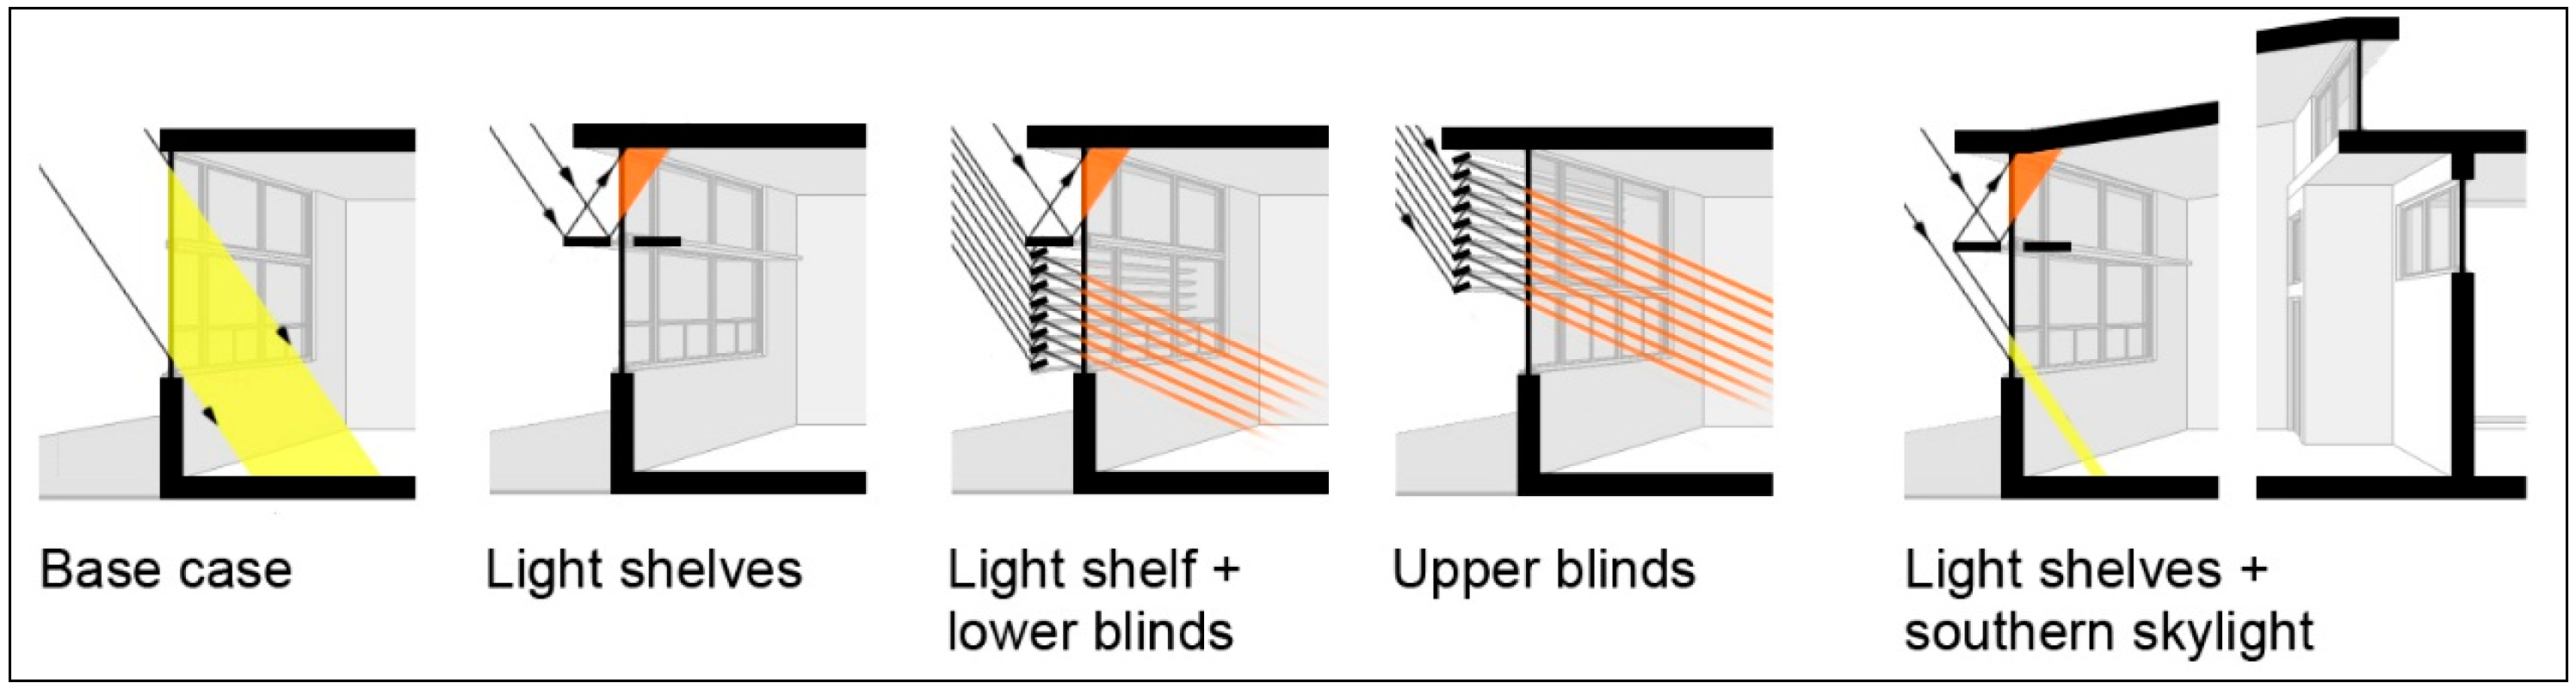
5. Application of Daylighting Strategies in Classrooms
In the definition of the classroom alternatives, three criteria are addressed: avoiding direct sunlight penetration on the workplane; reaching a good lighting distribution; and avoiding sources of glare in the student’s visual field [
25]. In this investigation, the illuminance levels are evaluated based on target ranges, the evaluation of the visual comfort remaining implicit through the glare. It is assumed that being within the “in range” illuminance range, we will be avoiding possible sources of glare.
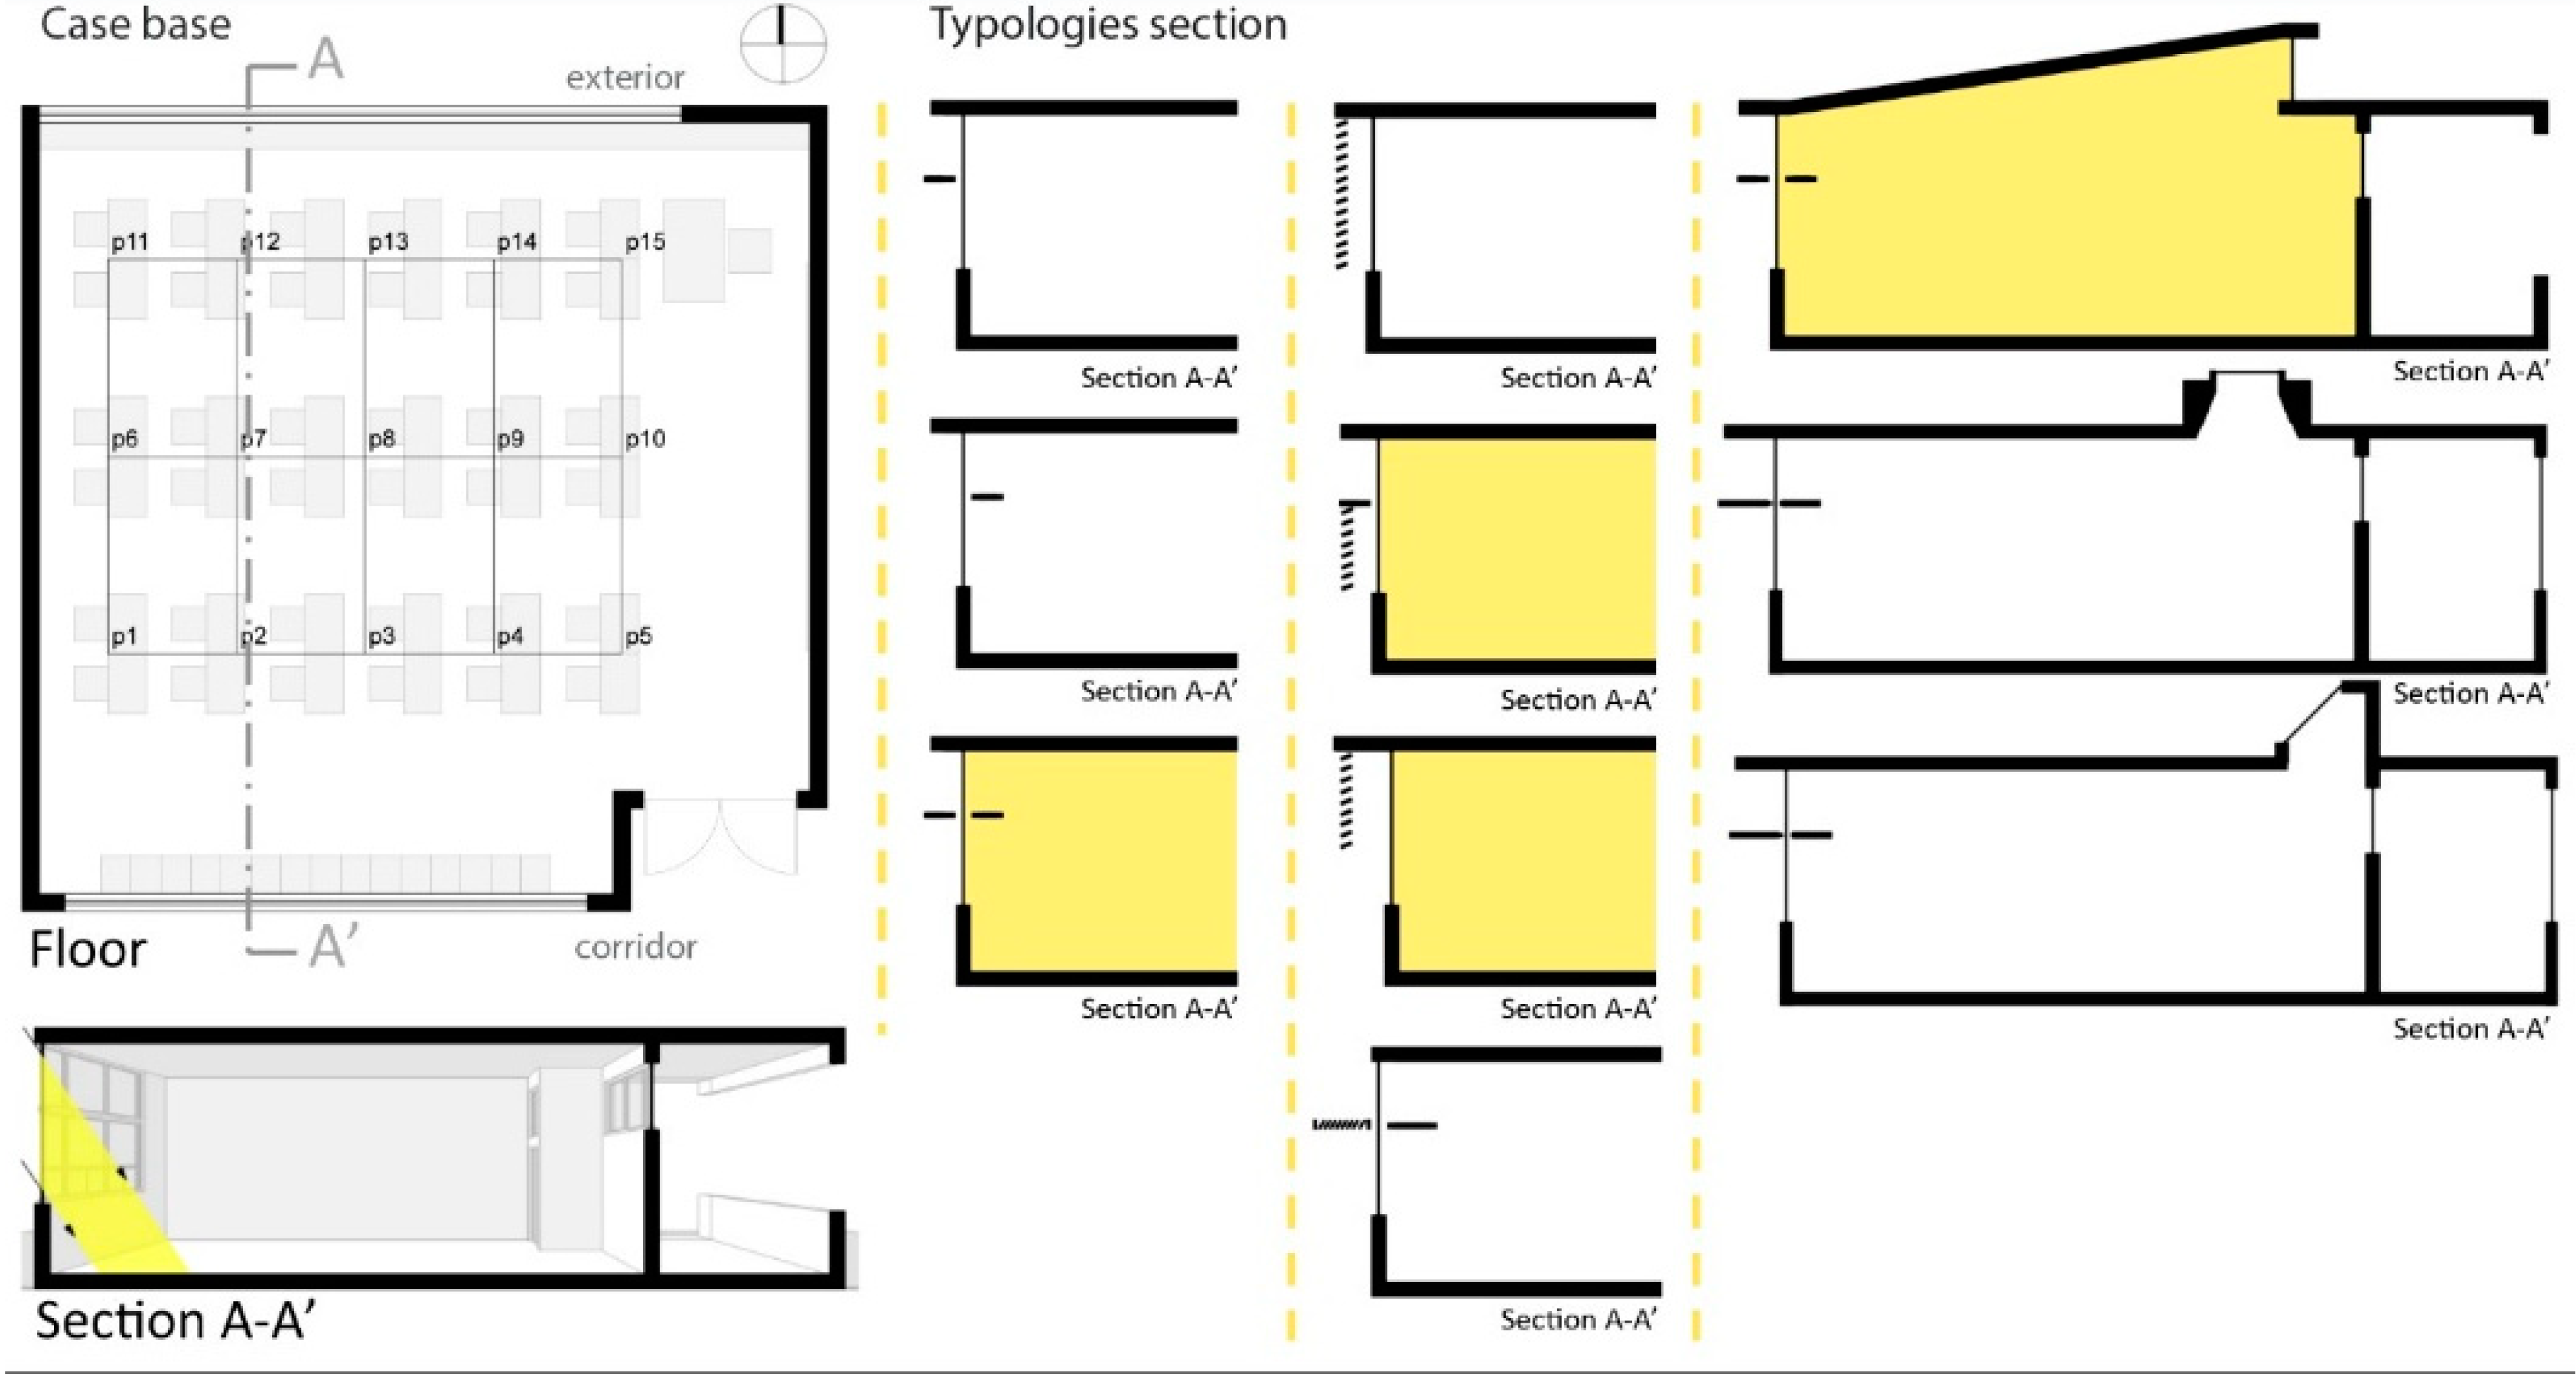
A base typology was defined that responds to the most frequent classroom typology built in Chile. The other typologies arise starting from this classroom, incorporating different architectonic elements: interior, exterior light shelves and both sunlight protections or bilateral lighting, depending on the area of Chile. In the north and central area, where clear and intermediate skies predominate, in order to diffuse the light, the exterior and/or interior light shelves are incorporated, and to protect from excessive light, fixed sunlight protection elements are incorporated. In the south area, where overcast skies predominate, the light shelf is also incorporated to know its effectiveness. Likewise, for this area, different zenith lighting strategies were evaluated (
Figure 3). For the scope of this research, the different typologies with only a northerly orientation were favored, while the other orientations will be the subject for a future investigation.
Figure 3.
Plan distribution of the base case, grid of the analysis and the section of the classroom. The section of the proposed typologies: the sections highlighted in yellow are the typologies analyzed in this paper (source: our own elaboration, 2014).
Figure 3.
Plan distribution of the base case, grid of the analysis and the section of the classroom. The section of the proposed typologies: the sections highlighted in yellow are the typologies analyzed in this paper (source: our own elaboration, 2014).
5.1. Base Case Classroom Typology Definition
A base classroom is defined with a size of 78.24 m
2 by 3.5 m high, with the capacity for 36 students, north facing, which has direct lateral lighting and indirect lighting from the hall (
Figure 3); its main window corresponds to 23% of the total area of the floor surface, based on that proposed as optimal for the three areas [
7]. Although the student’s workplane is often rearranged in the classroom, it has been decided to set them up in the traditional way. To control the sunlight penetration at the level of the whiteboard, the window was kept at a distance of 1.55 m from the perpendicular wall where the whiteboard is placed.
5.2. Simulation Parameters
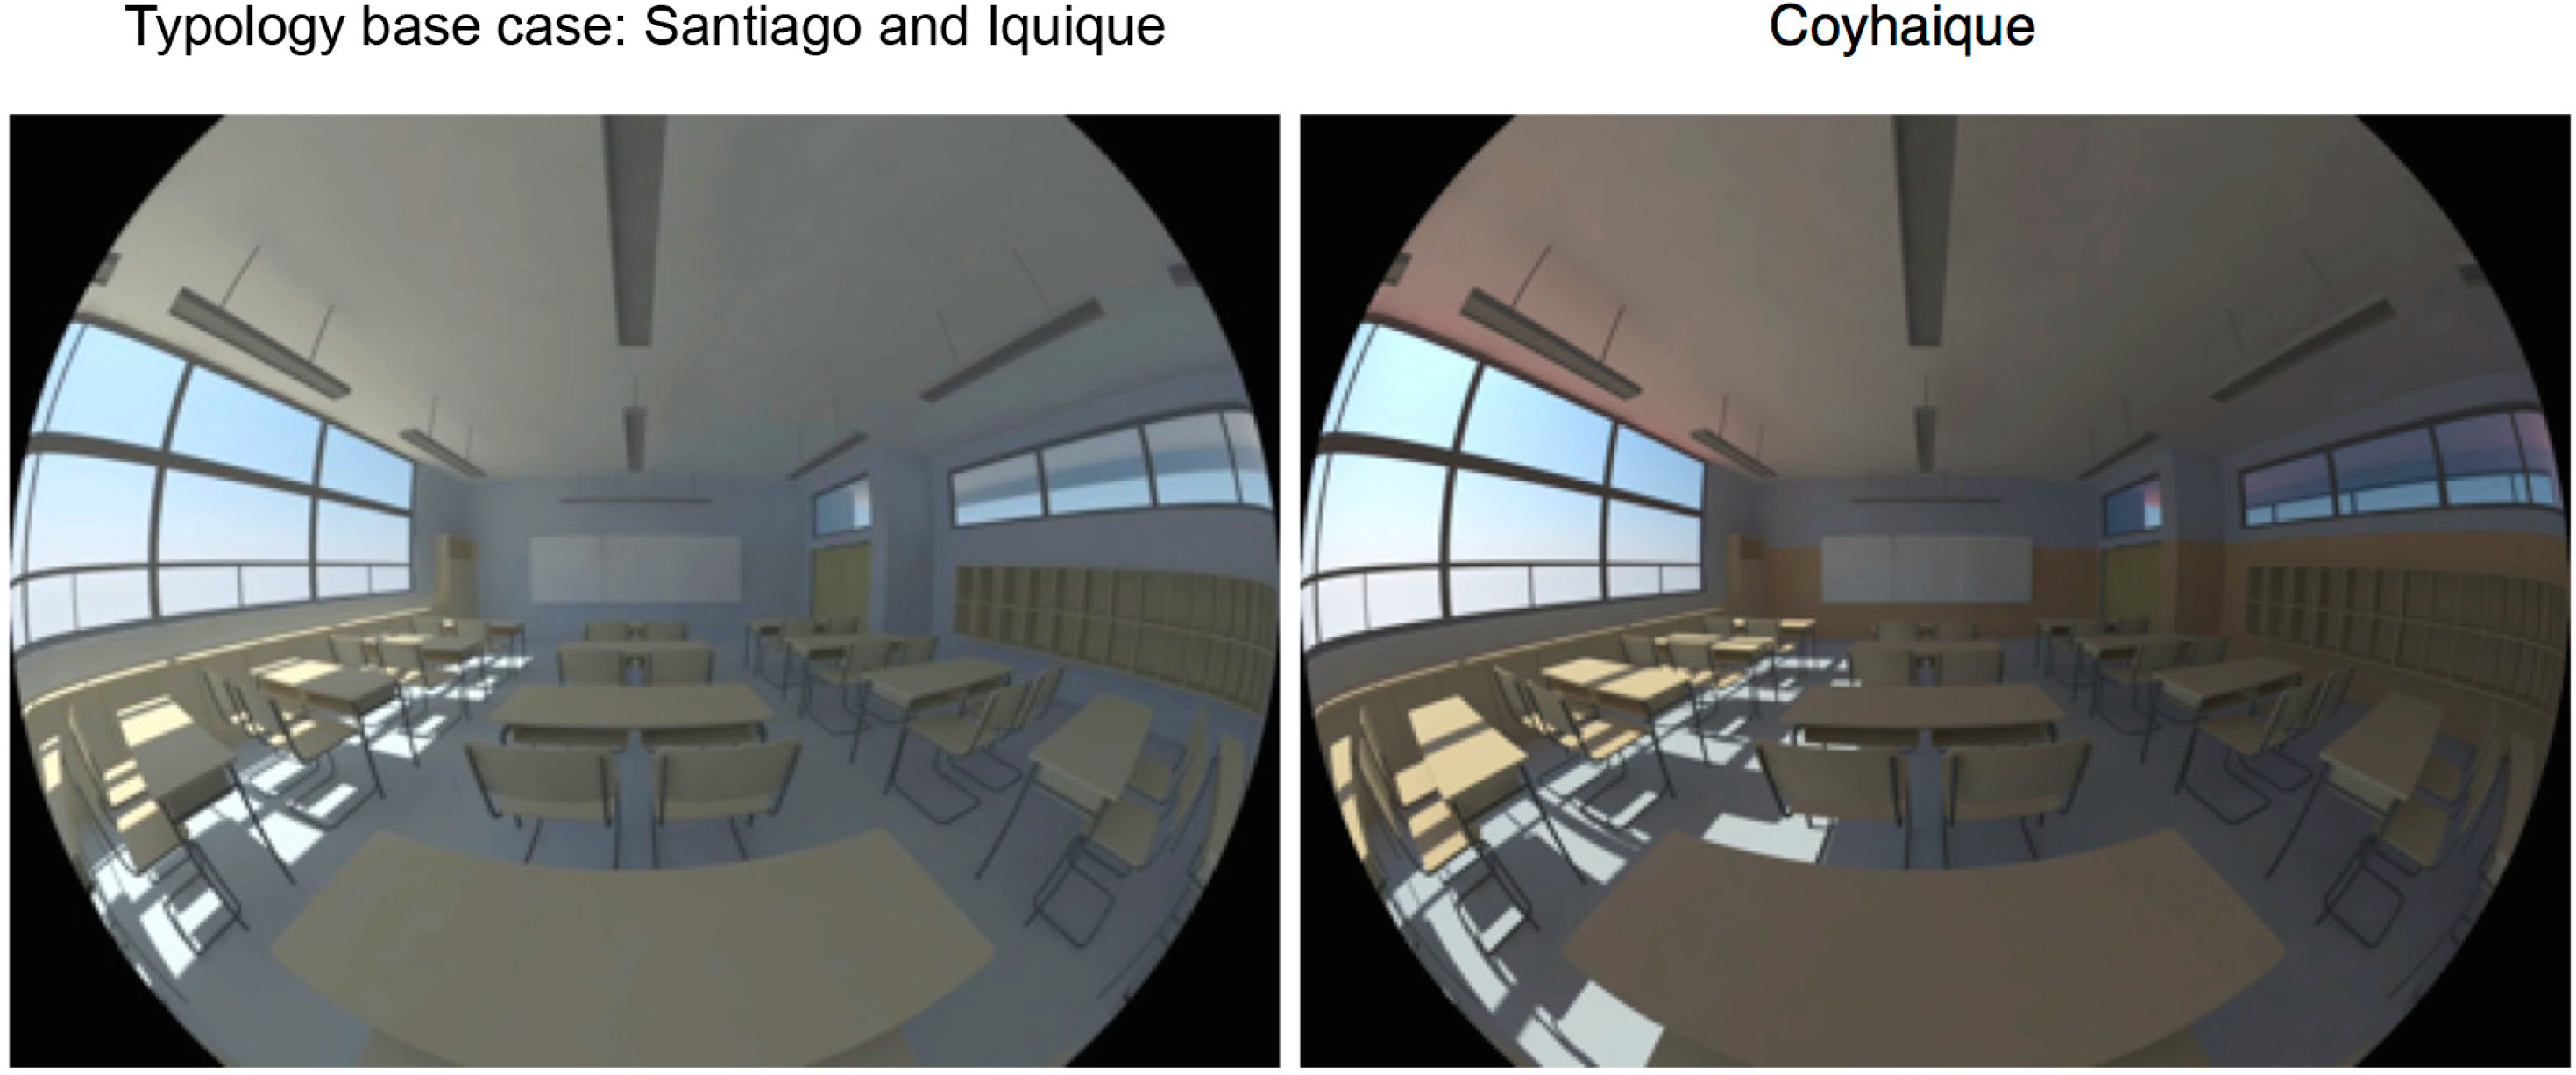
For the calculation, it was decided to use a horizontal grid representing the student’s workplane, defining 15 sensors distributed uniformly at 80 cm high. This would allow making the calculations for the 27 studied typologies within the timeframes of the study. The properties of the interior materials are defined by the reflection coefficient based on values recommended for classrooms in Chile [
6], diffuse reflectance values: sky, >70%; wall, 50%–70%; floor, 20%–50%. The values considered are observed in
Table 3. The final rendering of the materials and color are shown in
Figure 4.
Table 3.
Reflectance values of interior materials of classrooms (source: our own elaboration, 2014).
Table 3.
Reflectance values of interior materials of classrooms (source: our own elaboration, 2014).
| Building Element | Material Description |
|---|
| Ceiling | 90% |
| Walls | 60% 1–50% 2 until 2.0 m |
| Floor | 50% |
| Mullions | 20% |
| Light Shelve | 90% |
| View and Daylit window | 90% visual transmittance 1 70% visual transmittance 2 |
| External Ground | 40% |
| Fixer Blinds | 50% |
Figure 4.
Rendered images of the interior materials for the north and center zones and the southern zone (source: our own elaboration, 2014).
Figure 4.
Rendered images of the interior materials for the north and center zones and the southern zone (source: our own elaboration, 2014).
The 3D models were built with SketchUp 8 and then exported with their su2rad [
26], to then have the files necessary to carry out the lighting simulation with Radiance software. The scenario description for each of the four sky distributions was done with the
gensky command-line, considering the overcast sky “–c”, intermediate sky “+I”, clear turbid sky “+s –t5.5” and for clear sky “+s –t 2.54” [
14]. The value of zenith brightness of the sky vault is not specified, but automatically computed with the
gensky command. The horizontal illuminance was determined with the
rtrace command-line, and the scripts used for the calculation were:
gensky ${DATE} ${H} ${LOC} -m +60 ${CIE} >sky_1.rad
oconv materials.rad geometry.rad sky_1.rad sky_2.rad > scene.oct
rtrace -I -h -ab 5 -aa 0.08 -ar 512 -ad 2048 -as 512 scene.oct < grid.pts | rcalc -e '$1=179*(.265*$1+.670*$2+.065*$3)' > illuminance_value.dat
${DATE}= month-day ${H}=hours ${LOC}=latitude and longitude city ${CIE}=skies descriptions
5.3. Results of the Design Strategies
In this section, the results of some of the typologies are shown to validate the methodology. For Iquique, Santiago and Coyhaique, the results obtained from the base case typology are shown; then, for the case of Iquique and Santiago, the results of incorporating light shelves with lower blinds and the typology with upper blinds and, finally, of the typology with exterior-interior light shelves and a bilateral strategy with a skylight facing south, for the three cities studied, are shown (
Figure 5).
Figure 5.
Sections of the base case and the studied typologies that integrate architectural elements, such as light shelves, protections and skylights. Direct daylight is shown in yellow, while diffuse daylight is shown in orange (source: our own elaboration, 2014).
Figure 5.
Sections of the base case and the studied typologies that integrate architectural elements, such as light shelves, protections and skylights. Direct daylight is shown in yellow, while diffuse daylight is shown in orange (source: our own elaboration, 2014).
In
Table 4, it is possible to see the annual illuminance range averages. It can be observed that the base classroom in the city of Santiago has an annual average below 55%, presenting inadequate daylighting levels over the year, reaching “high” illuminances 17% of the year and “too high” illuminances 29% of the year. In Iquique and Coyhaique, there are “adequate daylighting levels” throughout the year; however, the percentage of time that there are “high” and “too high” illuminances is 36% in Iquique and 26% in Coyhaique; therefore, Sun control strategies must be integrated. When incorporating light shelves in the three cities, the annual illuminance average “in range” increases, having “adequate daylighting levels” throughout the year in Santiago, where the percentage of “high” illuminances remains over 30% of the year. For Iquique and Coyhaique, the light shelf becomes more effective, reaching “optimal daylighting levels”. The effectiveness of the proposed sunlight protections will be verified for the case of the typologies with light shelves with lower blinds and the typology with upper blinds, where the “high” average illuminances were considerably reduced throughout the year, achieving a better performance, especially in Iquique, where “optimal daylighting levels” throughout the year are achieved. The typology with light shelves and southern skylight obtains, for the case of Iquique, “high” illuminances during 30% of the year and “too high” illuminances only during 9% of the year, both indicate that this strategy provides too much light to the classroom, which can be optimized. In the case of Santiago, the percentage of time with “high” illuminances is even higher, with these values being present during 45% of the year, which equally indicates that complementary strategies are to be defined in order to lower these values.
Table 4.
The annual percentage of time that the horizontal illuminance is within each range for the different typologies for each city and the categorization proposed (source: our own elaboration, 2014).
Table 4.
The annual percentage of time that the horizontal illuminance is within each range for the different typologies for each city and the categorization proposed (source: our own elaboration, 2014).
| Cities And typologies | Ranges OF Illuminance |
|---|
| IQUIQUE | Too Low | Low | In Range | High | Too High |
| Base case | 0% | 2% | 61% (↑) | 15% | 21% |
| Light shelves | 0% | 4% | 73% (+) | 14% | 9% |
| Light shelves + lower blinds | 1% | 5% | 76% (+) | 11% | 7% |
| Upper blinds | 2% | 5% | 77% (+) | 13% | 3% |
| Light shelves southern skylight | 0% | 1% | 60% (↑) | 30% | 9% |
| SANTIAGO | Too Low | Low | In range | High | Too High |
| Base case | 3% | 2% | 49% (–) | 17% | 29% |
| Light shelves | 3% | 3% | 62% (↑) | 15% | 16% |
| Light shelves + lower blinds | 5% | 4% | 68% (↑) | 12% | 11% |
| Upper blinds | 5% | 4% | 71% (+) | 12% | 7% |
| Light shelves southern skylight | 3% | 1% | 51% (–) | 28% | 17% |
| COYAHIQUE | Too Low | Low | In range | High | Too High |
| Base case | 10% | 4% | 60% (↑) | 9% | 17% |
| Light shelves | 13% | 5% | 71% (+) | 4% | 7% |
| Light shelves southern skylight | 11% | 5% | 74% (+) | 4% | 7% |
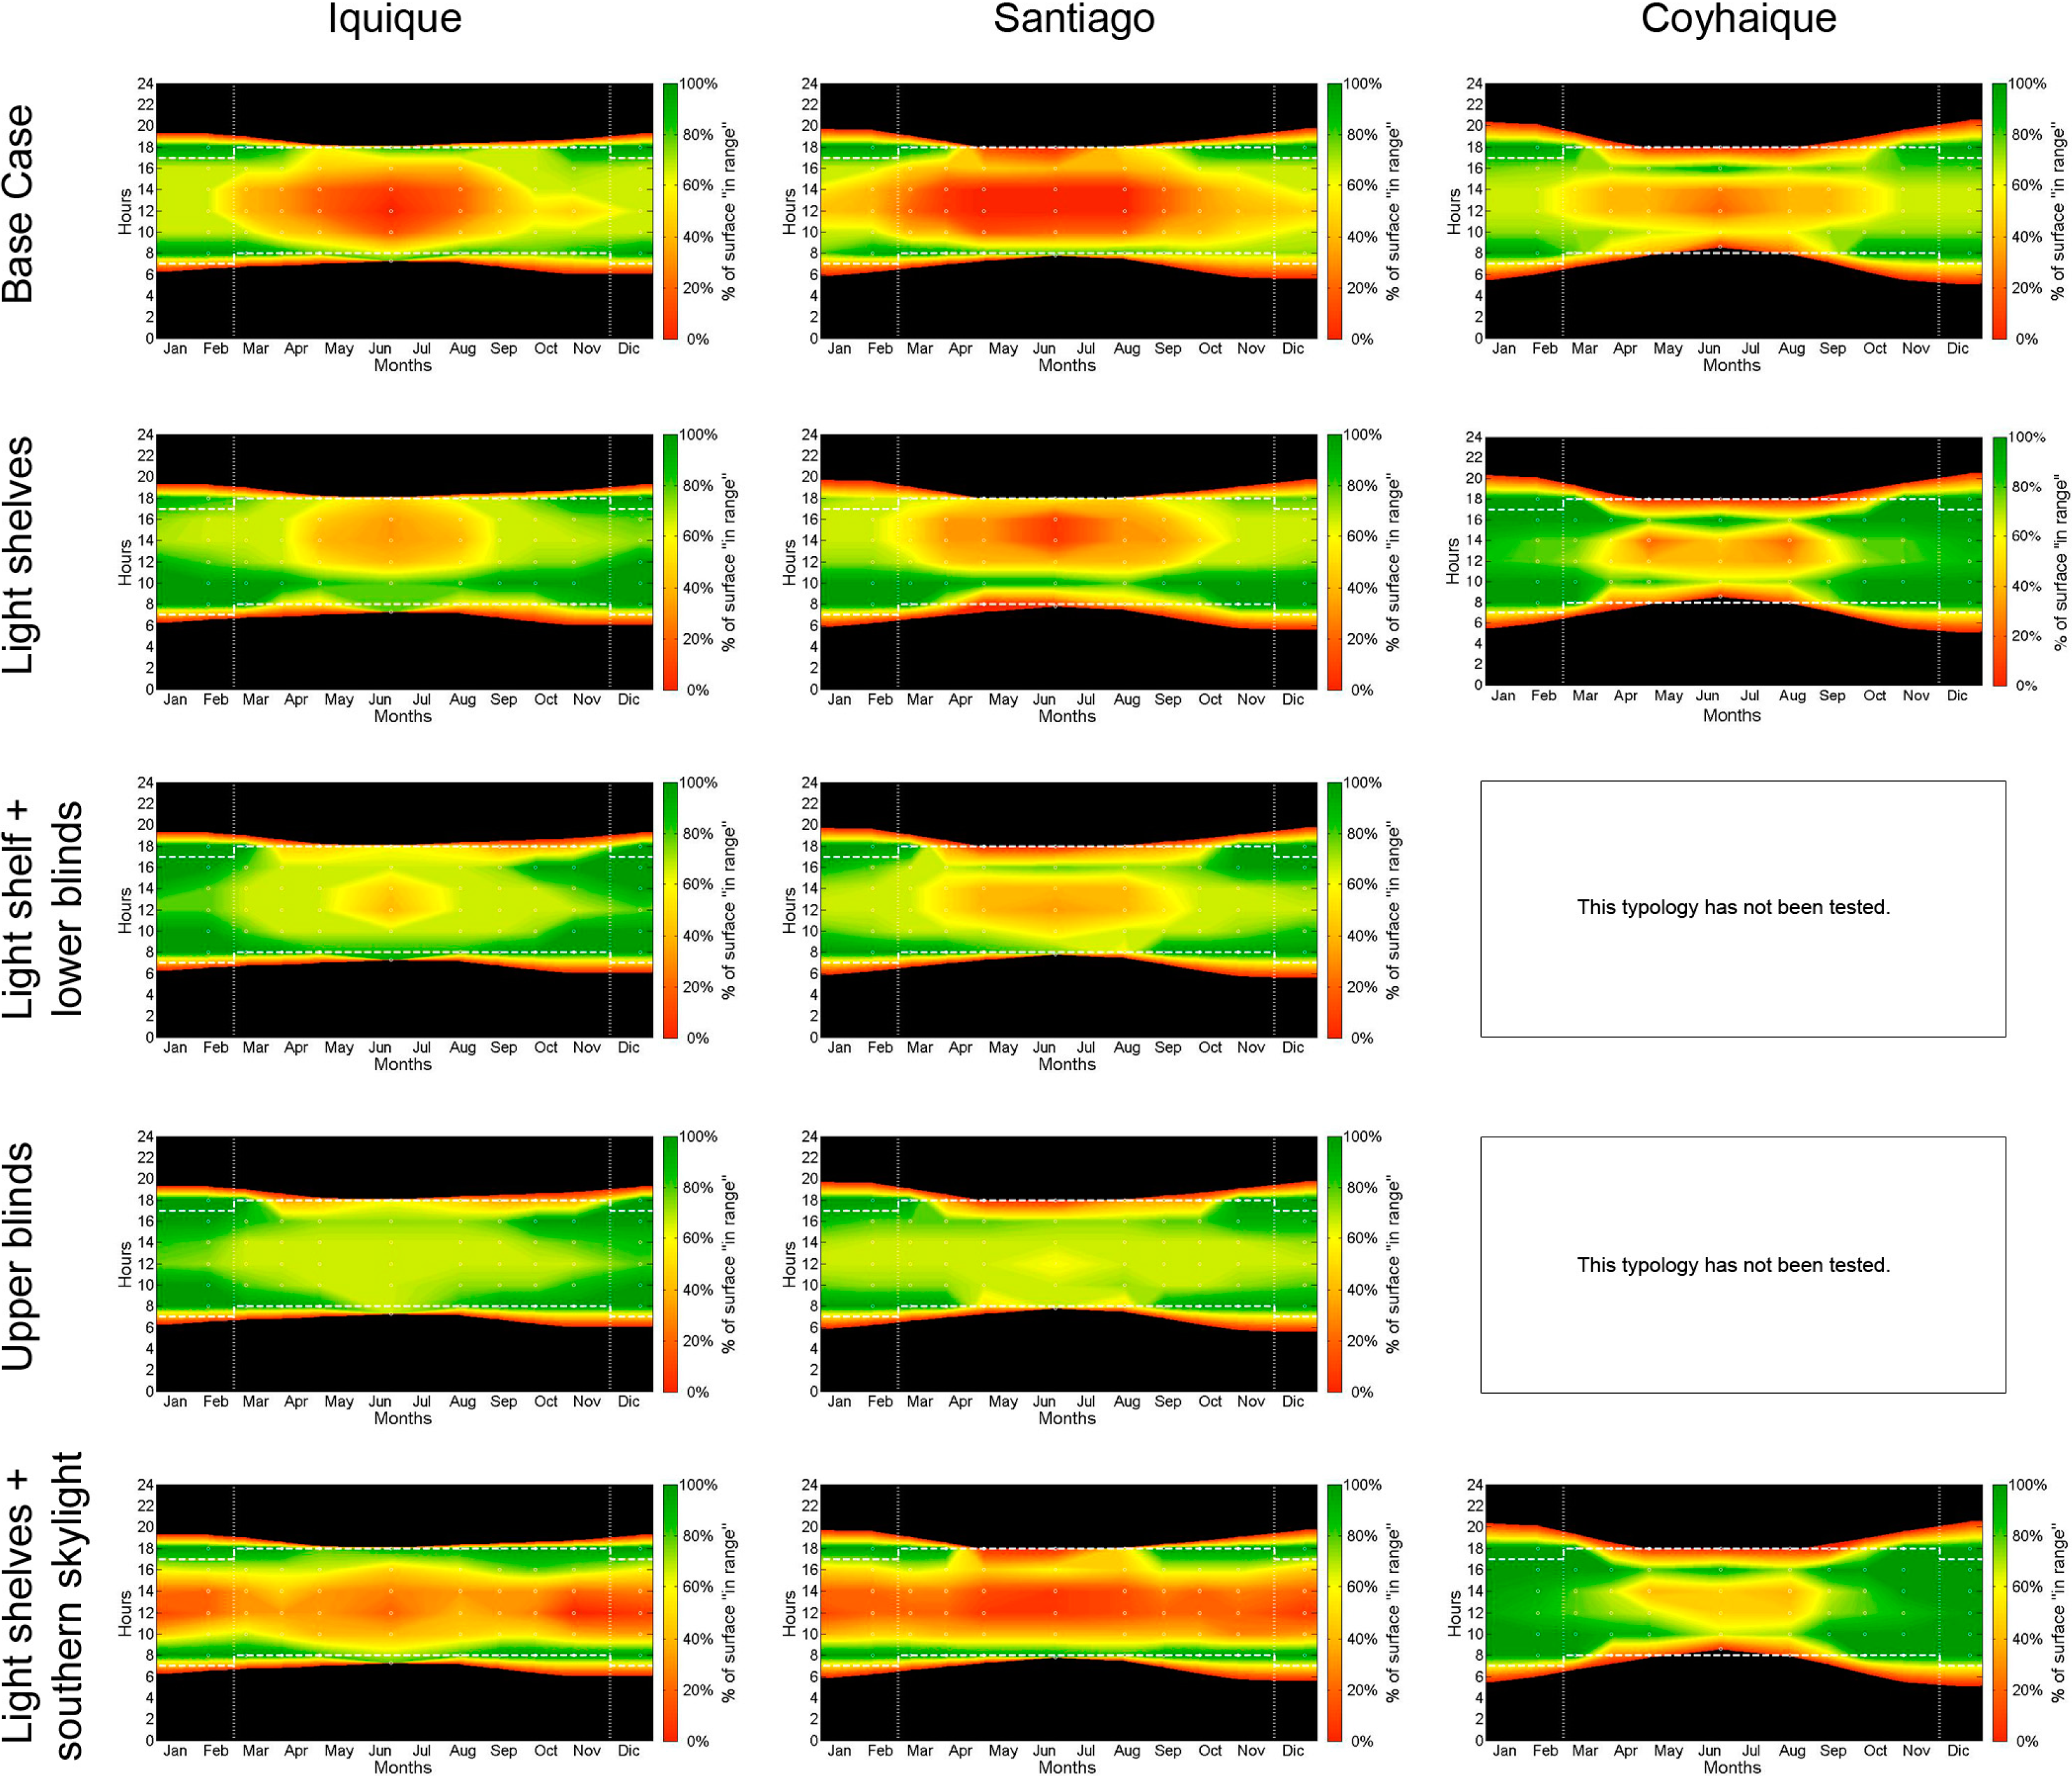
In
Figure 6, the results of the temporal maps are shown, which indicate the percentage of the classroom surfaces with illuminances “in range”; here, it is possible to observe the periods in which the illuminance inside the classroom is not reached. The typologies that achieve a greater percentage of surface “in range” are for the case of classrooms evaluated with upper blinds, in the case of Iquique and Santiago. For the case of Coyhaique, the typology with a north facing light shelf and a south facing skylight achieves the greatest percentage of the classroom “in range” throughout the year; however, it can be seen that in the winter period, the percentage of the surface with illuminance “in range” drops significantly.
Figure 6.
Resulting temporal maps for every strategy in each city that represents the percentage of the classroom’s area that has illuminances values “in range” throughout the year (source: our own elaboration, 2014).
Figure 6.
Resulting temporal maps for every strategy in each city that represents the percentage of the classroom’s area that has illuminances values “in range” throughout the year (source: our own elaboration, 2014).
6. Conclusions and Discussion
6.1. Conclusions
From the results obtained, it can be concluded that, for the classrooms evaluated, for the cities of Iquique and Santiago, the typology with the best performance was the classroom with an upper blind, providing the ideal conditions to expect an energy savings that almost does not require complementary artificial lighting. In the case of the city of Coyhaique, although the results of the typology with the light shelf and southern skylight are good, we cannot assure an energy savings, since it will be necessary to use artificial light in the periods with the greatest demand, during the winter.
As for the analysis methodology, we can conclude that it allows having, as a final result, an indicator for the annual performance and a temporal graph indicating the spatial performance based on a target (illuminance “in range”). Both address two different, but complementary, perspectives, helping to understand the lighting performance of the typologies analyzed. The first indicator is the annual average values for each range, which tell us if we have an excess or lack of light, depending on the climate of each city, with the possibility of carrying out a general evaluation to define how to improve the design of a classroom. For example, if we have too much light, we must check the types of glass and sunlight protections; on the other hand, if we have little light, we must review the lighting strategy. For a more detailed analysis, when we want a spatial understanding, the temporal maps allow recognizing, accurately, month-on-month and hour-on-hour, the percentage of the surface will illuminances “in range”. To report which percentage of the classroom is outside of this range, whether in high or low ranges, it was proposed to determine, for each date and hour, the average value of all of the ranges that will be incorporated in the stage after the one presented.
The merits of the investigation are as follows: It allowed carrying out a study that covered different climate areas, allowing the recollection of base information for the daylight studies in Chile. Upon knowing the types of skies and their frequencies, data that, up until now, had not been generated for Chile, we can make design decisions in an early stage, in the draft, before carrying out simulations that take more time. The designer can recommend and/or pre-design the space based on the predominant skies, month-on-month and throughout the year, with their effectiveness being able to be checked more quickly, for example, for the solstices and equinoxes with the predominant skies of those months, to thus reduce the calculation time in the draft stage. Likewise, it is important to highlight the contribution provided by communicating the results of the different typologies proposed through the temporal maps, aiming at communicating the percentage of the classroom’s area that is in compliance. These are the result of a dynamic daylight analysis that, finally, allows reporting a complex process in a simple and comprehensible form.
Another contribution is the categorization proposed, which, although, as it was said before, is not part of the methodology, aims at defining achievements for the % of time with illuminance “in range”. A quantitative analysis is qualified in relation to the daylighting illuminance levels, integrating three concepts: Inadequate, adequate and optimal; these levels are a first approach to setting standards for the minimum requirements to achieve the “in range” light levels throughout the year.
The limitations of this study are that only one orientation is analyzed, since it is difficult to cover all of the orientations, and not the external obstructions have not been considered; this allowed us to know the lighting performance of certain architectonic typologies applied in Chile, which, until now, had not been studied considering the daylight variations.
6.2. Discussion
Regarding the applied methodology, bearing in mind that in order to achieve these results, the process implies a series of stages—building climate data and processing it to obtain the predominant skies month-on-month, generating the files necessary for the calculation of the illuminance in Radiance and, finally, setting the ranges with which the results will be evaluated—it is important to highlight that it is necessary to be clear about what one wishes to evaluate, since this does not allow making preliminary evaluations, due to the great time demand. It is advisable to apply this methodology when, starting from the same base parameters, there is a wish to evaluate multiple architectural solutions.
In relation to the dynamic method proposed for this study, it is important to suggest that the results obtained from the typologies could be different if another analysis method, like the one integrated in Daysim, that likewise considers annual simulations based on climate files, is used, being able in this way to face the ranges proposed for UDI and the ranges proposed in this study.
Although the “in range” target illuminances were defined starting from international studies, upon considering the extension of the Chilean territory (latitude 17°30′S to 56°30′S), it is stated that it is important to evaluate, onsite, how the users perceive the ranges defined and to have this data from local references. It is presumed that there will be differences in the perception of visual comfort depending on the different locations in Chile.
It is acknowledged that, in order to move forward in the definition of guiding light indicators, to achieve an evaluation system for the whole of Chile, it is necessary to extend the study area, carrying out evaluations for other cities of Chile or of other typologies, in order to verify the application of the indicators proposed and the analysis graphs. Within this future work, it is important to complement a detailed study of the risk of glare for the students, using “evalglare”, to determine the daylighting glare probability (GDP), and through this, being able to define a standard for Chile.


