
Futures Analysis of Urban Land Use and Wetland Change in Saskatoon, Canada: An Application in Strategic Environmental Assessment

Abstract
:1. Introduction
2. SEA Context: Wetlands Assessment and LUC Modeling
- (i).
- Historical trends. This principle is based on extrapolation of past LUC change, assuming permanency of the factors that underline the trend.
- (ii).
- Suitability. The suitability principle describes LUC change based on the specific characteristics of a parcel of land (e.g., spatial, biophysical, or socio-economical preference) in terms of quantitative or qualitative based minimization of costs or maximization of profit.
- (iii).
- Neighborhood interaction. The basis of this principle is that the possibility of land change depends on surrounding land uses and use characteristics. LUC change drivers in this case can be biophysical or socio-economic.
- (iv).
- Actor interaction. In this principle, LUC change depends on the decision-making process, which is the result of actors’ interaction. The drivers are socio-economic values and development policy.
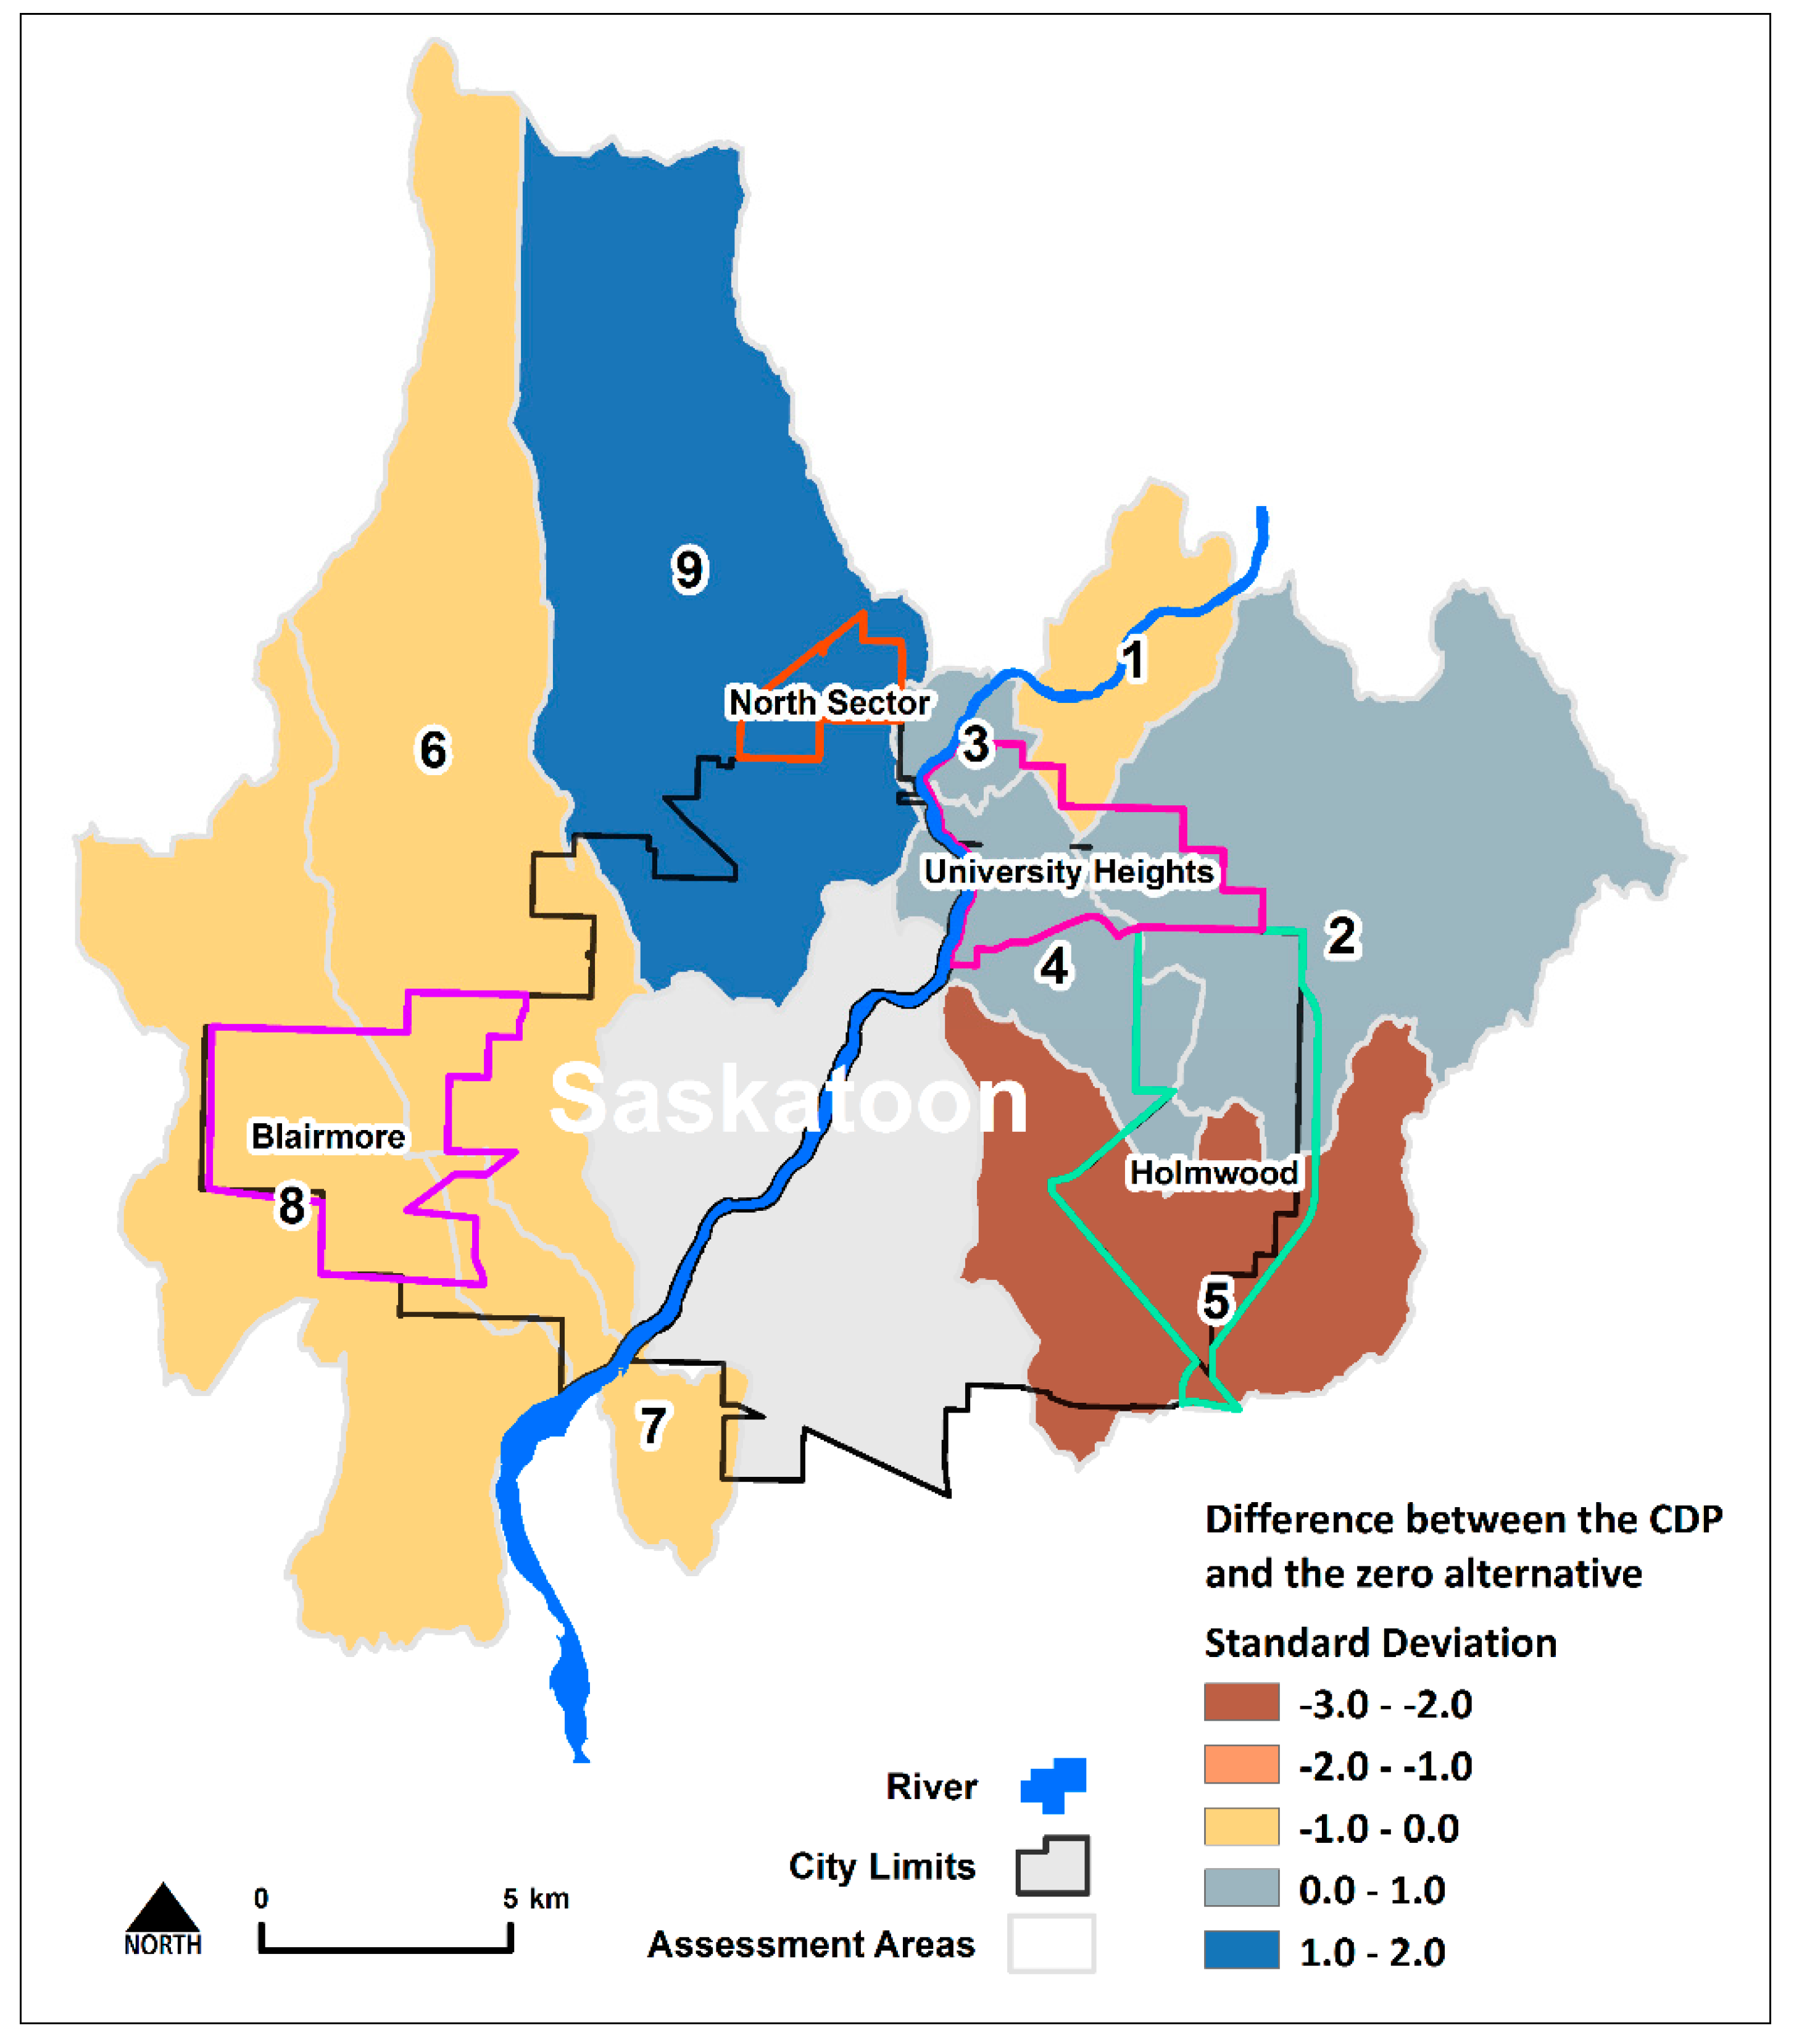
3. Study Area
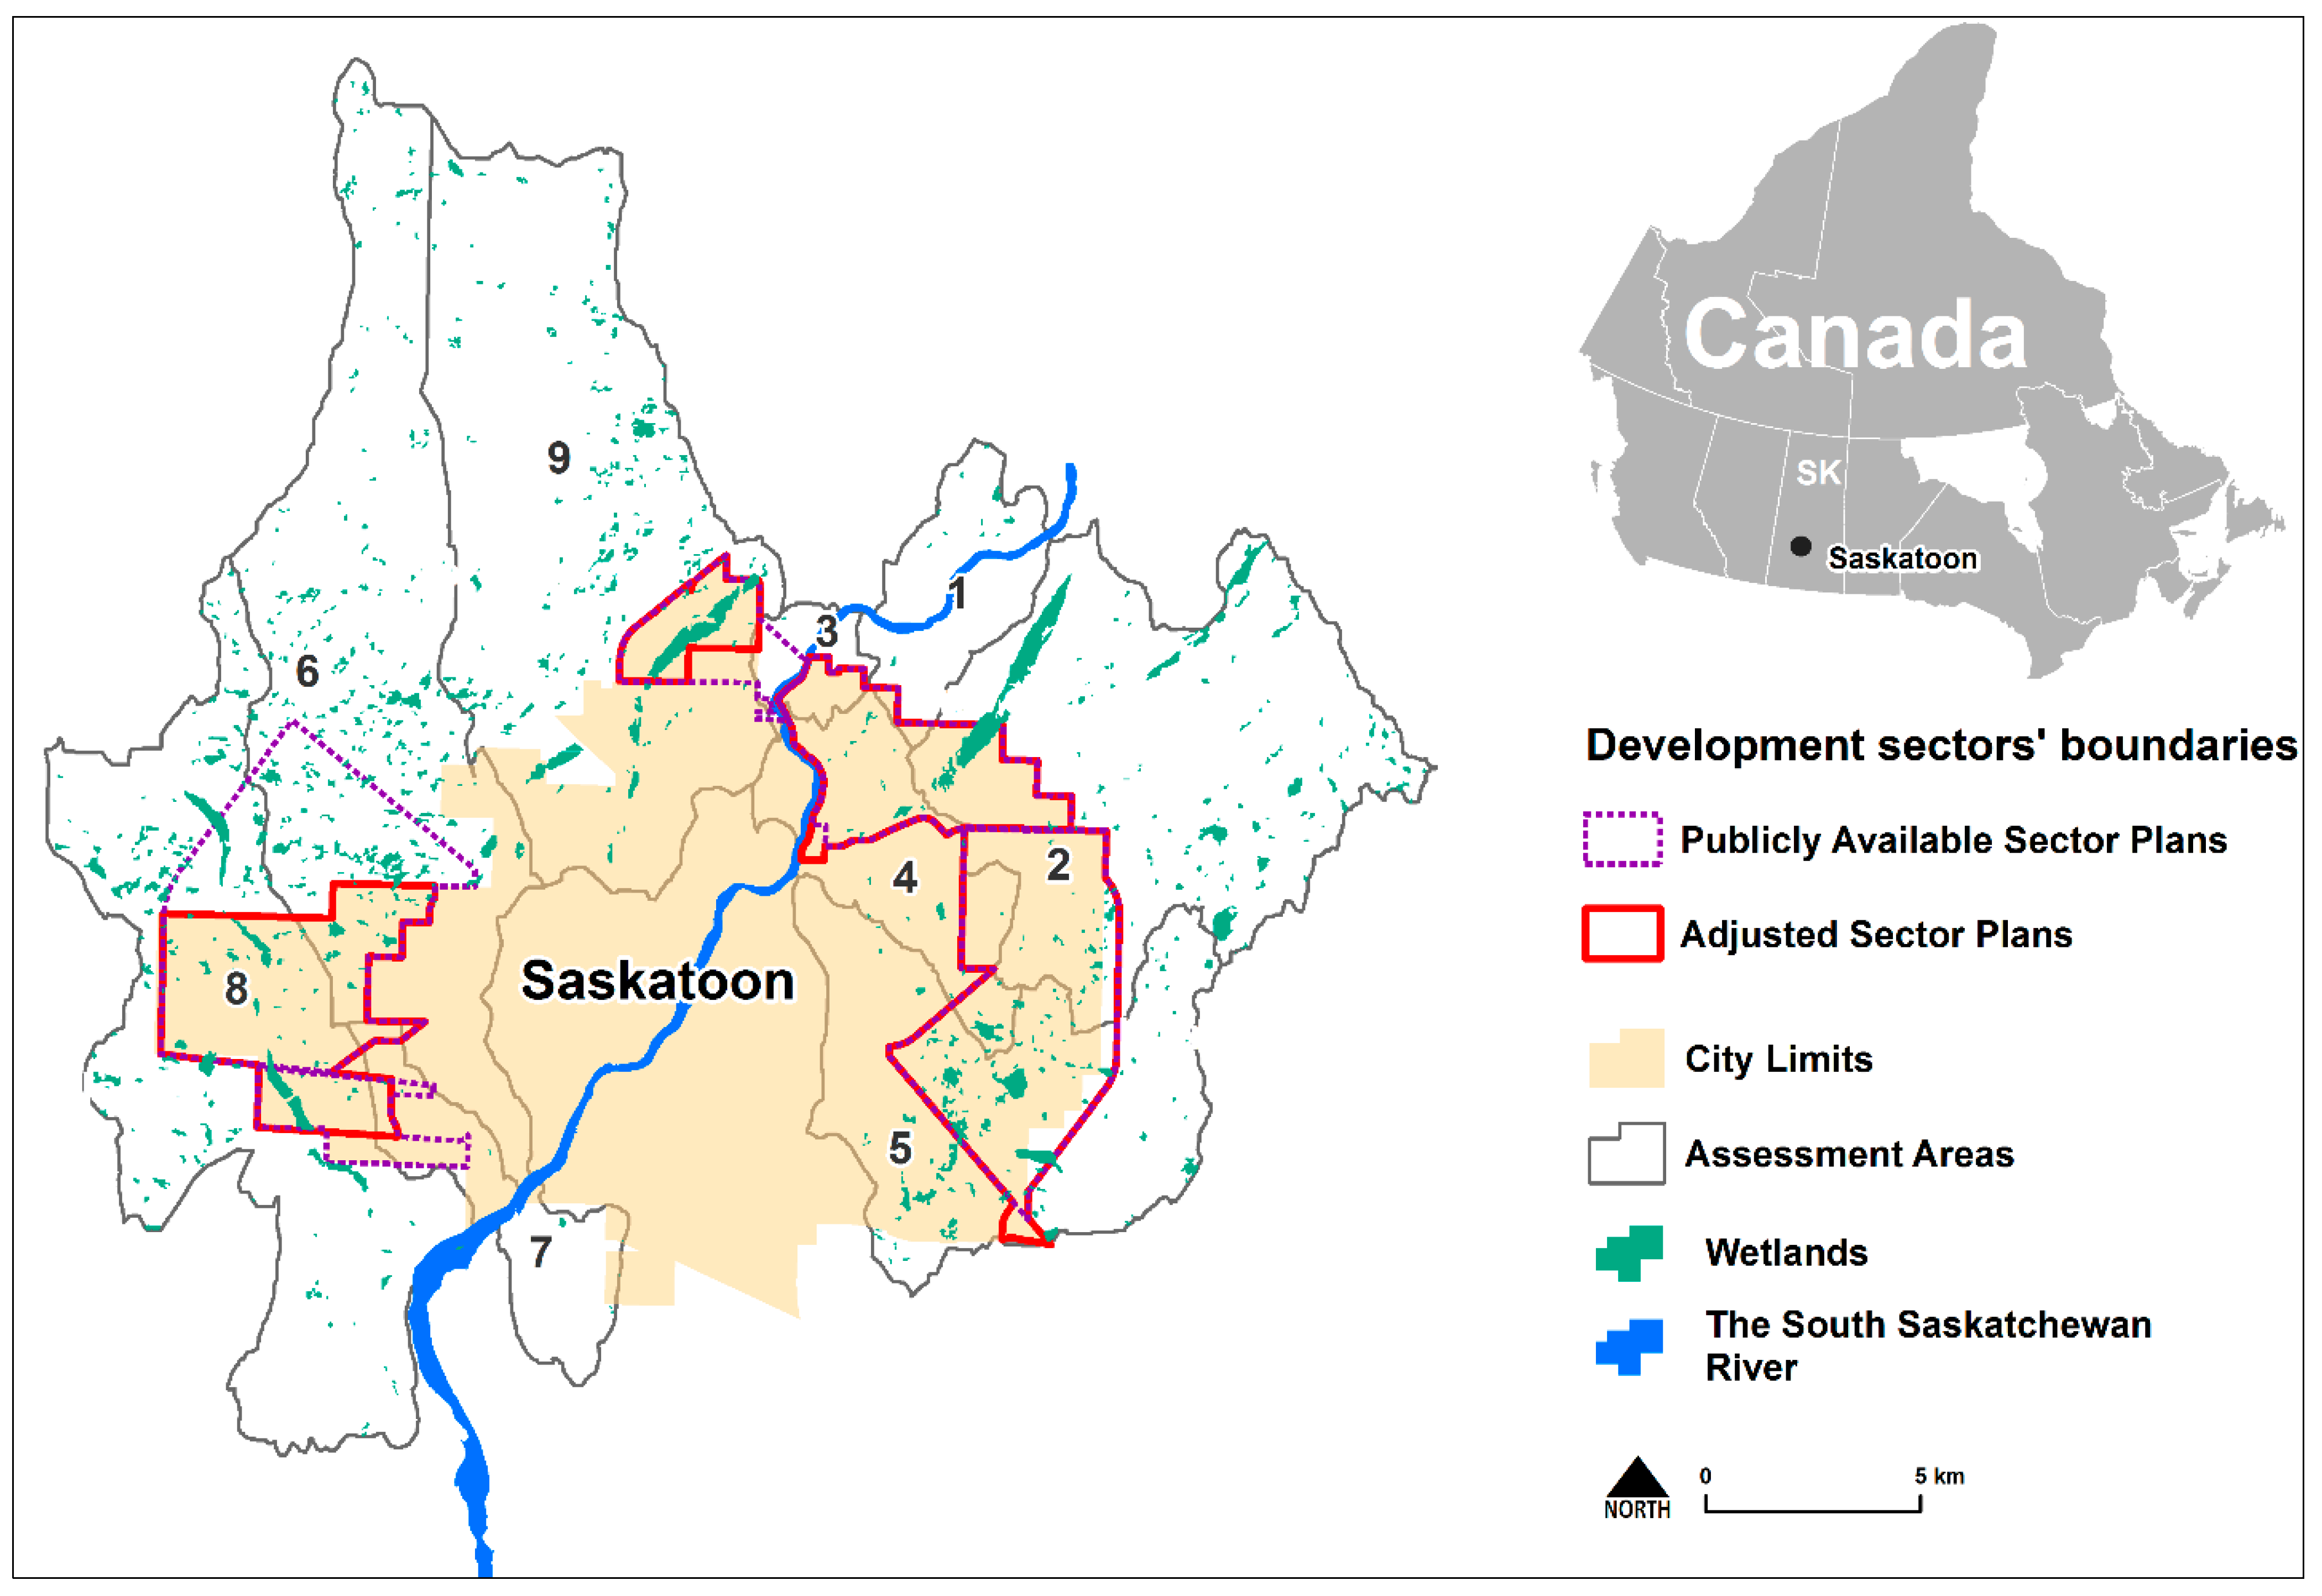
4. Assessment Approach
4.1. Data

| AA | LUC class | 1985–2006 | 1985–2011 | ||||
|---|---|---|---|---|---|---|---|
| Built-up | Non Built-up | Wet Areas | Built-up | Non Built-up | Wet Areas | ||
| 1 | Built-up | 0.0 | 1.4 | 0.0 | 0.0 | 1.4 | 0.0 |
| Non built-up | 50.9 | 1422.8 | 0.1 | 1.4 | 1442.3 | 17.6 | |
| Wet areas | 0.1 | 45.1 | 14.0 | 0.0 | 29.3 | 29.9 | |
| 2 | Built-up | 4.3 | 25.6 | 0.4 | 3.8 | 26.0 | 0.5 |
| Non built-up | 27.5 | 7172.4 | 72.1 | 20.3 | 7101.4 | 150.3 | |
| Wet areas | 2.3 | 119.4 | 360.8 | 0.9 | 140.5 | 341.2 | |
| 3 | Built-up | 10.1 | 15.9 | 0.0 | 7.4 | 18.5 | 0.0 |
| Non built-up | 10.1 | 508.1 | 0.0 | 0.9 | 502.9 | 5.5 | |
| Wet areas | 0.0 | 9.5 | 0.5 | 0.0 | 5.6 | 4.4 | |
| 4 | Built-up | 116.7 | 27.1 | 0.0 | 113.6 | 30.2 | 0.0 |
| Non built-up | 208.0 | 1826.2 | 8.8 | 385.1 | 1631.3 | 21.5 | |
| Wet areas | 5.9 | 20.5 | 39.3 | 14.2 | 19.6 | 32.0 | |
| 5 | Built-up | 568.9 | 68.9 | 0.0 | 581.6 | 56.1 | 0.1 |
| Non built-up | 615.1 | 3680.1 | 36.1 | 734.5 | 3533.5 | 63.3 | |
| Wet areas | 61.7 | 101.9 | 196.5 | 66.3 | 96.6 | 197.1 | |
| 6 | Built-up | 752.4 | 118.1 | 0.0 | 769.9 | 95.0 | 5.4 |
| Non built-up | 124.6 | 6924.4 | 50.7 | 272.2 | 6531.0 | 296.1 | |
| Wet areas | 0.8 | 395.4 | 301.6 | 3.9 | 323.6 | 370.4 | |
| 7 | Built-up | 230.0 | 59.6 | 0.0 | 233.3 | 55.4 | 0.0 |
| Non built-up | 110.2 | 1222.5 | 3.6 | 146.4 | 1176.1 | 11.2 | |
| Wet areas | 1.4 | 5.5 | 1.7 | 1.9 | 3.4 | 3.2 | |
| 8 | Built-up | 41.4 | 34.5 | 0.0 | 47.3 | 28.5 | 0.0 |
| Non built-up | 63.5 | 7500.2 | 49.1 | 109.5 | 7213.4 | 279.9 | |
| Wet areas | 0.0 | 122.6 | 351.7 | 0.0 | 62.9 | 411.4 | |
| 9 | Built-up | 710.8 | 169.5 | 1.4 | 762.7 | 117.8 | 1.3 |
| Non built-up | 407.9 | 7420.6 | 79.7 | 804.4 | 6986.6 | 117.2 | |
| Wet areas | 26.5 | 433.6 | 302.0 | 61.7 | 407.0 | 293.5 | |
| Area unit is ha | |||||||
4.2. Simulation of Future LUC: Markov Chain Technique
4.3. Markov Chain Models and LUC Alternatives
- (i)
- The zero alternative, which simulates business as usual, where future LUC is based on historical trends in wetland/urban change using the MC1985–2006 model for the entire study area and describing future conditions without the introduction of planned urban development actions.
- (ii)
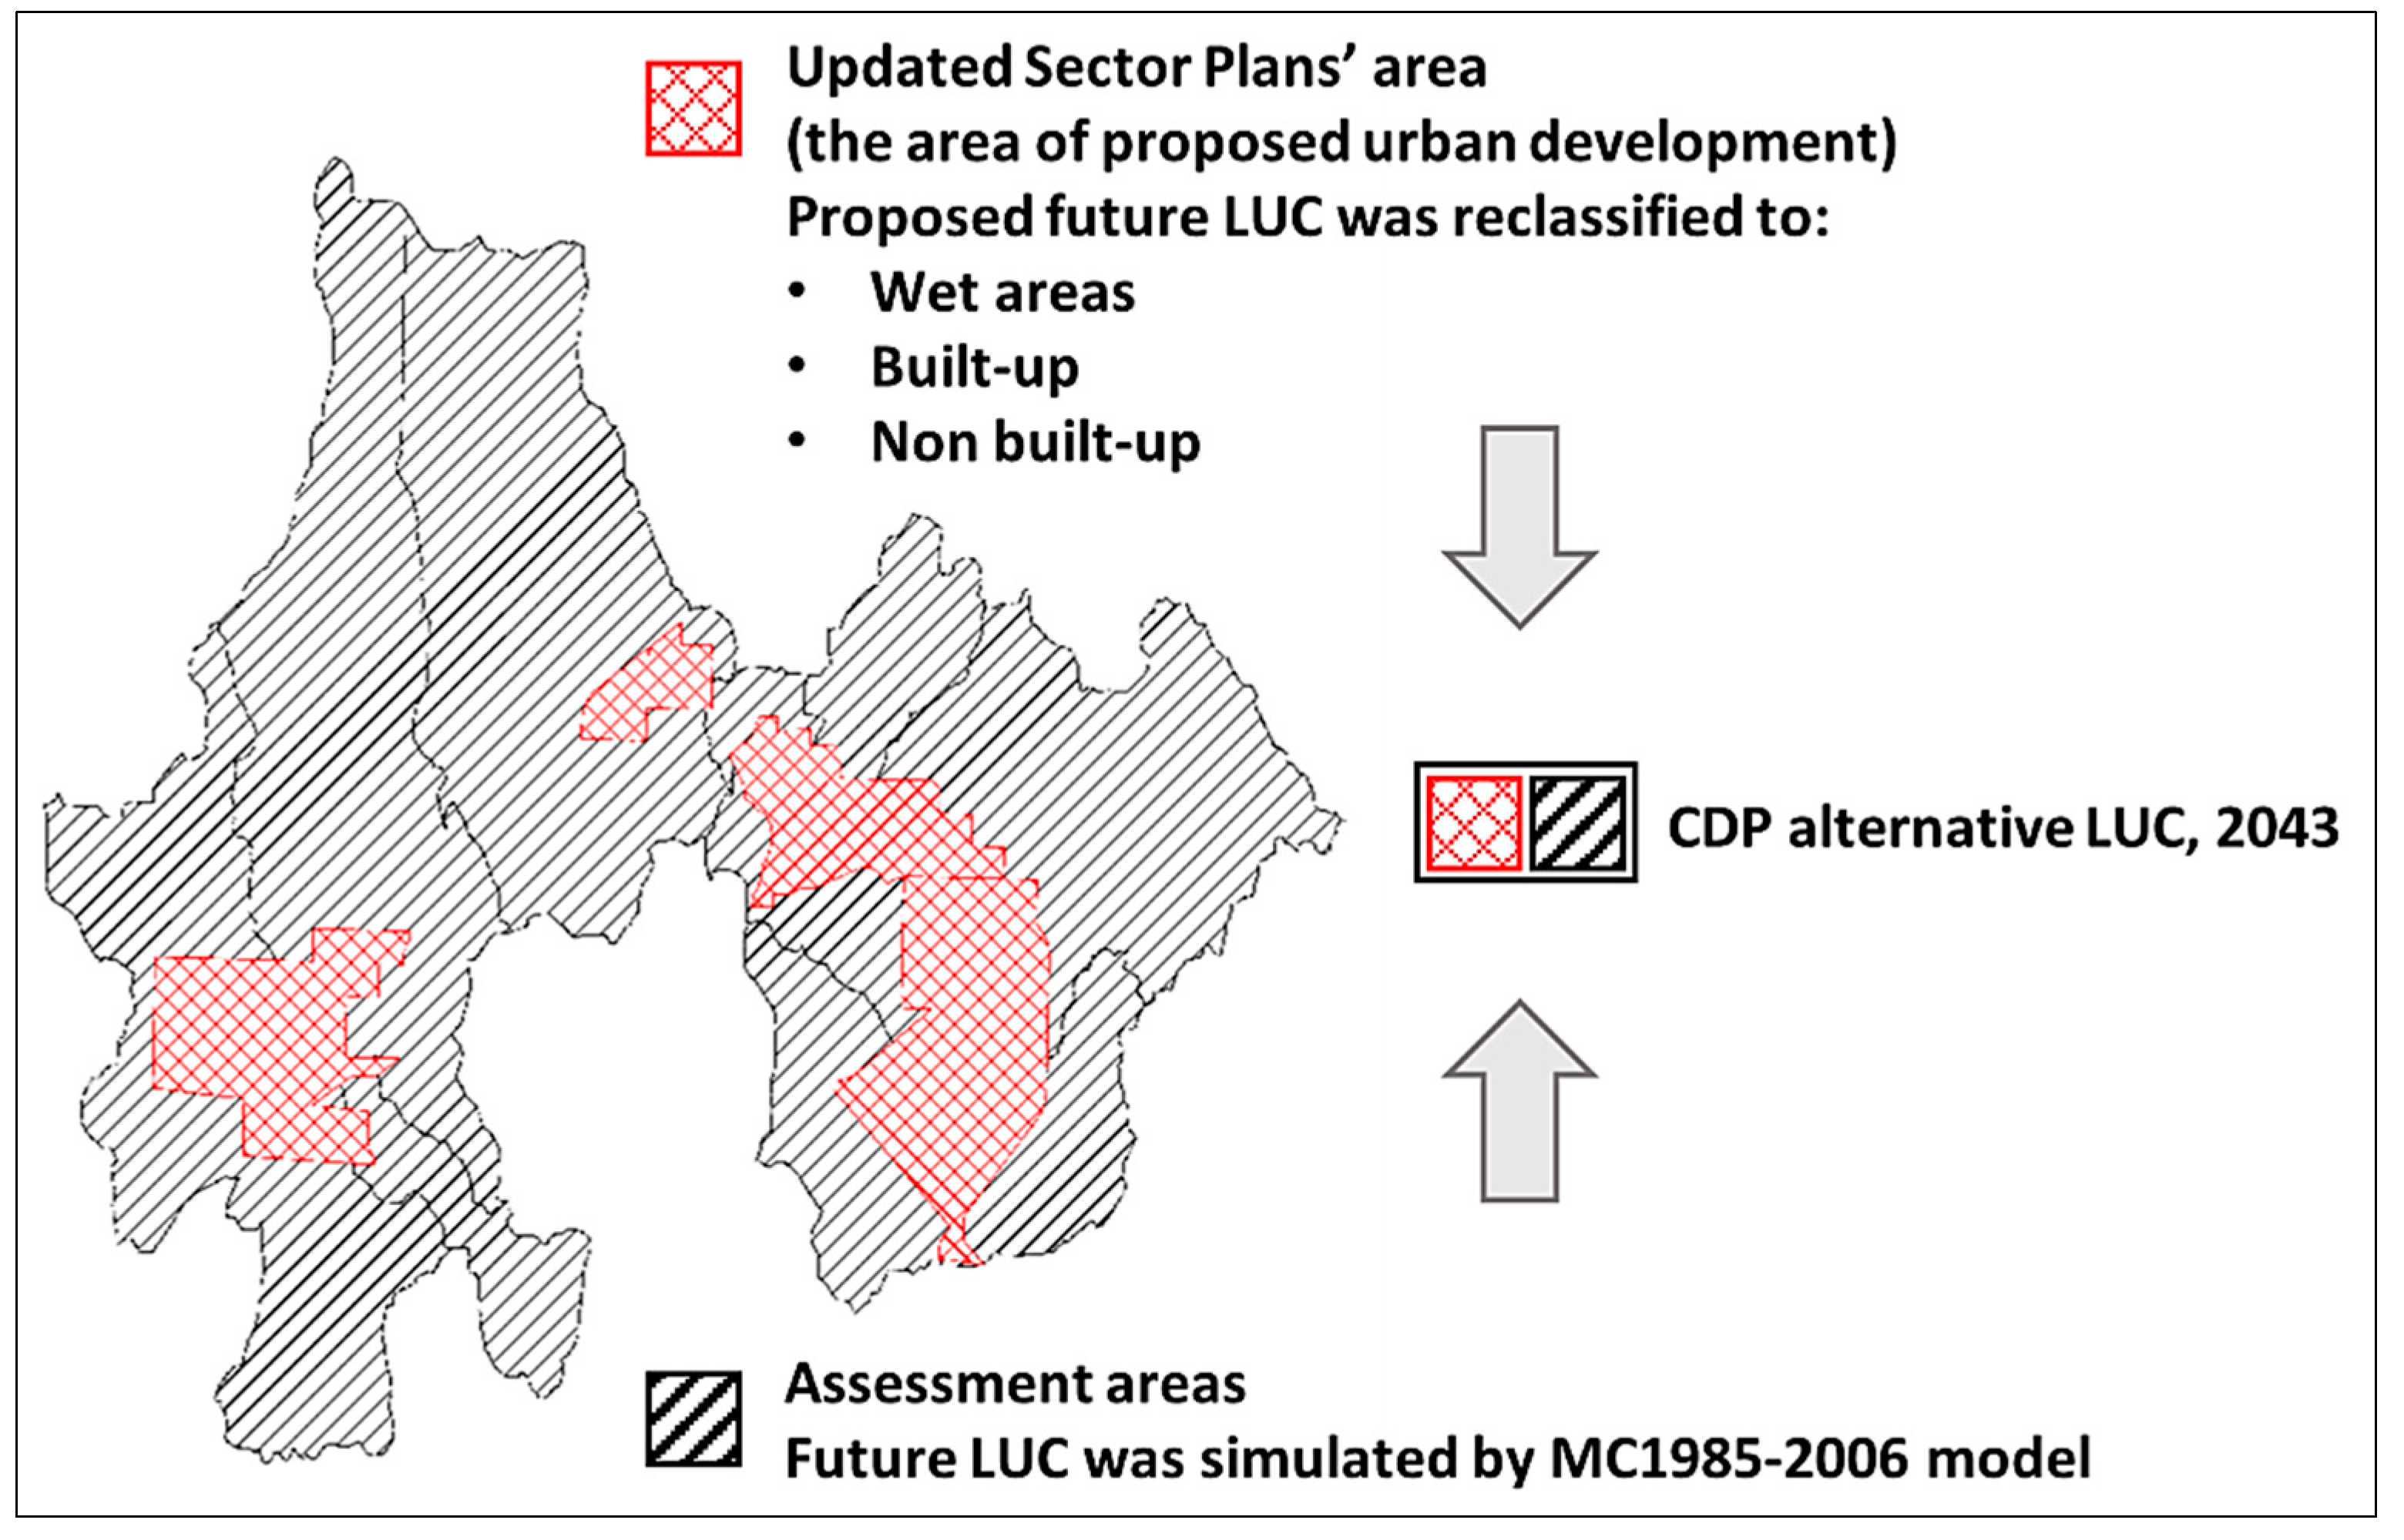
- The current development plans (CDP) alternative, which describes future conditions assuming the City’s development plans and strategy are implemented, using the MC1985–2006 model for the area which lies outside the spatial extent of the proposed Sector Plans of urban development.
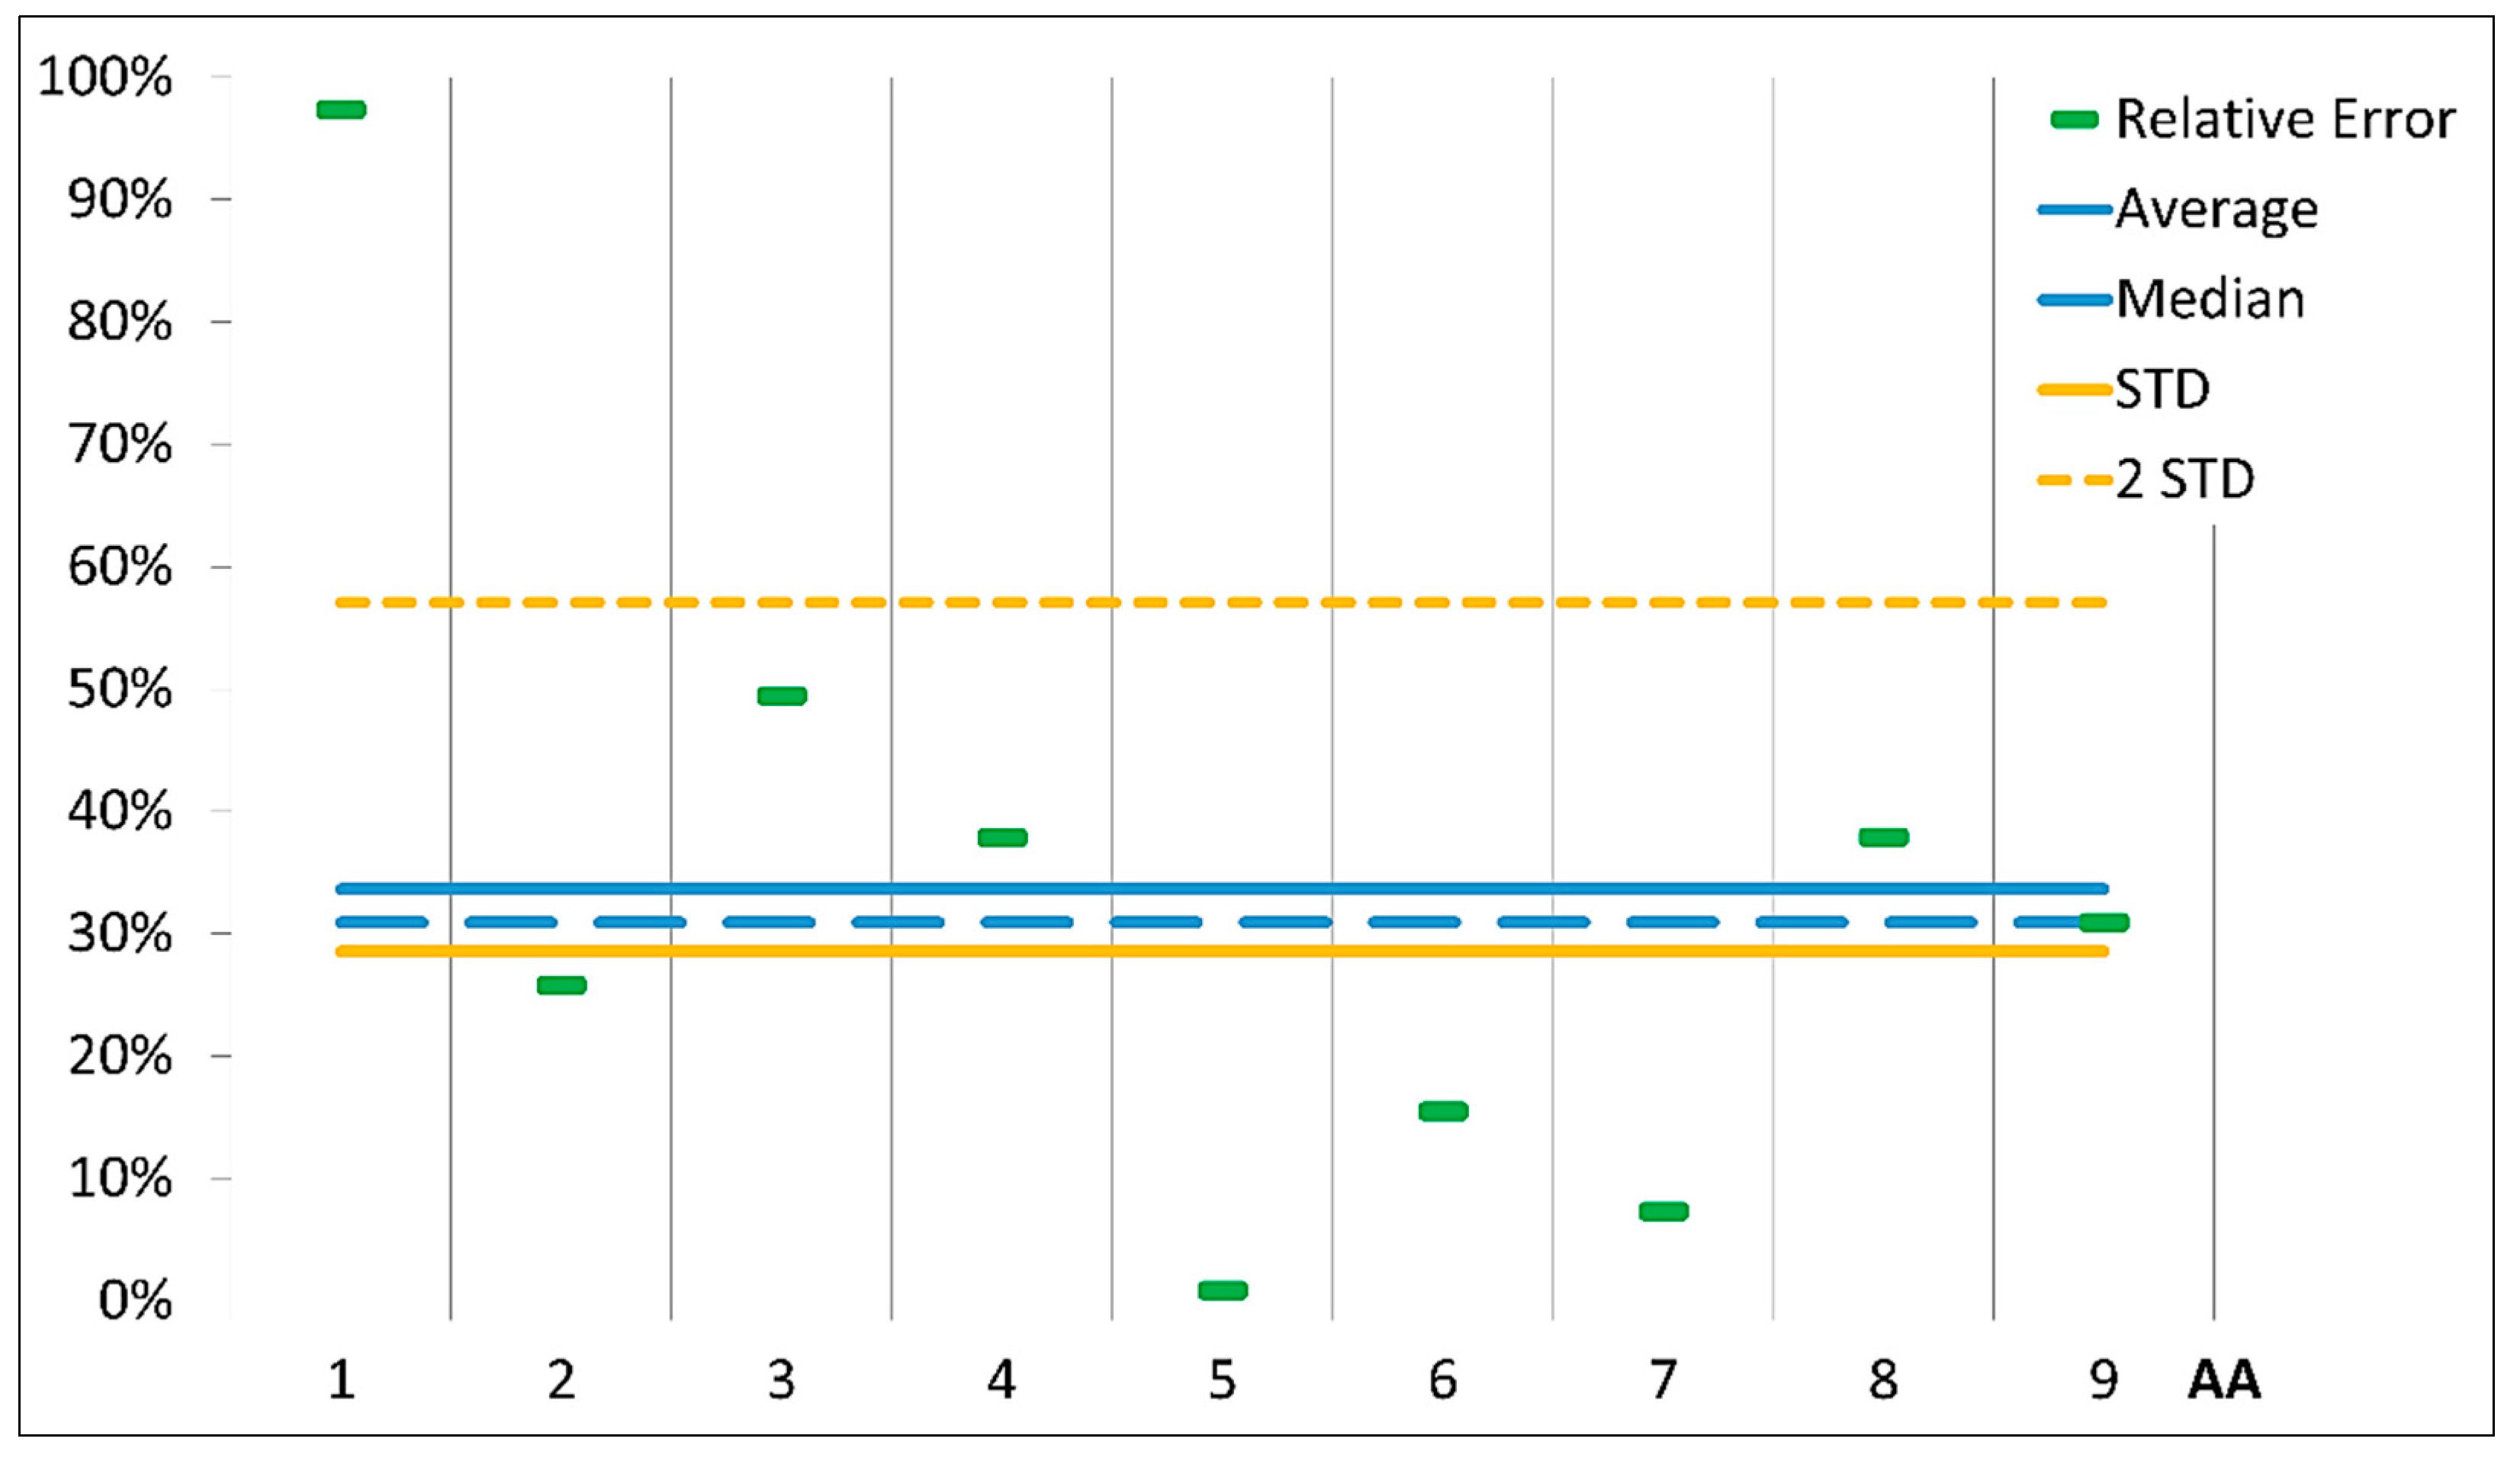
4.4. Quality Assessment of Markov Chain Simulation

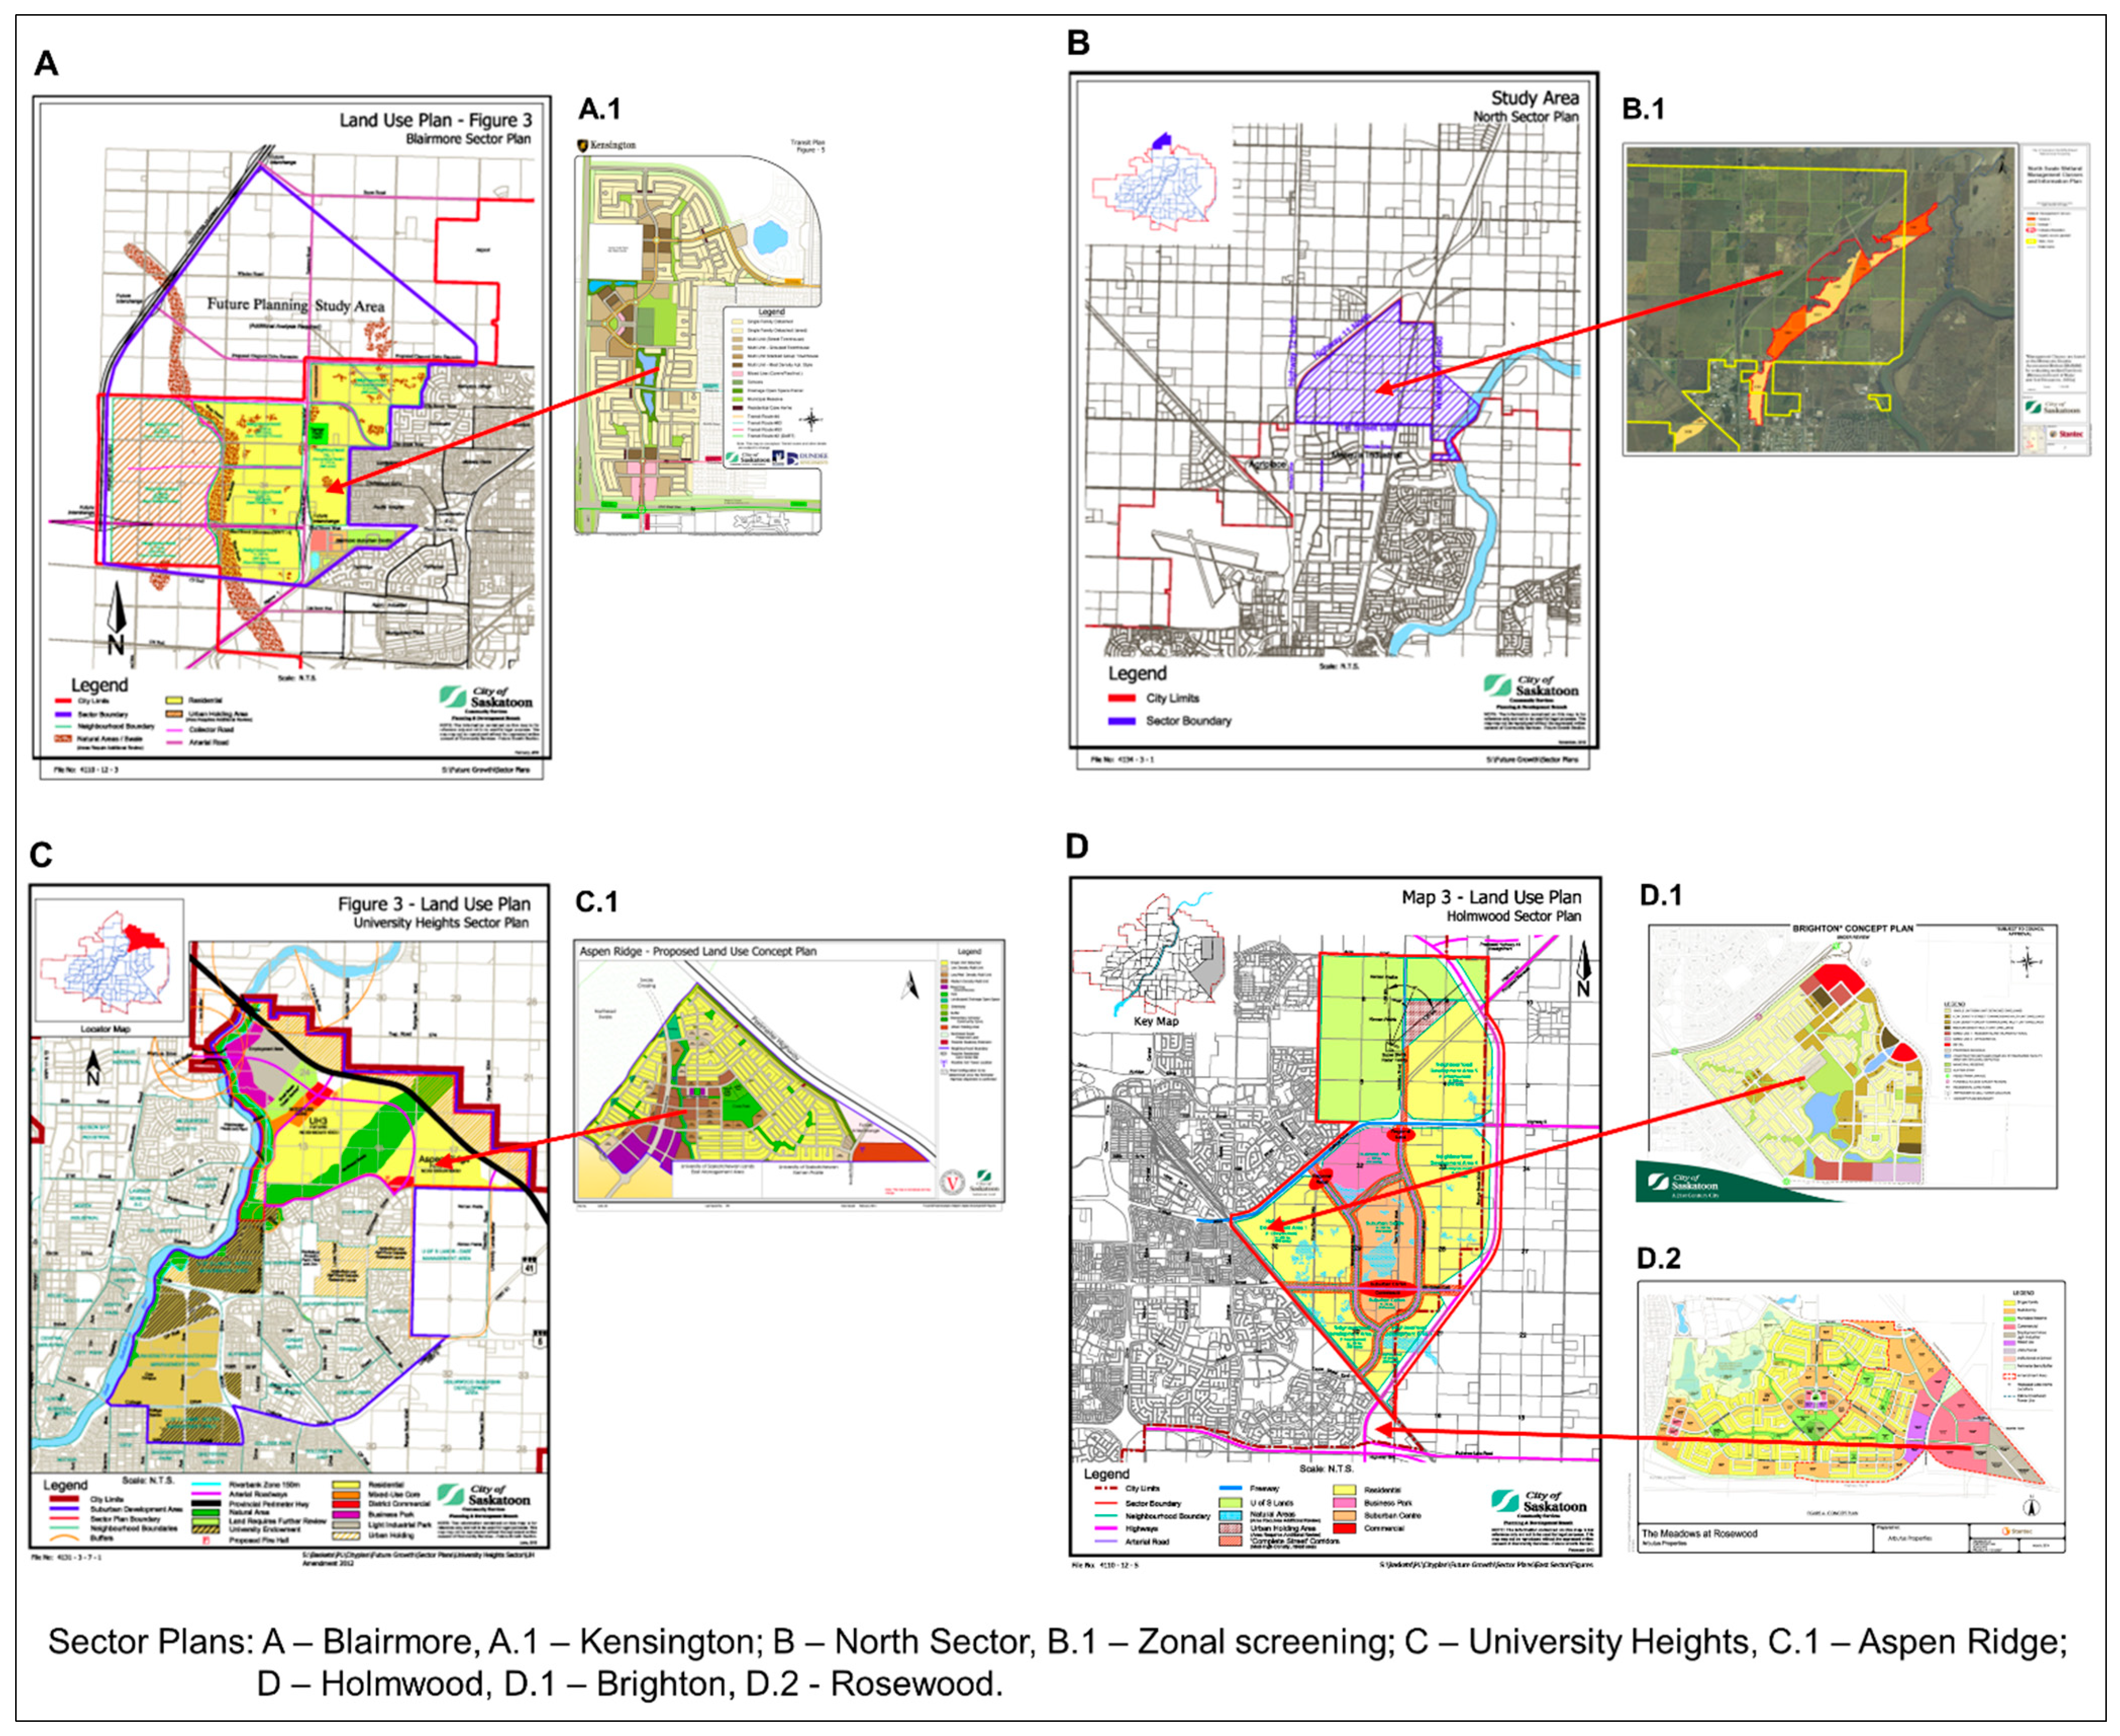
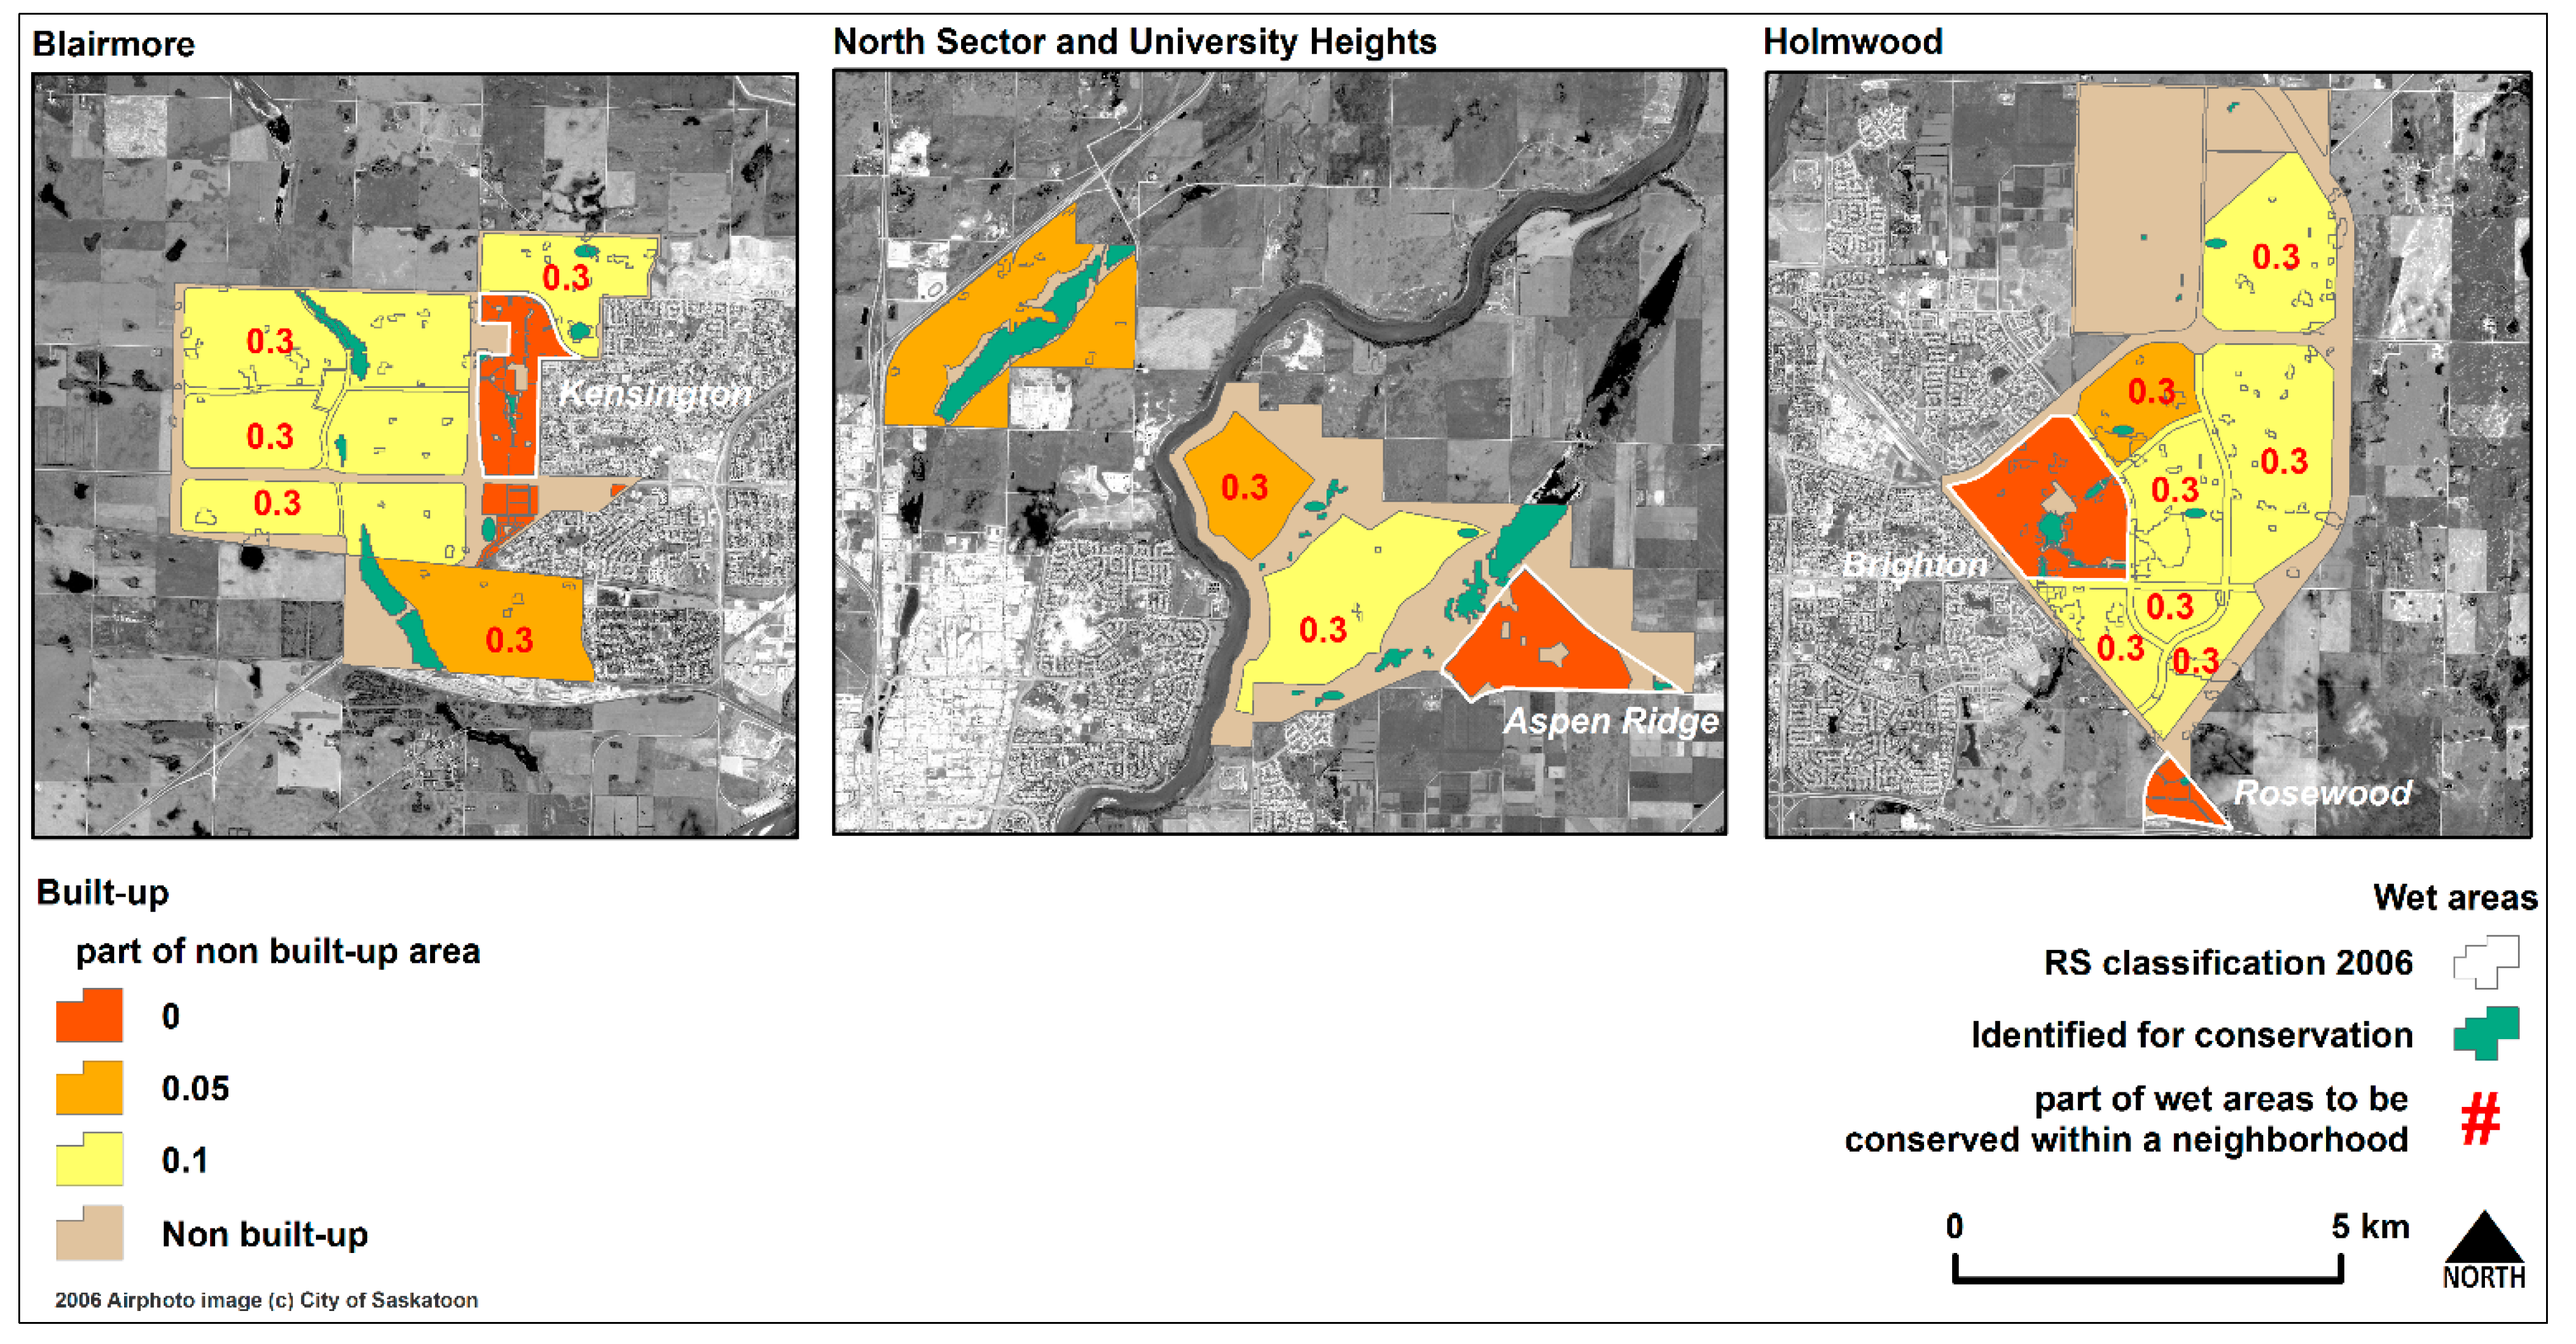
4.5. City Planning and Neighborhood Urban Development Evaluation


- (i)
- In the neighborhoods with detailed plans, open space areas (e.g., parks) were identified as non built-up; constructed wetlands, conserved wetlands with original boundaries, and water/storm ponds were identified as wet areas; all other areas were identified as built-up.
- (i)
- Neighborhood areas without detailed plans were classified as built-up with a variable rate of non built-up: (1) 0% and 5% for non residential and (2) 10% for residential use. The neighborhoods without wet areas that were directly prescribed for conservation (e.g., west and north swale) were identified for conservation of 30% of existing wet areas per neighborhood.
5. Results
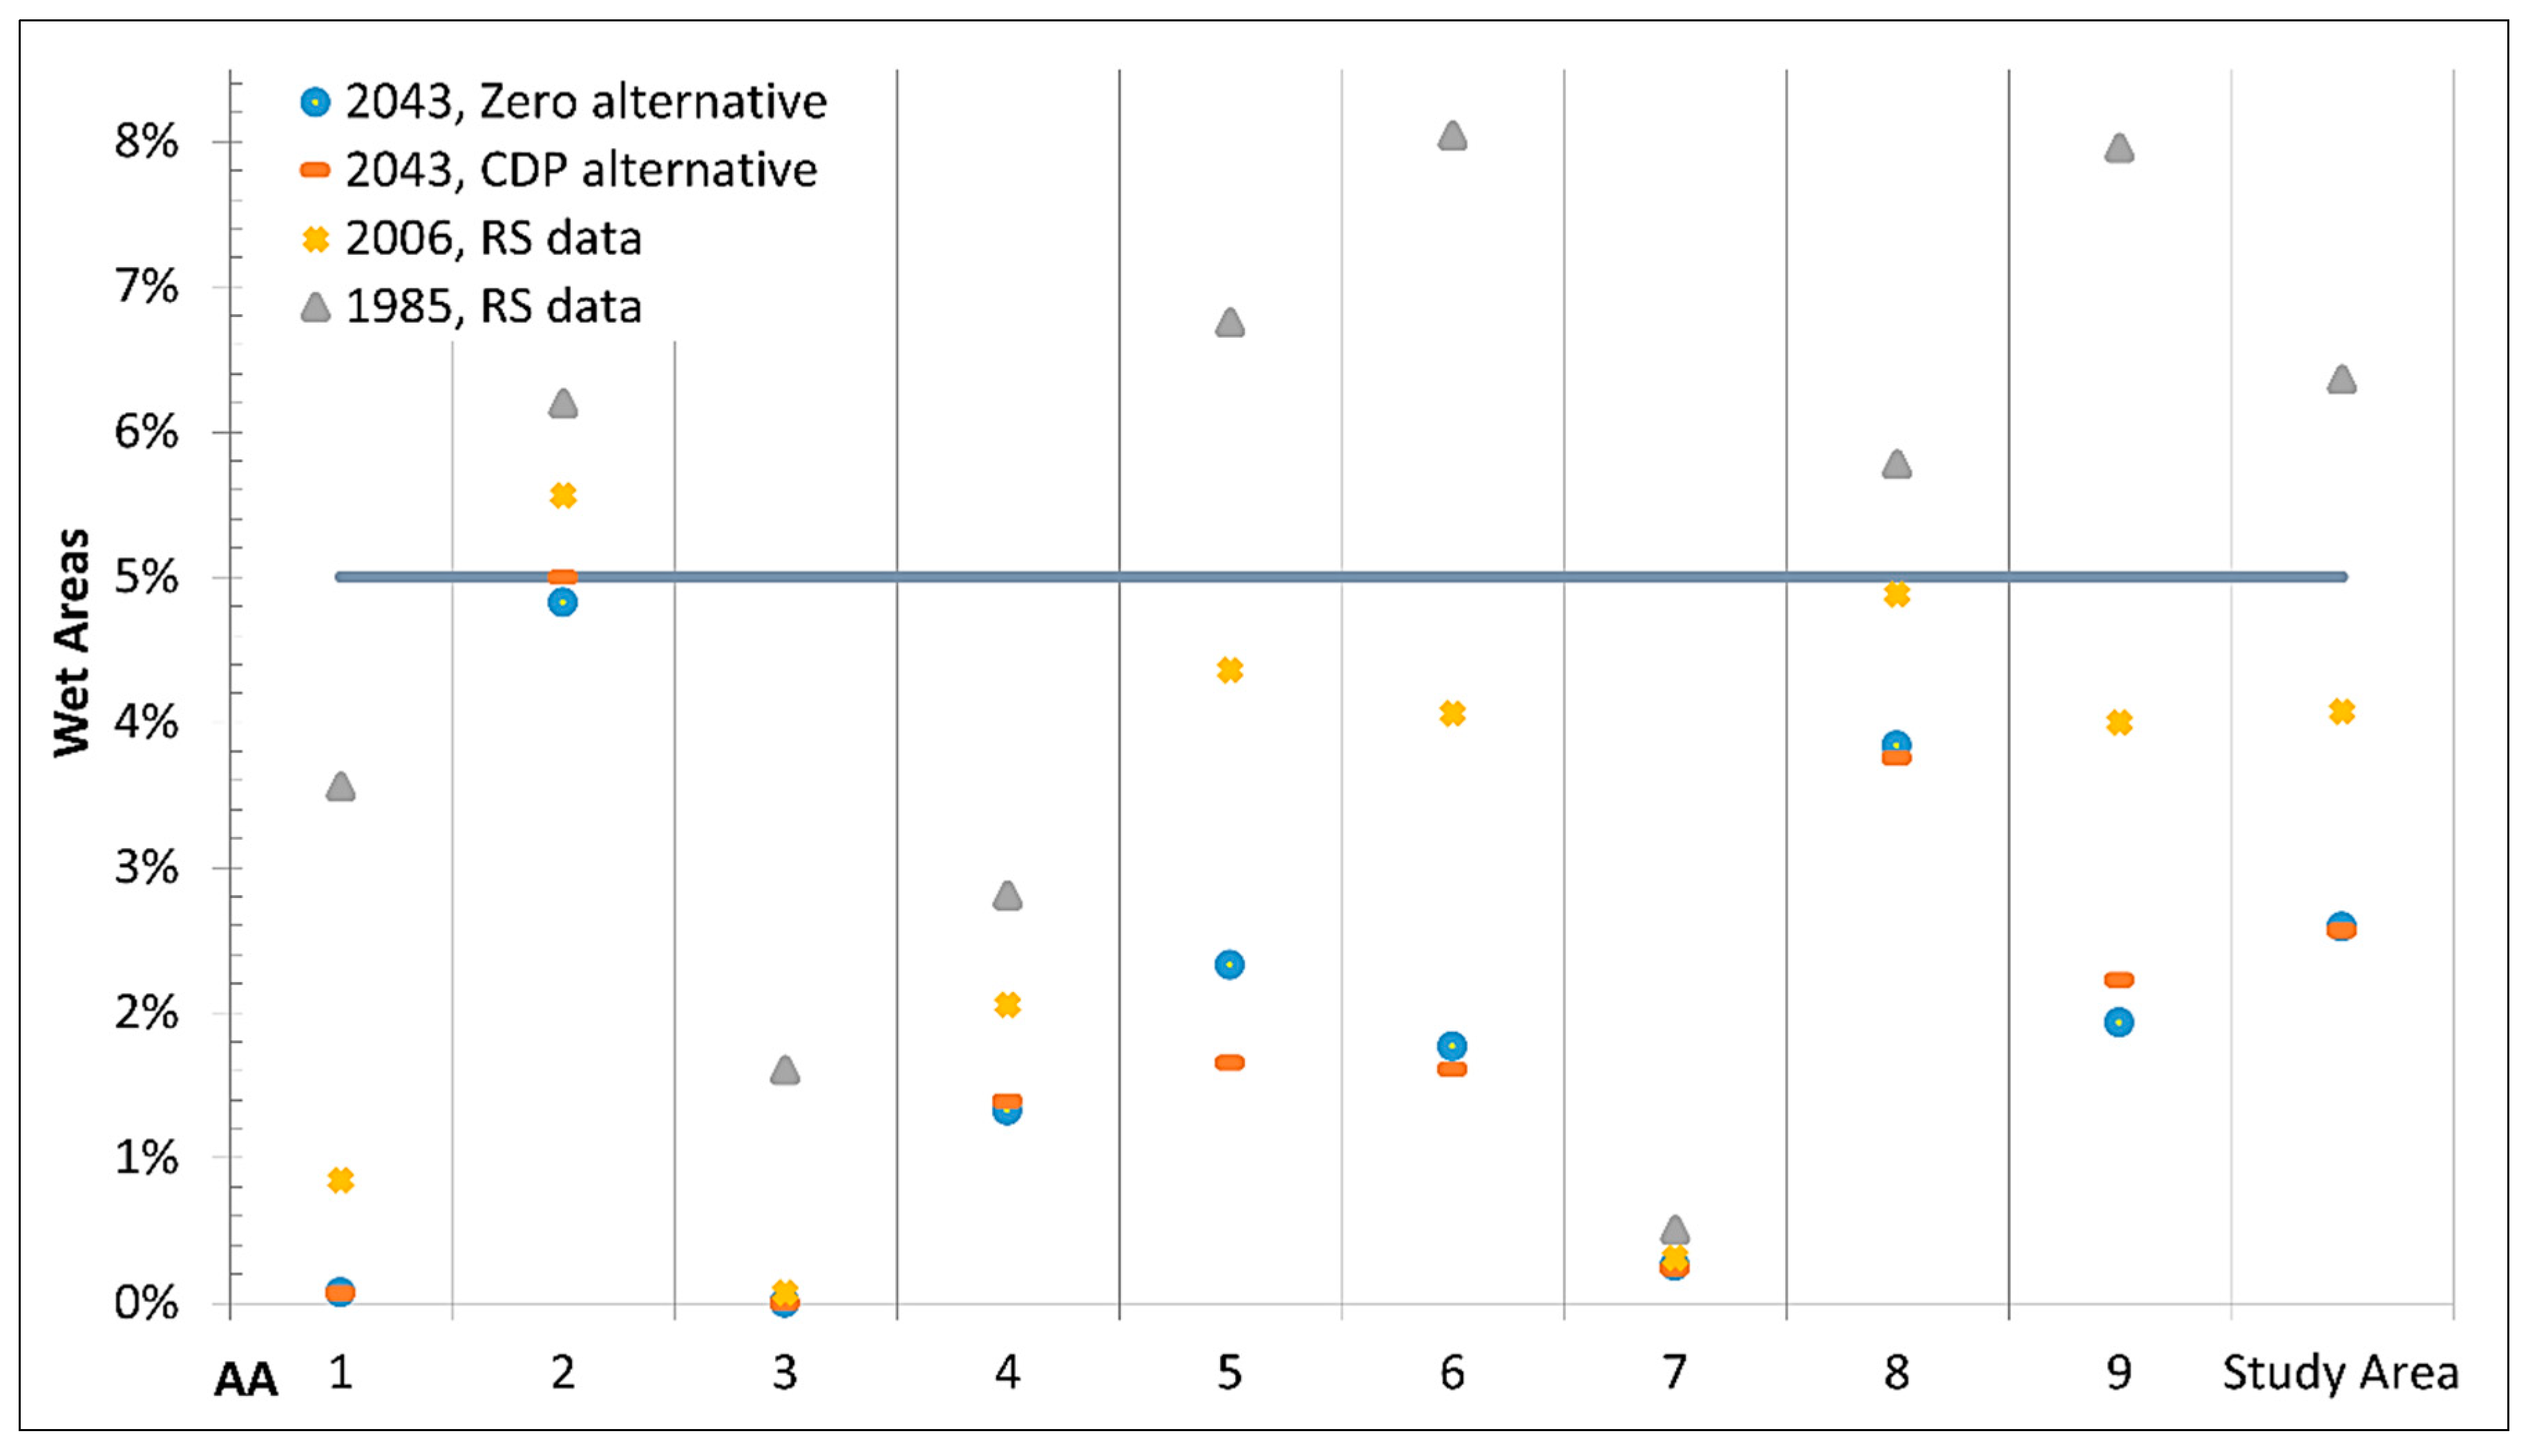
6. Discussion

7. Conclusions
Acknowledgments
Author Contributions
Conflicts of Interest
References
- Bartzen, B.A.; Dufour, K.W.; Clark, R.G.; Caswell, F.D. Trends in agricultural impact and recovery of wetlands in prairie Canada. Ecol. Appl. 2010, 20, 525–538. [Google Scholar] [CrossRef] [PubMed]
- Ehrenfeld, J.G. Evaluating wetlands within an urban context. Ecol. Eng. 2000, 15, 253–265. [Google Scholar] [CrossRef]
- Nielsen, J.; Noble, B.; Hill, M. Wetland assessment and impact mitigation decision support framework for linear development projects: The Louis Riel Trail, Highway 11 North project, Saskatchewan, Canada. Can. Geogr./Le Géographe Can. 2012, 56, 117–139. [Google Scholar] [CrossRef]
- Geneletti, D. Reasons and options for integrating ecosystem services in strategic environmental assessment of spatial planning. Int. J. Biodivers. Sci. Ecosyst. Serv. Manag. 2011, 7, 143–149. [Google Scholar] [CrossRef]
- Chaker, A.; El-Fadl, K.; Chamas, L.; Hatjian, B. A review of strategic environmental assessment in 12 selected countries. Environ. Impact Assess. Rev. 2006, 26, 15–56. [Google Scholar] [CrossRef]
- Thérivel, R. Strategic Environmental Assessment in Action; Earthscan: London, UK, 2004; p. 276. [Google Scholar]
- Bidstrup, M.; Hansen, A.M. The paradox of strategic environmental assessment. Environ. Impact Assess. Rev. 2014, 47, 29–35. [Google Scholar] [CrossRef]
- Gunn, J.; Noble, B. A conceptual basis and methodological framework for regional strategic environmental assessment (R-SEA). Impact Assess. Proj. Apprais. 2009, 27, 258–270. [Google Scholar] [CrossRef]
- Castellani, V.; Sala, S. Sustainability Indicators Integrating Consumption Patterns in Strategic Environmental Assessment for Urban Planning. Sustainability 2013, 5, 3426–3446. [Google Scholar] [CrossRef]
- He, J.; Bao, C.-K.; Shu, T.-F.; Yun, X.-X.; Jiang, D.; Brwon, L. Framework for integration of urban planning, strategic environmental assessment and ecological planning for urban sustainability within the context of China. Environ. Impact Assess. Rev. 2011, 31, 549–560. [Google Scholar] [CrossRef]
- Westbrook, C.J.; Noble, B. Science requisites for cumulative effects assessment for wetlands. Impact Assess. Proj. Apprais. 2013, 31, 318–323. [Google Scholar] [CrossRef]
- Partidário, M.R. Strategic Environmental Assessment Better Practice Guide—Methodological Guidance for Strategic Thinking in SEA; Portuguese Environment Agency and Redes Energéticas Nacionais: Lisbon, Portugal, 2012. [Google Scholar]
- Noble, B. Strategic approaches to regional cumulative effects assessment: A case study of the Great Sand Hills, Canada. Impact Assess. Proj. Apprais. 2008, 26, 78–90. [Google Scholar] [CrossRef]
- Canadian Council of Ministers of the Environment. Regional Strategic Environmental Assessment in Canada: Principles and Guidance; Canadian Council of Ministers of the Environment: Winnipeg, MB, Canada, 2009. [Google Scholar]
- White, L.; Noble, B. Strategic environmental assessment for sustainability: A review of a decade of academic research. Environ. Impact Assess. Rev. 2013, 42, 60–66. [Google Scholar] [CrossRef]
- Geneletti, D. Environmental assessment of spatial plan policies through land use scenarios: A study in a fast-developing town in rural Mozambique. Environ. Impact Assess. Rev. 2012, 32, 1–10. [Google Scholar] [CrossRef]
- Gontier, M. Scale issues in the assessment of ecological impacts using a GIS-based habitat model—A case study for the Stockholm region. Environ. Impact Assess. Rev. 2007, 27, 440–459. [Google Scholar] [CrossRef]
- Bonder, J.; Cherp, A. Quality review package for strategic environmental assessments of land-use plans. Impact Assess. Proj. Apprais. 2000, 18, 99–100. [Google Scholar] [CrossRef]
- The Assessment of the Effects of Certain Plans and Programmes on the Environment. In European Parliament and Council Commission’s Guidance on the implementation of Directive 2001/42/EC; 2003.
- Schmidt, M.; João, E.; Albrecht, E. Implementing Strategic Environmental Assessment; Schmidt, M., João, E., Albrecht, E., Eds.; Springer Berlin: Heidelberg, Germany, 2005; Volume 2, p. 742. [Google Scholar]
- Duinker, P.; Greig, L. Scenario analysis in environmental impact assessment: Improving explorations of the future. Environ. Impact Assess. Rev. 2007, 27, 206–219. [Google Scholar] [CrossRef]
- Peterson, G.D.; Cumming, G.S.; Carpenter, S.R. Scenario Planning: A Tool for Conservation in an Uncertain World. Conserv. Biol. 2003, 17, 358–366. [Google Scholar] [CrossRef]
- Zhu, Z.; Bai, H.; Xu, H.; Zhu, T. An inquiry into the potential of scenario analysis for dealing with uncertainty in strategic environmental assessment in China. Environ. Impact Assess. Rev. 2011, 31, 538–548. [Google Scholar] [CrossRef]
- Sohl, T.; Loveland, T.; Sleeter, B.; Sayler, K.; Barnes, C. Addressing foundational elements of regional land-use change forecasting. Landsc. Ecol. 2010, 25, 233–247. [Google Scholar] [CrossRef]
- Verburg, P.; Schot, P.; Dijst, M.; Veldkamp, A. Land use change modelling: Current practice and research priorities. Geo J. 2004, 61, 309–324. [Google Scholar]
- Bragagnolo, C.; Geneletti, D. Dealing with land use decisions in uncertain contexts: A method to support Strategic Environmental Assessment of spatial plans. J. Environ. Plan. Manag. 2013, 57, 50–77. [Google Scholar] [CrossRef]
- Mozumder, C.; Tripathi, N.K. Geospatial scenario based modelling of urban and agricultural intrusions in Ramsar wetland Deepor Beel in Northeast India using a multi-layer perceptron neural network. Int. J. Appl. Earth Obs. Geoinf. 2014, 32, 92–104. [Google Scholar] [CrossRef]
- Ma, C.; Zhang, G.Y.; Zhang, X.C.; Zhao, Y.J.; Li, H.Y. Application of Markov model in wetland change dynamics in Tianjin Coastal Area, China. Procedia Environ. Sci. 2012, 13, 252–262. [Google Scholar] [CrossRef]
- Noble, B.; Gunn, J.; Martin, J. Survey of current methods and guidance for strategic environmental assessment. Impact Assess. Proj. Apprais. 2012, 30, 1–9. [Google Scholar] [CrossRef]
- Davidson, N.C.; Finlayson, C.M. Earth Observation for wetland inventory, assessment and monitoring. Aquat. Conserv. Mar. Freshw. Ecosyst. 2007, 17, 219–228. [Google Scholar] [CrossRef]
- Mitsch, W.J.; Gosselink, J.G. Wetlands, 4th ed.; John Wiley and Sons: Hoboken, NJ, USA, 2007. [Google Scholar]
- National Wetlands Working Group; Canada Committee on Ecological Land Classification. Wetlands of Canada; Polyscience Publications Inc.: Montreal, QC, Canada, 1988. [Google Scholar]
- Noble, B.; Hill, M.; Nielsen, J. Environmental assessment framework for identifying and mitigating the effects of linear development to wetlands. Landsc. Urban Plan. 2011, 99, 133–140. [Google Scholar] [CrossRef]
- Rubec, C.; Hanson, A. Wetland mitigation and compensation: Canadian experience. Wetl. Ecol. Manag. 2009, 17, 3–14. [Google Scholar] [CrossRef]
- Neuman, A.; Belcher, K. The contribution of carbon-based payments to wetland conservation compensation on agricultural landscapes. Agric. Syst. 2011, 104, 75–81. [Google Scholar] [CrossRef]
- Seitz, N.E.; Westbrook, C.J.; Noble, B. Bringing science into river systems cumulative effects assessment practice. Environ. Impact Assess. Rev. 2011, 31, 172–179. [Google Scholar] [CrossRef]
- Veldkamp, A.; Verburg, P.H. Modelling land use change and environmental impact. J. Environ. Manag. 2004, 72, 1–3. [Google Scholar] [CrossRef]
- Schrojenstein Lantman, J.; Verburg, P.; Bregt, A.; Geertman, S. Core Principles and Concepts in Land-Use Modelling: A Literature Review. In Land-Use Modelling in Planning Practice SE-3; Koomen, E., Borsboom-van Beurden, J., Eds.; GeoJournal Library; Springer: Amsterdam, The Netherlands, 2011. [Google Scholar]
- Zhang, R.; Tang, C.; Ma, S.; Yuan, H.; Gao, L.; Fan, W. Using Markov chains to analyze changes in wetland trends in arid Yinchuan Plain, China. Math. Comput. Model. 2011, 54, 924–930. [Google Scholar] [CrossRef]
- Arsanjani, J.J.; Helbich, M.; Kainz, W.; Boloorani, A.D. Integration of logistic regression, Markov chain and cellular automata models to simulate urban expansion. Int. J. Appl. Earth Obs. Geoinf. 2013, 21, 265–275. [Google Scholar] [CrossRef]
- Huel, D. Managing Saskatchewan Wetlands—A Landowner’s Guide; Saskatchewan Wetland Conservation Corporation: Regina, SK, Canada, 2000. [Google Scholar]
- City of Saskatoon Population Estimate & Projection. Available online: http://www.saskatoon.ca/departments/communityservices/planningdevelopment/futuregrowth/demographicandhousingdata/Pages/PopulationEstimateProjection.aspx (accessed on 26 July 2014).
- City of Saskatoon. City of Saskatoon Municipal Manual 2011; City of Saskatoon: Saskatoon, SK, Canada, 2011. [Google Scholar]
- Statistics Canada; Census of Canada. Saskatchewan Population Report; Saskatchewan Bureau of Statistic, Ministry of Finance: Regina, SK, Canada, 2011.
- City of Saskatoon. City of Saskatoon Future Growth Study 2000; City of Saskatoon: Saskatoon, SK, Canada, 2000. [Google Scholar]
- City of Saskatoon. City of Saskatoon City of Saskatoon & Saskatoon Census Metropolitan Area Population Projection 2012–2032; City of Saskatoon: Saskatoon, SK, Canada, 2013. [Google Scholar]
- City of Saskatoon. City of Saskatoon The Official Community Plan Bylaw; No. 8769; City of Saskatoon: Saskatoon, SK, Canada, 2009. [Google Scholar]
- City of Saskatoon Sector Planning. Available online: http://www.saskatoon.ca/departments/Community Services/PlanningDevelopment/FutureGrowth/Sector Planning/Pages/default.aspx (accessed on 21 April 2014).
- Sizo, A.; Noble, B.; Bell, S. Strategic environmental assessment framework for landscape-based, temporal analysis of wetland change in urban environments. Environ. Manag. 2015. submitted. [Google Scholar]
- Duinker, P.; Greig, L. The impotence of cumulative effects assessment in Canada: Ailments and ideas for redeployment. Environ. Manag. 2006, 37, 153–161. [Google Scholar] [CrossRef]
- Committee on Mitigating Wetland Losses; Board on Environmental Studies and Toxicology; Water Science and Technology Board; National Research Council. Compensating for Wetland Losses Under the Clean Water Act; The National Academy Press: Washington, DC, USA, 2001; p. 322. [Google Scholar]
- Fischer, T.B. The Theory and Practice of Strategic Environmental Assessment: Towards a More Systematic Approach; Earthscan: London, UK, 2007. [Google Scholar]
- Thérivel, R.; Caratti, P.; Partidário, M.R.; Theodórsdóttir, Á.H.; Tyldesley, D. Writing strategic environmental assessment guidance. Impact Assess. Proj. Apprais. 2004, 22, 259–270. [Google Scholar] [CrossRef]
- Wright, F. Consideration of the baseline environment in examples of voluntary SEAs from Scotland. Environ. Impact Assess. Rev. 2007, 27, 424–439. [Google Scholar] [CrossRef]
- Ramsar Convention Secretariat. Impact Assessment: Guidelines on Biodiversity-Inclusive Environmental Impact Assessment and Strategic Environmental Assessment, 4th ed.; Ramsar Convention Secretariat: Gland, Switzerland, 2010; Volume 16, p. 67. [Google Scholar]
- Privy Council Office; Government of Canada. The cabinet Directive on the Environment Assessment of Policy, Plan and Program Proposals 2010; Canadian Environmental Assessment Agency: Ottawa, ON, Canada, 2010. [Google Scholar]
- Gala, T.S.; Melesse, A.M. Monitoring prairie wet area with an integrated LANDSAT ETM+, RADARSAT-1 SAR and ancillary data from LIDAR. CATENA 2012, 95, 12–23. [Google Scholar] [CrossRef]
- MacGregor-Fors, I. Misconceptions or misunderstandings? On the standardization of basic terms and definitions in urban ecology. Landsc. Urban Plan. 2011, 100, 347–349. [Google Scholar] [CrossRef]
- USGS. Product Guide: Landsat 4–7 Climate Data Record (CDR) Surface Reflectance 2014; USGS: Reston, VA, USA, 2014. [Google Scholar]
- Dahl, T.E.; Watmough, M.D. Current approaches to wetland status and trends monitoring in prairie Canada and the continental United States of America. Can. J. Remote Sens. 2007, 33, S17–S27. [Google Scholar] [CrossRef]
- Rebonato, R.; Jackel, P. The most general methodology to create a valid correlation matrix for risk management and option pricing purposes. J. Risk 2000, 2, 17–28. [Google Scholar]
- Chun, K.P.; Wheater, H.S. An extreme analysis for the 2010 precipitation event at the South of Saskatchewan Prairie. Glob. NEST J. 2012, 14, 311–324. [Google Scholar]
- Mitsch, W.J.; Gosselink, J.G. The value of wetlands: Importance of scale and landscape setting. Ecol. Econ. 2000, 35, 25–33. [Google Scholar] [CrossRef]
- Kristensen, S.; Noble, B.; Patrick, R.J. Capacity for Watershed Cumulative Effects Assessment and Management: Lessons from the Lower Fraser River Basin, Canada. Environ. Manag. 2013, 52, 360–373. [Google Scholar] [CrossRef]
- González, A.; Gilmer, A.; Foley, R.; Sweeney, J.; Fry, J. Applying geographic information systems to support strategic environmental assessment: Opportunities and limitations in the context of Irish land-use plans. Environ. Impact Assess. Rev. 2011, 31, 368–381. [Google Scholar] [CrossRef]
- João, E. A research agenda for data and scale issues in Strategic Environmental Assessment (SEA). Environ. Impact Assess. Rev. 2007, 27, 479–491. [Google Scholar] [CrossRef]
- MacDonald, L.H. Evaluating and Managing Cumulative Effects: Process and Constraints. Environ. Manag. 2000, 26, 299–315. [Google Scholar] [CrossRef]
- Winston, W.L. Operations Research: Applications and Algorithms, 3rd ed.; Wadsworth Publishing Company: Belmont, CA, USA, 1997. [Google Scholar]
© 2015 by the authors; licensee MDPI, Basel, Switzerland. This article is an open access article distributed under the terms and conditions of the Creative Commons Attribution license (http://creativecommons.org/licenses/by/4.0/).
Share and Cite
Sizo, A.; Noble, B.; Bell, S. Futures Analysis of Urban Land Use and Wetland Change in Saskatoon, Canada: An Application in Strategic Environmental Assessment. Sustainability 2015, 7, 811-830. https://doi.org/10.3390/su7010811
Sizo A, Noble B, Bell S. Futures Analysis of Urban Land Use and Wetland Change in Saskatoon, Canada: An Application in Strategic Environmental Assessment. Sustainability. 2015; 7(1):811-830. https://doi.org/10.3390/su7010811
Chicago/Turabian StyleSizo, Anton, Bram Noble, and Scott Bell. 2015. "Futures Analysis of Urban Land Use and Wetland Change in Saskatoon, Canada: An Application in Strategic Environmental Assessment" Sustainability 7, no. 1: 811-830. https://doi.org/10.3390/su7010811
APA StyleSizo, A., Noble, B., & Bell, S. (2015). Futures Analysis of Urban Land Use and Wetland Change in Saskatoon, Canada: An Application in Strategic Environmental Assessment. Sustainability, 7(1), 811-830. https://doi.org/10.3390/su7010811