Assessing Regional Sustainability Using a Model of Coordinated Development Index: A Case Study of Mainland China

Abstract
:1. Introduction
2. Literature Review
3. Material and Methods

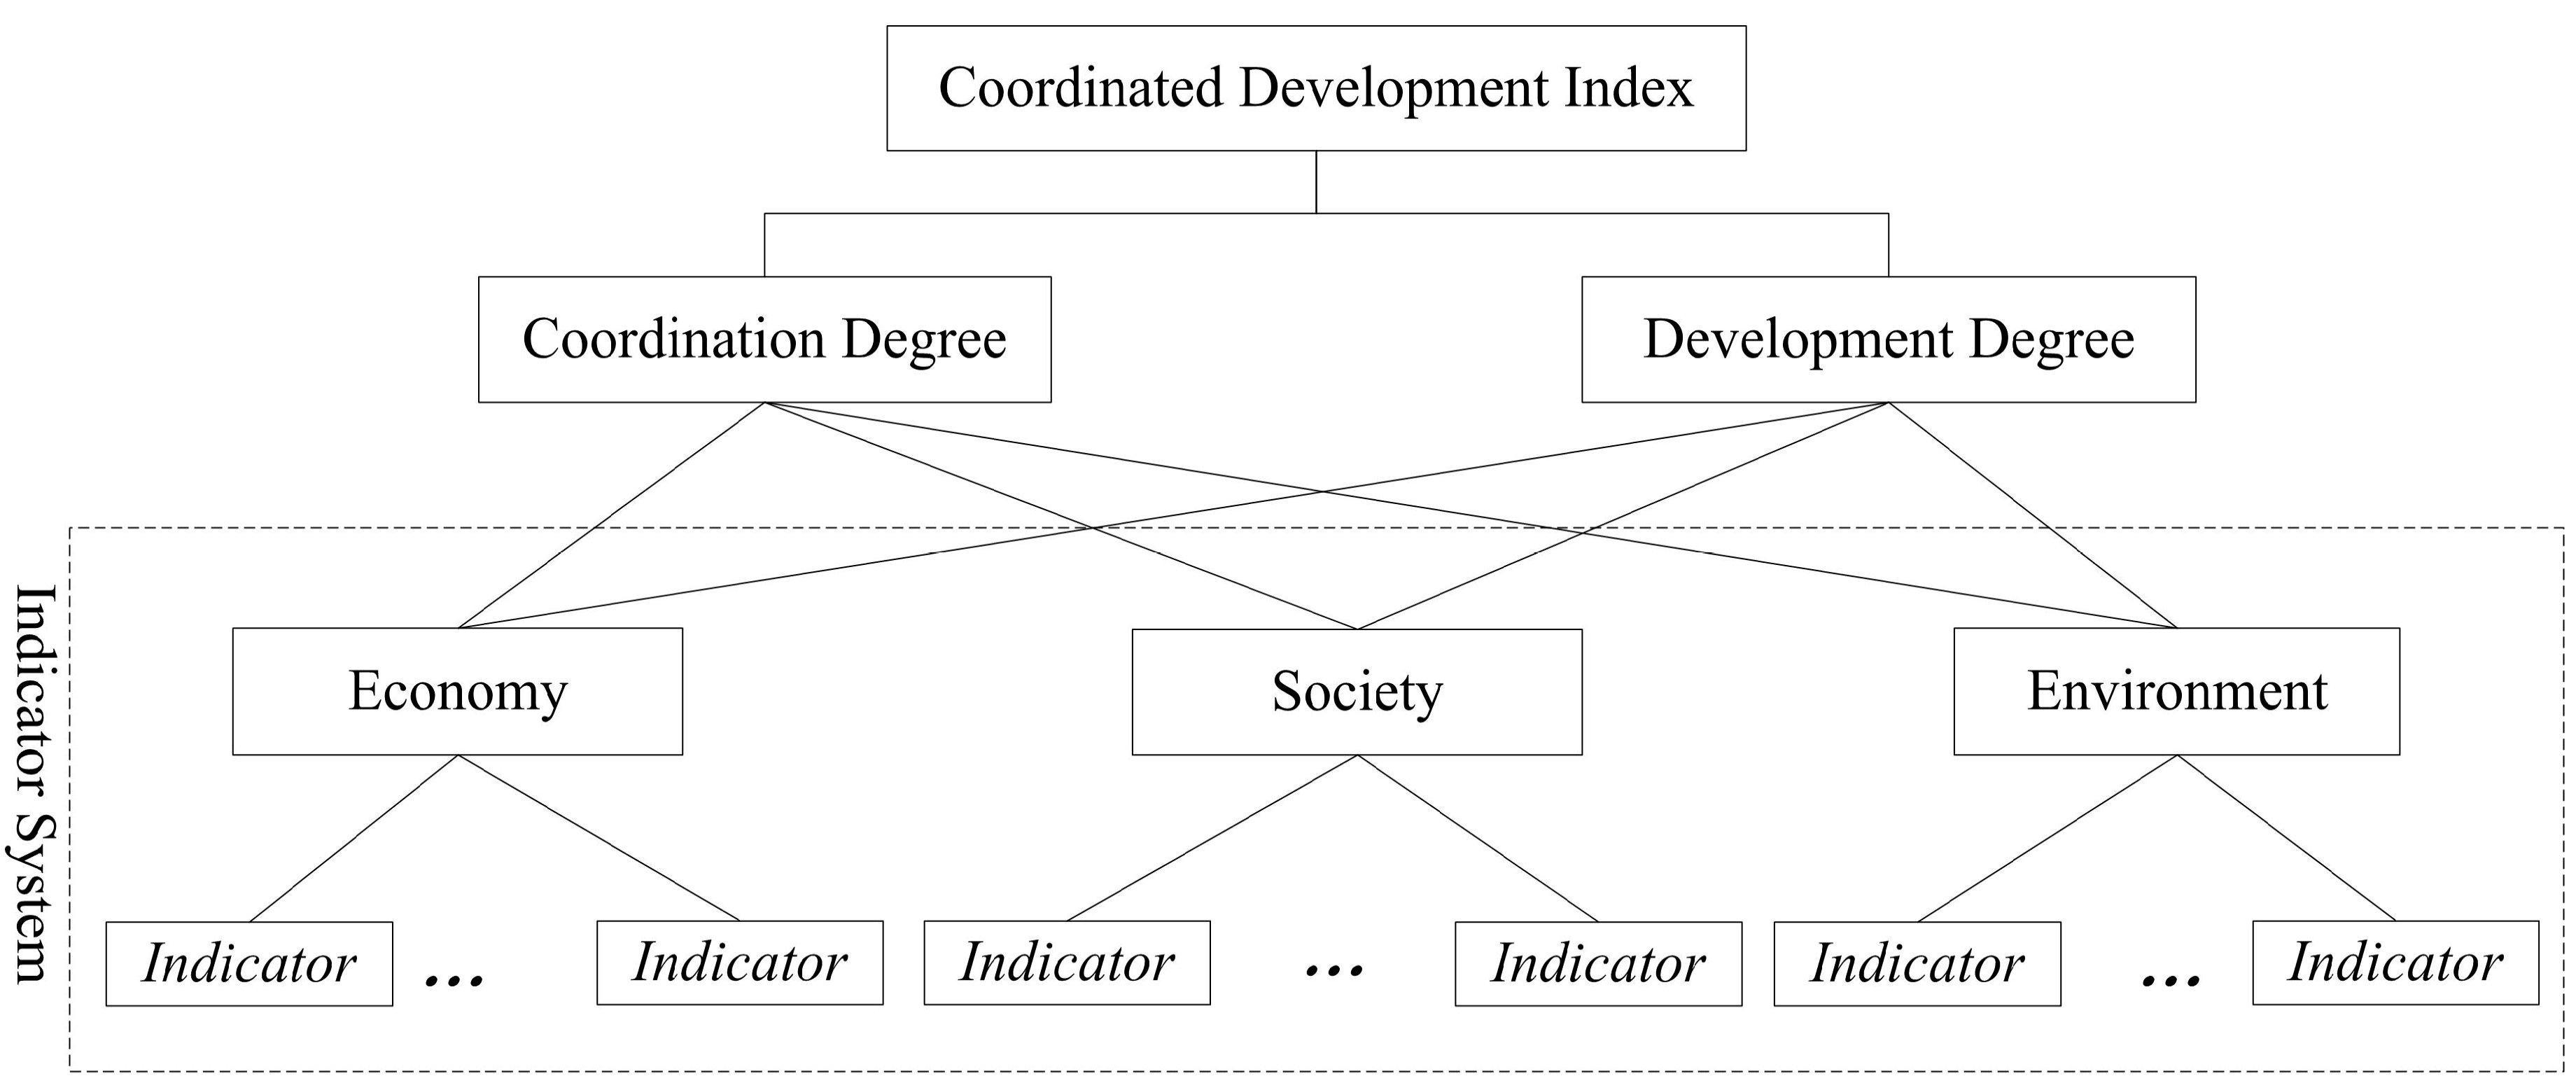
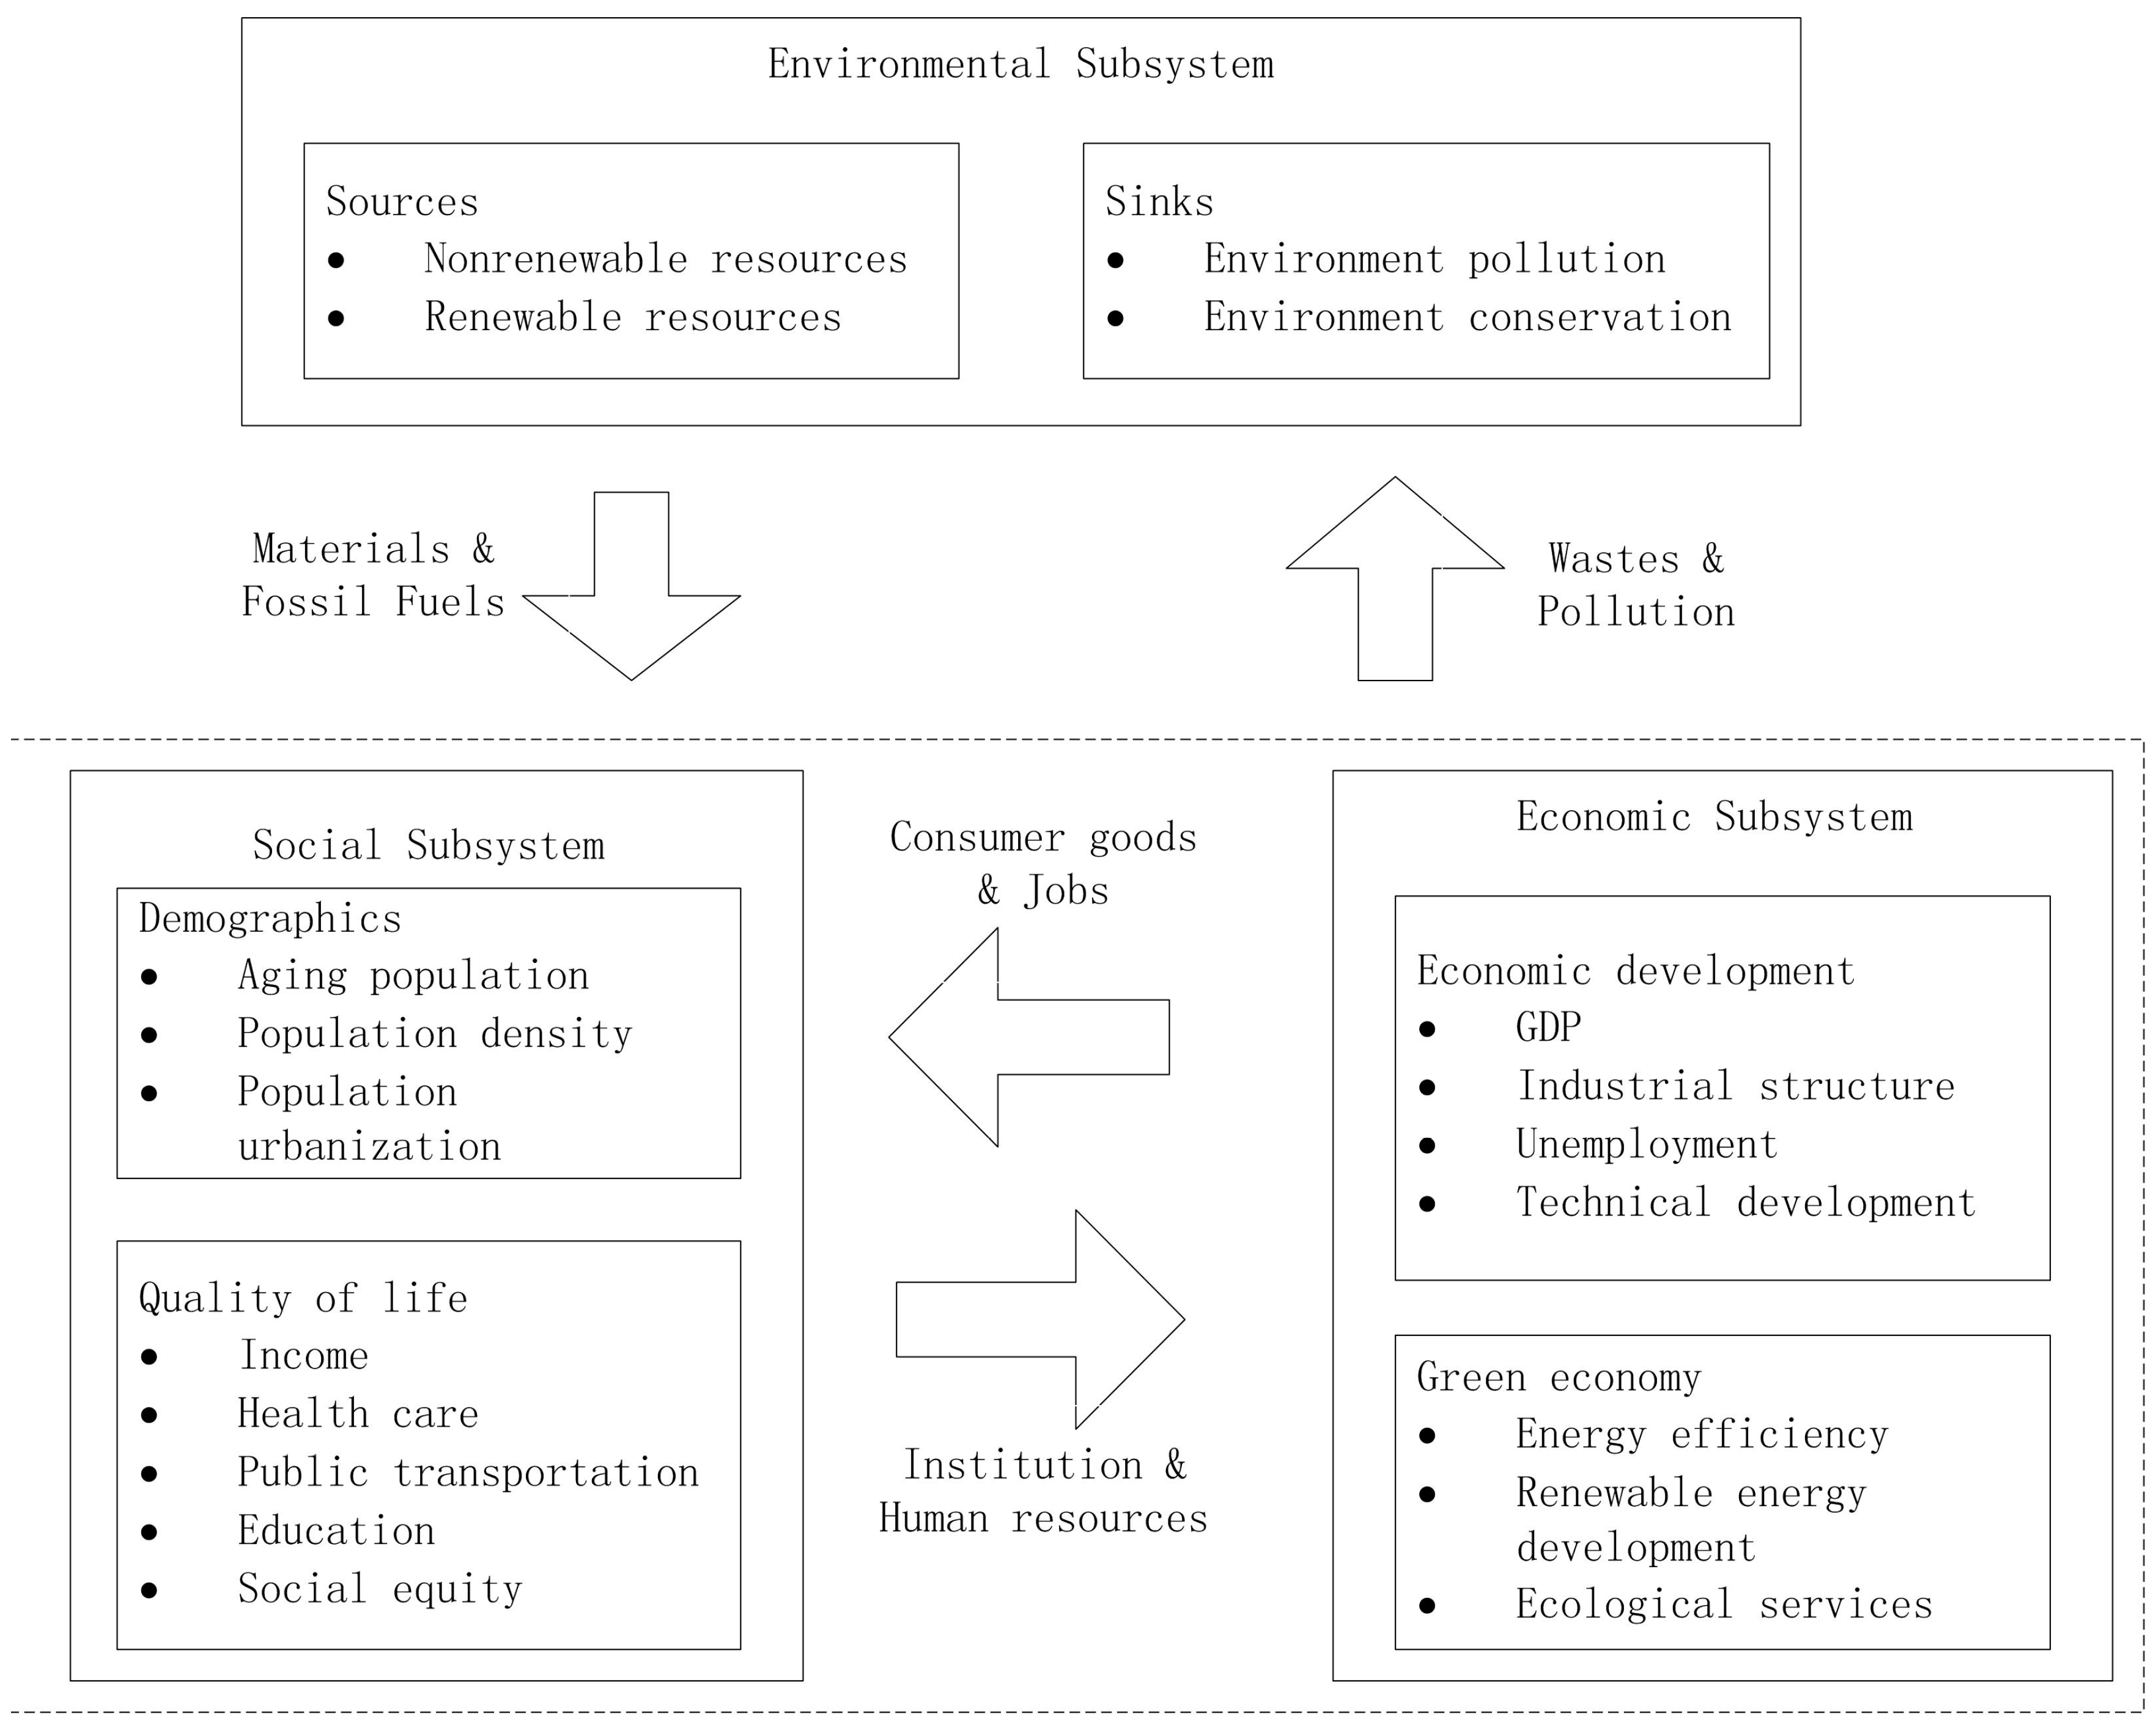
3.1. The Indicator System of Coordinated Development for Regional Sustainability in Mainland China


| Subsystem | Aspect | Indicator | Units |
|---|---|---|---|
| Environment | Sources | x1. Per-capita water resource | m3 |
| x2. Per-capita arable land area | hm2 | ||
| x3. Forest coverage | % | ||
| Sinks | x4. PM10 | mg/stere | |
| x5. Proportion of sandy land to national total area | % | ||
| x6. Ratio of industrial solid waste utilized | % | ||
| x7. Waste gas removal rate | % | ||
| x8. Proportion of industrial waste water meeting discharge standards in total volume | % | ||
| Society | Demographics | x9. Number of people per hectare | people/hectare |
| x10. Ratio of urban population with access | % | ||
| Quality of life | x11. Engel coefficient | % | |
| x12. Number of beds in health care institutions per 10,000 people | beds/10,000 people | ||
| x13. Number of public transportation vehicles per 10,000 capita | vehicles/10,000 people | ||
| x14. People with college degrees per 10,000 inhabitants | per 10,000 people | ||
| x15. Ratio between the income of urban households and the income of rural housholds | % | ||
| Economy | Economic development | x16. Gross domestic product (GDP) per capita | Yuan |
| x17. Proportion of tertiary Industry in GDP | % | ||
| x18. Urban unemployed rate | % | ||
| x19. Proportion of Expenditure on R&D in GDP | % | ||
| Green economy | x20. Energy Consumption per 10,000 yuan of GDP | tce/10,000 yuan |
3.2. Data Normalization
3.3. Evaluation of the Subsystems
3.4. The Coordination Development Index Model (CDI)
3.4.1. The Coordination Degree
3.4.2. The Development Degree
4. Assessment of Regional Sustainability in Mainland China
| Subsystem | Weight of subsystem | Indicator | Weight of Indicator |
|---|---|---|---|
| Environment | 0.435 | x1. Per-capita water resource | 0.309 |
| x2. Per-capita arable land area | 0.123 | ||
| x3. Forest coverage | 0.196 | ||
| x4. PM10 | 0.040 | ||
| x5. Proportion of sandy land to national total area | 0.081 | ||
| x6. Ratio of Industrial solid waste utilized | 0.107 | ||
| x7. Waste gas removal rate | 0.062 | ||
| x8. Proportion of industrial waste water meeting discharge standards in total volume | 0.082 | ||
| Society | 0.248 | x9. Number of people per hectare | 0.101 |
| x10. Ratio of urban population with access | 0.122 | ||
| x11. Engel coefficient | 0.122 | ||
| x12. Number of beds in health care institutions per 10,000 people | 0.251 | ||
| x13. Number of public transportation vehicles per 10,000 capita | 0.189 | ||
| x14. People with college degrees per 10,000 inhabitants | 0.098 | ||
| x15. Ratio between the income of urban households and the income of rural households | 0.117 | ||
| Economy | 0.316 | x16. Gross domestic product (GDP) per capita | 0.186 |
| x17. Proportion of tertiary Industry in GDP | 0.136 | ||
| x18. Urban unemployed rate | 0.024 | ||
| x19. Proportion of Expenditure on R&D in GDP | 0.604 | ||
| x20. Energy Consumption per 10,000 yuan of GDP | 0.050 |
5. Results and Discussion
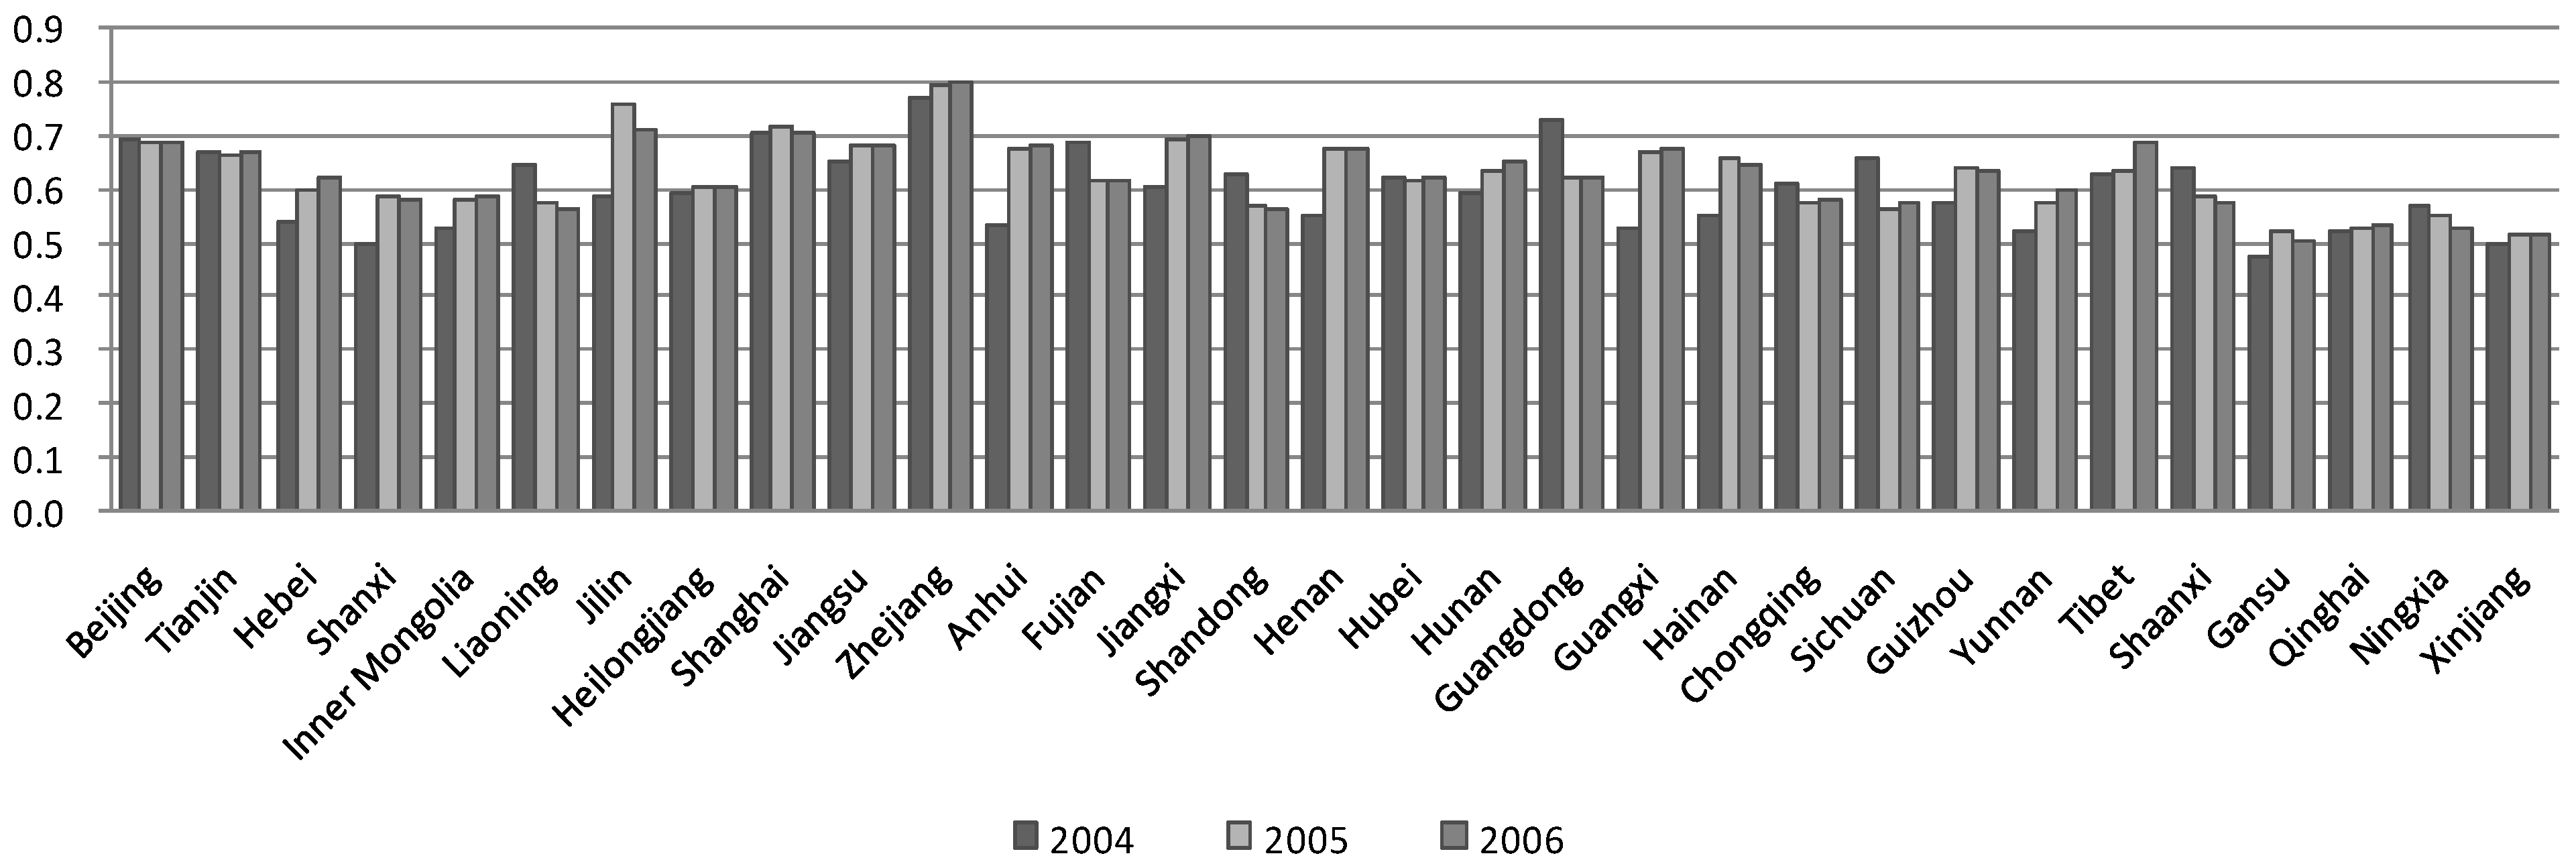
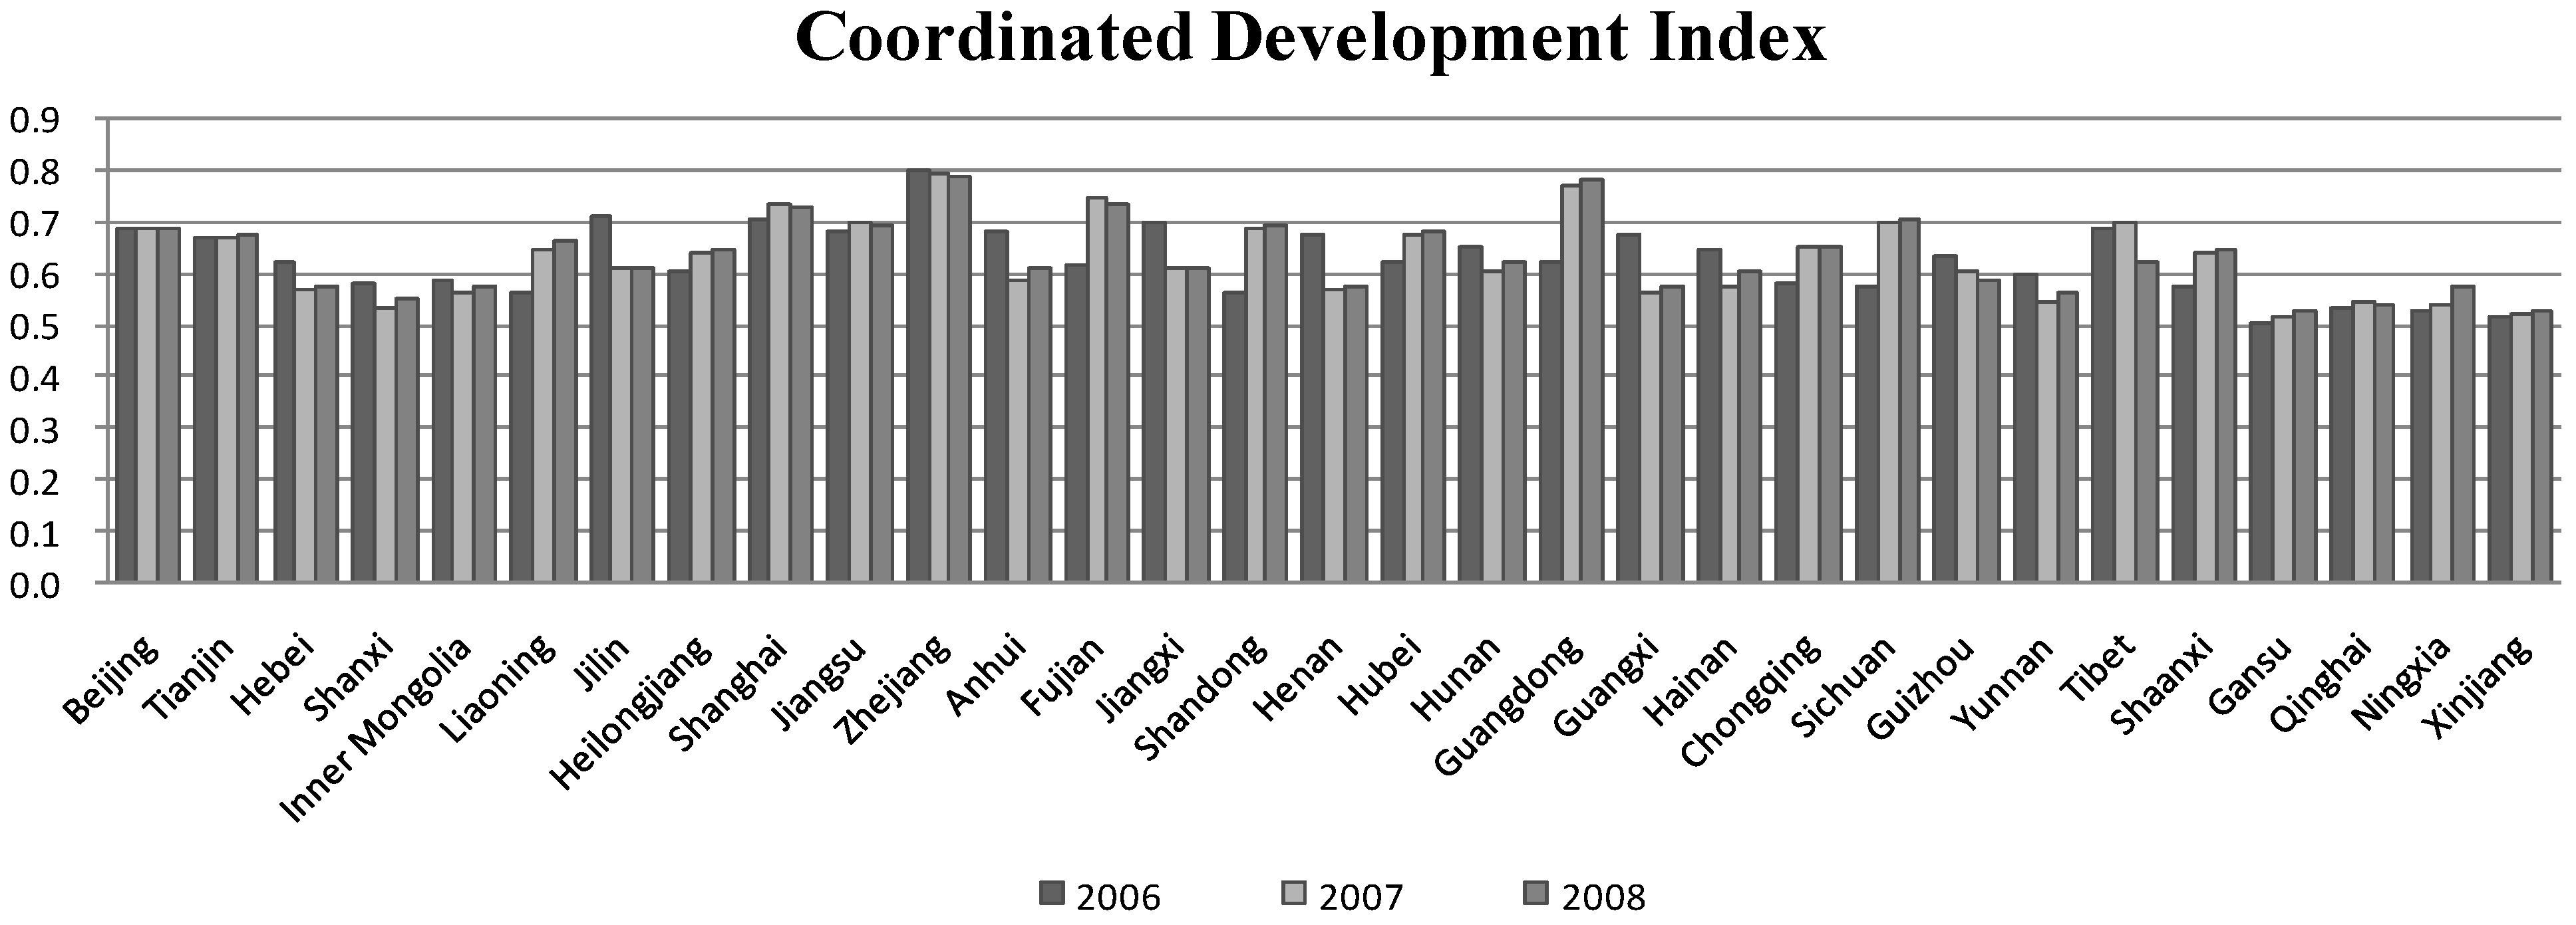
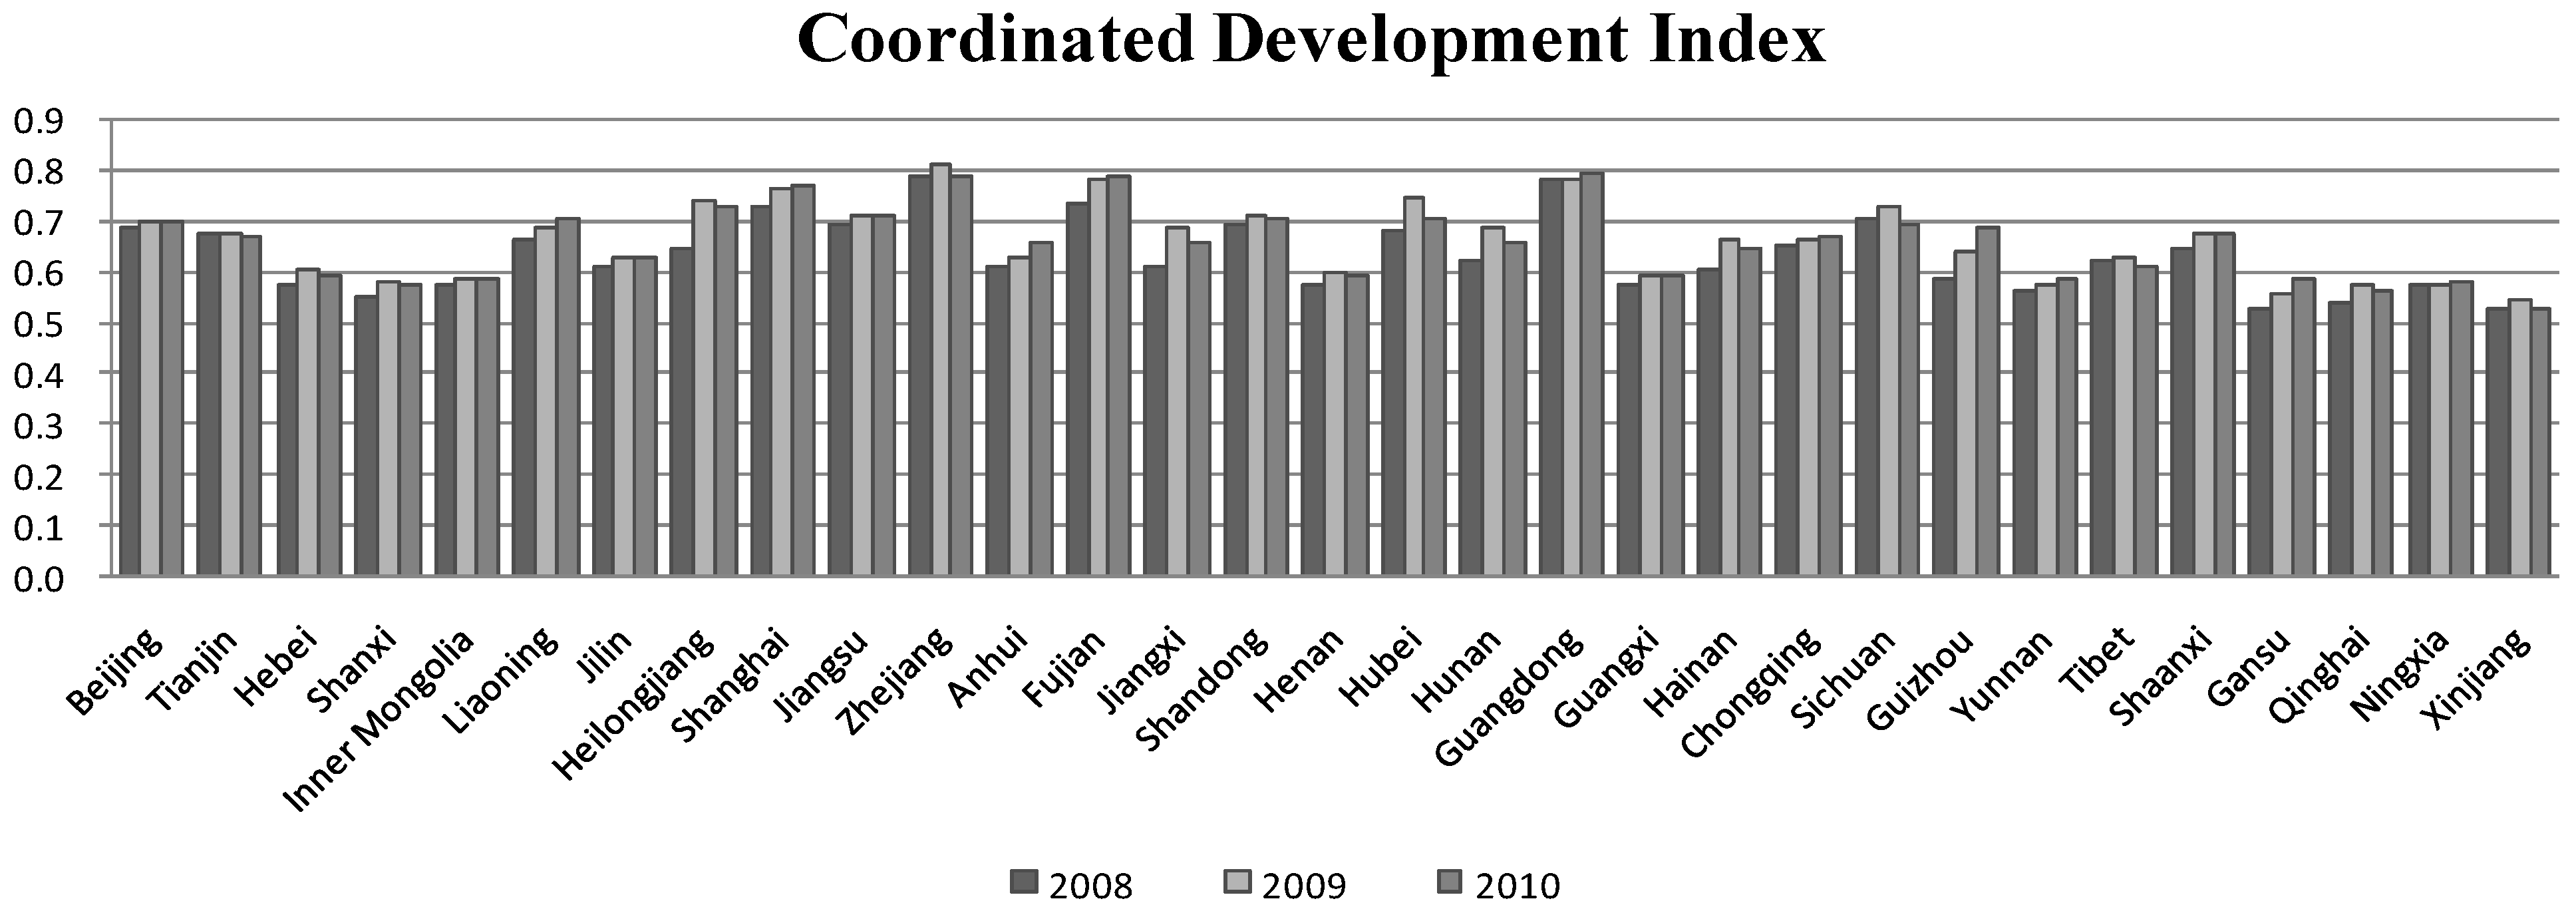
5.1. Results of the Coordinated Development Index from 2004 to 2010


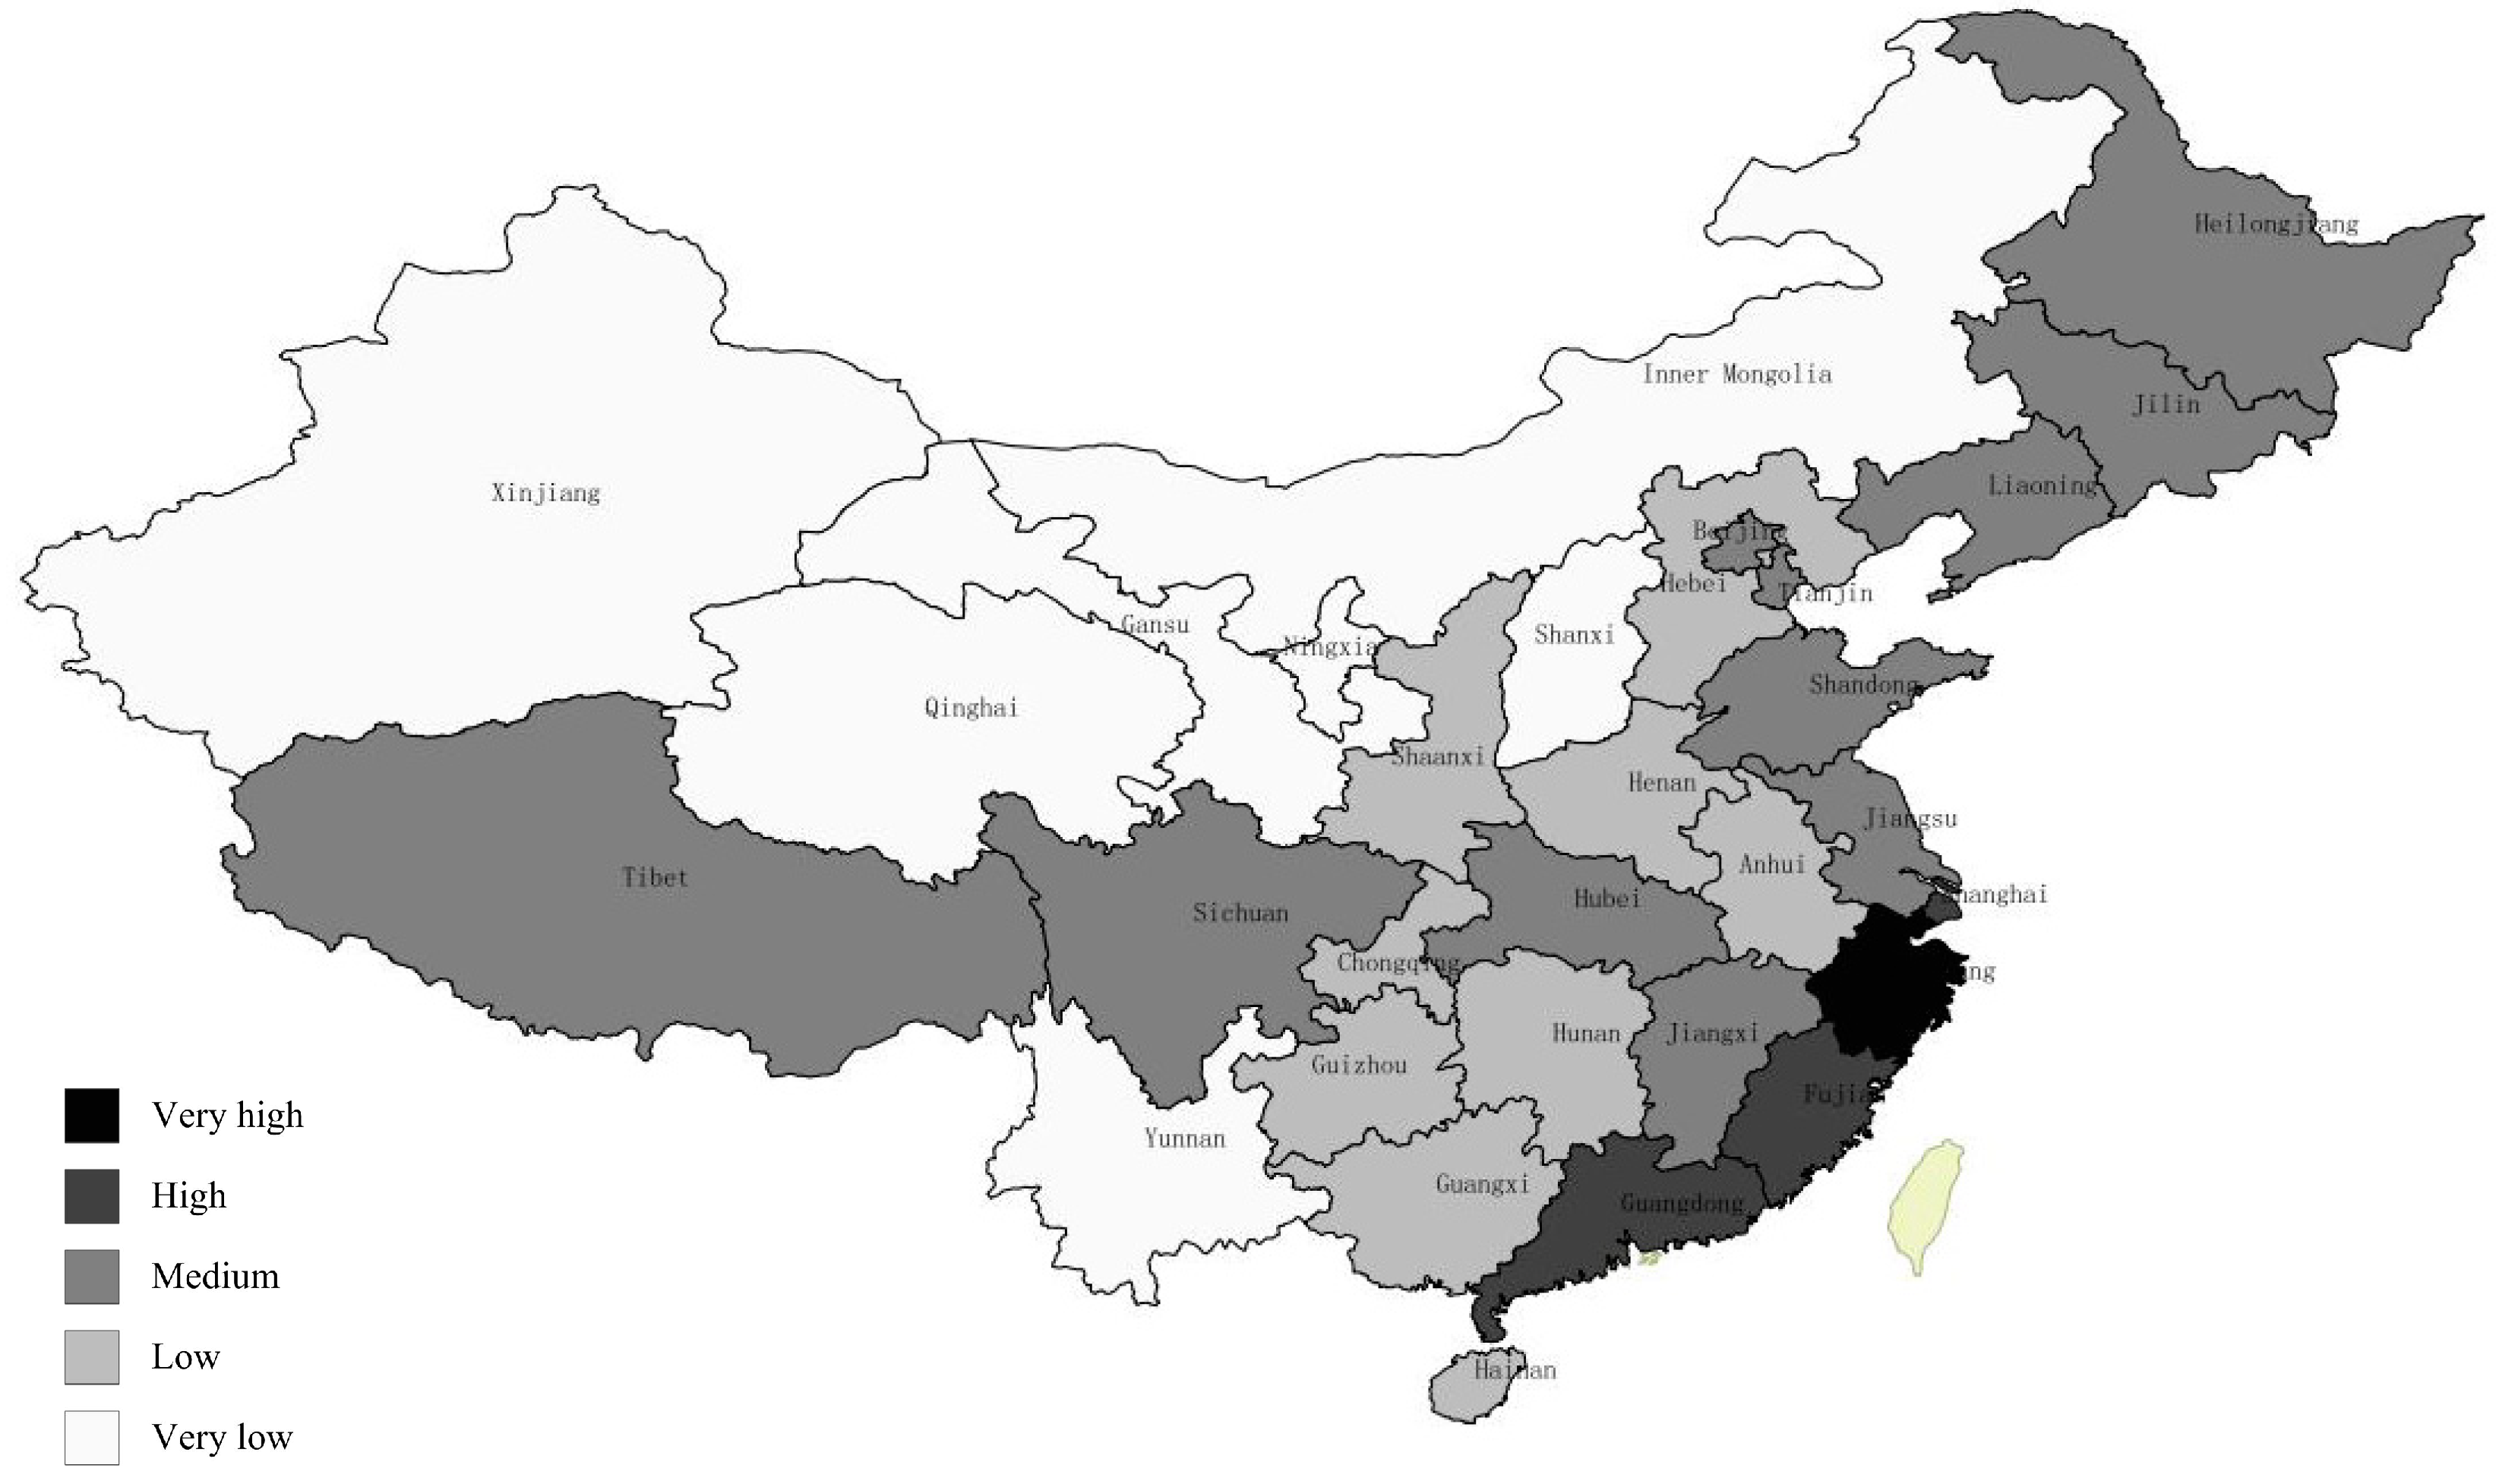
5.2. Regional Disparities of the Coordinated Development in Mainland China

5.3. Discussion about the Regional Sustainability in Mainland China Based on the Level of CDI
5.3.1. The Municipality of “High” Grade of CDI, Shanghai
| GDP per capita | Proportion of gross output value of high-tech industry in GDP (%) | Number of Collage Student in each 10,000 people | Days of air quality up to the national standard of China in a whole year | |||||
|---|---|---|---|---|---|---|---|---|
| Shanghai | National Average | Shanghai | National Average | Shanghai | National Average | Shanghai | National Average | |
| 2004 | 55,307 | 14079 | 43.75 | 11.5 | 239 | 112 | 311 | 294 |
| 2005 | 51,474 | 16203 | 42.66 | 11.2 | 249 | 129 | 322 | 305 |
| 2006 | 57,695 | 18662 | 43.15 | 11.6 | 257 | 142 | 324 | 307 |
| 2007 | 66,367 | 21973 | 46.20 | 11.7 | 261 | 151 | 328 | 314 |
| 2008 | 73,124 | 25780 | 43.08 | 10.9 | 266 | 160 | 328 | 318 |
| 2009 | 78,989 | 28737 | 36.94 | 10.3 | 272 | 169 | 334 | 321 |
| 2010 | 76,074 | 33427 | 40.20 | 10.7 | 224 | 170 | ||
5.3.2. The municipality of “Medium” Grade of CDI, Beijing
| Engel’s coefficient of urban households | Proportion of tertiary industry in GDP | Average urban income per capita (RMB/capita) | Proportion of gross output value of high-tech industry in GDP (%) | |||||
|---|---|---|---|---|---|---|---|---|
| Beijing | National Average | Beijing | National Average | Beijing | National Average | Beijing | National Average | |
| 2004 | 32.18 | 38.2 | 60 | 37.5 | 17,116 | 9897 | 35.95 | 11.5 |
| 2005 | 31.83 | 37.3 | 69 | 40.4 | 19,533 | 11,004 | 30.99 | 11.2 |
| 2006 | 30.76 | 36.5 | 71 | 40.0 | 22,417 | 12,273 | 33.80 | 11.6 |
| 2007 | 32.18 | 37.2 | 72 | 39.8 | 24,576 | 14,168 | 34.07 | 11.7 |
| 2008 | 33.79 | 38.9 | 73 | 39.0 | 27,678 | 16,151 | 28.16 | 10.9 |
| 2009 | 33.18 | 37.5 | 76 | 41.6 | 30,674 | 17,864 | 22.69 | 10.3 |
| 2010 | 32.07 | 36.7 | 75 | 40.4 | 33,360 | 19,888 | 21.20 | 10.7 |
| Days of air quality up to the national standard of China in the whole year (days) | Proportion of waste gas (SO2, Soot, Dust) removed in total waste generated (%) | Proportion of Industrial waste water meeting discharge standards in total volume (%) | Ratio of industrial solid waste utilized(%) | |||||
|---|---|---|---|---|---|---|---|---|
| Value | Ranking | Value | Ranking | Value | Ranking | Value | Ranking | |
| 2004 | 229 | 27 | 93.6 | 3.0 | 98.61 | 2 | 73.7 | 9 |
| 2005 | 234 | 31 | 96.1 | 1.0 | 99.43 | 2 | 67.9 | 14 |
| 2006 | 241 | 30 | 94.5 | 1.0 | 99.29 | 2 | 74.6 | 9 |
| 2007 | 246 | 31 | 97.0 | 1.0 | 97.42 | 5 | 74.8 | 11 |
| 2008 | 274 | 28 | 97.2 | 1.0 | 98.26 | 5 | 66.4 | 15 |
| 2009 | 285 | 28 | 96.6 | 1.0 | 98.41 | 5 | 68.9 | 17 |
| 2010 | 96.7 | 2.0 | 98.76 | 2 | 65.8 | 17 | ||
5.3.3. The Municipality of “Very Low” Grade of CDI, Gansu
| Proportion of waste gas (SO2, Soot, Dust) removed in total waste generated (%) | Proportion of Industrial waste water meeting discharge standards in total volume (%) | Ratio of industrial solid waste utilized | ||||
|---|---|---|---|---|---|---|
| Value | Ranking | Value | Ranking | Value | Ranking | |
| 2004 | 82.6 | 22 | 73.20 | 26 | 32.6 | 26 |
| 2005 | 86.2 | 19 | 73.23 | 25 | 29.4 | 27 |
| 2006 | 84.8 | 22 | 79.08 | 24 | 27.1 | 30 |
| 2007 | 87.9 | 23 | 80.96 | 25 | 36.1 | 29 |
| 2008 | 90.4 | 24 | 58.95 | 29 | 34.1 | 29 |
| 2009 | 91.0 | 24 | 81.07 | 27 | 33.4 | 30 |
| 2010 | 91.3 | 25 | 83.32 | 26 | 46.3 | 29 |
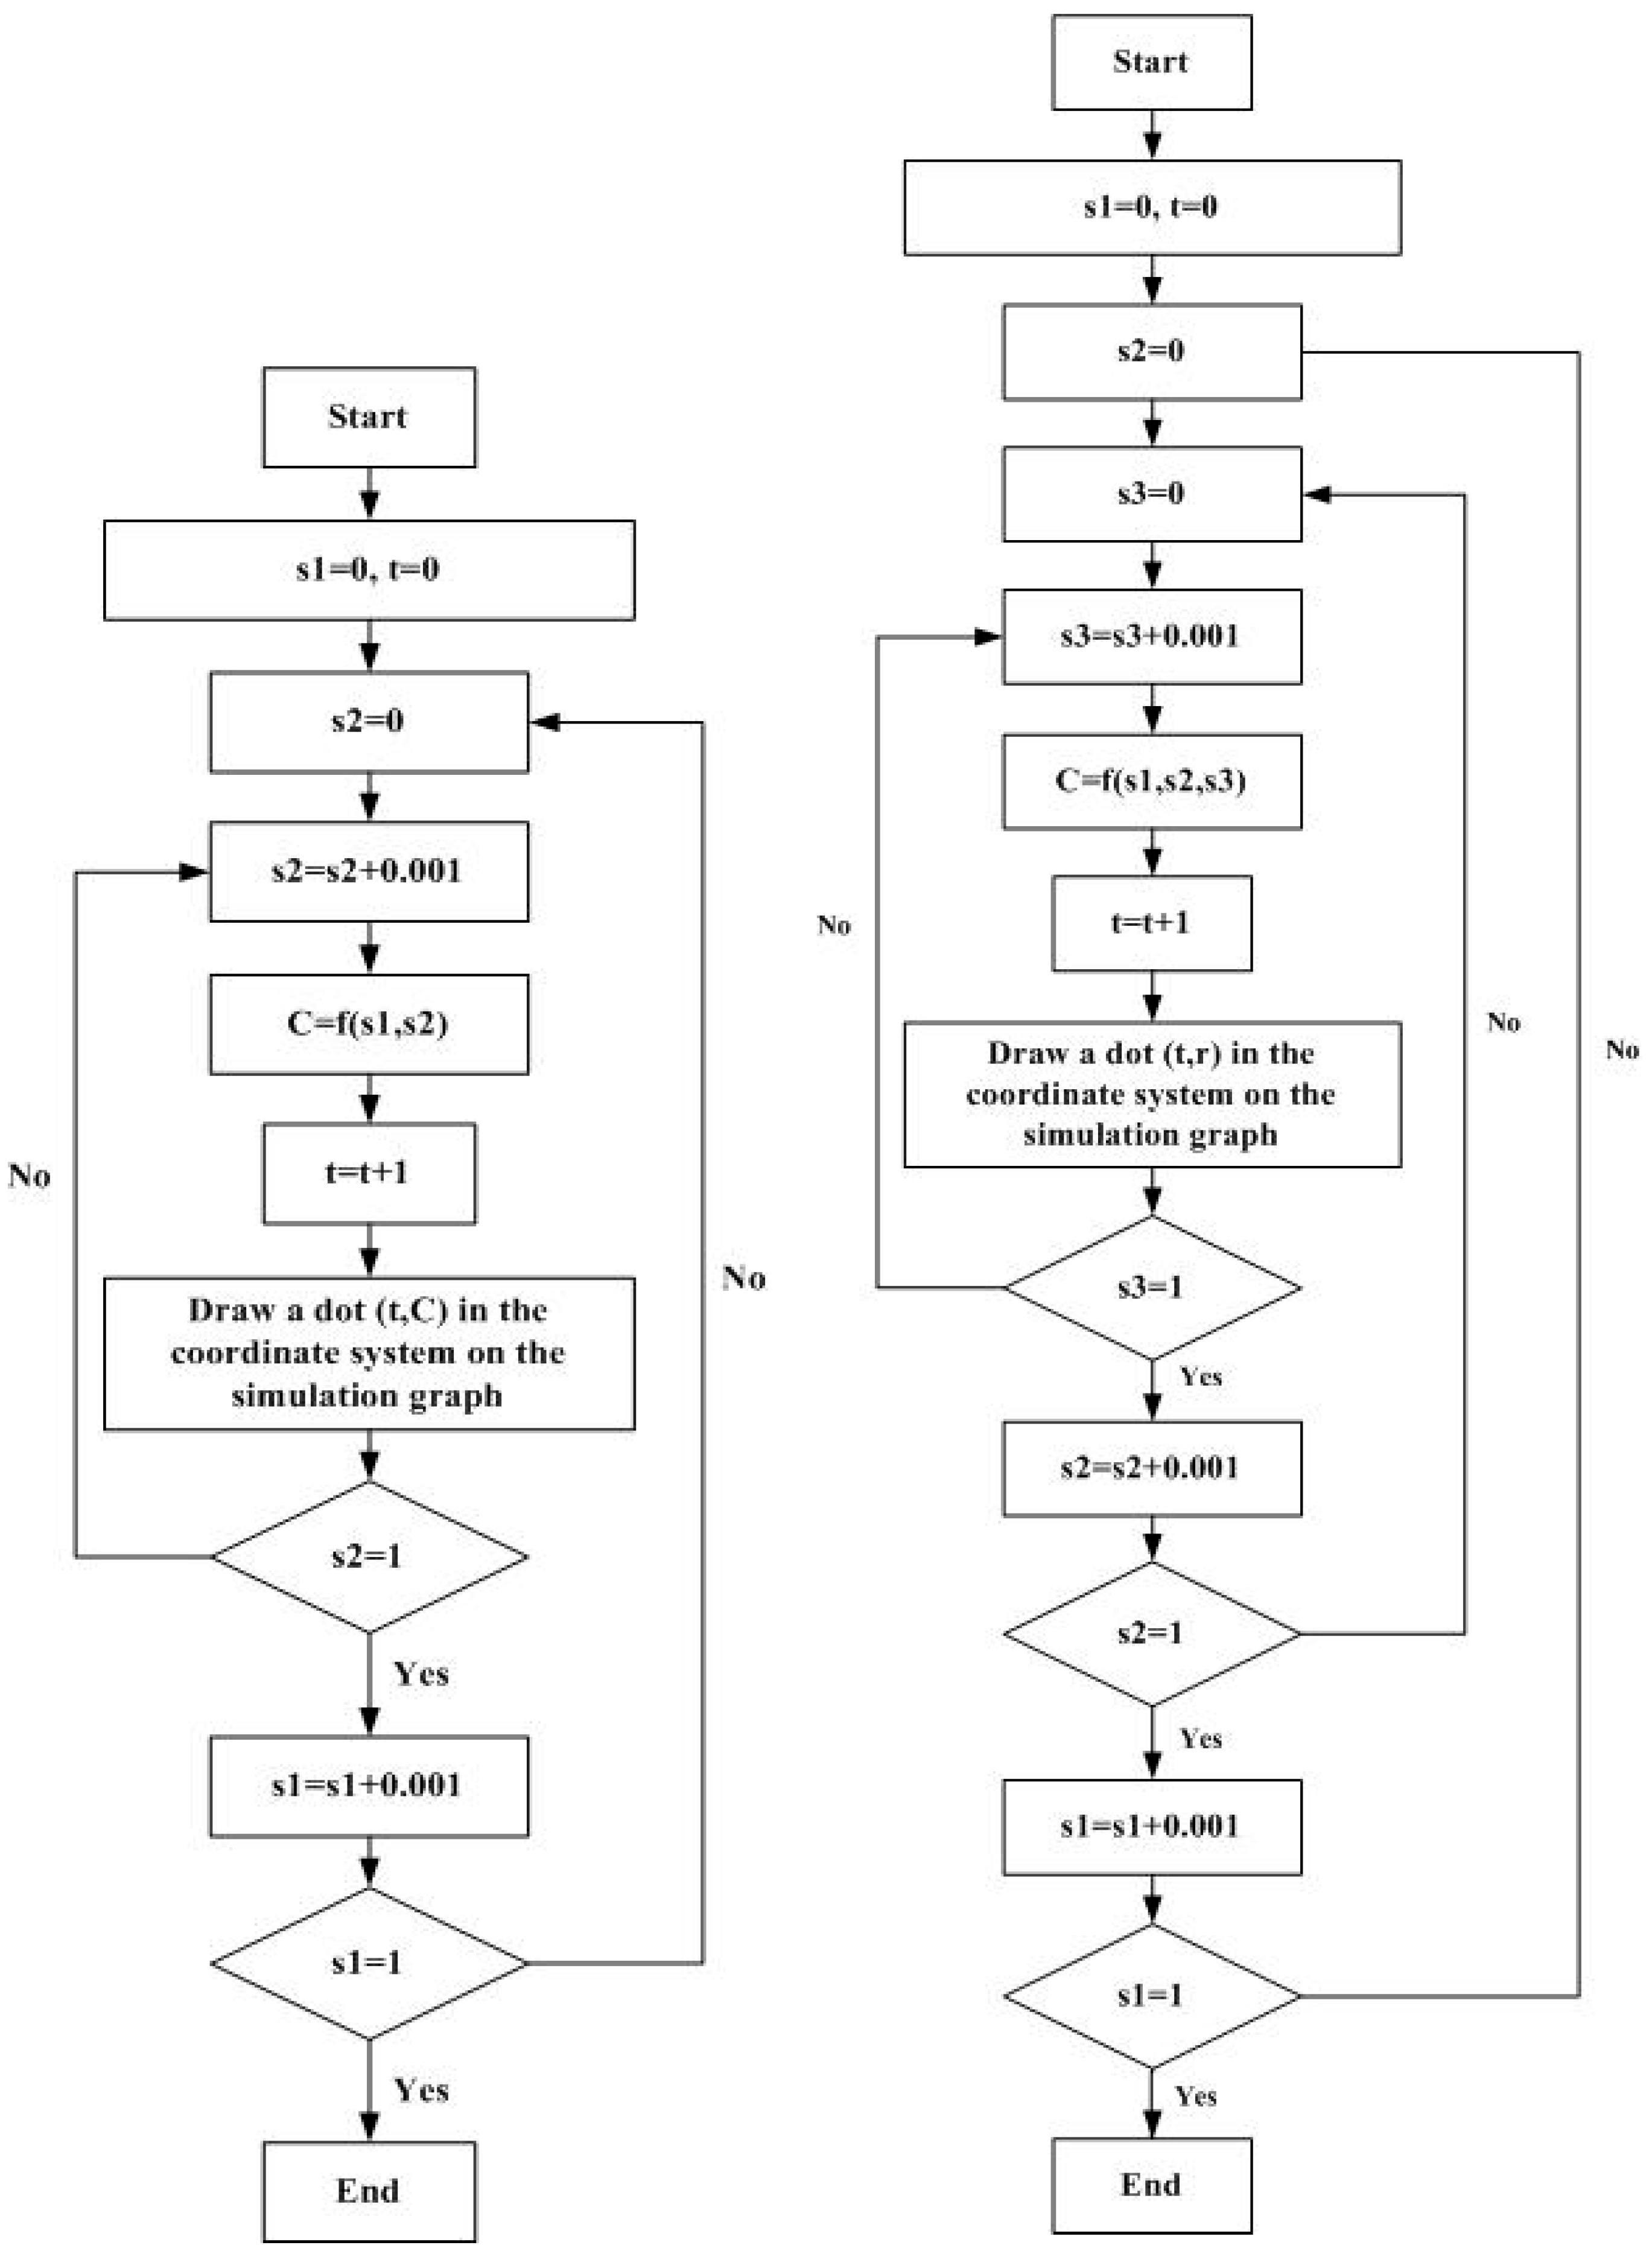
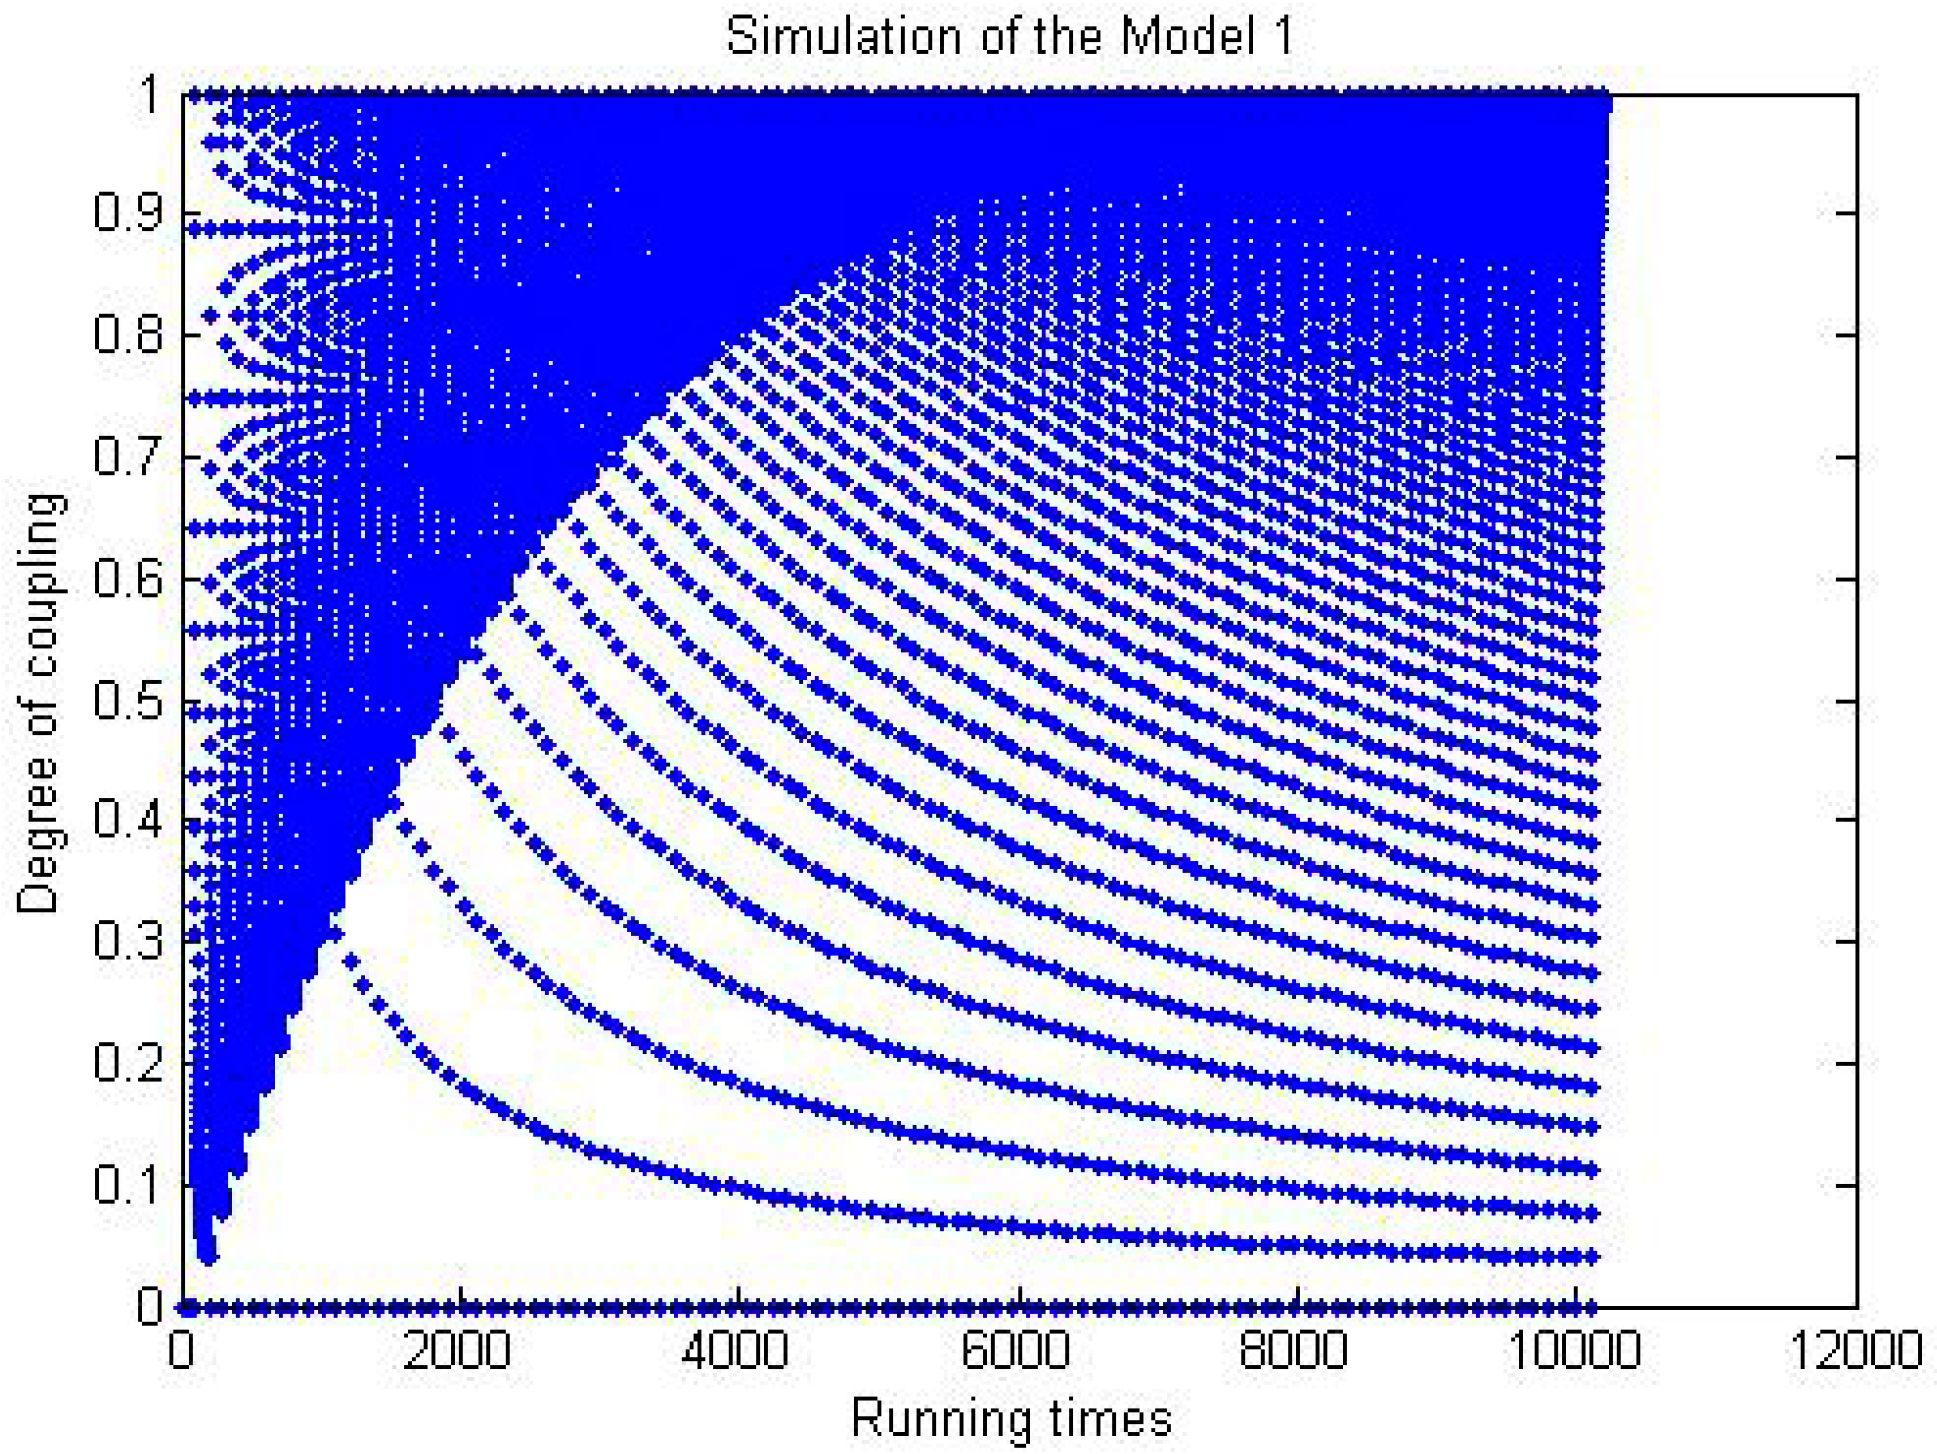
5.4. Discussion about the Coordinated Development Index and the Existing Model of Coupling Coordination Degree
The existing model: Coupling Coordination Degree Model (CCDM)


6. Conclusions
Acknowledgments
Author Contributions
Conflicts of Interest
References
- United Nations Environment Programme (UNEP). Towards a Green Economy: Pathways to Sustainability Development and Poverty Eradication; UNEP: Nairobi, Kenya, 2011. [Google Scholar]
- Liu, C. Smog levels in china reach record levels since the end of 2013; surrounding areas severely polluted. China News Agency, 4 December 2013. (In Chinese) [Google Scholar]
- Zeng, Z. The analysis of coordination and sus tainable development. Syst. Eng. Theory Pract. 2001, 3, 18–21. (In Chinese) [Google Scholar]
- Romer, P.M. Endogenous technological change. J. Polit. Econ. 1990, 98, S71–S102. [Google Scholar] [CrossRef]
- Robert, E.; Lucas, J. On the mechanics of economic development. J. Monet. Econ. 1988, 22, 3–42. [Google Scholar]
- Norgaard, R.B. Economic indicators of resource scarcity: A critical essay. J. Environ. Econ. Manag. 1990, 19, 19–25. [Google Scholar] [CrossRef]
- Grossman, G.M.; Krueger, A.B. Economic growth and the environment. Q. J. Econ. 1995, 110, 353–377. [Google Scholar] [CrossRef]
- Holling, C.S. Cross-scale morphology, geometry, and dynamics of ecosystems. Ecol. Soc. Am. 1992, 62, 447–502. [Google Scholar]
- Barkley, J.; Rosser, J. Systemic crises in hierarchical ecological economies. Land Econ. 1995, 71, 163–172. [Google Scholar]
- Costanza, R.; Wainger, L.; Folke, C.; Mäler, K.-G. Modeling complex ecological economic systems. Am. Instit. Biol. Sci. 1993, 43, 545–555. [Google Scholar]
- United Nations. Indicators of Sustainable Development: Guidelines and Methodologies; United Nations: New York, NY, USA, 2007. [Google Scholar]
- Unitied Nations. Urban Indicator Guidelines; United Nations: New York, NY, USA, 2004. [Google Scholar]
- The World Bank. World Development Indicators 2013; The World Bank: Washington, DC, USA, 2013. [Google Scholar]
- The World Bank. World Development Indicators 2014; The World Bank: Washington, DC, USA, 2014. [Google Scholar]
- European Commission. European Common Indicators-Towards a Local Sustainability Profile; European Commission: Milano, Italy, 2003. [Google Scholar]
- Copeland, B.R.; Taylor, M.S. Trade, growth, and the environment. J. Econ. Lit. 2004, 42, 7–71. [Google Scholar] [CrossRef]
- Dinda, S. Environmental kuznets curve hypothesis: A survey. Ecol. Econ. 2004, 49, 431–455. [Google Scholar] [CrossRef]
- Li, Y.; Xu, Z.; Wang, Y. Study on environmental kuznets curve. China Popul. Resour. Environ. 2005, 15, 7–14. (In Chinese) [Google Scholar]
- Xue, B.; Zhang, Z.L.; Guo, X.J.; Chen, X.P.; Gen, Y. A study on the coupling relationships between regional economic growth and environmental pressure: Case of ningxia autonomous region. Ecol. Environ. Sci. 2010, 19, 1125–1131. [Google Scholar]
- Wang, Z.; Shi, C.; Li, Q.; Wang, G. Coupling trending analysis about urbanization and urban resource in Beijing. Energy Procedia 2011, 5, 1589–1596. [Google Scholar]
- Zhang, P.; Su, F.; Li, H.; Sang, Q. Coordination degree of urban population, economy, space, and environment in Shenyang since 1990. China Popul. Resour. Environ. 2008, 18, 115–119. [Google Scholar]
- Liu, J.; Dietz, T.; Carpenter, S.R.; Alberti, M.; Folke, C.; Moran, E.; Pell, A.N.; Deadman, P.; Kratz, T.; et al. Complexity of coupled human and natural systems. Science 2007, 317, 1513–1516. [Google Scholar]
- Cullerne, J.P. The Penguin Dictionary of Physics Illingworth, 5th ed.; Penguin Books: London, UK, 2001. [Google Scholar]
- Li, Y.; Li, Y.; Zhou, Y.; Shi, Y.; Zhu, X. Investigation of a coupling model of coordination between urbanization and the environment. J. Environ. Manag. 2012, 98, 127–133. [Google Scholar]
- Wu, W.; Niu, S. Evolutional analysis of coupling between population and resource-environment in china. Procedia Environ. Sci. 2012, 12, 793–801. [Google Scholar] [CrossRef]
- Goodland, R. The concept of environmental sustainability. Ann. Rev. Ecol. Syst. 1995, 26, 1–24. [Google Scholar] [CrossRef]
- Sustainable Development Strategy Study Group Chinese Academy of Sciences. China Sustainable Development Strategy Report 2012; Science Press: Beijing, China, 2012. (In Chinese) [Google Scholar]
- Department of Comprehensive Statistics of National Bureau of Statistics of China. China Statistical Yearbook 2005–2011; China Statistics Press: Beijing, China, 2005–2011. [Google Scholar]
- China Environment Yearbook Editorial Board. China Environment Yearbook 2005–2011; China Statistics Press: Beijing, China, 2005–2011. [Google Scholar]
- China Energy Yearbook Editorial Board. China Energy Yearbook 2005–2011; Science Press: Beijing, China, 2005–2011. [Google Scholar]
- Ebert, U.; Welsch, H. Meaningful environmental indices: A social choice approach. J. Environ. Econ. Manag. 2004, 47, 270–283. [Google Scholar] [CrossRef]
© 2014 by the authors; licensee MDPI, Basel, Switzerland. This article is an open access article distributed under the terms and conditions of the Creative Commons Attribution license (http://creativecommons.org/licenses/by/4.0/).
Share and Cite
Yang, Q.; Ding, Y.; De Vries, B.; Han, Q.; Ma, H. Assessing Regional Sustainability Using a Model of Coordinated Development Index: A Case Study of Mainland China. Sustainability 2014, 6, 9282-9304. https://doi.org/10.3390/su6129282
Yang Q, Ding Y, De Vries B, Han Q, Ma H. Assessing Regional Sustainability Using a Model of Coordinated Development Index: A Case Study of Mainland China. Sustainability. 2014; 6(12):9282-9304. https://doi.org/10.3390/su6129282
Chicago/Turabian StyleYang, Qing, Yang Ding, Bauke De Vries, Qi Han, and Huimin Ma. 2014. "Assessing Regional Sustainability Using a Model of Coordinated Development Index: A Case Study of Mainland China" Sustainability 6, no. 12: 9282-9304. https://doi.org/10.3390/su6129282
APA StyleYang, Q., Ding, Y., De Vries, B., Han, Q., & Ma, H. (2014). Assessing Regional Sustainability Using a Model of Coordinated Development Index: A Case Study of Mainland China. Sustainability, 6(12), 9282-9304. https://doi.org/10.3390/su6129282