Assessment of Physical-Chemical Drinking Water Quality in the Logone Valley (Chad-Cameroon)

Abstract
:1. Introduction
2. Materials and Methods
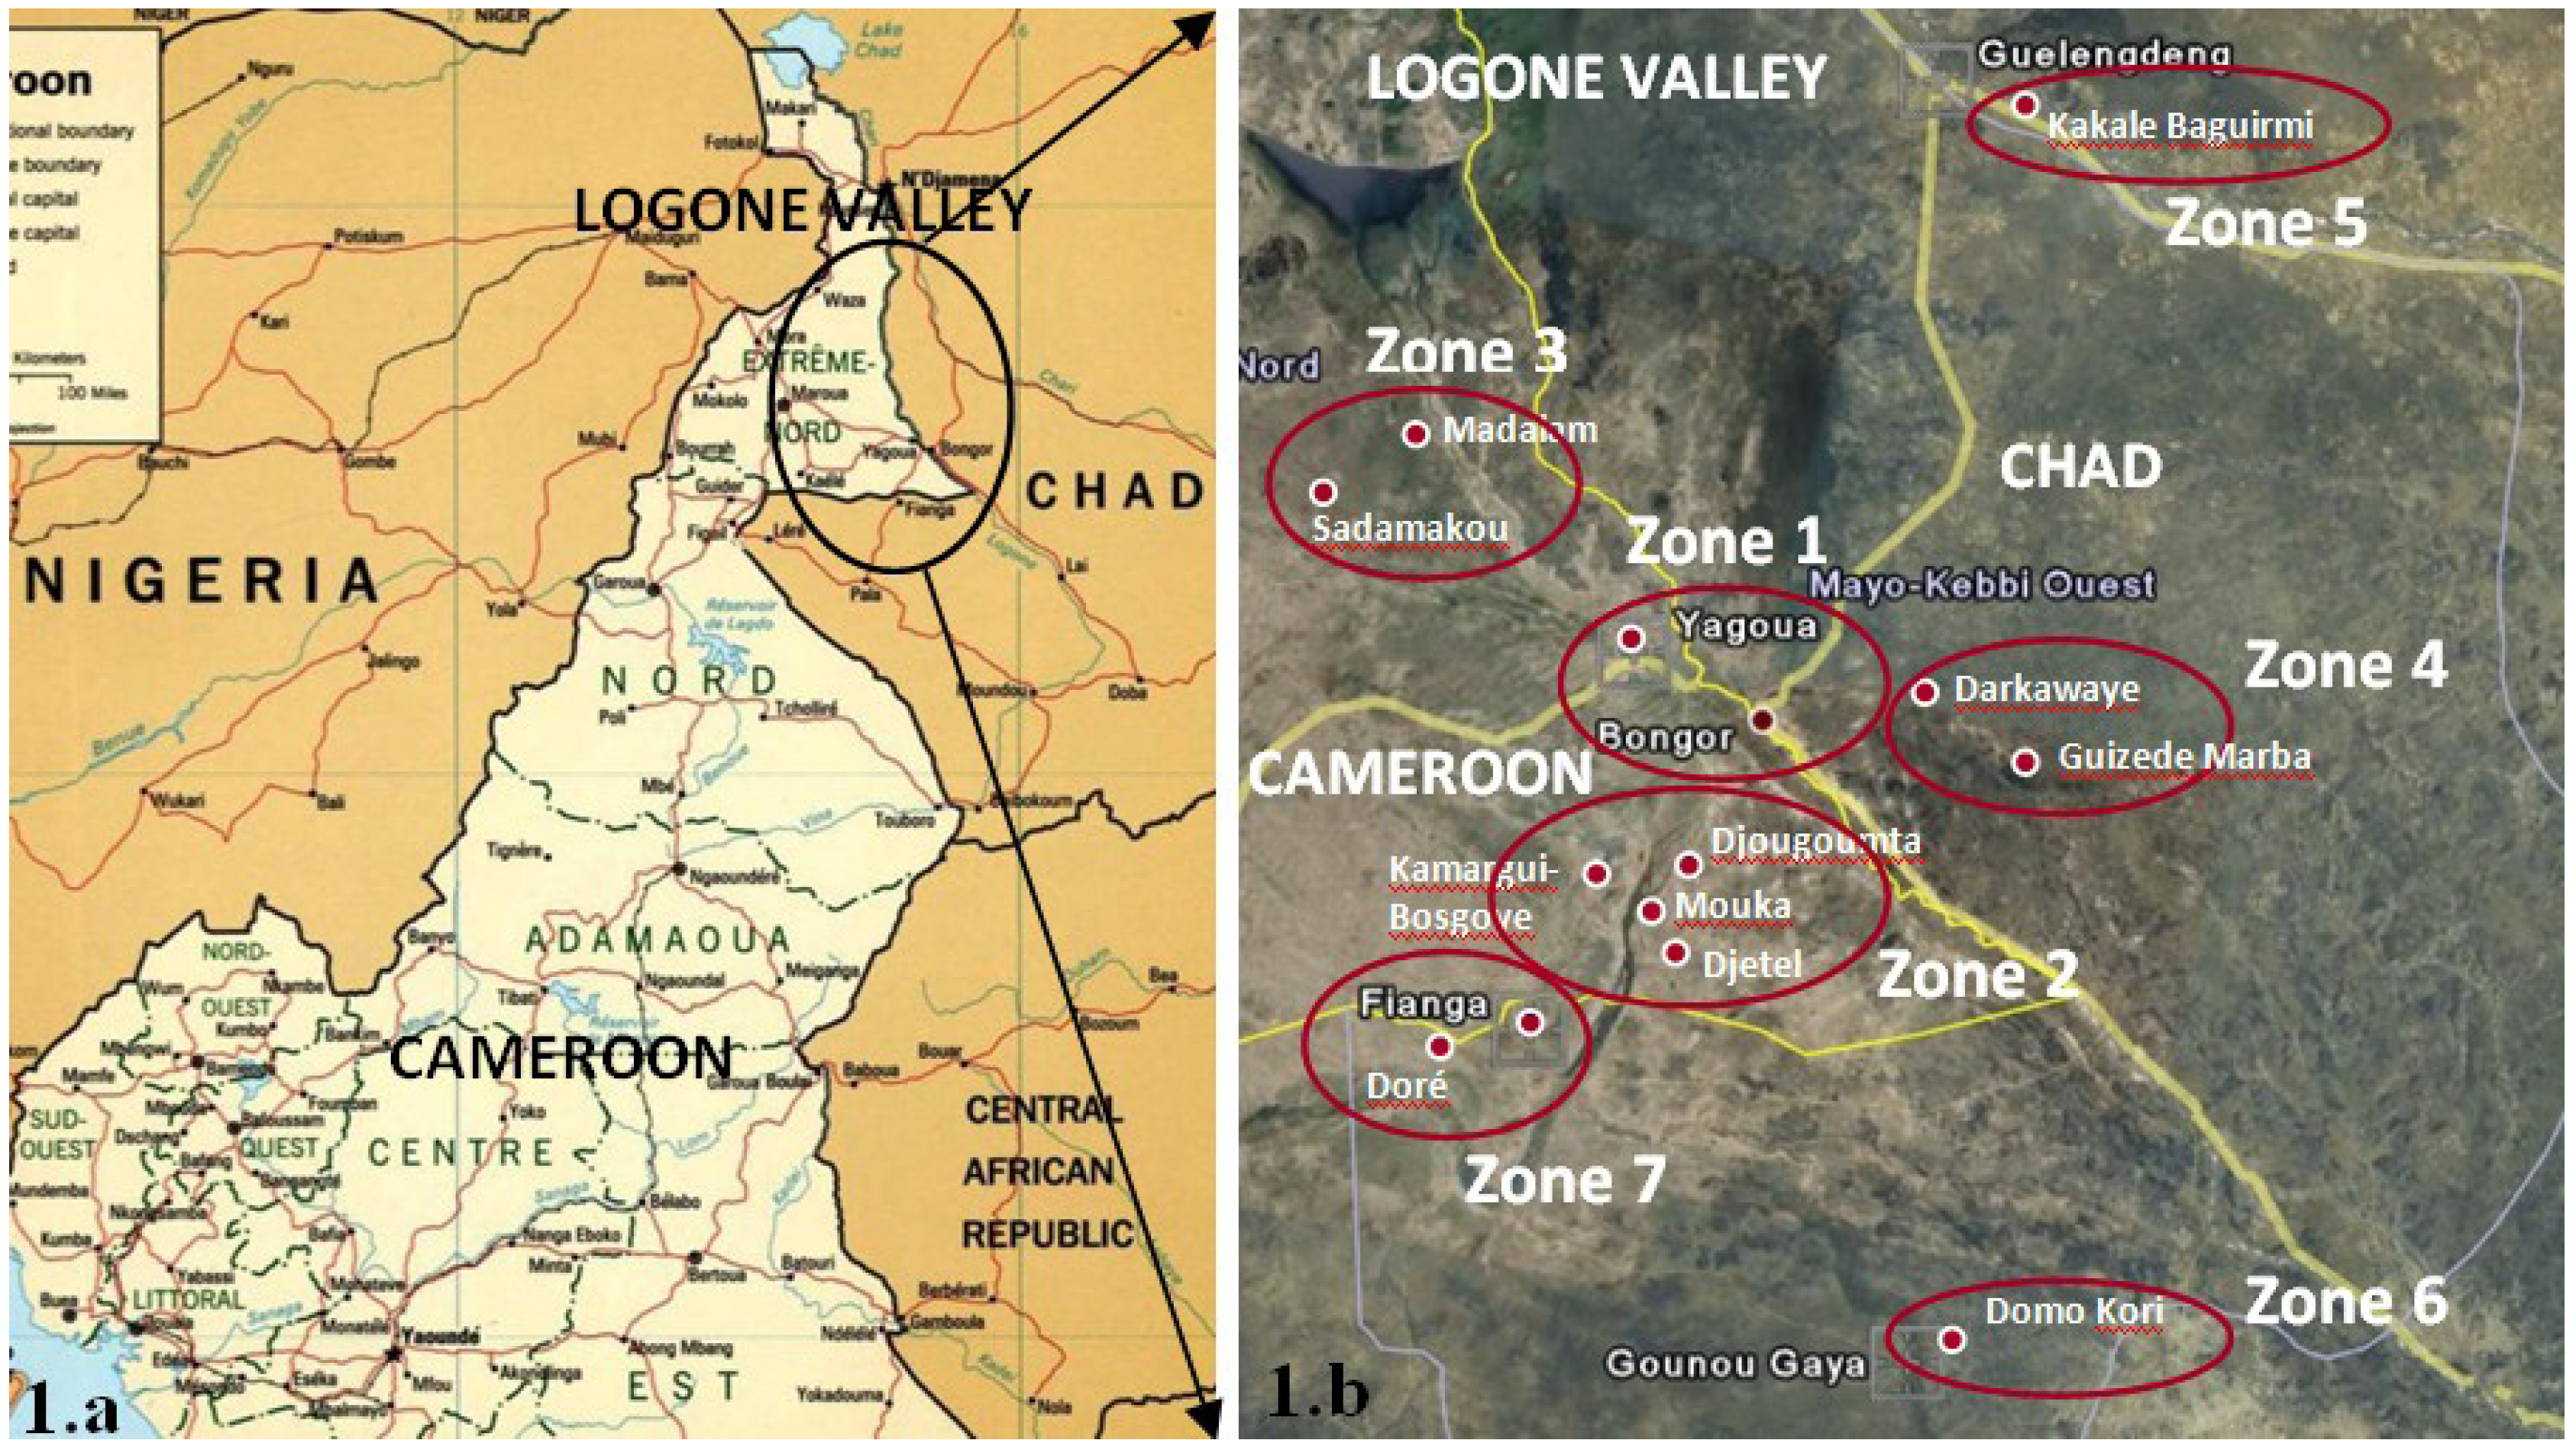
2.1. Description of the Sampling Site
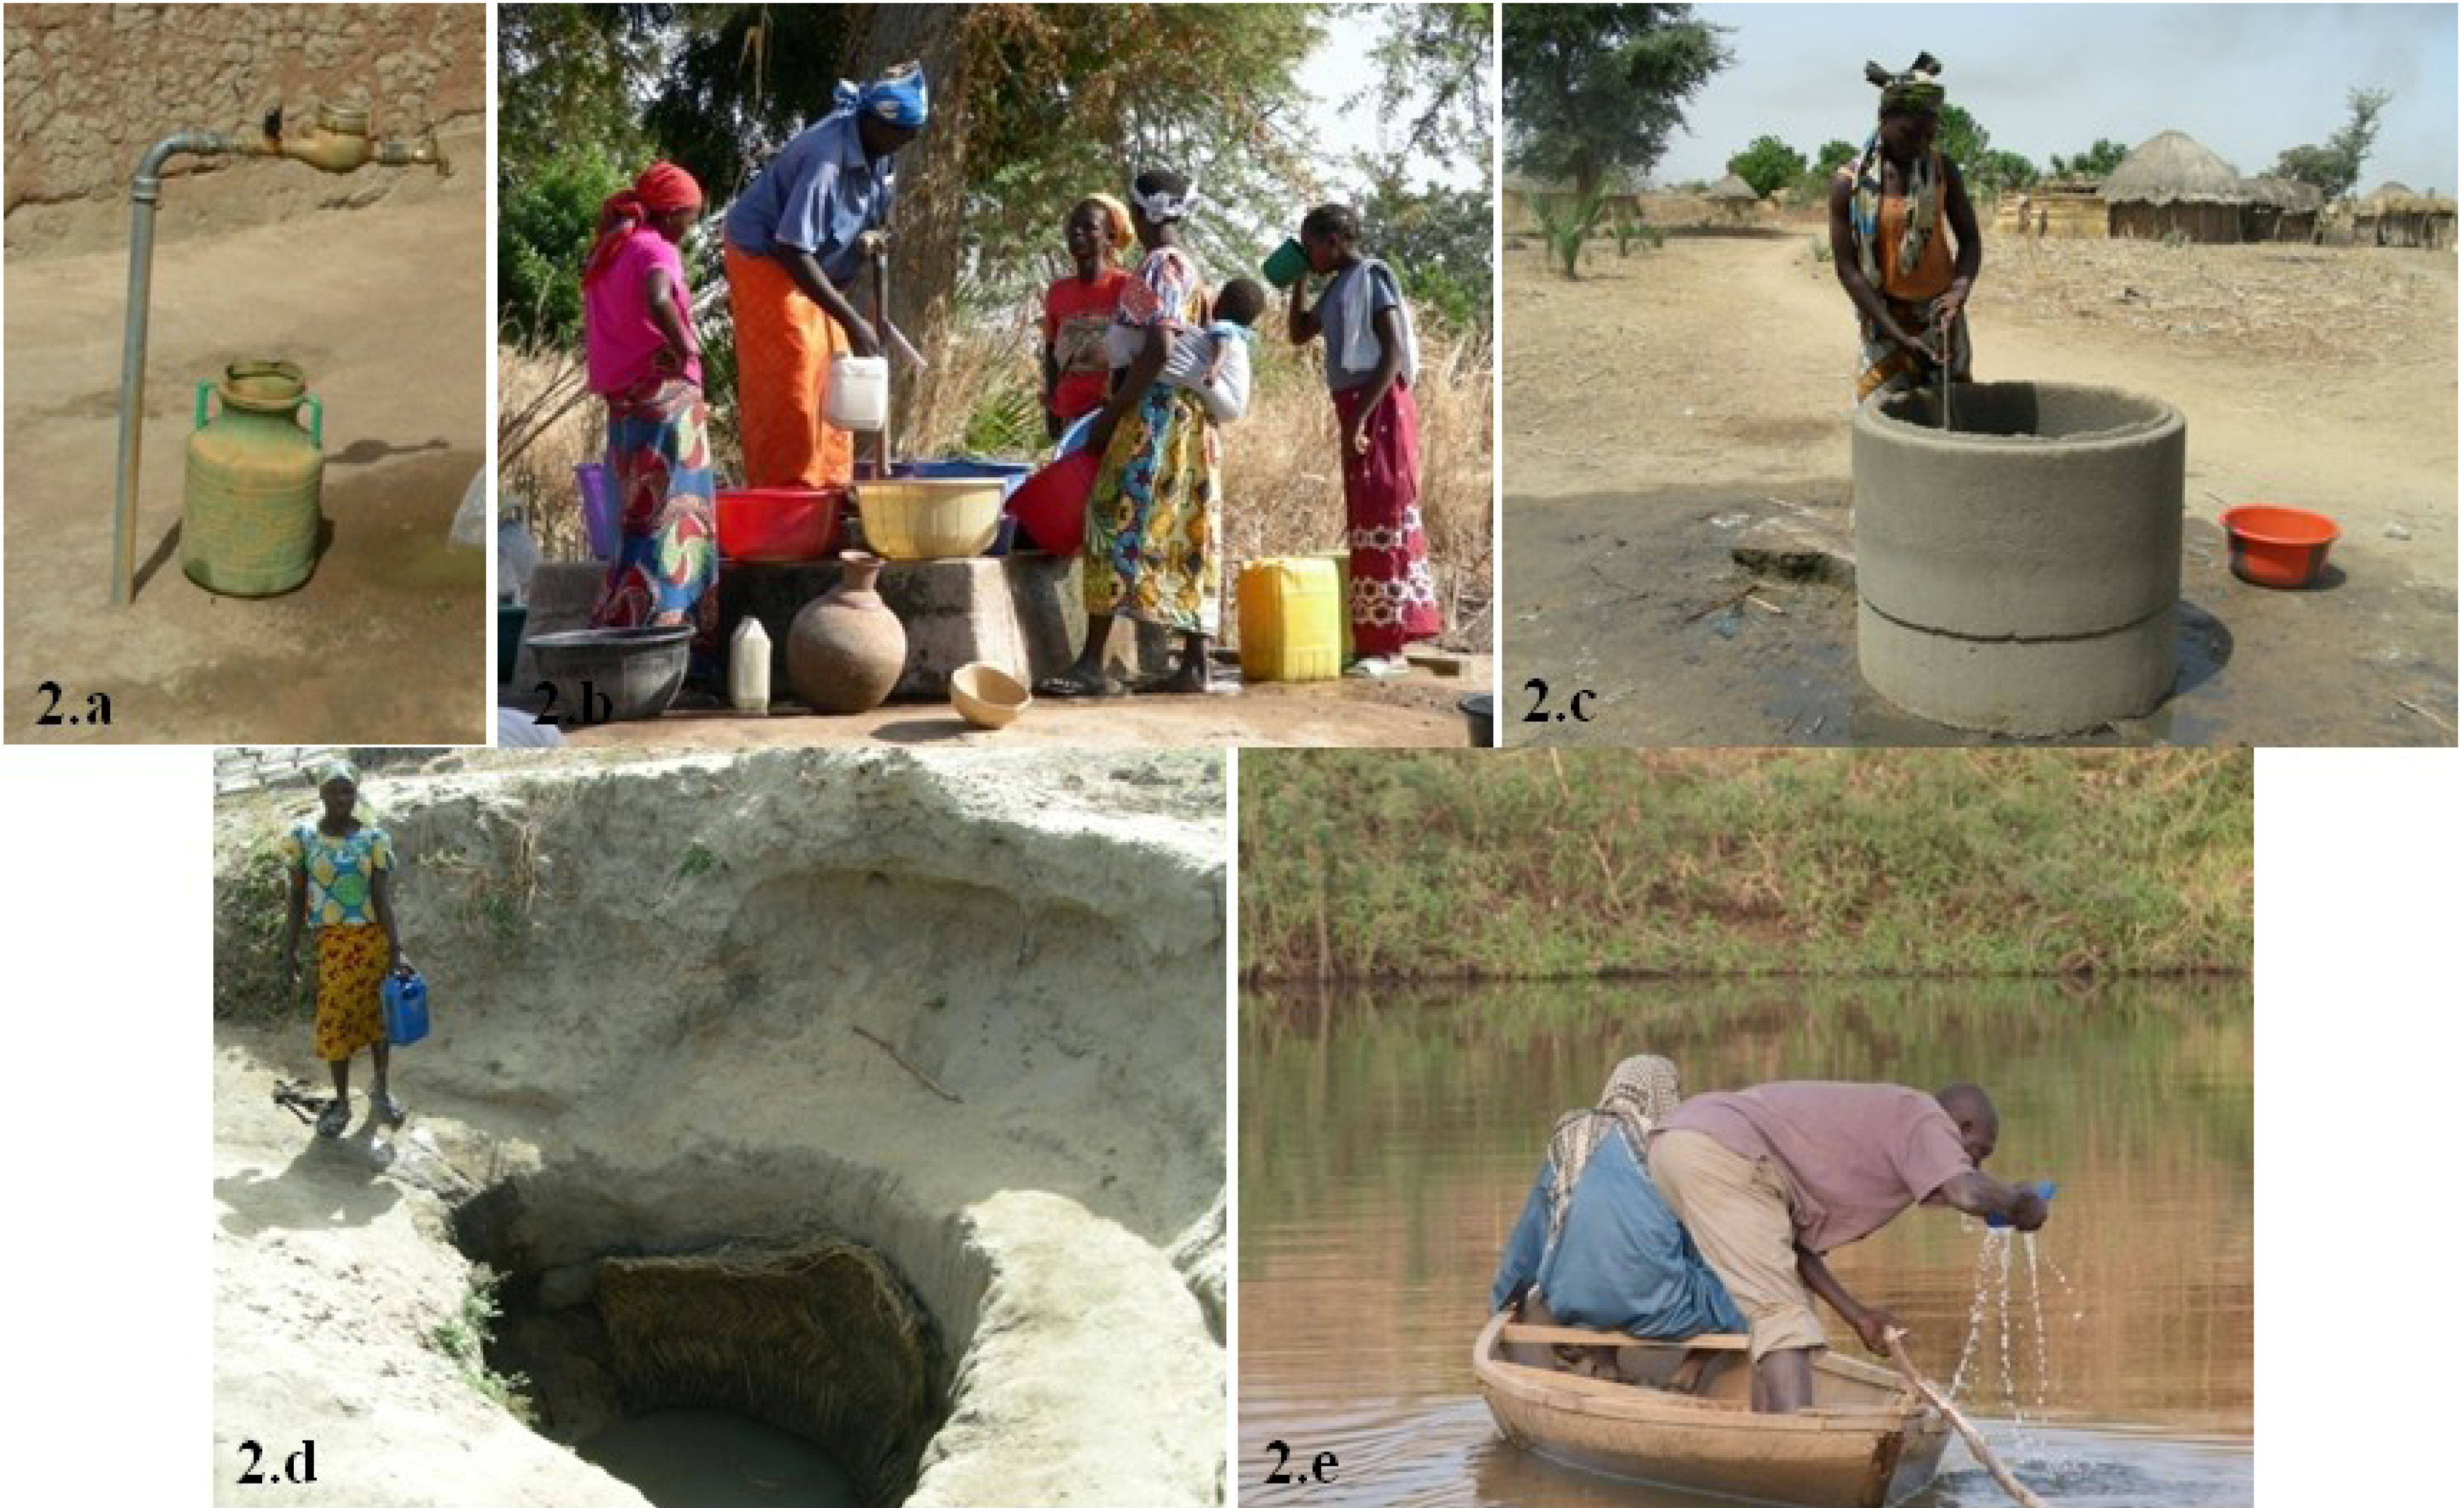
- Category 1: piped water (Figure 2a);
- Category 2: boreholes with a hand pump (Figure 2b); average depth 30 m;
- Category 3: open hand dug wells with concrete walls (Figure 2c); average depth 16 m;
- Category 4: simple open hand dug wells, that do not have sealed walls (Figure 2d); average depth 5 m;
- Category 5: surface waters (Figure 2e).


| Village | Source more used |
|---|---|
| Yagoua | Category 1 |
| Djougoumta | Categories 2, 3, 4 and 5 |
| Djetel | Category 2 |
| Mouka | Category 4 |
| Kamargui-Bosgoye | Category 3 |
| Madalam | Category 5 |
| Sadamakou | Category 3 |
| Bongor | Category 1 |
| Darkawaye | Category 4 |
| Guizede Marba | Category 3 |
| Kakale Baguirmi | Category 5 |
| Domo Kori | Category 4 |
| Doré | Category 2 |
| Fianga | All categories |
2.2. Physical-Chemical Analyses
| Parameter | Analytical method | Instrument |
|---|---|---|
| pH | Instrumental, analyse on site | Multi-parameter WTW, model Photoflex Turb Set and probe Sentix 41 |
| Temperature | Instrumental, analyse on site | Conductivity Meter Aqualitic, model AL20 CON |
| Conductivity | Instrumental, analyse on site | Conductivity Meter Aqualitic, model AL20 CON |
| Turbidity | Nephelometric method, analyse on site | Multi-parameter WTW, model Photoflex Turb Set |
| Hardness | Photometric method | Photometer WTW, model Photoflex Turb Set |
| Chloride | ||
| Fluoride | Potentiometric method | Ionometer WTW, model pH/ION 340i and probe F- 800 |
| Sulphate | Photometric method | Photometer WTW, model Photoflex Turb Set |
| Nitrate | ||
| Phosphate | ||
| Iron | ||
| Manganese | ||
| Zinc | ||
| Copper | ||
| Lead | ||
| Cadmium | ||
| Chrome (VI) |
2.3. Data Processing and Statistical Analyses
3. Results
3.1. Physical-Chemical Analyses
| Source category | N | Mean±St.Dev | Min | Median | Max | WHO GV |
|---|---|---|---|---|---|---|
| All | 38 | 6.7 ± 0.5 | 5.9 | 6.7 | 7.9 | 6.5–8.5 |
| 1 | 3 | 7.1 ± 0.2 | 6.8 | 7.1 | 7.4 | 6.5–8.5 |
| 2 | 9 | 6.6 ± 0.2 | 6.4 | 6.6 | 7.0 | |
| 3 | 10 | 6.6 ± 0.3 | 6.1 | 6.6 | 7.0 | |
| 4 | 7 | 6.4 ± 0.4 | 5.9 | 6.5 | 7.1 | |
| 5 | 9 | 7.3 ± 0.4 | 6.6 | 7.3 | 7.9 | |
| All | 38 | 243 ± 195 | 30 | 220 | 1,128 | - |
| 1 | 3 | 198 ± 73 | 95 | 249 | 250 | - |
| 2 | 9 | 250 ± 88 | 54 | 300 | 350 | |
| 3 | 10 | 370 ± 266 | 159 | 294 | 1,128 | |
| 4 | 7 | 239 ± 209 | 30 | 186 | 687 | |
| 5 | 9 | 111 ± 52 | 56 | 85 | 218 | |
| All | 38 | 29.0 ± 2.3 | 24.2 | 29.8 | 33.7 | - |
| 1 | 3 | 32.6 ± 0.8 | 32.0 | 32.2 | 33.7 | - |
| 2 | 9 | 29.7 ± 1.3 | 27.5 | 30.3 | 31.0 | |
| 3 | 10 | 29.7 ± 1.8 | 26.7 | 30.3 | 31.9 | |
| 4 | 7 | 27.5 ± 2.1 | 24.2 | 27.1 | 30.1 | |
| 5 | 9 | 27.3 ± 2.2 | 24.3 | 27.3 | 30.4 | |
| All | 38 | 62.7 ± 119.9 | 0.2 | 14.2 | 544.0 | 5.0 |
| 1 | 3 | 81.8 ± 111.9 | 0.5 | 4.7 | 240.0 | 5.0 |
| 2 | 9 | 2.6 ± 2.8 | 0.2 | 1.5 | 9.5 | |
| 3 | 10 | 15.0 ± 15.8 | 1.7 | 6.8 | 53.3 | |
| 4 | 7 | 123.4 ± 148.5 | 14.3 | 46.9 | 395.0 | |
| 5 | 9 | 122.2 ± 162.6 | 13.4 | 46.3 | 544.0 | |
| All | 18 | 7.6 ± 8.4 | 0.3 | 5.5 | 39.8 | - |
| 1 | 2 | 4.75 ± 1.0 | 3.8 | 4.8 | 5.8 | - |
| 2 | 6 | 7.25 ± 3.2 | 3.5 | 6.3 | 13.3 | |
| 3 | 5 | 13.6 ± 13.2 | 4.0 | 9.0 | 39.8 | |
| 4 | 2 | 2.5 ± 1.8 | 0.8 | 2.5 | 4.3 | |
| 5 | 3 | 3.6 ± 3.7 | 0.3 | 1.8 | 8.8 |
| Source category | N | Mean ± St.Dev | Min | Median | Max | WHO GV |
|---|---|---|---|---|---|---|
| All | 38 | 0.17 ± 0.22 | 0.05 | 0.10 | 1.10 | 1.50 |
| 1 | 3 | 0.2 ± 0.12 | 0.11 | 0.21 | 0.40 | 1.50 |
| 2 | 9 | 0.16 ± 0.12 | 0.07 | 0.10 | 0.41 | |
| 3 | 10 | 0.15 ± 0.09 | 0.05 | 0.11 | 0.36 | |
| 4 | 7 | 0.21 ± 0.36 | 0.05 | 0.06 | 1.10 | |
| 5 | 9 | 0.22 ± 0.27 | 0.09 | 0.13 | 0.97 | |
| All | 36 | 1.5 ± 4.7 | 0.0 | 0.3 | 27.6 | 50.0 |
| 1 | 3 | 0.7 ± 0.6 | 0.2 | 0.4 | 1.5 | 50.0 |
| 2 | 7 | 0.3 ± 0.4 | 0.0 | 0.1 | 1.2 | |
| 3 | 10 | 3.4 ± 8.1 | 0.0 | 0.4 | 27.6 | |
| 4 | 7 | 2.0 ± 2.8 | 0.2 | 1.3 | 8.8 | |
| 5 | 9 | 0.4 ± 0.5 | 0.0 | 0.2 | 1.8 | |
| All | 36 | 0.37 ± 0.38 | 0.00 | 0.25 | 1.86 | - |
| 1 | 3 | 0.66 ± 0.33 | 0.30 | 0.58 | 1.10 | - |
| 2 | 7 | 0.41 ± 0.32 | 0.04 | 0.29 | 1.06 | |
| 3 | 10 | 0.38 ± 0.24 | 0.09 | 0.30 | 0.77 | |
| 4 | 7 | 0.47 ± 0.60 | 0.01 | 0.25 | 1.86 | |
| 5 | 9 | 0.14 ± 0.14 | 0.00 | 0.07 | 0.48 | |
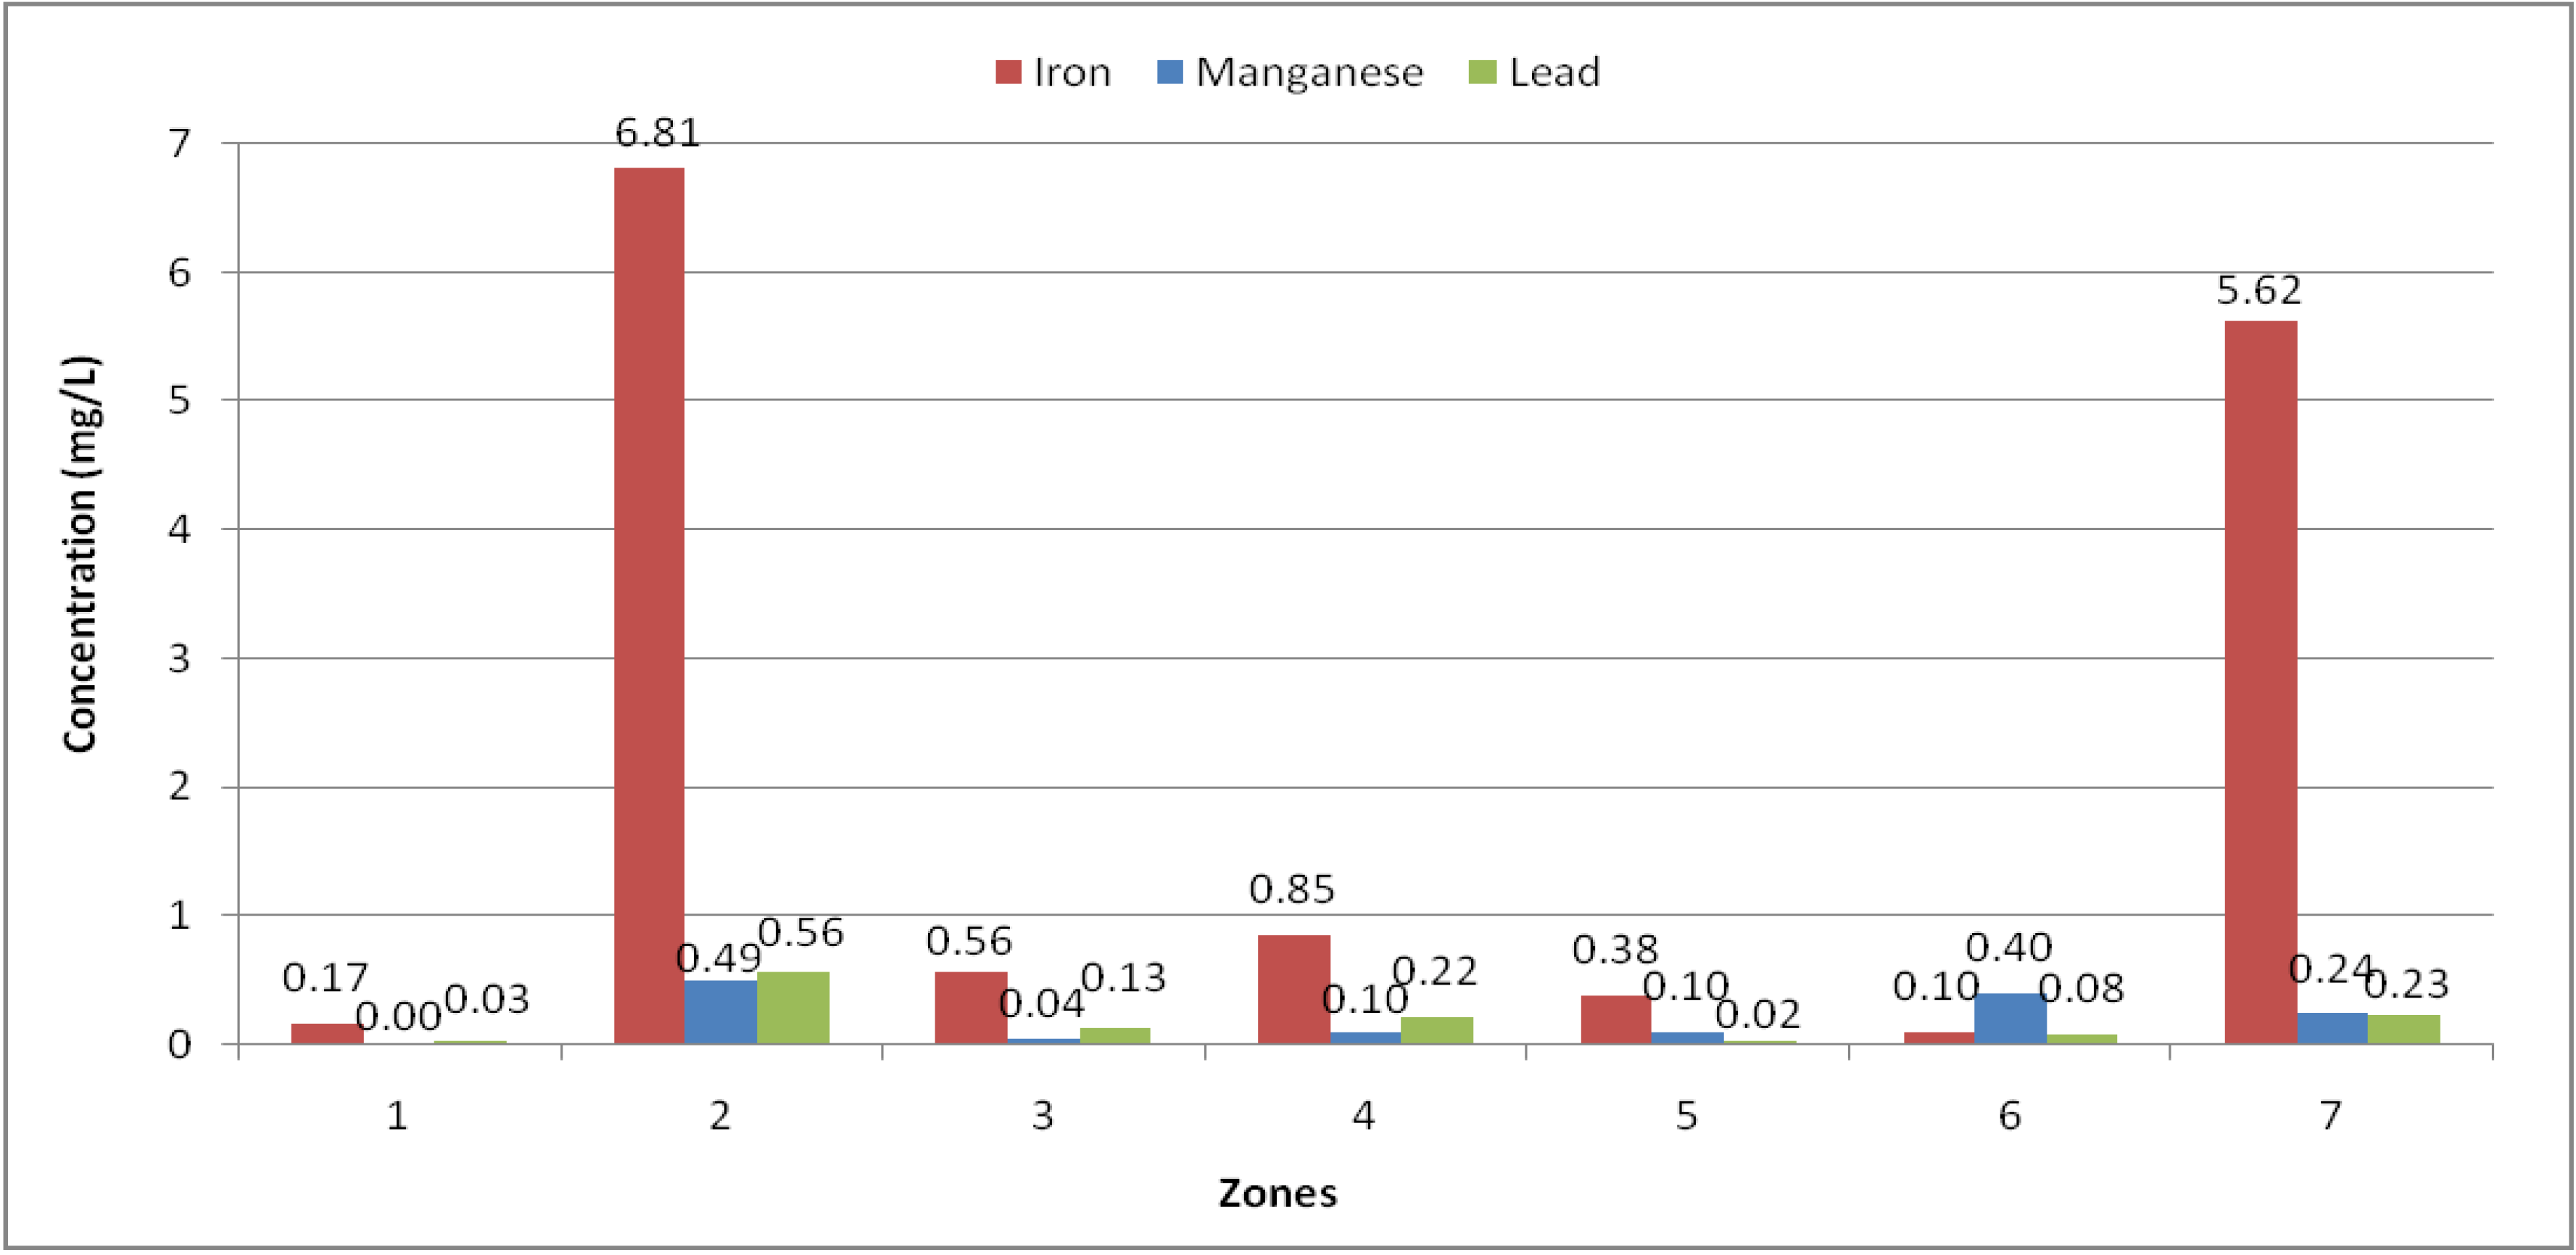
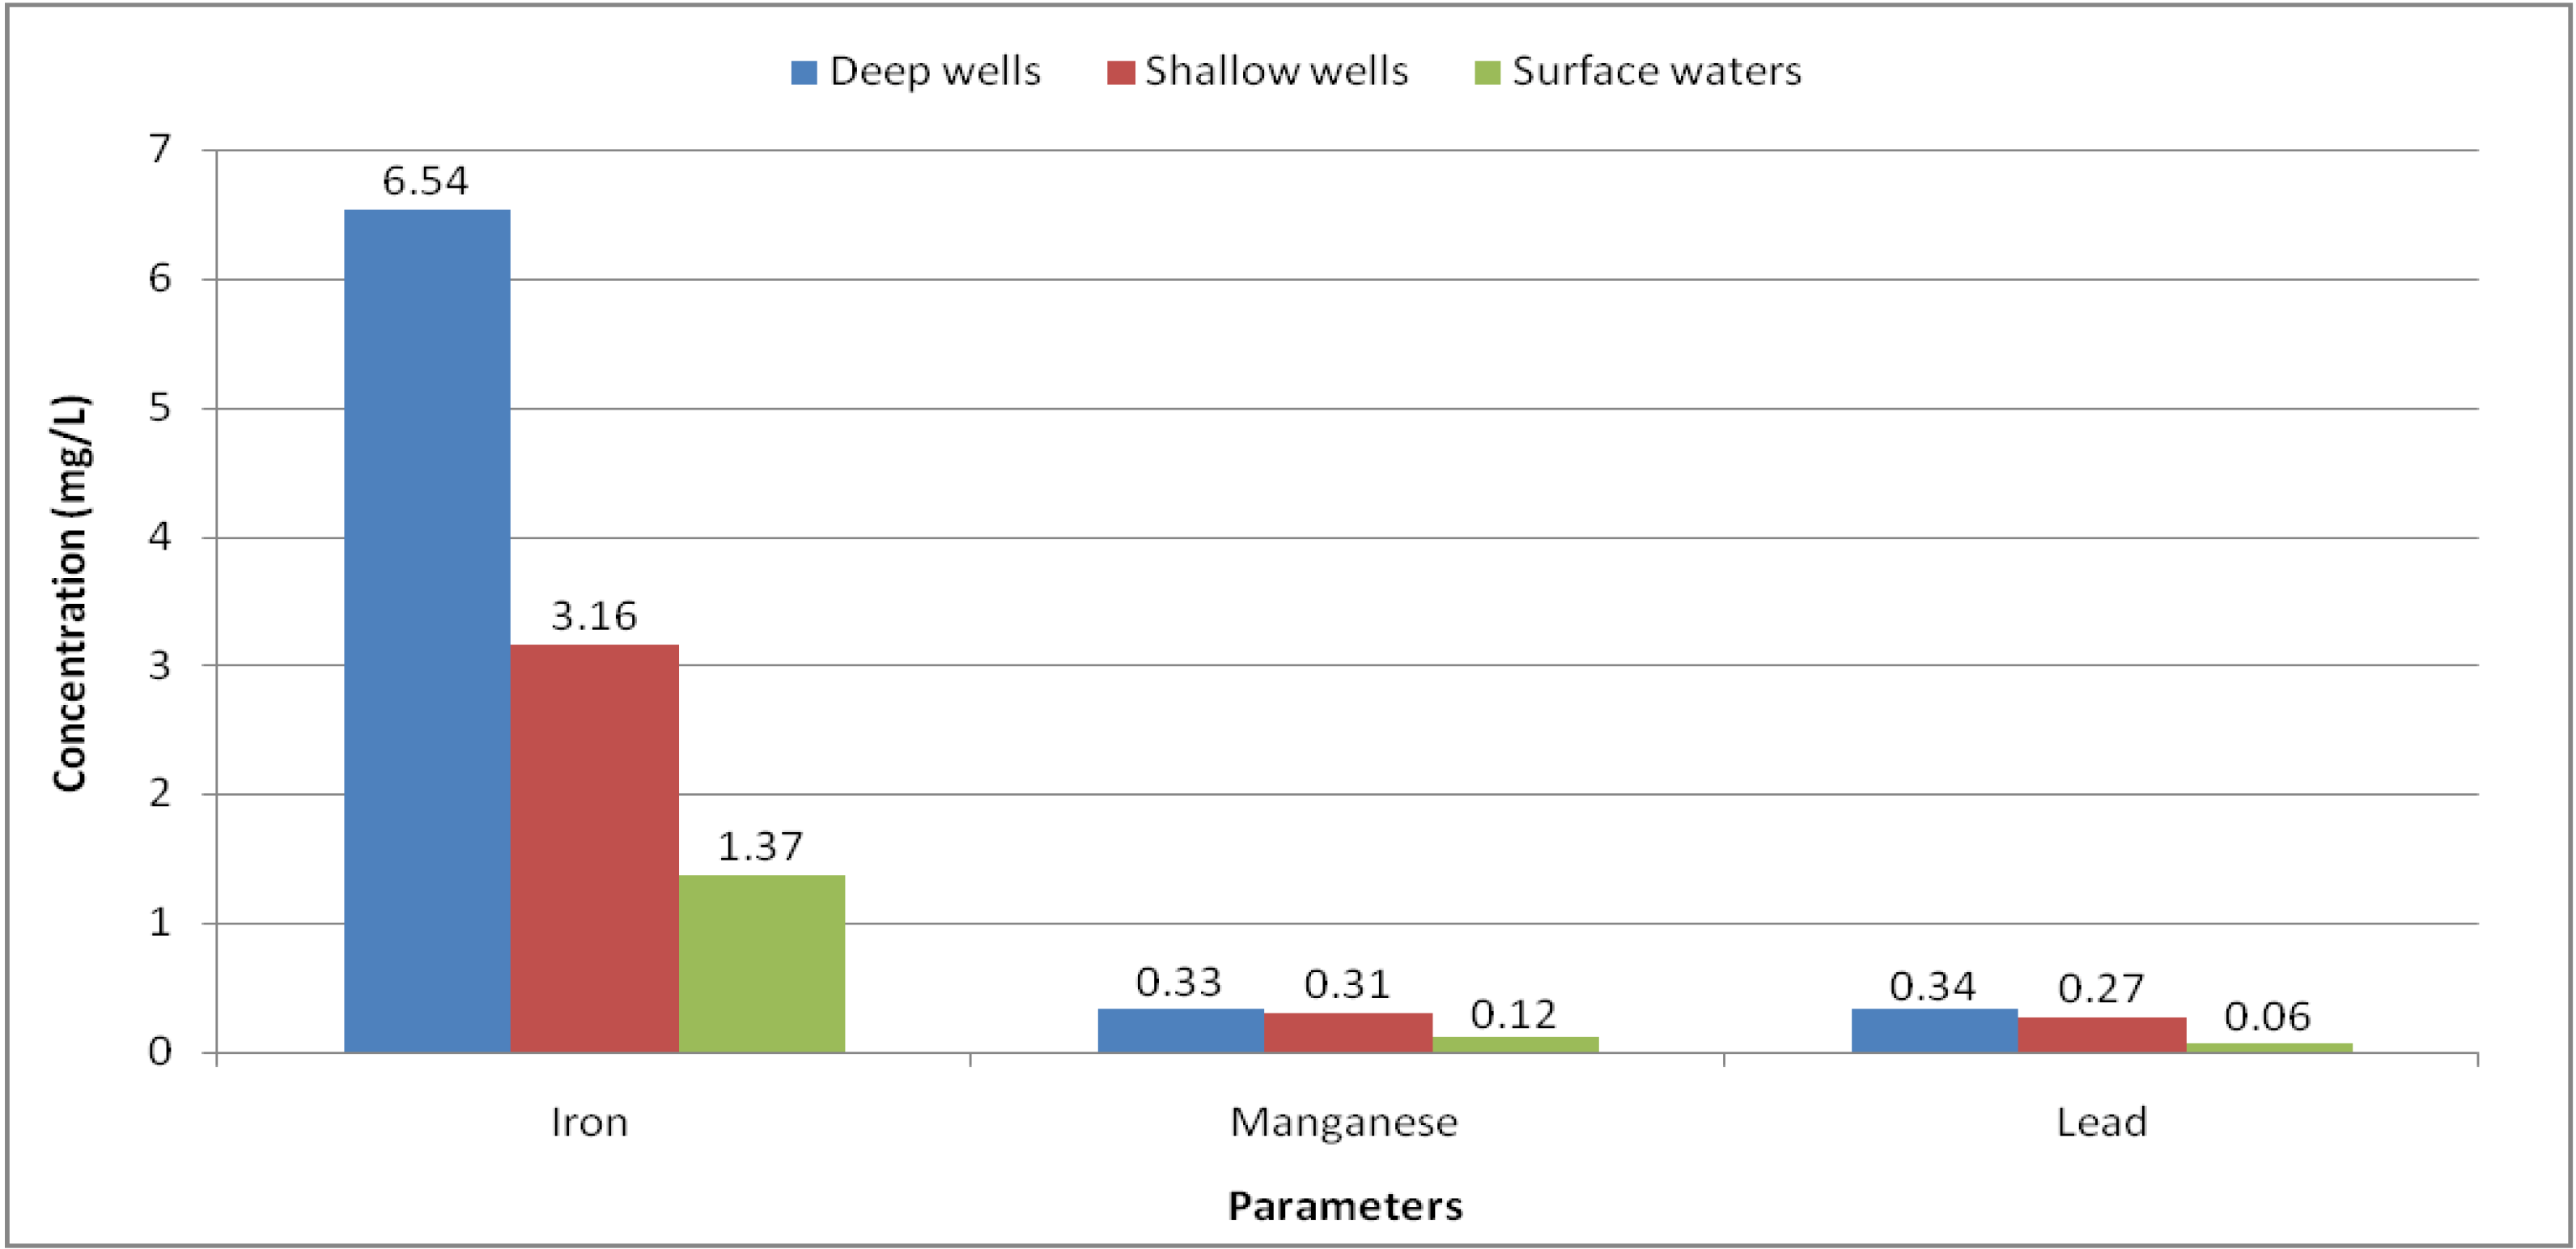
| All | 38 | 3.71 ± 6.93 | 0.00 | 0.39 | 25.20 | 0.30 |
| 1 | 3 | 6.54 ± 9.24 | 0.00 | 0.01 | 19.60 | 0.30 |
| 2 | 9 | 6.54 ± 9.96 | 0.00 | 0.94 | 25.20 | |
| 3 | 10 | 1.97 ± 4.40 | 0.05 | 0.26 | 15.00 | |
| 4 | 7 | 4.35 ± 6.25 | 0.04 | 0.26 | 16.30 | |
| 5 | 9 | 1.37 ± 1.79 | 0.20 | 0.70 | 6.20 | |
| All | 38 | 0.27 ± 0.42 | 0.00 | 0.00 | 1.50 | 0.40 |
| 1 | 3 | 0.3 ± 0.42 | 0.00 | 0.00 | 0.90 | 0.40 |
| 2 | 9 | 0.36 ± 0.52 | 0.00 | 0.00 | 1.50 | |
| 3 | 10 | 0.24 ± 0.39 | 0.00 | 0.00 | 1.10 | |
| 4 | 7 | 0.37 ± 0.41 | 0.00 | 0.20 | 1.10 | |
| 5 | 9 | 0.12 ± 0.28 | 0.00 | 0.00 | 0.90 | |
| All | 20 | 0.14 ± 0.14 | 0.02 | 0.07 | 0.56 | 3.00 |
| 1 | 3 | 0.23 ± 0.07 | 0.17 | 0.18 | 0.32 | 3.00 |
| 2 | 5 | 0.23 ± 0.20 | 0.03 | 0.15 | 0.56 | |
| 3 | 4 | 0.08 ± 0.05 | 0.04 | 0.07 | 0.16 | |
| 4 | 3 | 0.13 ± 0.08 | 0.04 | 0.13 | 0.22 | |
| 5 | 5 | 0.03 ± 0.01 | 0.02 | 0.03 | 0.04 | |
| All | 37 | 0.29 ± 0.39 | 0.01 | 0.12 | 1.52 | 0.01 |
| 1 | 3 | 0.15 ± 0.15 | 0.02 | 0.07 | 0.36 | 0.01 |
| 2 | 9 | 0.52 ± 0.56 | 0.02 | 0.21 | 1.52 | |
| 3 | 10 | 0.32 ± 0.36 | 0.02 | 0.14 | 1.13 | |
| 4 | 7 | 0.23 ± 0.19 | 0.02 | 0.18 | 0.63 | |
| 5 | 8 | 0.06 ± 0.05 | 0.01 | 0.03 | 0.14 |
| Source category | Turbidity (NTU) | Fe (mg/L) | Mn (mg/L) |
|---|---|---|---|
| 2 | 9.5 | 5.7 | 1.5 |
| 4 | 315.0 | 11.7 | 0.9 |
| 2 | 2.9 | 25.2 | 0.7 |
| 3 | 53.3 | 15.0 | 1.1 |
| 3 | 29.3 | 2.5 | 0.9 |
| 4 | 23.0 | 16.3 | 0.3 |
| 1 | 240.0 | 19.6 | 0.9 |
| 2 | 5.1 | 24.6 | 0.9 |
| 5 | 544.0 | 0.2 | 0.1 |
| 4 | 395.0 | 0.3 | 0.2 |

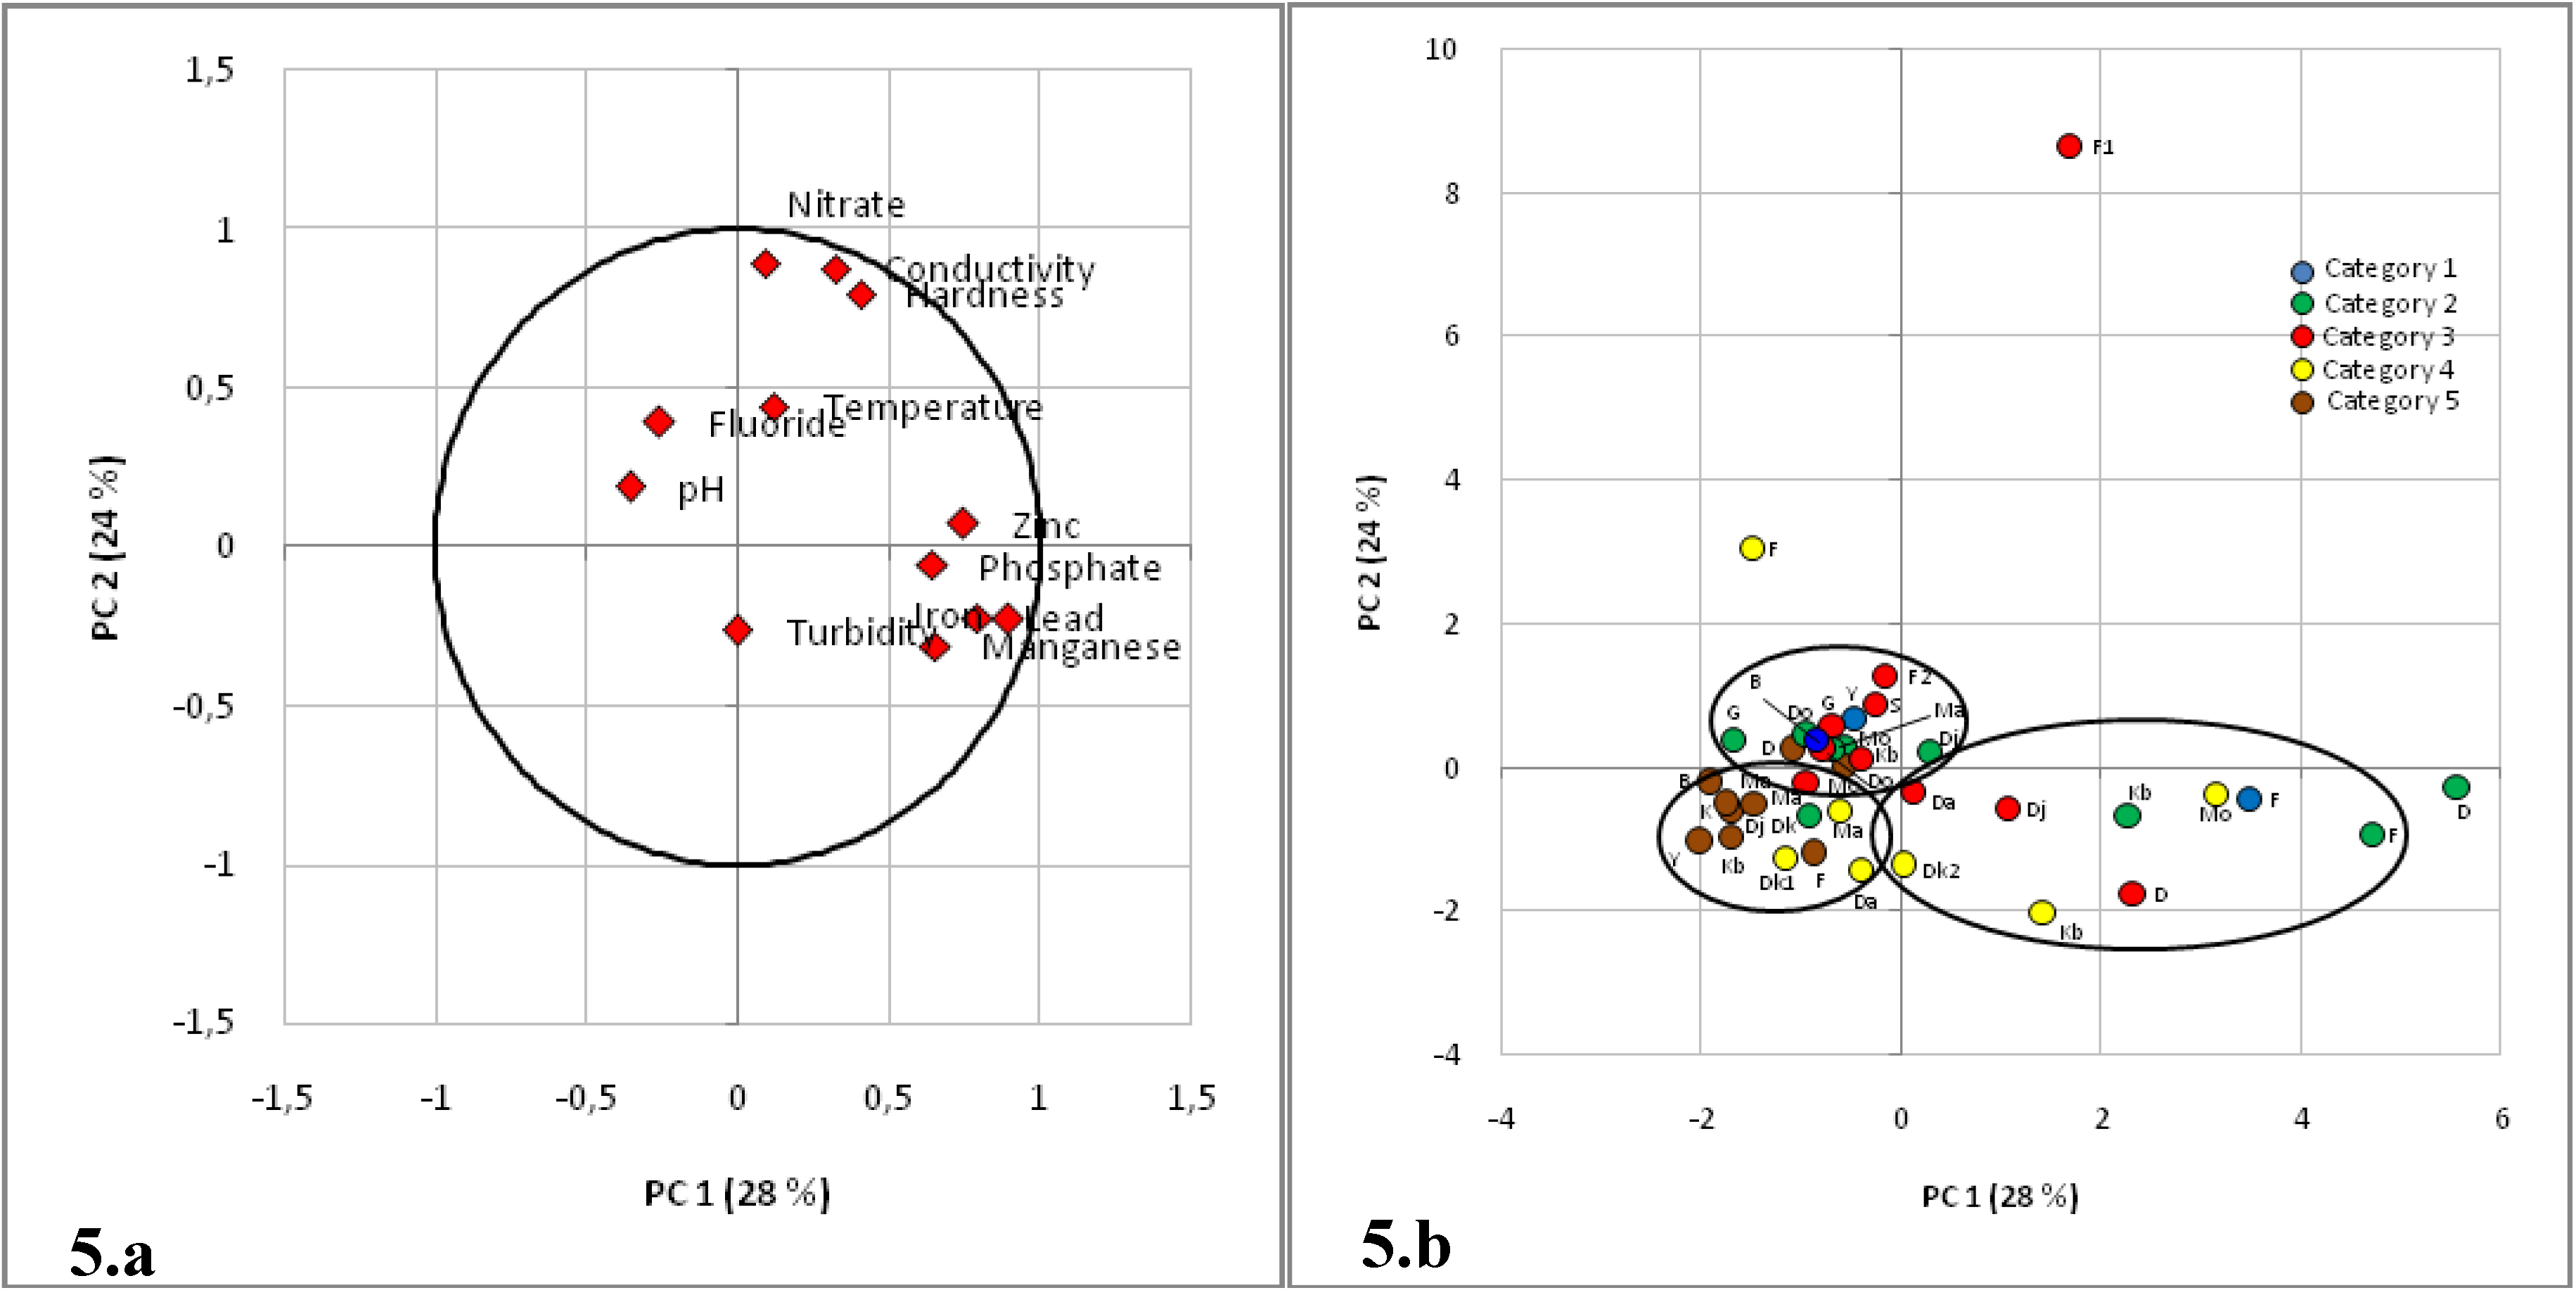
3.2. PCA Profiles of Correlation between Different Parameters

| PC 1 |
|---|
| −0.36 |
| 0.32 |
| 0.12 |
| 0.00 |
| 0.40 |
| −0.26 |
| 0.09 |
| 0.64 |
| 0.89 |
| 0.65 |
| 0.75 |
| 0.79 |
4. Conclusions
Acknowledgments
Conflict of Interest
References
- WHOUNICEFProgress on Sanitation and Drinking Water: 2012 Update; World Health Organisation/UNICEF: Geneva, Switzerland, 2012.
- JPM Technical Task Force Meeting on Monitoring Drinking-water Quality. Available online: http://www.wssinfo.org/fileadmin/user_upload/resources/JMP-Task-Force-Meeting-on-Monitoring-Drinking-water-Quality.pdf (accessed on 9 July 2013).
- Feldman, P.; Rosenboom, J.; Saray, M.; Samnang, C.; Navuth, P.; Iddings, S. Assessment of the chemical quality of drinking water in Cambodia. J. Water Health 2007, 5, 101–116. [Google Scholar] [CrossRef]
- Quagraine, E.K.; Adokoh, C.K. Assessment of dry season surface, ground, and treated water quality in the Cape Coast municipality of Ghana. Environ. Monit. Assess. 2010, 160, 521–539. [Google Scholar] [CrossRef]
- Rossiter, H.; Owusu, P.A.; Awuah, E.; MacDonald, A.M.; Schäfer, A.I. Chemical drinking water quality in Ghana: Water costs and scope for advanced treatment. Sci. Total. Environ. 2010, 408, 2378–2386. [Google Scholar] [CrossRef]
- Rahman, I.M.M.; Islam, M.M.; Hossain, M.M.; Hossain, M.S.; Begum, Z.A.; Chowdhury, D.A.; Chakraborty, M.K.; Rahman, M.A.; Nazimuddin, M.; Hasegawa, H. Stagnant surface water bodies (SSWBs) as an alternative water resource for the Chittagong metropolitan area of Bangladesh: physicochemical characterization in terms of water quality indices. Environ. Monit. Assess. 2011, 173, 669–684. [Google Scholar] [CrossRef]
- Adekunle, I.M.; Adetunji, M.T.; Gbadebo, A.M.; Banjoko, O.B. Assessment of groundwater quality in a typical rural settlement in Southwest Nigeria. Int. J. Environ. Res. Public. Health. 2007, 4, 307–318. [Google Scholar] [CrossRef]
- WHO, Guidelines for Drinking-Water Quality, 4th ed.; World Health Organisation: Geneva, Switzerland.
- Hoko, Z. An assessment of quality of water from boreholes in Bindura District, Zimbabwe. Phys. Chem. Earth, Parts A/B/C 2008, 33, 824–828. [Google Scholar] [CrossRef]
- Mbawala, A.; Abdou, A.; Ngassoum, M.B. Evaluation de la pollution physico-chimique et microbienne des eaux de puits de Dang-Ngaoundéré (Cameroun). (in French). IJBCS 2010, 4, 1962–1975. [Google Scholar]
- Memon, M.; Soomro, M.S.; Akhtar, M.S.; Memon, K.S. Drinking water quality assessment in Southern Sindh (Pakistan). Environmen. Monit. Assess. 2011, 177, 39–50. [Google Scholar] [CrossRef]
- Sharaky, A.M.; Atta, S.A.; El Hassanein, A.S.; Khallaf, K.M.A. Hydrogeochemistry of Groundwater in the Western Nile Delta Aquifers, Egypt. In Proceeding of the 2nd International Conference on the Geology of Tethys, Cairo, Egypt, 19–21 March 2007; pp. 19–21.
- Cobbina, S.J.; Nyame, F.K.; Obiri, S. Groundwater Quality in the Sahelian Region of Northern Ghana, West Africa. Res. J. Environ. Earth. Sci. 2012, 4, 482–491. [Google Scholar]
- Tchounwou, P.B.; Lantum, D.M.; Monkiedje, A.; Takougang, I.; Barbazan, P. The urgent need for environmental sanitation and a safe drinking water supply in Mbandjock, Cameroon. Arch. Environ. Contam. Toxicol. 1997, 33, 17–22. [Google Scholar]
- Mkandawire, T. Quality of groundwater from shallow wells of selected villages in Blantyre District, Malawi. Phys. Chem. Earth, Parts A/B/C 2008, 33, 807–811. [Google Scholar]
- Ketchemen, B. Etude hydrogéologique du grand Yaéré (Extrême-Nord du Cameroun); synthèse hydrogéologique et étude de la recharge par les isotopes de l’environnement. Ph.D. Thesis, Cheik Anta Diop University, Dakar, Senegal, 1992. [Google Scholar]
- Ngatcha, B.N.; Mudry, J.; Aranyossy, J.F.; Naah, E.; Reynault, J.S. Contribution of geology, hydrogeology and environmental isotopes to the knowledge of “piezometric depressions” of the Grand Yaere (Northern Cameroon). (in French). Rev. Sci. Eau 2007, 20, 29–43. [Google Scholar]
- Bartram, J.; Balance, R. Water Quality Monitoring—A Practical Guide to the Design and Implementation of Freshwater Quality Studies and Monitoring Programmes; World Health Organisation: Geneva, Switzerland, 1996. [Google Scholar]
- WHO, Guidelines for Drinking-Water Quality, Volume 3, Surveillance and Control of Community Supplies, 2nd ed.; World Health Organisation: Geneva, Switzerland, 1997.
- Broo, A.E.; Berghult, B.; Hedberg, T. Copper corrosion in drinking water distribution systems—the influence of water quality. Corrosion Sci. 1997, 39, 1119–1132. [Google Scholar] [CrossRef]
- Pehkonen, S.O.; Palit, A.; Zhang, X. Effect of specific water quality parameters on copper corrosion. Corrosion 2002, 58, 156–165. [Google Scholar] [CrossRef]
- Schock, M.R. Causes of temporal variability of lead in domestic plumbing systems. Environ. Monitor. Assess. 1990, 15, 59–82. [Google Scholar] [CrossRef]
- Kim, E.J.; Herrera, J.E.; Huggins, D.; Braam, J.; Koshowski, S. Effect of pH on the concentrations of lead and trace contaminants in drinking water: A combined batch, pipe loop and sentinel home study. Water Res. 2011, 45, 2763–2774. [Google Scholar] [CrossRef]
- ATSDR-Agency for Toxic Substances and Disease Registry. Toxicological Profile for Manganese; US Department of Health and Human Services, Public Health Service: Atlanta, GA, USA, 2000. Available online: www.atsdr.cdc.gov/toxprofiles/tp151.html (accessed on 20 September 2012).
- Kondakis, X.G.; Makris, N.; Leotsinidis, M.; Prinou, M.; Papapetropoulos, T. Possible health effects of high manganese concentration in drinking water. Arch. Environ. Health 1989, 44, 175–178. [Google Scholar] [CrossRef]
- He, P.; Liu, D.H; Zhang, G.Q. Effects of high-level manganese sewage irrigation on children’s neurobehavior. (in Chinese). Zhonghua Yu Fang Yi Xue Za Zhi 1994, 28, 216–218. [Google Scholar]
- Zhang, G.; Liu, D.; He, P. Effects of manganese on learning abilities in school children. (in Chinese). Zhonghua Yu Fang Yi Xue Za Zhi 1995, 29, 156–158. [Google Scholar]
- Woolf, A.; Wright, R.; Amarasiriwardena, C.; Bellinger, D. A child with chronic manganese exposure from drinking water. Environ. Health Perspesc. 2002, 110, 613–616. [Google Scholar]
- EPA, Drinking Water Health Advisory for Manganese; U.S. Environmental Protection Agency: Washington, DC, USA, 2004.
- EPA. Secondary drinking water regulations. Available online: http://water.epa.gov/drink/contaminants/secondarystandards.cfm (accessed on 21 June 2013).
© 2013 by the authors; licensee MDPI, Basel, Switzerland. This article is an open access article distributed under the terms and conditions of the Creative Commons Attribution license (http://creativecommons.org/licenses/by/3.0/).
Share and Cite
Sorlini, S.; Palazzini, D.; Sieliechi, J.M.; Ngassoum, M.B. Assessment of Physical-Chemical Drinking Water Quality in the Logone Valley (Chad-Cameroon). Sustainability 2013, 5, 3060-3076. https://doi.org/10.3390/su5073060
Sorlini S, Palazzini D, Sieliechi JM, Ngassoum MB. Assessment of Physical-Chemical Drinking Water Quality in the Logone Valley (Chad-Cameroon). Sustainability. 2013; 5(7):3060-3076. https://doi.org/10.3390/su5073060
Chicago/Turabian StyleSorlini, Sabrina, Daniela Palazzini, Joseph M. Sieliechi, and Martin B. Ngassoum. 2013. "Assessment of Physical-Chemical Drinking Water Quality in the Logone Valley (Chad-Cameroon)" Sustainability 5, no. 7: 3060-3076. https://doi.org/10.3390/su5073060
APA StyleSorlini, S., Palazzini, D., Sieliechi, J. M., & Ngassoum, M. B. (2013). Assessment of Physical-Chemical Drinking Water Quality in the Logone Valley (Chad-Cameroon). Sustainability, 5(7), 3060-3076. https://doi.org/10.3390/su5073060