Climate and Food Production: Understanding Vulnerability from Past Trends in Africa’s Sudan-Sahel

Abstract
:1. Introduction
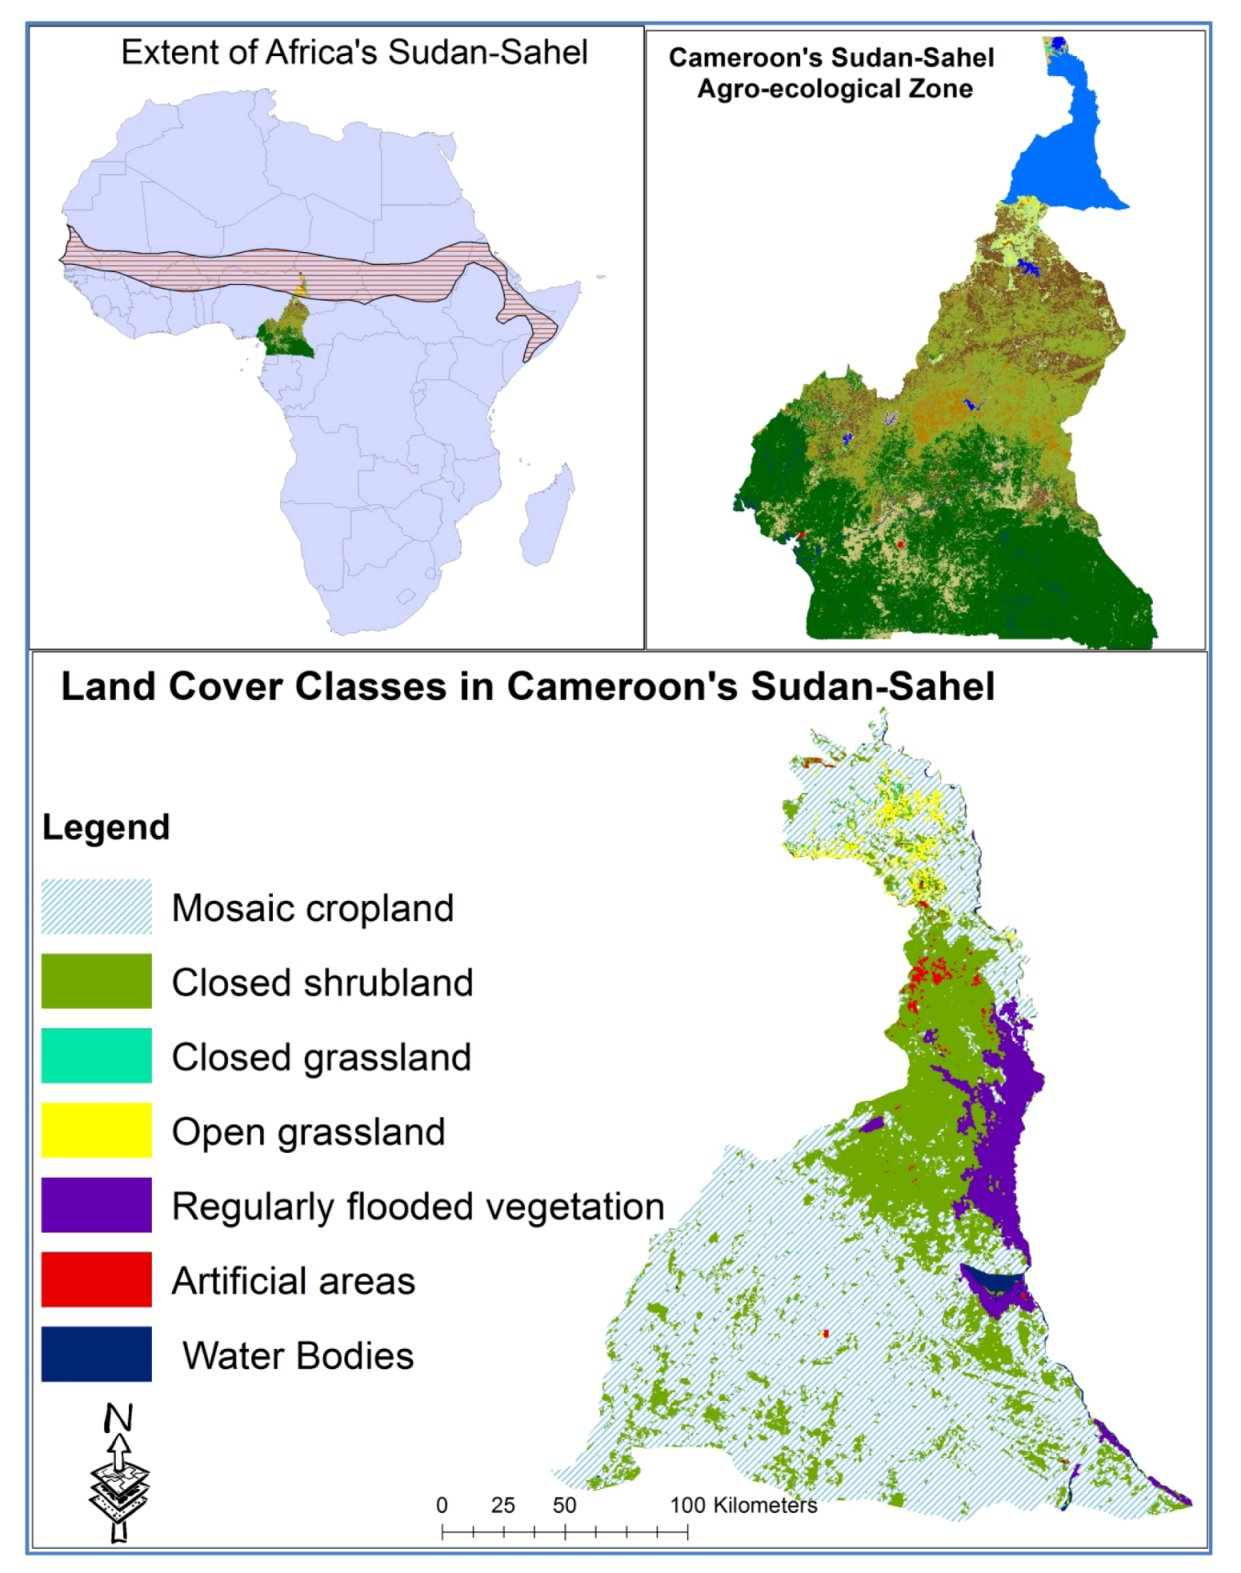
2. Description of the Study Area

3. Methods
3.1. Sources of Data and Analysis
4. Results
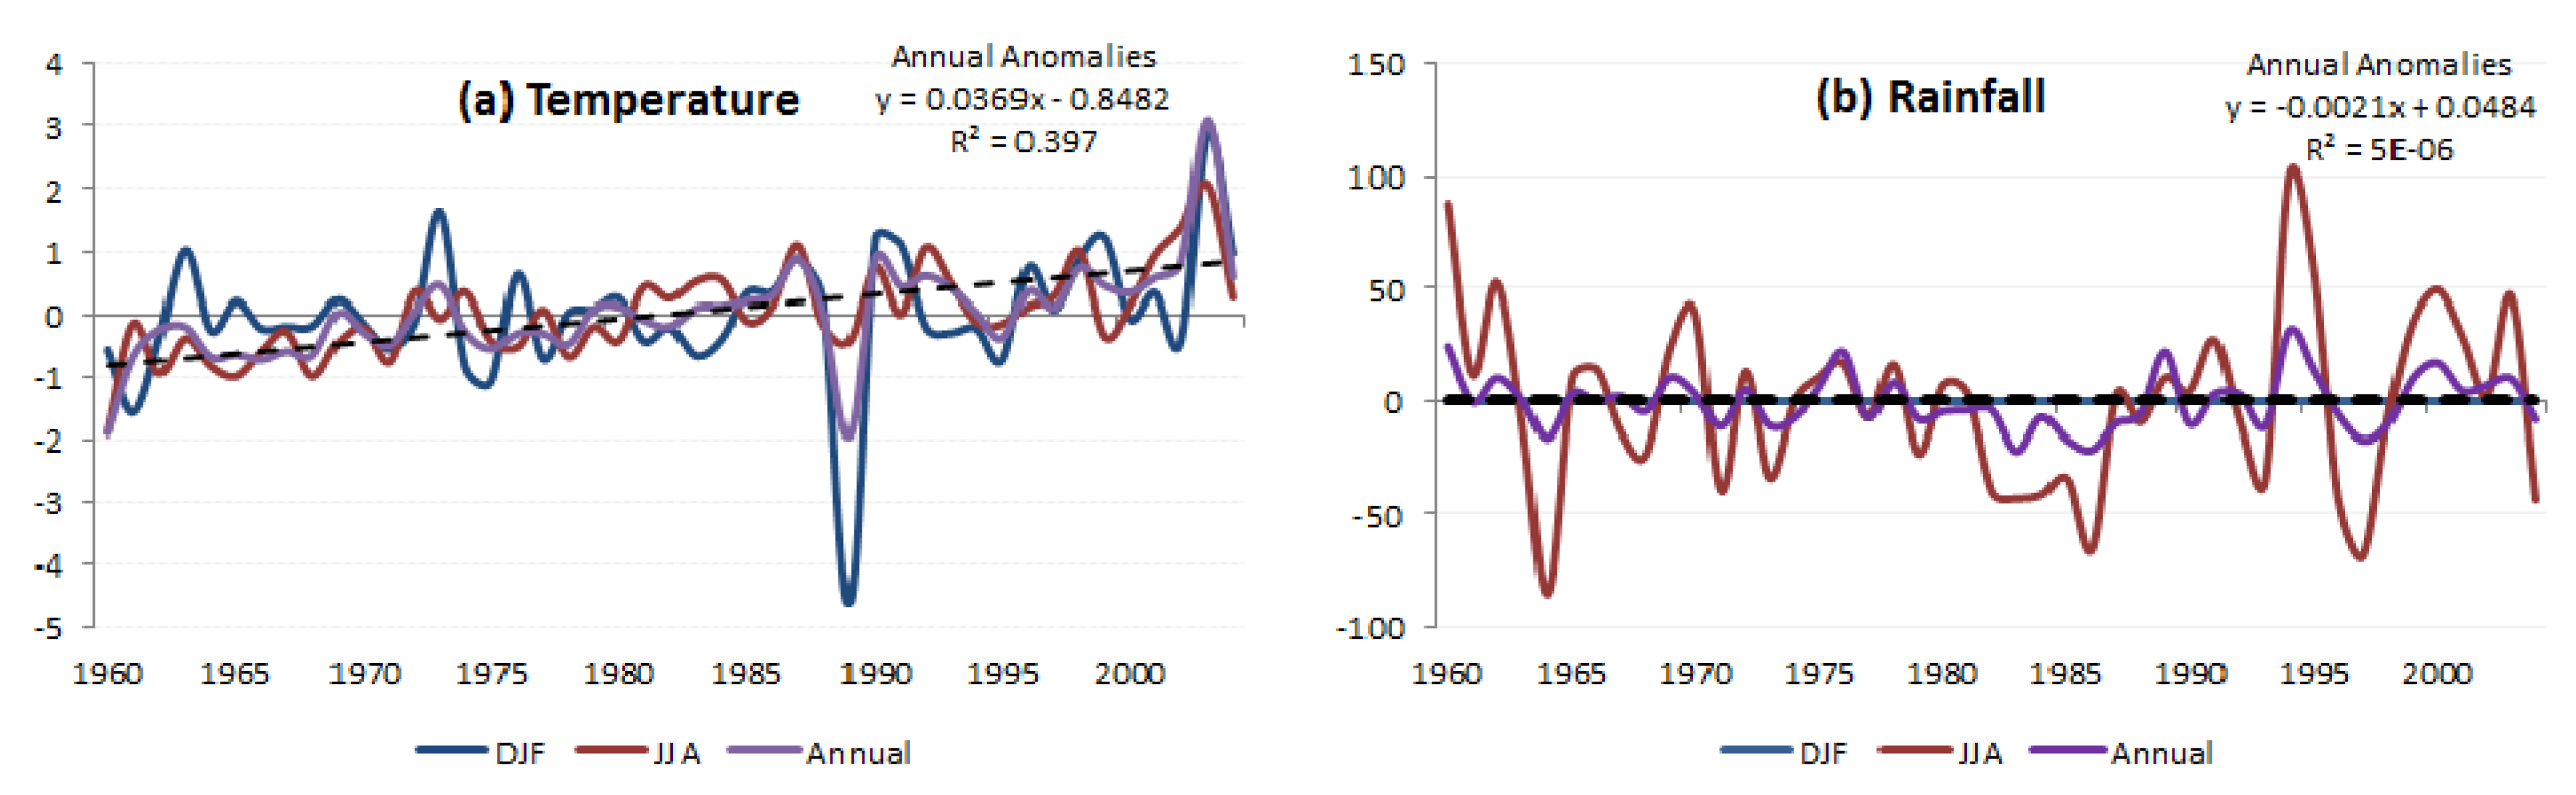
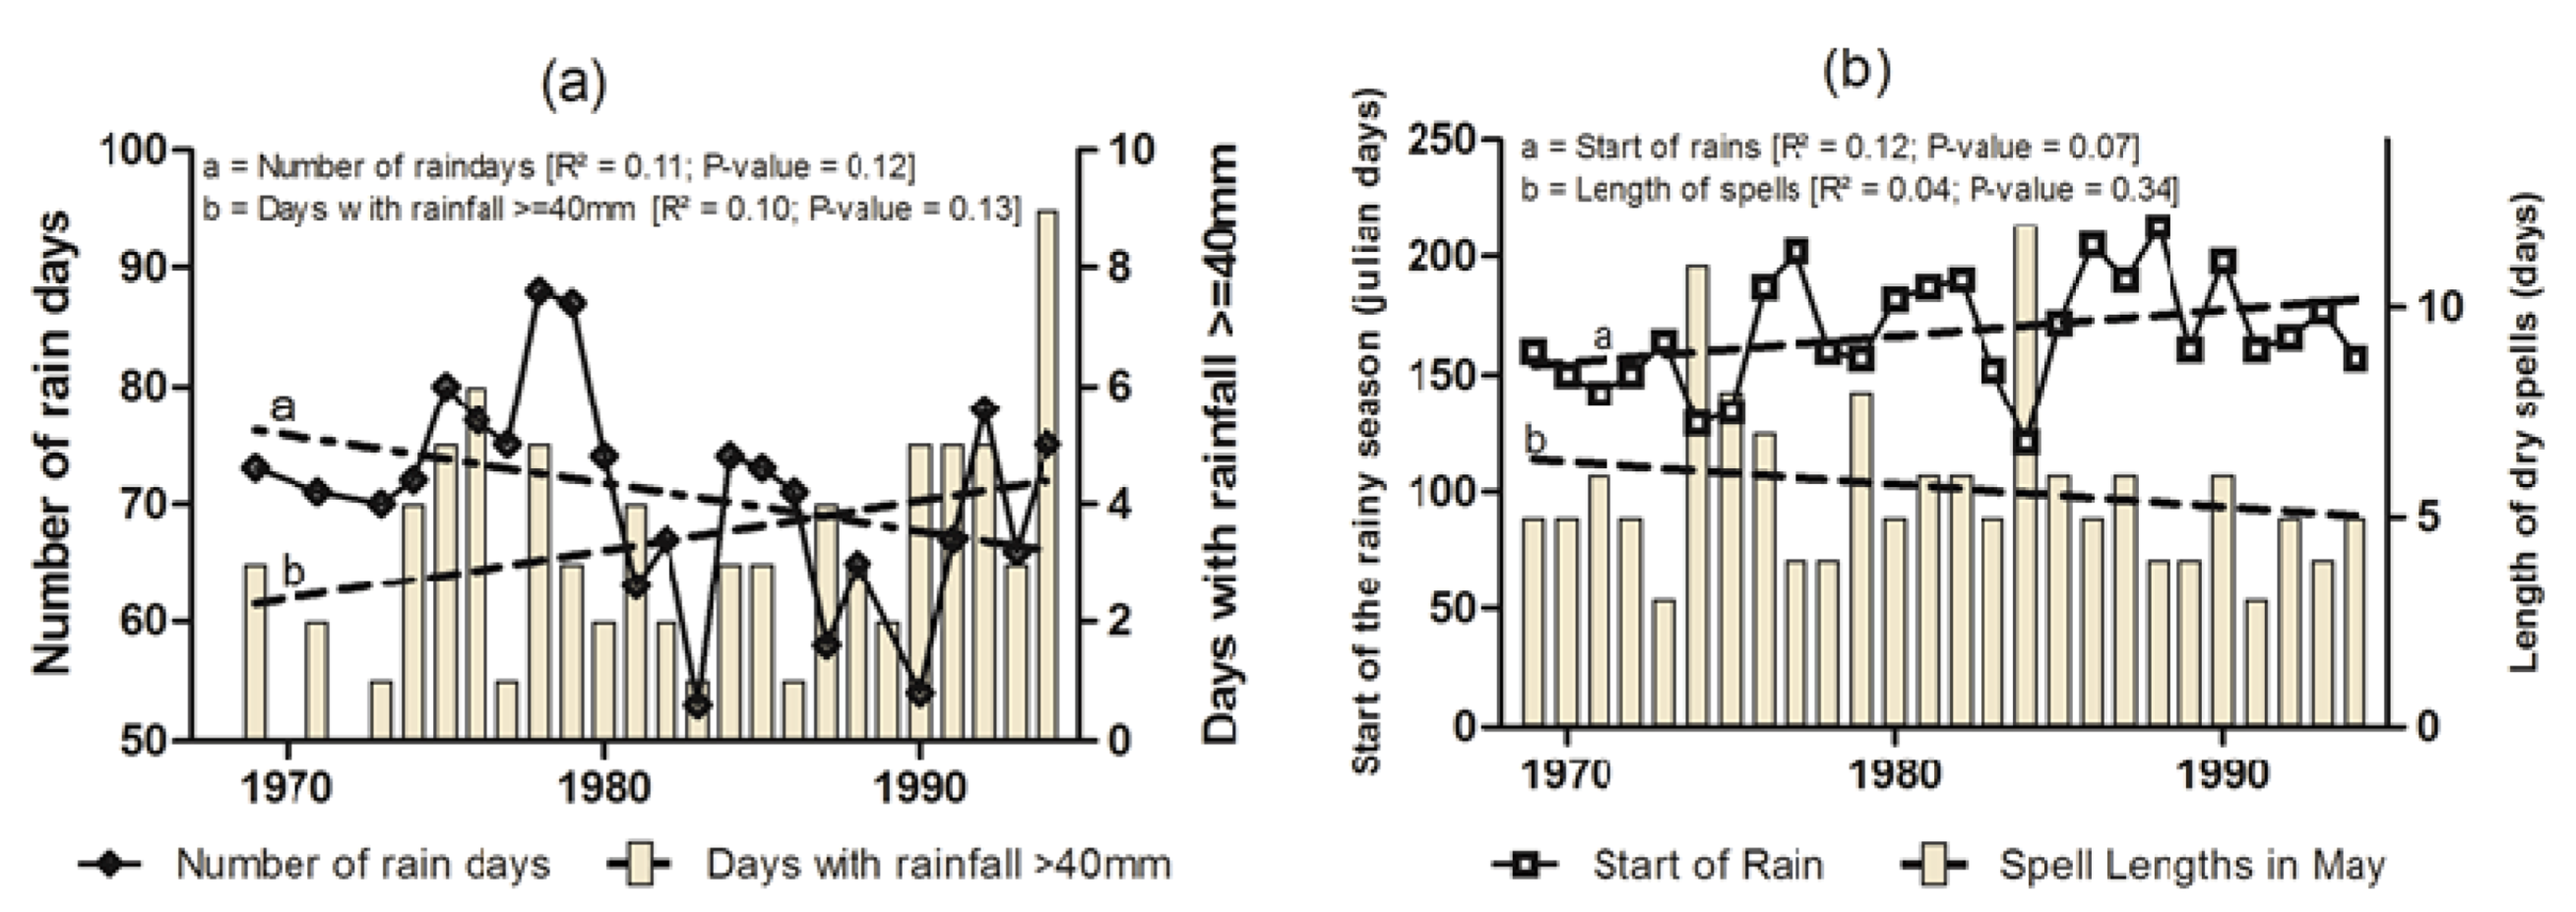
4.1. Trends in Temperature and Precipitation

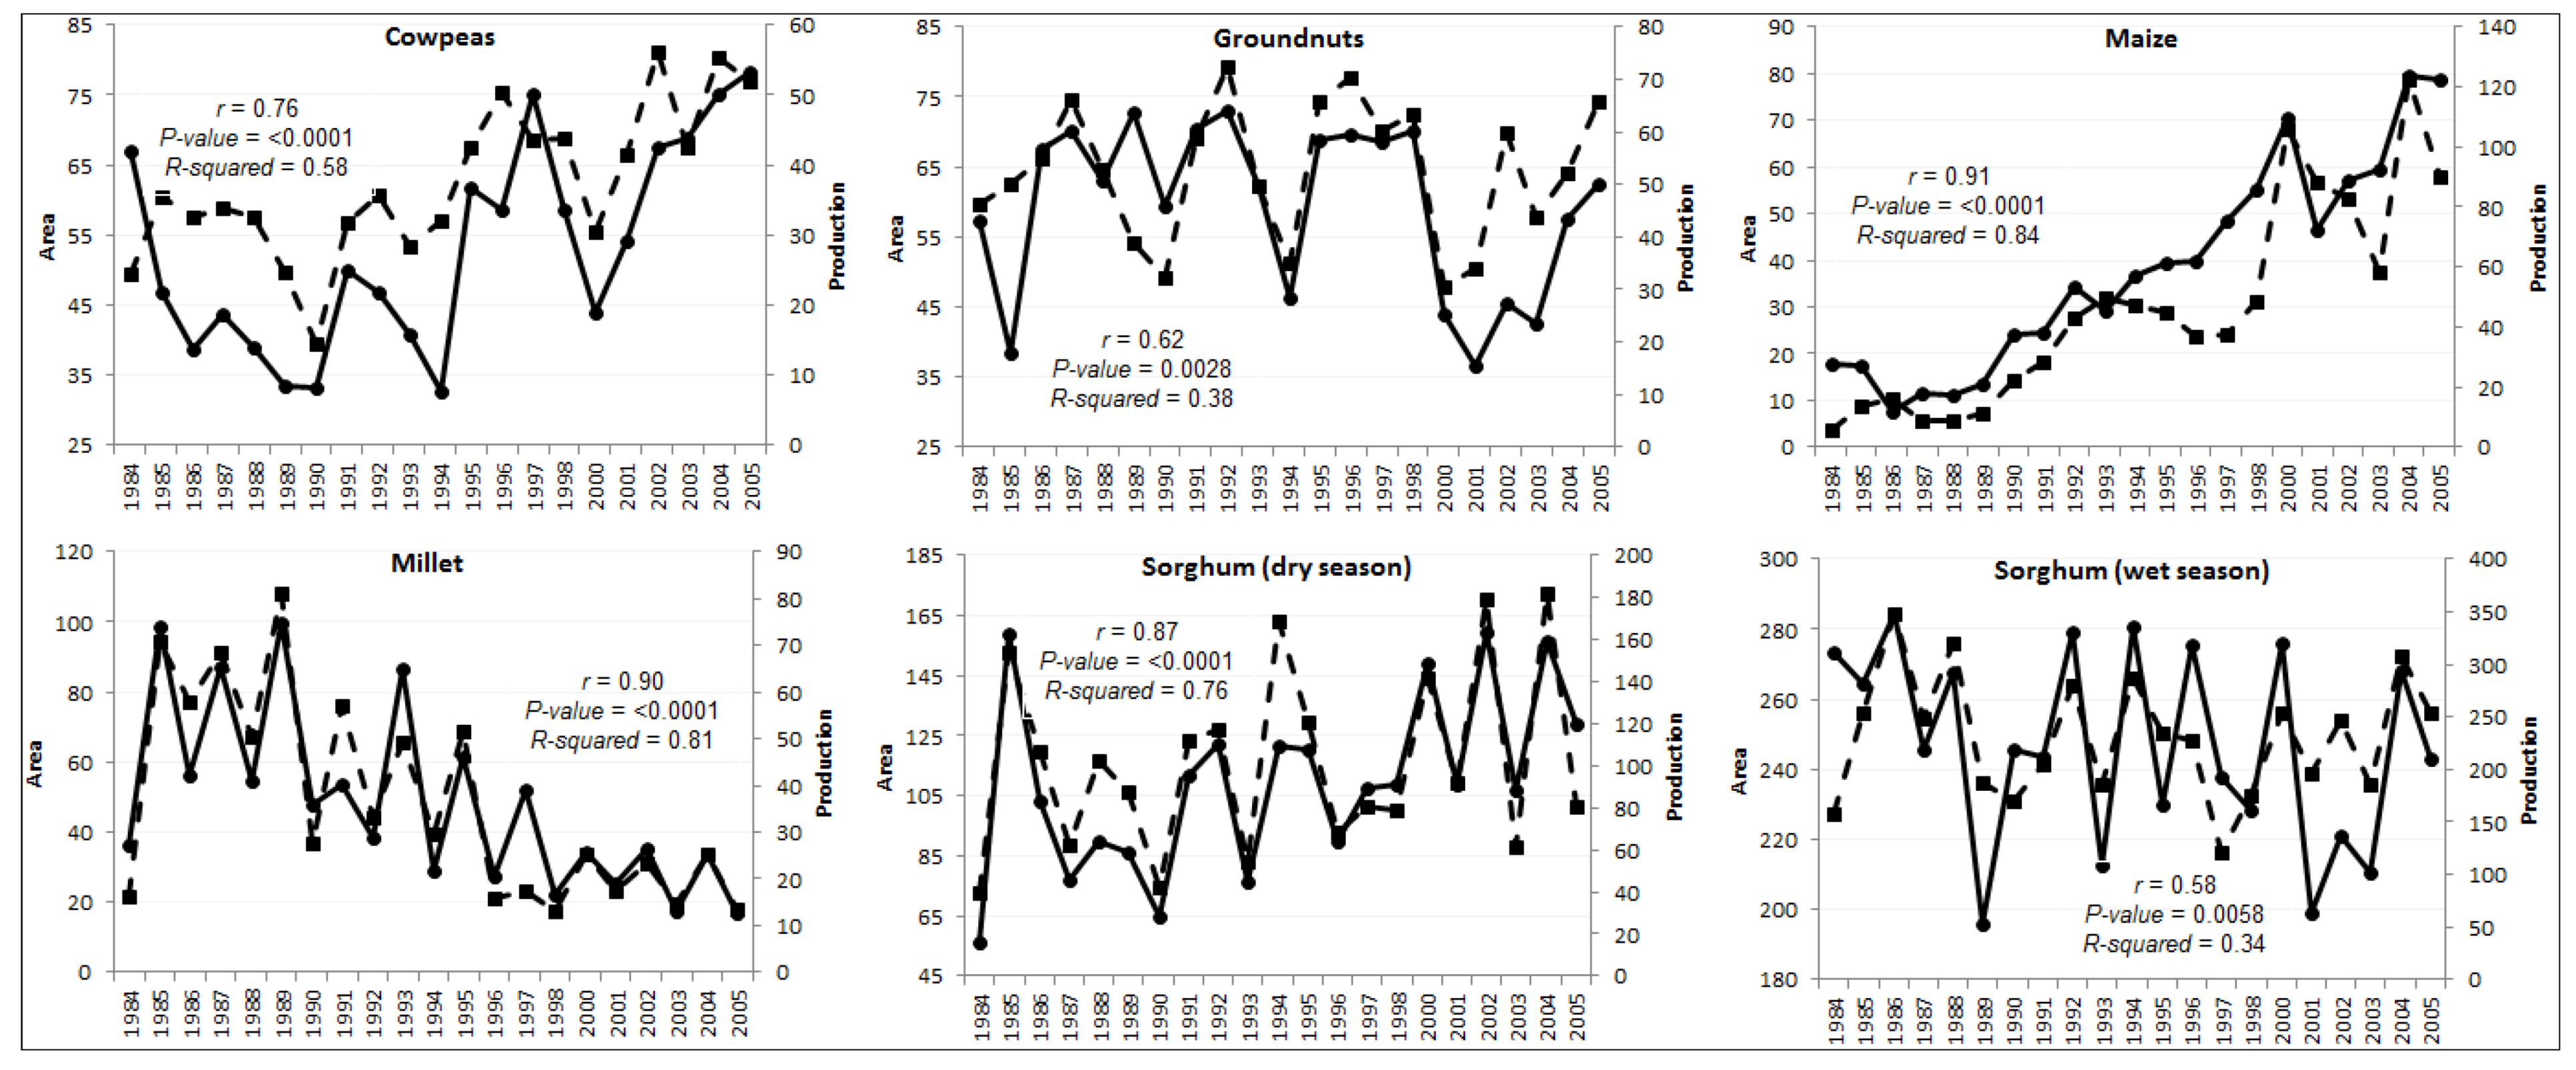
4.2. Trends in Crop Production and Area Cultivated
4.3. Rainfall Variation and Yields

| Crop | Statistic | |||
|---|---|---|---|---|
| R-squared | Correlation | Mean Square Error | P-value | |
| Cowpeas | 0.08 | 0.28 | 0.97 | 0.2125 |
| Groundnuts | 0.04 | −0.19 | 1.01 | 0.3846 |
| Maize | 0.03 | 0.17 | 1.02 | 0.4327 |
| Millet | 0.13 | 0.36 | 0.91 | 0.1116 |
| Sorghum (dry) | 0.28 | 0.53 | 0.76 | 0.0132 |
| Sorghum (wet) | 0.07 | 0.26 | 0.98 | 0.2515 |
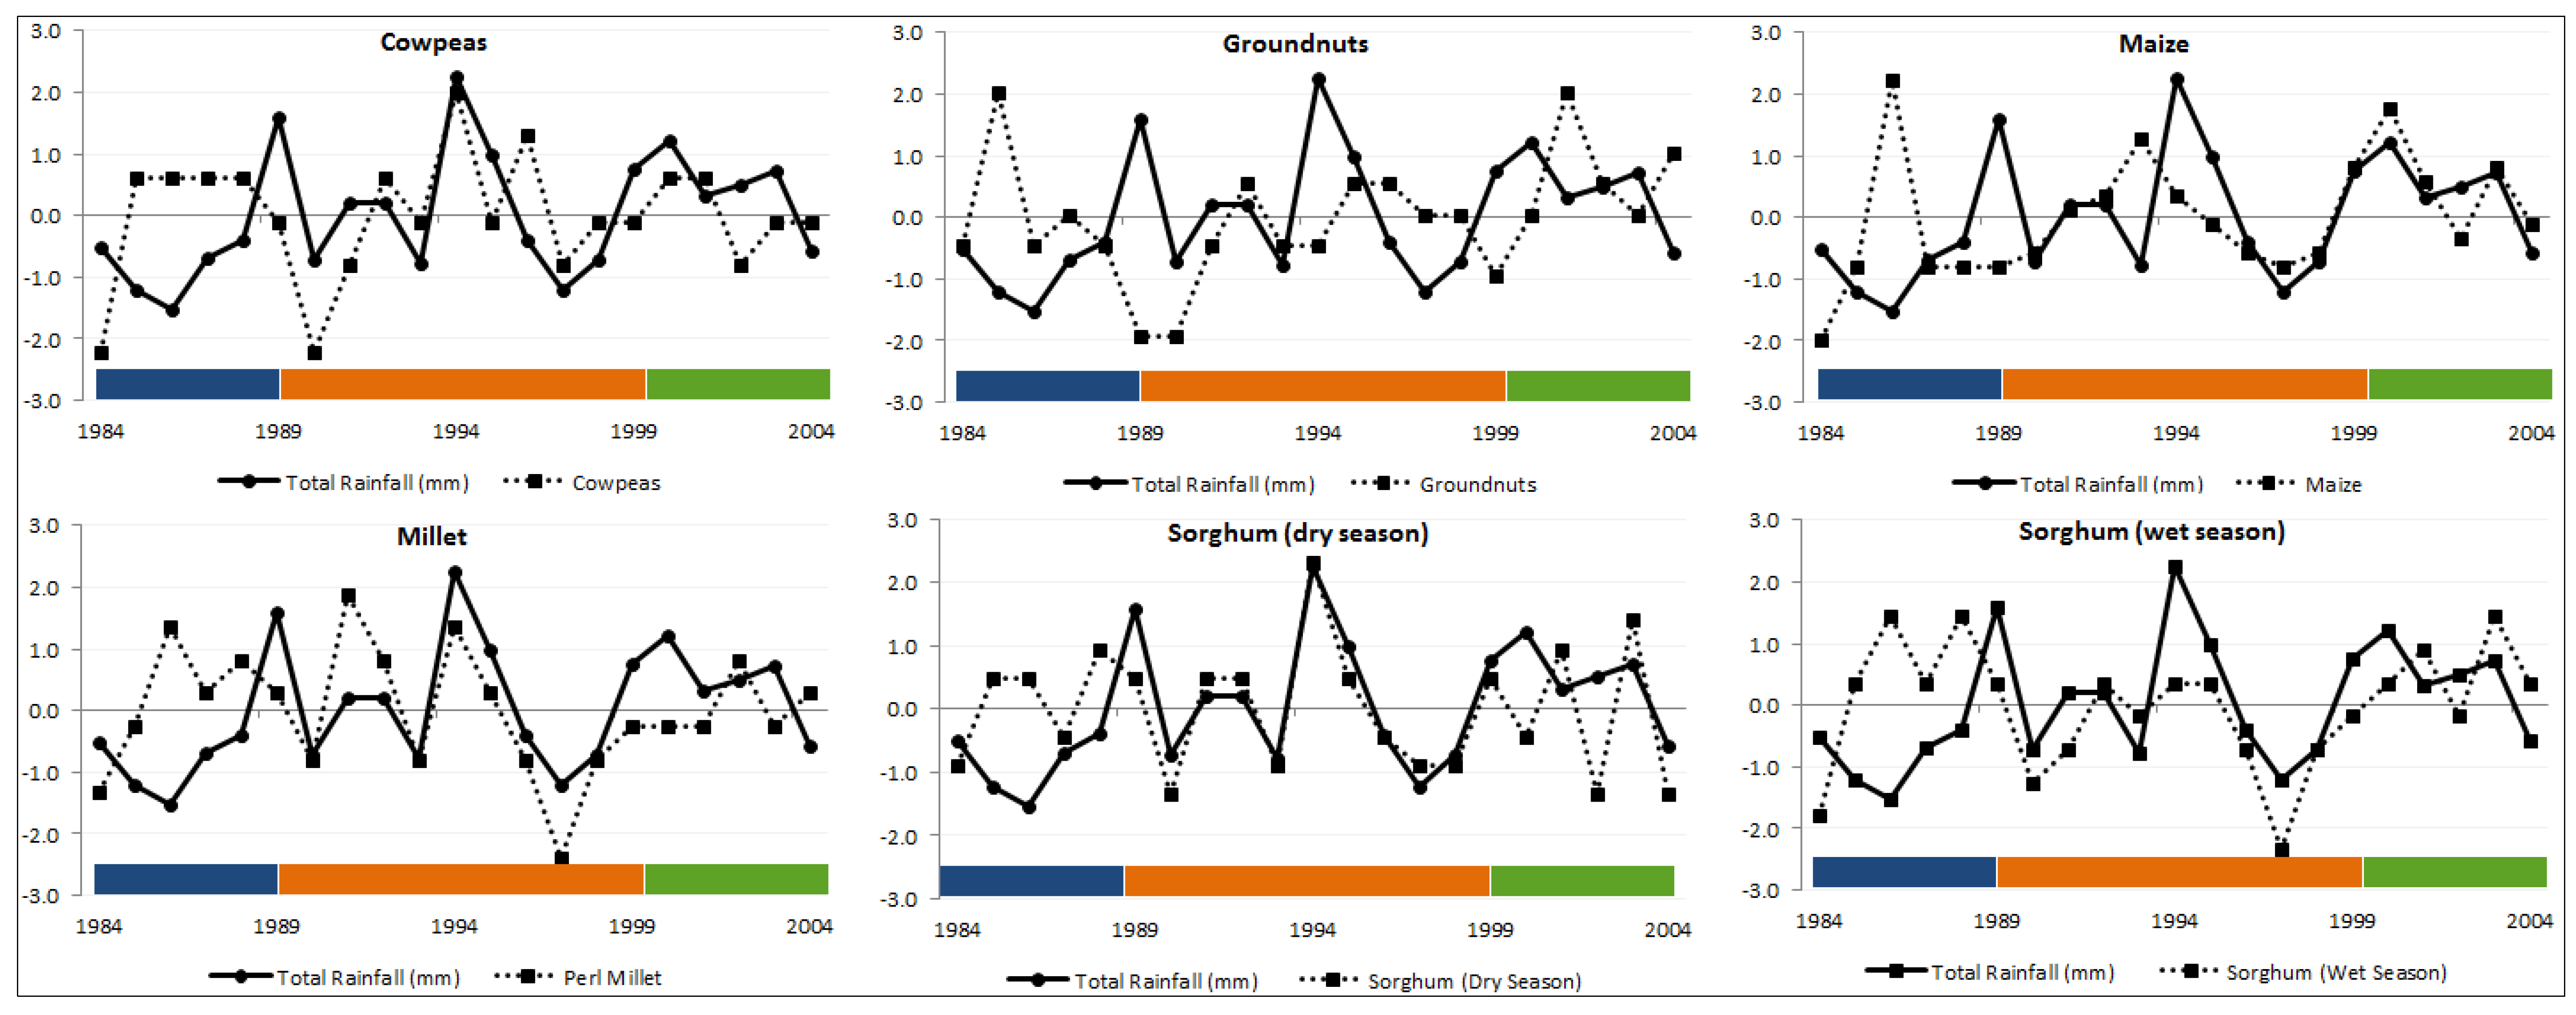
4.4. Effects of Support for Agriculture on the Rainfall—Crop Yields Time-series

| Crop | Period | Statistic | ||
|---|---|---|---|---|
| r | P-value | R2 | ||
| Cow Peas | 1984–1989 | −0.21 | 0.6868 | 0.045 |
| 1990–1999 | 0.59 | 0.075 | 0.34 | |
| 2000–2004 | 0.26 | 0.6701 | 0.069 | |
| Groundnut | 1984–1989 | −0.73 | 0.1016 | 0.53 |
| 1990–1999 | 0.071 | 0.8463 | 0.005 | |
| 2000–2004 | −0.55 | 0.3353 | 0.3 | |
| Maize | 1984–1989 | −0.4 | 0.4281 | 0.16 |
| 1990–1999 | 0.38 | 0.2785 | 0.14 | |
| 2000–2004 | 0.74 | 0.1508 | 0.55 | |
| Pearl Millet | 1984–1989 | −0.12 | 0.8231 | 0.014 |
| 1990–1999 | 0.73 | 0.0162 | 0.54 | |
| 2000–2004 | −0.4 | 0.5071 | 0.16 | |
| Sorghum (dry) | 1984–1989 | 0.085 | 0.8732 | 0.0072 |
| 1990–1999 | 0.95 | <0.0001 | 0.9 | |
| 2000–2004 | 0.38 | 0.532 | 0.14 | |
| Sorghum (wet) | 1984–1989 | −0.14 | 0.7917 | 0.02 |
| 1990–1999 | 0.74 | 0.0151 | 0.54 | |
| 2000–2004 | 0.11 | 0.8626 | 0.012 | |
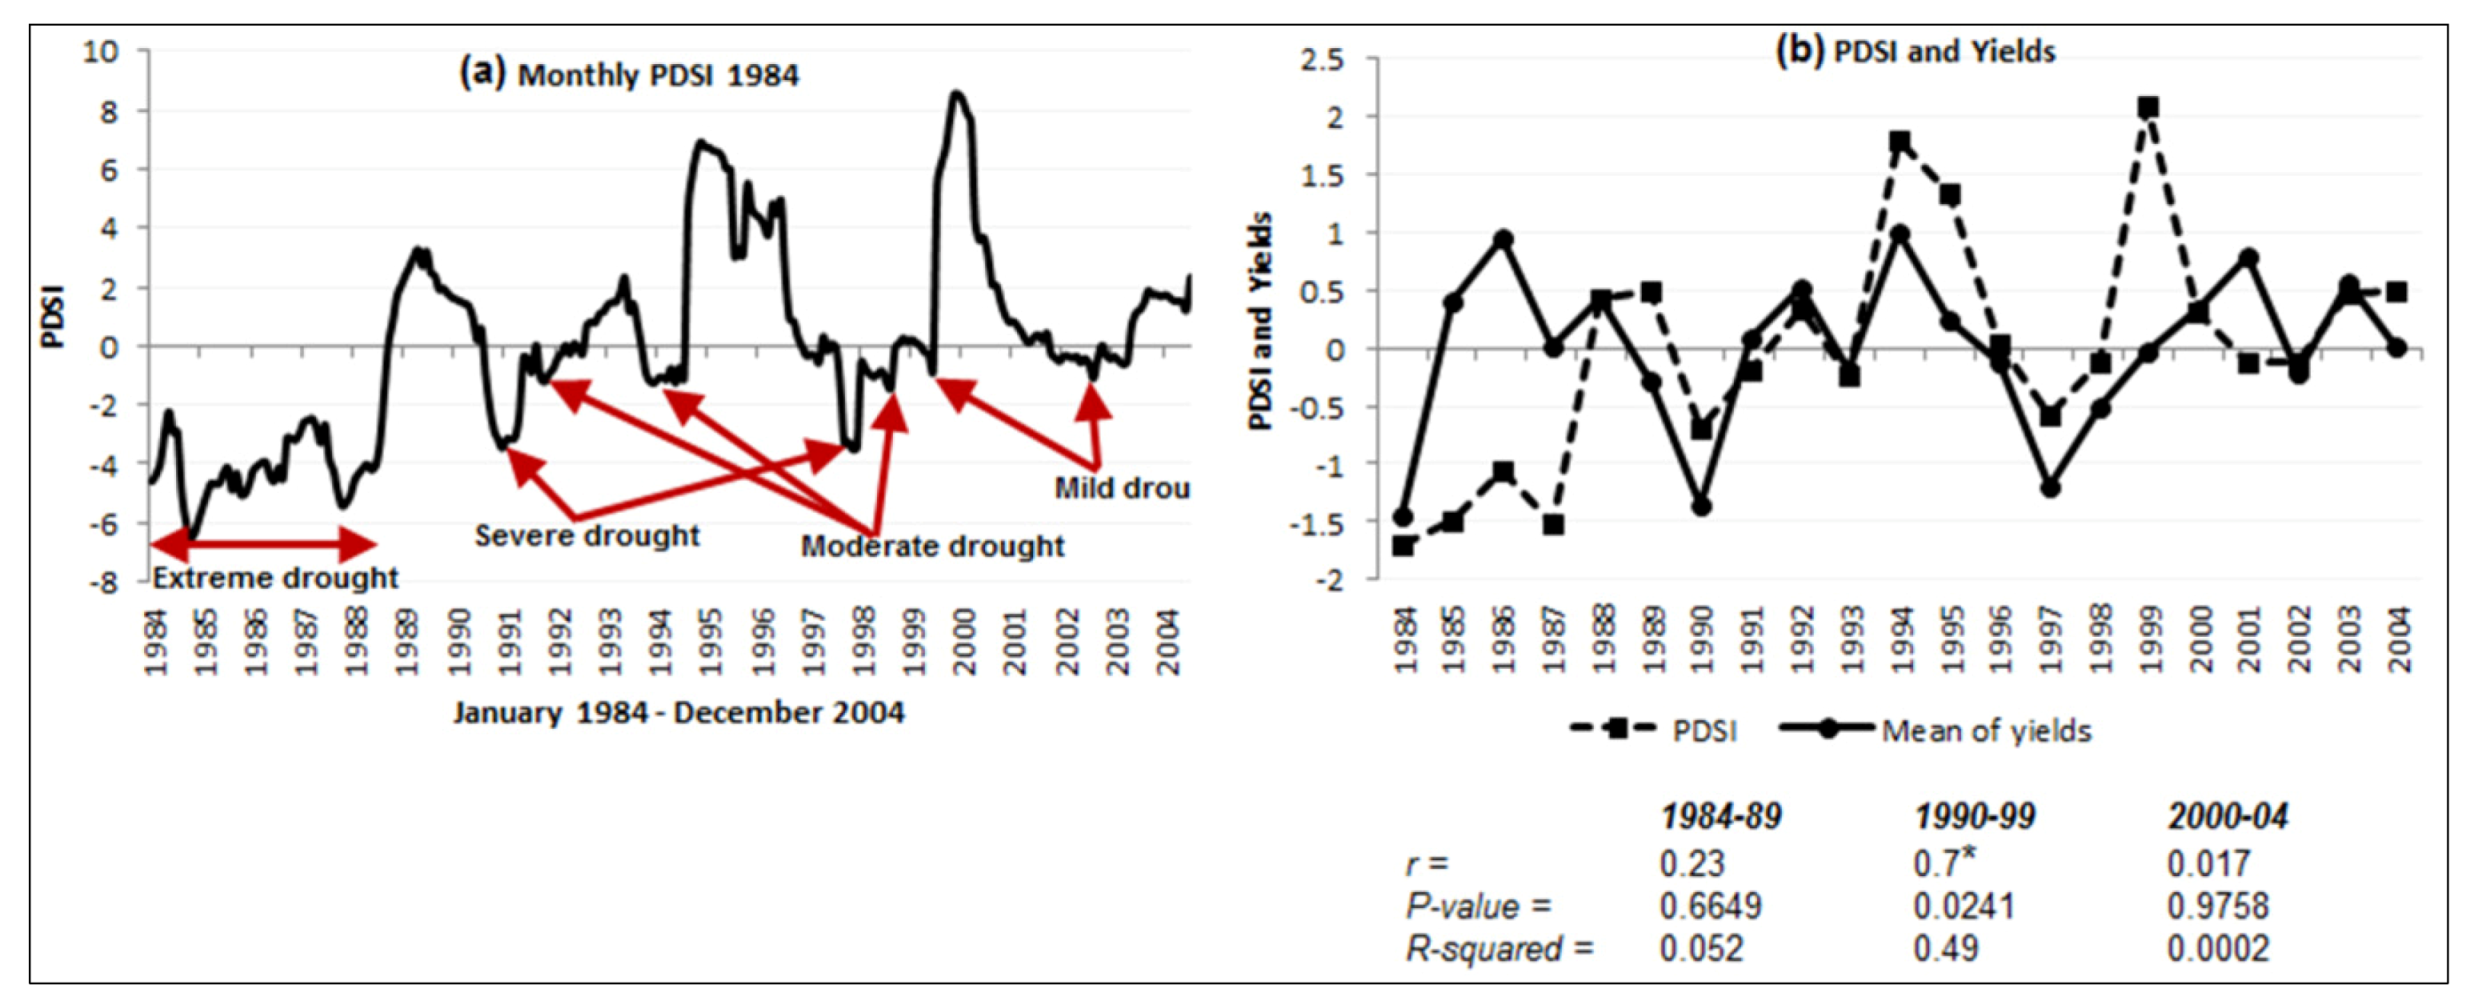
4.5. Climate Extremes, Yield Vulnerability and the Effects of Support for Small-scale Agriculture
5. Discussion
5.1. The Importance of Reconsidering Agricultural Water Management Strategies in Africa’s Sudan-Sahel
5.2. Planning for Climate-induced Vulnerabilities to Food Crop Production
5.3. Implications for Food Security Vulnerability in the Sudan-Sahel
6. Conclusions
Acknowledgments
Conflict of Interest
References
- WFP, West Africa and the Sahel—Food Security and Humanitarian Implications, 2012; Vulnerability Assessment and Mapping (VAM), World Food Programme: Rome, Italy, 2012.
- Sasson, A. Food security for Africa: An urgent global challenge. Agr. Food Secur. 2012, 1, 1–16. [Google Scholar] [CrossRef]
- Rosen, S.; Meade, B.; Shapouri, S.; D'Souza, A.; Rada, N. International Food Security Assessment 2012–2022; ERS-USDA: Washington, DC, USA, 2012. [Google Scholar]
- Sanchez, P.; Denning, G.; Nziguheba, G. The African green revolution moves forward. Food Secur. 2009, 1, 37–44. [Google Scholar] [CrossRef]
- Sánchez, P.A. Tripling crop yields in tropical Africa. Nat. Geosci. 2010, 3, 299–300. [Google Scholar] [CrossRef]
- FAOSTAT, Statistical Database; Agriculture Organization of the United Nations (FAO): Rome, Italy, 2012.
- Richardson, C.J. How much did droughts matter? Linking rainfall and GDP growth in Zimbabwe. Afr. Aff. 2007, 106, 463–478. [Google Scholar] [CrossRef]
- Jury, M.R. Economic impacts of climate variability in South Africa and development of resource prediction models. J. Appl. Meteorol. 2002, 41, 46–55. [Google Scholar] [CrossRef]
- Brown, C.; Lall, U. Water and economic development: The role of variability and a framework for resilience. Nat. Resour. Forum 2006, 30, 306–317. [Google Scholar] [CrossRef]
- Armah, F.A.; Yawson, D.O.; Yengoh, G.T.; Odoi, J.O.; Afrifa, E.K.A. Impact of Floods on Livelihoods and Vulnerability of Natural Resource Dependent Communities in Northern Ghana. Water 2010, 2, 120–139. [Google Scholar] [CrossRef]
- Vörösmarty, C.J.; Green, P.; Salisbury, J.; Lammers, R.B. Global water resources: Vulnerability from climate change and population growth. Science 2000, 289, 284. [Google Scholar]
- Vörösmarty, C.J.; Douglas, E.M.; Green, P.A.; Revenga, C. Geospatial indicators of emerging water stress: An application to Africa. AMBIO 2005, 34, 230–236. [Google Scholar]
- INS, Rapport Regional de Progres des Objectifs de Millenaire pour le Developpement: Région de l’Extrême-Nord; Institut National de la Statistique (INS), Ministère de l'Economie et des Finances: Yaoundé, Cameroon, 2004.
- Seignobos, C.; Iyébi-Mandjek, O. Atlas de la province extrême-nord Cameroun; MINREST-IRD: Yaoundé, Cameroun, 2000. [Google Scholar]
- Medugu, N.I.; Majid, M.R.; Johar, F. Drought and desertification management in arid and semi-arid zones of Northern Nigeria. Manag. Environ. Qual. Int. J. 2011, 22, 595–611. [Google Scholar] [CrossRef]
- Dai, A. Drought under global warming: A review. Wiley Interdiscip. Rev. 2011, 2, 45–65. [Google Scholar]
- Dai, A. Characteristics and trends in various forms of the Palmer Drought Severity Index during 1900–2008. J. Geophys. Res. 2011, 116, D12115. [Google Scholar] [CrossRef]
- Liénou, G.; Sighomnou, D.; Sigha-Nkamdjou, L.; Mahé, G.; Ecodeck, G.; Tchoua, F. Système hydrologique du Yaéré (Extrême-Nord Cameroun), Changements climatiques et actions anthropiques: Conséquences sur le bilan des transferts superficiels. IAHS Pub. 2003, 278, 403–409. [Google Scholar]
- Von Braun, J. A Policy Agenda for Famine Prevention in Africa; IFPRI: Wahington, DC, USA, 1991. [Google Scholar]
- Allen, R.G.; Pereira, L.S.; Raes, D.; Smith, M. Crop evapotranspiration-Guidelines for computing crop water requirements-FAO Irrigation and drainage paper 56. FAO: Rome, Italy, 1998; Volume 300, p. 6541. [Google Scholar]
- Kniveton, D.; Layberry, R.; Williams, C.; Peck, M. Trends in the start of the wet season over Africa. Int. J. Climatol. 2009, 29, 1216–1225. [Google Scholar] [CrossRef]
- Yabi, I.; Afouda, F. Extreme rainfall years in Benin (West Africa). Quaternary Int. 2010, 262, 39–43. [Google Scholar] [CrossRef]
- Olsson, L. On the causes of famine: Drought, desertification and market failure in the Sudan. Ambio 1993, 22, 395–403. [Google Scholar]
- Owusu, K.; Waylen, P.R. The changing rainy season climatology of mid-Ghana. Theor. Appl. Climatol. 2012. [Google Scholar] [CrossRef]
- Molua, E.L.; Lambi, C. The economic impact of climate change on agriculture in Cameroon. Policy Res. Work. Pap. 2007, 1, 4364. [Google Scholar]
- Yengoh, G.T.; Tchuinte, A.; Armah, F.A.; Odoi, J.O. Impact of prolonged rainy seasons on food crop production in Cameroon. Mitig. Adaptation Strategies Glob. Change 2010, 15, 825–841. [Google Scholar] [CrossRef]
- Konate, M. Climate of the Sorghum and Millet Cultivation Zones of the Semi-Arid Tropical Regions of West Africa. In Agrometeorology of Sorghum and Millet in the Semi-Arid Tropics; Virmani, S., Sivakumar, M., Eds.; International Crops Research Institute for the Semi-Arid Tropics (ICRISAT) and the World Meteorological Organization (WMO): Patancheru, India, 1984. [Google Scholar]
- Konate, M. Etude le I'environnement avec reference speciale au climat des zones de culture du sorgho et du mil des regions tropicales semi-arides d'Afrique occidentale. In Agrometeorology of Sorghum and Millet in the Semi-Arid Tropics; Virmani, S., Sivakumar, M., Eds.; International Crops Research Institute for the Semi-Arid Tropics (ICRISAT) and the World Meteorological Organization (WMO): Patancheru, India, 1984. [Google Scholar]
- Briggs, D.J.; Smithson, P. Fundamentals of Physical Geography; Rowman & Littlefield Pub Incorporated: London, UK, 1986. [Google Scholar]
- Huis, A. Challenges of Integrated Pest Management in Sub-Saharan Africa. In Integrated Pest Management: Dissemination and Impact; Peshin, R., Dhawan, A., Eds.; Springer: Heidelberg, The Netherlands, 2009; pp. 395–417. [Google Scholar]
- Ahmed, I.I.; Lipton, M. Impact of structural adjustment on sustainable rural livelihoods: A review of the literature, IDS Working Paper 62; Institute of Development Studies and Poverty Research Unit, University of Sussex: Essex, UK, 1997. [Google Scholar]
- Tchoungui, R.; Gartlan, S.; Simo, J.A.M.; Sikod, F.; Youmbi, A.; Ndjatsana, M.; Winpenny, J. Structural Adjustment and Sustainable Development in Cameroon: A world wide fund for nature study; Overseas Development Institute: London, UK, 1995. [Google Scholar]
- ADB, Evaluation of Bank Group Assistance to the Agriculture and Rural Development Sector 1996–2004; Operations Evaluation Department (OPEV), African Development Bank: Tunis-Belvedère, Tunisia, 2008.
- MINADER, Document de Strategie de Developpement du Secteur Rural Actualisation 2005; Ministere De l’Agriculture et du Developpement Rural: Yaoundé, Cameroun, 2005; Volume 2.
- MINADER, Stratégie de Développement du Secteur Rural (SDSR), synthèse du Volet Agriculture et Développement Rural; Ministere De l’Agriculture et du Developpement Rural: Yaoundé, Cameroun, 2006; p. 57.
- Abu-Awwad, A. Irrigation management in arid areas affected by surface crust. Agr. Water Manag. 1998, 38, 21–32. [Google Scholar] [CrossRef]
- Rockström, J.; Barron, J.; Fox, P. Water productivity in rain-fed agriculture: Challenges and opportunities for smallholder farmers in drought-prone tropical agroecosystems. In Water productivity in agriculture: Limits and opportunities for improvement; Kijne, J.W., Barker, R., Molden, D.J., Eds.; CABI: Oxon, UK, 2003; Volume 85199, p. 8. [Google Scholar]
- Jewitt, G. Integrating blue and green water flows for water resources management and planning. Phys. Chem. Earth 2006, 31, 753–762. [Google Scholar] [CrossRef]
- Botha, J.; Van Rensburg, L.; Anderson, J.; Hensley, M.; Macheli, M.; Van Staden, P.; Kundhlande, G.; Groenewald, D.; Baiphethi, M. Water conservation techniques on small plots in semi-arid areas to enhance rainfall use efficiency, food security, and sustainable crop production. Water Research Commission, Report 1176/1; Pretoria: South Africa, 2003. [Google Scholar]
- Ngigi, S.N. What is the limit of up-scaling rainwater harvesting in a river basin? Phys. Chem. Earth 2003, 28, 943–956. [Google Scholar] [CrossRef]
- Ngigi, S.N.; Savenije, H.H.G.; Rockström, J.; Gachene, C.K. Hydro-economic evaluation of rainwater harvesting and management technologies: Farmers’ investment options and risks in semi-arid Laikipia district of Kenya. Phys. Chem. Earth 2005, 30, 772–782. [Google Scholar]
- FAO, Crops and Drops: Making the Best Use of Water in Agriculture; Food and Agriculture Organization of the United Nations: Rome, Italy, 2000.
- Rosegrant, M.W.; Cline, S.A. Global food security: Challenges and policies. Science 2003, 302, 1917–1919. [Google Scholar] [CrossRef]
- Hess, U.; Syroka, H. Weather-based Insurance in Southern Africa. The Case of Malawi; World Bank: Washington, DC, USA, 2005. [Google Scholar]
- Meze-Hausken, E.; Patt, A.; Fritz, S. Reducing climate risk for micro-insurance providers in Africa: A case study of Ethiopia. Global Environ. Change 2009, 19, 66–73. [Google Scholar] [CrossRef]
- Skees, J.R.; Barnett, B.J. Enhancing microfinance using index-based risk-transfer products. Agr. Finance Rev. 2006, 66, 235–250. [Google Scholar] [CrossRef]
- Morduch, J. Between the state and the market: Can informal insurance patch the safety net? World Bank Res. Obs. 1999, 14, 187–207. [Google Scholar] [CrossRef]
- Buontempo, C. Sahelian climate: Past, Current, Projections. In Report to the Project ‘Security Implications of Climate Change in the Sahel’ (SICCS); Met Office Hadley Centre: Devon, UK, 2010. [Google Scholar]
- Newton, A.C.; Johnson, S.N.; Gregory, P.J. Implications of climate change for diseases, crop yields and food security. Euphytica 2011, 179, 3–18. [Google Scholar] [CrossRef]
- Misselhorn, A.; Aggarwal, P.; Ericksen, P.; Gregory, P.; Horn-Phathanothai, L.; Ingram, J.; Wiebe, K. A vision for attaining food security. Curr. Opin. Environ. Sustain. 2012, 4, 7–17. [Google Scholar] [CrossRef]
- Fischer, G.; O’Neill, B.C. Global and case-based modeling of population and land use change. In Population, land use, and environment: Research directions; Entwise, B., Stern, P.C., Eds.; National Academies Press: Washington, DC, USA, 2005; pp. 53–83. [Google Scholar]
- Parry, M.L.; Rosenzweig, C.; Iglesias, A.; Livermore, M.; Fischer, G. Effects of climate change on global food production under SRES emissions and socio-economic scenarios. Global Environ. Change 2004, 14, 53–67. [Google Scholar] [CrossRef]
- Stern, N.H. The economics of climate change: The Stern review; Cambridge University Press: Cambridge, UK, 2007. [Google Scholar]
© 2013 by the authors; licensee MDPI, Basel, Switzerland. This article is an open-access article distributed under the terms and conditions of the Creative Commons Attribution license (http://creativecommons.org/licenses/by/3.0/).
Share and Cite
Yengoh, G.T. Climate and Food Production: Understanding Vulnerability from Past Trends in Africa’s Sudan-Sahel. Sustainability 2013, 5, 52-71. https://doi.org/10.3390/su5010052
Yengoh GT. Climate and Food Production: Understanding Vulnerability from Past Trends in Africa’s Sudan-Sahel. Sustainability. 2013; 5(1):52-71. https://doi.org/10.3390/su5010052
Chicago/Turabian StyleYengoh, Genesis T. 2013. "Climate and Food Production: Understanding Vulnerability from Past Trends in Africa’s Sudan-Sahel" Sustainability 5, no. 1: 52-71. https://doi.org/10.3390/su5010052
APA StyleYengoh, G. T. (2013). Climate and Food Production: Understanding Vulnerability from Past Trends in Africa’s Sudan-Sahel. Sustainability, 5(1), 52-71. https://doi.org/10.3390/su5010052