Continuum of Risk Analysis Methods to Assess Tillage System Sustainability at the Experimental Plot Level

Abstract
: This study applied a broad continuum of risk analysis methods including mean-variance and coefficient of variation (CV) statistical criteria, second-degree stochastic dominance (SSD), stochastic dominance with respect to a function (SDRF), and stochastic efficiency with respect to a function (SERF) for comparing income-risk efficiency sustainability of conventional and reduced tillage systems. Fourteen years (1990–2003) of economic budget data derived from 35 treatments on 36 experimental plots under corn (Zea mays L.) and soybean (Glycine max L.) at the Iowa State University Northeast Research Station near Nashua, IA, USA were used. In addition to the other analyses, a visually-based Stoplight or “probability of target value” procedure was employed for displaying gross margin and net return probability distribution information. Mean-variance and CV analysis of the economic measures alone provided somewhat contradictive and inconclusive sustainability rankings, i.e., corn/soybean gross margin and net return showed that different tillage system alternatives were the highest ranked depending on the criterion and type of crop. Stochastic dominance analysis results were similar for SSD and SDRF in that both the conventional and reduced tillage system alternatives were highly ranked depending on the type of crop and tillage system. For the SERF analysis, results were dependent on the type of crop and level of risk aversion. The conventional tillage system was preferred for both corn and soybean for the Stoplight analysis. The results of this study are unique in that they highlight the potential of both traditional stochastic dominance and SERF methods for distinguishing economically sustainable choices between different tillage systems across a range of risk aversion. This study also indicates that the SERF risk analysis method appears to be a useful and easily understood tool to assist farm managers, experimental researchers, and potentially policy makers and advisers on problems involving agricultural risk and sustainability.1. Introduction
Interest in tillage systems that reduce the number of cultivation steps has increased steadily worldwide over the past two decades. These reduced tillage systems—commonly called reduced till, no-till, low till, limited till, or conservation till—potentially have the ability to reduce wind and water erosion, conserve soil moisture, and improve soil structure. Although the possible agronomic benefits of reduced tillage systems are easy to recognize, the economic benefits can be less evident and may lead to questions of long-term sustainability. Many studies have found that using reduced tillage systems reduces input costs such as fuel, labor, and machinery repair/depreciation costs [1,2]. However, lower production costs found in reduced tillage systems may be offset by increased chemical costs for many crops [3-5]. Consequently, many studies comparing net income between conventional and reduced tillage systems are contradictory, especially when the impact of soil type and climate conditions on the economic sustainability of reduced tillage systems is considered. For example, generally better economic performance for reduced tillage systems has been noted for well-drained soils and warmer climates [6,7] and poorer performance noted for poorly drained soils and cooler climates [8-10].
Despite potential benefits, many farmers are still reluctant to adopt reduced tillage systems. One contributing factor is that farmers lack knowledge about risks related to tradeoffs between the upfront (or short-term) costs of implementing reduced conservation management practices compared to long-term economic benefits that might be expected in the future (such as reduced variability). The overall purpose of this paper is to examine how an understanding of risk-return tradeoffs can affect the ranking or preferability of reduced tillage systems. While the majority of studies investigating the economic sustainability of reduced tillage systems have largely ignored risk (i.e., only average net income between conventional and reduced tillage systems is typically compared), a number of studies have attempted to address farm business risk issues through the application of stochastic dominance approaches to better account for risk aversion behavior. Klemme [3] used first and second-degree stochastic dominance (FSD and SSD, respectively) techniques to rank tillage systems on a net return basis to examine assumptions concerning various levels of risk avoidance. Lee et al. [11] compared mean-variance and stochastic dominance techniques for farmer adoption of reduced tillage practices in a central Indiana watershed. Williams et al. [12] used SSD to compare reduced tillage systems with conventional tillage systems for wheat and sorghum in western Kansas. Larson et al. [13] used FSD and SSD to evaluate how using cover crops with various applied nitrogen rates affected net revenue from no-till corn production in western Tennessee. De Vuyst and Halvorson [14] used FSD and SSD to rank the economics of eighteen continuous cropping/crop-fallow experimental treatments in the Northern Great Plains as influenced by tillage system and nutrient management. Pendell et al. [7] used stochastic dominance to examine the net return of continuous corn production using conventional and no-till tillage systems to quantify the value of carbon sequestration credits needed to encourage farmer adoption of carbon sequestration programs.
A more recent method of stochastic dominance, called stochastic efficiency with respect to a function (SERF), orders a set of risk-efficient alternatives instead of finding a subset of dominated alternatives [15] and uses the concept of certainty equivalents (CEs) instead of cumulative distribution functions (CDFs) for each alternative (as in the case of FSD and SSD). Hardaker et al. [16] state that SERF provides an approach consistent with the subjective expected utility (SEU) hypothesis, in such way that SERF narrows the choice to an efficient set and thus has stronger discriminating power than conventional stochastic dominance techniques. A major hypothesis of SERF is that the decision-maker would be risk averse enough to accept a sure lower expected value versus a high unsure expected value. Grove [17] and Grove et al. [18] conducted a stochastic efficiency analysis and optimization of alternative agricultural water use and conservation strategies. Results showed that the portfolio of irrigation schedules for a risk averse farmer may include those with high production risk, due to the interaction of resource use between deficit irrigation alternatives when water is limited. Lien et al. [19] used SERF within a whole-farm stochastic modeling framework to analyze organic and conventional cropping systems in eastern Norway. SERF methodology was also applied by Lien et al. [20] to analyze optimal tree replanting on an area of recently harvested forestland. Pendell et al. [21] examined the economic potential of using no-till and conventional tillage with both commercial nitrogen and cattle manure to sequester soil carbon in continuous corn production in northeastern Kansas. SERF was employed to determine preferred production systems under various risk preferences and to calculate utility-weighted certainty equivalent risk premiums for estimating carbon credit values needed to motivate adoption of systems that sequester higher levels of carbon. Watkins et al. [22] used SERF to evaluate the profitability and risk efficiency of Arkansas rice production management under no-till from the perspective of both the tenant and the landlord. Results indicated that risk-neutral and risk averse tenants would benefit from no-till management, and that risk-neutral landlords would be indifferent between either no-till or conventional till. Archer and Reicosky [23] evaluated the effects of no-till and five tillage system alternatives: fall residue management (Fall RM), Fall RM + strip-tillage (ST), spring residue management (Spring RM), Spring RM + ST, and Fall RM + Subsoil, relative to conventional moldboard plow and chisel plow tillage systems on corn and soybean yields and economic risks and returns. SERF risk analysis showed tillage system preferences ranked as: Fall RM > no-till > Fall RM + ST > Spring RM + ST, Spring RM > chisel plow > Fall RM + Subsoil > moldboard plow for risk neutral or risk averse producers facing uncertain yield, crop price, and input price conditions. Archer and Reicosky [23] concluded that ST and no-till might be economically viable alternatives to conventional tillage systems for corn and soybean production in the northern Corn Belt. Grove and Oosthuizen [24] used an expected utility optimization model and SERF to evaluate deficit irrigation economics within a multi-crop setting while taking into account the increasing production risk of deficit irrigation. They concluded that, although deficit irrigation was stochastically more efficient than full irrigation under limited water supply conditions, irrigation farmers would not voluntarily choose to conserve water through deficit irrigation and would require compensation to do so. Finally, Williams et al. [25] examined the economic potential of producing a wheat and grain sorghum rotation with three different tillage strategies (conventional, reduced, and no-till) compared with the Conservation Reserve Program (CRP) in a semiarid region. They used enterprise budgeting and SERF to determine the preferred management strategies under various risk preferences. Results indicated that CRP would be the preferred strategy for more risk averse managers, i.e., only individuals who were risk-neutral or slightly risk averse would prefer crop production to continued CRP enrollment.
To our knowledge, this study represents the first attempt to apply a continuum of risk analysis methods for comparing the economic sustainability (through income-risk efficiency) of conventional and reduced tillage systems. Each method provides different insights about risk and returns; therefore, the purpose of comparing different methods (applied to the same problem) is to elicit additional information to better understand the impacts of each tillage system alternative on farm sustainability (where risk is concerned). Fourteen years (1990–2003) of economic budget data collected from 35 treatments on 36 plots with continuous corn (Zea mays L.) and corn-soybean (Glycine max L.) rotation cropping systems at the Iowa State University Northeast Research Station near Nashua, IA, USA were used. The field research experimental study was initiated in 1977; Chase and Duffy [8] previously analyzed economic data (net return) for the years 1978–1987. The specific objective of this research was to utilize SSD, stochastic dominance with respect to a function (SDRF), and SERF approaches to stochastically evaluate the economic sustainability (gross margin and net return) of four different tillage system alternatives (chisel plow, moldboard plow, no-till, and ridge-till) on continuous corn and corn/soybean rotation cropping systems. We analyze the tillage system alternatives across a continuum of risk since the risk aversion level of the decision-maker is typically unknown; therefore, risk efficiency of the tillage alternatives is calculated using a range of assumed risk aversion levels. It is important to note that farmers balance tradeoffs between risk and profitability in their own personal way (i.e., attitudes towards risk depend on being a risk taker, risk neutral, risk avoider, or somewhere in between these three levels). The SSD, SDRF, and SERF methods allow a non-biased comparison of risk and return tradeoffs with reasonable assumptions about how a farmer might value them, thereby avoiding having to directly ask individuals about their specific risk choices. In addition to the stochastic dominance and SERF analyses, we conduct a non-stochastic analysis of the tillage system alternatives using mean-variance and coefficient of variation (CV) statistical criteria approaches for the purpose of initial comparison and sustainability ranking. Finally, we apply a straightforward complementary method, the probability of target value or Stoplight approach, for analyzing and visually displaying the probabilistic information contained in the tillage system CDFs.
2. Materials and Methods
2.1. Field Study
Data for our study were obtained from 36, 0.4-ha plots located at the Iowa State University Northeast Research Station near Nashua, IA, USA (43.0°N, 92.5°W). The experimental plots were established to quantify the impact of management practices on crop production and water quality [26,27]. The soils are predominantly Floyd loam (fine-loamy, mixed, mesic Aquic Hapludolls), Kenyon silty-clay loam (fine-loamy, mixed, mesic Typic Hapludolls) and Readlyn loam (fine-loamy, mixed, mesic Aquic Hapludolls) with 30 to 40 g kg−1 (3 to 4%) organic matter [28]. These soils are moderately well to poorly drained, lie over loamy glacial till, and belong to the Kenyon-Clyde-Floyd soil association. Soil slopes varied from 1 to 3% among the various plots. The field experiments were established on a 15 ha research site in 1977 using a randomized complete block design with three replications. The seasonal water table at the site fluctuates from 20 to 160 cm and subsurface drainage tubes/pipes (10 cm in diameter) were installed in the fall of 1979 at 120 cm depth and 29 m apart. Three experimental phases were conducted from 1978–1992, 1993–1998, and 1999–2003. From 1978–1992, there were four tillage treatments (chisel plow, moldboard plow, no-till, and ridge-till) under two different cropping sequences (continuous corn and both phases of a corn-soybean rotation). Crop yield was the primary measurement from 1978–1989. Experimental data collected starting in 1990 included tile drain flow, nitrate concentration in tile drain flow, residual nitrogen (N) in soil, and crop yield, biomass, and plant N uptake. From 1993-98, there were two tillage treatments (chisel plow and no-till), with eight N management treatments (e.g., different rates, times of application, fertilizer type and/or swine manure) for chisel plow and four N treatments for no-till with no change in the number of crop sequences. The experimental data collected remained essentially the same as from 1990–1992 with the addition of runoff. Continuous corn was replaced with both phases of the corn-soybean rotation in 1999 and the experiments were continued along with ten fertilizer and swine manure treatments in the chisel plow system and two swine manure treatments in the no-till system. All plots received swine manure and/or urea-ammonium-nitrate (UAN) fertilizer each cropping season, with the swine manure applied in either fall or spring using application rates based on N or phosphorus (P) needs for the corn-soybean/soybean-corn rotations. Experimental measurements from 1999–2003 again focused on tile drain flow, nitrate concentration in drain flow, soil N, and crop yield, biomass, and N uptake. Table 1 lists the major management practices by treatment (e.g., tillage and cropping systems) from 1990 to 2003 for the Nashua experiment.
2.2. Economic Budget Data and Analysis
Economic budgets for 1990 to 2003 were developed as part of the web-based USDA Natural Resources Conservation Service (NRCS)—EconDoc exchange tool. Primary data sources for the study included both Nashua experimental records and USDA National Agricultural Statistical Services (NASS) published data. The economic budget approach was used to summarize the per unit (hectare) revenue, gross margin (revenue—operating costs), and net return (revenue—total costs). This resulted in 504 treatment (cropping/tillage system) observations (Table 1) of enterprise budget data with detailed information about revenue, operating costs, overhead costs, total costs, gross margin, and net return stored in the EconDoc economics information network. Historical market prices for commercial brands of each input (e.g., seeds, fuels, fertilizer, pesticides, and herbicides, hours of machinery used, and labor hours used) were calculated to determine the input costs for each plot in each specific year during the 1990–2003 period. Additional details on the total cost of production for each tillage system for the period prior to the experimental phase analyzed in this study are described in Chase and Duffy [8]. Total net return to management for each of the four tillage systems was calculated for the Nashua experimental plots by subtracting the total production costs (including overhead costs) from the corresponding gross return. Overhead cost is the part of the production cost allocated to each plot based on the overall farm expenses rather than those of the specific plot, such as machinery not specialized for a certain crop. Examples of overhead costs are the interest paid on an equipment loan or management costs directly related to production. To determine gross return, we used average annual prices for corn and soybeans from NASS county data records and annual yields reported by the Nashua experiment station. In addition to net return, gross margin for each of the four tillage systems were calculated by subtracting the operating costs from the corresponding gross return. Gross margin represents the enterprise's contribution towards covering the fixed costs and generation of profit after operating costs have been covered [29]. The net return and gross margin data were then discounted to reflect the net present values and averaged across the experimental replications.
It is important to emphasize that both gross margin and net returns were used to explore risk-return tradeoffs in this study and that government subsidy income was not included. Conventional wisdom considers gross margin (i.e., the revenue above the total costs for each enterprise budget) to be a more useful indicator for long-term farm planning. Net returns are a useful short-term planning tool to compare one enterprise to another, but can be misleading if used to disqualify farm enterprises with low net returns that still contribute towards long-term fixed farm costs. For example, a farmer may decide to continue producing a certain crop even though the crop revenue covers the production cost but does not cover the total cost. The farmer makes this decision because any contribution beyond the production cost is better than the alternative of having other costs (e.g., a fixed cost such as the cost of a long-term investment) left uncovered. Therefore, we consider both gross and net returns since each contributes unique information.
Although examining mean values for economic performance measures is useful, it is also important to examine variability to determine if risk affects the decision to use one system or another. Nearly all farm managers are risk averse, i.e., most will accept fewer dollars of return for fewer dollars of variability or loss. Each decision maker trades off risk and return at their own rate, so it is difficult to prescribe a specific strategy for any one manager, but some initial conclusions can be made with the use of statistical criteria such as mean-variance and coefficient of variation (CV) [16]. Risk averse farm managers generally prefer systems that have both the largest mean gross margin or net return and smallest variance. The advantage of the CV criterion is that it simplifies the criteria to a single value for each alternative and eliminates ambiguity. The CV criterion works well if the means of all the alternatives are similar and not close to zero. A disadvantage of the CV criterion is that it ignores the skewness and extreme downside risks associated with some alternatives.
2.3. Stochastic Dominance Techniques
A detailed discussion of the usefulness of stochastic dominance decision criteria can be found in Robison and Barry [30]. Boggess and Ritchie [31] and Williams et al. [32] also present the rationale and application of various techniques. The theoretical attractiveness of stochastic dominance analysis lies in its non-parametric orientation, i.e., it does not require a full parametric specification of the preference of the decision-maker and the statistical distribution of the choice alternative [4,33,34]. As previously discussed, several decision criteria for stochastic dominance exist including FSD, SSD and SDRF. Given two alternatives, A and B, each with a probability distribution of outcomes defined by a CDF, A dominates B in the FSD sense if the CDF of A is always below and to the right of the CDF of B. SSD holds for those decision makers who are risk neutral or risk averse, thus the applicable range of the absolute risk aversion coefficient ra (a measure of how much a person would pay to avoid risk) for the SSD criterion is from 0 to +∞. The rule selects distributions that are preferred by all risk averse decision makers as being risk-efficient, irrespective of their degree of risk aversion. Strategies that are SSD efficient will have a smaller area under their cumulative probability distribution than those that are not, as the area is summed across the observations of net return from lowest to highest. Although more powerful than FSD, SSD often leaves a large number of choices as being risk-efficient. To improve the discriminating power of SSD, Meyer [35] proposed SDRF that is a more general notion of stochastic dominance. This rule helps to identify risk-efficient options for the class of decision makers whose risk aversion coefficients are bounded by lower and upper values. The smaller the range of risk aversion coefficients, the more powerful is the criterion. The SDRF criterion orders the choices by defining intervals using the ra absolute risk aversion coefficients. These risk-preference intervals are bounded by a lower risk aversion coefficient, raL, and an upper risk aversion coefficient, raU, which characterize the general degree of risk aversion for a manger. A risk-efficient set of strategies will include the choices preferred by each manager having risk preferences consistent with the restrictions imposed by the lower to upper interval. A comprehensive review of SDRF is provided by Cochran [36]; King and Robison [37] and Robison and Barry [30] also present further discussion of these concepts and the technique.
Unlike the stochastic dominance techniques presented above which typically find a set or subset of dominated alternatives, SERF identifies and orders utility efficient alternatives in terms of certainty equivalents (CEs) for a specified risk preference. Hardaker et al. [15] state that the SERF procedure can potentially find a smaller set of preferred strategies (i.e., has stronger discriminating power) compared to stochastic dominance approaches in addition to being more transparent and easier to implement. The CE of a risky alternative (in this study the type of tillage system) is the amount of money at which the decision maker is indifferent between the certain dollar value and the risky alternative. That is, the CE is the sure amount of money with the same utility as the expected utility of a risky alternative [38] and can be calculated by taking the inverse of the utility function U:
where w is the initial wealth and r(w) represents the risk aversion coefficient with respect to wealth. Strategies with higher CEs are preferred to those with lower CEs and interpretation of the CEs is straightforward because, unlike utility values, they may be expressed in monetary terms [19]. To calculate the CEs using SERF, various types of utility functions can be used (e.g., power, negative exponential, quadratic, log-log). In this study, similar to that of Pendell et al. [21], we assume a negative exponential form for the utility function:
where ra(w) is the absolute risk aversion coefficient (ARAC) with respect to wealth. Given a random sample of size n from alternative w with i possible outcomes, the estimated CE can be defined as:
A negative exponential utility function conforms to the hypothesis that managers prefer less risk to more given the same expected return and assumes managers have constant absolute risk aversion [20]. Under this assumption, managers view a risky strategy for a specific level of risk aversion the same without regard for their level of wealth. Babcock et al. [39] state this functional form is often used to analyze farmers' decisions under risk. The decision rule for SERF is to rank the risky alternatives (within the decision makers specified risk aversion coefficient) from the most preferred (i.e., the highest CEs at specified levels of risk aversion) to the least preferred (i.e., the lowest CEs at specified levels of risk aversion). Richardson et al. [40] presents a utility-weighted risk premium (RP) that is calculated once the strategies are ranked using the CE results (i.e., the risk premium changes as the degree of risk aversion increases or decreases). This is accomplished in Equation (4) by subtracting the CE of a baseline (often a less preferred) strategy B from the CE of an alternative (often a preferred) strategy A where:
The RP, a utility weighted risk premium for a risk-preferring to risk averse decision maker, reflects the minimum amount ($/ha for the tillage system alternatives considered in this study) that will have to be paid to a decision maker to justify a switch from alternative A to B [15].
2.4. The Stoplight or Probability of Target Value Procedure
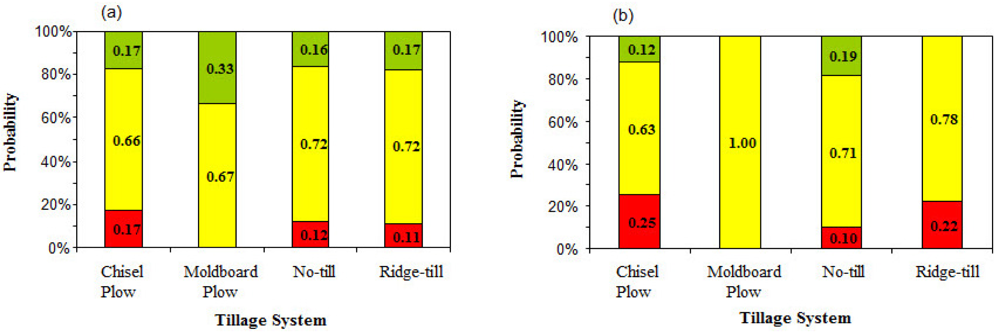
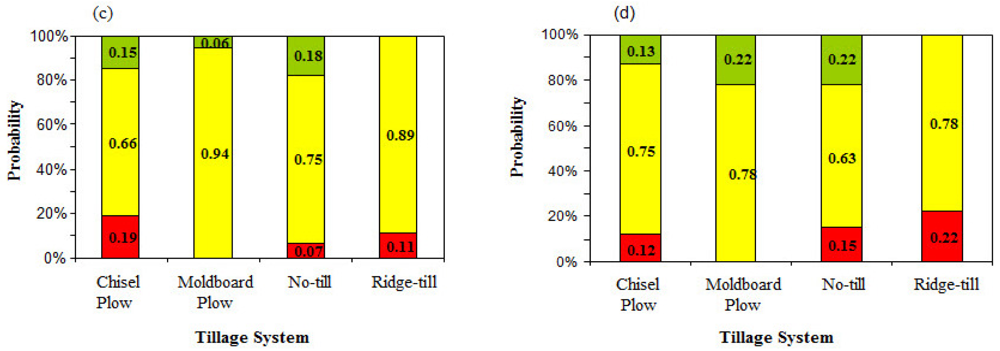
Methods that rely on evaluating CDFs can be difficult for many people to understand. A “probability of target value” or “stoplight” graph relies on CDF information but is a more visually appealing depiction of probabilistic information. The Stoplight procedure [40] calculates the probability of a measure (e.g., mean gross margin or net return) exceeding an upper cutoff value, being less than a lower cutoff value, or having a value between the upper and lower cutoff values (the cutoff values can be input directly from the decision maker). Like a stoplight, the three ranges are assigned colors of red (less than the lower cutoff value), yellow (between the upper and lower cutoff values), and green (exceeding the upper cutoff value).
2.5. Risk Simulation Analyses
The Simetar© 2008 risk analysis software [40] was used to perform the SDRF and the SERF analyses. Simetar© 2011 (not yet released to the public) with improved SSD methodology was used for the SSD analysis. For the SDRF stochastic dominance analysis, seven intervals (three negative, three positive, and one encompassing risk neutrality) of absolute risk aversion coefficients were used to categorize risk-preferring to risk averse behavior. King and Robison [37] suggested that most intervals based on whole-farm analysis should be established between -0.0001 to +0.001. A study conducted with Kansas farm managers by Thomas [41] suggested that the range could be -0.0005 to +0.005. Many studies normalize the range of risk against wealth. The relation between absolute and relative risk aversion is ra(w) = rr(w)/w where rr(w) is the relative risk aversion coefficient with respect to wealth (w) [15]. Anderson and Dillon [42] proposed a general classification of degrees of risk aversion, based on rr(w), in the range of 0.5 (hardly risk averse) to approximately 4 (extremely risk averse). Average wealth (i.e., gross margin and net return) in this study ranged from $247.05/ha (corn net return) to $371.03/ha (soybean gross margin) across the tillage system alternatives. Assuming a 10% return (R) on the value of the assets with a normal debt to asset (DA) ratio of 20%, the ARAC at the extremely risk averse level can be calculated as:
Using Equation 5 and the average wealth values presented above, calculated ARAC values ranged from 0.0013 to 0.0021. The ARAC upper limit (raU) was expanded slightly to 0.003 (to encompass the ARAC value of 0.0021) with a corresponding ARAC lower limit (raL) of 0.0 (i.e., a risk neutral condition). Therefore, the preference intervals used for the SDRF analysis were: (1) 0.0 to 0.0005 (risk neutral); (2) 0.0005 to 0.001; (3) 0.001 to 0.002; and (4) 0.002 to 0.003 (risk averse). For the SERF analyses, gross margin and net return CE curves by crop (corn and soybean) for the tillage system alternatives were produced by calculating 25 CE values for each curve over the entire range (0.0 to 0.003) of absolute risk aversion. The STOPLIGHT function in Simetar© 2008 was used to perform the Stoplight analysis. The user must specify two probability targets (a lower target and an upper target) for the Stoplight analysis. For this study, the upper cutoff target corresponds to one standard deviation above the mean and the lower cutoff target corresponds to one standard deviation below the mean.
3. Results
3.1. Mean-Variance and CV Analysis
Table 2 shows that the moldboard plow and ridge-till tillage systems had the highest mean gross margin for corn, while the no-till and moldboard plow systems had the highest mean gross margin for soybean. No tillage system alternative exhibited the largest mean and smallest variance across the four corn and soybean gross margin and net return combinations. For corn gross margin, the moldboard plow tillage system had the largest mean and smallest variance. For soybean gross margin, the no-till system had the largest mean but also had a much higher variance than the moldboard plow tillage system, indicating a larger degree of risk relative to the expected return (i.e., there would be a significant amount of net income given up to reduce risk with the no-till system). Table 3 shows that the mean-variance analysis for net return was the exact opposite (with respect to corn and soybean) compared to gross margin. That is, for soybean net return the moldboard plow tillage system had the largest mean and the smallest variance, and for corn the no-till system had a larger mean net return than the moldboard plow system but also a much larger variance. The no-till and moldboard plow tillage systems had the highest mean net return for both corn and soybean. Tables 2 and 3 show that the moldboard plow and ridge-till distributions are platykurtic, i.e., they display excess negative kurtosis. In terms of shape, a platykurtic distribution has a lower, wider peak around the mean (i.e., a higher probability than a normally distributed variable of values near the mean) and thinner tails (if viewed as the height of the probability density, i.e., a lower probability than a normally distributed variable of extreme values). Overall, the system with the least amount of risk for gross margin and net return, if measured by variance alone, was the moldboard plow tillage system. Based on the mean-variance statistical criteria, Tables 2 and 3 show that there would be little motivation for a farm manager to use either the chisel plow or the ridge-till systems as both systems in general had lower mean gross margins and net returns with higher variances for chisel plow than for the other two tillage systems. However, it is worth noting that the ridge-till tillage system had lower variances than the no-till system for all the corn and soybean gross margin and net return combinations.
As indicated previously, farm managers will give up income for reduced variability. If the manager accepts a dollar less of return for a dollar less of risk (standard deviation) at a one-to-one ratio, the CV can be used as a reasonable decision criterion. For corn and soybean gross margin and net return, the chisel plow and no-till systems had the highest CVs with the moldboard plow tillage system having the lowest CVs, thus indicating a lower amount of risk (Tables 2 and 3). Moldboard plow tillage system CVs for corn and soybean gross margin and net return ranged from 0.17 to 0.40 which indicated that the standard deviation was consistently less than one-half of the mean. It is interesting to note that the gross margin and net return CVs in Tables 2 and 3 were substantially higher than the CVs for total revenue and total cost (data not shown). In theory, a producer could examine only mean-variance and CV risk-tradeoff results and simply decide which tillage system alternative is best; however, this may be difficult in practice in that these criteria often exhibit high variability and can result in contradictive and inconclusive rankings. Application of more sophisticated risk-based methodology, such as stochastic dominance or SERF, can help farm managers and decision makers see these tradeoffs more clearly with very few additional assumptions.
3.2. Stochastic Dominance Analysis
3.2.1. Second-degree Stochastic Dominance (SSD)
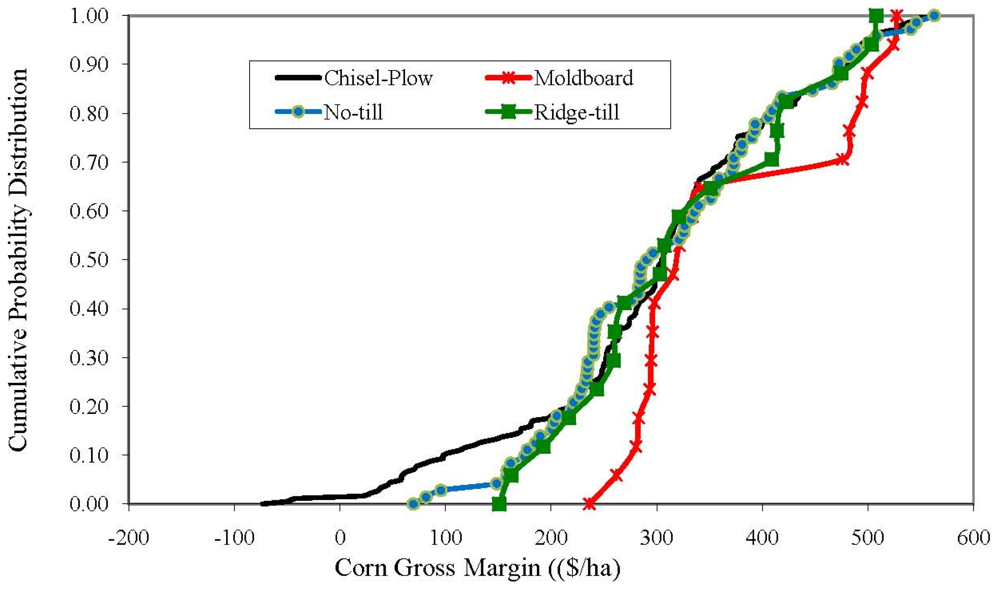
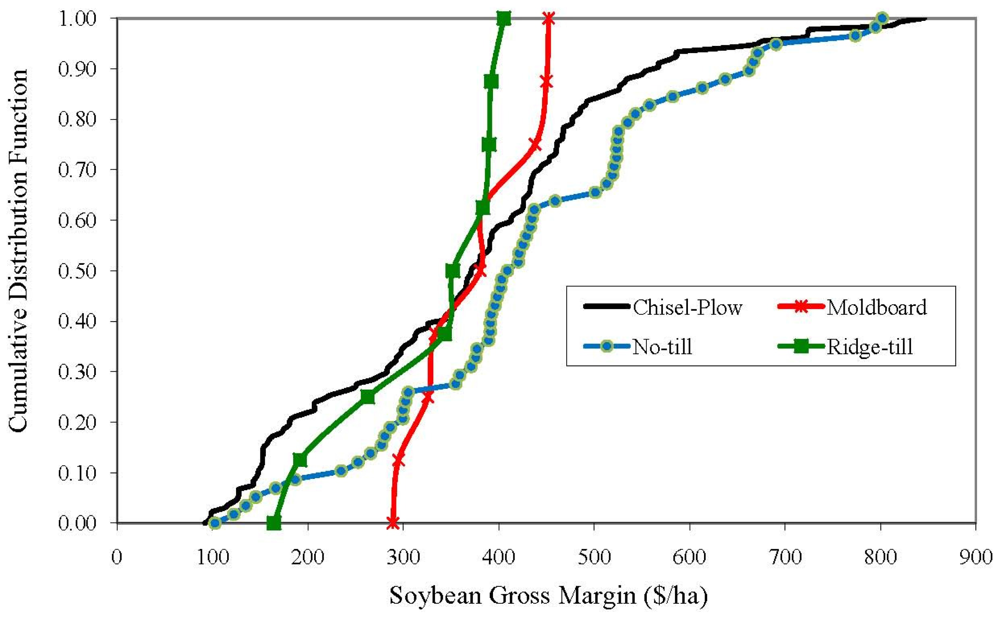
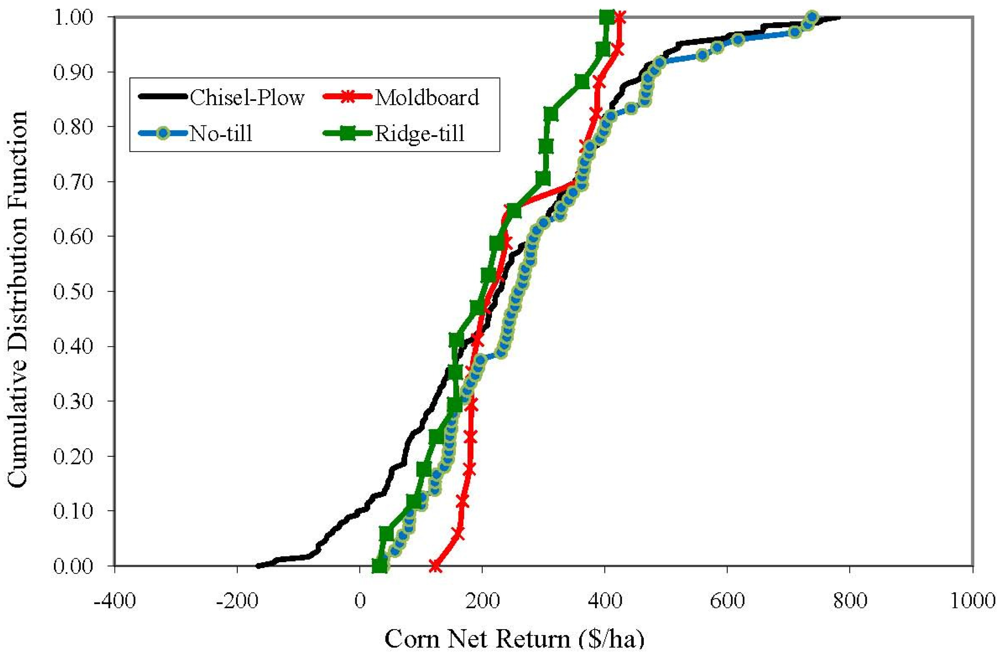
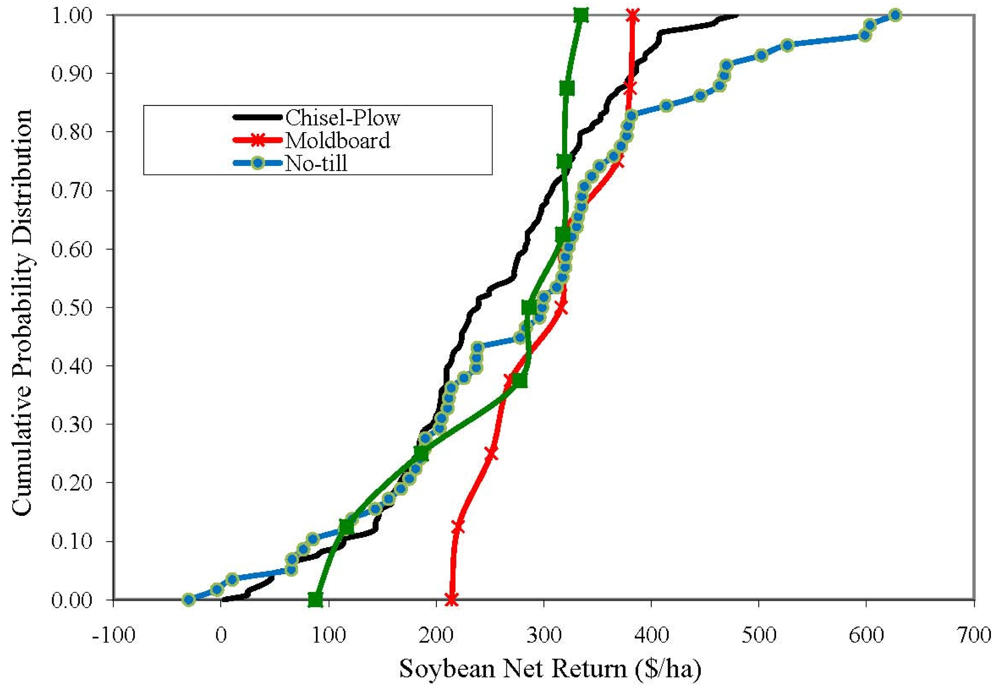
The corn and soybean gross margin CDFs for the Nashua, IA tillage system alternatives are shown in Figures 1 and 2, respectively, with the corn and soybean net return CDFs shown in Figures 3 and 4, respectively. Since the CDFs intersect each other at multiple points, including intersection on the negative tails, first-degree stochastic dominance is inconclusive and the decision maker would require additional information (based on the area underneath each point of the CDF) offered by second-degree stochastic dominance (SSD). The ranking results of the SSD analysis are presented in Tables 4 and 5. For corn gross margin (Table 4), SSD analysis of the tillage system alternatives (reading dominance from left to right across the table rows) shows that the moldboard plow tillage system alternative dominated all other tillage system alternatives and the chisel plow tillage system alternative did not dominate any other tillage system.. The results for the no-till and ridge-till tillage system alternatives were mixed, i.e., these two tillage system alternatives dominated some but not all of the other tillage system alternatives.
SSD analysis of soybean gross margin indicates that the moldboard plow tillage system alternative dominated the ridge-till and chisel plow tillage system alternatives but not the no-till system. In contrast to corn gross margin, both the ridge-till and chisel plow tillage system alternatives did not dominate any other alternative (Table 4).
SSD analysis of corn net return was nearly identical to corn gross margin with the exception that the ridge-till tillage system alternative dominated the no-till system for corn gross margin but not for net return (Table 5). Interestingly, the soybean net return SSD analysis was also nearly identical to the soybean gross margin SSD analysis—the only difference was that the ridge-till tillage system alternative dominated the chisel plow system for soybean net return but not for gross margin.
The above results indicate that the moldboard plow and no-till tillage system alternatives were the most preferred (i.e., ranked either first or second) for all SSD analyses, with the exception of corn gross margin. In this case, Table 4 shows that the ridge-till tillage system alternative was the second most preferred after the moldboard plow tillage system alternative. However, these results may not be conclusive in that a known weakness of SSD is that it does not rigorously discriminate between distributions at all levels. This is problematic for analyzing many economic scenarios in agriculture because the most risk is usually at the distribution tails (i.e., very low levels of gross margin or net return). For example, in Figure 2, the no-till tillage system alternative clearly dominates the ridge-till system in every case except the lower outcomes where the CDFs cross at approximately 0.10 in cumulative probability. SSD assumes risk aversion so it cannot rank the no-till tillage system alternative as dominant over the ridge-till system (or vice versa). SSD accounts for the possibility that some decision makers possess an absolute risk aversion parameter that is so large that the utility of a small difference at the lowest observation is extraordinarily important. In empirical work, it is often found that these two forms of analysis are not discriminating enough to yield useful results, meaning that the efficient set can still be too large to be easily manageable [37,43,44]. Moreover, as noted in relation to loss aversion, allowing for extreme risk aversion is unrealistic. Therefore, there is a case for using SDRF, which allows for tighter restrictions on risk aversion.
3.2.2. Stochastic Dominance with Respect to a Function (SDRF)
As previously discussed, the SDRF analysis was performed using four intervals (bounds) for the lower (raL) and upper (raU) and absolute risk aversion coefficients. The tillage system alternative rankings based on generalized SDRF are presented in Tables 6 and 7. SDRF rankings are shown for the most preferred (ranking = 1st) to the least preferred (ranking = 4th) for the tillage system alternatives. For corn gross margin, the SDRF tillage system alternative rankings (from the most preferred to least preferred) were identical for all ARAC intervals (i.e., from risk neutral to extremely risk averse): moldboard plow, ridge-till, no-till, and chisel plow (Table 6). For soybean gross margin, the no-till and ridge-till tillage system alternatives were ranked the highest and lowest, respectively, for all ARAC intervals. Similar to soybean gross margin, for corn net return the no-till and ridge-till tillage system alternatives were ranked the highest and lowest, respectively, for all ARAC intervals with the exception of the extremely risk averse ARAC level (0.002 to 0.003) where the chisel plow tillage system alternative was the lowest ranked (Table 7). For soybean net return, the moldboard plow tillage system alternative was the highest ranked followed by the no-till tillage system alternative (Table 7). The SDRF results in Table 4 are quite similar to the SSD results in that the moldboard plow and no-till tillage system alternatives were the most preferred (i.e., ranked either first or second across nearly all risk aversion levels) with the exception of corn gross margin. Identical to the SSD analysis, the SDRF corn gross margin analysis in Table 6 shows the ridge-till tillage system alternative as the second most preferred (after the moldboard plow tillage system alternative).
Richardson et al. [40] strongly proposed using SERF methodology if SDRF analysis calculated different efficient sets and also to determine the precise ARAC level where the efficient set changes.
3.2.3. Stochastic Efficiency with Respect to a Function (SERF)
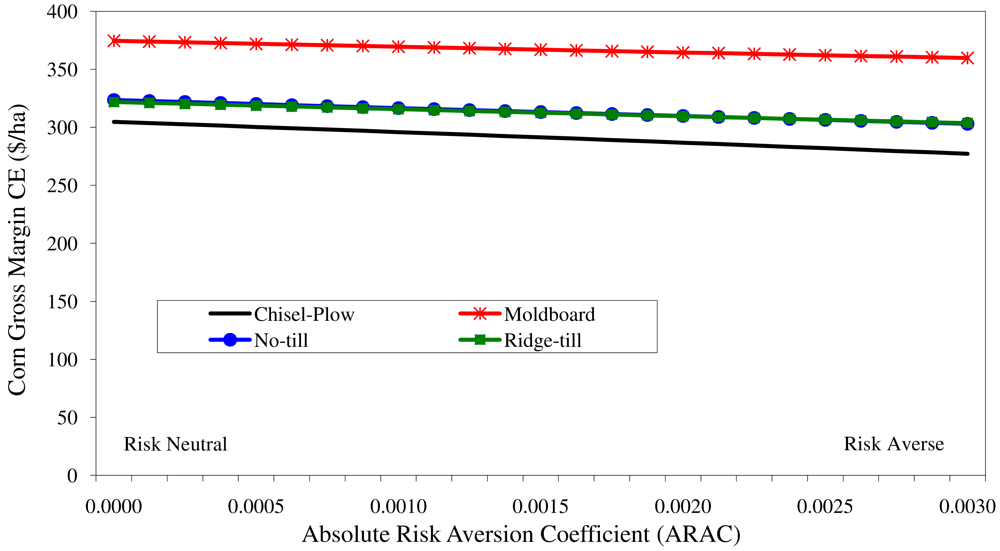
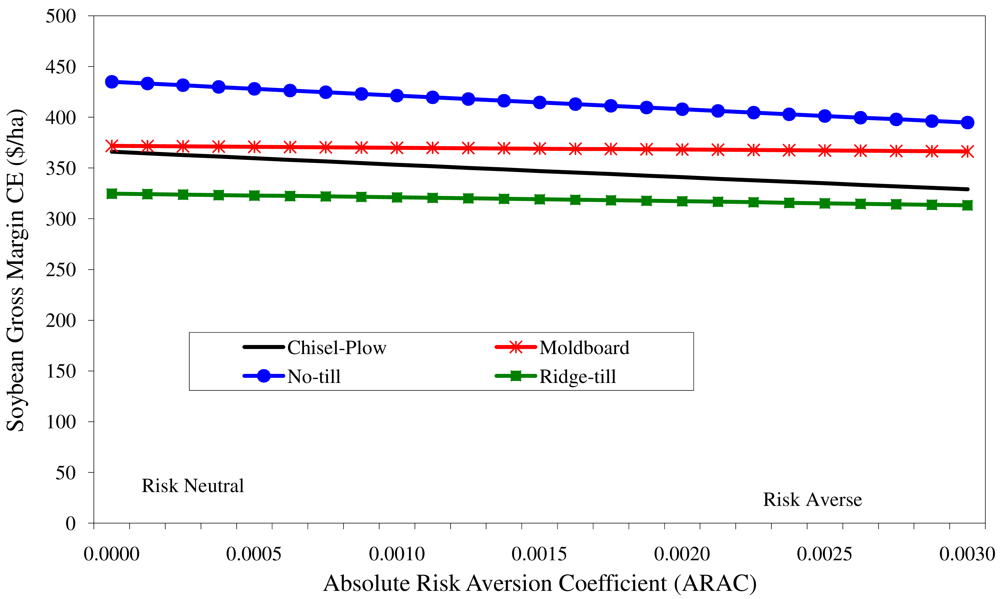
For ease in interpreting the SERF results, the CEs of the tillage system alternatives can be graphed on the vertical axis against risk aversion on the horizontal axis over the range of the ARAC values. Where the lines intersect, the strategies are equivalent to each other in terms of risk aversion. SERF results for corn and soybean gross margin and net return are shown in Figures 5–8. Figure 5 shows the gross margin CE results for all ARAC values for the tillage system alternatives under corn. The results show that the rankings do not appreciably change as risk aversion increases and that the moldboard plow tillage system was preferred across the entire range of risk aversion. For a risk neutral decision maker, the overall difference between the gross margin of the tillage system alternatives was ∼$75/ha. This indicates the risk preferring farmer would need to receive ∼$75/ha to be indifferent between the moldboard plow tillage system (highest ranked) and the chisel plow system (lowest ranked), and less than $75/ha for the no-till and ridge-till systems with nearly identical rankings. The difference in gross margin between the tillage system alternatives remained nearly constant as the risk aversion increased (Figure 5). Under extreme risk aversion (ARAC = 0.003), the farmer would need to receive ∼$60/ha to be indifferent between the moldboard plow tillage system and the no-till system and ∼$80/ha to be indifferent between the moldboard plow tillage system and the chisel plow tillage system. The gross margin CE results for all ARAC's for the tillage system alternatives under soybean are presented in Figure 6. The no-till tillage system alternative was the most preferred and the ridge-till tillage system alternative the least preferred across the entire range of risk aversion. Similar to the SERF CE calculations for corn gross margin in Figure 5, the soybean gross margin CE calculations in Figure 6 show a CE range of ∼$50 to $60/ha between the tillage system alternatives across the entire range of risk aversion.
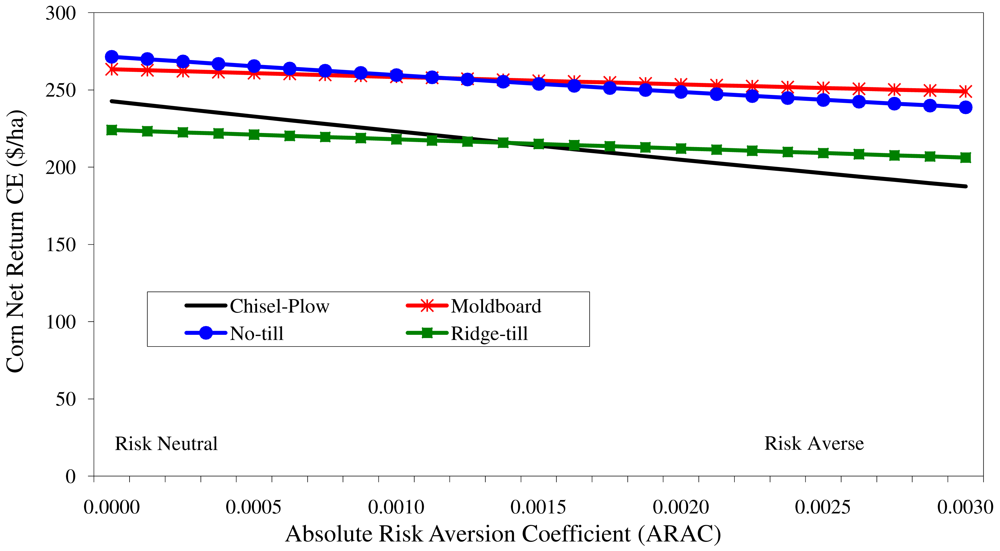
The net return CE results for all ARAC values for the tillage system alternatives under corn and soybean are shown in Figures 7 and 8, respectively. The corn net return results in Figure 7 show that the no-till tillage system alternative was the most preferred until the ARAC reached a moderate level of risk aversion (ARAC = 0.0015) at which point moldboard plow was the most preferred tillage system alternative.
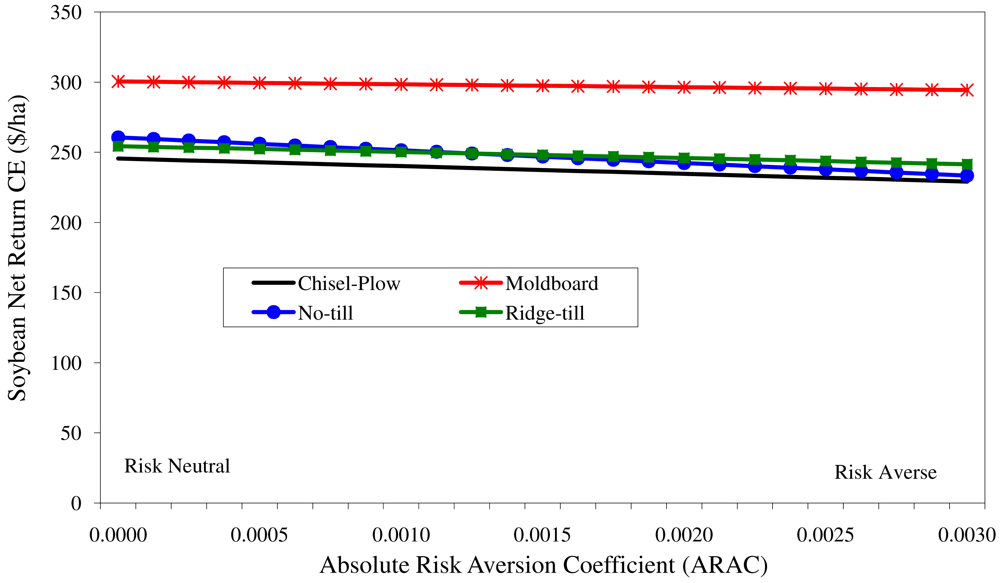
The chisel plow and ridge-till tillage system alternatives switch between the third and least most preferred system, respectively, again at a moderate level of risk aversion (i.e., ARAC = 0.0015). The soybean net return results in Figure 8 show that the moldboard plow tillage system was preferred across the entire range of risk aversion. The no-till tillage system alternative was the second most preferred system until the ARAC reached approximately 0.0005 at which point the ridge-till tillage system was the second most preferred. Figure 8 also shows that chisel plow was the least preferred tillage system alternative for soybean net return across all risk aversion levels (but only by a small margin), unlike the corn net return results in Figure 7 where the chisel plow tillage system alternative was preferred over the moldboard plow system until moderate levels of risk aversion were reached.
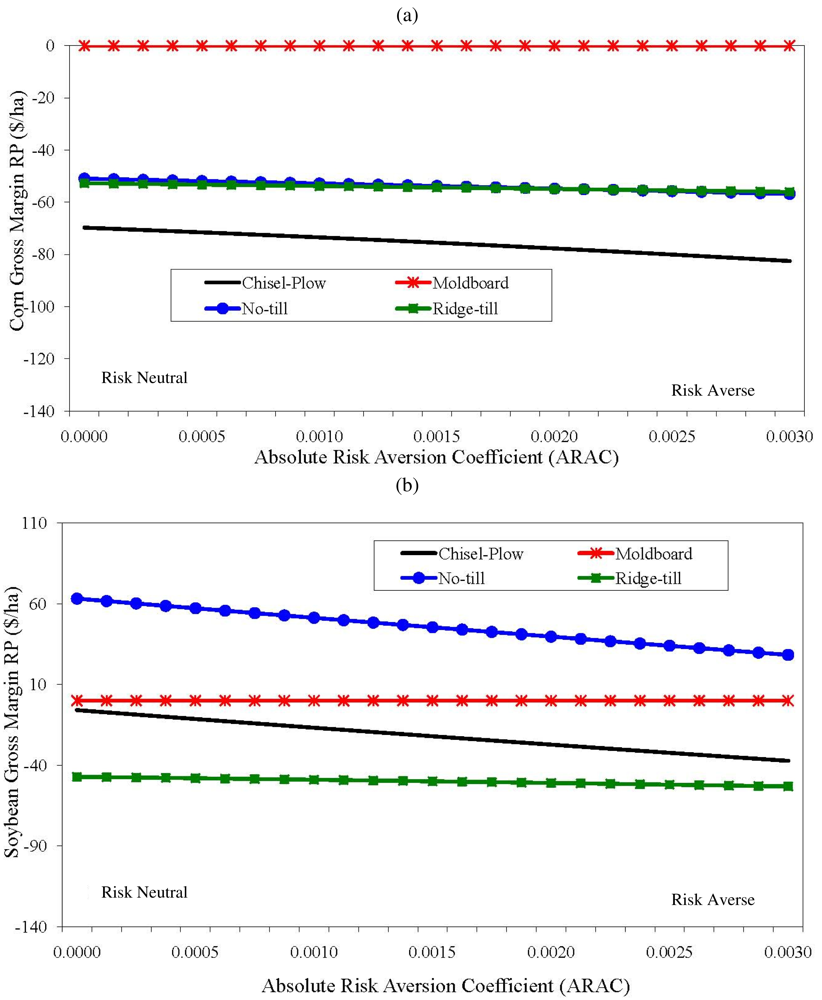
The risk premium results for corn and soybean gross margin and net return calculated using Equation (4) are shown in Figures 9 and 10. The risk premium results compare the absolute differences in the CEs for the moldboard plow tillage system (the baseline system) to the three other tillage systems across the entire range of risk aversion. For corn gross margin (Figure 9a), all risk premiums for the no-till, ridge-till, and chisel plow tillage systems were negative, indicating a farm manager would not pay to use these systems based on economic considerations alone. As shown in Figure 9b for soybean gross margin, the risk premiums were negative for ridge-till across the entire range of risk aversion, indicating a decision maker would not pay to use this tillage system. However, the risk premiums for no-till were positive, i.e., a decision maker would pay up to ∼$60/ha to use the no-till system instead of the moldboard plow system for risk neutral preferences and up to ∼$30/ha to use the no-till system instead of the moldboard plow system for extremely risk averse preferences. For corn net return (Figure 10a), the no-till risk premium was positive (∼$10/ha) with respect to the moldboard plow risk premium until an ARAC of 0.001 was reached. The moldboard plow tillage system would be preferred to the no-till system from this point forward as risk aversion increases. All corn net return risk premiums for the chisel plow and ridge-till tillage system alternatives were negative across the entire range of risk aversion, again indicating a farm manager would probably not pay to use these systems. For soybean net return (Figure 10b), the risk premiums ranged from a maximum of ∼$40/ha for no-till and a risk neutral decision maker to ∼$60/ha for chisel plow/no-till and an extremely risk averse decision maker. This indicates that at an ARAC of 0.0, the risk neutral manager would need to receive ∼$40/ha to be indifferent between the no-till and the moldboard plow tillage systems. This “indifference” payment between no-till and moldboard plow increases to ∼$60/ha for the extremely risk averse (i.e., ARAC = 0.003) decision maker. Similar to Figure 9a for corn gross margin, all soybean net return risk premiums for the no-till, ridge-till, and chisel plow tillage systems were negative.
3.3. Stoplight Analysis
The Stoplight visualization tool is effective when the objective of the decision maker is to determine the probability of an outcome between upper and lower cutoff values when analyzing alternatives. Figure 11 illustrates the probability of having a corn and soybean gross margin (Figures 11a,b) or net return (Figures 11c,d) of plus (upper cutoff value) or minus (lower cutoff value) one standard deviation of the mean for each tillage system, based on the cumulative probability functions (e.g., Figures 1–4). The upper and lower cutoff values ($/ha), respectively, are $433.00/$182.00 for corn gross margin (Figure 11a); $543.31/$218.00 for soybean gross margin (Figure 11b); $423.16/$72.30 for corn net return (Figure 11c); and $375.73/$142.57 for soybean net return (Figure 11d). Figures 11a,b clearly show that if the decision maker is interested in the downside risk associated with gross margin then the moldboard plow tillage system is preferred as there was no probability range less than the lower cutoff value (i.e., one standard deviation below the mean) for this system. The moldboard plow tillage system is again preferred if the decision maker is interested in the probability of achieving a higher mean gross margin. The Stoplight net return analyses for corn and soybean in Figures 11c,d are similar to the gross margin results in that the moldboard plow tillage system is preferred regardless of whether the objective of the decision maker is to minimize risk or maximize net return. An additional piece of useful information that the Stoplight analysis can provide is the probability of obtaining a negative gross margin or net return. When the lower cutoff value ($/ha) is set to 0.0 (instead of minus one standard deviation) there is zero probability that corn or soybean gross margin (across all tillage system alternatives) will be negative. For corn and soybean net return and a lower cutoff value ($/ha) of 0.0, only the chisel plow tillage system for corn and the no-till system for soybean had a probability of a negative return (10% and 3%, respectively). The Stoplight results shown in Figure 11 are comparable to the SERF analysis results with the exception that the moldboard plow tillage system was superior in all cases. For the SERF results, the no-till system was preferred for soybean gross margin at all but the extreme level of risk aversion, and the ridge-till system was preferred for corn net return at all levels of risk aversion.
4. Discussion
The above results indicate that the moldboard plow and no-till tillage system alternatives were more risk efficient compared to the other tillage systems, especially for farm managers who are relatively more risk averse. Chase and Duffy [8] found that the moldboard plow system produced statistically significant higher returns to land, labor, and management than the other Nashua, IA tillage systems for the years 1978–1987. Similar to this study, Klemme [3] showed that no-till tillage systems were dominated (using FSD and SSD) by conventional tillage systems for a corn-soybean rotation in north-central Indiana. However, the results must be qualified in that for the Nashua, IA data set used in our study (1990–2003), both environmental (e.g., hail in 1994–1995) and management changes (e.g., a reduction in chemical fertilizer rates between 1990–1993 and 1994–1999 on most plots) occurred which could have affected yield and yield variability during the study period [45]. Furthermore, Klemme [3] stated that changes in yields or costs, such as reduced herbicide costs through improved weed control in no-till planting, could lead to quite different tillage system rankings for risk averse farmers (and consequently improve the relative attractiveness of no-till). This observation was confirmed by Williams et al. [25] who noted that in the current economic environment the volatility of input costs may play nearly as big a role in tillage and cropping decisions as commodity prices.
Despite the fact that many studies comparing net income between conventional and reduced tillage systems are contradictory, there is a growing scientific consensus that environmental and other sustainability benefits of reduced tillage systems may outweigh potential disadvantages [46,47]. Chase and Duffy [8] long ago pointed out that, despite the oftentimes superior performance of conventional tillage systems, “the adoption of conservation tillage practices can be accomplished without lowering economic returns or significantly increasing chemical use.” Indeed, Figures. 5-8 show that the no-till and ridge-till reduced tillage systems performed very well, even with the moldboard plow tillage system included in the analysis. For the SDRF and SERF analyses, the no-till tillage system alternative was more risk efficient for soybean gross margin and corn net return compared to the other tillage system alternatives. Furthermore, no-till may require less labor which might allow more off-farm income or alternatively the farmer could have a larger farm. In other words, farmers using no-till may have higher general income that is not reflected in farm gross margin or net return. It is important to note that: (1) traditional stochastic dominance and SERF analyses focus strictly on economic sustainability without consideration of other externalities (e.g., soil quality) which may render a conventional tillage system environmentally unsustainable in the long term; and (2) most studies comparing economic and/or environmental data between conventional and reduced tillage systems omit an important area that affects profit and sustainability—the impact on farm business risk. If decisions are made without considering risk, the decision maker can easily determine which strategy is best, the one with the greatest average net income [48]. When decisions are made considering risk, such as in agriculture, the decision maker cannot use such a simple rule because the economic return for each alternative is a distribution of returns rather than a single value [5]. In this study, we have used various risk analysis methodologies to expand upon this concept, i.e., the application of traditional stochastic dominance and SERF methods for quantifying the effects of experimental designs on economic sustainability outcomes when comparing alternative production systems over time.
5. Summary and Conclusions
The primary goal of this study was to explore several risk ranking methods including SSD, SDRF, and SERF to generate economic sustainability rankings for conventional and reduced tillage systems using 14 years (1990–2003) of economic budget data collected from 35 treatments on 36 plots at the Iowa State University Northeast Research Station near Nashua, IA, USA. Four tillage system alternatives (chisel plow, moldboard plow, no-till, and ridge-till) were analyzed. For the stochastic dominance analysis, the tillage system alternatives were ranked using second-degree stochastic dominance (SSD) and stochastic dominance with respect to a function (SDRF). For the SERF analysis, certainty equivalent (CE) values for gross margin and net return by crop were calculated for each tillage system alternative. In addition to the stochastic dominance and SERF analyses, an economic analysis of the tillage system alternatives was also performed using simple statistical (e.g., mean-variance and CV) measures. Finally, the visually-based Stoplight method was employed for displaying gross margin and net return probability distribution information at cutoff points one standard deviation above and below mean values.
Statistical analysis of the economic measures alone provided somewhat contradictive and non-conclusive rankings, e.g., examination of the mean-variance and CV results for corn and soybean gross margin and net return showed that different tillage system alternatives were the highest ranked depending on the criterion and the type of crop (corn or soybean). Stochastic dominance analysis results were very similar for both SSD and SDRF, i.e., for both methods the moldboard plow or no-till tillage system alternatives were ranked either first or second with the exception of the ridge-till system which was ranked second for corn gross margin. SERF analysis results were dependent on the type of crop, economic outcome of interest (gross margin or net return) and level of risk aversion. The moldboard plow tillage system was preferred across the entire range of risk aversion for corn gross margin and soybean net return. The no-till tillage system alternative was preferred across the entire range of risk aversion for soybean gross margin. For the corn net return SERF analysis, the no-till and moldboard plow tillage system alternatives were both preferred depending on the level of risk aversion. For the Stoplight analysis, the moldboard plow tillage system was preferred for corn and soybean regardless of whether the objective of the decision maker was to minimize risk or maximize gross margin or net return. In summary, the risk analysis results indicate that: (1) there was no single tillage system alternative that was consistently preferred across the SSD, SDRF, and SERF analyses for both type of crop and gross margin/net return; and (2) the chisel plow tillage system alternative was never preferred (i.e., ranked first) for any of the risk analysis methods.
Our study illustrates that using the SERF methodology to examine gross margin and net return risk can be a useful component in analyzing tillage system sustainability. However, the difference in tillage systems, considering risk, may be difficult to discern because environmental/management changes and production cost instability can cause one tillage system to be selected over another. Our results also show that using statistical or semi-quantitative methods to rank tillage system alternatives may lead to ambiguous conclusions. Even with quantitative assessments, the typical absence in commonly advocated methods (e.g., mean-variance) of a systematic way to accommodate risk aversion seems unsatisfactory. The traditional stochastic dominance and SERF methods of tillage system assessment illustrated herein help to overcome these limitations. However, stochastic dominance and SERF approaches for assessing tillage system sustainability based primarily upon economics may not tell the whole picture, i.e., it is often more productive to focus on the distributions of possible risky outcomes that, in farming as in other forms of business, may be due to many causes such as unpredictable weather or a shift in market prices [15]. Another important factor that is difficult to measure (but could affect yield and subsequently gross margins/net returns) is the time it takes the farm operator to master the management of a new tillage system. Furthermore, the manager's perception of risk associated with each tillage system is often highly qualitative, and may be the driving factor in the selection decision. Nevertheless, the results of this study are important in that they highlight the potential of traditional stochastic dominance and SERF methods for quantifying income-risk sustainability between different tillage systems (across a range of risk aversion levels).
Several limitations of the study should be mentioned to better assist with interpretation of the results. Similar to Pendell et al. [21] and others, we have used a single utility function (negative exponential) that approximates an inter-temporal utility function. Future research should consider alternative utility functions for SERF such as the power, expo-power, and log utility functions. In addition, this study does not explicitly consider the impact of time, i.e., the results should be considered applicable only to the time period of the study and not to future data. Finally, we have illustrated the use of a traditional stochastic dominance and SERF framework for the problem of evaluating alternative tillage systems based on long-term experimental data. The primary sustainability attribute considered was risk attitude with regard to income. However, as previously stated, farmers have multiple farm management objectives when considering farm sustainability including managing financial risk, managing institutional risk (e.g., maintaining government program eligibility), and evaluating soil conservation or environmental benefits. Thus, it is difficult to select whether a reduced tillage system or which tillage system is generally best for all farm managers, each of whom will have personal preferences on how they perceive system risk.


| Treatment ID | Treatment period | Cropping/tillage system | No. of treatment observations | Treatment ID | Treatment period | Cropping/tillage system | No. of treatment observations |
|---|---|---|---|---|---|---|---|
| 1 | 1990–1992 | CC/NT | 9 | 19 | 1993–1998 | CC/CP | 18 |
| 2 | 1990–1993 | CS/NT | 15 | 20 | 1994–2003 | CS/CP | 30 |
| 3 | 1990–1992 | SC/NT | 9 | 21 | 1993–2003 | SC/CP | 27 |
| 4 | 1990–1992 | CC/CP | 9 | 22 | 2000–2003 | CS/CP | 12 |
| 5 | 1990–1993 | CS/CP | 18 | 23 | 2001–2003 | SC/CP | 9 |
| 6 | 1990–1992 | SC/CP | 9 | 24 | 1993–1998 | CC/CP | 18 |
| 7 | 1990–1992 | CC/MP | 9 | 25 | 1994–2003 | CS/CP | 30 |
| 8 | 1990–1992 | CS/MP | 9 | 26 | 1993–2003 | SC/CP | 33 |
| 9 | 1990–1992 | SC/MP | 9 | 27 | 1999 | CC/CP | 6 |
| 10 | 1990–1992 | CC/RT | 9 | 28 | 2000–2003 | CS/CP | 12 |
| 11 | 1990–1992 | CS/RT | 9 | 29 | 2000–2003 | SC/CP | 12 |
| 12 | 1990–1992 | SC/RT | 9 | 30 | 2000 | CC/CP | 3 |
| 13 | 1994–1998 | CS/NT | 15 | 31 | 2001–2003 | CS/CP | 9 |
| 14 | 1993–2000 | SC/NT | 27 | 32 | 2001–2003 | SC/CP | 9 |
| 15 | 1994–1999 | CS/CP | 21 | 33 | 2000–2003 | CS/NT | 12 |
| 16 | 1993–2000 | SC/CP | 27 | 34 | 2001–2003 | SC/NT | 9 |
| 17 | 1994–1999 | CS/NT | 18 | 35 | 1999–2000 | SC/CP | 6 |
| 18 | 1993–1998 | SC/NT | 18 |
*CS: corn-soybean rotation with corn during even years; SC: soybean-corn rotation with corn during odd years; CC: continuous corn; CP: chisel plow; RT: ridge-till; MP: moldboard plow; NT: no-till.
| Gross margin ($/ha) | ||||
|---|---|---|---|---|
| Chisel plow | Moldboard plow | No-till | Ridge-till | |
| Corn | ||||
| Mean | 300.18 | 364.31 | 310.19 | 320.43 |
| Variance | 17350.2 | 10520.6 | 13502.4 | 12805.2 |
| Coefficient of variation (CV) | 0.44 | 0.28 | 0.37 | 0.35 |
| Skewness | −0.40 | 0.63 | 0.22 | 0.27 |
| Kurtosis | 0.02 | −1.42 | −0.56 | −1.02 |
| Range | 636.42 (−73.15–563.27) | 291.20 (236.10–527.30) | 493.32 (69.46–562.78) | 357.19 (150.70–507.89) |
| Soybean | ||||
| Mean | 364.48 | 371.88 | 427.33 | 320.44 |
| Variance | 27712.3 | 4191.3 | 27370.4 | 8361.3 |
| Coefficient of variation (CV) | 0.46 | 0.17 | 0.39 | 0.29 |
| Skewness | 0.46 | 0.21 | 0.39 | 0.29 |
| Kurtosis | 0.07 | −1.72 | −0.13 | −0.75 |
| Range | 753.83 (92.10–845.93) | 163.38 (288.93–452.31) | 699.17 (102.57–801.74) | 240.88 (164.32–405.20) |
| Net return ($/ha) | ||||
|---|---|---|---|---|
| Chisel plow | Moldboard plow | No-till | Ridge-till | |
| Corn | ||||
| Mean | 236.49 | 257.29 | 282.32 | 212.11 |
| Variance | 35298.9 | 10545.2 | 27652.4 | 13301.0 |
| Coefficient of variation (CV) | 0.79 | 0.40 | 0.59 | 0.54 |
| Skewness | 0.33 | 0.59 | 0.84 | 0.19 |
| Kurtosis | −0.10 | −1.37 | 0.43 | −0.98 |
| Range | 825.62 (-261.14–564.48) | 300.02 (123.71–423.73) | 620.96 (34.22–655.18) | 370.96 (32.30–403.26) |
| Soybean | ||||
| Mean | 247.15 | 302.29 | 281.46 | 249.73 |
| Variance | 10656.4 | 4443.6 | 21824.2 | 8983.2 |
| Coefficient of variation (CV) | 0.42 | 0.22 | 0.52 | 0.38 |
| Skewness | 0.42 | 0.22 | 0.52 | 0.38 |
| Kurtosis | −0.42 | −1.71 | −0.03 | −0.78 |
| Range | 727.17 (−156.22–570.95) | 168.37 (214.30–382.67) | 789.29 (-162.59–626.70) | 246.79 (87.76–334.55) |
| Chisel plow | Moldboard plow | No-till | Ridge-till | SSD dominance ranking level | |
|---|---|---|---|---|---|
| Corn | |||||
| Chisel plow | --- | Not dominant | Not dominant | Not dominant | 4 |
| Moldboard plow | Dominant | --- | Dominant | Dominant | 1 |
| No-till | Dominant | Not dominant | --- | Not dominant | 3 |
| Ridge-till | Dominant | Not dominant | Dominant | --- | 2 |
| Soybean | |||||
| Chisel plow | --- | Not dominant | Not dominant | Not dominant | 3 |
| Moldboard plow | Dominant | --- | Not dominant | Dominant | 1 |
| No-till | Dominant | Not dominant | --- | Not dominant | 2 |
| Ridge-till | Not dominant | Not dominant | Not dominant | --- | 3 |
| Chisel plow | Moldboard plow | No-till | Ridge-till | SSD dominance ranking level | |
|---|---|---|---|---|---|
| Corn | |||||
| Chisel plow | --- | Not dominant | Not dominant | Not dominant | 3 |
| Moldboard plow | Dominant | --- | Dominant | Dominant | 1 |
| No-till | Dominant | Not dominant | --- | Not dominant | 2 |
| Ridge-till | Dominant | Not dominant | Not dominant | --- | 2 |
| Soybean | |||||
| Chisel plow | --- | Not dominant | Not dominant | Not dominant | 3 |
| Moldboard plow | Dominant | --- | Not dominant | Dominant | 1 |
| No-till | Dominant | Not dominant | --- | Not dominant | 2 |
| Ridge-till | Dominant | Not dominant | Not dominant | --- | 2 |
| Absolute risk aversion coefficient (ARAC) level | SDRF dominance ranking level | |||
|---|---|---|---|---|
| 1st | 2nd | 3rd | 4th | |
| Corn | ||||
| 0.0 to 0.0005 (Risk neutral) | Moldboard plow | Ridge-till | No-till | Chisel plow |
| 0.0005 to 0.001 | Moldboard plow | Ridge-till | No-till | Chisel plow |
| 0.001 to 0.002 | Moldboard plow | Ridge-till | No-till | Chisel plow |
| 0.002 to 0.003 (Risk averse) | Moldboard plow | Ridge-till | No-till | Chisel plow |
| Soybean | ||||
| 0.0 to 0.0005 (Risk neutral) | No-till | Moldboard plow | Chisel plow | Ridge-till |
| 0.0005 to 0.001 | No-till | Moldboard plow | Chisel plow | Ridge-till |
| 0.001 to 0.002 | No-till | Moldboard plow | Chisel plow | Ridge-till |
| 0.002 to 0.003 (Risk averse) | No-till | Moldboard plow | Chisel plow | Ridge-till |
| Absolute risk aversion coefficient (ARAC) level | SDRF dominance ranking level | |||
|---|---|---|---|---|
| 1st | 2nd | 3rd | 4th | |
| Corn | ||||
| 0.0 to 0.0005 (Risk neutral) | No-till | Moldboard plow | Chisel plow | Ridge-till |
| 0.0005 to 0.001 | No-till | Moldboard plow | Chisel plow | Ridge-till |
| 0.001 to 0.002 | No-till | Moldboard plow | Chisel plow | Ridge-till |
| 0.002 to 0.003 (Risk averse) | No-till | Moldboard plow | Ridge-till | Chisel plow |
| Soybean | ||||
| 0.0 to 0.0005 (Risk neutral) | Moldboard plow | No-till | Ridge-till | Chisel plow |
| 0.0005 to 0.001 | Moldboard plow | No-till | Ridge-till | Chisel plow |
| 0.001 to 0.002 | Moldboard plow | No-till | Ridge-till | Chisel plow |
| 0.002 to 0.003 (Risk averse) | Moldboard plow | No-till | Ridge-till | Chisel plow |
Acknowledgments
We acknowledge the Department of Agricultural and Biosystems Engineering at Iowa State University for initiating and maintaining the experimental study at the Nashua Northeast Research Station, collecting the data, and graciously sharing the data with us. In addition, we acknowledge Kevin Boyle with the USDA NRCS for his role in initially summarizing the Nashua economic data under the NRCS EconDocs exchange tool.
References
- Bremer, J.E.; Livingston, S.D.; Parker, R.D.; Stichler, C.R. Conservation Tillage Applications; Texas Coop. Ext.: College Station, TX, USA, 2001. [Google Scholar]
- Vetsch, J.A.; Randall, G.W.; Lamb, J.A. Corn and soybean production as affected by tillage systems. Agron. J. 2007, 99, 952–959. [Google Scholar]
- Klemme, R. A stochastic dominance comparison of reduced tillage systems in corn and soybean production under risk. Am. J. Agric. Econ. 1985, 67, 550–557. [Google Scholar]
- Williams, J.R. A stochastic dominance analysis of tillage and crop insurance practices in a semiarid region. Am. J. Agr. Econ. 1988, 70, 112–120. [Google Scholar]
- Ribera, L.A.; Hons, F.M.; Richardson, J.W. An economic comparison between conventional and no-tillage farming systems in Burleson County, Texas. Agron. J. 2004, 96, 415–424. [Google Scholar]
- Yin, X.; Al-Kaisi, M.M. Periodic response of soybean yields and economic returns to long-term no-tillage. Agron. J. 2004, 96, 723–733. [Google Scholar]
- Pendell, D.L.; Williams, J.R.; Rice, C.W.; Nelson, R.G.; Boyles, S.B. Economic feasibility of no-tillage and manure for soil carbon sequestration in corn production in Northeastern Kansas. J. Env. Qual. 2006, 35, 1364–1373. [Google Scholar]
- Chase, C.A.; Duffy, M.D. An economic analysis of the Nashua tillage study: 1978–1987. J. Prod. Agric. 1991, 4, 91–98. [Google Scholar]
- Yiridoe, E.K.; Weerksink., A.; Hooker, D.C.; Vyn, T.J.; Swanton, C. Income risk analysis of alternative tillage systems for corn and soybean production on clay soils. Can. J. Agric. Econ. 2000, 48, 161–174. [Google Scholar]
- Al-Kaisi, M.; Yin, X. Step-wise time response of corn yield and economic returns to no-till. Soil Tillage. Res. J. 2004, 78, 91–101. [Google Scholar]
- Lee, J.; Brown, D.J.; Lovejoy, S. Stochastic efficiency versus mean-variance criteria as predictors of adoption of reduced tillage. Amer. J. Agric. Econ. 1985, 67, 839–845. [Google Scholar]
- Williams, J.R.; Johnson, O.S.; Gwin, R.E. Tillage systems for wheat and sorghum: An economic analysis and risk analysis. J. Soil Wat. Cons. 1987, 42, 120–123. [Google Scholar]
- Larson, J.A.; Roberts, R.K.; Tyler, D.D.; Duck, B.N.; Slinsky, S.P. Stochastic dominance analysis of winter cover crop and nitrogen fertilizer systems for no-tillage corn. J. Soil Wat. Cons 1998, 53, 285–288. [Google Scholar]
- DeVuyst, E.A.; Halverson, A.D. Economics of annual cropping versus crop-fallow in the Northern Great Plains as influenced by tillage and nitrogen. Agron. J. 2004, 96, 148–153. [Google Scholar]
- Hardaker, J.B.; Richardson, J.W.; Lien, G.; Schumann, K.D. Stochastic efficiency analysis with risk aversion bounds: A simplified approach. Aus. J. Agric. Res. Econ. 2004, 48, 253–270. [Google Scholar]
- Hardaker, J.B.; Huirne, R.B.M.; Anderson, J.R.; Lien, G. Coping with Risk in Agriculture, 2nd ed.; CABI Publishing: Cambridge, MA, USA, 2004. [Google Scholar]
- Grove, B. Stochastic efficiency optimization of alternative agricultural water use strategies. Agrekon 2006, 45, 406–420. [Google Scholar]
- Grove, B.; Nel, F.; Maluleke, H.H. Stochastic efficiency analysis of alternative water conservation strategies. Agrekon 2006, 45, 50–59. [Google Scholar]
- Lien, G.; Stordal, S.; Hardaker, J.B.; Asheim, L.J. Risk aversion and optimal forest replanting: A stochastic efficiency study. Eur. J. Oper. Res. 2007, 181, 1584–1592. [Google Scholar]
- Lien, G.; Hardaker, J.B.; Flaten, O. Risk and economic sustainability of crop farming systems. Agric. Sys. 2007, 94, 541–552. [Google Scholar]
- Pendell, D.L.; Williams, J.R.; Boyles, S.B.; Rice, C.W.; Nelson, R.G. Soil carbon sequestration strategies with alternative tillage and nitrogen sources under risk. Rev. Agric. Econ. 2007, 29, 247–268. [Google Scholar]
- Watkins, K.B.; Hill, J.L.; Anders, M.M. An economic risk analysis of no-till management and rental arrangements in Arkansas rice production. J. Soil Wat. Cons. 2008, 63, 242–250. [Google Scholar]
- Archer, D.W.; Reicosky, D.C. Economic performance of alternative tillage systems in the Northern Corn Belt. Agron. J. 2009, 101, 296–304. [Google Scholar]
- Grove, B.; Oosthuizen, L.K. Stochastic efficiency analysis of deficit irrigation with standard risk aversion. Agric. Wat. Man. 2010, 97, 792–800. [Google Scholar]
- Williams, J.R.; Llewelyn, R.V.; Pendell, D.J.; Schlegel, A.; Dumler, T. A risk analysis of converting conservation reserve program acres to a wheat-sorghum-fallow rotation. Agron. J. 2010, 102, 612–622. [Google Scholar]
- Karlen, D.L.; Berry, E.C.; Colvin, T.S. Twelve year tillage and crop rotation effects on yields and soil chemical properties in northeast Iowa. Commun. Soil Sci. Plant Anal. 1991, 22, 1985–2003. [Google Scholar]
- Bakhsh, A.; Kanwar, R.S.; Karlen, D.L.; Cambardella, C.A.; Colvin, T.S.; Moorman, T.B.; Bailey, T.B. Tillage and nitrogen management effects on crop yield and residual soil nitrate. Trans. ASAE 2000, 44, 1589–1595. [Google Scholar]
- Voy, K.D. Soil Survey of Floyd County, Iowa; USDA-SCS and Iowa Agriculture and Home Economics Experiment Station, Co-operative Extention Service: Ames, IA, USA, 1995. [Google Scholar]
- Kay, R.D. Farm Management: Planning, Control, and Implementation, 2nd ed.; McGraw-Hill Book Company: New York, NY, USA, 1986. [Google Scholar]
- Robison, L.J.; Barry, P. The Competitive Firm's Response to Risk; Macmillan Publishing Co.: New York, NY, USA, 1987. [Google Scholar]
- Boggess, W.G.; Ritchie, J.T. Economic and risk analysis of irrigation decisions in humid regions. J. Prod. Agric. 1988, 1, 116–122. [Google Scholar]
- Williams, J.R.; Llewelyn, R.V.; Mikesell, C.L. An economic risk analysis of conservation tillage systems for wheat, grain sorghum, and soybeans in the Great Plains. J. Soil Wat. Cons. 1989, 34, 234–239. [Google Scholar]
- Weersink, A.; Walker, M.; Swanton, C.; Shaw, J.E. Economic comparison of alternative tillage systems under risk. Can. J. Agric. Econ. 1992, 40, 199–217. [Google Scholar]
- Greene, W.H. Econometric Analysis, 5th ed.; Prentice-Hall International Inc.: New York, NY, USA, 2003. [Google Scholar]
- Meyer, J. Choice among distributions. J. Econ. Theor. 1977, 14, 326–336. [Google Scholar]
- Cochran, M.J. Stochastic dominance: The state of the art in agricultural economics. Proceedings of Southern Region Project S-180 Seminar: An Economic Analysis of Risk Management Strategies for Agricultural Production Firms, Tampa, FL, USA, 23–26 March; 1986. [Google Scholar]
- King, P.K.; Robison, L.J. An interval approach to measuring decision maker preferences. Am. J. Agric. Econ. 1981, 63, 510–520. [Google Scholar]
- Keeney, R.L.; Raiffa, H. Decisions with Multiple Objectives: Preferences and Value Tradeoffs; Wiley Publishers: New York, NY, USA, 1976. [Google Scholar]
- Babcock, B.A.; Choi, E.K.; Feinerman, E. Risk and probability premiums for CARA utility functions. J. Agr. Res. Econ. 1993, 18, 17–24. [Google Scholar]
- Richardson, J.W.; Schumann, K.D.; Feldman, P.A. Simulation & Econometrics to Analyze Risk: Simetar© Inc. 2008 User Manual; Texas A & M University College Station: TX, USA, 2008. [Google Scholar]
- Thomas, A.C. Risk attitudes measured by the interval approach: A case study of Kansas farmers. Amer. J. Agr. Econ. 1987, 69, 1101–1105. [Google Scholar]
- Anderson, J.R.; Dillon, J.L. FAO Farming Systems Management Series No. 2, Rome, Italy. Risk Analysis in Dryland Farming Systems 1992. [Google Scholar]
- King, P.K.; Robison, L.J. Risk efficiency models. In Risk Management in Agriculture; Barry, P.J., Ed.; Iowa State University Press: Ames, IA, USA, 1984; pp. 68–81. [Google Scholar]
- Williams, J.R.; Roth, T.W.; Claassen, M.M. Profitability of alternative production and tillage strategies for dryland wheat and grain sorghum in the Central Great Plains. J. Soil Wat. Cons. 2000, 55, 49–56. [Google Scholar]
- Malone, R.W.; Ma, L.; Heilman, P.; Karlen, D.L.; Kanwar, R.S.; Hatfield, J.L. Simulated N management effects on corn yield and tile-drainage nitrate loss. Geoderma 2007, 140, 272–283. [Google Scholar]
- Grandy, A.S.; Robertson, G.P.; Thelen, K.D. Do productivity and environmental trade-offs justify periodically cultivating no-till cropping systems? Agron. J. 2006, 98, 1377–1383. [Google Scholar]
- Quincke, J.A.; Wortmann, C.S.; Mamo, M.; Franti, T.; Drijber, R.A.; García, J.P. One-time tillage of no-till systems: Soil physical properties, phosphorus runoff, and crop yield. Agron. J. 2007, 99, 1104–1110. [Google Scholar]
- Richardson, J.W.; Klose, S.L.; Gray, A.W. An applied procedure for estimating and simulating multivariate empirical (MVE) probability distributions in farm-level risk assessment and policy analysis. J. Agric. Appl. Econ. 2000, 332, 299–315. [Google Scholar]
© 2011 by the authors; licensee MDPI, Basel, Switzerland. This article is an open access article distributed under the terms and conditions of the Creative Commons Attribution license (http://creativecommons.org/licenses/by/3.0/)
Share and Cite
Fathelrahman, E.M.; Ascough II, J.C.; Hoag, D.L.; Malone, R.W.; Heilman, P.; Wiles, L.J.; Kanwar, R.S. Continuum of Risk Analysis Methods to Assess Tillage System Sustainability at the Experimental Plot Level. Sustainability 2011, 3, 1035-1063. https://doi.org/10.3390/su3071035
Fathelrahman EM, Ascough II JC, Hoag DL, Malone RW, Heilman P, Wiles LJ, Kanwar RS. Continuum of Risk Analysis Methods to Assess Tillage System Sustainability at the Experimental Plot Level. Sustainability. 2011; 3(7):1035-1063. https://doi.org/10.3390/su3071035
Chicago/Turabian StyleFathelrahman, Eihab M., James C. Ascough II, Dana L. Hoag, Robert W. Malone, Philip Heilman, Lori J. Wiles, and Ramesh S. Kanwar. 2011. "Continuum of Risk Analysis Methods to Assess Tillage System Sustainability at the Experimental Plot Level" Sustainability 3, no. 7: 1035-1063. https://doi.org/10.3390/su3071035
APA StyleFathelrahman, E. M., Ascough II, J. C., Hoag, D. L., Malone, R. W., Heilman, P., Wiles, L. J., & Kanwar, R. S. (2011). Continuum of Risk Analysis Methods to Assess Tillage System Sustainability at the Experimental Plot Level. Sustainability, 3(7), 1035-1063. https://doi.org/10.3390/su3071035