Low Discounting Behavior among Small-Scale Fishers in Fiji and Sabah, Malaysia

Abstract
: Understanding the socio-economic factors that are associated with fishers' willingness to delay gratification may be useful for designing appropriate fisheries management and conservation policies. We aim to identify the predictors of low discounting behaviour among fishers, which is analogous to having a longer-term outlook. We base our empirical study on two small-scale tropical reef fisheries in Sabah, Malaysia, and Fiji. We use an experimental approach to identify fishers with low discount rates, and then use a logistic regression model to identify predictors of low discount rates. We find that 42% of the respondents have low discount rates, and that site and village level variables are significant predictors of low discount rates. Within Sabah and Fiji, boat ownership and relative catch differentiate low discounting from non-low discounting fishers, but these variables have contradictory effects in Sabah and Fiji. Overall, our results imply that a substantial proportion of reef fishers may be willing to engage in conservation initiatives; however, local socio-cultural, economic, and ecological conditions have to be considered first during the process of designing management interventions.1. Introduction
Coral reef fisheries sustain the livelihoods and food security of millions of people worldwide [1], but have been extensively overexploited [2]. Well-managed reef fisheries are rare [3], and exacerbated by the fact that the majority of coral reefs occur in developing countries where restricting fishing activity will impose significant societal and economic costs on poor coastal communities [1,4-6]. The combined pressures of dwindling fish stocks and the need to earn a livelihood have led many fishers to engage in ‘outright resource destruction’ [7], a behavior which is consistent with an inability to delay economic gratification. In this context, understanding the socio-economic factors which contribute to a longer-term outlook or willingness to delay gratification among fishers may be useful for designing appropriate fisheries management and conservation policies. To address this, our study objective is to identify the socio-economic characteristics that are associated with fishers who have low discount rates. We base our empirical study on two small-scale tropical reef fisheries in Sabah, Malaysia, and Fiji.
An individual's willingness to trade current for future consumption can be measured by one's private discount rate. Understanding fishers' discount rates is important for fisheries management because fisheries economics theory suggests that overexploitation occurs when fishers' discount rates are high [8,9], i.e., they prefer receiving an immediate, certain, smaller benefit over future, uncertain, but potentially larger benefits. Akpalu [10] supports this assertion by showing that, in Ghana, fishers with higher discount rates engaged in less sustainable fishing practices. In another developing country study done in rural fishing villages where fishing was the main occupation and there was free access to fishing grounds, Fehr and Leibbrandt [11] found that more patient Brazilian fishers were less likely to exploit the fisheries resource heavily. We therefore adopt the standpoint that low, rather than high discount rates are desirable for achieving the goal of sustainable marine resource use for both current and future generations. The question of what socio-economic factors are associated with a low discount rate is therefore of policy interest. Pollnac and Poggie [12] examined factors that affect small-scale fishers' economic gratification orientation, a parallel concept to discounting. However, we do not know of any study that explicitly deals with the socio-economic predictors of fishers' discount rates. As such, our study fills a research gap that also has important management implications.
Factors such as wealth, income, education, and age are thought to lower individuals' discount rates [13], although case studies involving communities in comparable socio-economic settings to Sabah and Fiji have provided inconclusive evidence. For example, Pender [14] and Holden et al. [15] found that income was inversely related to discount rates, but Poulos and Whittington [16] found no relationship. Similarly, education and age have been both positively and negatively related to discount rates [17,18]. Differences in individuals' discount rates are also likely due to neurophysiological features (e.g., impulsiveness), personality, or learning differences [19,20]. We focus on the socio-economic correlates of discount rates, as these bear the most relevance in terms of developing management policies for small-scale reef fisheries.
Resources from coral reefs and adjacent mangrove and seagrass ecosystems have traditionally formed the backbone of fishing economies along the coasts of Sabah and Fiji [21,22]. Coral reef fisheries in both locations are small-scale, making use of various manually operated gears such as hook and line, gillnets, traps, and spears or spear guns to catch a wide variety of reef and reef-associated species. The main fish families caught in both Sabah and Fiji include groupers (Serranidae), emperors (Lethrinidae), snappers (Lutjanidae), and various mackerels and tunas (Scrombidae). Trevallies and other carangids are also commonly caught in Sabah, whereas surgeonfish (Acanthuridae) are more common in Fiji. In addition to fish for domestic consumption, fishing for internationally traded organisms such as live reef food fish species and sea cucumbers provide a valuable source of income for fishers in both locations [23-26].
Inshore fisheries resources in Sabah and Fiji have shown signs of overfishing, and fishers in both places have similarly noted a decrease in catch rates and the size of fish caught [27-29].The depletion of coral reef fisheries resources has serious socio-economic consequences for fishing communities in both locations, as these tend to be poor, with high reliance on inshore reef resources for food and income [30-32]. Faced with the pressure of having to meet immediate consumption needs from declining inshore marine resources, reef fishers in Sabah and Fiji can be expected to engage in high discounting. In the rest of this paper, we will first identify those fishers who, contrary to expectations, have low discount rates, and then examine what socio-economic factors may predict their low discounting behavior.
2. Methodology
Data for this study were obtained from 122 interviews conducted with fishers in Fiji and Sabah. The interviews were semi-structured and followed a prepared questionnaire, although interviewees had the flexibility to expand on topics of interest. The discount rate elicitation exercise formed part of a longer questionnaire that also covered topics on ecology, socio-economics, catch rates, spatial use of fishing grounds, and perceptions of change to fishery management.
2.1. Study Sites
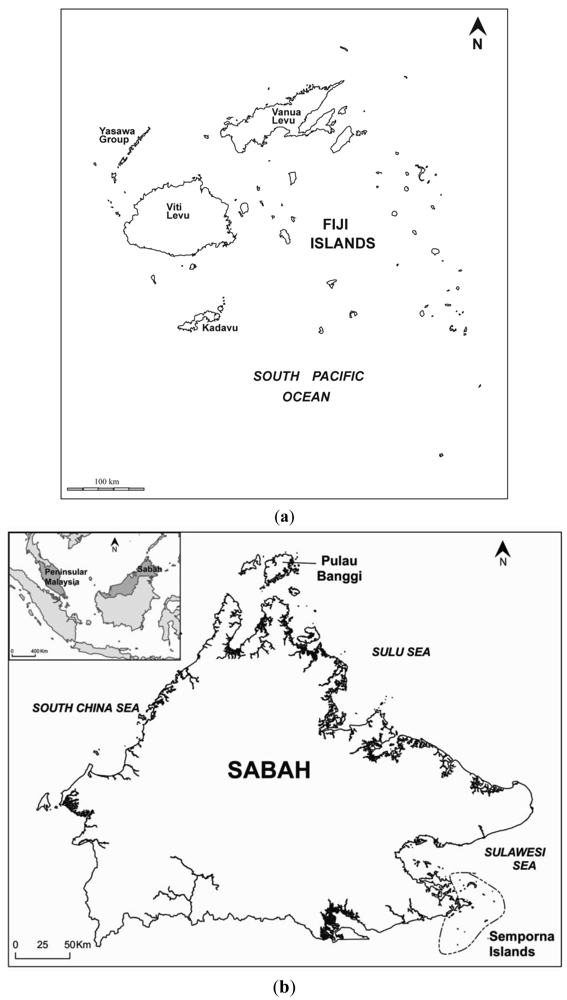
Interviews in Fiji (n = 47) were carried out in May and June 2008, while interviews in Sabah (n = 75), a Malaysian state situated on the northeast corner of Borneo, took place in April and May 2009. Interviews in Fiji covered 9 villages and 2 settlements located on Viti Levu and Vanua Levu, the two largest and most developed islands, as well as on the smaller islands of Yasawa and Kadavu (Figure 1a, Table 1). These interview sites were selected to provide a wide geographical coverage of Fiji, and artisanal and/or subsistence fishing took place at all the interview sites. Our study in Sabah was conducted in 11 rural fishing villages grouped into two main geographical areas, which were chosen due to the prevalence of reef fishing. Four villages were located in the Semporna group of islands, off the south-eastern coast of Sabah, while another 7 villages were located in Pulau Banggi (Table 1), which is an island located off the northern tip of Sabah (Figure 1b).
2.2. Estimating Personal Discount Rates
We used an experimental economics approach to estimate personal discount rates. The procedure involved providing fishers with a series of binary choices consisting of monetary payments that occurred at different points in time. The choice series followed a ‘multiple price list’ format similar to Harrison et al. [34], and was chosen because it was easy for respondents to quickly grasp how to do the exercise. For example, we asked “Would you prefer $100 today or $100 + x in one month?” The value of each subsequent delayed payment increased while the immediate payment remained constant. We inferred that the respondent's discount rate was higher than x% per month if they chose the immediate option, and less than x% per month if they chose the delayed payment. Consequently, each payment choice was bounded by upper and lower discount rates (r), which were calculated as r = −ln (x/y)/t, where x and y were the immediate and delayed payment, respectively, and t was the time delay. We used hypothetical payments in both Fiji and Sabah due to budgetary and logistical considerations. While other studies have used food or cash payments [18,35], there has been no conclusive evidence that real payments result in more realistic answers [20].
Fijian fishers completed two sets of choice series: the first series (AF) had a one-month delay period while the second series (BF) had a one-year delay. These delay periods were chosen to represent the short and long term in order to investigate whether fishers' discount rates varied over time, a topic which we do not examine further in this study. Both series had an immediate payment of FJD 400 (USD 204), which was approximately the average monthly income of fishers. Each series consisted of 13 choices, with associated annual discount rates ranging from 29 to 471% for Series AF, and 27 to 103% for Series BF. Forty-five out of 47 respondents completed both choice series.
Fishers completed three sets of choice series in Sabah. As with Fiji, the first series (AS) had a one month delay. We shortened the delay for the second series (BS) to 6 months due to the inclusion of a third series (CS), which had a front end delay of one year, so that the choice was between payment in one year and one year plus one month. Each series had 14 choices. Delayed payments in all 3 series were calculated to correspond to an annual discount rate range of 29 to 637%. The immediate payment for Series AS and BS was RM 100 (USD 29), while for Series CS it was RM 500 (USD 146). These payments were roughly equivalent to a fishers' net income for one week, and one month, respectively. Of the 75 participants, 73 completed the choice series.
The difference in discount rate ranges used in Sabah and Fiji did not affect our present analysis because we did not focus on fishers' absolute discount rate values. Rather, we were interested in low discounting fishers, whom we defined as those who chose the smallest future payment presented to them. We considered all other payment choices to be non-low discounting because they represented some degree of unwillingness to delay consumption.
2.3. Explanatory Variables
Our study was exploratory, with the aim of identifying factors associated with low discount rates. As such, the study was not designed to determine the direction of causality between low discount rates and socio-economic variables. We split the explanatory variables into 3 groups as detailed below and summarized in Table 2.
Demographic
- 1.
Age—The effect of age on discount rates is ambiguous. Becker and Mulligan [13] suggested a U shape relationship between age and discount rate, indicating that discount rates decrease through childhood, reach some minimum during adulthood, and then increase again as people grow older. In contrast, Kirby et al. [18] found a positive relationship between age and discount rates.
- 2.
Education—Education is expected to focus attention on, and facilitate planning for the future [13]. It is also assumed that people with higher education levels are more likely to earn larger incomes, which are associated with lower discount rates.
- 3.
Household size—Households with more children may be more forward-looking; thus, larger households may be associated with lower discount rates [15]. On the other hand, having a higher number of dependents may be associated with higher discount rates due to the pressure of having to fulfil larger immediate consumption needs. Therefore, the effect of household size appears to be ambiguous.
Socio-economic variables
- 4.
Poverty index—People with lower income levels tend to be less patient due to the need to provide for current consumption, which leads to an inverse relationship between discount rates and income or wealth [13-15]. We used a poverty index [36] as a standardized measure of income for fishers in Fiji and Sabah. This was calculated as a fisher's net monthly fishing income standardized to the monthly poverty line income of each country.
- 5.
Boat ownership—Owning a boat is indicative of economic security and may thus be associated with a fisher who is more oriented towards delaying gratification[12]; the maintenance that has to be done on a boat also requires a fisher to be future-oriented [12]. Boat ownership was coded as a dichotomous variable with 0 and 1 indicating not owning and owning a boat, respectively.
- 6.
Relative catch—A fisher who catches more relative to others may exhibit an unwillingness to delay current consumption, everything else being equal. Relative catch was calculated as the total catch per fisher per week, standardized to the average weekly catch for all fishers in Sabah and Fiji.
- 7.
Presence of an alternate job or income source—Due to the seasonal and periodic nature of fishing, having another source of income or livelihood other than fishing is indicative of increased economic security, which has been found to be positively related with a deferred gratification orientation [12].
- 8.
Temporal decline in fish catch—We hypothesized that fishers' perceptions about whether there had been a temporal change in their fish catch would affect their willingness to conserve fisheries resources. Perceiving a temporal decline may incite a fisher to become more aware about the need to conserve for the future. On the other hand, it may also motivate a fisher to fish harder and adopt a shorter term focus.
Location-specific variables
- 9.
Site—A dummy variable was used to control for site differences, with Sabah = 1 and Fiji = 0.
- 10.
Market access—Having good market access may mean that fishers are more certain that their produce will be sold for a reasonable price. This added certainty may decrease discount rates. The accessibility of each fishing village was categorized as ‘good’ or ‘poor’, based on the distance to the nearest main town or fish market, and how accessible it was transport-wise. In both Sabah and Fiji, 8 villages (73%) were considered to have poor market access. These villages were either situated on outlying islands located away from the mainland or main island, or were isolated villages located far from main fish markets.
- 11.
Protection initiative—Previous findings indicated that lower discount rates may be associated with villages where inhabitants had taken the initiative to protect their village fishing grounds from outside fishers [37]. At the study villages, forms of protection included (i) marine reserves in which no fishing was allowed; and (ii) semi-protected fishing grounds which outside fishers were prevented from fishing, but villagers were allowed to fish. Three villages in Sabah had protection initiatives, as opposed to one in Fiji.
2.4. Analysis
We fitted a binary logistic regression model using R software ( www.r-project.org) to investigate which socio-economic factors predicted the probability that fishers would choose low discount rates. We had 3 regression models: separate models for Sabah and Fiji, and a pooled model for both Sabah and Fiji. Excluding two missing values in Sabah and Fiji led to sample sizes of 118, 73, and 45 for the pooled, Sabah, and Fiji models, respectively.
The correlations between all independent variables were examined for collinearity. We also checked for excessive multi-collinearity using Variance Inflation Factor (VIF) values. We found that market access and protection initiative (PI) were almost perfectly correlated (r = −0.98), and decided to leave market access out of the regression because our prior findings indicated that PI may be associated with low discounting behavior [37]. The dummy variables for site and boat ownership were also highly correlated (r = 0.8). As other studies had found inter-country differences in discount rates or willingness to defer gratification [12,16], we decided to leave site in the pooled model, and used boat ownership in the individual location models instead.
We used our results from the choice experiments to create a dichotomous indicator variable to identify low discounting individuals. We considered two options for identifying low discounters: (i) one who chose the smallest future payment offered in Series A, or (ii) one who chose the smallest payment offered in all series. Hyperbolic discounting behavior may have confounded individuals' choices for option (ii). Therefore, we decided to use option (i), which involved the same one month period delay for both Fiji and Sabah. The dichotomous dependent variable was defined as Y = 1 for those who chose the smallest payment offered in Series A, and Y = 0 otherwise. For each model, we started with a “full” model containing the explanatory variables of interest. The logistic regression equation we tested was:
As we were undertaking exploratory analysis, it was appropriate to use a stepwise model selection procedure in both directions to identify a model which presented the “best” fit to the data. Akaike information criterion for small samples (AICc) was used to compare between models fitted to the same data. We accepted significance levels of 0.1 due to the exploratory nature of the analysis, and because we were making observations of human behavior, which may by nature be more unpredictable [38]. Following model selection, we assessed the model goodness of fit and predictive accuracy using the log likelihood test and receiver operating characteristic (ROC) curve. Residual and leverage plots were visually inspected to check for severe outliers and for data points which exerted excessive influence on the parameter estimates.
3. Results
3.1. Site Comparisons
3.1.1. Between Site Comparisons, all Fishers
Overall, 42% of fishers chose the low discount rate option in Series A; a substantially higher proportion in Sabah chose this option, compared to Fiji (51% vs. 27%). Fishers in Sabah and Fiji were similar in terms of age, household size, and dependence on fishing as the only source of income (Table 3). Based on interview data, the mean catch per unit effort (CPUE) across all gears in Sabah was 16.0 ± 3.8 kg person−1 trip−1. Mean CPUE in Fiji was slightly lower, at 15.4 ± 1.8 kg person−1 trip−1, but the difference was not statistically significant. Poverty levels at both sites were similar, with no significant difference in fishing poverty index between Sabah and Fiji, although it was slightly higher in Fiji (0.79 vs. 0.59). Fishers in Fiji also had higher levels of education, and were less likely to own their own boats. Twenty-seven percent of fishers in Sabah resided in villages with some form of protection initiative, compared to 9% in Fiji.
3.1.2. Within Site Comparisons of Low and Non-Low Discounting Fishers
Low discounting fishers in Sabah tended to be slightly older than non-low discounters, had slightly smaller families, less education, and a higher boat ownership rate (Table 3). In contrast, low discounting fishers in Fiji tended to be slightly younger than non-low discounters, achieved a higher level of education, and had a lower boat ownership rate. A larger proportion of low discounting fishers in Fiji had alternative income sources, had noticed a temporal decline in catches, and lived in accessible villages, whereas the proportion for these variables was roughly the same in Sabah. The difference in proportions between low and non-low discounting fishers who lived in PI villages was statistically significant within Sabah (Fisher's exact test, p < 0.01), but not in Fiji (Table 3). There was no other outstanding factor that distinguished low discounting from non-low discounting fishers within sites, as none of the other independent variables were statistically different at the 0.05 level between low and non-low discounting fishers.
3.2. Logistic Regression Models
3.2.1. Pooled Model
The stepwise procedure indicated that the following variables had non-significant relationships with fishers' choice of a low discount rate: age, education, poverty index, relative catch, temporal decline, and the presence of an alternate job or income source. We removed these from the model and tested the model using the 3 significant regressors: site, protection initiative, and household size (Table 4). The location specific variables (site and protection initiative (PI)) were significant predictors of a low discount rate. Although the coefficient estimate for household size was not statistically significant, we left it in the final model because a nested Chi test showed that its inclusion significantly improved the model fit. The significance of the overall model meant that the explanatory variables as a set allowed us to make better predictions of low discounting fishers than we could have made without the explanatory variables.
If the other explanatory variables remain constant, the odds of a low discount rate for a fisher from a PI village is about 5 times higher than that for a fisher from a non PI village. The odds that a Sabah fisher chose a low discount rate is about 2.6 times over that for a Fijian fisher. Having a larger household decreased the likelihood of choosing a low discount rate, although this effect was statistically insignificant. The Nagelkerke R2 value of 0.21 indicated that the model had low usefulness for predicting the probability of fishers choosing a low discount rate. The ROC measure of 0.71 also suggested moderate discriminating ability.
3.2.2. Sabah and Fiji Models
3.2.2.1. Sabah
The overall model was significant, and included protection initiative, boat ownership, and relative catch as significant predictors of a low discount rate. Owning a boat or living in a PI village increased the odds that a fisher would have a low discount rate, whereas high relative catch decreased the odds of choosing a low discount rate (Table 4). The Nagelkerke R2 of 0.32 indicated a moderate relationship between the independent and dependent variables, while the ROC measure of 0.73 indicated that the model had moderate discriminating ability.
3.2.2.2. Fiji
One data point was removed from the Fiji model due to a high deviance residual, so that the final model was fitted to a sample of 44. The removal did not affect the overall model results. The Fiji model also included boat ownership and relative catch as significant predictors of low discount rates. Interestingly, in contrast to Sabah, boat ownership in Fiji decreased the odds that a fisher would choose a low discount rate, while an increase in relative catch actually increased the odds of a fisher choosing a low discount rate (Table 4). The model had moderately high discriminating ability with a ROC measure of 0.79, and the Nagelkerke R2 of 0.26 indicated a moderate relationship between the independent and dependent variables.
4. Discussion
We find that 42% of the fishers in our study have low discount rates, which is encouraging given the urgency of conserving coral reef resources. It also appears that the common assumption that small-scale fishers have high discount rates [39] may not be applicable in all cases. In fact, other researchers have also found that fishers' discount rates are not excessively high [40,41], while both Ngyuen [42] and Poggie [43] showed that small-scale fishers had lower discount rates compared to workers in other occupations within the same community.
The significance of the site dummy variable in the pooled model is consistent with the few other studies which have compared discount rates across developing countries [12,15,16]. It suggests that socio-economic variables we have not controlled for, or some emergent property of local conditions, (e.g., cultural values and traditions [15], or local geographical conditions [44]) may account for the observed difference in the distribution of fishers choosing low discount rates in Sabah and Fiji. The use of certain fisheries management tools may also encourage fishers to develop a longer term planning horizon. For instance, based on two well-developed ITQ (individual transferable quota) systems in Iceland and New Zealand, Asche [41] estimated that fishers' discount rates decreased through time.
The protection initiative (PI) variable is significant in the pooled and Sabah models. All PI villages have low accessibility, as they tend to be situated on islands away from the main island or the mainland. Pomeroy et al. [45] found that social and economic conditions prevalent in small island communities, such as constant face-to-face interaction among villagers, and sharing similar activities and backgrounds, increased the likelihood of villagers cooperatively undertaking a joint venture such as implementing community marine protected areas. Although we did not explicitly measure these attributes, the findings of Pomeroy et al. [45] are consistent with studies which suggest that the presence of social capital among community members can lead to more sustainable marine resource management [46-48]. Having said this, we acknowledge that factors which we are not aware of, such as villagers' exposure to marine education campaigns, or political incentives, could have spurred villagers to initiate protection of their village fishing grounds. In any case, our results highlight the need for future research to explore the linkage between fishers' time preference and social capital.
The same fishery-related variables affect low discounting in both Sabah and Fiji, albeit with contrary effects. While the Sabah model results are consistent with other empirical studies, the Fiji model results counter expectations. Owning a boat increases the chances of a low discount rate in Sabah, which supports another study that found boat ownership to be associated with a deferred economic gratification orientation among small-scale fishers [12]. Boat owning fishers have invested in the fishery, and are therefore more likely to have a longer term perspective about the fishery compared to non-boat owners, who have no investment, hence no interest or stake in the future well-being of the fishery. The fact that boat ownership is lower in Fiji may explain the lack of the positive boat ownership-low discount rate relationship observed in the Sabah model.
An increase in the relative catch variable is associated with a decrease in the probability of choosing a low discount rate in Sabah. This makes sense if a higher fish catch is due to a fisher intentionally catching more in order to gain as much as possible from the fishery today. Pursuing one's short-term interests that ultimately leads to outcomes which are in no one's long-term interest is a characteristic problem with common pool resources [49]. In Sabah, this type of short-sighted and competitive behavior is likely exacerbated by the essentially open access nature of small-scale fishers' fishing grounds. On the other hand, a higher catch may also indicate a better skilled fisher who catches more relative to others. If this effect is stronger than the competitive effect, the negative relationship between relative catch and low discount rate may not be present. This appears be the case in Fiji, where the presence of a customary marine tenure system may be dampening the competitive mentality that seems to occur in Sabah.
Surprisingly, demographic variables are not significant predictors of a low discount rate, even though age, education, and poverty have been correlated with discount rates in other studies of resource dependent communities in developing countries [18,44,50,51]. The lack of statistical relationship between poverty and discount rates may be because fishers in our study are not completely cash-constrained, as fishers in both Sabah and Fiji are able to obtain credit from fish buyers or from their friends and families, without having to repay interest. The lack of an explicit debt load may play a role in reducing the pressure for fishers in our study to catch as much as they possibly can, but this was not completely captured in using fishing income as an indicator. The weak relationships between independent and dependent variables may also be because our models do not account for risk attitudes, ethical considerations or psychological and neurophysiological traits, which others have found to be related to discount rates [20,52-54]. Overall, we must bear in mind that, due to the relatively small sample size and exploratory nature of our study, our results should be regarded as tentative rather than conclusive.
5. Conclusion
In summary, we found that over 40% of the fishers in our study have low private discount rates, although the proportion of patient fishers in Sabah is nearly double that in Fiji. This is encouraging for conservation of the region's coral reefs, particularly in Sabah, where marine protected areas are in the process of being established in both Pulau Banggi and the Semporna islands. Our results suggest that location and fishery-related variables differentiate low discounting from non-low discounting fishers. Policies which aim to motivate a long-term conservation orientation among fishers may therefore wish to focus on the community and fishery level, rather than on individuals. The fact that the same boat ownership and relative fish catch variables have contradictory effects on low discount rates in Fiji and Sabah cautions against implementing blanket solutions without first carefully considering local socio-cultural, economic, and ecological conditions.


| Site | Island | Village |
|---|---|---|
| SABAH | Banggi | Batu Sirih, Damaran, Dogoton, Maligu, Manawali, Sibogo Air, Sibogo Balak |
| Semporna | Denawan, Hampalan Laut, Mabul, Omadal | |
| FIJI | Vanua Levu | Galoa, Moata, Tavea, Vunivutu |
| Viti Levu | Nakavita, Natawarau, Seroa | |
| Kadavu | Galoa, Namouna | |
| Yasawa | Malakati, Nacula |
| Explanatory variable | Variable type | Variable definition | Expected relationship with a low discount rate |
|---|---|---|---|
| Demographic | |||
| Age | Continuous | Age in years | +/− |
| Education | Dichotomous | 0 if not educated or primary education, 1 if secondary education or higher | + |
| Household size | Continuous | No. of people in household | +/− |
| Economic | |||
| Poverty index | Continuous | Standardized measure of net monthly fishing income (USD) | + |
| Boat ownership | Dichotomous | 1 if own a boat, 0 if do not own a boat | + |
| Relative catch | Continuous | Standardized measure of catch (Kg) per fisher per week | − |
| Alternate income | Dichotomous | 1 if have an alternate income, 0 if none | + |
| Temporal decline | Dichotomous | 1 if perceive decline, 0 if none | ? |
| Location | |||
| Site | Dichotomous | 1 if survey site is Sabah, 0 for Fiji | ? |
| Market access | Dichotomous | 1 if village is accessible, 0 if poor accessibility | + |
| Protection initiative | Dichotomous | 1 if there is community initiative to protect fishing area, 0 if none | + |
| Variable | SABAH (n = 73) | FIJI (n = 45) | ||||
|---|---|---|---|---|---|---|
| Non-low discounting fishers | Low discounting fishers | All fishers | Non-low discounting fishers | Low discounting fishers | All fishers | |
| Age | 37.3 ± 1.9 | 41.9 ± 1.9 | 39.6 ± 1.4 | 39.4 ± 2.4 | 37.0 ± 2.4 | 38.9 ± 1.7 |
| Household size (people household−1) | 8.1 ± 0.9 | 7.0 ± 0.6 | 7.0 ± 0.4 | 6.4 ± 0.6 | 5.8 ± 0.9 | 6.3 ± 0.5 |
| No. years fishing | 20.3 + 2.0 | 22.2 + 1.9 | 21.2 ± 1.4 | 13.6 + 1.5 | 14.7 + 3.1 | 14.2 ± 1.4 |
| Relative catch | 1.0 ± 0.4 | 1.5 ± 0.7 | 1.3 ± 0.4 | 0.9 ± 0.2 | 1.2 ± 0.4 | 1.0 ± 0.2 |
| Poverty index | 0.6 ± 0.1 | 0.6 ± 0.1 | 0.6 ± 0.1 | 0.8 ± 0.1 | 0.9 ± 0.3 | 0.8 ± 0.1 |
| Education | ||||||
| None (%) | 37 | 61 | 47 | 0 | 0 | 0 |
| Primary (%) | 57 | 32 | 45 | 42 | 25 | 32 |
| Secondary/Tertiary (%) | 6 | 8 | 8 | 58 | 75 | 68 |
| Boat ownership =1 (%) | 84 | 95 | 89 | 39 | 17 | 9 |
| Alternate income =1 (%) | 24 | 21 | 25 | 33 | 42 | 35 |
| Temporal decline =1(%) | 89 | 89 | 90 | 52 | 67 | 56 |
| Accessible =1 (%) | 24 | 21 | 23 | 30 | 58 | 38 |
| Protection initiative =1 (%) a | 11 | 42 | 27 | 6 | 17 | 9 |
aSignificant difference between low and non-low discounting fishers within Sabah (Fisher's exact test, p < 0.01).
| Variable | Pooled | Sabah | Fiji |
|---|---|---|---|
| Intercept | −0.55 ± 0.55 | −2.83 ± 1.22 | −1.40 ± 0.55 |
| (−1.00) | (−2.32) ** | (−2.56) | |
| Site | 0.96 ± 0.44 | n/a | n/a |
| (2.18) ** | |||
| 2.61 | |||
| Protection initiative | 1.64 ± 0.54 | 2.85 ± 0.99 | n/a |
| (3.06) *** | (2.89) *** | ||
| 5.16 | 17.29 | ||
| Household size | −0.11 ± 0.07 | n/a | n/a |
| (−1.45) | |||
| 0.90 | |||
| Boat ownership | n/a | 2.77 ± 1.22 | −2.91 ± 1.47 |
| (2.27) ** | (−1.97) ** | ||
| 15.96 | 0.05 | ||
| Relative catch | n/a | −0.17 ± 0.10 | 0.81 ± 0.42 |
| (−1.75) * | (1.93) * | ||
| 0.84 | 2.25 | ||
| χ2 | 19.81 (df = 3) *** | 19.65 (df = 3) *** | 8.44 (df = 2) |
| Log-likelihood | 68.97 (df = 4) | −40.71 (df = 4) | −20.52 (df = 3) |
| Nagelkerke R2 | 0.21 | 0.32 | 0.26 |
| ROC | 0.71 | 0.71 | 0.79 |
| Sample size | 118 | 73 | 44 |
*p < 0.1;**p < 0.05;***p < 0.01.
Acknowledgments
We thank the WWF Semporna team, R. Abdul Rahman and the Borneo Marine Research Institute Banggi staff for field support in Sabah. We acknowledge the Kingfisher Foundation for funding field work in Fiji, and thank the Fiji Fisheries Department, especially N. Kuridrani and V. Tuiwakaya, for their assistance. A. Dyck and L. Huang provided helpful comments on an earlier version of this paper. LSLT acknowledges funding support from the Canada Social Sciences and Humanities Research Council Doctoral Fellowship Award. Field work in Sabah was partially funded by a Cosmos International Graduate Travel Award (University of British Columbia) to LSLT. URS acknowledges the Pew Charitable Trust for funding the Sea Around Us and the Global Ocean Economics projects. Lastly, we are grateful to all the fishers who participated in our study.
References
- Whittingham, E.; Campbell, J.; Townsley, P. Poverty and Reefs; DFID–IMM–IOC/UNESCO: Exeter, UK, 2003. [Google Scholar]
- Newton, K.; Cote, I.; Pilling, G.; Jennings, S.; Dulvy, N. Current and future sustainability of island coral reef fisheries. Curr. Biol. 2007, 17, 655–658. [Google Scholar]
- Sale, P. Management of coral reefs: Where we have gone wrong and what we can do about it. Mar. Pollut. Bull. 2008, 56, 805–809. [Google Scholar]
- Bell, J.; Ratner, B.; Stobutzki, I.; Oliver, J. Addressing the coral reef crisis in developing countries. Ocean Coast. Manage. 2006, 49, 976–985. [Google Scholar]
- Wilkinson, C. Global change and coral reefs: impacts on reefs, economies and human cultures. Glob. Change Biol. 1996, 2, 547–558. [Google Scholar]
- McManus, J.W. Tropical marine fisheries and the future of coral reefs: A brief review with emphasis on Southeast Asia. Coral Reefs 1997, 16, S121–S127. [Google Scholar]
- Pauly, D.; Chua, T.E. The overfishing of marine resources: socioeconomic background in Southeast Asia. Ambio 1988, 17, 200–206. [Google Scholar]
- Clark, C. The economics of overexploitation. Science 1973, 181, 630–634. [Google Scholar]
- Sumaila, U.R.; Walters, C. Intergenerational discounting: A new intuitive approach. Ecol. Econ. 2005, 52, 135–142. [Google Scholar]
- Akpalu, W. Fishing regulations, individual discount rate, and fisherman behaviour in a developing country fishery. Environ. Devel. Econ. 2008, 13, 591–606. [Google Scholar]
- Fehr, E.; Leibbrandt, A. Cooperativeness and Impatience in the Tragedy of the Commons; Institute for Empirical Research in Economics, University of Zurich: Zurich, Switzerland, 2008. Available online: http://ideas.repec.org/p/zur/iewwpx/378.html (accessed on 15 February 2011).
- Pollnac, R.; Poggie, J.J. Economic gratification orientations among small-scale fishermen in Panama and Puerto Rico. Hum. Organ. 1978, 37, 355–367. [Google Scholar]
- Becker, G.; Mulligan, C. The endogenous determination of time preference. Quart. J. Econ. 1997, 112, 729–758. [Google Scholar]
- Pender, J. Discount rates and credit markets: Theory and evidence from rural India. J. Dev. Econ. 1996, 50, 257–296. [Google Scholar]
- Holden, S.; Shiferaw, B.; Wik, M. Poverty, market imperfections and time preferences: of relevance for environmental policy? Environ. Devel. Econ. 1998, 3, 105–130. [Google Scholar]
- Poulos, C.; Whittington, D. Time preferences for life-saving programs: Evidence from six less developed countries. Environ. Sci. Technol. 2000, 34, 1445–1455. [Google Scholar]
- Godoy, R.; Jacobson, M. Covariates of private time preference: a pilot study among the Tsimane' Indians of the Bolivian rain forest. Evol. Hum. Behav. 1999, 20, 249–256. [Google Scholar]
- Kirby, K.; Godoy, R.; Reyes-Garcia, V.; Byron, E.; Apaza, L.; Leonard, W.; Perez, E.; Valdez, V.; Wilkie, D. Correlates of delay-discount rates: Evidence from Tsimane' Amerindians of the Bolivian rain forest. J. Econ. Psychol. 2002, 23, 291–316. [Google Scholar]
- Kirby, K.; Petry, N.; Bickel, W. Heroin addicts have higher discount rates for delayed rewards than non-drug-using controls. J. Exp. Psychol. 1999, 128, 78–87. [Google Scholar]
- Frederick, S.; Loewenstein, G.; O'Donoghue, T. Time Discounting and Time Preference: A Critical Review. In Time and Decision; Loewenstein, G., Read, D., Baumeister, R., Eds.; Russell Sage Foundation: New York, NY, USA, 2003; pp. 13–86. [Google Scholar]
- Sather, C. The Bajau Laut Adaptation, History, and Fate in a Maritime Fishing Society of South-Eastern Sabah; Oxford University Press: Kuala Lumpur, Malaysia, 1997. [Google Scholar]
- Gillett, R.; Lightfoot, C. The Contribution of Fisheries to the Economies of Pacific Island Countries; Asian Development Bank, Forum Fisheries Agency and World Bank: Manila, Philippines, 2007. [Google Scholar]
- Ovasisi, L. The live reef fish trade in Fiji. SPC Live Reef Fish Inf. Bull. 2006, 16, 29–32. [Google Scholar]
- Adams, T. Resource aspects of the Fiji bêche-de-mer industry. SPC Bêche-de-mer Inf. Bull. 1992, 4, 13–16. [Google Scholar]
- Teh, L.S.L.; Teh, L.C.L.; Starkhouse, B.; Kuridrani, N.; Sumaila, U.R. Preliminary Assessment of the Socio-Economic Importance of Export Trade in Coral Reef Resources on Fijian Society. Proceedings of the 11th International Coral Reef Symposium, Fort Lauderdale, FL, USA, 7–11 July 2008; International Society for Reef Studies; 2, pp. 1055–1059.
- Teh, L.; Sumaila, U.R.; Cabanban, A.S. The reef fisheries of Pulau Banggi, Sabah: A preliminary profile and assessment of ecological and socio-economic sustainability. Fish. Res. 2005, 76, 359–367. [Google Scholar]
- Teh, L.; Sumaila, U.R. Malthusian overfishing in Pulau Banggi? Mar. Policy 2007, 31, 451–457. [Google Scholar]
- Turner, R.; Cakacaka, A.; Graham, N.; Polunin, N.; Pratchett, M.; Stead, S.M.; Wilson, S.K. Declining reliance on marine resources in remote South Pacific societies: ecological versus socio-economic drivers. Coral Reefs 2007, 26, 997–1008. [Google Scholar]
- Teh, L.C.L.; Teh, L.S.L.; Starkhouse, B.; Sumaila, U.R. An overview of socio-economic and ecological perspectives of Fiji's inshore reef fisheries. Mar. Policy 2009, 33, 807–817. [Google Scholar]
- Teh, L.S.L.; Zeller, D.; Cabanban, A.; Teh, L.C.L.; Sumaila, U.R. Seasonality and historic trends in the reef fisheries of Pulau Banggi, Sabah, Malaysia. Coral Reefs 2007, 26, 251–263. [Google Scholar]
- Veitayaki, J. Fisheries Resource-Use Culture in Fiji and its Implications. In Culture and Sustainable Development in the Pacific; Hooper, A., Ed.; Asia Pacific Press: Canberra, Australia, 2000; pp. 116–130. [Google Scholar]
- Rawlinson, N.; Milton, D.; Blaber, S.; Sesewa, A.; Sharma, S. A Survey of the Subsistence and Artisanal Fisheries in Rural Areas of Viti Levu, Fiji.; ACIAR: Canberra, Australia, 1995. [Google Scholar]
- Fiji Base Map. Available online: http://d-maps.com/ (accessed on 16 June 2011).
- Harrison, G.; Lau, M.; Williams, M. Estimating individual discount rates in Denmark: A field experiment. Am. Econ. Rev. 2002, 92, 1606–1617. [Google Scholar]
- Coller, M.; Williams, M. Eliciting individual discount rates. Exper. Econ. 1999, 2, 107–127. [Google Scholar]
- Sumaila, U.R. An Economic Indicator for Monitoring Fishing Pressure on Marine Ecosystems. Proceedings of ECOFISH Workshop on Sustainability Indicators in Fisheries, Dakar, Senegal, 14–16 April 2003; Available online: http://filaman.ifm-geomar.de/ecofish/reports/rashid.pdf (accessed on 13 December 2010).
- Teh, L. Time Discounting Behaviour of Small-Scale Fishers in Open Access and Traditionally Managed Reef Fisheries. Proceedings of the 15th Biennial Conference of the International Institute of Fisheries Economics & Trade, Montpellier, France, 13–16 July 2010; International Institute of Fisheries Economics & Trade: Corvallis, OR, USA.
- Menard, S. Applied Logistic Regression Analysis; SAGE Publications: Thousand Oaks, CA, USA, 1995. [Google Scholar]
- Pollnac, R.B. Social and Cultural Characteristics in Small-scale Fishery Development. In Putting People First Sociological Variables in Rural Development; Cernea, M.M., Ed.; Oxford University Press: Washington, DC, USA, 1985; pp. 189–223. [Google Scholar]
- Curtis, J. Estimates of fshermen's personal discount rate. Appl. Econ. Lett. 2002, 9, 775–778. [Google Scholar]
- Asche, F. Fishermen's discount rates in ITQ systems. Environ. Resour. Econ. 2001, 19, 403–410. [Google Scholar]
- Nguyen, Q. Do Fishermen have Different Preferences?: Insights from an Experimental Study and Household Data, MPRA Paper No. 16012, Munich Personal RePEc Archive. 2009. Available online: http://ideas.repec.org/p/pra/mprapa/16012.html (accessed on 14 February 2011).
- Poggie, J.J. Deferred gratification as an adaptive characteristic for small-scale fishermen. Ethos 1978, 6, 114–123. [Google Scholar]
- Moseley, W. African evidence on the relation of poverty, time preference and the environment. Ecol. Econ. 2001, 38, 317–326. [Google Scholar]
- Pomeroy, R.S.; Mascia, M.B.; Pollnac, R.B. Marine Protected Areas: The social dimension. In Report on the FAO Expert Workshop on Marine Protected Areas and Fisheries Management; FAO: Rome, Italy; 12–14; June; 2006; pp. 149–275. [Google Scholar]
- Grafton, R.Q. Social capital and fisheries governance. Ocean Coast. Manage. 2005, 48, 753–766. [Google Scholar]
- Jentoft, S. The community: A missing link of fisheries management. Mar. Policy 2000, 24, 53–60. [Google Scholar]
- Ostrom, E. Governing the Commons: The Evolution of Institutions for Collective Action; Cambridge University Press: New York, NY, USA, 1990. [Google Scholar]
- Ostrom, E.; Burger, J.; Field, C.B.; Norgaard, R.B.; Policansky, D. Revisiting the commons: Local lessons, global challenges. Science 1999, 284, 278–282. [Google Scholar]
- Godoy, R.; Kirby, K.; Wilkie, D. Tenure security, private time preferences, and use of natural resources among lowland Bolivian Amerindians. Ecol. Econ. 2001, 38, 105–118. [Google Scholar]
- Tanaka, T.; Camerer, C.F.; Nguyen, Q. Risk and time preferences: Linking experimental and household survey data from Vietnam. Am. Econ. Rev. 2010, 100, 557–571. [Google Scholar]
- Frederick, S. Valuing future life and future lives: A framework for understanding discounting. J. Econ. Psychol. 2006, 27, 667–680. [Google Scholar]
- Lumley, S. The environment and the ethics of discounting: An empirical analysis. Ecol. Econ. 1997, 20, 71–82. [Google Scholar]
- Anderhub, V.; Güth, W.; Gneezy, U.; Sonsino, D. On the interaction of risk and time preference: An experimental study. Ger. Econ. Rev. 2003, 2, 239–253. [Google Scholar]
© 2011 by the authors; licensee MDPI, Basel, Switzerland. This article is an open access article distributed under the terms and conditions of the Creative Commons Attribution license (http://creativecommons.org/licenses/by/3.0/).
Share and Cite
Teh, L.S.L.; Teh, L.C.L.; Sumaila, U.R. Low Discounting Behavior among Small-Scale Fishers in Fiji and Sabah, Malaysia. Sustainability 2011, 3, 897-913. https://doi.org/10.3390/su3060897
Teh LSL, Teh LCL, Sumaila UR. Low Discounting Behavior among Small-Scale Fishers in Fiji and Sabah, Malaysia. Sustainability. 2011; 3(6):897-913. https://doi.org/10.3390/su3060897
Chicago/Turabian StyleTeh, Louise S. L., Lydia C. L. Teh, and U. Rashid Sumaila. 2011. "Low Discounting Behavior among Small-Scale Fishers in Fiji and Sabah, Malaysia" Sustainability 3, no. 6: 897-913. https://doi.org/10.3390/su3060897
APA StyleTeh, L. S. L., Teh, L. C. L., & Sumaila, U. R. (2011). Low Discounting Behavior among Small-Scale Fishers in Fiji and Sabah, Malaysia. Sustainability, 3(6), 897-913. https://doi.org/10.3390/su3060897