Article

Designing an Integrated SMART Indicator Framework for Urban Green Transitions: Aligning SDGs and ISO 37120 at City Level


1
Intrepid Lab, FCESE, Lusófona University & CETRAD, 4000-098 Porto, Portugal
2
Department of Industrial Engineering and Management, Faculty of Engineering, University of Porto, Rua Dr. Roberto Frias, s/n, 4200-465 Porto, Portugal
3
UNIDEMI, Department of Mechanical and Industrial Engineering, NOVA School of Science and Technology, Universidade NOVA de Lisboa, 2829-516 Caparica, Portugal
4
School of Business Administration, Polytechnic Institute of Setúbal, 2910-761 Setúbal, Portugal
5
Laboratory of Artificial Intelligence and Computer Science, Faculty of Engineering, University of Porto, Rua Dr. Roberto Frias, s/n, 4200-465 Porto, Portugal
6
Laboratório Associado de Sistemas Inteligentes (LASI), 4800-058 Guimarães, Portugal
*
Author to whom correspondence should be addressed.
Sustainability 2026, 18(7), 3624; https://doi.org/10.3390/su18073624
Submission received: 13 February 2026 / Revised: 26 March 2026 / Accepted: 1 April 2026 / Published: 7 April 2026
(This article belongs to the Section Sustainable Urban and Rural Development)

Abstract

Urban areas are pivotal to achieving the Sustainable Development Goals (SDGs), yet sustainability monitoring at the municipal level remains fragmented, difficult to operationalize, and weakly comparable across cities. Although the SDGs provide a comprehensive global agenda and ISO 37120 offers a standardized set of city indicators, municipalities still face practical barriers in translating global targets into actionable, jurisdiction-sensitive, and measurable metrics aligned with local responsibilities and available data. This study addresses this gap by presenting the design of an integrated, target-level urban sustainability assessment framework grounded in SMART (Specific, Measurable, Achievable, Relevant, and Time-bound) principles and explicitly tailored to municipalities in developed-country contexts. The framework contributes (i) a structured procedure for disaggregating and reallocating SDG targets according to municipal responsibilities, (ii) a six-dimension architecture that consolidates SDG targets and ISO 37120 themes into a coherent, governance-oriented structure (Government and Economic Development; Civic & Social Infrastructure; Environment and Climate; Infrastructure and Urban Planning; Health; Urban Living Conditions), and (iii) a SMART-based indicator screening logic that prioritizes feasibility, data availability, and benchmarking potential, thus supporting the green transition in Urban Areas. The framework is empirically examined through validation against sustainability reporting practices of the Porto City Council, quantifying indicator coverage, assessing alignment with municipal mandates, and identifying systematic gaps—particularly in cross-cutting areas such as governance transparency, equity monitoring, and long-term climate adaptation. Overall, the results indicate that the proposed approach strengthens coherence, measurability, and comparability in urban sustainability assessment, supporting evidence-based municipal decision-making, performance benchmarking, and more strategically aligned SDG localization.

1. Introduction

Urbanization remains a defining trend of the twenty-first century. More than half of the global population now resides in urban areas, and projections suggest that this figure may approach 70% by 2050 [1]. Cities act as central hubs of economic activity, innovation, and social interaction, generating a substantial share of global wealth and employment [2]. At the same time, they account for a disproportionate share of environmental pressures, including energy consumption, greenhouse gas emissions, waste generation, and ecosystem degradation [3,4]. Consequently, the concentration of both opportunities and impacts within cities has intensified concerns regarding the long-term sustainability and resilience of urban systems. Rapid urban growth has amplified challenges related to social inequality, access to essential services, housing affordability, environmental quality, and climate vulnerability [5,6]. In response to these interlinked challenges, the concept of urban sustainability has gained prominence, commonly defined as the capacity of cities to achieve economic vitality, social equity, and environmental protection while maintaining resilience to internal and external shocks [7,8].
Against this backdrop, the adoption of the 2030 Agenda for Sustainable Development by the United Nations in 2015 marked a major milestone in global sustainability governance. The agenda introduced 17 Sustainable Development Goals (SDGs) and 169 associated targets as a universal framework to guide development efforts worldwide [9]. Unlike earlier international frameworks, the SDGs apply to all countries regardless of income level and explicitly emphasize the interdependence among social, economic, environmental, and institutional dimensions of sustainability [10]. Within this framework, cities occupy a particularly central position. One SDG is explicitly dedicated to sustainable cities and communities, while many others depend indirectly on effective urban action. Empirical evidence suggests that approximately 65% of SDG targets cannot be achieved without implementation at the local and municipal levels [11,12]. As a result, local governments are increasingly recognized as key actors in translating global sustainability ambitions into concrete actions [13].
Despite this growing prominence, municipalities face structural barriers in adopting the SDGs as practical policy tools. The goals were not originally conceived as an operational framework for local authorities. Their global scope and broad, often abstract targets complicate integration into municipal policy planning, implementation, and monitoring processes [14,15]. These challenges have intensified calls for the localization of the SDGs—namely, the adaptation of global goals and targets to local contexts, priorities, and governance structures [16]. However, localization efforts frequently encounter operational frictions. Many SDG targets and indicators fall outside municipal jurisdiction, relying instead on national or regional policies, which limit local accountability and actionability. Moreover, numerous global SDG indicators lack the spatial resolution required for city-level monitoring or depend on data that are unavailable, infrequently updated, or methodologically inconsistent across municipalities. At the same time, cities face fragmented reporting requirements—combining SDG monitoring, standardized indicator systems, and local sustainability strategies—which increase administrative burden while undermining strategic coherence.
These frictions often result in sustainability monitoring systems that are more symbolic than operational, offering limited support for prioritization, benchmarking, or evidence-based decision-making at the municipal level. This situation highlights the need for assessment frameworks that explicitly reflect municipal responsibilities, align indicators with reliable and accessible data sources, and remain consistent with global sustainability agendas.
Within this study, the concept of urban green transition refers to the gradual transformation of urban governance systems toward environmentally sustainable, socially inclusive, and economically resilient development pathways. In practical terms, such transitions require the capacity to monitor progress through clear and measurable indicators. Consequently, indicator definition, monitoring, and systematic follow-up represent a critical first step in enabling urban green transitions, as municipal authorities require reliable metrics to evaluate sustainability performance and guide policy adjustments.
One of the most persistent challenges in localizing the SDGs concerns the selection and use of appropriate indicators. Although the global SDG indicator framework is comprehensive, it frequently lacks the spatial resolution, data availability, and institutional alignment required for effective municipal decision-making [17,18]. Conversely, locally developed indicators often suffer from limited standardization, weak methodological rigor, and reduced comparability across cities [19,20]. To address these limitations, several international organizations have developed standardized indicator frameworks for urban sustainability assessment. Among these, ISO 37120 [19] has gained prominence as an international standard for measuring city services and quality of life through a structured and comparable set of indicators [21]. The standard enables cities to benchmark performance over time and across contexts, covering economic, social, and environmental dimensions [22]. However, the application of ISO 37120 in isolation does not fully resolve the challenge of aligning urban sustainability monitoring with the SDGs. The standard does not explicitly map its indicators to SDG targets, nor does it systematically address the division of responsibilities across levels of government [22,23]. Consequently, municipalities often continue to face fragmented reporting systems, duplicated efforts, and weak integration between sustainability strategies and performance measurement.
Accordingly, the literature reveals a clear gap in integrated approaches that combine global sustainability frameworks with standardized urban indicators while remaining grounded in municipal realities. In particular, the novelty of this study lies in the integration of SDG targets, ISO 37120 indicators, and SMART principles within a governance-oriented framework explicitly aligned with municipal responsibilities. While previous studies have addressed these elements individually, the proposed framework combines them into a coherent structure designed to support operational sustainability monitoring and decision-making at the municipal level. Specifically, there is a lack of models that align SDG targets with municipal responsibilities, apply SMART principles to ensure operational relevance, and preserve comparability across cities and contexts [18,24]. This study seeks to address this gap by developing an integrated SMART indicator framework for urban sustainability assessment. The framework is designed to support municipalities in operationalizing sustainability by translating global SDG targets into context-sensitive indicators aligned with municipal accountability and supported by reliable data sources. By reorganizing SDG targets and ISO 37120 indicators into a coherent structure reflecting core dimensions of urban sustainability, this study contributes to more effective sustainability monitoring, benchmarking, and evidence-based decision-making at the local level.
The remainder of this paper is structured as follows. Section 2 outlines the research design and methodological approach, including the literature review process, framework development, indicator selection criteria, and validation strategy. Section 3 presents the main findings, describing the framework structure, the alignment between SDG targets and ISO 37120 indicators, and the results of the municipal case validation. Section 4 discusses the theoretical and practical implications of the findings within the broader urban sustainability literature. Finally, Section 5 concludes by summarizing the main contributions and outlining directions for future research.

2. Materials and Methods

2.1. Research Design and Methodological Overview

This study adopts a qualitative and analytical research design aimed at developing and validating an operational framework for urban sustainability assessment at the municipal level. Rather than pursuing a hypothesis-testing or model-estimation approach, the study focuses on conceptual integration, indicator structuring, and empirical applicability. This design choice reflects the multidimensional, governance-driven, and context-dependent nature of urban sustainability, which requires both analytical synthesis and practical feasibility [25,26].
The methodological approach is structured around four interconnected stages. First, a targeted and structured review of the scientific literature was conducted to identify dominant approaches to urban sustainability assessment, common challenges in SDG implementation at the local level, and prevailing practices in indicator design and use. Second, an integrated conceptual framework was developed by reorganizing SDG targets and ISO 37120 indicators according to municipal functional responsibilities. Third, candidate indicators were screened and refined using explicit SMART criteria to ensure operational relevance and data feasibility. Finally, the proposed framework was empirically examined through a validation exercise based on municipal sustainability reporting practices.
This sequential approach ensures conceptual coherence across stages while allowing the framework to remain grounded in real-world municipal governance and data constraints.

2.2. Structured Literature Review

The literature review aimed to inform the conceptual foundations of the framework rather than to provide an exhaustive or systematic mapping of the existing body of work. Its purpose was to identify key debates, methodological patterns, and recurring limitations in urban sustainability assessment, particularly in relation to indicator-based monitoring and SDG localization.
The review was conducted using the Scopus database, selected for its multidisciplinary coverage and relevance in sustainability, urban studies, and policy research [27]. Searches were carried out using combinations of the terms “sustainable cities”, “urban sustainability”, “indicators”, “metrics”, and “Sustainable Development Goals” or “SDGs”. To improve transparency in the literature review process, the search and selection procedure followed a structured screening logic inspired by PRISMA-style review approaches, while remaining consistent with scoping and narrative review practices commonly used in conceptual framework studies. The review focused on peer-reviewed journal articles and conference papers published from 2015 onwards and written in English, reflecting the period following the adoption of the 2030 Agenda [9].
Following this screening process, a refined set of studies was retained for detailed analysis. These publications provided the conceptual and methodological basis for identifying the main challenges associated with indicator-based urban sustainability assessment, including the operationalization of SDG targets, data availability constraints, and tensions between standardization and contextual relevance.
Rather than applying a formal systematic review protocol, articles were selected through iterative screening based on their relevance to three core themes: (i) urban sustainability assessment frameworks, (ii) indicator systems and performance measurement at the municipal level, and (iii) challenges associated with adapting global sustainability agendas to local governance contexts. Studies focusing exclusively on smart city technologies, highly sector-specific domains, or national-level assessments without urban or municipal relevance were excluded, consistent with established scoping and narrative review practices in the field [28,29].
The reviewed literature informed the identification of recurring gaps, including the limited operationalization of SDG targets at the city level, tensions between standardization and contextual relevance, and constraints related to data availability. These insights directly shaped the design choices adopted in the proposed framework.

2.3. Conceptual Framework Design and Target Reorganization

Framework development was guided by the principle that sustainability assessment systems should reflect the scope of action and decision-making authority of municipal governments. Instead of directly adopting existing classifications, sustainability dimensions were reorganized into six overarching categories aligned with typical municipal functions [22].
SDG targets were disaggregated and qualitatively analyzed at the target level, rather than at the level of entire goals. Each target was examined in terms of its substantive focus and relevance to municipal responsibilities. Targets were then assigned to one or more framework dimensions based on the area in which municipalities exert the most direct influence. In cases where targets spanned multiple domains, assignment followed a dominant-responsibility logic, prioritizing municipal actionability over thematic breadth. This approach aligns with recent calls for more granular and governance-aware SDG localization strategies [10,14].
To reduce potential subjectivity in the classification process, the allocation of SDG targets to the six framework dimensions was reviewed through an expert validation step. The expert panel included municipal sustainability practitioners, sustainability consultants, and standardization specialists with experience in urban sustainability assessment and indicator systems. These experts reviewed the proposed classification and confirmed the coherence between SDG targets, municipal governance responsibilities, and the conceptual structure of the framework. This validation step strengthened the transparency and reproducibility of the classification process.
In parallel, ISO 37120 indicators were reviewed and mapped onto the same six dimensions. Indicators that aligned clearly with municipal functions were retained, while those primarily dependent on national-level data or authority were identified as requiring adaptation or exclusion. This dual mapping process ensured conceptual consistency between global sustainability objectives and standardized urban performance indicators, while maintaining sensitivity to municipal governance realities [22,23].

2.4. Indicator Selection and Application of SMART Criteria

Indicator selection was guided by the SMART framework, which has been widely used in performance management and sustainability assessment to enhance clarity, feasibility, and accountability [24,30]. In this study, SMART criteria were operationalized as a qualitative screening tool rather than as a scoring or weighting mechanism.
Candidate indicators were assessed according to their specificity (clarity of definition and scope), measurability (availability of quantitative data and methodological transparency), achievability (feasibility within municipal authority and available resources), relevance (direct linkage to sustainability objectives and SDG targets), and time-boundedness (capacity for periodic monitoring). Particular emphasis was placed on data availability from public statistical sources, municipal databases, and international organizations, in order to enhance transparency and replicability [17].
To increase transparency in the application of SMART principles, the criteria used to assess each SMART dimension were further operationalized through a set of verifiable objective conditions. These conditions ensured that indicator selection followed consistent methodological rules rather than purely interpretative judgment. The application of SMART criteria resulted in a refined indicator set that prioritizes operational clarity, feasibility, and relevance for municipal decision-making. Rather than treating SMART criteria as a scoring or weighting mechanism, indicators were qualitatively screened to assess their suitability for monitoring at the city level. Table 1 summarizes the operational criteria applied for each SMART characteristic.
The most common exclusion factors were related to insufficient data availability at the municipal level and to indicators primarily dependent on national authorities. Reformulation was more frequent among social and governance-related indicators, where conceptual relevance was high, but definitions required clarification to ensure measurability and periodic monitoring.
While many indicators were conceptually aligned with sustainability objectives, a non-negligible subset faced practical constraints related to data availability, institutional scope, or definitional clarity. Table 2 summarizes the main outcomes of the SMART feasibility screening. Indicators that fell outside municipal jurisdiction, lacked reliable or regularly updated data, or were insufficiently defined for monitoring purposes were excluded or reformulated. This screening process aimed to balance conceptual ambition with operational feasibility, addressing a recurrent limitation identified in the urban sustainability assessment literature—namely, the proliferation of indicators that are theoretically relevant but practically unusable [8,18]. Data availability was confirmed in international databases such as United Nations statistical platforms and other global data repositories, as well as national databases such as the Portuguese Statistics Institute (INE) and Pordata. Indicators without publicly accessible municipal-level datasets were retained due to their inclusion in official SDG and ISO 37120 frameworks, which are expected by design to be measurable. Appendix A presents all indicators and their source—either public databases or SDG and ISO 37120 metrics.

2.5. Validation Through Municipal Case Analysis

To examine the practical applicability of the proposed framework, a validation exercise was conducted using sustainability-related reports published by the Porto City Council. The validation did not seek to evaluate municipal performance per se, but rather to assess the degree of alignment between existing municipal reporting practices and the structure and requirements of the proposed framework.
The validation followed a qualitative comparative approach. Indicators reported by the municipality were identified and categorized according to the six framework dimensions and subsequently compared with the proposed SMART indicator set. The analysis focused on three aspects: coverage of sustainability dimensions, alignment with municipal responsibilities, and availability of data suitable for monitoring over time.
This approach enabled the identification of areas of strong alignment, as well as systematic gaps, particularly in cross-cutting domains such as governance transparency, social equity, and long-term climate adaptation. Similar qualitative validation strategies have been widely used to assess the applicability and robustness of sustainability assessment frameworks in real-world governance contexts [20,25].

3. Results

3.1. Structure of the Integrated Urban Sustainability Framework

The primary result of this study is the development of an integrated framework for assessing urban sustainability through SMART indicators aligned with both the Sustainable Development Goals (SDGs) and ISO 37120. Rather than proposing a new set of indicators in isolation, the framework offers a structured architecture that reorganizes existing global and standardized indicators according to municipal functional responsibilities.
The framework consolidates urban sustainability assessment into six core dimensions: Government and Economic Development, Civic & Social Infrastructure, Environment and Climate, Infrastructure and Urban Planning, Health, and Urban Living Conditions. This reorganization directly addresses two recurrent limitations identified in the literature. First, the SDGs are frequently criticized for their abstract formulation and limited operational relevance at the municipal level. Second, standardized indicator systems such as ISO 37120, while methodologically robust, are often detached from explicit sustainability strategies and broader global policy agendas.
By integrating SDG targets and ISO 37120 indicators within a governance-oriented structure, the framework provides a coherent foundation for municipal sustainability planning, monitoring, and communication. Importantly, the six dimensions reflect areas in which municipalities typically exert direct or indirect influence, thereby strengthening alignment between sustainability assessment, institutional accountability, and local decision-making (Table 3).
This categorization ensures alignment with municipal competencies, responding to critiques that sustainability assessment frameworks often fail to clearly distinguish between national and local responsibilities.

3.2. Alignment of SDG Targets and ISO 37120 Indicators

A key result of this study lies in the systematic decomposition of the Sustainable Development Goals into their constituent targets and the subsequent reassignment of these targets to the six framework dimensions, considering the institutional scope and responsibilities of municipalities. This target-level approach avoids the conceptual oversimplification associated with assigning entire SDGs to single domains and reflects the inherently cross-cutting nature of sustainable development challenges.
Table 4 presents the alignment between selected SDG targets and ISO 37120 indicator themes across the six framework dimensions.
In parallel, ISO 37120 indicators were mapped to the same dimensions, enabling a systematic comparison between global sustainability targets and standardized urban performance indicators within a common municipal governance structure.
Beyond illustrative alignment, the mapping process revealed uneven distributions of SDG targets and standardized indicators across the framework dimensions. To make these differences explicit, Table 5 summarizes the relative density of SDG targets and ISO 37120 indicators for each dimension.
These patterns provide an empirical basis for the subsequent development and operationalization of the proposed framework, as presented in the following sections.

3.3. Conceptual Architecture of the Framework

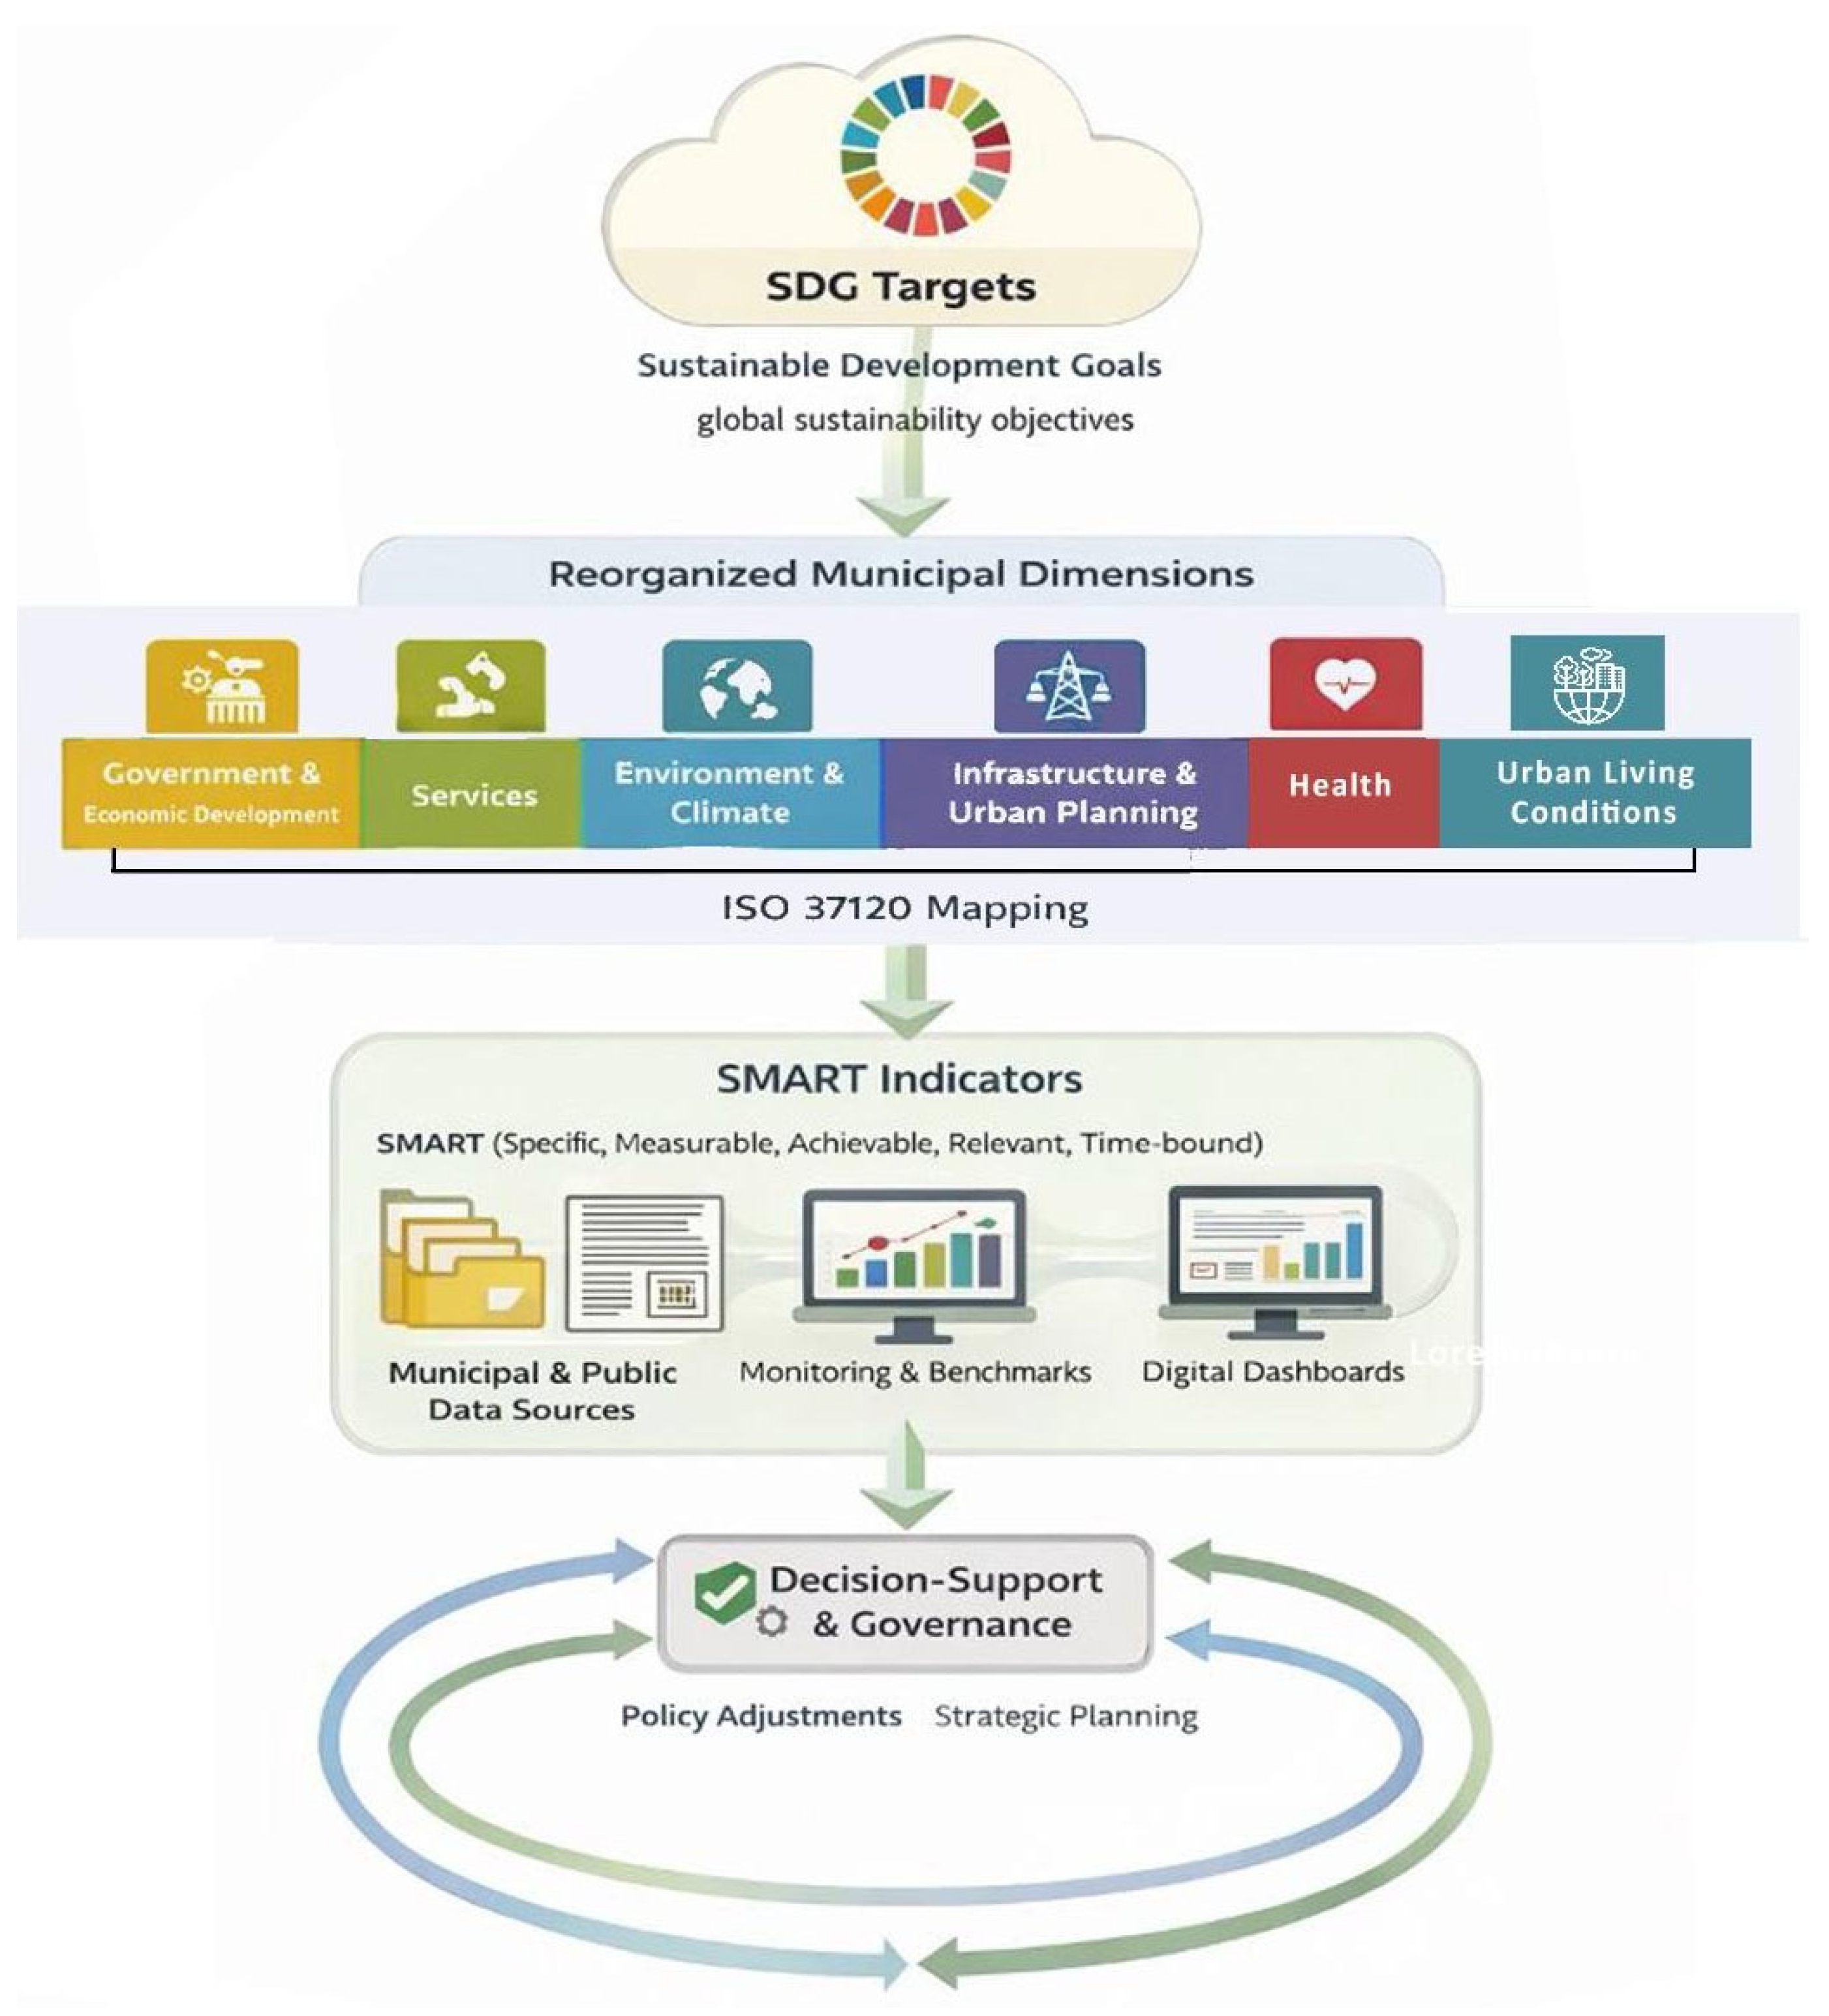
Figure 1 presents the conceptual architecture of the integrated framework. The framework is structured as a three-layer system that links global sustainability objectives to municipal decision-support tools.
The first layer consists of SDG targets, representing global sustainability objectives. The second layer reorganizes these targets into six municipal sustainability dimensions and aligns them with ISO 37120 indicator themes. The third layer comprises SMART indicators supported by municipal and public data sources, enabling monitoring, benchmarking, and integration into digital dashboards and decision-support systems.
This layered structure clarifies how global agendas can be translated into operational municipal monitoring systems without sacrificing comparability or strategic coherence.

3.4. Framework Operationalization

Following the alignment of SDG targets and ISO 37120 indicator themes presented in Section 3.2, a critical step in the development of the proposed framework consisted of refining the applicability of the SDGs to the municipal scale. Although the SDGs provide a comprehensive and universally applicable reference, their scope encompasses objectives that extend beyond municipal responsibilities, including national-level governance, international cooperation mechanisms, and macroeconomic policy instruments. Accordingly, SDG targets whose implementation lies predominantly outside the domain of municipal action were either adapted to reflect local competencies or, where such adaptation was not feasible, excluded from the framework. This refinement ensured that the resulting model remains grounded in the institutional, operational, and policy capacities of urban governments, thereby enhancing its practical relevance for municipal sustainability assessment.
Once the set of SDG targets applicable to the municipal context was defined, a subsequent step consisted of consolidating these targets based on shared thematic affinities within each of the six framework dimensions. Rather than operationalizing individual SDG targets in isolation, this process led to the formulation of integrated objectives that capture coherent sustainability themes at the urban level. This consolidation was intended to reduce fragmentation across policy domains and to ensure that the proposed framework does not constrain the inclusion of interrelated aspects that are essential for an adequate assessment of the multiple and interconnected components of urban sustainability.
To operationalize the integrated objectives defined within each framework dimension, a structured set of indicators was established to support the assessment and comparison of urban sustainability across municipalities. In addition to the indicators proposed within the SDG framework, urban indicators from ISO 37120:2018 [19] were incorporated to enhance standardization and comparability, together with other indicators commonly employed by international organizations and municipal authorities. Indicator selection was guided by considerations of relevance, conceptual clarity, and feasibility at the municipal level.
Data availability constituted a key criterion throughout this process. Nevertheless, for a limited subset of indicators included in the framework, no publicly accessible online databases providing relevant data were identified at the time of analysis. As these indicators originate from official reference frameworks such as the SDGs and ISO standards, they were retained in the model. Such indicators are explicitly distinguished within the framework to ensure transparency regarding current data availability and to support future data collection and monitoring efforts.
Although not all indicators were found in the sustainability reports published by the Porto City Council, all indicators included in the framework correspond to datasets available in publicly accessible statistical repositories. These include international databases such as United Nations statistical platforms and other global data repositories, as well as national databases such as the Portuguese Statistics Institute (INE) and Pordata. Indicators without publicly accessible municipal-level datasets were retained due to their inclusion in official SDG and ISO 37120 frameworks, which are expected to be measurable. Consequently, the absence of some indicators in the municipal case study reflects limitations in current municipal reporting practices rather than inconsistencies in the framework itself. This distinction is important, as the proposed framework aims not only to monitor existing indicators but also to highlight areas where municipal sustainability monitoring systems can be expanded in the future.
To illustrate the operationalization of the proposed framework while preserving the readability of the main text, one framework dimension is presented in detail as an example. The Health dimension was selected for this purpose, as it encompasses targets and indicators drawn from multiple SDGs and highlights both strengths and limitations in terms of indicator standardization at the urban level (Table 6).
For this dimension, the consolidated objectives, corresponding SDG targets, and associated indicators were defined to enable the assessment and comparison of population health conditions across municipalities. Within the Health dimension, eight targets were developed, drawing on SDGs 2 and 3. The complete table for the health dimension (with sources/origins for each indicator) is provided in the Appendix A.
The remaining framework dimensions are operationalized following the same structure and are fully presented in detail in Appendix A.

3.5. Validation Through the Porto Municipal Case

The proposed framework was validated through a comparative analysis of sustainability-related reports and publicly available indicators published by the Porto City Council. This validation aimed to assess the extent to which existing municipal monitoring practices align with the framework dimensions, consolidated objectives, and indicators, as well as to identify systematic gaps in current reporting.
The validation process involved mapping the indicators currently reported by the municipality to the six framework dimensions and their corresponding consolidated objectives. This mapping revealed a high degree of conceptual alignment, particularly in the Environment and Climate, Infrastructure and Urban Planning, and Civic & Social Infrastructure dimensions, where a substantial proportion of municipal indicators could be directly associated with the proposed framework. These areas correspond to domains in which municipalities typically hold clearer operational responsibilities and more established data collection practices.
To provide an overview of this alignment, Table 7 summarizes the coverage of the proposed framework dimensions by existing municipal indicators, distinguishing between dimensions with high, moderate, and limited levels of indicator availability.
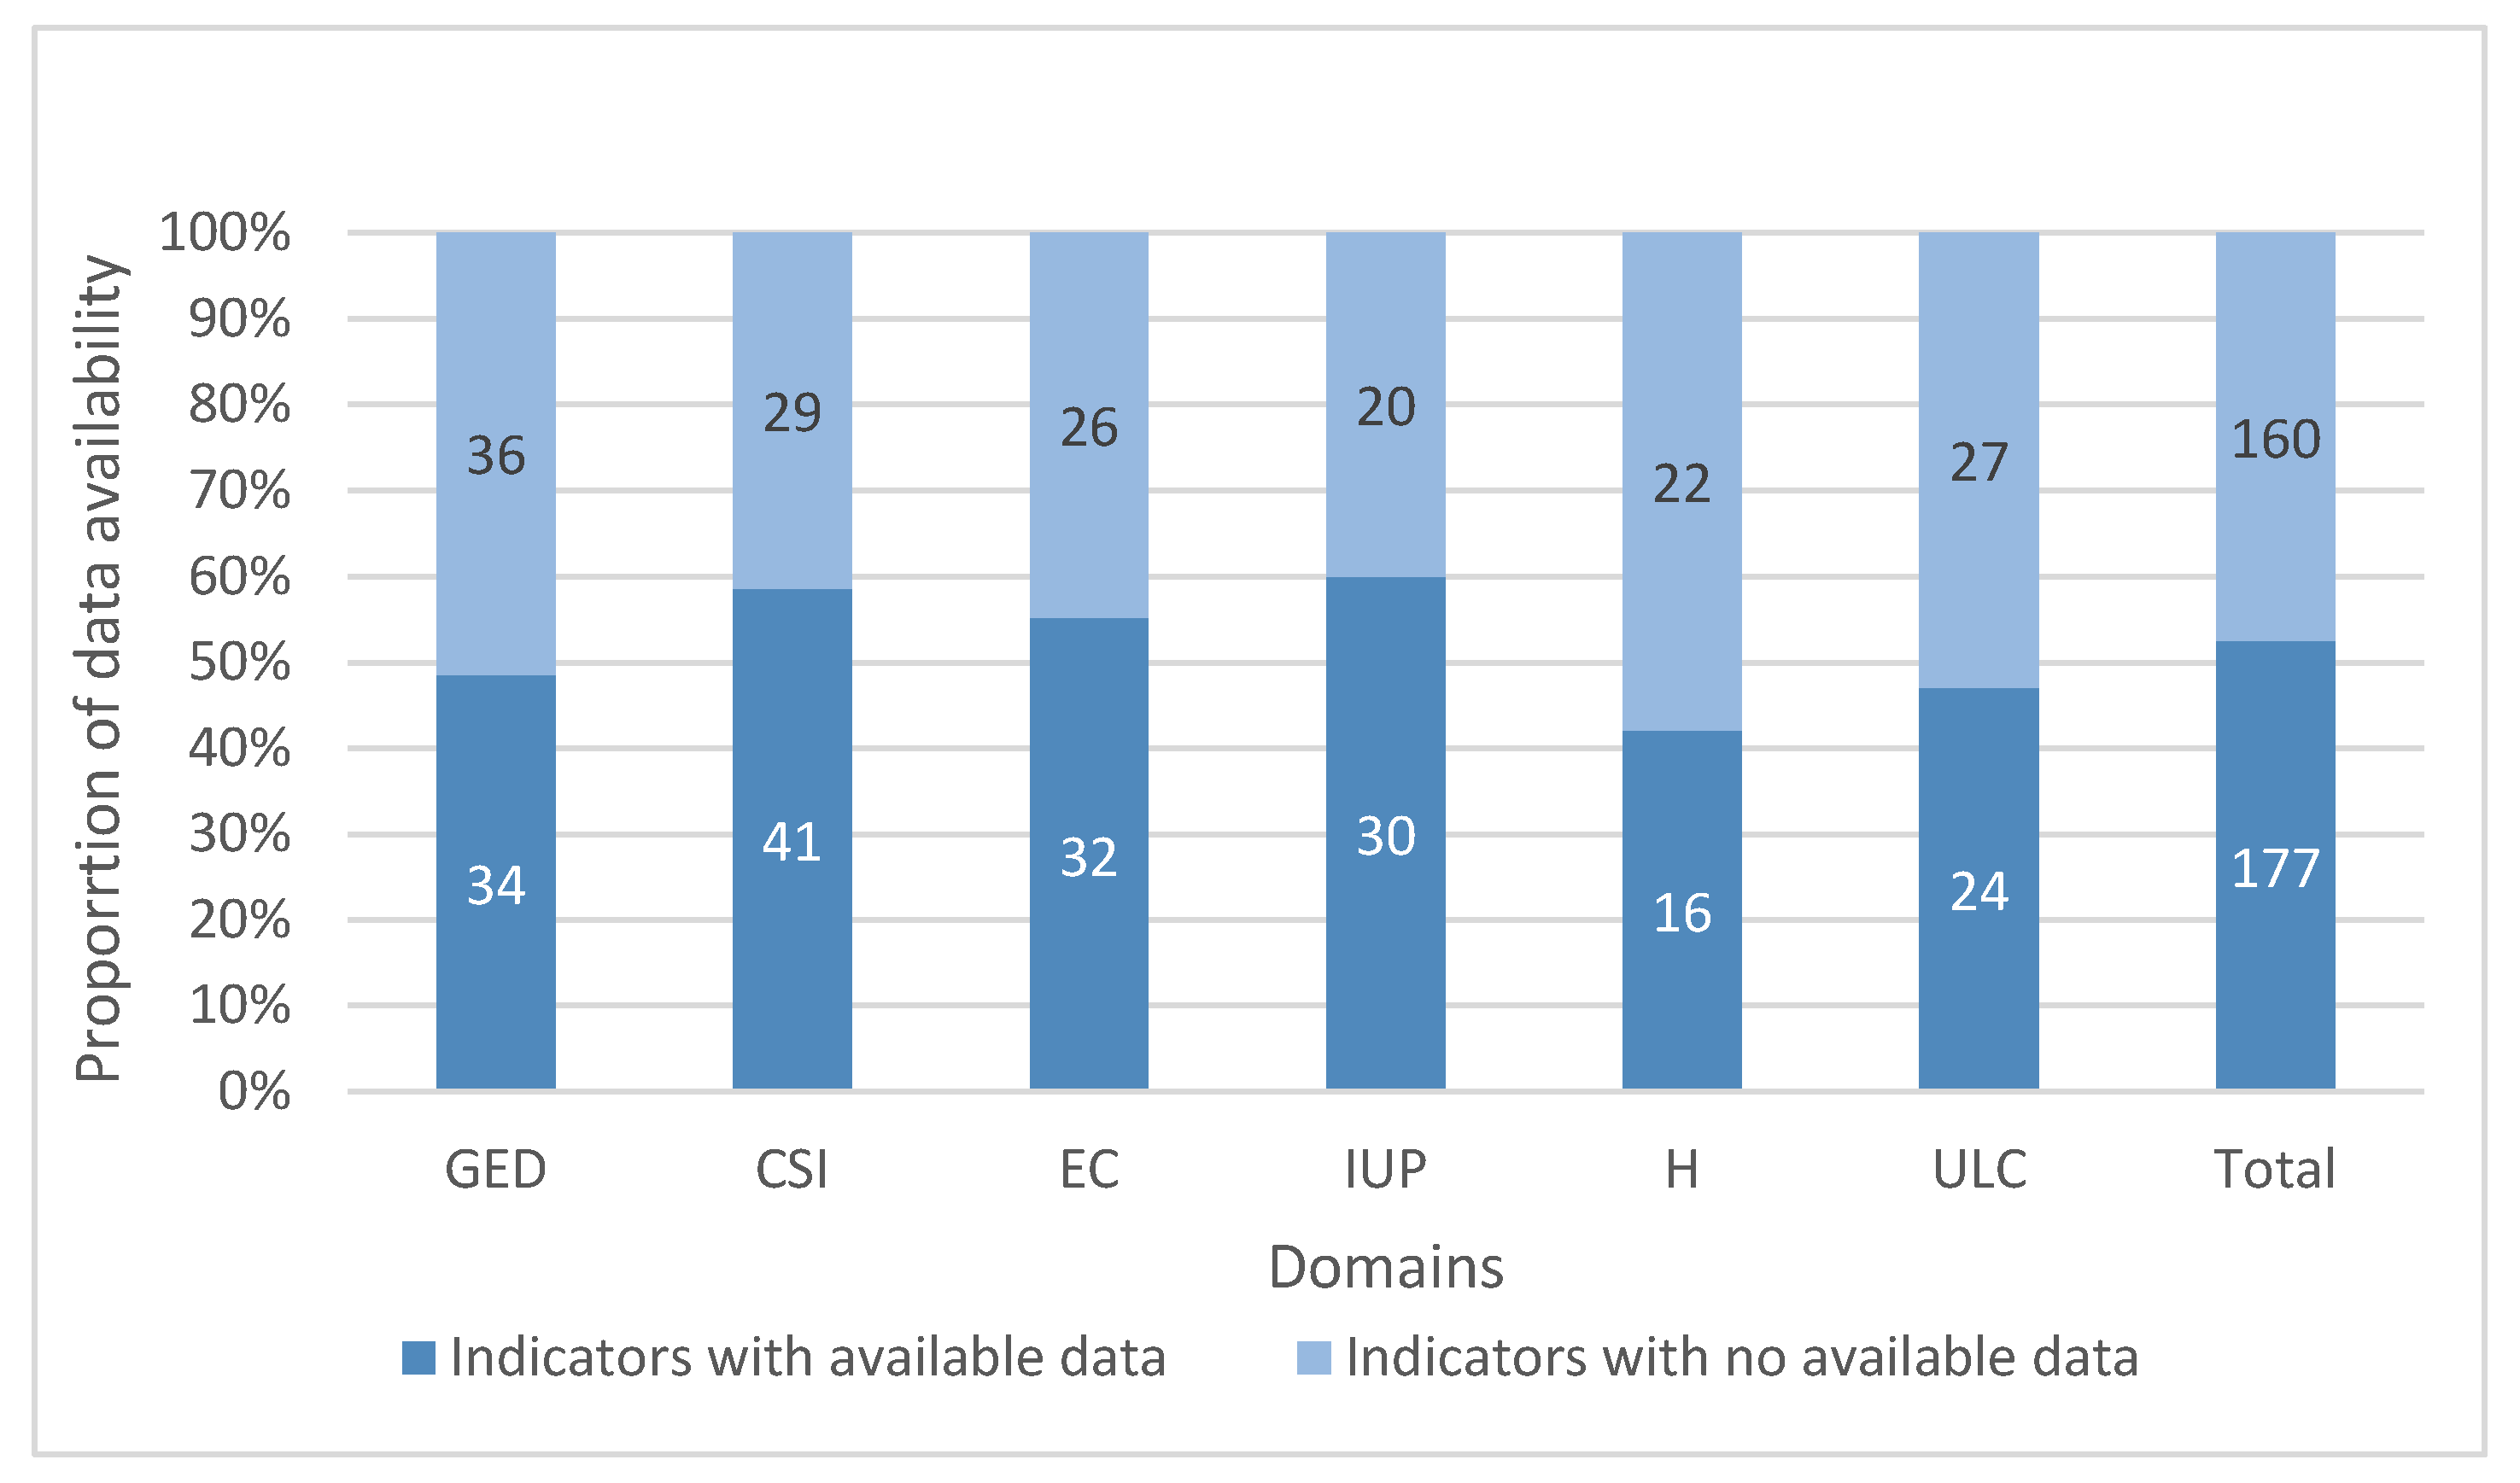
Despite this overall alignment, the validation exercise also revealed systematic gaps across specific framework dimensions. Indicators related to governance transparency, social equity, and long-term climate adaptation were found to be weakly represented or entirely absent from existing municipal reporting. Importantly, these gaps do not reflect a lack of relevance at the urban level; rather, they highlight persistent challenges related to indicator definition, data availability at the municipal scale, and coordination across administrative departments.
These limitations are further illustrated in Figure 2, which compares the number of indicators included in the proposed framework with those for which data are currently available at the municipal level. The figure highlights the uneven distribution of data availability across dimensions, reinforcing the need for targeted improvements in municipal data systems and cross-departmental data integration.
Overall, the validation confirms the practical applicability of the proposed framework and demonstrates its diagnostic value. Beyond supporting urban sustainability assessment and inter-city comparability, the framework provides a structured basis for identifying blind spots in municipal sustainability monitoring and for guiding future indicator development and data collection efforts at the urban level.

4. Discussion

4.1. Advancing the Localization of the SDGs Through Municipal Logic

One of the central contributions of this study lies in its explicit focus on the localization of the Sustainable Development Goals through a municipal logic of action and responsibility. Although the importance of local governments in achieving the SDGs is widely acknowledged, the literature consistently highlights a persistent gap between global ambition and local operationalization [11,14,15]. This gap is commonly attributed to the abstract formulation of SDG targets, their cross-sectoral nature, and the limited jurisdictional authority of municipalities across several policy domains.
By disaggregating the SDGs into their constituent targets and associating them with functional areas corresponding to municipal responsibilities, the proposed framework directly addresses a core weakness of many existing localization approaches. Rather than treating the SDGs primarily as a reporting or communication exercise, the framework reframes them as an operational governance tool capable of informing municipal planning, monitoring, and prioritization. This target-level adaptation responds to repeated calls in the literature for more granular, context-sensitive, and action-oriented interpretations of the SDGs at the urban scale [13].
Importantly, this approach avoids the oversimplification observed in several SDG localization efforts, where entire goals are assigned to single policy domains, thereby masking trade-offs, synergies, and institutional interdependencies [10]. Instead, the framework reflects the systemic nature of urban sustainability, recognizing that governance quality, infrastructure provision, environmental management, and social conditions are deeply interconnected within municipal decision-making processes.

4.2. Integrating Standardization and Contextual Relevance

A persistent tension in sustainability assessment concerns the balance between standardization and contextual relevance. Highly standardized frameworks enhance comparability and benchmarking but often risk overlooking local institutional arrangements and policy priorities. Conversely, context-specific indicator sets may be more meaningful locally but limit cross-city learning and comparability [17,23].
The integration of ISO 37120 within the proposed framework represents a deliberate attempt to reconcile this tension. ISO 37120 has been widely recognized for its methodological rigor and international comparability, particularly in relation to Civic & Social Infrastructure and quality of life [20,21]. However, when applied in isolation, standardized indicator systems may become detached from strategic sustainability objectives and long-term policy agendas.
By embedding ISO 37120 indicators within a structure explicitly aligned with SDG targets and municipal responsibilities, the framework enhances the strategic interpretability of standardized metrics. This integration allows municipalities to situate performance indicators within a broader sustainability narrative, strengthening coherence between monitoring, planning, and reporting processes. Although similar integrative approaches have been advocated conceptually, empirical applications at the municipal level remain limited [21,22], reinforcing the relevance of the contribution presented here.

4.3. The Role and Limits of SMART Indicators in Urban Sustainability

The use of SMART indicators constitutes another key dimension of the proposed framework. SMART criteria have long been promoted in performance management and public policy to enhance clarity, accountability, and measurability [23,29]. In the context of urban sustainability, their application responds directly to criticisms regarding vague, aspirational, or non-operational indicators that fail to support decision-making [8,16].
The results indicate that applying SMART principles improves indicator feasibility and strengthens alignment with available data sources and municipal competencies. This finding is particularly relevant given the recurrent data limitations reported by cities attempting to monitor SDG progress at the local level [2,17]. By prioritizing measurability and time-boundedness, the framework supports longitudinal monitoring and performance tracking, both of which are essential for effective sustainability governance.
At the same time, the literature cautions against an overly technocratic reliance on quantitative indicators. SMART metrics may underrepresent qualitative dimensions such as social cohesion, institutional trust, democratic participation, and perceived well-being [6,30]. This limitation is explicitly acknowledged in the proposed framework, which is not intended to replace qualitative or participatory assessment approaches, but rather to complement them by providing a robust and transparent quantitative backbone for municipal sustainability monitoring.

4.4. Comparison with Existing Assessment Approaches

When positioned within the broader landscape of urban sustainability assessment tools, the proposed framework occupies an intermediate position between composite indices and indicator-based dashboards.
Composite indices offer simplicity and communication advantages but often rely on normalization procedures, weighting schemes, and aggregation rules that introduce methodological arbitrariness and obscure trade-offs between sustainability dimensions [24,31]. Such approaches may limit transparency and reduce their usefulness for policy learning and accountability.
In contrast, SDG dashboards and indicator lists emphasize transparency and disaggregation but frequently suffer from fragmentation and limited municipal granularity. Many SDG dashboards are designed for national or regional reporting and rely on indicators that are misaligned with municipal responsibilities or unavailable at the city scale [11,17].
The framework proposed in this study seeks to overcome these limitations by combining the transparency of indicator-based approaches with a coherent governance-oriented structure. By avoiding composite scoring while organizing indicators into intelligible municipal dimensions aligned with the SDGs and ISO 37120, the framework supports interpretability, accountability, and policy relevance simultaneously.

4.5. Governance Implications and Digital Decision-Support Systems

From a governance perspective, the proposed framework has significant implications for municipal decision-making and policy integration. By structuring indicators around municipal functions rather than sectoral silos, the framework facilitates horizontal coordination across departments—a challenge frequently identified in urban sustainability governance [5,12].
Moreover, the framework is inherently compatible with digital decision-support systems and emerging approaches to data-driven governance. The structured linkage between SDG targets, standardized indicators, and municipal data sources enables integration into digital dashboards, benchmarking platforms, and continuous monitoring systems. Such digital quality systems can support feedback loops between performance measurement, strategic planning, and policy adjustment, reinforcing adaptive governance capacities [2,32].
Beyond digital monitoring, the indicator framework can also be embedded within core municipal governance processes. In practical terms, sustainability indicators may support strategic planning cycles, departmental performance monitoring, and annual sustainability reporting conducted by municipal administrations. The structured indicator set also facilitates the identification of priority policy areas where environmental or social performance gaps are most significant, thereby supporting more informed allocation of municipal resources and budgetary planning. In addition, the framework can serve as a reference structure for municipal performance evaluation systems, enabling local governments to track progress toward sustainability objectives and align policy interventions with measurable outcomes.
In this sense, the framework extends beyond static reporting tools, offering a foundation for dynamic sustainability management aligned with smart governance and performance-based public administration paradigms.

4.6. Limitations and Threats to Validity

Several limitations and threats to validity should be acknowledged. First, the mapping of SDG targets and indicators to sustainability dimensions involves a degree of interpretative judgment, introducing potential subjectivity despite the use of explicit criteria. Second, the framework’s applicability is partly constrained by data availability, which varies significantly across municipalities and policy domains. Third, the empirical validation focused on a single municipal case within a developed-country context, limiting the generalizability of the findings to other governance settings.
These limitations do not undermine the conceptual contribution of the framework but instead highlight the need for further empirical testing across diverse institutional and geographic contexts.

5. Conclusions

This study proposed an integrated SMART indicator framework for urban sustainability assessment, explicitly designed to align the Sustainable Development Goals with ISO 37120 and the functional responsibilities of municipal governments. By disaggregating SDG targets, reorganizing standardized indicators according to municipal logic, and applying SMART criteria as an operational screening tool, the framework addresses key limitations identified in existing approaches to urban sustainability monitoring, particularly those related to actionability, comparability, and governance relevance.
The results demonstrate that global comparability and local relevance are not mutually exclusive. Rather, they can be reconciled through a structured, governance-oriented approach to indicator design and organization. The validation exercise confirmed the applicability of the framework in a real municipal context and highlighted its capacity to enhance transparency, identify performance gaps, and support evidence-based policy development. Beyond monitoring, the framework functions as a diagnostic and decision-support tool, enabling municipalities to better align sustainability objectives with operational responsibilities and available data.
From a practical perspective, the framework can be adopted by municipalities as a baseline structure for sustainability assessment, providing a common reference aligned with international agendas and standardized indicators. Municipalities are encouraged to use this baseline while developing documented local extensions tailored to specific territorial priorities or policy challenges. Such extensions should be explicitly recorded in order to preserve transparency and avoid compromising cross-city comparability.
The framework also lends itself to pilot multi-city applications involving a small group of municipalities (e.g., three to five cities) willing to jointly test indicator alignment, benchmarking practices, and reporting consistency. These pilot initiatives could support peer learning, identify data harmonization challenges, and contribute to the refinement of governance arrangements for sustainability monitoring.
Effective implementation further requires explicit data governance arrangements. Municipalities should define clear data ownership, data collection periodicity, quality assurance procedures, and mechanisms for data validation and auditing. Embedding the framework within an institutionalized data governance or digital quality system can enhance reliability, accountability, and continuity over time, reinforcing the role of sustainability assessment as an integral component of municipal management rather than a standalone reporting exercise.
Several avenues for future research emerge from this work. First, broader empirical validation across multiple cities and national contexts would strengthen the generalizability of the framework and enable systematic comparative analyses of urban sustainability performance. Applying the framework longitudinally would also allow for the examination of sustainability trajectories, policy effectiveness, and institutional learning over time.
Second, future studies should explore the integration of qualitative, participatory, and perception-based indicators, particularly in domains such as governance quality, social inclusion, and citizen engagement. Combining SMART quantitative indicators with deliberative assessment methods could provide a more comprehensive understanding of urban sustainability outcomes.
Third, the digitalization of the framework represents a promising research and practice-oriented direction. Integrating the indicator system into digital dashboards and decision-support platforms could facilitate real-time monitoring, scenario analysis, and adaptive policy experimentation, aligning with emerging paradigms of data-driven and performance-oriented urban governance.
Finally, future research should examine how governance-oriented sustainability frameworks can support cross-level policy alignment, facilitating coherence between municipal, regional, national, and international sustainability strategies. Such multilevel integration is essential to ensure that local sustainability efforts contribute meaningfully to the achievement of the 2030 Agenda.

Author Contributions

Conceptualization, J.S., L.C. and A.M.C.; methodology, J.S. and A.M.C.; validation, G.L., F.C. and L.C.; formal analysis, G.L., F.C. and J.S.; investigation, J.S.; resources, G.L.; data curation, J.S.; writing—original draft preparation, J.S., G.L. and F.C.; writing—review and editing, F.C., L.C. and A.M.C.; visualization, G.L.; supervision, A.M.C.; project administration, A.M.C.; funding acquisition, not applicable. All authors have read and agreed to the published version of the manuscript.

Funding

Authors A.M.C. and L.C. would like to acknowledge the support via National funds from FCT, I.P.–Fundação para a Ciência e a Tecnologia, to this research in the scope of the project UID/00667/2025 (https://doi.org/10.54499/UID/00667/2025) (UNIDEMI).

Institutional Review Board Statement

Not applicable.

Informed Consent Statement

Not applicable.

Data Availability Statement

The original contributions presented in this study are included in the article. Further inquiries can be directed to the corresponding author.

Acknowledgments

The authors acknowledge the Porto City Council for making sustainability-related reports and municipal indicators publicly available, which supported the empirical validation of the proposed framework. During the preparation of this manuscript, the authors used generative artificial intelligence tools to support language editing and text refinement. The authors critically reviewed, edited, and validated all generated content and take full responsibility for the integrity, accuracy, and originality of the final manuscript.

Conflicts of Interest

The authors declare no conflicts of interest. The funders had no role in the design of the study; in the collection, analyses, or interpretation of data; in the writing of the manuscript; or in the decision to publish the results.

Abbreviations

The following abbreviations are used in this manuscript:
AIHWAustralian Institute of Health and Welfare
APCArticle Processing Charge
AQICNAir Quality Index China Network
CBPPCenter on Budget and Policy Priorities
EM-DATEmergency Events Database
ESGEnvironmental, Social and Governance
GDPGross Domestic Product
ISOInternational Organization for Standardization
OECDOrganisation for Economic Co-operation and Development
PM2.5Particulate Matter with aerodynamic diameter ≤ 2.5 µm
SDGSustainable Development Goal
SMARTSpecific, Measurable, Achievable, Relevant, and Time-bound
UNUnited Nations
UNEPUnited Nations Environment Programme
UNICEFUnited Nations Children’s Fund
WHOWorld Health Organization

Appendix A. Framework Operationalization by Dimension

Appendix A presents the detailed operationalization of the framework dimensions not included in the main text. In line with the methodological structure described in Section 3.5, each subsection summarizes the consolidated objectives, associated SDG targets, and corresponding indicators for a specific framework dimension. All dimensions follow the same operational logic applied to the Health dimension presented in the main text.

Appendix A.1. Government and Economic Development: SDG Targets and Operational Indicators

Appendix A.1 presents the operationalization of the Government and Economic Development dimension. This dimension captures key aspects related to governance quality, economic performance, institutional capacity, and fiscal sustainability.
Table A1. Government and Economic Development.
SDGConsolidated TargetIndicatorsSource
SDG 1G1. Reduce poverty and ensure access to economic resources and social protectionProportion of population living below the national poverty lineUN–1.2.1 [31]
Proportion of population covered by social protection systemUN–1.3.1 [32]
Municipal expenditure on social protection per capitaOECD [33]
SDG 5G2. Ensure inclusive participation and gender equality in decision-makingProportion of seats held by women in local governmentUN–5.5.1 [34]
SDG 8G3. Promote sustained, inclusive and sustainable economic growth and decent workGender wage gapEurostat [35]
Employment rateEurostat [36]
Youth unemployment rateEurostat [37]
Number of businesses per 100,000 inhabitantsEurostat [38]
SDG 9G4. Strengthen economic resilience, innovation and productivityNumber of patents per 100,000 inhabitantsOECD [39]
SDG 10G5. Reduce inequalities within the cityHouseholds with internet accessEurostat [40]
Income inequality (Gini coefficient)World Bank [41]
Share of income held by the bottom 40% of the populationUN–10.1.1 [42]
SDG 12G6. Promote sustainable public procurement and responsible productionShare of municipal procurement aligned with sustainability criteriaUN–12.7.1 [43]
SDG 16G7. Strengthen institutions, transparency and public trustVoter turnout in municipal electionsInternational IDEA [44]
SDG 17G8. Strengthen institutional capacity and fiscal autonomy through partnershipsAccess to public informationUN–16.10.2 [45]
Municipal revenue per capitaEurostat [46]
Share of own-source revenue in total municipal revenueOECD [47]

Appendix A.2. Civic & Social Infrastructure Targets and Operational Indicators

Appendix A.2 presents the operationalization of the Civic & Social Infrastructure dimension. This dimension covers essential public services that directly affect quality of life and social inclusion at the municipal level, including healthcare, education, water and sanitation, energy provision, and access to basic administrative services. Targets and indicators reflect both service availability and accessibility, enabling a comprehensive assessment of municipal service provision.
Table A2. Civic & Social Infrastructure.
SDGConsolidated TargetIndicatorsSource
SDG 3S1. Ensure access to essential health services and preventive careHealth service coverage indexUN–3.8.1 [48]
Number of physicians per 100,000 inhabitantsEurostat [49]
Number of hospital beds per 100,000 inhabitantsWorld Bank [50]
SDG 4S2. Ensure inclusive and equitable access to quality educationParticipation rate in early childhood educationUN–4.2.2 [51]
Completion rate in primary and secondary educationUN–4.1.2 [52]
Adult participation in education and trainingEurostat [53]
SDG 6S3. Ensure access to safe drinking water and sanitation servicesProportion of population using safely managed drinking water servicesUN–6.1.1 [54]
Proportion of population using safely managed sanitation servicesUN–6.2.1 [55]
Population connected to wastewater treatmentEurostat [56]
SDG 7S4. Ensure access to affordable, reliable and modern energy servicesProportion of population with access to electricityUN–7.1.1 [57]
Average electricity consumption per capita (kWh)Portuguese National Statistics Institute (INE) [58]
SDG 10S5. Promote social inclusion and equal access to public servicesShare of population at risk of social exclusionEurostat [59]
Access to essential public services for vulnerable groupsOECD [60]
SDG 16S6. Ensure access to information and basic administrative servicesBirth registration coverageUN–16.9.1 [61]
Access to digital public servicesOECD [62]
SDG 17S7. Strengthen data availability and service-related monitoring capacityAvailability of municipal service statisticsUN–17.18.1 [63]

Appendix A.3. Environment and Climate: SDG Targets and Operational Indicators

Appendix A.3 presents the operationalization of the Environment and Climate dimension. This dimension captures key environmental pressures and climate-related challenges affecting urban sustainability, including resource management, pollution, ecosystem protection, and climate resilience. The consolidated targets and indicators focus on both environmental performance and exposure to environmental risks at the municipal level, in line with international sustainability and urban monitoring frameworks.
Table A3. Environment and Climate.
SDGConsolidated TargetIndicatorsSource
SDG 2E1. Promote sustainable food systems and environmentally sound agricultural practicesProportion of agricultural area under productive and sustainable agricultureUN–2.4.1 [64]
SDG 6E2. Ensure sustainable management of water resourcesWater stress levelUN–6.4.2 [65]
Water consumption per capitaWorldometer [66]
Proportion of wastewater safely treatedUN–6.3.1 [67]
SDG 11E3. Reduce the environmental impact of citiesAnnual mean concentration of PM2.5UN–11.6.2 [68]
Solid waste collected per capitaEuropean Environment Agency (EEA) [69]
SDG 12E4. Promote waste reduction and sustainable consumption patternsMunicipal waste recycling rateINE [70]
Food waste per capitaUN–12.3.1 [71]
SDG 13E5. Strengthen resilience and adaptive capacity to climate-related hazardsNumber of climate-related disaster eventsEM-DAT [72]
Deaths caused by climate-related natural disastersGerman Watch [72]
SDG 14E6. Reduce marine pollution and protect coastal ecosystemsCoastal water quality indexUNEP [73]
SDG 15E7. Protect, restore and promote sustainable use of terrestrial ecosystemsGreen areas per capitaHassan and Jombach, 2026 [74]

Appendix A.4. Infrastructure and Urban Planning: SDG Targets and Operational Indicators

Appendix A.4 presents the operationalization of the Infrastructure and Urban Planning dimension. This dimension addresses the physical and spatial structures that support urban functioning, including energy systems, transportation networks, housing conditions, and land-use planning. The consolidated targets and indicators focus on infrastructure availability, efficiency, safety, and resilience, reflecting key aspects of sustainable urban development at the municipal level.
Table A4. Infrastructure and Urban Planning.
SDGConsolidated TargetIndicatorsSource
SDG 7I1. Ensure access to affordable, reliable and sustainable energy infrastructureShare of renewable energy in total final energy consumptionUN–7.2.1 [75]
Energy consumption per capitaOur World in Data [76]
SDG 9I2. Develop resilient infrastructure and promote innovationLength of public transport network per 100,000 inhabitantsEuropean Metropolitan Transport Authorities (EMTA) [77]
Internet broadband subscriptions per 100,000 inhabitantsOur World in Data [78]
SDG 11I3. Ensure access to adequate, safe and affordable housingProportion of population living in overcrowded dwellingsUN–11.1.1 [79]
Housing affordability indexOECD [80]
SDG 11I4. Promote safe, inclusive and sustainable urban mobilityPublic transport ridership per capitaISO 37120–9.2 [81]
Food waste per capitaUN–12.3.1 [71]
SDG 11E5. Strengthen resilience and adaptive capacity to climate-related hazardsNumber of climate-related disaster eventsEM-DAT [72]
Road traffic fatalities per 100,000 inhabitantsUN–3.6.1 [82]
SDG 11I5. Strengthen urban planning and land-use managementLand consumption rateUN–11.3.1 [83]
Built-up area per capitaWorld Bank [50]
SDG 13I6. Enhance infrastructure resilience to climate-related hazardsInfrastructure damage caused by extreme weather eventsEM-DAT [84]
Municipal climate adaptation plansOECD [85]

Appendix A.5. Health: SDG Targets and Operational Indicators

Appendix A.5 presents the operationalization of the Health dimension. This dimension addresses physical and mental impacts of several health-related aspects, from nutrition to drug abuse, together with more traditional quality indicators of social health–such as overall mortality and infant deaths.
Table A5. Health.
Table A5. Health.
SDGConsolidated TargetIndicatorsSource
SDG 2H1. End hunger and ensure access to nutritious, safe and sufficient food for allPrevalence of undernourishmentUN–2.1.1 [86]
Prevalence of moderate or severe food insecurityUN–2.1.2 [87]
Percentage of urban population undernourishedRitchie et al., 2023 [88]
Percentage of children experiencing food insecurityFeeding America [89]
Proportion of population supported by food assistance programsCBPP [90]
Prevalence of malnutrition among children under 5 years of ageUN–2.2.2 [91]
SDG 2H2. Ensure balanced nutritional needs for all, particularly for vulnerable groupsPrevalence of anemia in women aged 15–49 yearsUN–2.2.3 [92]
Percentage of urban population overweight or obeseEurostat [93]
Prevalence of anemia by age group and sexWorld Bank [94]
Prevalence of micronutrient deficiencyOur World in Data [95]
Percentage of newborns with low birth weightUNICEF [96]
Maternal mortality ratioUN–3.1.1 [97]
SDG 3H3. Reduce the maternal mortality ratioProportion of births attended by skilled health personnelUN–3.1.2 [98]
Neonatal mortality rateUN–3.2.2 [99]
SDG 3H4. End preventable deaths of newborns and children under fiveUnder-five mortality rateWorld Health Organization (WHO) [100]
SDG 3H5. Reduce the incidence of communicable diseasesNumber of infections per 1000 population, by diseaseAIHW [101]
Vaccination coverage rate, by vaccine typeWHO [102]
Mortality from cardiovascular diseases, cancer, diabetes or chronic respiratory diseasesUN–3.4.1 [103]
SDG 3H6. Reduce premature mortality from non-communicable diseases and promote mental healthHospitalization rate for chronic diseasesEuropean Commission [104]
Suicide rateWHO [105]
Antidepressant consumptionOur World in Data [106]
Work absenteeism due to mental health problemsOECD [107]
Population reporting symptoms of depression or anxietyWorld Population Review [108]
Prevalence of tobacco, alcohol and drug consumptionOur World in Data [109]
SDG 3H7. Reduce the harmful use of addictive substancesTobacco consumption per capita per dayEurostat [110]
Users in rehabilitation programs per 1000 inhabitantsICAD [111]
Hospital admissions attributable to substance useNHS [112]
Mortality attributed to household and ambient air pollutionUN–3.9.1 [113]
SDG 3H8. Reduce mortality and illness from environmental and behavioral risksAnnual mean concentration of PM2.5EEA [68]
Noise pollutionEEA [114]
Air Quality IndexAQICN [115]
Road traffic injury mortality rateUN–3.6.1 [116]
Mortality attributed to unsafe water, sanitation and hygieneUN–3.9.2 [117]
Mortality attributed to unintentional poisoningUN–3.9.3 [118]
Deaths caused by natural disastersOur World in Data [119]

Appendix A.6. Urban Living Conditions: SDG Targets and Operational Indicators

Appendix A.5 presents the operationalization of the Urban Living Conditions dimension. This dimension captures social and living conditions that shape everyday urban well-being, including housing adequacy, safety and security, exposure to social vulnerability, and basic living standards. The consolidated targets and indicators reflect both structural conditions and outcome-oriented measures relevant to municipal-level assessment of inclusive and safe urban environments.
Table A6. Urban Living Conditions.
SDGConsolidated TargetIndicatorsSource
SDG 1U1. Reduce vulnerability and ensure minimum living standardsProportion of population living below the national poverty lineUN–1.2.1 [31]
Proportion of population covered by social protection systemsUN–1.3.1 [120]
SDG 5U2. Prevent violence and harmful practices affecting women and vulnerable groupsProportion of women subjected to physical or sexual violenceUN–5.2.1 [121]
Child marriage prevalenceUN–5.3.1 [122]
SDG 8U3. Promote safe and decent working conditionsFrequency rates of fatal and non-fatal occupational injuriesUN–8.8.1 [123]
Workplace fatalities per 100,000 inhabitantsOECD [124]
SDG 10U4. Promote social inclusion and protect vulnerable populationsProportion of population at risk of social exclusionEurostat [125]
Remittances received as a proportion of GDPUN–10.c.1 [50]
SDG 11U5. Ensure access to safe, inclusive and accessible public spacesShare of built-up area that is open space for public useUN–11.7.1 [126]
Green areas per capitaUN-Habitat [127]
SDG 16U6. Reduce violence and improve urban safetyNumber of intentional homicides per 100,000 inhabitantsUN–16.1.1 [128]
Violent crime rate per 100,000 inhabitantsISO 37120–14.1 [129]
Death rate due to assaultISO 37120–14.2 [130]
SDG 16U7. Protect children and reduce exploitation and abuseProportion of children experiencing violenceUN–16.2.1 [131]
Number of reported cases of child abuse per 100,000 inhabitantsUNICEF [132]
SDG 16U8. Strengthen community resilience and access to justice-related supportPopulation reporting feeling safe walking alone at nightOECD [133]
Access to legal aid servicesUN–16.3.3 [134]

References

  1. United Nations. World Urbanization Prospects: The 2018 Revision; Department of Economic and Social Affairs: New York, NY, USA, 2019. [Google Scholar]
  2. OECD. A Territorial Approach to the Sustainable Development Goals; OECD Publishing: Paris, France, 2020. [Google Scholar] [CrossRef]
  3. Seto, K.C.; Güneralp, B.; Hutyra, L.R. Global forecasts of urban expansion to 2030 and direct impacts on biodiversity and carbon pools. Proc. Natl. Acad. Sci. USA 2012, 109, 16083–16088. [Google Scholar] [CrossRef]
  4. UN-Habitat. World Cities Report 2022: Envisioning the Future of Cities; United Nations Human Settlements Programme: Nairobi, Kenya, 2022. [Google Scholar]
  5. Bulkeley, H.; Castán Broto, V.; Hodson, M.; Marvin, S. Cities and Low Carbon Transitions; Routledge: London, UK, 2010. [Google Scholar] [CrossRef]
  6. Elmqvist, T.; Bai, X.; Frantzeskaki, N.; Griffith, C.; Maddox, D.; McPhearson, T.; Parnell, S.; Romero-Lankao, P.; Simon, D.; Watkins, M. Urban Planet: Knowledge Towards Sustainable Cities; Cambridge University Press: Cambridge, UK, 2018. [Google Scholar]
  7. Newman, P.; Kenworthy, J. Sustainability and Cities: Overcoming Automobile Dependence; Island Press: Washington, DC, USA, 2015. [Google Scholar] [CrossRef]
  8. Sharifi, A. A critical review of selected smart city assessment tools and indicator sets. J. Clean. Prod. 2019, 233, 1269–1283. [Google Scholar] [CrossRef]
  9. United Nations. Transforming Our World: The 2030 Agenda for Sustainable Development; UN General Assembly: New York, NY, USA, 2015. [Google Scholar]
  10. Nilsson, M.; Griggs, D.; Visbeck, M. Policy: Map the interactions between Sustainable Development Goals. Nature 2016, 534, 320–322. [Google Scholar] [CrossRef] [PubMed]
  11. Sachs, J.; Schmidt-Traub, G.; Kroll, C.; Lafortune, G.; Fuller, G. Sustainable Development Report 2019; Bertelsmann Stiftung: New York, NY, USA, 2019. [Google Scholar]
  12. Simon, D.; Arfvidsson, H.; Anand, G.; Bazaz, A.; Fenna, G.; Foster, K.; Jain, G.; Hansson, S.; Evans, L.; Moodley, N.; et al. Developing and testing the Urban Sustainable Development Goal’s targets and indicators—A five-city study. Environ. Urban. 2016, 28, 49–63. [Google Scholar] [CrossRef]
  13. Allen, C.; Metternicht, G.; Wiedmann, T. Prioritising SDG targets: Assessing baselines, gaps and interlinkages. Sustain. Sci. 2019, 14, 421–438. [Google Scholar] [CrossRef]
  14. Moreno, C.; Allam, Z.; Chabaud, D.; Gall, C.; Pratlong, F. Introducing the “15-minute city”: Sustainability, resilience and place identity in future post-pandemic cities. Smart Cities 2021, 4, 93–111. [Google Scholar] [CrossRef]
  15. Gupta, J.; Vegelin, C.; Boas, I. Sustainable development goals and inclusive development. Int. Environ. Agreem. 2016, 16, 433–448. [Google Scholar] [CrossRef]
  16. Klopp, J.M.; Petretta, D.L. The urban sustainable development goal: Indicators, complexity and the politics of measuring cities. Cities 2017, 63, 92–97. [Google Scholar] [CrossRef]
  17. Hiremath, R.B.; Balachandra, P.; Kumar, B.; Bansode, S.S.; Murali, J. Indicator-based urban sustainability—A review. Energy Sustain. Dev. 2013, 17, 555–563. [Google Scholar] [CrossRef]
  18. Shen, L.; Ochoa, J.J.; Shah, M.N.; Zhang, X. The application of urban sustainability indicators—A comparison between various practices. Habitat Int. 2011, 35, 17–29. [Google Scholar] [CrossRef]
  19. ISO 37120:2018; Sustainable Cities and Communities—Indicators for City Services and Quality of Life. International Organization for Standardization: Geneva, Switzerland, 2018.
  20. Carli, R.; Dotoli, M.; Pellegrino, R.; Ranieri, L. Measuring and managing the smartness of cities: A framework for classifying performance indicators. Sustain. Cities Soc. 2013, 36, 836–845. [Google Scholar] [CrossRef]
  21. Bell, S.; Morse, S. Sustainability Indicators: Measuring the Immeasurable? 2nd ed.; Routledge: London, UK, 2008. [Google Scholar] [CrossRef]
  22. Ahvenniemi, H.; Huovila, A.; Pinto-Seppä, I.; Airaksinen, M. What are the differences between sustainable and smart cities? Cities 2017, 60, 234–245. [Google Scholar] [CrossRef]
  23. Bibri, S.E.; Krogstie, J. Smart sustainable cities of the future: An extensive interdisciplinary literature review. Sustain. Cities Soc. 2017, 31, 183–212. [Google Scholar] [CrossRef]
  24. Mongeon, P.; Paul-Hus, A. The journal coverage of Web of Science and Scopus: A comparative analysis. Scientometrics 2016, 106, 213–228. [Google Scholar] [CrossRef]
  25. Pires, S.M.; Fidélis, T.; Ramos, T.B. Measuring and comparing local sustainable development through common indicators: Constraints and achievements in practice. Cities 2014, 39, 1–9. [Google Scholar] [CrossRef]
  26. Sharifi, A.; Murayama, A. A critical review of seven selected neighborhood sustainability assessment tools. Environ. Impact Assess. Rev. 2013, 38, 73–87. [Google Scholar] [CrossRef]
  27. Doran, G.T. There’s a S.M.A.R.T. way to write management’s goals and objectives. Manag. Rev. 1981, 70, 35–36. [Google Scholar]
  28. Meadowcroft, J. Engaging with the politics of sustainability transitions. Environ. Innov. Soc. Transit. 2011, 1, 70–75. [Google Scholar] [CrossRef]
  29. Spangenberg, J.H. Sustainability science: A review, an analysis and some empirical lessons. Environ. Conserv. 2011, 38, 275–287. [Google Scholar] [CrossRef]
  30. UN-Habitat. Localizing the SDGs. United Nations Human Settlements Programme (UN-Habitat). Available online: https://unhabitat.org/topics/localizing-the-sdgs (accessed on 15 November 2025).
  31. Our World in Data. Share of Population Living Below National Poverty Lines. Available online: https://ourworldindata.org/grapher/share-of-population-living-in-poverty-by-national-poverty-lines (accessed on 25 March 2026).
  32. World Bank Blogs. Who Benefits from Public Spending? New Evidence on Pro-Poor Investments. Available online: https://blogs.worldbank.org/en/opendata/who-benefits-from-public-spending--new-evidence-on-pro-poor-inve (accessed on 25 March 2026).
  33. Our World in Data. Social Protection Spending as Share of Total Government Spending. Available online: https://ourworldindata.org/grapher/share-social-protection-in-government-exp-oecd (accessed on 25 March 2026).
  34. Portal INE—Base Dados—Indicador 0001432. Available online: https://www.ine.pt/xportal/xmain?xpid=INE&xpgid=ine_indicadores&indOcorrCod=0001432&contexto=bd&selTab=tab2 (accessed on 25 March 2026).
  35. Gender Pay Gap Statistics. Available online: https://ec.europa.eu/eurostat/statistics-explained/index.php?title=Gender_pay_gap_statistics (accessed on 25 March 2026).
  36. Unemployment Rates by Educational Attainment Level and NUTS 2 Region. Available online: https://ec.europa.eu/eurostat/databrowser/view/lfst_r_lfu3rt/default/table?lang=en (accessed on 25 March 2026).
  37. Portugal Youth Unemployment Rate. Available online: https://tradingeconomics.com/portugal/youth-unemployment-rate (accessed on 25 March 2026).
  38. Business Demography Statistics. Available online: https://ec.europa.eu/eurostat/statistics-explained/index.php?title=Business_demography_statistics (accessed on 25 March 2026).
  39. Our World in Data. Annual Patent Applications per Million People. Available online: https://ourworldindata.org/grapher/patent-applications-per-million (accessed on 25 March 2026).
  40. Households—Level of Internet Access. Available online: https://ec.europa.eu/eurostat/databrowser/view/isoc_ci_in_h/default/table?lang=en (accessed on 25 March 2026).
  41. Our World in Data. Income Inequality: Gini Coefficient. Available online: https://ourworldindata.org/grapher/economic-inequality-gini-index (accessed on 25 March 2026).
  42. Growth Rates of Household Expenditure or Income per Capita Among the Bottom 40 per Cent of the Population—Sustainable Development Goals—United Nations Economic Commission for Europe. Available online: https://w3.unece.org/SDG/en/Indicator?id=122 (accessed on 25 March 2026).
  43. Relatorio_Desenvolvimento_Sustentavel_2024_Porto_Futuro_PT.pdf. Available online: https://www.cm-porto.pt/files/uploads/cms/Relatorio_Desenvolvimento_Sustentavel_2024_Porto_Futuro_PT.pdf (accessed on 25 March 2026).
  44. Eleições Autárquicas 2025. Available online: https://www.eleicoes.mai.gov.pt/autarquicas2025/resultados/territorio-nacional (accessed on 25 March 2026).
  45. Conjuntos de Dados—Dados.gov—Plataforma Aberta de Dados Abertos da Administração Pública. Available online: https://dados.gov.pt/pt/datasets/ (accessed on 25 March 2026).
  46. Real GDP per Capita. Available online: https://ec.europa.eu/eurostat/databrowser/view/sdg_08_10/default/table (accessed on 25 March 2026).
  47. Portal INE—Base Dados—Indicador 0010003. Available online: https://www.ine.pt/xportal/xmain?xpid=INE&xpgid=ine_indicadores&contecto=pi&indOcorrCod=0010003&selTab=tab0 (accessed on 25 March 2026).
  48. Evolução do Desempenho do Serviço Nacional de Saúde em 2024. 2024. Available online: https://www.cfp.pt/pt/publicacoes/sectores-das-administracoes-publicas/evolucao-do-desempenho-do-servico-nacional-de-saude-em-2024 (accessed on 25 March 2026).
  49. Practising Physicians. Available online: https://ec.europa.eu/eurostat/databrowser/view/tps00044/default/table?lang=en (accessed on 25 March 2026).
  50. World Bank Open Data. World Bank Open Data. Available online: https://data.worldbank.org (accessed on 25 March 2026).
  51. Pupils from Age 3 to the Starting Age of Compulsory Education at Primary Level by Sex—% of the Population of the Corresponding Age. Available online: https://ec.europa.eu/eurostat/databrowser/view/educ_uoe_enra21/default/table?lang=en (accessed on 25 March 2026).
  52. Our World in Data. Primary, Secondary and Tertiary Education Enrollment and Completion Rates. Available online: https://ourworldindata.org/grapher/primary-secondary-enrollment-completion-rates (accessed on 25 March 2026).
  53. Observatorio Desigualdades. Taxa de Participação de Adultos em Atividades de Aprendizagem ao Longo da Vida (ALV)—Observatório das Desigualdades. Available online: https://www.observatorio-das-desigualdades.com/2024/01/01/taxa-de-participacao-de-adultos-em-atividades-de-aprendizagem-ao-longo-da-vida-alv/ (accessed on 25 March 2026).
  54. Datadot. 1548EA3. Available online: https://data.who.int/indicators/i/5131A52/1548EA3 (accessed on 25 March 2026).
  55. Our World in Data. Share of the Population Using Improved Sanitation Facilities. Available online: https://ourworldindata.org/grapher/share-of-the-population-using-improved-sanitation-facilities (accessed on 25 March 2026).
  56. Population Connected to at Least Secondary Wastewater Treatment. Available online: https://ec.europa.eu/eurostat/databrowser/view/sdg_06_20/default/table?lang=en (accessed on 25 March 2026).
  57. Our World in Data. Share of the Population with Access to Electricity. Available online: https://ourworldindata.org/grapher/share-of-the-population-with-access-to-electricity (accessed on 25 March 2026).
  58. Portal INE—Base Dados. Available online: https://www.ine.pt/xportal/xmain?xpid=INE&xpgid=ine_indicadores&userLoadSave=Load&userTableOrder=10861&tipoSeleccao=1&contexto=pq&selTab=tab1&submitLoad=true (accessed on 25 March 2026).
  59. Portal INE—Base Dados—Indicador 0014528. Available online: https://www.ine.pt/xportal/xmain?xpid=INE&xpgid=ine_indicadores&indOcorrCod=0014528&contexto=bd&selTab=tab2 (accessed on 25 March 2026).
  60. 4.6 Access to Quality Services. Available online: https://national-policies.eacea.ec.europa.eu/youthwiki/chapters/portugal/46-access-to-quality-services (accessed on 25 March 2026).
  61. WHO Data. Proportion of Children Under 5 Years of Age Whose Births Are Registered (SDG 16.9.1). Available online: https://platform.who.int/data/maternal-newborn-child-adolescent-ageing/indicator-explorer-new/mca/proportion-of-children-under-5-years-of-age-whose-births-are-registered (accessed on 25 March 2026).
  62. OECD. Digital Public Infrastructure: Government at a Glance 2025. Available online: https://www.oecd.org/en/publications/government-at-a-glance-2025_0efd0bcd-en/full-report/digital-public-infrastructure_1cee4220.html (accessed on 25 March 2026).
  63. Portal INE—Calendário—Disponibilidade de Informação Estatística. Available online: https://www.ine.pt/xportal/xmain?xpid=INE&xpgid=ine_dispinfest (accessed on 25 March 2026).
  64. Our World in Data. Share of Agricultural Land Being Productively and Sustainably Used. Available online: https://ourworldindata.org/grapher/share-of-agricultural-land-being-productively-and-sustainably-used (accessed on 25 March 2026).
  65. Level of Water Stress: Freshwater Withdrawal as a Proportion of Available Freshwater Resources—Sustainable Development Goals—United Nations Economic Commission for Europe. Available online: https://w3.unece.org/SDG/en/Indicator?id=140 (accessed on 25 March 2026).
  66. Worldometer. Water Use Statistics. Available online: https://www.worldometers.info/water/ (accessed on 25 March 2026).
  67. Wastewater Treatment Plants—Compliance of Urban Wastewater Treatment Systems|Indicatori Ambientali. Available online: https://indicatoriambientali.isprambiente.it/en/inland-waters/wastewater-treatment-plants-compliance-urban-wastewater-treatment-systems (accessed on 25 March 2026).
  68. Particulate matter—PM2.5. Available online: https://www.eea.europa.eu/en/analysis/publications/air-quality-status-report-2025/particulate-matter-pm2.5 (accessed on 25 March 2026).
  69. Municipal Waste Statistics. Available online: https://ec.europa.eu/eurostat/statistics-explained/index.php?title=Municipal_waste_statistics (accessed on 25 March 2026).
  70. Portal INE—Base Dados—Indicador 0013542. Available online: https://censos.ine.pt/xportal/xmain?xpid=INE&xpgid=ine_indicadores&indOcorrCod=0013542&contexto=bd&selTab=tab2 (accessed on 25 March 2026).
  71. Statista. Portugal: Food Waste per Capita, by Sector 2022. Available online: https://www.statista.com/statistics/1394109/portugal-food-waste-per-capita-by-sector/?srsltid=AfmBOoraK-VkG3hAw9Op6Qd5dxJlF2dYsJAsz_HTWel4sQPJx8j4sJHh (accessed on 25 March 2026).
  72. Climate Risk Index 2026|Germanwatch e.V. Available online: https://www.germanwatch.org/en/cri (accessed on 25 March 2026).
  73. Qualidade das Águas Balneares Costeiras e de Transição/Estuarinas (%). Available online: https://www.pordata.pt/portugal/qualidade+das+aguas+balneares+costeiras+e+de+transicao+estuarinas+(percentagem)-1215?_gl=1*auuyhx*_up*MQ..*_ga*OTQ5OTM4MTM1LjE3NzQ0NzAzMTM.*_ga_HL9EXBCVBZ*czE3NzQ0NzAzMTMkbzEkZzAkdDE3NzQ0NzAzMTMkajYwJGwwJGgw (accessed on 25 March 2026).
  74. Hassan, Y.N.; Jombach, S. Urban Green Space per Capita for Sustainable and Equitable Urban Planning: A Systematic Review and Bibliometric Analysis. Land 2026, 15, 29. [Google Scholar] [CrossRef]
  75. Our World in Data. Share of Final Energy Use that Comes from Renewable Sources. Available online: https://ourworldindata.org/grapher/share-of-final-energy-consumption-from-renewable-sources (accessed on 25 March 2026).
  76. Our World in Data. Energy Use per Person. Available online: https://ourworldindata.org/grapher/per-capita-energy-use (accessed on 25 March 2026).
  77. EMTA 2014 Barometer. Available online: https://www.emta.com/wp-content/uploads/2020/05/2018_emta_barometer-200526.pdf (accessed on 25 March 2026).
  78. Our World in Data. Landline Internet Subscriptions per 100 People. Available online: https://ourworldindata.org/grapher/broadband-penetration-by-country?country=USA~GBR~CHN~IND~JPN~PRT (accessed on 25 March 2026).
  79. 16.9% of People in EU Lived in Overcrowded Households. Available online: https://ec.europa.eu/eurostat/web/products-eurostat-news/w/ddn-20251222-1 (accessed on 25 March 2026).
  80. World Population Review. Affordable Housing by Country 2026. Available online: https://worldpopulationreview.com/country-rankings/affordable-housing-by-country (accessed on 25 March 2026).
  81. Share of Public Transport in Total Passangers Traffic|ODYSSEE-MURE. Available online: https://www.odyssee-mure.eu/publications/efficiency-by-sector/transport/public-transport.html (accessed on 25 March 2026).
  82. Road Traffic Death Rate (per 100,000 Population), Estimate. Available online: https://www.who.int/data/gho/data/indicators/indicator-details/GHO/estimated-road-traffic-death-rate-(per-100-000-population) (accessed on 25 March 2026).
  83. SDG Indicator 11.3.1|Sustainable Developments Goals. Available online: https://sdgs.unep.org/article/sdg-indicator-1131 (accessed on 25 March 2026).
  84. 2024_EMDAT_Report.pdf. Available online: https://files.emdat.be/reports/2024_EMDAT_report.pdf (accessed on 25 March 2026).
  85. Communication from the Commission to the European Parliament, the Council, the European Economic and Social Committee and the Committee of the Regions Forging a Climate-Resilient Europe—The New EU Strategy on Adaptation to Climate Change. 2021. Available online: https://eur-lex.europa.eu/legal-content/EN/TXT/?uri=COM:2021:82:FIN (accessed on 25 March 2026).
  86. Our World in Data. Share of People Who Are Undernourished. Available online: https://ourworldindata.org/grapher/prevalence-of-undernourishment (accessed on 25 March 2026).
  87. SDGIndicators. 2.1.2 Prevalence of Moderate or Severe Food Insecurity|SDG Indicators Data Portal|Food and Agriculture Organization of the United Nations. Available online: https://www.fao.org/sustainable-development-goals-data-portal/data/indicators/212-prevalence-of-moderate-or-severe-food-insecurity-in-the-population-based-on-the-food-insecurity-experience-scale/en (accessed on 25 March 2026).
  88. Ritchie, H.; Rosado, P.; Roser, M. Hunger and Undernourishment. Our World in Data. June 2023. Available online: https://ourworldindata.org/hunger-and-undernourishment (accessed on 25 March 2026).
  89. Hunger & Poverty in the United States|Map the Meal Gap. Available online: https://map.feedingamerica.org (accessed on 25 March 2026).
  90. A Closer Look at Who Benefits from SNAP: State-by-State Fact Sheets|Center on Budget and Policy Priorities. Available online: https://www.cbpp.org/research/food-assistance/a-closer-look-at-who-benefits-from-snap-state-by-state-fact-sheets (accessed on 25 March 2026).
  91. WHO Data. Prevalence of Underweight Among Children Under-Five Years of Age (Weight-for-Age <-2SD of the Median). Available online: https://platform.who.int/data/maternal-newborn-child-adolescent-ageing/indicator-explorer-new/mca/prevalence-of-underweight-among-children-under-five-years-of-age-(weight-for-age--2sd-of-the-median) (accessed on 25 March 2026).
  92. Anaemia in Women of Reproductive Age (aged 15–49), Prevalence (%), by Pregnancy Status. Available online: https://www.who.int/data/gho/data/indicators/indicator-details/GHO/prevalence-of-anaemia-in-women-of-reproductive-age-(-) (accessed on 25 March 2026).
  93. Overweight and Obesity—BMI Statistics. Available online: https://ec.europa.eu/eurostat/statistics-explained/index.php?title=Overweight_and_obesity_-_BMI_statistics (accessed on 25 March 2026).
  94. Alvarez-Uria, G.; Naik, P.K.; Midde, M.; Yalla, P.S.; Pakam, R. Prevalence and Severity of Anaemia Stratified by Age and Gender in Rural India. Anemia 2014, 2014, 176182. [Google Scholar] [CrossRef]
  95. Ritchie, H.; Roser, M. Micronutrient Deficiency. Our World in Data. August 2017. Available online: https://ourworldindata.org/micronutrient-deficiency (accessed on 25 March 2026).
  96. Low Birthweight—UNICEF DATA. Available online: https://data.unicef.org/topic/nutrition/low-birthweight/ (accessed on 25 March 2026).
  97. Portal INE—Base Dados—Indicador 0009334. Available online: https://www.ine.pt/xportal/xmain?xpid=INE&xpgid=ine_indicadores&indOcorrCod=0009334&contexto=bd&selTab=tab2&xlang=pt (accessed on 25 March 2026).
  98. Datadot. 1772666. Available online: https://data.who.int/indicators/i/F835E3B/1772666 (accessed on 25 March 2026).
  99. datadot. A4C49D3. Available online: https://data.who.int/indicators/i/E3CAF2B/A4C49D3 (accessed on 25 March 2026).
  100. Child Deaths: Under-Five Mortality Rate (per 1000 Live Births) (SDG 3.2.1). Available online: https://www.who.int/data/gho/data/indicators/indicator-details/GHO/under-five-mortality-rate-(probability-of-dying-by-age-5-per-1000-live-births) (accessed on 25 March 2026).
  101. Australian Institute of Health and Welfare. Infectious and Communicable Diseases. Available online: https://www.aihw.gov.au/reports/australias-health/infectious-and-communicable-diseases (accessed on 25 March 2026).
  102. Immunization Data. WHO Immunization Data Portal—Global. Available online: https://immunizationdata.who.int (accessed on 25 March 2026).
  103. Mortality Rate Attributed to Cardiovascular Disease, Cancer, Diabetes or Chronic Respiratory Disease—Sustainable Development Goals—United Nations Economic Commission for Europe. Available online: https://w3.unece.org/SDG/en/Indicator?id=93 (accessed on 25 March 2026).
  104. 2023_chp_pt_Portuguese.pdf. Available online: https://health.ec.europa.eu/system/files/2024-01/2023_chp_pt_portuguese.pdf (accessed on 25 March 2026).
  105. Datadot. 16BBF41. Available online: https://data.who.int/indicators/i/F08B4FD/16BBF41 (accessed on 25 March 2026).
  106. Our World in Data. Antidepressant Drug Consumption per 1000 People. Available online: https://ourworldindata.org/grapher/antidepressants-per-capita (accessed on 25 March 2026).
  107. OECD. Health at a Glance 2023: OECD Indicators. In Health at a Glance; OECD: Paris, France, 2023; Volume 2023. [Google Scholar] [CrossRef]
  108. Depression Rates by Country 2026. Available online: https://worldpopulationreview.com/country-rankings/depression-rates-by-country (accessed on 25 March 2026).
  109. Our World in Data. Share of the Population with Drug Use Disorders by Age. Available online: https://ourworldindata.org/grapher/prevalence-of-drug-use-disorders-by-age?country=~PRT (accessed on 25 March 2026).
  110. Tobacco Consumption Statistics. Available online: https://ec.europa.eu/eurostat/statistics-explained/index.php?title=Tobacco_consumption_statistics (accessed on 25 March 2026).
  111. ICAD. Available online: https://www.icad.pt/ (accessed on 25 March 2026).
  112. NHS England Digital. Part 1: Hospital Admissions Related to Drug Misuse. Available online: https://digital.nhs.uk/data-and-information/publications/statistical/statistics-on-drug-misuse/2020/part-1-hospital-admissions-related-to-drug-misuse (accessed on 25 March 2026).
  113. Air Pollution Attributable Mortality Rate (per 100,000 Population, Age-Standardized), Household and Ambient, SDG Indicator 3.9.1. Available online: https://www.who.int/data/gho/data/indicators/indicator-details/GHO/ambient-and-household-air-pollution-attributable-death-rate-(per-100-000-population-age-standardized) (accessed on 25 March 2026).
  114. noise.eea.europa.eu. Available online: https://noise.eea.europa.eu/ (accessed on 25 March 2026).
  115. The World Air Quality Index Project. Lisbon Air Pollution: Real-time Air Quality Index. aqicn.org. Available online: https://aqicn.org/city/lisbon/ (accessed on 25 March 2026).
  116. Our World in Data. Death Rate from Road Injuries. Available online: https://ourworldindata.org/grapher/death-rates-road-incidents (accessed on 25 March 2026).
  117. Water-, Sanitation- and Hygiene-Attributed Mortality Rate, Exposure to Unsafe WASH Services (per 100,000 Population) (SDG 3.9.2). Available online: https://www.who.int/data/gho/data/indicators/indicator-details/GHO/mortality-rate-attributed-to-exposure-to-unsafe-wash-services-(per-100-000-population)-(sdg-3-9-2) (accessed on 25 March 2026).
  118. Poison Control and Unintentional Poisoning. Available online: https://www.who.int/data/gho/data/themes/topics/indicator-groups/poison-control-and-unintentional-poisoning (accessed on 25 March 2026).
  119. Our World in Data. Global Natural Disaster Death Rates. Available online: https://ourworldindata.org/grapher/natural-disaster-death-rates (accessed on 25 March 2026).
  120. Dados Estatísticos de Seg. Social—Beneficiários em Portugal|Pordata. Available online: https://www.pordata.pt/subtema/portugal/seg.+social+++beneficiarios-21 (accessed on 25 March 2026).
  121. Proportion of Ever-Partnered Women and Girls (Aged 15+) Subjected to Physical and/or Sexual Violence by a Current or Former Intimate Partner in the Previous 12 Months—Sustainable Development Goals—United Nations Economic Commission for Europe. Available online: https://w3.unece.org/SDG/en/Indicator?id=19 (accessed on 25 March 2026).
  122. WHO Data. Percentage of Women Aged 20–24 who Were Married or in a Union Before Age 15 and Before Age 18 (SDG 5.3.1). Available online: https://platform.who.int/data/maternal-newborn-child-adolescent-ageing/indicator-explorer-new/mca/percentage-of-women-aged-20-24-who-were-married-or-in-a-union-before-age-15-and-before-age-18-(sdg-5.3.1) (accessed on 25 March 2026).
  123. Our World in Data. Non-Fatal Occupational Injury Rates. Available online: https://ourworldindata.org/grapher/non-fatal-occupational-injuries-per-100000 (accessed on 25 March 2026).
  124. Accidents at Work Statistics. Available online: https://ec.europa.eu/eurostat/statistics-explained/index.php?title=Accidents_at_work_statistics (accessed on 25 March 2026).
  125. People at Risk of Poverty or Social Exclusion in 2024. Available online: https://ec.europa.eu/eurostat/web/products-eurostat-news/w/ddn-20250430-2 (accessed on 25 March 2026).
  126. SDG Indicator 11.7.1|Sustainable Developments Goals. Available online: https://sdgs.unep.org/article/sdg-indicator-1171 (accessed on 25 March 2026).
  127. UN-Habitat. Urban Indicators Databse. Available online: https://data.unhabitat.org/pages/open-spaces-and-green-areas (accessed on 25 March 2026).
  128. Number of Victims of Intentional Homicide—Sustainable Development Goals—United Nations Economic Commission for Europe. Available online: https://w3.unece.org/SDG/en/Indicator?id=71 (accessed on 25 March 2026).
  129. Indicator 16.1.2—Conflict-Related Deaths per 100,000 Population, by Sex, Age and Cause—U.K. Indicators for the Sustainable Development Goals. Available online: https://sdgdata.gov.uk/16-1-2/ (accessed on 25 March 2026).
  130. Assault-Related Death Rate on the Decline. Available online: https://ec.europa.eu/eurostat/web/products-eurostat-news/-/ddn-20200902-1 (accessed on 25 March 2026).
  131. Our World in Data. Share of Children Who Experienced Violence. Available online: https://ourworldindata.org/grapher/share-of-children-who-experienced-violence (accessed on 25 March 2026).
  132. National Children’s Alliance. National Statistics on Child Abuse. Available online: https://www.nationalchildrensalliance.org/media-room/national-statistics-on-child-abuse/ (accessed on 25 March 2026).
  133. ESS|Sikt. Available online: https://ess.sikt.no/en/datafile/f37d014a-6958-42d4-b03b-17c29e481d3d?tab=1&elems=b1f84f45-ebd0-45fc-b1ff-2d1505ceb076 (accessed on 25 March 2026).
  134. Public Law Project. Who Can Get Legal Aid? Available online: https://publiclawproject.org.uk/current-projects-and-activities/legal-aid/who-can-get-legal-aid/ (accessed on 25 March 2026).
Figure 1. Conceptual Architecture of the Integrated Urban Sustainability Framework.
Sustainability 18 03624 g001
Figure 2. Availability of municipal-level data for framework indicators in the Porto case, with the total number of indicators with (dark blue) and without (light blue) available data in this case. Figure 2 illustrates the distribution of indicators included in the proposed framework according to data availability at the municipal level for the Porto City Council. The comparison highlights variations across framework dimensions, revealing higher levels of data availability in environmental and infrastructure-related domains and more limited coverage in governance, social equity, and long-term climate adaptation indicators.
Sustainability 18 03624 g002
Table 1. Operationalization of SMART criteria in indicator selection.
Indicator CharacteristicVerifiable Objective Criteria
SpecificIndicators were defined through the integration of SDG targets and ISO 37120 indicators and aligned with municipal governance responsibilities in Portugal and OECD contexts
MeasurableData availability was verified through publicly accessible statistical databases, including international repositories and national databases such as the Portuguese Statistics Institute (INE) and Pordata. Indicators without publicly accessible municipal-level datasets were retained due to their inclusion in official SDG and ISO 37120 frameworks, which are expected by design to be measurable.
AchievableAchievability was validated through consultation with municipal sustainability practitioners, sustainability consultants, and standardization experts, ensuring that indicators fall within realistic monitoring capacities
RelevantIndicators were retained only if directly linked to SDG targets and to sustainability objectives within the scope of municipal responsibilities. Indicators outside municipal governance were excluded
Time-boundIndicators were selected to ensure periodic data collection, typically on an annual basis, with some indicators available at quarterly or monthly intervals.
Table 2. Indicator Feasibility Outcomes Following SMART Screening.
Screening OutcomeDescriptionTypical Causes
RetainedIndicator fully meets SMART criteriaClear definition, municipal data available
ReformulatedIndicator adapted for municipal applicabilityExcessive aggregation, unclear scope
ExcludedIndicator removed from the final setData unavailable, outside municipal jurisdiction, ambiguous definition
Table 3. Core Dimensions of the Urban Sustainability Framework.
DimensionScope and Rationale
Government and Economic DevelopmentGovernance quality, economic resilience, institutional capacity, transparency, and fiscal sustainability
Civic & Social InfrastructureAccess to and quality of education, culture, social services, and basic utilities
Environment and ClimateResource efficiency, emissions, biodiversity, waste management, water resources, and climate adaptation
Infrastructure and Urban PlanningMobility, energy systems, land use, digital infrastructure, and urban form
HealthPublic health outcomes, prevention, environmental health, and access to healthcare
Urban Living ConditionsHousing, safety, social inclusion, equity, and overall quality of life
Table 4. Example of SDG-ISO 37120 Alignment.
Urban DimensionSDG TargetsISO 37120 Indicator Themes
Government and Economic Development1.1, 1.2, 1.b, 2.b, 2.c, 5.5, 5.a, 8.1,
8.2, 8.4, 8.9, 8.10, 9.2, 9.3, 10.1,
10.4, 12.1, 12.6, 12.7, 12.8, 12.c,
13.2, 14.a, 15.9, 15.b, 16.5, 16.6,
16.7, 17.1, 17.6, 17.13, 17.14,
17.15, 17.16, 17.17
Economy, Finance, Governance
Civic & Social Infrastructure3.7, 3.8, 4.1, 4.2, 4.3, 4.4, 4.5, 4.6,
4.7, 4.a, 5.1, 5.6, 5.c, 6.1, 6.2, 7.1,
8.3, 8.5, 8.6, 8.b, 10.2, 10.3, 13.3,
16.3, 16.9, 16.10, 16.b, 17.18, 17.19
Education, Recreation, Sports, and Culture
Environment and Climate2.3, 2.4, 2.5, 6.3, 6.4, 6.5, 6.6, 6.b,
11.6, 12.3, 12.4, 12.5, 14.1, 14.2,
14.3, 14.4, 14.5, 14.6, 15.1, 15.2, 15.3, 15.4, 15.5, 15.7, 15.8, 15.c
Environment, Solid Waste, Water
Infrastructure and Urban Planning7.2, 7.3, 9.1, 9.4, 9.5, 9.b, 11.1,
11.2, 11.3, 11.4, 11.5, 11.a, 11.b,
13.1
Energy, Transportation, Urban Planning
Health2.1, 2.2, 3.1, 3.2, 3.3, 3.4, 3.5, 3.6,
3.9, 3.a
Health, Food Safety
Urban Living Conditions1.3, 1.4, 1.5, 5.2, 5.3, 5.4, 8.7, 8.8,
10.7, 10.c, 11.7, 16.1, 16.2, 16.4,
16.a
Housing, Social and Population Conditions, Security
Table 5. Mapping Density of SDG Targets and ISO 37120 Indicators.
DimensionRelative Density of SDG TargetsRelative Density of ISO 37120 IndicatorsCoverage Characterization
Government and Economic DevelopmentHighModerateGovernance-heavy, partial standardization
Civic & Social InfrastructureModerateModerateBalanced but fragmented
Environment and ClimateHighHighStrong alignment and data availability
Infrastructure and Urban PlanningModerateHighStrong standardization, partial SDG linkage
HealthModerateLowSDG-driven, limited standardized indicators
Urban Living ConditionsModerateModerateSocial focus, mixed measurability
Table 6. Health Dimension: SDG Targets and Operational Indicators.
SDGConsolidated TargetIndicators
SDG 2H1. End hunger and ensure access to nutritious, safe and sufficient food for allPrevalence of undernourishment
Prevalence of moderate or severe food insecurity
Percentage of urban population undernourished
Average distance to nearest supermarket
Percentage of children experiencing food insecurity
Proportion of population supported by food assistance programs
SDG 2H2. Ensure balanced nutritional needs for all, particularly for vulnerable groupsPrevalence of malnutrition among children under 5 years of age
Prevalence of anemia in women aged 15–49 years
Percentage of urban population overweight or obese
Prevalence of anemia by age group and sex
Prevalence of micronutrient deficiency
Percentage of newborns with low birth weight
SDG 3H3. Reduce the maternal mortality ratioMaternal mortality ratio
Proportion of births attended by skilled health personnel
SDG 3H4. End preventable deaths of newborns and children under fiveNeonatal mortality rate
SDG 3H5. Reduce the incidence of communicable diseasesUnder-five mortality rate
Number of infections per 1000 population, by disease
Vaccination coverage rate, by vaccine type
SDG 3H6. Reduce premature mortality from non-communicable diseases and promote mental healthMortality from cardiovascular diseases, cancer, diabetes or chronic respiratory diseases
Hospitalization rate for chronic diseases
Suicide rate
Antidepressant consumption
Work absenteeism due to mental health problems
Population reporting symptoms of depression or anxiety
SDG 3H7. Reduce the harmful use of addictive substancesPrevalence of tobacco, alcohol and drug consumption
Tobacco consumption per capita per day
Users in rehabilitation programs per 1000 inhabitants
Hospital admissions attributable to substance use
SDG 3H8. Reduce mortality and illness from environmental and behavioral risksMortality attributed to household and ambient air pollution
Annual mean concentration of PM2.5
Noise pollution
Air Quality Index
Road traffic injury mortality rate
Mortality attributed to unsafe water, sanitation and hygiene
Mortality attributed to unintentional poisoning
Deaths caused by natural disasters
Table 7. Coverage of Framework Dimensions by Sustainability Indicators Reported by the Porto City Council.
Framework DimensionCoverage by Existing Municipal IndicatorsMain Gaps Identified
Government and Economic DevelopmentLow to moderateGovernance transparency and institutional performance indicators
Civic & Social InfrastructureModerate to highEquity-related service access indicators
Environment and ClimateHighLong-term climate adaptation indicators
Infrastructure and Urban PlanningHighIntegrated land-use and resilience indicators
HealthModerateMental health and preventive care indicators
Urban Living ConditionsModerateSocial equity, vulnerability, and safety-related indicators
Disclaimer/Publisher’s Note: The statements, opinions and data contained in all publications are solely those of the individual author(s) and contributor(s) and not of MDPI and/or the editor(s). MDPI and/or the editor(s) disclaim responsibility for any injury to people or property resulting from any ideas, methods, instructions or products referred to in the content.