Article

The Coupling Coordination Relationship Between the Ecological Environment and Economic Development in the Chishui River Basin, China: Spatiotemporal Evolution and Influencing Factors


1
School of Karst Science, Guizhou Normal University/State Engineering Technology Institute for Karst Desertification Control, Guiyang 550025, China
2
School of Ecological Engineering, Guizhou University of Engineering Science, Bijie 551700, China
3
Guizhou Key Laboratory of Plateau Wetland Conservation and Restoration, Bijie 551700, China
*
Author to whom correspondence should be addressed.
Sustainability 2026, 18(7), 3534; https://doi.org/10.3390/su18073534
Submission received: 7 February 2026 / Revised: 26 March 2026 / Accepted: 27 March 2026 / Published: 3 April 2026
(This article belongs to the Section Social Ecology and Sustainability)

Abstract

Although the coupling coordination relationship (CCR) between ecological environment and economic development has received extensive scholarly attention, investigations into the underlying mechanisms of this coupling coordination remain insufficient. Taking the Chishui River Basin (CRB) in Southwest China as the study area, this study integrates remote sensing data and county-level statistical datasets. Firstly, the quality of the ecological environment and economic development level of the CRB are systematically evaluated. Secondly, an improved coupling coordination degree model (ICCDM) is adopted to quantify the CCR between the ecological environment and economic development, as well as its spatiotemporal evolution characteristics. Finally, an obstacle degree model and panel Tobit model are employed to explore the influencing factors of the CCR from both intrinsic and extrinsic perspectives. The results show that during the study period, both the ecological environment index (EEI) and the economic development index (EDI) in the CRB exhibited upward trends, with pronounced inter-county disparities. The CCR between ecological environment and economic development was continuously optimized, and the coupling coordination degree (CCD) displayed a distinct spatial gradient pattern of downstream regions > midstream regions > upstream regions. Obstacle degree analysis identifies significant heterogeneity in the obstacle factors for CCR improvement across the basin: Renhuai and Zunyi are dominated by ecological environment constraints, while 11 counties including Chishui and Xishui are mainly restricted by economic development constraints. Industrial structure, ecological endowment, industrialization level and government capacity are vital positive driving factors for the CCR in the CRB, whereas Terrain conditions act as a key negative restraining factor. This study indicates that the overall coupling coordination level between ecological environment and economic development in the CRB is still relatively low and requires further enhancement. Therefore, region-specific differentiated regulation strategies are urgently needed to achieve high-level coordinated development between the ecological environment and economy in the CRB.

1. Introduction

The interrelationship between the ecological environment and economic development has long been a focal point of attention from various sectors, and it is also a key issue for achieving the sustainable development goals (SDGs; e.g., SDGs 1, 8, 10 and 15) [1]. Since the Industrial Revolution, the advancement of productivity has substantially strengthened humanity’s ability to exploit and utilize natural resources. While this has generated considerable economic benefits, it has also precipitated a series of global ecological and environmental problems, including climate change [2], land degradation [3,4], biodiversity loss [5], environmental pollution [6,7] and resource depletion [8]. With the escalating threats to human survival and development, harmonizing ecological conservation and economic growth to realize sustainable development has become a global consensus. In this context, the Chinese government has proposed a high-quality development strategy, which aims to promote economic progress while ensuring human well-being and ecological security [9]. However, the implementation of high-quality development requires not only national-level strategic guidance but also localized practical actions. This is particularly critical in Southwest China, where important ecological function zones are widely distributed, coexisting with numerous ecologically vulnerable areas such as karst rocky desertification and soil erosion regions [10,11]. Constrained by geographical location and developmental history, this region generally features a low level of economic development and faces severe challenges in balancing ecological protection and economic growth [12]. The coordinated development of the regional ecological environment and socio-economic factors is therefore in urgent need of attention. Accordingly, this study takes the Chishui River Basin (CRB) in Southwest China as the research area to scientifically evaluate its ecological environment quality and economic development level, systematically analyze the coupling coordination relationship (CCR) between them, and reveal the underlying driving mechanisms. The findings can not only facilitate the targeted regulation of ecological construction and economic development in the region but also provide a scientific reference for the implementation of the SDGs.
In fact, the discussion on the interrelationship between the ecological environment and economic development has a long history. Meadows et al. argue that the Earth’s resource carrying capacity is limited, and that population growth and economic growth will eventually encounter ecological and resource ceilings. Without corresponding adjustments, the development of human society will reach its limit and subsequently fall into irreversible decline [13]. Panayotou T. proposed the Environmental Kuznets Curve (EKC) hypothesis, which suggests an inverted U-shaped relationship between environmental degradation and per capita income [14], meaning that environmental quality undergoes a dynamic process of initial deterioration followed by improvement as the economy grows. With the development of human–land relationship theories, scholars have gradually realized that the ecological environment and economic development form a complex, interrelated system [15], exhibiting a significant coupling effect. On the one hand, the ecological environment supports or constrains economic development through resource supply, environmental capacity and regulatory functions [16]. On the other hand, economic development also exerts a bidirectional impact on the ecological environment: unreasonable economic activities often lead to ecological degradation [17], whereas high-quality economic development can provide financial and technological support for environmental protection, thereby improving regional ecological environment quality [18]. Therefore, how to coordinate the ecological environment and economic development to achieve a dynamic balance between the two has become a focal point of academic attention [19].
At present, numerous scholars in the fields of geography, ecology, economics and management have conducted extensive empirical research on the CCR between the ecological environment and economic development. The coupling coordination degree model (CCDM) is commonly employed to analyze the interactive effects between these two systems. Nevertheless, most studies assume equal importance of the ecological environment and economic development by assigning a value of 0.5 to both contribution coefficients α and β [9,20]. Such subjective assignment often neglects regional heterogeneity, leading to results that fail to accurately reflect the actual conditions [21]. To address this limitation, Shen et al. [22] proposed an objective method for determining contribution coefficients based on data distribution patterns, thus developing the improved coupling coordination degree model (ICCDM); this ICCDM has been widely applied in subsequent studies [21,23]. The construction of an evaluation indicator system is the foundation for research on the CCR. Scholars select single or multiple indicators from diverse perspectives to establish assessment frameworks for coupling coordination. For single-indicator selection, the normalized difference vegetation index (NDVI) [24], net primary productivity (NPP) [25] and remote sensing ecological index (RSEI) [26] are commonly used to characterize ecological environment quality, while gross domestic product (GDP) [27] and nighttime light index [28] are generally adopted to represent the level of economic development. Although such indicators can intuitively reflect the overall characteristics of the ecological environment and economic development, they fail to capture internal heterogeneity within the systems, thereby limiting their effectiveness in analyzing the CCR between the two systems. For multi-indicator systems, most scholars select indicators based on frameworks such as the pressure-state-response (PSR) model [29] or the driving force-pressure-state-impact-response (DPSIR) model [30] to construct ecological environment evaluation systems. For economic development evaluation systems, indicators are selected in accordance with the scale-structure-benefit (SSB) model [16] or the innovation-coordination-green-openness-sharing (ICGOS) model [15]. The multi-indicator method is widely favored by scholars due to its ability to comprehensively and systematically reflect the internal cascading relationships between the ecological environment and economic development. However, data for the multi-indicator method are mainly derived from statistical materials, which are restricted by incomplete statistical indicators and inconsistent statistical calibers [31]. As a result, existing studies struggle to refine evaluation units, mostly focusing on large-scale regions such as countries, provinces and cities, while paying relatively little attention to small-scale areas at the county level and below. In recent years, the advancement of remote sensing and geographic information system (GIS) technologies has effectively remedied these shortcomings [32]. On this basis, most existing studies have further explored the spatiotemporal characteristics [1,9,15,16,31] and future development trends [33] of the CCR between the ecological environment and economic development. In contrast, research on the influencing determinants of this CCR remains relatively scarce [9,15], and the in-depth exploration of the coupling coordination mechanisms between the two systems is still insufficient.
The CRB, located in the upper reaches of the Yangtze River, is an important water conservation area and a priority region for biodiversity protection in southwestern China [34]. It has long been a key area for regional ecological construction and environmental protection. Owing to its distinctive geological and geomorphological characteristics, together with the influence of anthropogenic activities, the basin experiences severe soil erosion and has been designated as a national key area for soil erosion control [35], indicating its ecologically vulnerable status. In addition, considerable economic disparities exist across the basin: many counties were previously poverty-stricken, and problems of uneven and inadequate regional development remain. These marked regional differences, together with the complex interaction between ecological and economic issues, make the basin a representative case for investigating the coupling and coordination between the ecological environment and economic development in southwestern China. However, existing studies have mainly focused on ecological environment quality [34,35,36], biodiversity [37], and ecological restoration and governance [38], while research explicitly addressing the CCR between the ecological environment and economic development in the basin remains limited.
In this context, the present study takes the CRB as the study area and integrates remote sensing data with county-level statistical datasets to construct an evaluation index system for the ecological environment and economic development. On this basis, the entropy method is employed to assess the ecological environment quality and economic development level of 13 counties in the CRB at six time points: 2000, 2005, 2010, 2015, 2020, and 2022. Subsequently, the ICCDM is used to reveal the CCR between the ecological environment and economic development and to examine its spatiotemporal evolution. Finally, the obstacle degree model and panel Tobit model are applied to analyze the influencing factors of this coupling coordination and their effects from both internal and external perspectives. This study enriches research on human-environment interactions and provides empirical support for the sustainable development of the CRB and other comparable regions.

2. Materials and Methods

2.1. Study Area

The CRB is located in the upper reaches of the Yangtze River Basin and spans three provinces in China, namely Yunnan, Guizhou, and Sichuan. It extends from 104°45′ to 106°51′ E and from 27°20′ to 28°50′ N, lying on the transitional slope from the Yunnan–Guizhou Plateau toward the Sichuan Basin, with a general topographic gradient descending from the southwest to the northeast. The middle and upper reaches are dominated by karst landforms with pronounced terrain relief, whereas the lower reaches are characterized by Danxia landforms with comparatively gentler relief. The basin has a subtropical monsoon climate and abundant hydrothermal resources, with an annual mean temperature of 13.1–17.6 °C and an annual mean precipitation of 749–1286 mm. Rich in biodiversity and natural landscapes, the CRB harbors numerous rare and endemic species as well as distinctive geological scenery, indicating considerable ecological conservation value [39]. However, in recent years, rapid economic growth and urbanization have intensified ecological and environmental problems, including vegetation degradation, soil erosion, and rocky desertification [35].
This study uses county-level units as the primary units of analysis to examine the CCR between the ecological environment and economic development in the CRB. Following the principle of prioritizing the natural boundaries of the river basin while maintaining the integrity of administrative units to the greatest extent possible, the study area ultimately includes 13 county-level units (Figure 1). It should be noted that, due to county-level administrative adjustments during the study period, the adjusted units of Honghuagang, Huichuan, and Bozhou were consolidated into the municipal districts of Zunyi City for the purpose of data continuity; hereafter, this merged area is referred to as “Zunyi”. Furthermore, based on the division of the Chishui River into upstream, midstream, and downstream sections, and with full consideration of county-level unit integrity, six counties (Zhenxiong, Weixin, Xuyong, Qixingguan, Dafang, and Jinsha) are classified as upstream regions, five counties (Zunyi, Tongzi, Xishui, Renhuai, and Gulin) as midstream regions, and two counties (Chishui and Hejiang) as downstream regions.

2.2. Evaluation Indicator System Construction and Data Sources

2.2.1. Evaluation Indicator System Construction

Taking into account data availability and adhering to the principles of scientific rigor, representativeness, and feasibility, this study integrates remote sensing data with county-level statistical datasets to construct an evaluation indicator system for the ecological environment and economic development of the CRB (Table 1).
For the ecological environment, the evaluation indicator system is constructed based on the Pressure-State-Response (PSR) model. Within this framework, Pressure (P) refers to the degree of external disturbance imposed on the ecological environment and is represented by three indicators: population density, land development intensity, and fertilizer application intensity. State (S) reflects the overall condition and structural-functional characteristics of the ecological environment under pressure and is represented by average NDVI, landscape fragmentation, and ecological resilience. Response (R) denotes the measures taken by human society to prevent ecological degradation and is represented by forest and grassland coverage, the proportion of nature reserve area, and the proportion of tertiary industry output value in GDP. According to their relationship with ecological environment quality, the nine indicators are classified into two categories: positive and negative indicators. Specifically, population density, land development intensity, fertilizer application intensity, and landscape fragmentation are negative indicators, whereas the remaining five are positive indicators.
For economic development, this study constructs an evaluation indicator system based on the Scale-Structure-Benefit (SSB) model. The scale (S) dimension is used to measure the overall macroeconomic level of a region and is represented by three indicators: per capita GDP, economic density, and per capita local fiscal revenue. The structure (S) dimension reflects the intrinsic compositional characteristics of the economic development process. Indicators selected for this dimension cover industrial structure, urban-rural disparities, and regional coordination, including the ratio of urban to rural disposable income, proportion of GDP accounted for by secondary and tertiary industries, and the ratio of regional per capita GDP to national per capita GDP. The benefit (B) dimension reflects the quality of regional economic development and the extent to which development outcomes improve people’s livelihoods. This dimension is represented by three indicators: GDP growth rate, per capita balance of savings deposits, and Per capita total retail sales of consumer goods. Among the nine selected indicators, the ratio of urban to rural disposable income is a negative indicator, whereas the remaining eight are positive indicators.

2.2.2. Data Sources and Processing Methods

The primary data used in this study include basic geographic data, land use data, and socio-economic data.
(1) Basic geographic data: Digital Elevation Model (DEM) data were obtained from the Geospatial Data Cloud (https://www.gscloud.cn/ (accessed on 10 January 2026)), karst coverage data were obtained from the Karst Science Data Center of the Institute of Geochemistry, Chinese Academy of Sciences (http://www.karstdata.cn/ (accessed on 10 January 2026)), nature reserve data were sourced from the Resource and Environmental Science Data Center of the Chinese Academy of Sciences (https://www.resdc.cn/ (accessed on 10 January 2026)), and NDVI data were derived from the MODIS13A3 dataset. All basic geographic data were processed and clipped using ArcGIS 10.8 to extract data for 13 counties, and subsequent calculations were conducted to generate the analytical data used in this study.
(2) Land use data: The land use data used in this study were obtained from the China Land Cover Dataset developed by the research team of Professors Yang Jie and Huang Xin at Wuhan University [48]. Land use data for the 13 counties within the study area were extracted through spatial clipping using ArcGIS 10.8. Based on these data, indicators for each county, including land development intensity, landscape fragmentation, ecological resilience, and forest and grassland coverage rate, were calculated.
Among these indicators, land development intensity reflects the degree to which human activities disturb land use patterns [49]. This study adopts the method of Zeng et al. [42] to assign values to different land use types, with the specific assignments as follows: unused land = 1, water bodies = 2, grassland = 3, forest land = 4, arable land = 5, and construction land = 6. Based on these assignments, land development intensity was calculated as follows:
L U I = i = 1 n S i S × A i
where L U I represents land development intensity; S i is the area of the i th land use type; S is the total area of the county; and A i is the assigned intensity value of the i th land use type.
Landscape fragmentation refers to the degree to which a landscape is divided and can serve as an indicator of the extent of anthropogenic disturbance [50]. The calculation formula is as follows:
C i = N i A i
where C i is the degree of landscape fragmentation for landscape i ; N i is the total number of patches in landscape i ; and A i is the total area of landscape i .
Ecological resilience refers to the buffering and regulatory capacity of a specific ecological system [51]. Drawing on previous research [41], this study calculates the ecological resilience of each county according to the extent to which different land use types affect regional ecological resilience.
R e = i = 1 n P i × R i
where R e represents ecological resilience; P i is the proportion of the area of the i th land use type; and R i is the assigned ecological resilience value of the i th land use type.
(3) Socio-economic data: The data used in this section were derived from the China County Statistical Yearbook, the Guizhou Statistical Yearbook, Sichuan Statistical Yearbook, and Yunnan Statistical Yearbook for the corresponding years. These data are all county-level statistical data and were further processed through relevant calculations to obtain the data required for this study.

2.3. Research Methodology

2.3.1. Evaluation of Ecological Environmental Quality and Economic Development Level

Considering the considerable variation in scale and units among the selected evaluation indicators, all indicators were initially standardized using the min–max normalization technique. The detailed standardization process is outlined as follows:
Positive indicator:
Y i j = X i j min ( X j ) max ( X j ) min ( X j )
Negative indicator:
Y i j = max ( X j ) X i j max ( X j ) min ( X j )
where X i j denotes the raw value of the j th indicator for sample i ; Y i j represents the corresponding standardised value; max ( X i j ) and min ( X i j ) denote the maximum and minimum values of the j th indicator, respectively. To eliminate the impact of zero values after standardisation, let b i j = Y i j + 1 .
Building upon this foundation, the entropy weight method is adopted to calculate the weights of individual indicators. The formula is as follows:
p i j = b i j / i = 1 m b i j
E j = 1 ln ( m ) i = 1 m p i j ln p i j
W j = 1 E j j = 1 n 1 E j
where p i j denotes the homogeneity index value; E j represents the information entropy of the j th indicator; 1 E j signifies the coefficient of variation for the j th indicator; m denotes the number of samples; n denotes the number of indicators; W j denotes the weighting factor for the j th indicator.
Subsequently, the weighted summation method was employed to derive the ecological environment index (EEI) and the economic development index (EDI), which respectively quantify the quality of the ecological environment and the level of economic development.
E E I i = j = 1 9 W j × Y i j
E D I i = j = 1 9 W j × Y i j
where E E I i is the ecological environment index of sample i ; and E D I i is the economic development index of sample i .

2.3.2. ICCDM

This study employs the ICCDM to evaluate the CCR between the ecological environment and economic development within the CRB. The computational formula is presented as follows:
C C D i = C i × T i
C i = 2 × E E I i × E D I i E E I i + E D I i 2
T i = α i × E E I i + β i × E D I i
α i = E D I i E E I i + E D I i
β i = E E I i E E I i + E D I i
where C C D i denotes the coupling coordination degree (CCD) of sample i ; C i represents the coupling degree of sample i ; T i refers to the comprehensive evaluation index of sample i ; α i and β i are the ecological environment and economic development contribution coefficients of sample i , respectively, whose values were calculated following the coefficient assignment method proposed by Shen et al. [22]. Drawing on existing studies [52], this study classified CCD into 10 distinct CCR (Table 2).

2.3.3. Obstacle Degree Model

This study adopts an obstacle degree model to identify the intrinsic factors that constrain the CCR between the ecological environment and economic development in the CRB. The formula is as follows:
M i j = I i j × W j j = 1 n I i j × W j × 100 %
where M i j denotes the obstacle degree of the j th indicator for the i th sample; W j represents the weighting value of the j th indicator; I i j signifies the deviation degree of the j th indicator for the i th sample, with I i j = 1 Y i j .

2.3.4. Panel Tobit Model

Since the CCD is a bounded variable constrained within the interval [0, 1] [53], and this study aims to examine the determinants of the CCR between ecological environment and economic development in the CRB at six temporal nodes, the panel Tobit model, which is specifically designed for censored dependent variables, is adopted. The model is specified as follows:
C C D i t = c + i = 1 n δ i x i t + ε i t
where CCD denotes the coupling coordination degree; c represents the constant term; δ i t denotes the regression coefficients for each influencing factor; ε i t denotes the random error term.

3. Results

3.1. Spatiotemporal Characteristics of Ecological Environment and Economic Development

3.1.1. Ecological Environment

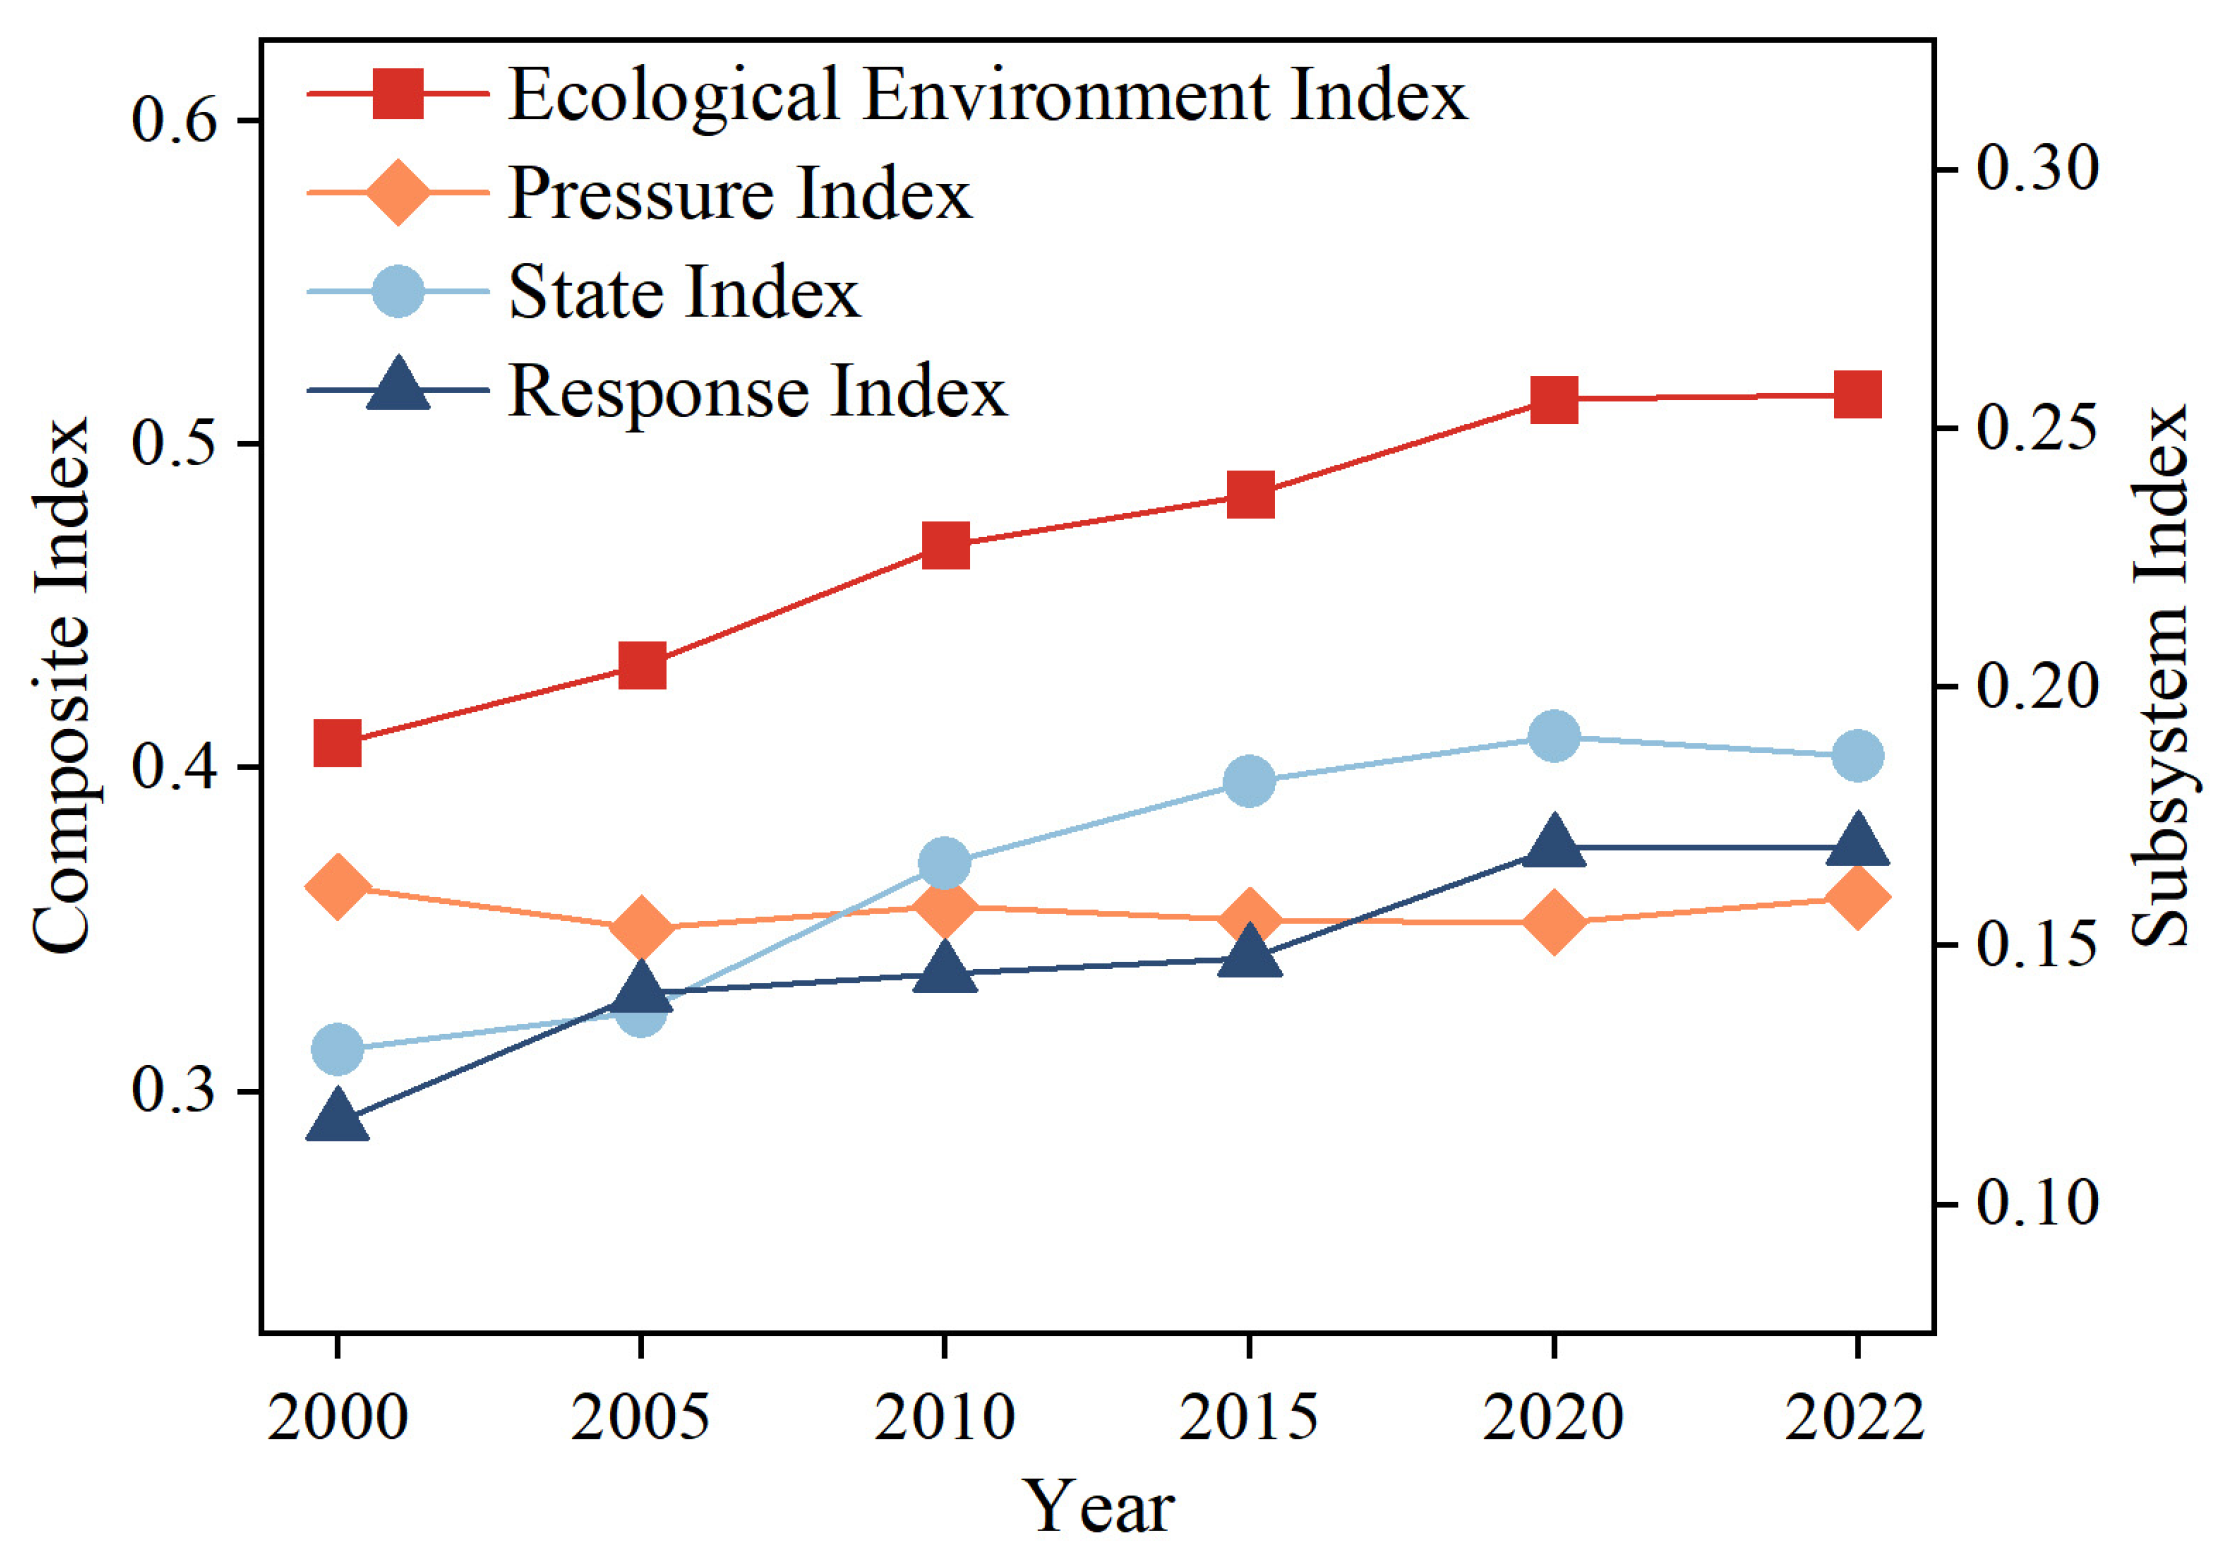
During the study period, the EEI of the CRB exhibited a steady upward trend (Figure 2), rising from 0.407 in 2000 to 0.515 in 2022, representing a cumulative growth of 26.46%. This trend demonstrates an overall improvement in the ecological environment quality of the CRB throughout the study period. Regarding subsystem dynamics, the ecological environment pressure subsystem showed a slight fluctuating decline, with its evaluation index decreasing marginally from 0.161 to 0.159. The ecological environment state subsystem presented an initial increase followed by a subsequent decline: its evaluation index climbed from 0.130 in 2000 to 0.191 in 2020, before falling slightly to 0.186 in 2022. In contrast, the ecological environment response subsystem displayed a sustained upward trend, with its evaluation index increasing from 0.116 to 0.169 over the same period.
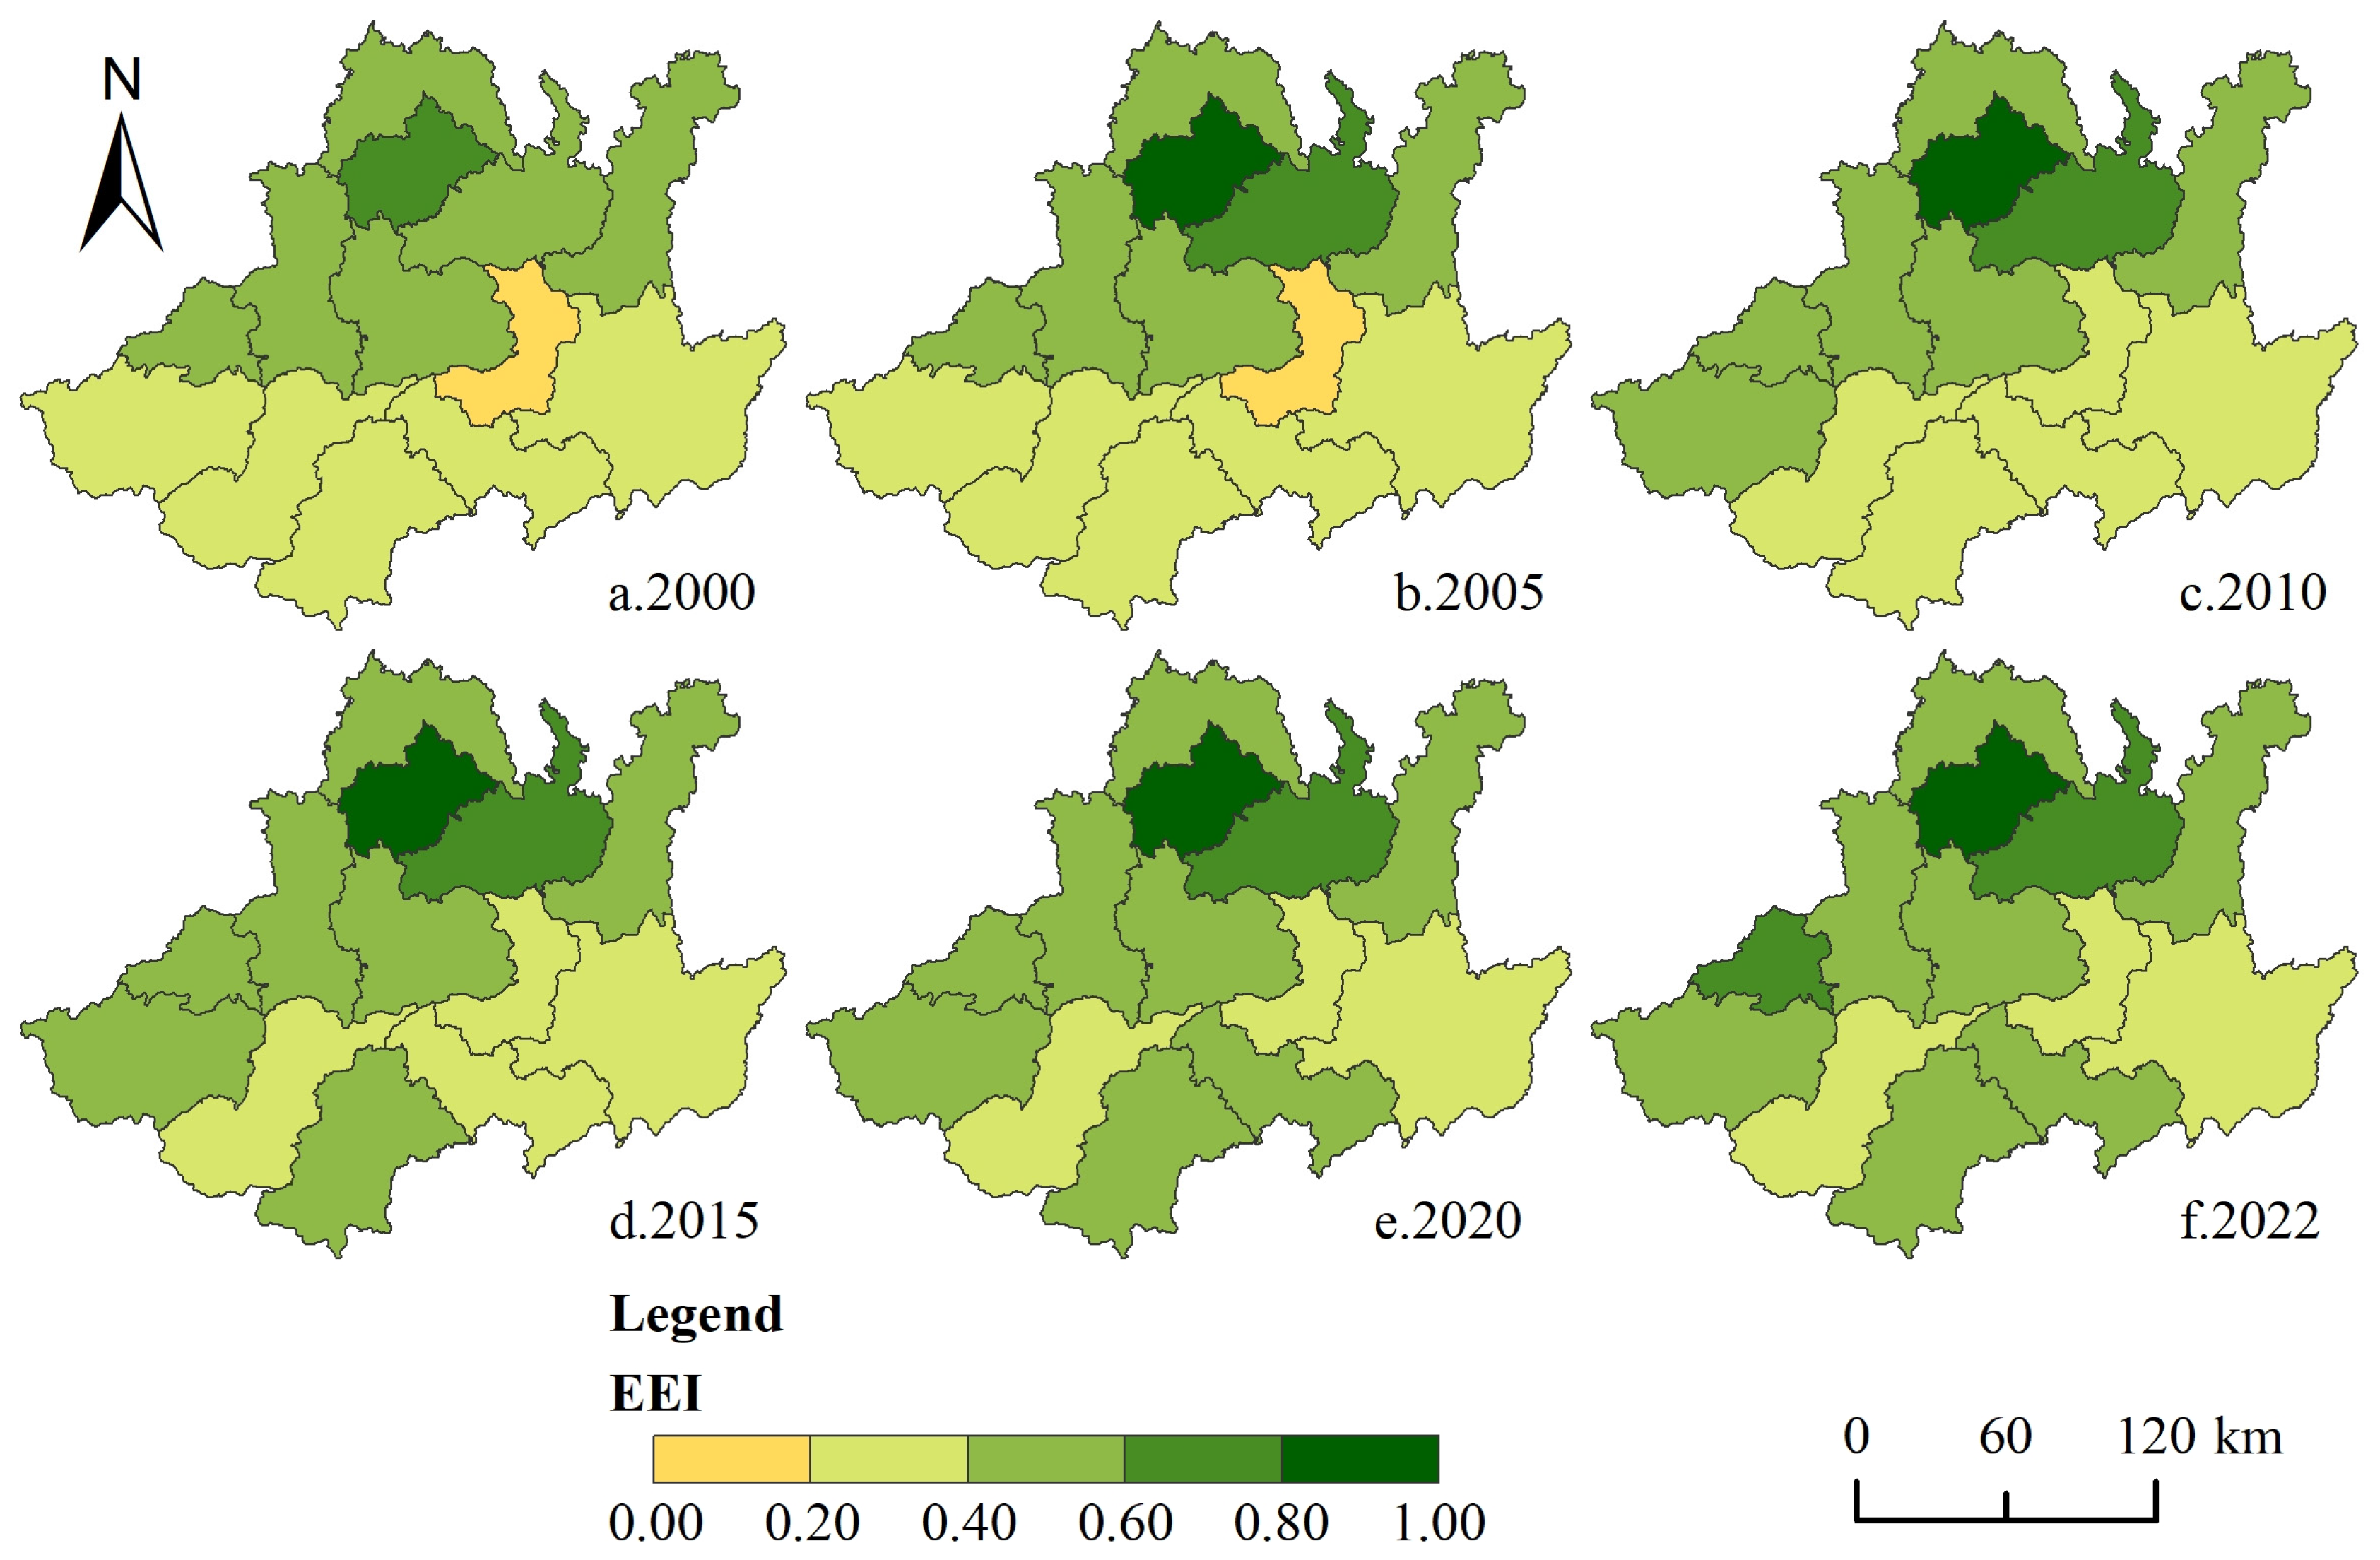
At the county level, the ecological environment quality across the 13 counties in the CRB has exhibited an improving trend, accompanied by a continuous increase in the EEI. Nonetheless, notable disparities exist among these counties, with the overall spatial distribution characterized by a pattern of “higher in the north and lower in the south” (Figure 3). Counties with low EEI values are predominantly distributed in the midstream and upstream regions of the basin. Over time, the number of low-EEI counties has gradually declined, and their spatial distribution has shifted from concentrated contiguous areas to a more dispersed pattern. Conversely, high-EEI areas have been consistently concentrated in northern counties such as Chishui and Xishui, maintaining a clustered spatial distribution.

3.1.2. Economic Development

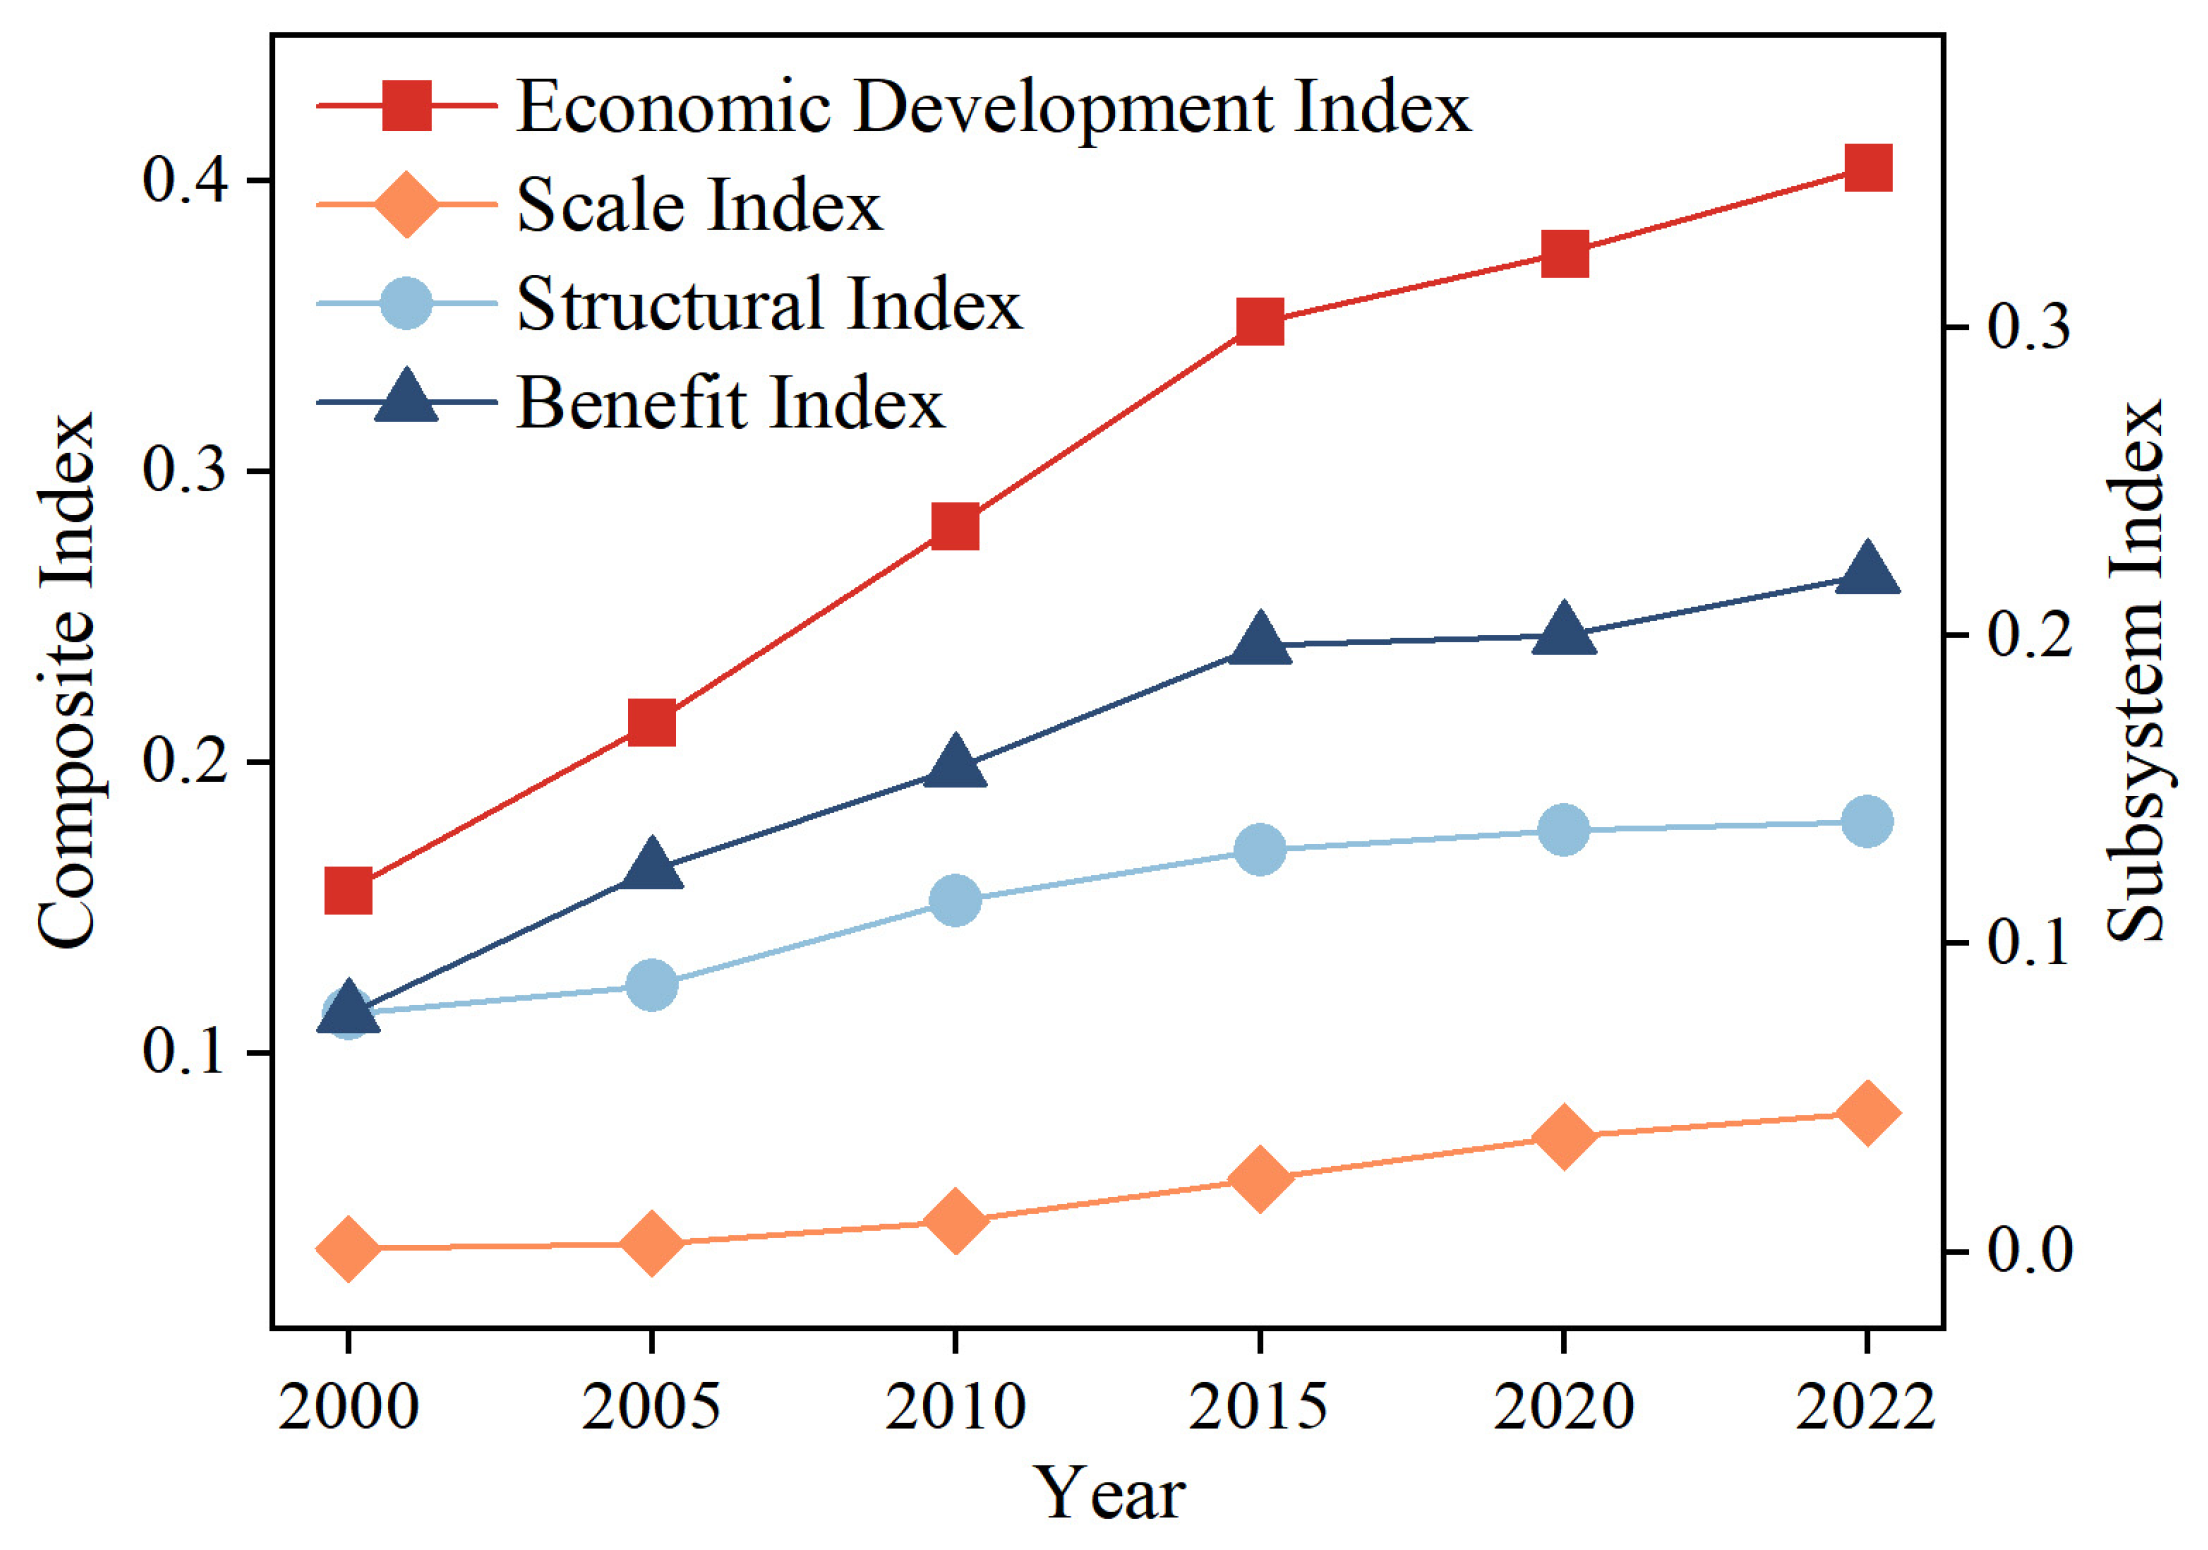
During the study period, the EDI of the CRB exhibited a significant and continuous upward trend (Figure 4), increasing from 0.156 in 2000 to 0.404 in 2022. This suggests that the economic development level of the CRB improved substantially over the study period. With regard to the evolutionary characteristics of each subsystem, the economic scale subsystem showed a modest growth trend, with its evaluation index rising from 0.001 to 0.045. The economic structure subsystem presented a steady upward trend, with its evaluation index increasing from 0.077 in 2000 to 0.139 in 2022. In contrast, the economic benefit subsystem displayed a pronounced growth trend, with its evaluation index rising from 0.078 to 0.220 during the same period.
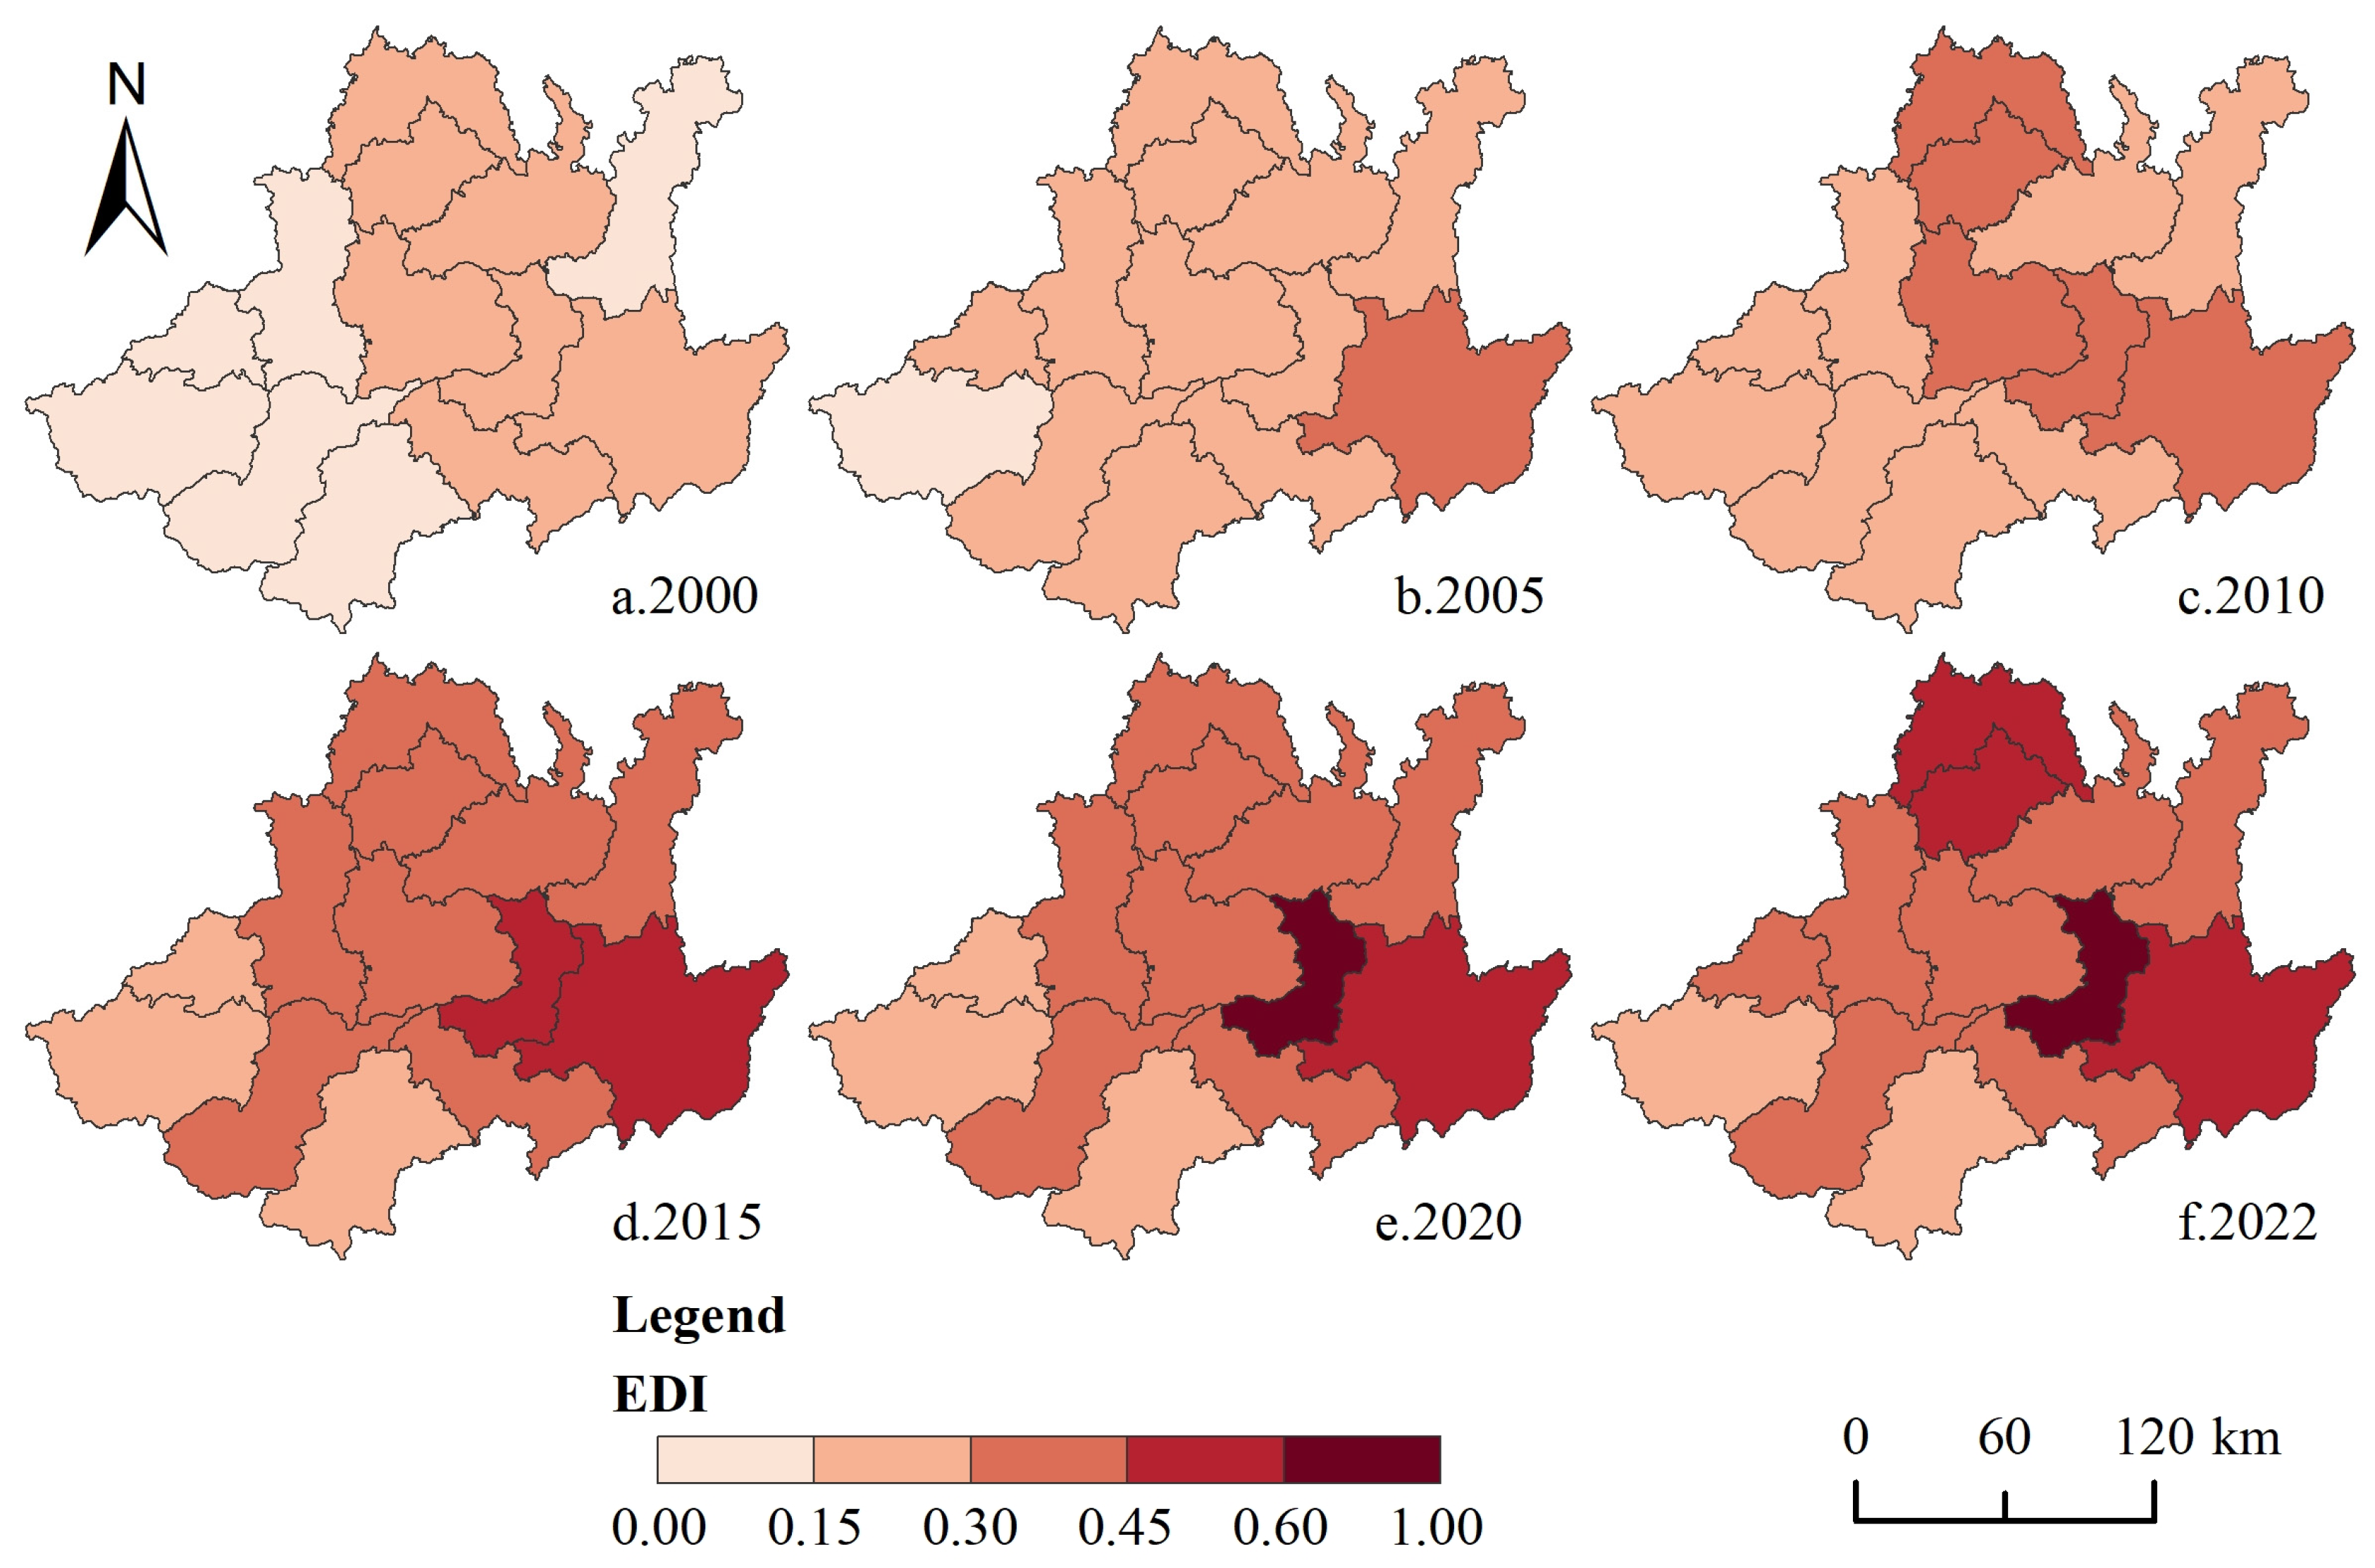
Analysis of the EDI trends across 13 counties in the CRB reveals a distinct transition from “balanced development” to “unbalanced development” (Figure 5). Accompanied by a widening economic disparity within the basin, two core economic development hubs have gradually taken shape: Renhuai-Zunyi and Hejiang-Chishui. Renhuai, acclaimed as the “Chinese Liquor Capital,” constitutes the core production area of globally renowned sauce-flavored baijiu and fosters prestigious brands represented by Kweichow Moutai. It has fostered a distinctive industrial cluster centered on baijiu manufacturing, boasting a high economic development level and ranking among China’s top 100 economically advanced counties. As the economic nucleus of northern Guizhou, Zunyi possesses prominent locational advantages and a relatively high economic development level. Hejiang, located along the Yangtze River corridor, benefits from well-developed transportation infrastructure; Chishui features abundant tourism resources and a sophisticated tourism service industry, with both counties maintaining a relatively high economic status. In contrast, although the economic development levels of other counties have gradually improved, their EDI values remain relatively low. This outcome is mainly attributable to their historical affiliation with the Wumeng Mountain poverty-stricken region, which is featured by inferior locational conditions and a weak developmental foundation.

3.2. Spatiotemporal Characteristic of CCD

3.2.1. Temporal Evolution Characteristic

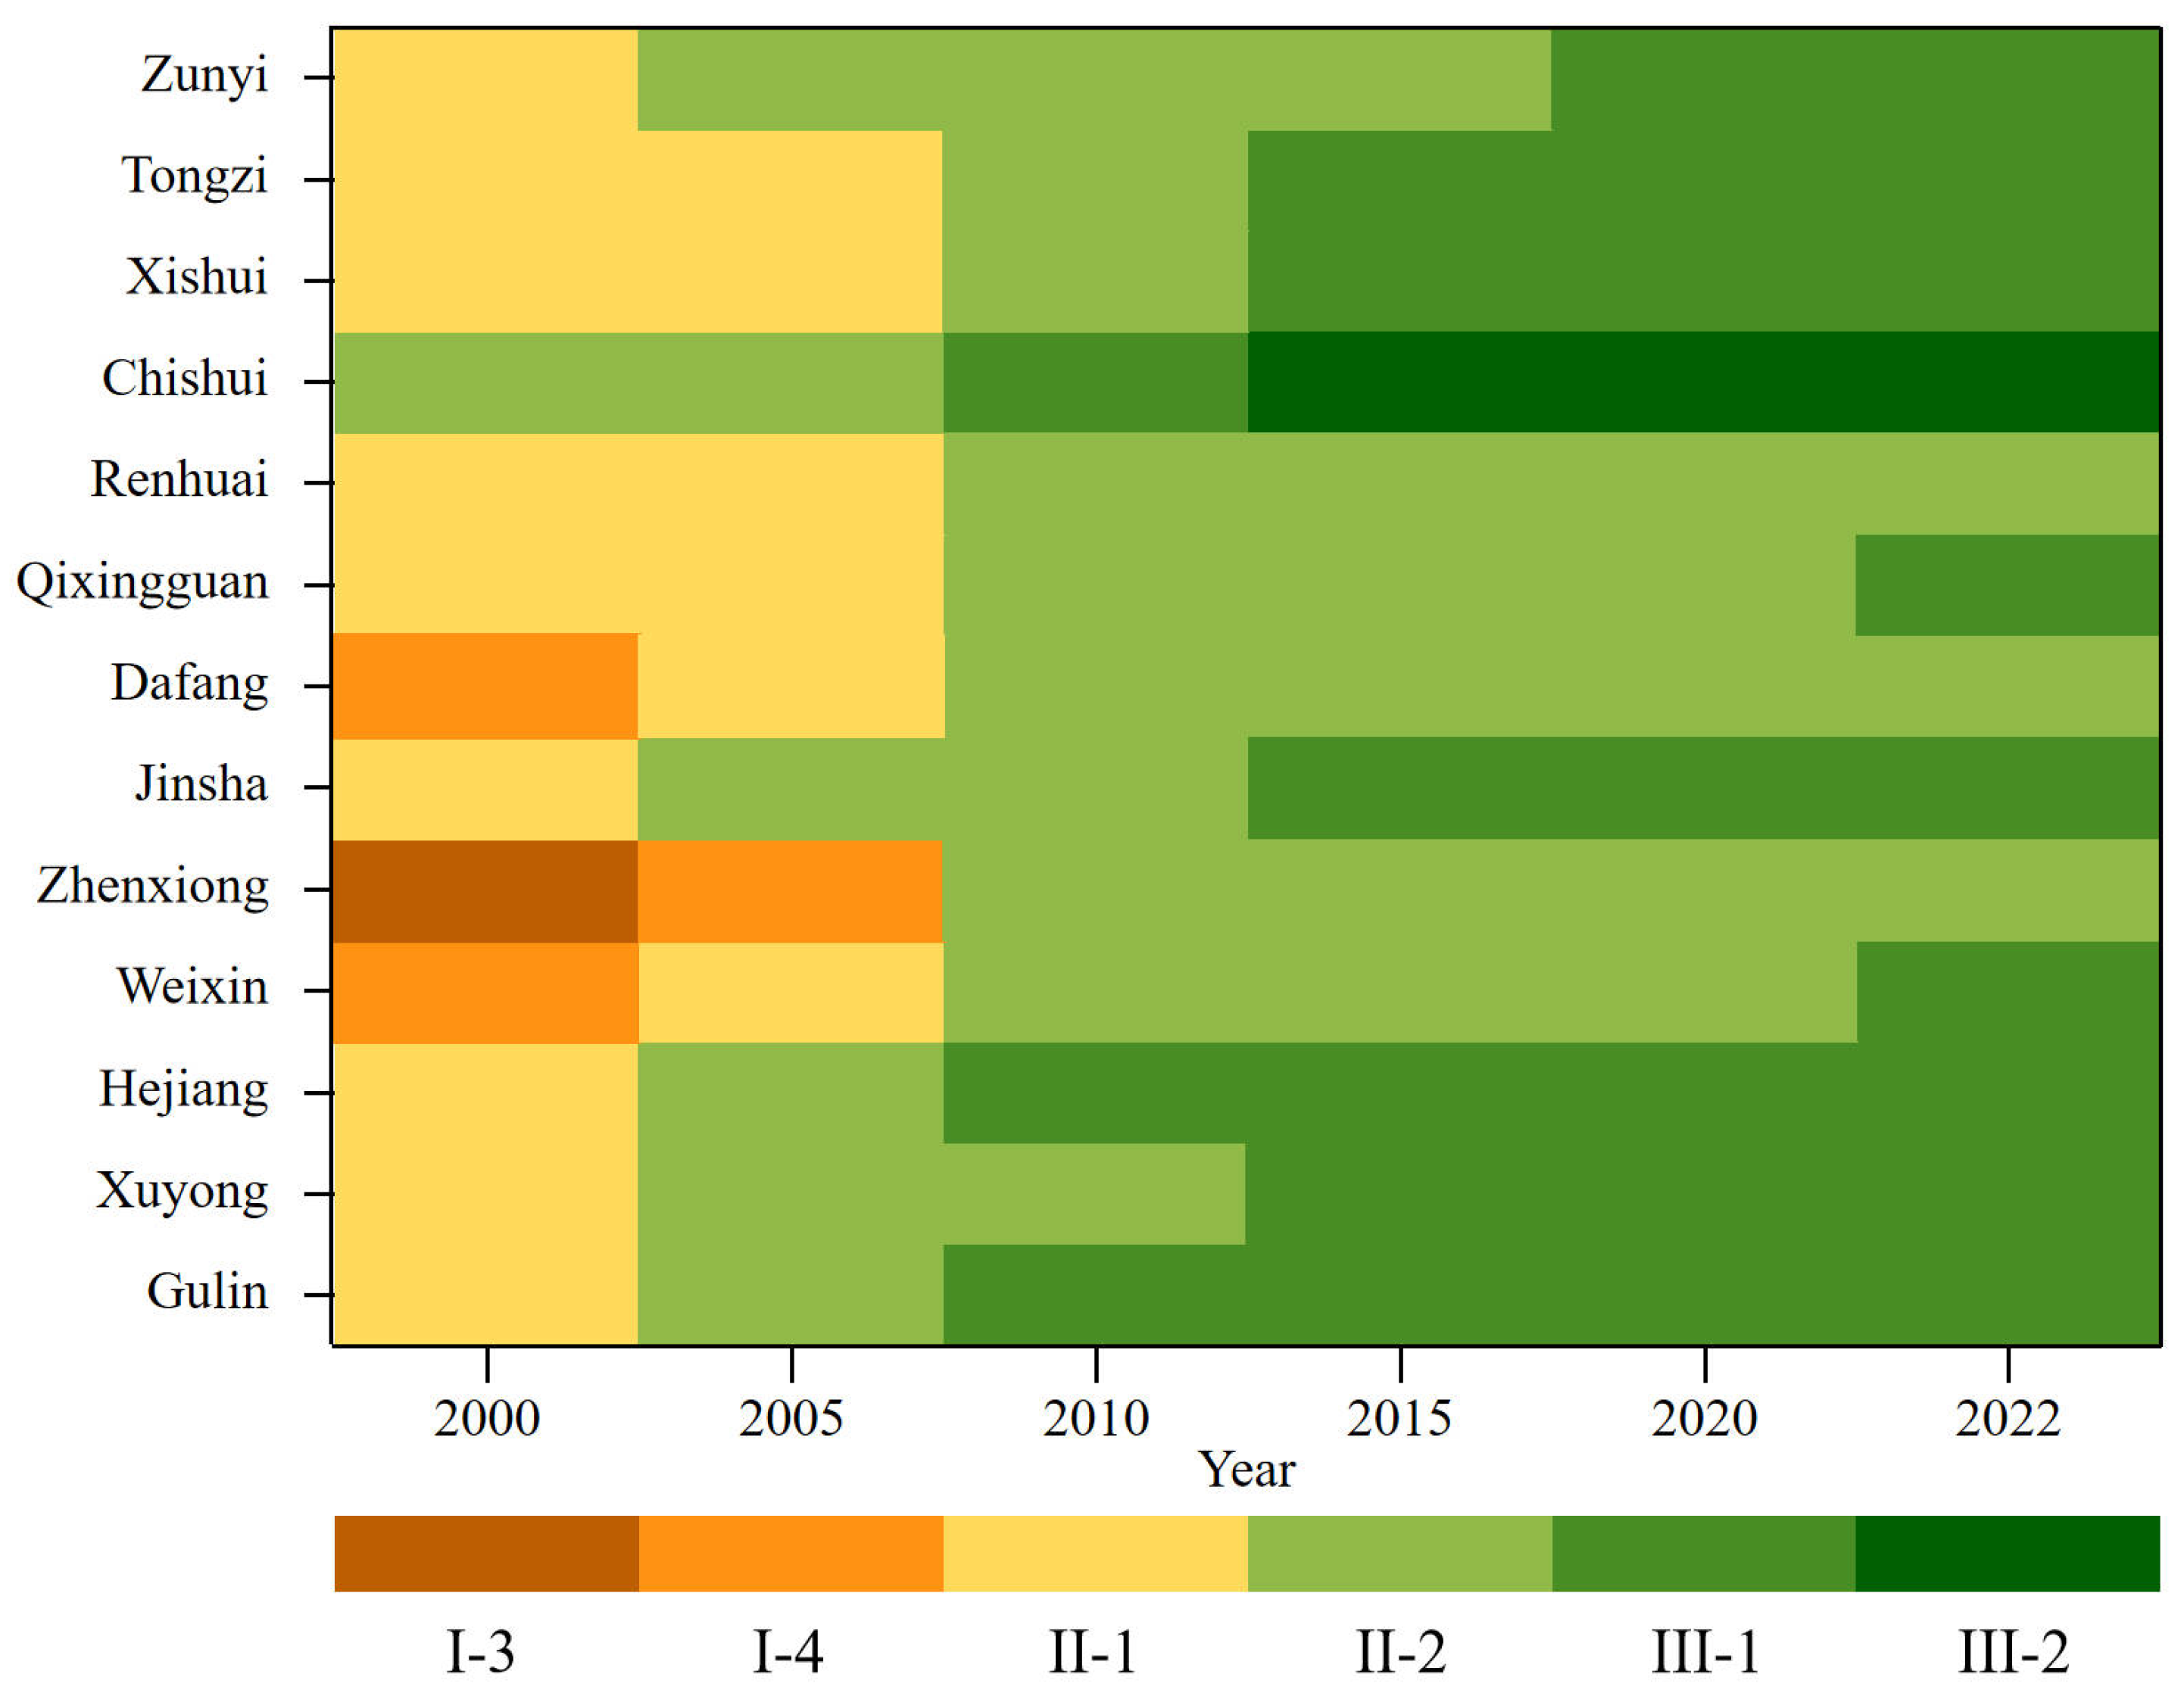
Based on the ICCDM, the CCD between the ecological environment and economic development of 13 counties in the CRB was calculated (Table 3), and the corresponding CCR were illustrated in Figure 6. The results reveal an upward trend in the CCD of the ecological environment and economic development in the CRB, with the average CCD increasing from 0.426 to 0.632 during the study period. The CCR has gradually improved from near imbalance (II-1) to primary coordination (III-1), indicating that the ecological environment and economic development in the basin are progressively transitioning from a disordered state to a coordinated state, with the coupling coordination between the two systems continuously strengthening.
At the county scale, the CCD of the ecological environment and economic development in the 13 counties generally shows a positive growth trend, with the CCR ranging from moderate imbalance (I-3) to moderate coordination (III-2). In 2000, the CCD across counties was generally low, with the CCR predominantly classified as near imbalance (II-1) (9 counties), followed by mild imbalance (I-4) (2 counties), moderate imbalance (I-3) (1 county), and only 1 county attaining barely coordinated (II-2). By 2022, the CCD of all 13 counties had improved significantly, and the CCR had been notably enhanced: 10 counties entered the coordinated development period, including 9 counties at primary coordination (III-1) and 1 county at moderate coordination (III-2), while the remaining 3 counties evolved into barely coordinated (II-2). These findings collectively demonstrate a progressively positive evolutionary trend in the CCR between the ecological environment and economic development in the CRB over the study period.
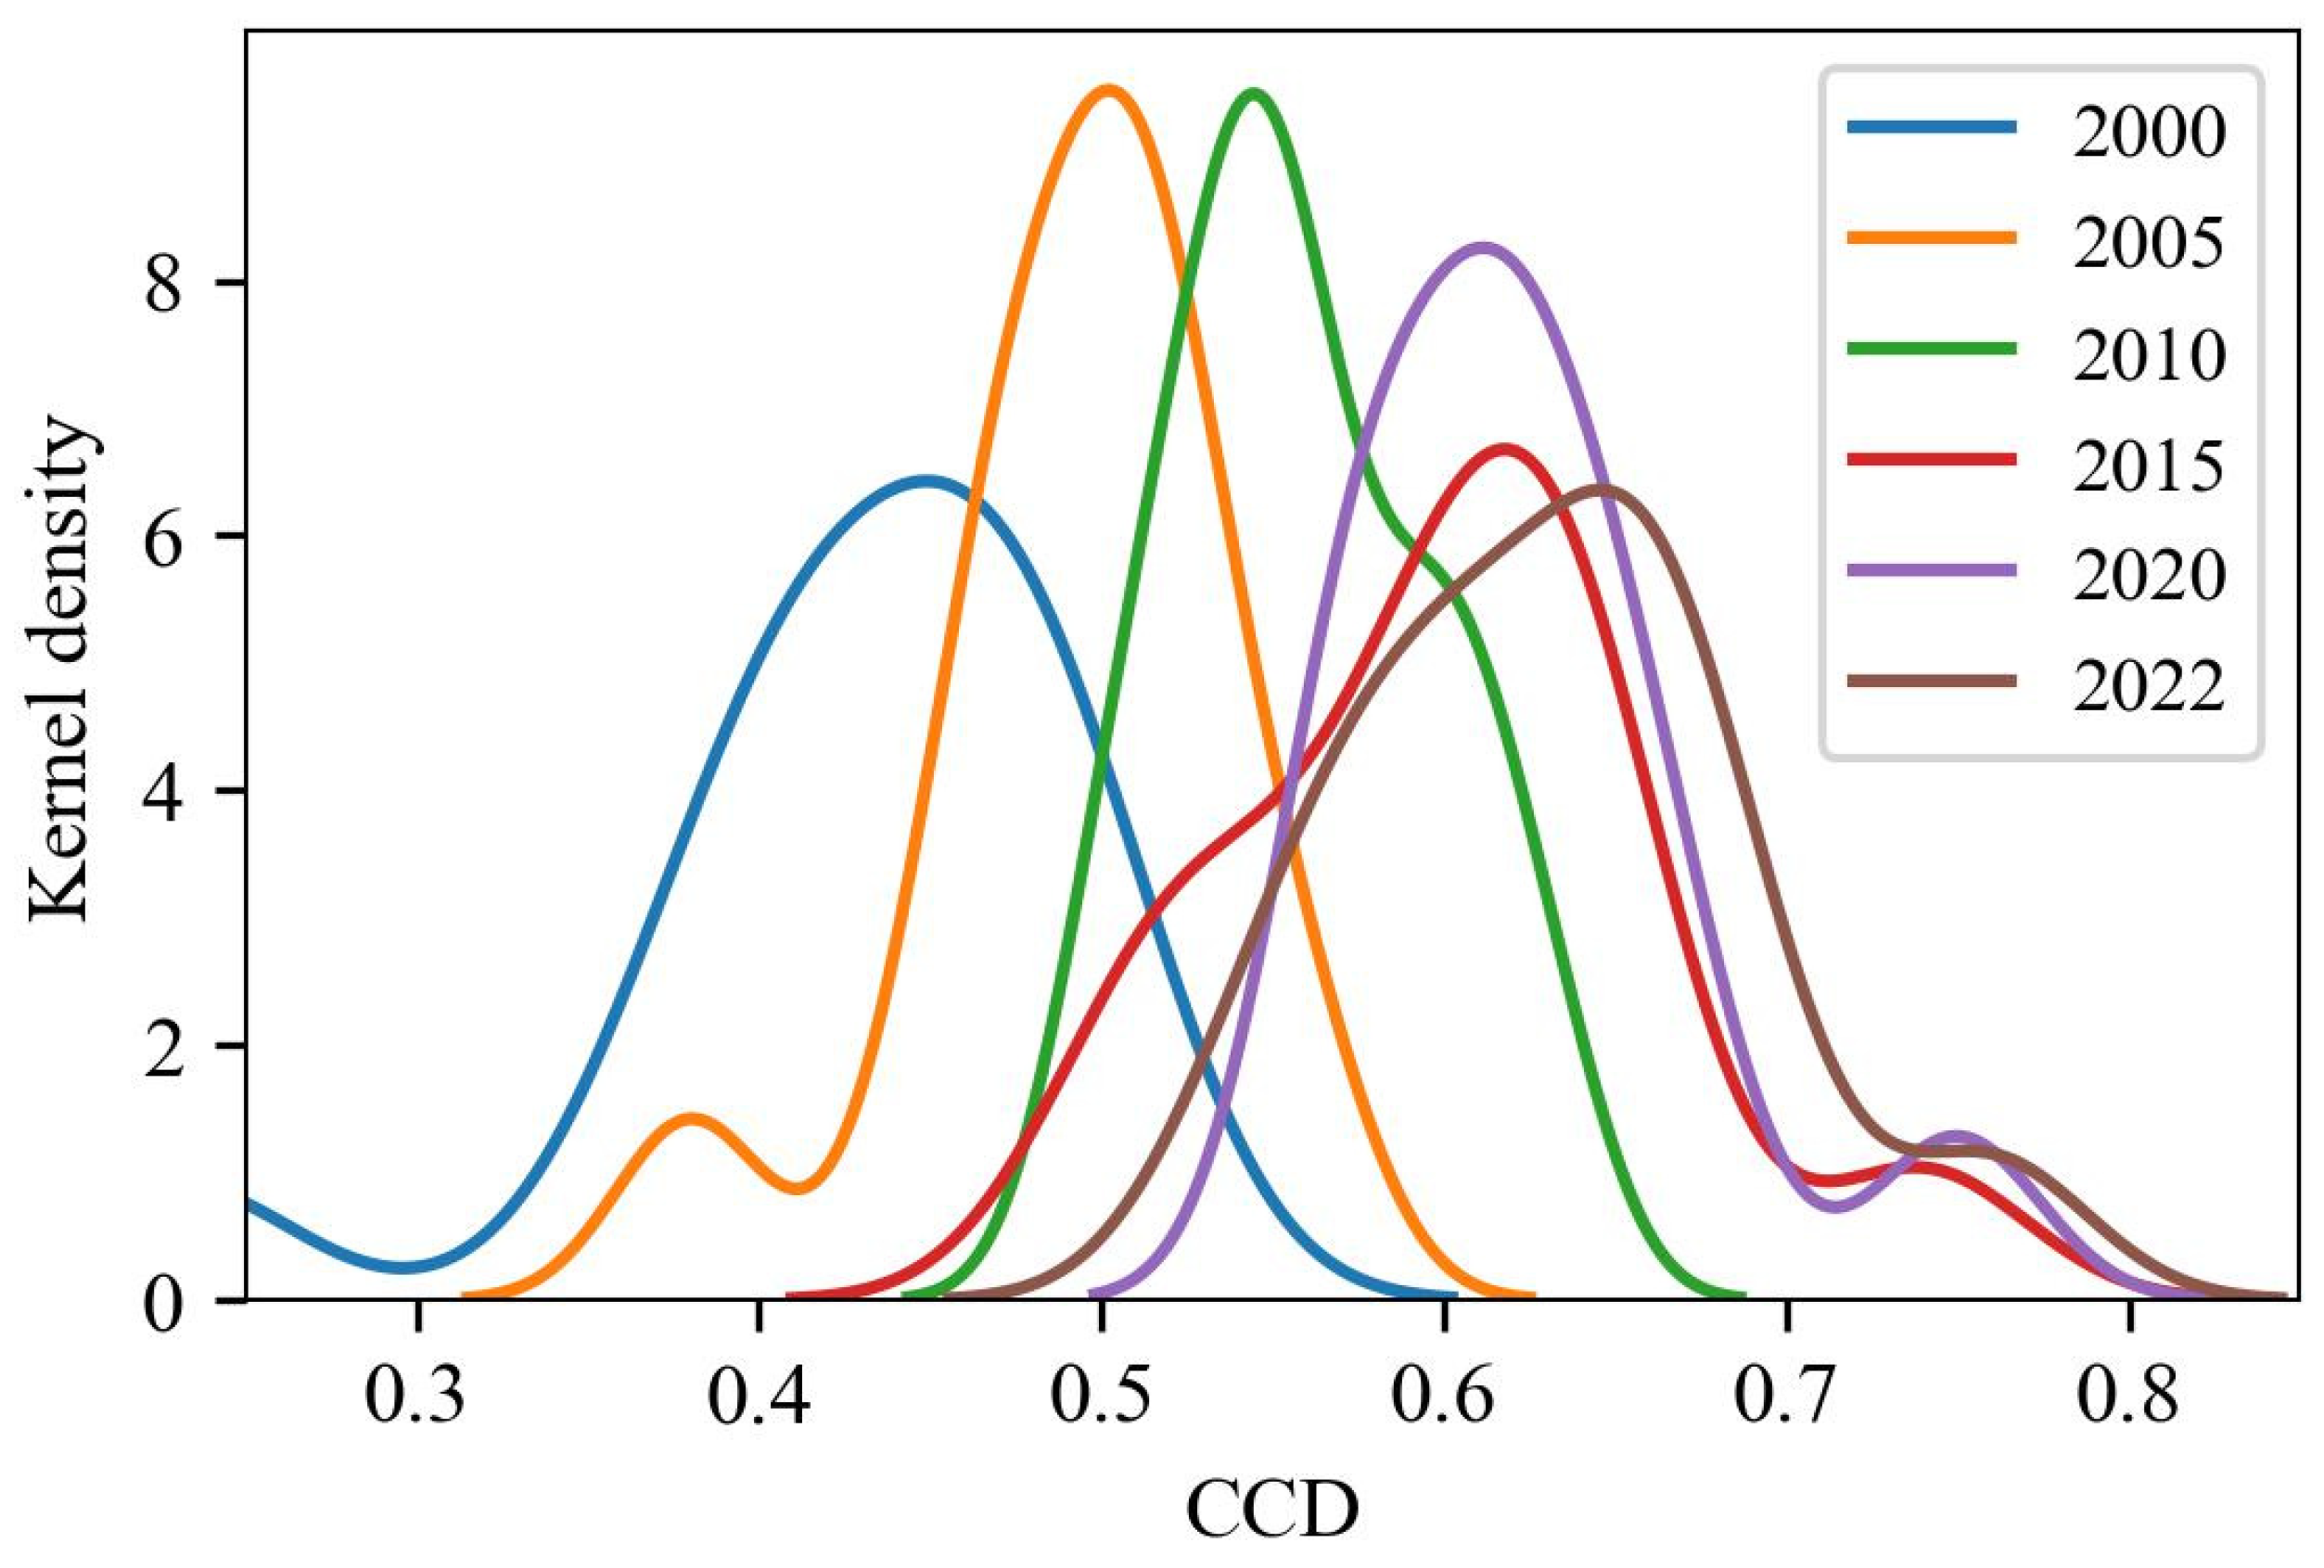
To further investigate the dynamic evolutionary characteristics of the CCR between the ecological environment and economic development in the CRB, this study utilized kernel density estimation to quantitatively assess the temporal progression of the CCD. As illustrated in Figure 7, the primary peak of the kernel density curve progressively shifted rightward throughout the study period, signifying a sustained enhancement in the CCR between ecological and economic systems within the basin. Concurrently, the distribution range of the kernel density curve contracted first and expanded later, indicating that inter-county disparities in coordination level diminished initially and then increased. In summary, although the CCR between the ecological environment and economic development in the CRB exhibited an overall upward trend, recent years have witnessed a pronounced intensification of spatial heterogeneity across the basin.

3.2.2. Spatial Evolution Characteristic

This study employs global spatial autocorrelation analysis to further explore the spatial association characteristics of the CCR between the ecological environment and economic development in the CRB (Table 4). The results demonstrate that the Global Moran’s I indices of the CCD across the study area are consistently positive and statistically significant (Z-Value > 1.96, p-Value < 0.05). These findings indicate that, throughout the study period, the CCD between the ecological environment and economic development in the CRB exhibits a significant positive spatial correlation, characterized by distinct spatial clustering patterns.
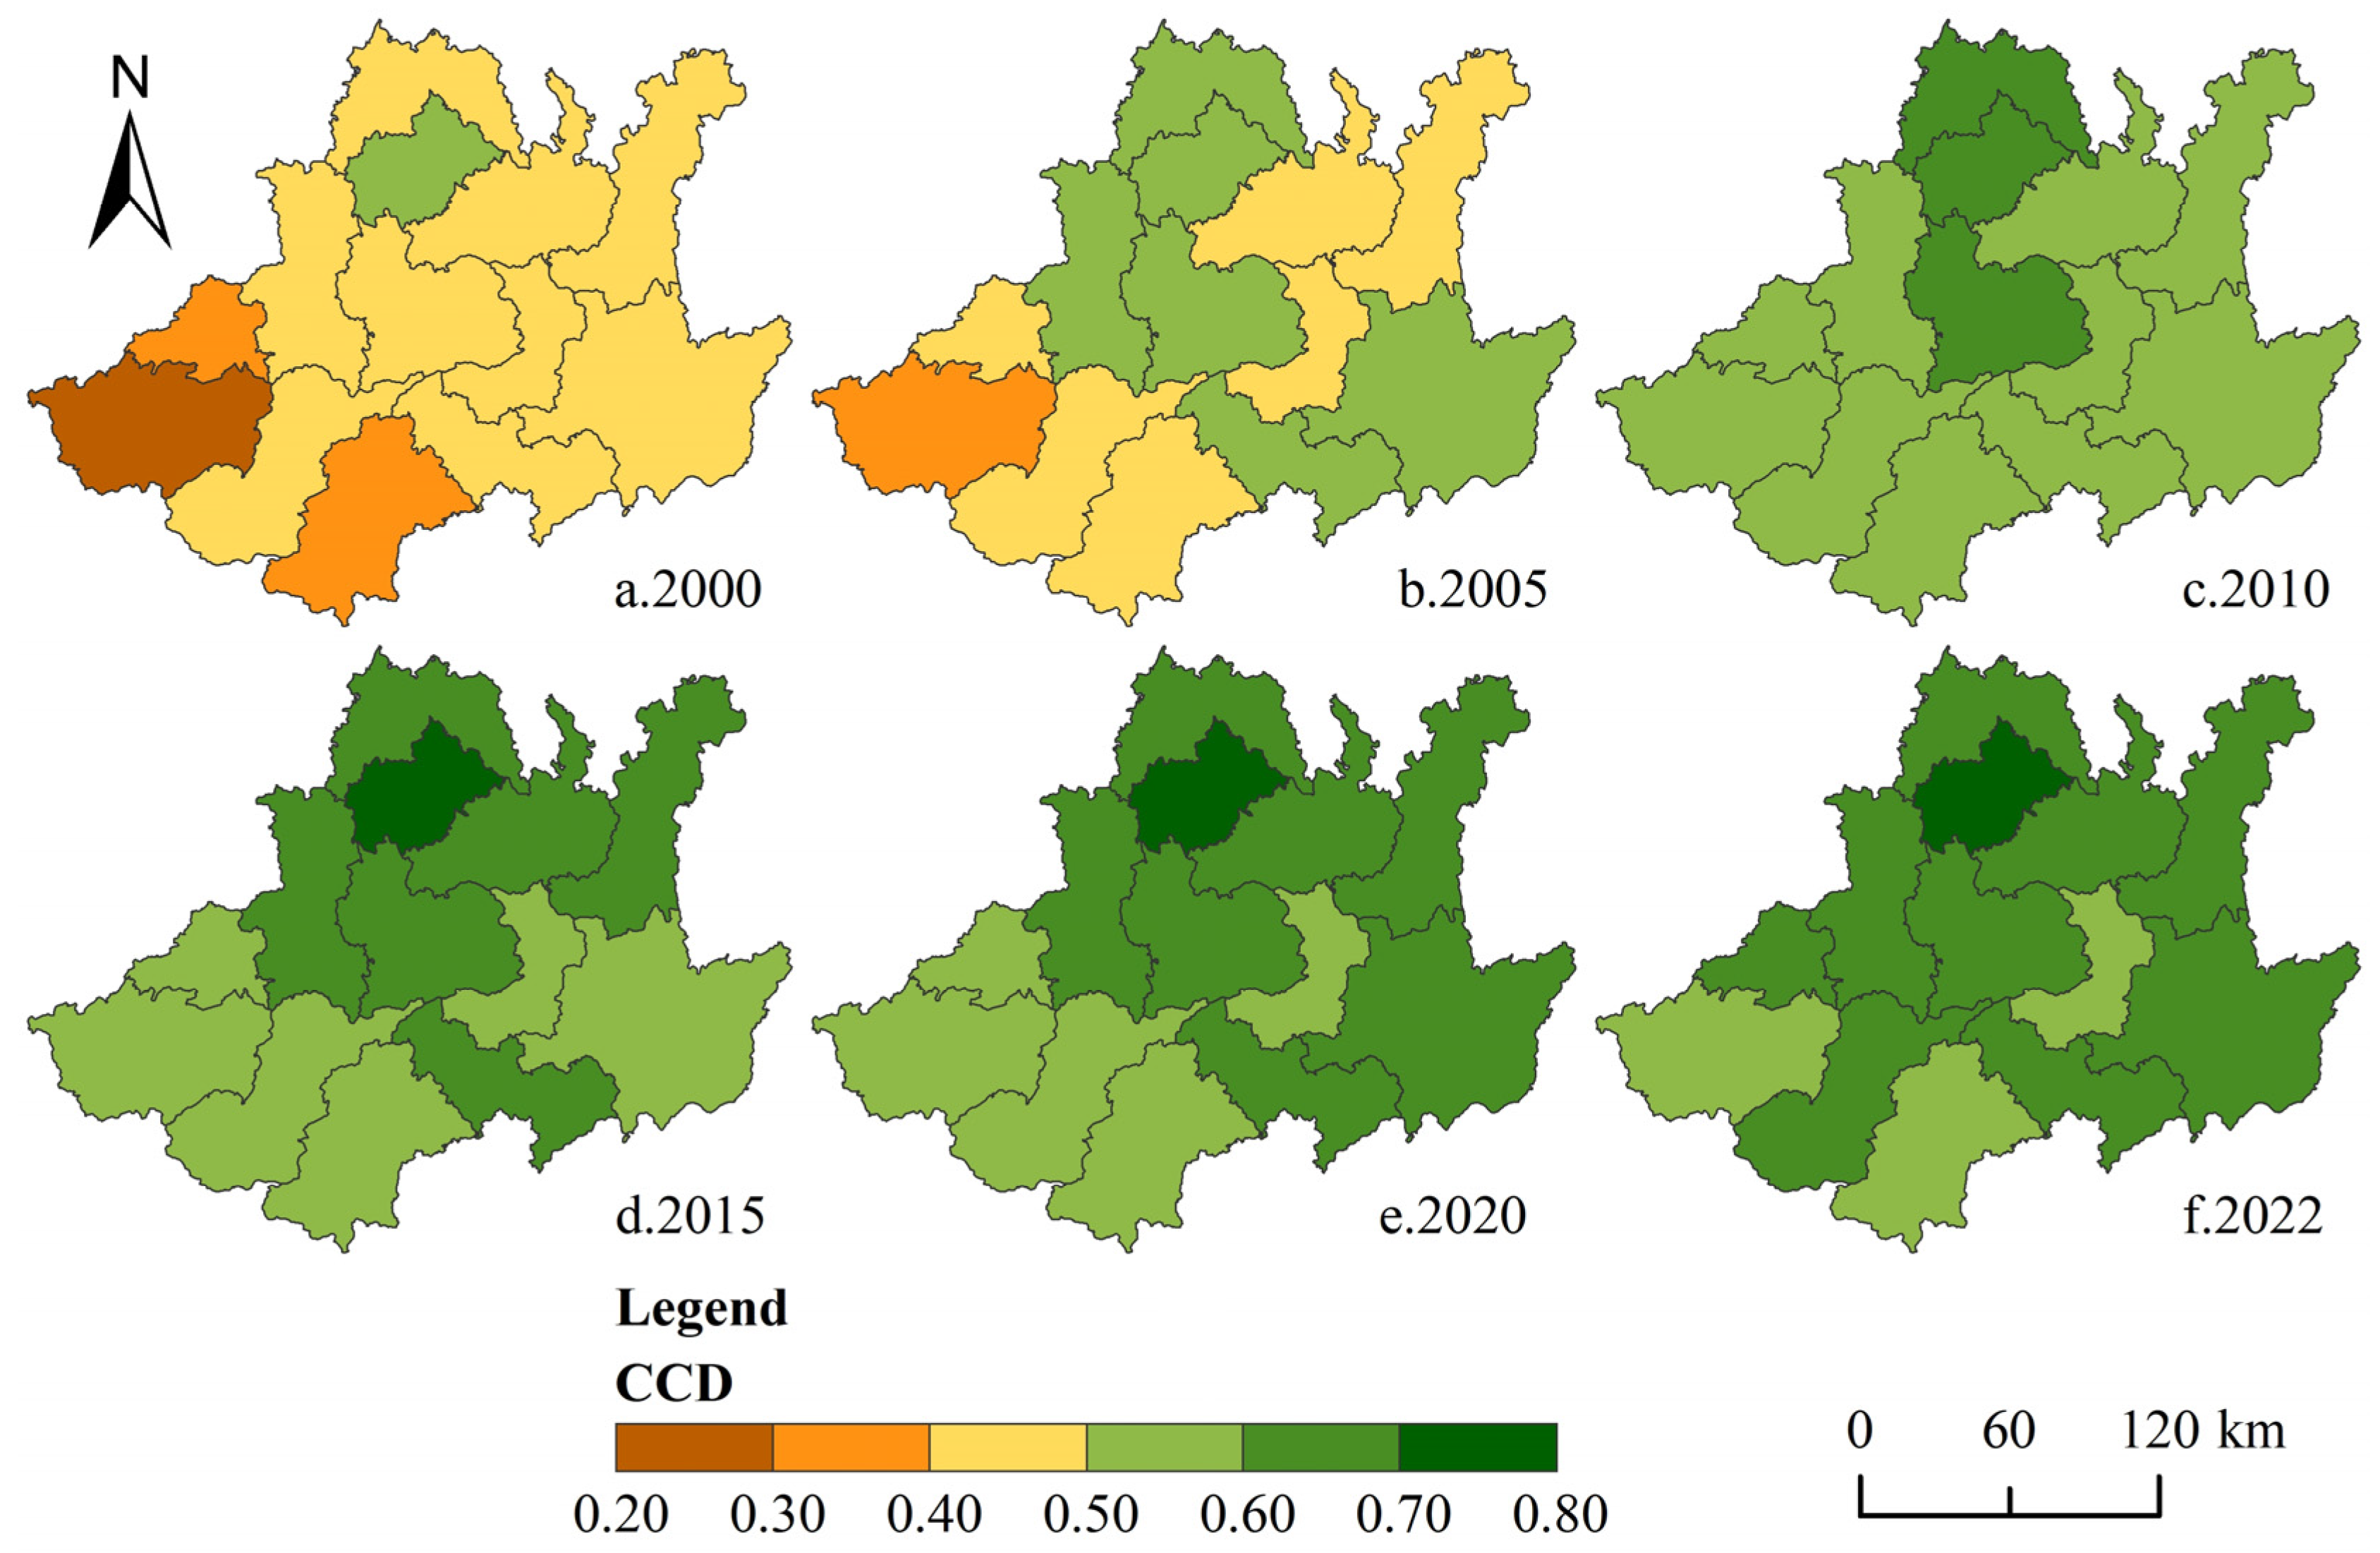
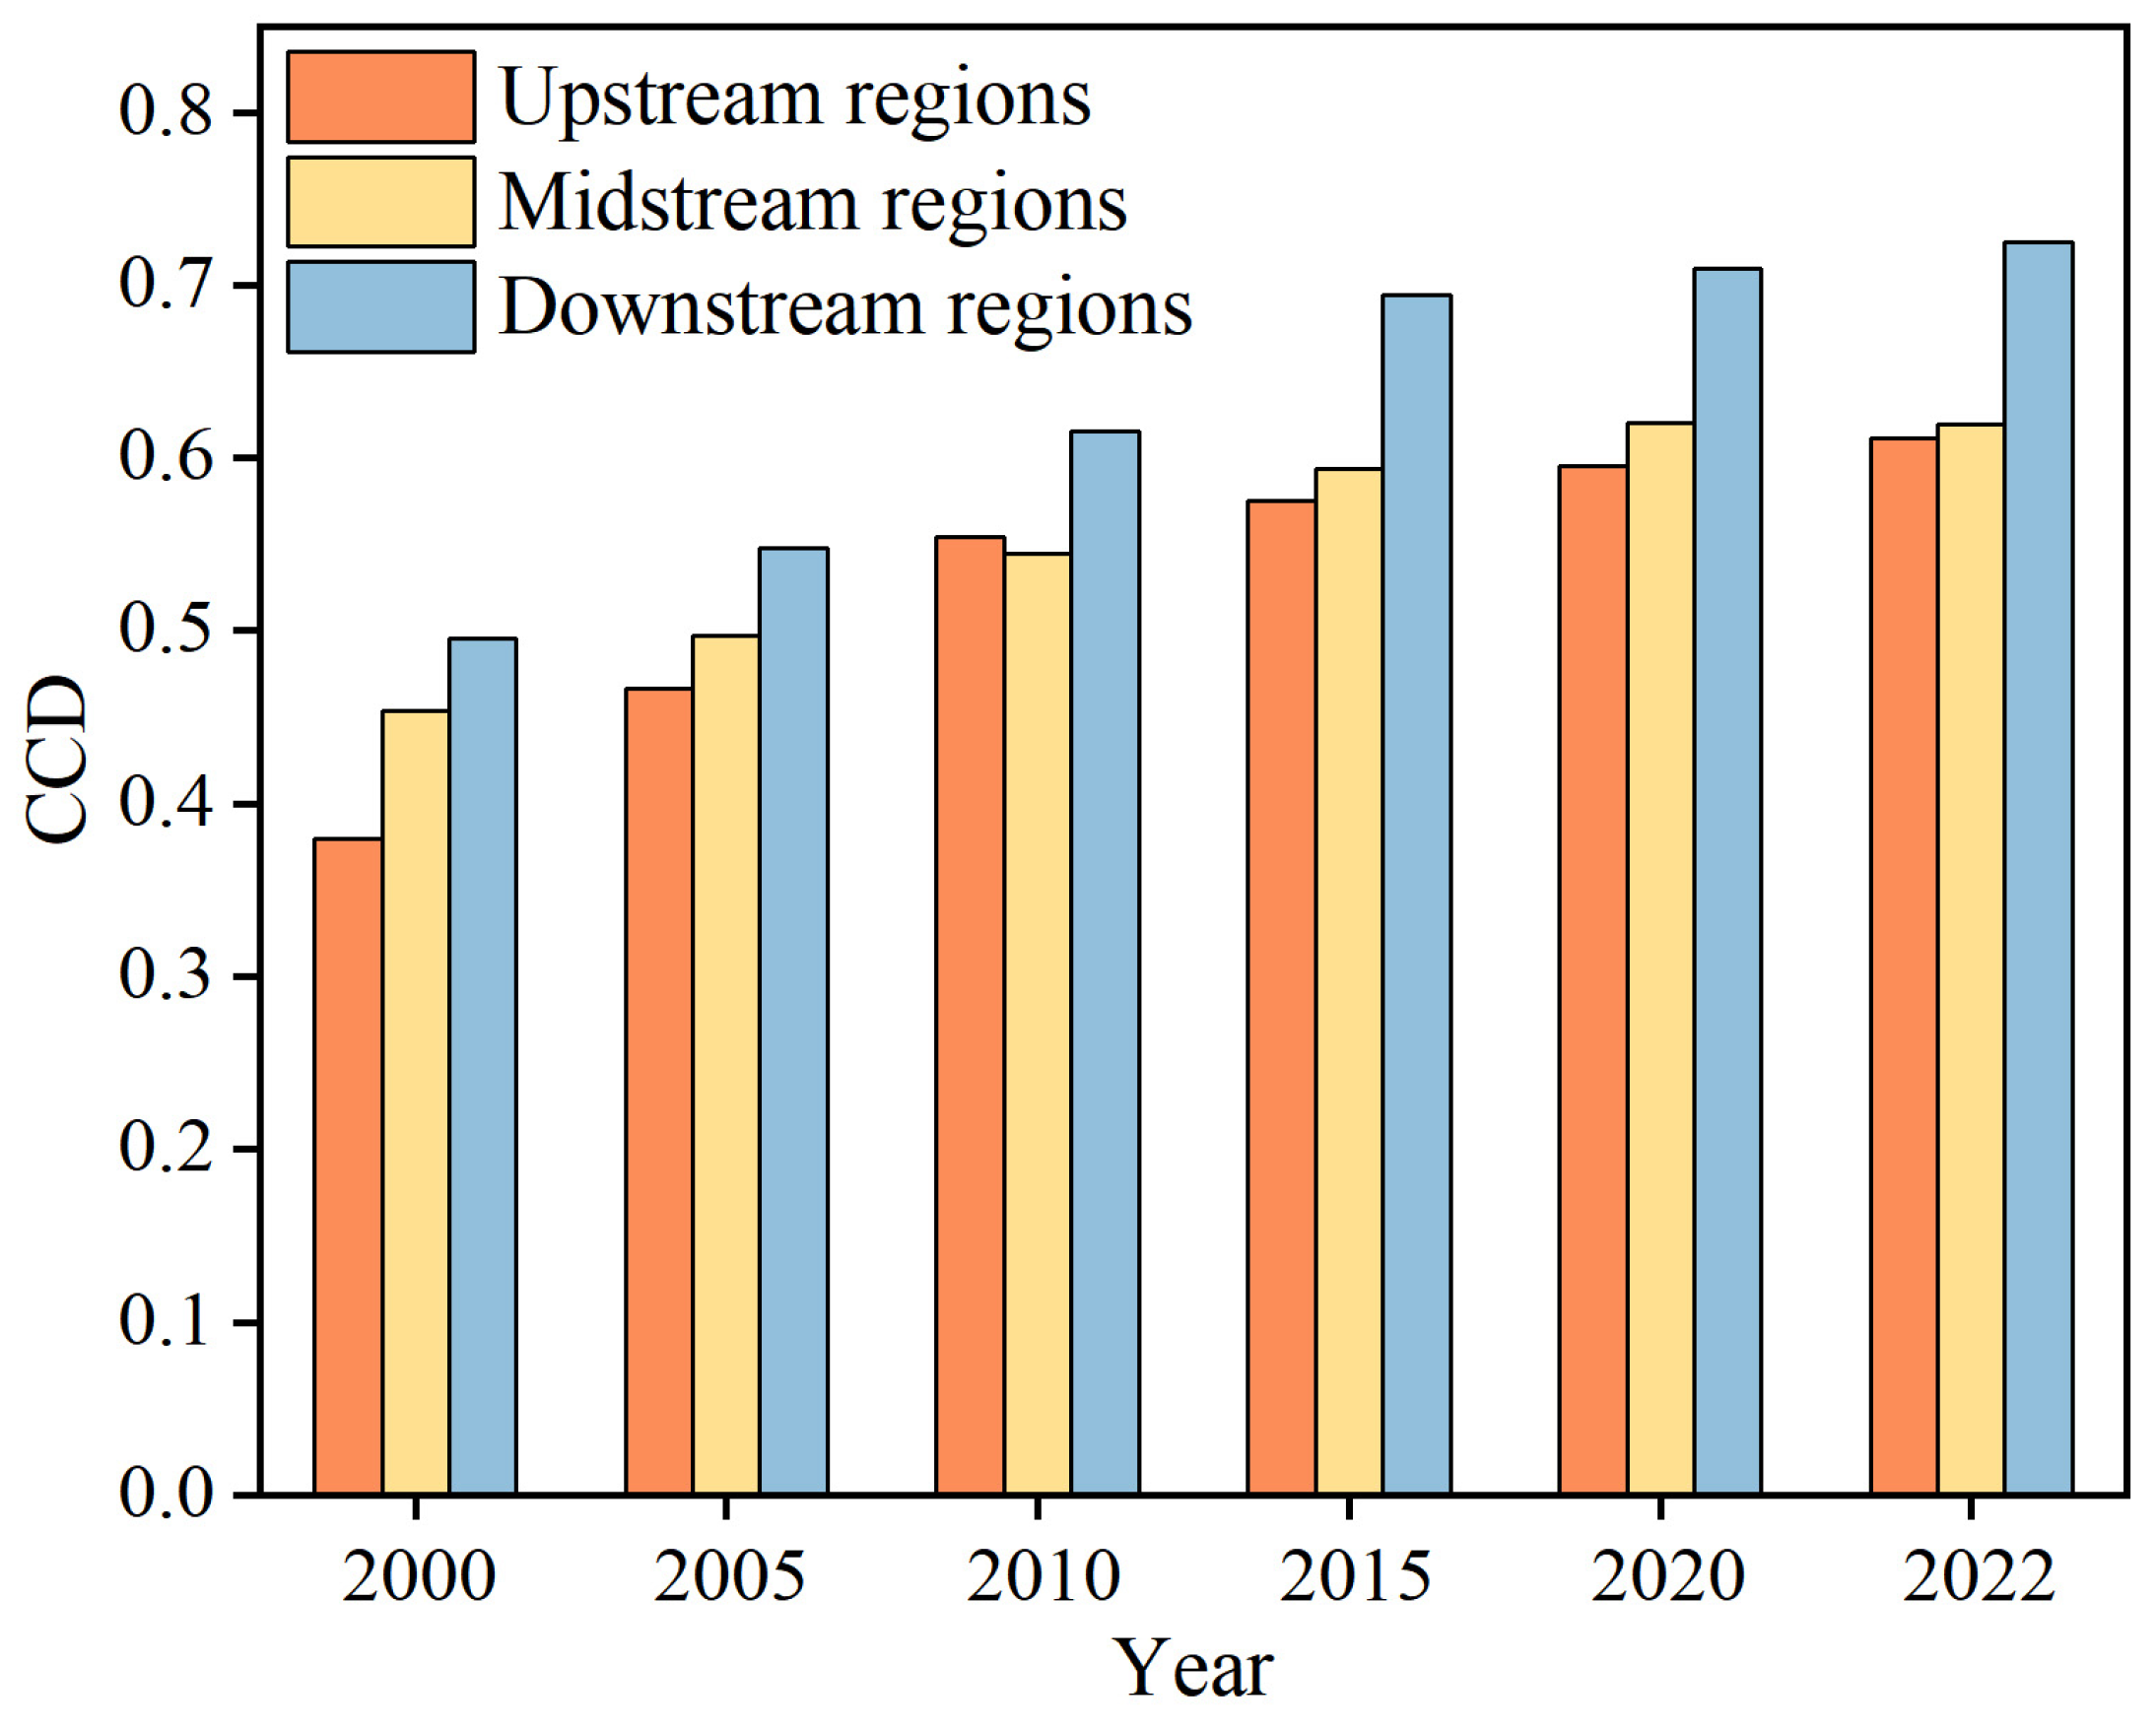
This study employs ArcGIS 10.8 software to generate a spatial distribution map of the CCD between the ecological environment and economic development in the CRB (Figure 8), and computes the average CCD values for counties in the upstream regions, midstream regions, and downstream regions of the basin (Figure 9). An integrated analysis of Figure 7 and Figure 8 reveals that the CCD of the ecological environment and economic development in the CRB exhibits a distinct spatial gradient pattern: downstream regions > midstream regions > upstream regions. During the study period, the CCR in the downstream regions performed the most favorably, entering the coordinated development period (III) as early as 2010. Notably, Chishui stood out, with its CCR advancing to moderate coordination (III-2) by 2015, making it the only county to attain this level throughout the study period. The CCR in the midstream regions mostly evolved from near imbalance (II-1) to primary coordination (III-1), with Renhuai lagging behind and remaining in the transitional development period (II) for an extended period. The CCR in the upstream regions was generally weak; by 2022, counties such as Zhenxiong and Dafang were still in the transitional development period (II). Overall, although the CCR between the ecological environment and economic development in the CRB has gradually improved, its spatial gradient pattern has not undergone substantial changes.

3.3. Diagnosis of Obstacle Factors

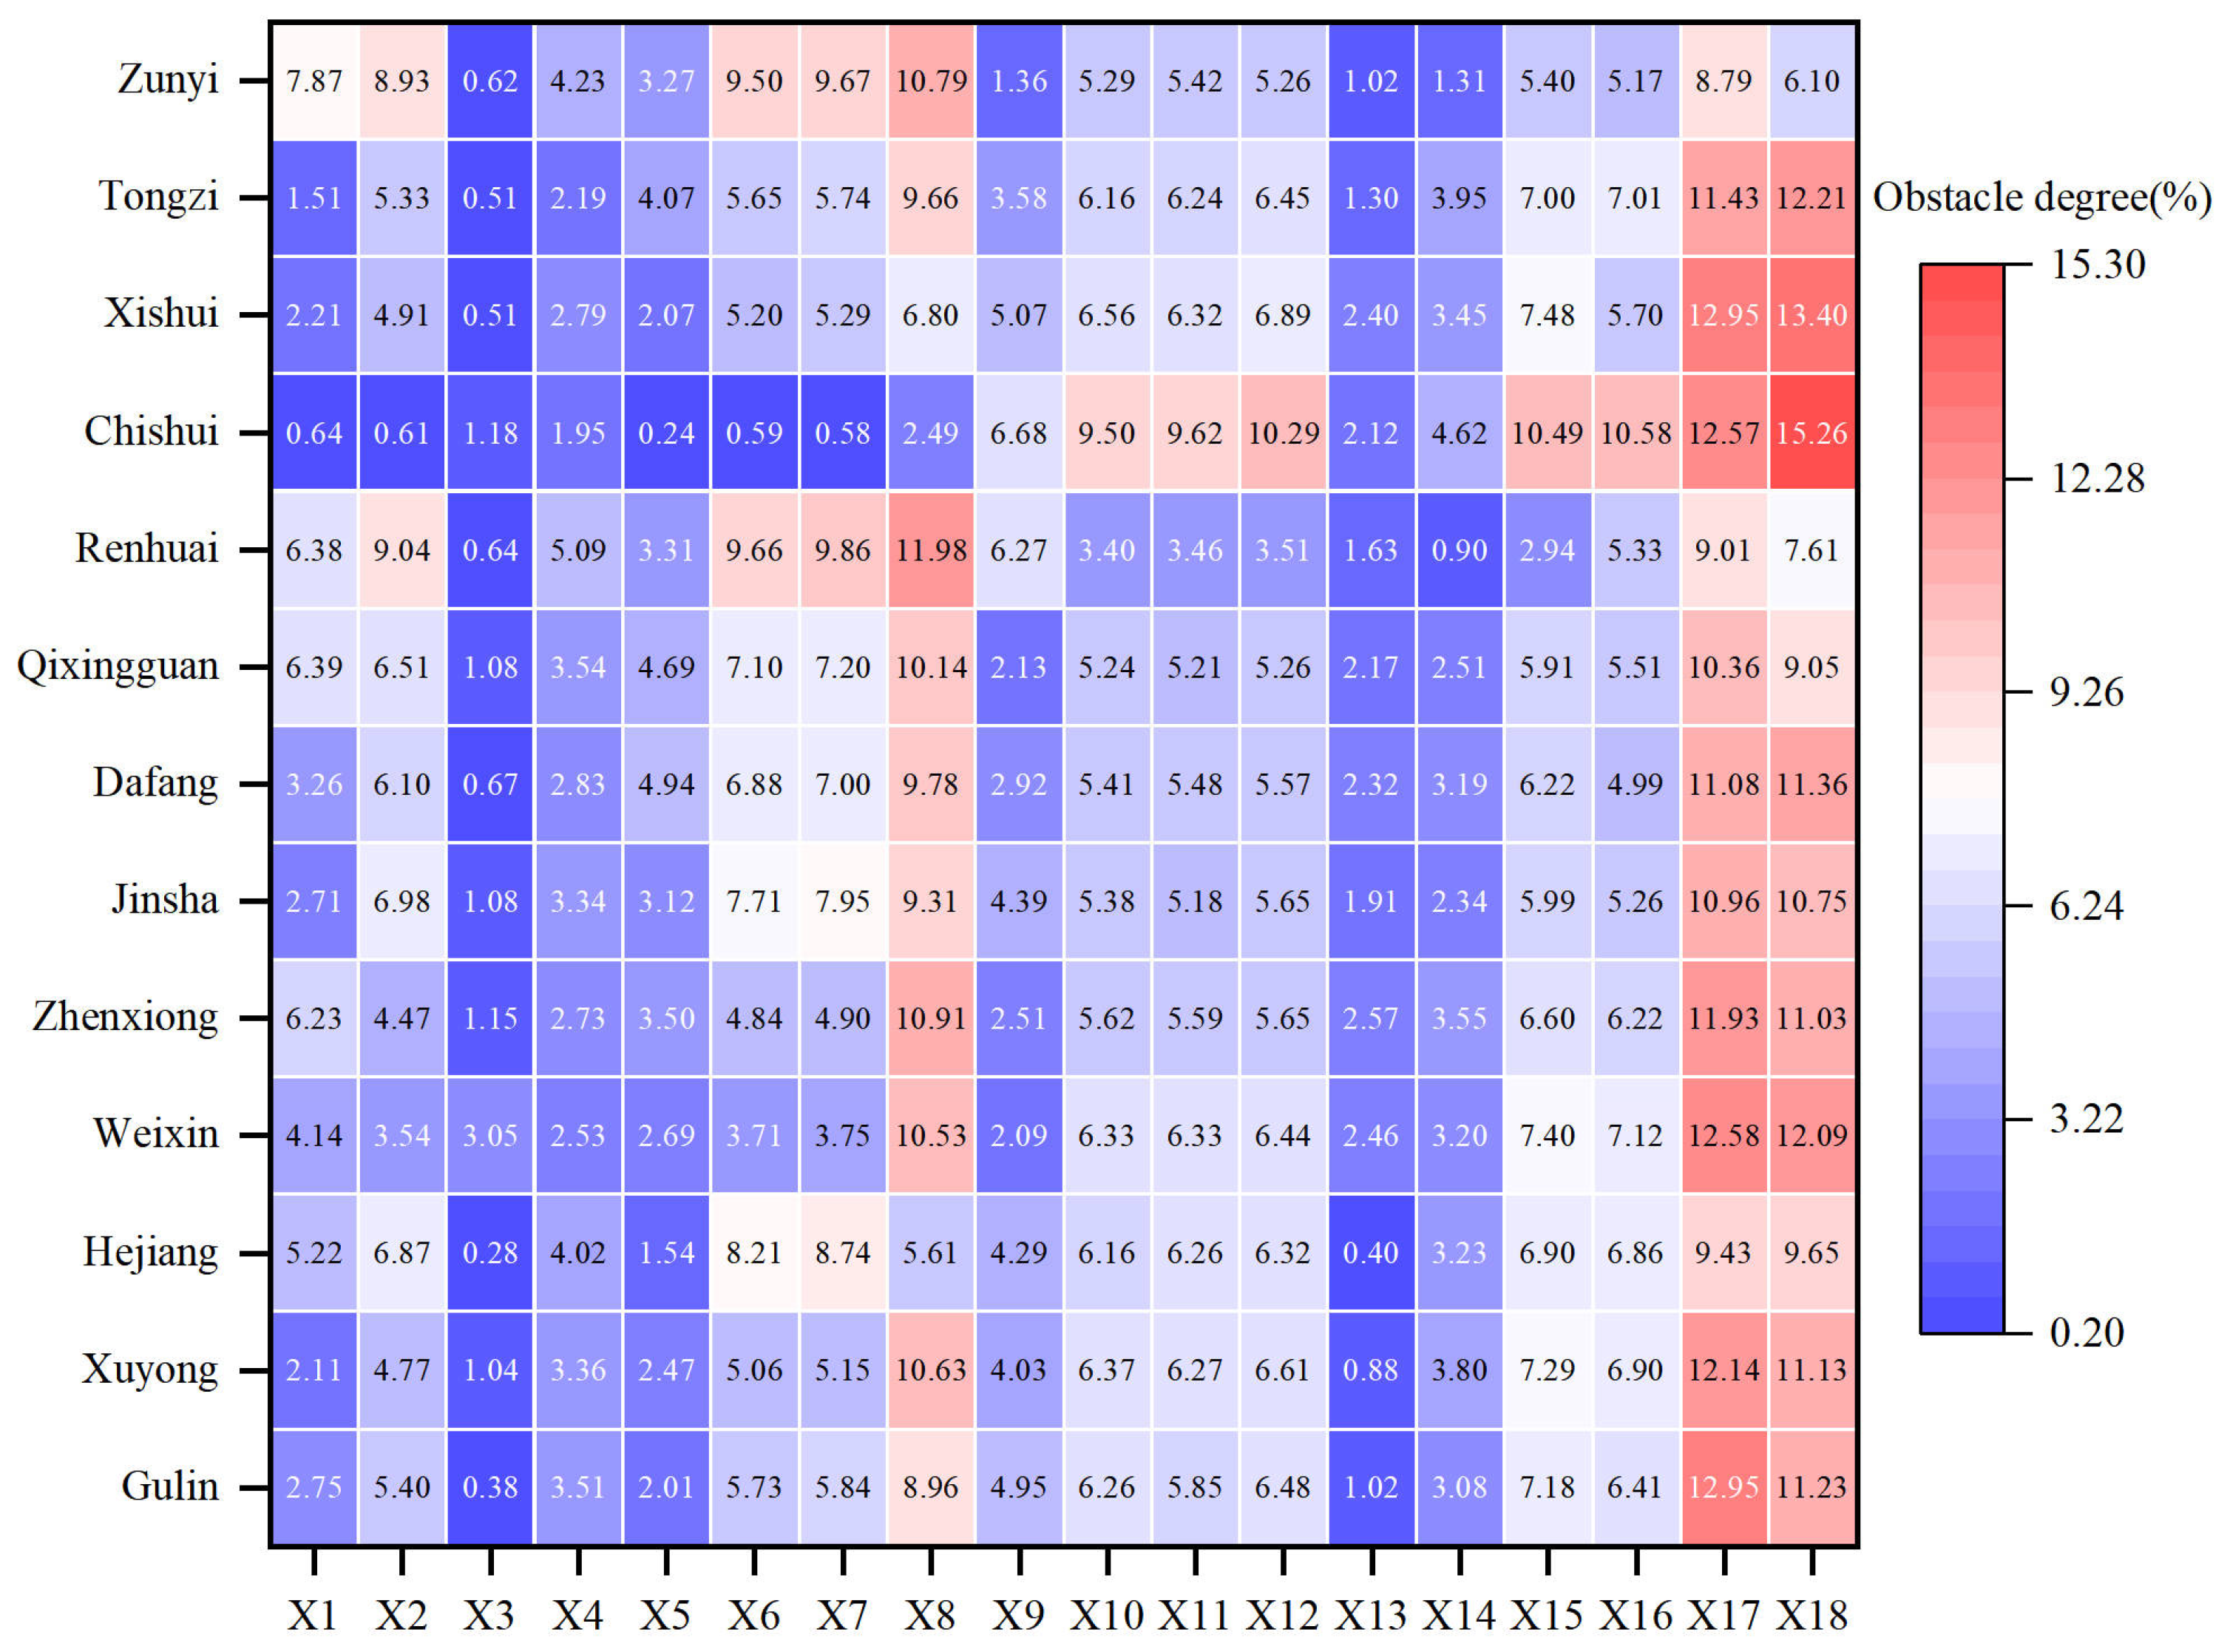
To facilitate the coordinated development of the CRB, it is imperative to further elucidate the key factors impeding the coupling coordination between the ecological environment and economic development. This study employs an obstacle degree model to quantify the obstacle degrees of each evaluation indicator across all 13 counties in the basin. Based on the average values across six time points, Figure 10 and Figure 11 are generated to investigate the obstructive factors influencing the CCR at both the system level and the indicator level.
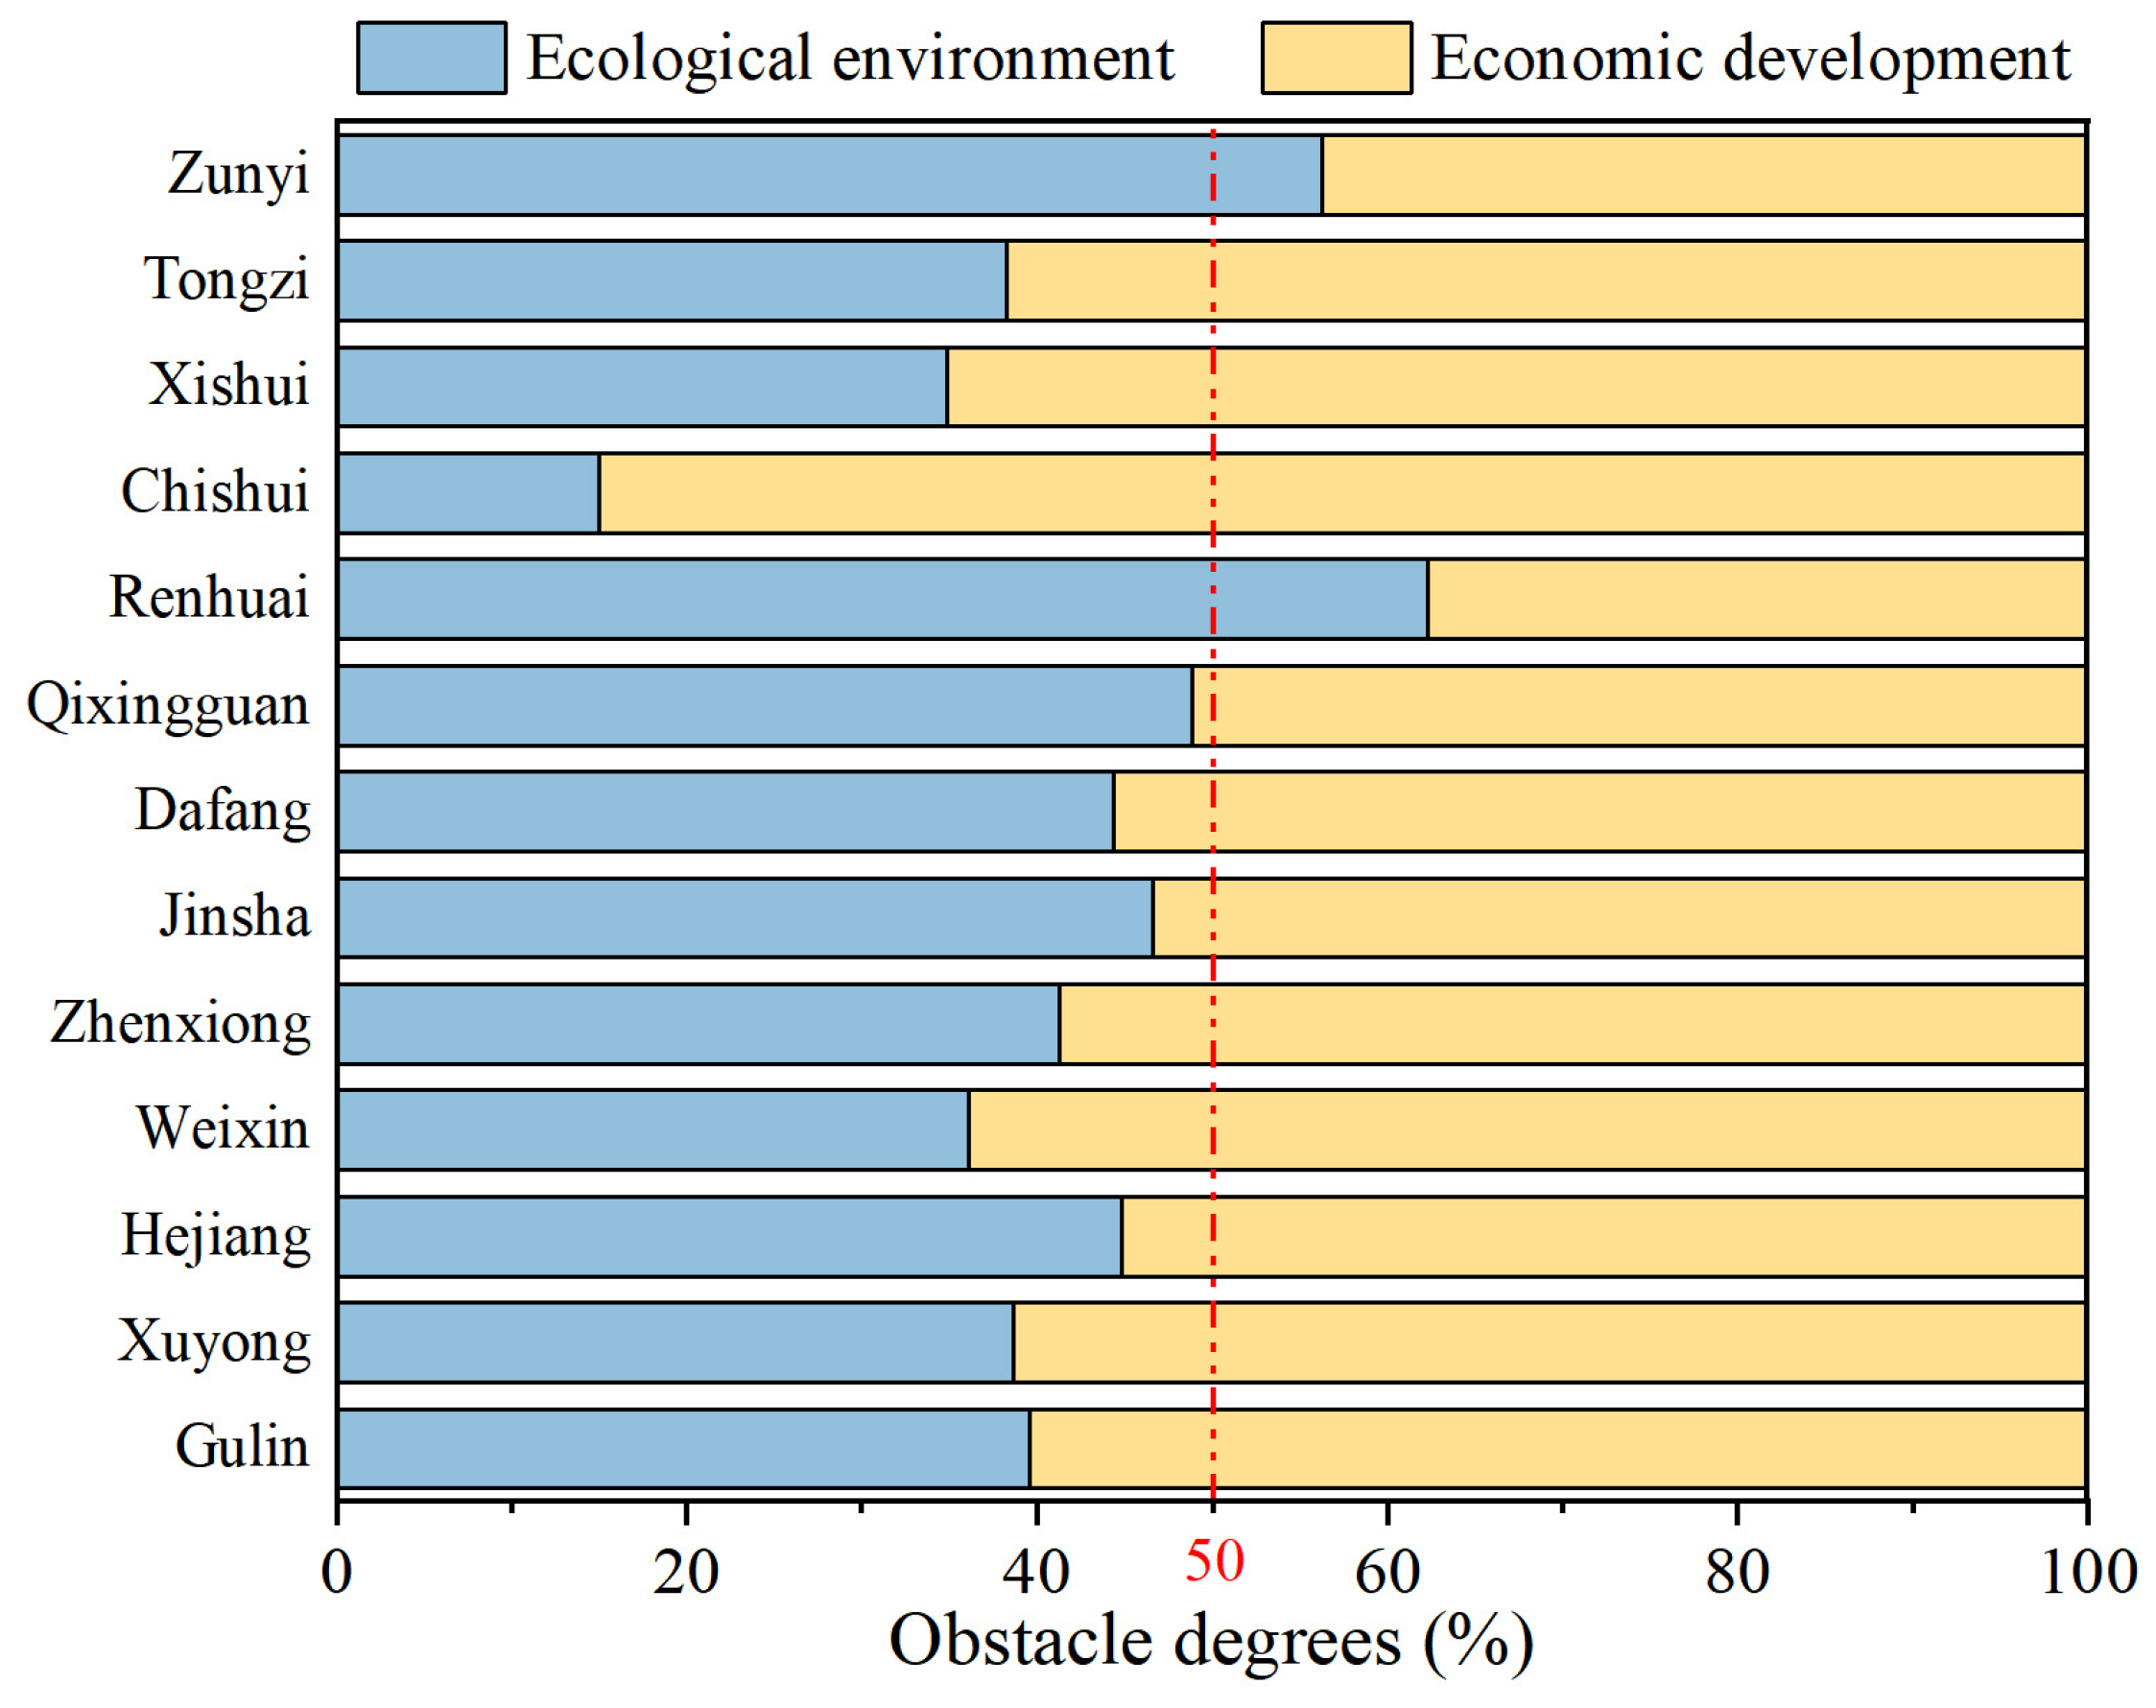
From the system level perspective, the 13 counties in the CRB can be classified into two categories: the ecological environment constraint type and the economic development constraint type (Figure 10). Specifically, Renhuai and Zunyi counties are identified as the ecological environment constraint type, with the obstacle degrees of the ecological environment system measuring 62.23% and 56.24%, respectively. This suggests that the primary constraint on the improvement of CCR in these two regions is the ecological environment system, while the hindrance from the economic development system is relatively minor. This pattern is mainly attributed to their relatively advanced economic development levels, which are accompanied by severe ecological environment lags that impede the enhancement of coupling coordination. Conversely, the remaining 11 counties fall into the economic development constraint type, with Chishui and Xishui counties being particularly notable; the obstacle degrees of their economic development systems are recorded at 85.05% and 65.15%, respectively.
From the indicator level perspective, the obstacle factors impeding the CCR between the ecological environment and economic development exhibit substantial heterogeneity across counties in the CRB (Figure 11). Specifically, the principal obstacle factors in Renhuai and Zunyi counties include the proportion of nature reserve area (X8), forest and grassland coverage (X7), ecological resilience (X6), and land development intensity (X2). These findings imply that strengthening ecological protection and management, as well as optimizing land use structure, are critical strategies to enhance the CCR in these regions. Conversely, the dominant obstacle factors in Chishui and Xishui counties are economic indicators, namely per capita total retail sales of consumer goods (X18), per capita balance of savings deposits (X17), GDP growth rate (X16), and the ratio of regional per capita GDP to national per capita GDP (X15). This suggests that inefficiencies in economic development and structural economic constraints are the primary barriers to improving the CCR in these counties. Furthermore, the obstacle factors in the nine counties (Tongzi, Qixingguan, Dafang, Jinsha, Zhenxiong, Weixin, Hejiang, Xuyong, and Gulin) tend to converge, demonstrating a composite obstacle pattern dominated by economic efficiency challenges with significant ecological impacts. The common leading obstacle factors are per capita total retail sales of consumer goods (X18) and per capita balance of savings deposits (X17), while ecological indicators such as the proportion of nature reserve area (X8) and forest and grassland coverage (X7) also exert substantial obstructive effects. This indicates that the CCR in these counties is constrained by a more complex interplay between economic and ecological factors.

3.4. Analysis of Influencing Factors

3.4.1. Selection of Influencing Factors

This study further applies a panel Tobit model to examine the impact of external environmental factors on the CCR between the ecological environment and economic development in the CRB. Drawing on prior studies [20,54,55] and considering the distinctive ecological characteristics of the study area, eight influencing factors are identified from the dimensions of economic development level, industrialization level, industrial structure, urbanization level, government capacity, ecological endowment, terrain conditions, and landform types. A systematic analysis is then conducted to evaluate the respective impact degrees of these factors on the CCR in the basin.
Specifically, economic development level is proxied by GDP, and industrialization level is measured by the proportion of secondary industry output value in GDP. Industrial structure is quantified by an industrial structure coefficient, which is calculated by assigning weights of 1, 2, and 3 to the proportions of primary, secondary, and tertiary industry output values in GDP, respectively, and then summing these weighted values. Urbanization level is represented by the proportion of urban resident population to the total resident population at the county level. Government capacity is measured by per capita government fiscal expenditure, and ecological endowment is characterized by the proportion of ecological land area to the total area of each county. Given the significant topographical differentiation and diverse geomorphological types in the CRB, two additional indicators—degree of topographical undulation and landform type—are selected for the analysis. Degree of topographical undulation is calculated in accordance with the methodology proposed by Feng Zhiming [56]. For landform type, the 13 counties in the study area are classified into karst landform counties and Danxia landform counties based on the differences in the proportions of karst and Danxia landforms in the total county area. Danxia landform counties are assigned a value of 0, and karst landform counties a value of 1, to facilitate an analysis of the impacts of different geomorphological types on the CCR.
The descriptive statistics of these eight influencing factors are presented in Table 5. Taking these factors as explanatory variables and the CCD as the dependent variable, the panel Tobit model is used to rigorously test the impacts of each factor on the CCR level between the ecological environment and economic development in the CRB. It should be noted that, to mitigate the effects of heteroscedasticity and variability in the panel data, natural logarithmic transformations are applied to all explanatory variables except for the landform types prior to the regression analysis.

3.4.2. Analysis of Regression Results

This study employs Stata 16 software to conduct a panel Tobit regression analysis. The regression results show that the model’s log-likelihood ratio statistic is 157.82, the Wald test statistic is 571.62, and the associated p-value is 0.00. These results indicate that the panel Tobit regression model developed in this study can effectively explain the impacts of various factors on the CCR between the ecological environment and economic development in the CRB. The regression results for these influencing factors are reported in Table 6.
Specifically, (1) The regression coefficient of economic development level on the CCD between the ecological environment and economic development in the CRB is 0.0105, yet this coefficient does not achieve statistical significance. This indicates no significant positive correlation between GDP and CCD, meaning that economic growth has not been accompanied by a noticeable improvement in CCD.
(2) The regression coefficient of industrialization level is 0.0530, which is statistically significant at the 1% level (p < 0.01), denoting a significant positive correlation between industrialization level and CCD. This finding is potentially attributable to the fact that industrial development can improve economic benefits, thereby exerting a positive impact on the CCR.
(3) The regression coefficient of industrial structure is 0.2327, statistically significant at the 5% level (p < 0.05), revealing a significant positive correlation between the optimization and upgrading of industrial structure and CCD. This is likely because industrial upgrading can simultaneously reduce ecological burdens and improve economic efficiency, thus having a positive effect on the CCR.
(4) The regression coefficient of urbanization level is 0.0215 but lacks statistical significance. This shows that although a positive correlation exists between urbanization and CCD, the relationship is not statistically robust, which may be related to the current developmental stage of urbanization in the CRB.
(5) The regression coefficient of government capacity is 0.0265, which is statistically significant at the 1% level (p < 0.01), indicating a significant positive correlation between per capita general public budget expenditure and CCD. Regions with stronger government fiscal capacity tend to have higher coupling coordination levels, which may reflect the positive role of the government in ecological environmental protection and economic development.
(6) The regression coefficient of ecological endowment is 0.1920, statistically significant at the 1% level (p < 0.01), demonstrating a significant positive correlation between the proportion of ecological space in counties and CCD. A higher proportion of ecological space can maintain regional ecological balance through the stable supply of ecological products, the implementation of environmental regulation, and the provision of ecological conservation services, thereby positively influencing the CCR.
(7) The regression coefficient of terrain conditions is −0.0818, which is statistically significant at the 5% level (p < 0.05), indicating a significant negative correlation between terrain undulation and CCD. Specifically, the higher the terrain complexity, the lower the CCD value.
(8) The regression coefficient of landform types is −0.0136, indicating that compared with Danxia landforms, Karst landforms have a negative but statistically insignificant relationship with CCD. In other words, Karst landforms exert a certain inhibitory effect on CCD, yet this effect does not achieve statistical significance.

4. Discussion

4.1. Evaluation Results of CCR

This study integrates remote sensing data with statistical data to systematically assess the ecological environment quality and economic development level of 13 counties in the CRB. The results demonstrate that the ecological environment quality of the basin has steadily improved during the study period, exhibiting a spatial pattern that the ecological environment quality is higher in downstream regions than in midstream regions and upstream regions. These findings are consistent with the analyses conducted by Chen Y et al. [34], Chen H et al. [35], and Zhou S et al. [57], who also adopted remote sensing technology, verifying that the ecological environment evaluation index system established in this study is scientifically valid and representative, and can objectively reflect the ecological environment quality of the CRB. Meanwhile, the economic development level of the basin has increased significantly, but inter-county disparities have gradually widened, which is in line with the conclusions of Sun M et al. [58]. This phenomenon highlights the necessity of attaching importance to coordinated development within the basin. Furthermore, the EEI of the CRB increased by 26.46% during the study period, while the EDI surged by 159.10%, indicating a distinct asymmetric evolutionary trend between the ecological environment and economic development systems in the basin. Similar phenomena have been documented in previous studies [16,59], and the probable cause is that under rapid industrialization and urbanization, factor agglomeration generally drives substantial economic leaps, whereas the effectiveness of ecological environment protection and governance presents a significant time lag, hindering rapid ecological improvement [60]. Notably, although the economic development rate of the CRB exceeds that of ecological environment enhancement, most counties in the basin still show a lag of economic development relative to ecological quality due to the weak economic foundation.
The study also reveals that the overall coupling coordination level of the CRB is relatively low with significant spatial heterogeneity. Although most counties have entered the stage of coordinated development, they are merely at the Primary coordination level, while counties such as Renhuai and Dafang have long been stuck in the Barely coordinated state. This assessment uncovers an intriguing phenomenon: counties with high economic development levels (e.g., Renhuai) have a relatively low CCD, whereas counties with moderate economic development levels (e.g., Chishui) present a superior CCD. This “dislocation” phenomenon suggests that the relationship between CCD and economic growth is not simply linear [20], which profoundly reflects the internal developmental disparities within the CRB. Renhuai has achieved economic leaps relying on the baijiu industry and has become an economic highland in the basin. However, population concentration, urban expansion and pollution emissions have exerted tremendous pressure on the ecological environment system [1], thereby inhibiting the enhancement of CCD. In contrast, Chishui boasts favorable ecological endowments, and its economy is dominated by tourism, which imposes a relatively minor impact on the ecological environment, thus facilitating a high-level coupling coordination. This indicates that the improvement of CCR depends not only on economic development but also on the compatibility between economic growth and the ecological environment, as well as the ecological effects of different industrial types.

4.2. Influencing Factors of CCR

This study adopts the obstacle degree model and panel Tobit model to investigate the influencing factors of the CCR between ecological environment and economic development in the CRB from both internal and external dimensions. The obstacle degree model is highly consistent with the CCDM [61] and serves as a critical method for identifying key internal factors that restrict CCD. The panel Tobit model is a widely used regression approach for dealing with censored dependent variables [62], which can effectively avoid estimation bias caused by ordinary regression models. Since the CCD values calculated in this study range from 0 to 1, representing a typical censored variable, the panel Tobit model is the most appropriate and objective selection [53].
From the perspective of internal constraints, the 13 counties in the CRB can be classified into two categories: ecological environment-constrained and economic development-constrained. Specifically, Renhuai and Zunyi are identified as ecological environment-constrained counties. The main factors impeding the improvement of their CCR include the proportion of nature reserve area (X8), forest and grass coverage rate (X7), ecological resilience (X6), and land development intensity (X2). This result further explains why their CCR is not optimal despite the high level of economic development. The remaining 11 counties are economic development-constrained, among which Chishui and Xishui show particularly prominent economic obstacles. This is mainly attributed to their status as national key ecological function zones [10], where the overall ecological environment quality is relatively high and CCR is mainly restricted by economic development. The nine counties of Tongzi, Qixingguan, Dafang, Jinsha, Zhenxiong, Weixin, Hejiang, Xuyong, and Gulin present a comprehensive obstacle pattern dominated by economic constraints with considerable ecological responses. These counties were once part of the Wumeng Mountain contiguous poverty-stricken area, one of the poorest regions in China. Although absolute poverty was eliminated by the end of 2020 [63], these counties still suffer from economic underdevelopment. Meanwhile, they exhibit high ecological vulnerability [64], facing complex eco-economic challenges.
For external influencing factors, industrial structure imposes the most significant impact on CCD, indicating that industrial structure upgrading can effectively improve the CCR between the ecological environment and economic development. This may be because industrial upgrading reduces pollution emissions and energy consumption, and promotes technological innovation, thereby facilitating the coordinated development of ecological protection and economic growth [65]. Ecological endowment, measured by the proportion of ecological land area at the county level, also significantly affects CCD. Ecological land provides vital ecosystem services and plays an indispensable role in maintaining regional ecological balance and sustainable development [66]. Therefore, coordinating production, living, and ecological spaces at the county level and increasing the proportion of ecological space can substantially enhance the coupling coordination level. The industrialization level also exerts a notable influence on CCD. Although industrial development is often regarded as detrimental to the ecological environment [67], industry remains the economic backbone for most regions, especially economically underdeveloped areas [20]. Hence, appropriate and orderly industrial development is conducive to improving the CCR in the CRB. Government capacity determines the intensity of government intervention in ecological protection and economic development [55]. Against the background of China’s active promotion of ecological civilization, the CRB has established the first cross-provincial horizontal ecological protection compensation mechanism in China. Yunnan, Guizhou, and Sichuan provinces have successively issued special protection regulations for the CRB [68], demonstrating the proactive role of the government in the coordinated eco-economic development of the basin. Terrain condition represents a major inhibitory factor for CCD. The CRB is located in the transition zone between the Yunnan-Guizhou Plateau and the Sichuan Basin. Especially in the midstream and upstream regions, high altitude and complex terrain restrict socio-economic activities and shape the types of ecological environment [57], thus imposing a negative effect on CCD.
It is worth noting that urbanization level and landform type have no statistically significant impact on the CCR in the CRB, which is inconsistent with expectations. Urbanization is a process of population, resource, and industrial agglomeration, accompanied by negative impacts such as the encroachment of ecological space by construction land expansion and concentrated pollutant discharge [69]. However, it also brings advantages including improved resource utilization efficiency and agglomeration economy, which support sustainable eco-economic development [55]. The insignificant promoting effect of urbanization in this study may be due to the relatively low overall urbanization level during the study period, which failed to realize the coordination of population, land, resources, and industrial development. Under the guidance of the new-type urbanization strategy, future development should focus on connotative urban development and achieve coordinated socio-economic and ecological development through intensive and efficient approaches. Karst landform is widely featured by fragmented and infertile land, scarce available resources, fragile ecological environment, high population pressure, and lagging economic development [70], which severely restrict regional sustainable development. Related studies have shown that the ecological health of the Danxia area in the CRB is better than that of the karst area [35]. Our empirical results further confirm that karst landform inhibits the coupling coordination level compared with Danxia landform. Although the inhibitory effect is not statistically significant, which may be related to the limited sample size, it still reflects the potential constraint of geomorphological differences on the coordinated development of the regional eco-economic system. Therefore, future efforts should strengthen ecological protection and governance in karst areas to further improve the CCR in the CRB.

4.3. Policy Suggestions

To enhance the CCR between the ecological environment and economic development in the CRB, this study puts forward the following policy recommendations based on the above results.
First, Renhuai and Zunyi should leverage their economic advantages to strengthen the research, development and application of green technologies, promote industrial upgrading and green transformation, and reduce resource consumption and pollution emissions. Meanwhile, strict urban development boundaries and ecological protection red lines should be delineated to transform urban growth from extensive expansion to intensive improvement, so as to reduce the occupation of ecological space by socio-economic activities. In addition, a sound county-level ecological network system should be established, the strictest ecological protection policies should be implemented, and investment in ecological protection and governance should be increased.
Second, as national key ecological function zones with superior ecological endowments, Chishui and Xishui should, on the premise of strict ecological protection, vigorously develop eco-tourism, green agriculture, wellness and health care industries and other eco-friendly industries. These counties should further tap the value transformation potential of high-quality ecological resources, innovate the value realization mechanisms of ecological products, build green industrial brands, and strengthen fiscal and financial support for green industries, so as to convert ecological advantages into economic advantages.
Third, the nine counties of Tongzi, Qixingguan, Dafang, Jinsha, Zhenxiong, Weixin, Hejiang, Xuyong and Gulin are confronted with the coordination dilemma under the dual constraints of ecology and economy. Therefore, differentiated and targeted regulation strategies should be adopted according to local conditions. With respect to the ecological environment, environmental protection and governance should be strengthened, especially in upstream areas such as Qixingguan, Dafang, Jinsha and Zhenxiong, where ecological projects, including rocky desertification control, should be continuously implemented to alleviate ecological constraints. For economic development, counties with relatively strong economic strength (e.g., Hejiang and Gulin) should rely on their locational advantages and pillar industries to actively optimize industrial structure and improve economic efficiency. Economically underdeveloped counties should actively attract investment, cultivate specialized industries, improve infrastructure, and pursue moderate industrial development.
Finally, from the perspective of the whole basin, a cross-county collaborative governance system should be established to coordinate the overall territorial spatial planning and clarify the ecological positioning and industrial layout of upstream, midstream and downstream regions. On the basis of the existing framework of collaborative ecological protection, the division of responsibilities should be refined and the horizontal ecological compensation mechanism should be improved to promote coordinated development across administrative regions [71].

4.4. Limitations and Future Directions

This study employs the ICCDM to analyze the CCR between the ecological environment and economic development in the CRB. Furthermore, the obstacle degree model and panel Tobit model are used to explore the influencing factors of such coupling coordination from multiple dimensions, providing a new perspective for comprehensively revealing the driving mechanisms underlying the coupling coordination between regional ecological environment and economic development. However, this study has several limitations. First, the entropy weight method was adopted to evaluate the ecological environment quality and economic development level. Although this method ensures the objectivity of indicator weighting, it is susceptible to data dispersion, which may lead to potential weighting bias [72] and further affect the accuracy of the evaluation. Second, restricted by data availability, this study only demonstrates the CCR at the county scale in the CRB, without exploring the heterogeneity within counties. In addition, only cross-sectional data at six time points were used in the analysis, which makes it difficult to accurately capture the dynamic evolution characteristics of coordinated eco-economic development in the basin. Moreover, the CCR is affected by a variety of factors, such as geographical conditions, resource endowments, economic development and social environment, leading to inevitable spatial heterogeneity, which cannot be fully reflected in simple horizontal comparisons. Future research should use remote sensing and GIS technologies to construct a more comprehensive and systematic evaluation framework, adopt diverse assessment methods, refine the research scale, and improve the temporal resolution. Meanwhile, considering the actual regional conditions, it is necessary to explore the coupling coordination thresholds of eco-economic systems in different regions, so as to achieve a more scientific and reasonable evaluation of the coupling coordination relationship between the regional ecological environment and economic development.

5. Conclusions

This study employs the ICCDM to investigate the dynamics of the CCR between the ecological environment and economic development in the CRB at six time points spanning more than 20 years. The results show that the coupling coordination level between the ecological and economic systems has continuously improved, which objectively verifies the remarkable achievements in ecological governance and economic development across the basin over the past two decades. Nevertheless, the current CCD remains relatively low, indicating that the CCR still needs to be further enhanced.
Obstacle degree analysis identifies significant internal disparities in the constraining factors for coupling coordination among the 13 counties in the CRB. Specifically, Renhuai and Zunyi are characterized as ecological environment-constrained, where ecological factors act as the primary obstacles to improving coupling coordination. In contrast, the other 11 counties, including Chishui, Xishui, and Tongzi, are economic development-constrained, with the bottlenecks of coordinated development mainly originating from economic factors. These findings not only reveal the existing imbalance in the development of the regional eco-economic system but also reflect the complex regional functional differentiation and heterogeneous evolution of the human–land relationship in the basin.
Analysis of external influencing factors demonstrates that industrial structure, ecological endowment, industrialization level, and government capacity are significant positive drivers of the coupling coordination relationship. Among them, industrial structure and ecological endowment exert the most prominent promoting effects. Conversely, terrain conditions, as a major natural constraint, impose a significant negative inhibitory impact on the CCR between ecological environment and economic development.

Author Contributions

Conceptualization, Z.F. and B.Y.; methodology, B.Y.; software, Z.F.; validation, D.C. and T.T.; formal analysis, Y.W.; investigation, Y.D.; resources, B.Y. and J.R.; data curation, Z.F.; writing—original draft preparation, Z.F.; writing—review and editing, D.C., Y.W. and J.R.; visualization, Z.F. and D.C.; supervision, B.Y.; project administration, J.R.; funding acquisition, J.R. All authors have read and agreed to the published version of the manuscript.

Funding

This research was funded by Bijie Scientist Workstation Project: Bijie City Scientist Workstation for Mountain Resources, Environment, and Disaster Research, grant number: BKHPT [2025] No. 2; Bijie City Talent Team Project: Karst Plateau Resources and Environmental Remote Sensing Talent Team, grant number: BWRLT [2023] No. 14; Bijie Municipal Science and Technology Bureau Joint Project: Intelligent Geographic Spatial Information Application Engineering Center, grant number: BKLH [2023] No. 08.

Institutional Review Board Statement

Not applicable.

Informed Consent Statement

Not applicable.

Data Availability Statement

The original contributions presented in this study are included in the article. Further inquiries can be directed to the corresponding author.

Conflicts of Interest

The authors declare no conflicts of interest.

Abbreviations

The following abbreviations are used in this manuscript:
CCRCoupling coordination relationship
CRBChishui River Basin
ICCDMImproved coupling coordination degree model
EEIEcological environment index
EDIEconomic development index
CCDCoupling coordination degree
SDGsSustainable development goals
EKCEnvironmental Kuznets Curve
CCDMCoupling coordination degree model
NDVINormalized difference vegetation index
NPPNet primary productivity
RSEIRemote sensing ecological index
GDPGross domestic product
PSRPressure- state- response
DPSIRDriver-pressure-state-impact-response
SSBScale-structure- benefit
ICGOSInnovation-coordination-green-openness-sharing
GISGeographic information system

References

  1. Li, Z.; Ye, Y.; Liu, X.; Wu, Q. Research on the Coupling Coordination, Spatiotemporal Evolution and Zoning Management of High-Quality Development and Ecosystem Service Value in China. Sci. Rep. 2025, 15, 12665. [Google Scholar] [CrossRef]
  2. Climate Change 2021—The Physical Science Basis. Chem. Int. 2021, 43, 22–23. [CrossRef]
  3. Salvati, L.; Mancini, A.; Bajocco, S.; Gemmiti, R.; Carlucci, M. Socioeconomic Development and Vulnerability to Land Degradation in Italy. Reg. Environ. Change 2011, 11, 767–777. [Google Scholar] [CrossRef]
  4. Ren, Y.; Xiao, S.; Peng, X.; Zhang, B.; Zhou, J.; Wang, J. Global Land Desertification Risk Assessment. J. Environ. Manag. 2025, 396, 128098. [Google Scholar] [CrossRef]
  5. Butchart, S.H.M.; Walpole, M.; Collen, B.; van Strien, A.; Scharlemann, J.P.W.; Almond, R.E.A.; Baillie, J.E.M.; Bomhard, B.; Brown, C.; Bruno, J.; et al. Global Biodiversity: Indicators of Recent Declines. Science 2010, 328, 1164–1168. [Google Scholar] [CrossRef] [PubMed]
  6. Qiao, S.; Guo, Q.; He, Z.; Feng, G.; Wang, Z.; Li, X. Spatiotemporal Trends and Drivers of PM2.5 Concentrations in Shandong Province from 2014 to 2023 under Socioeconomic Transition. Toxics 2025, 13, 978. [Google Scholar] [CrossRef]
  7. Song, J.; Chen, Y.; Luan, F. Air Pollution, Water Pollution, and Robots: Is Technology the Panacea. J. Environ. Manag. 2023, 330, 117170. [Google Scholar] [CrossRef] [PubMed]
  8. Riekhof, M.-C.; Regnier, E.; Quaas, M.F. Economic Growth, International Trade, and the Depletion or Conservation of Renewable Natural Resources. J. Environ. Econ. Manag. 2019, 97, 116–133. [Google Scholar] [CrossRef]
  9. Li, L.; Fan, Z.; Feng, W.; Yuxin, C.; Keyu, Q. Coupling Coordination Degree Spatial Analysis and Driving Factor between Socio-Economic and Eco-Environment in Northern China. Ecol. Indic. 2022, 135, 108555. [Google Scholar] [CrossRef]
  10. Sun, M.; Yang, R.; Li, X.; Zhang, L.; Liu, Q. Designing a Path for the Sustainable Development of Key Ecological Function Zones: A Case Study of Southwest China. Glob. Ecol. Conserv. 2021, 31, e01840. [Google Scholar] [CrossRef]
  11. Guo, F.; Jiang, G.; Yuan, D.; Polk, J.S. Evolution of Major Environmental Geological Problems in Karst Areas of Southwestern China. Environ. Earth Sci. 2012, 69, 2427–2435. [Google Scholar] [CrossRef]
  12. Chen, Q.; Xiong, K.; Dan, W.; Niu, L. Coupling Characteristics of Ecological and Poverty in Typical Karst Area: Case Study of 9000 Provincial Level Poor Villages in Guizhou Province. Acta Ecol. Sin. 2021, 41, 2968–2982. [Google Scholar] [CrossRef]
  13. Meadows, D.H.; Meadows, D.L.; Randers, J.; Behrens, W. The Limits to Growth: A Report for the Club of Rome’s Project on the Predicament of Mankind; Universe Books: New York, NY, USA, 1972. [Google Scholar]
  14. Panayotou, T. Demystifying the Environmental Kuznets Curve: Turning a Black Box into a Policy Tool. Environ. Dev. Econ. 1997, 2, 465–484. [Google Scholar] [CrossRef]
  15. Yang, S.; Zhang, Z.; Zhang, J.; Bai, X.; Hu, F.; Zhang, K.; Wang, S. The Coupling Relationship and Driving Mechanism between Ecological Environment and High-Quality Economic Development in the Middle Yellow River Basin. Sci. Rep. 2025, 15, 10688. [Google Scholar] [CrossRef] [PubMed]
  16. Ni, J.; Zheng, X.; Zheng, Y.; Zhang, Y.; Li, H. Coupling Coordination Development of the Ecological–Economic System in Hangzhou, China. Sustainability 2023, 15, 16570. [Google Scholar] [CrossRef]
  17. Ma, H.; Wang, Q.; Zhang, Y.; Hussain, M.B.; Xu, Y.; Tian, S.; Yuan, X.; Ma, Q.; Yuan, R.; Jia, Y. Research on Sustainable Development Evaluation and Improvement Path of Resource-Based Cities Based on Coupling of Emergy and System Dynamics. Environ. Dev. Sustain. 2024, 26, 5959–6006. [Google Scholar] [CrossRef] [PubMed]
  18. Ozkan, O.; Khan, N.; Ahmed, M. Impact of Green Technological Innovations on Environmental Quality for Turkey: Evidence from the Novel Dynamic ARDL Simulation Model. Environ. Sci. Pollut. Res. Int. 2023, 30, 72207–72223. [Google Scholar] [CrossRef]
  19. Fan, Y.; Fang, C.; Zhang, Q. Coupling Coordinated Development between Social Economy and Ecological Environment in Chinese Provincial Capital Cities-Assessment and Policy Implications. J. Clean. Prod. 2019, 229, 289–298. [Google Scholar] [CrossRef]
  20. Huang, Y.; Zhang, S.; Zhang, J.; Fan, F.; Zheng, H. Exploration of Ecosystem Asset-Economy Coupling Coordination and Its Endogenous and Exogenous Drivers in Mountainous Regions. J. Clean. Prod. 2025, 486, 144460. [Google Scholar] [CrossRef]
  21. Dong, G.; Ge, Y.; Liu, J.; Kong, X.; Zhai, R. Evaluation of Coupling Relationship between Urbanization and Air Quality Based on Improved Coupling Coordination Degree Model in Shandong Province, China. Ecol. Indic. 2023, 154, 110578. [Google Scholar] [CrossRef]
  22. Shen, L.; Huang, Y.; Huang, Z.; Lou, Y.; Ye, G.; Wong, S.-W. Improved Coupling Analysis on the Coordination between Socio-Economy and Carbon Emission. Ecol. Indic. 2018, 94, 357–366. [Google Scholar] [CrossRef]
  23. Zhang, L.; Wu, M.; Bai, W.; Jin, Y.; Yu, M.; Ren, J. Measuring Coupling Coordination between Urban Economic Development and Air Quality Based on the Fuzzy BWM and Improved CCD Model. Sustain. Cities Soc. 2021, 75, 103283. [Google Scholar] [CrossRef]
  24. Zhou, Y.; Yu, S.; Yu, Z. Spatiotemporal Coupling of Grain Production, Economic Development, and Ecological Protection in China’s Major Grain-producing Areas. Acta Ecol. Sin. 2025, 45, 1659–1673. [Google Scholar] [CrossRef]
  25. Zhang, Z.; Li, H.; Cao, Y. Research on the Coordinated Development of Economic Development and Ecological Environment of Nine Provinces (Regions) in the Yellow River Basin. Sustainability 2022, 14, 13102. [Google Scholar] [CrossRef]
  26. He, Z.; Guo, Q.; Yin, Z.; Luo, X.; Sun, M. Evolution and Driving Mechanisms of Eco-Environmental Quality across Different Urbanization Stages. Sci. Rep. 2025, 15, 22101. [Google Scholar] [CrossRef]
  27. Zhang, Q.; Ye, B.; Shen, X.; Zhu, Y.; Su, B.; Yin, Q.; Zhou, S. Coupling Coordination Evaluation of Ecology and Economy and Development Optimization at Town-Scale. J. Clean. Prod. 2024, 447, 141581. [Google Scholar] [CrossRef]
  28. Ariken, M.; Zhang, F.; Liu, K.; Fang, C.; Kung, H.-T. Coupling Coordination Analysis of Urbanization and Eco-Environment in Yanqi Basin Based on Multi-Source Remote Sensing Data. Ecol. Indic. 2020, 114, 106331. [Google Scholar] [CrossRef]
  29. Ma, L.; Zhao, X.; Yan, B.; Fan, J.; Wang, M.; Liu, M. How Does the Coupling Coordination between High-Quality Development and Eco-Environmental Carrying Capacity in the Yellow River Basin over Time? Front. Environ. Sci. 2024, 12, 1403265. [Google Scholar] [CrossRef]
  30. Dong, Z.; Zhang, J.; Tong, Z.; Han, A.; Zhi, F. Ecological Security Assessment of Xilingol Grassland in China Using DPSIRM Model. Ecol. Indic. 2022, 143, 109336. [Google Scholar] [CrossRef]
  31. Ji, J.; Tang, Z.; Zhang, W.; Liu, W.; Jin, B.; Xi, X.; Wang, F.; Zhang, R.; Guo, B.; Xu, Z.; et al. Spatiotemporal and Multiscale Analysis of the Coupling Coordination Degree between Economic Development Equality and Eco-Environmental Quality in China from 2001 to 2020. Remote Sens. 2022, 14, 737–760. [Google Scholar] [CrossRef]
  32. Ji, J.; Tang, Z.; Jiang, L.; Sheng, T.; Zhao, F.; Zhang, R.; Shifaw, E.; Liu, W.; Li, H.; Liu, X.; et al. Study on Regional Eco-Environmental Quality Evaluation Considering Land Surface and Season Differences: A Case Study of Zhaotong City. Remote Sens. 2023, 15, 657. [Google Scholar] [CrossRef]
  33. Zhao, J.; Sa, N.; Kou, X.; Fu, X.; Zheng, S.; Lu, Z.; Wu, G.; Sang, W. Coupling Coordination Analysis and Prediction of Multi-Social-Ecological Subsystem in the Xiaoxing’an Moutains-Sanjiang Plain, Northeast China. Glob. Ecol. Conserv. 2024, 51, e02892. [Google Scholar] [CrossRef]
  34. Chen, Y.; Zhai, J.; Yang, M.; Zhu, H.; Jin, D.; Gao, H.; Hou, P. Analysis of Ecological Protection Situation and Its Variation Characteristics of the Chishui River Basin. Environ. Eng. 2023, 41, 185–194. [Google Scholar] [CrossRef]
  35. Chen, H.; Li, R.; Zhang, Y.; Wu, Q.; Yuan, J.; Gao, J. Comparison of Ecosystem Health in Different Geomorphic Regions of Chishui River Basin, Southwest China. Chin. J. Appl. Ecol. 2023, 34, 1912–1922. [Google Scholar] [CrossRef]
  36. Chen, Z.; Xu, J.; Yang, F.; Hou, Z.; Ren, K.; Yu, L.; Yang, S.; Li, Z.; Zhang, X. Comprehensive Monitoring and Ecological Risk Assessment of Heavy Metals in Soil and Surface Water of Chishui River Basin in Upper Reaches of the Yangtze River. Water 2023, 15, 2069. [Google Scholar] [CrossRef]
  37. Liu, F.; Yu, F.; Xia, Z.; Qin, Q.; Xu, C.; Wang, J.; Liu, H. Changes in Fish Assemblages Following the Implementation of a Complete Fishing Closure in the Chishui River. Fish. Res. 2021, 243, 106099. [Google Scholar] [CrossRef]
  38. Gao, W.; Wang, Z.; Wang, K.; Wang, X.; Li, X.; Jiang, Q. Effectiveness of Small Hydropower Plants Dismantling in the Chishui River Watershed and Recommendations for Follow-up Studies. Water 2025, 17, 2909. [Google Scholar] [CrossRef]
  39. Wang, L.; Lan, A.; Fan, Z.; Lin, S.; Zhu, N. Spatial-temporal Differentiation and Driving Factors of Habitat Quality in the Chishui River Basin Based on InVEST Model. Chin. Rural. Water Hydropower 2023, 1, 17–23. [Google Scholar]
  40. Lai, S.; Sha, J.; Eladawy, A.; Li, X.; Wang, J.; Kurbanov, E.; Lin, Z.; Wu, L.; Han, R.; Su, Y.-C. Evaluation of Ecological Security and Ecological Maintenance Based on Pressure-State-Response (PSR) Model, Case Study: Fuzhou City, China. Hum. Ecol. Risk Assess. Int. J. 2022, 28, 734–761. [Google Scholar] [CrossRef]
  41. Zhao, J.; Wu, J.; Jia, L.; Cao, Y. Ecosystem Health Assessment of Gansu Section of Yellow River Basin Based on DPSR Model. J. Ecol. Rural Environ. 2024, 40, 602–611. [Google Scholar] [CrossRef]
  42. Zeng, C.; Li, T.; He, B. Decoupling Effect and Driving Decomposition of Land Use Intensity on Carbon Emissions in Southwest Alpine Canyon Area. Acta Ecol. Sin. 2025, 45, 6770–6782. [Google Scholar] [CrossRef]
  43. Tian, Y.; Tian, M.; Feng, Z. Analysis of the Yellow River Basin. Yellow River 2024, 46, 107–111+117. [Google Scholar] [CrossRef]
  44. Wang, J.; Tang, Q.; Guo, W. Coupling Coordination between New Urbanization and Economic Development Level in Wuhan. Sustainability 2025, 17, 4481. [Google Scholar] [CrossRef]
  45. Li, X.; Wan, D.; Wang, C. Coupling Coordination Relationship Between Economic Development and Ecological Environmental Protection in Huaihua City. Econ. Geogr. 2023, 43, 190–197. [Google Scholar] [CrossRef]
  46. Chen, Y.; Zhou, G.; Wang, H.; Cui, S.; Bi, F.; Yu, X. The Evolution Characteristics and Enhancement Paths of the Economy-Society-Ecology Coordinated Development Level of Changsha-Zhuzhou-Xiangtan Urban Agglomeration. Trop. Geogr. 2023, 43, 519–531. [Google Scholar] [CrossRef]
  47. Dong, Q.; Wang, X. Coupling Coordination of Eco-environment Quality and Economic Development in Counties Along the Yellow River in Shandong Province. J. Xi’an Univ. Technol. 2024, 40, 522–531+602. [Google Scholar] [CrossRef]
  48. Huang, X.; Yang, J. The 30 m annual land cover datasets and its dynamics in China from 1985 to 2022. Earth Syst. Sci. Data 2023, 13, 3907–3925. [Google Scholar]
  49. Jiang, Z.; Li, Y.; Wu, H.; Mohamed Shariff, A.R.B.; Zhou, H.; Fan, K. Unveiling the Impacts of Climate Change and Human Activities on Land-Use Evolution in Ecologically Fragile Urbanizing Areas: A Case Study of China’s Central Plains Urban Agglomeration. Ecol. Indic. 2024, 169, 112936. [Google Scholar] [CrossRef]
  50. Liu, C.; Zhang, K.; Liu, J. A Long-term Site Study for the Ecological Risk Migration of Landscapes and its Driving Forces in the Sanjiang Plain from 1976 to 2013. Acta Ecol. Sin. 2018, 38, 3729–3740. [Google Scholar] [CrossRef][Green Version]
  51. Meng, Q.; Liu, G.; Yang, Q. Dynamic Change of Land Use and its Ecological Effects on the Loess Plateau. Sci. Soil. Water Conserv. 2009, 7, 48–53. [Google Scholar] [CrossRef]
  52. He, J.; Lu, Y.; Yan, M.; Fang, G.; Zhu, Z. Factors Affecting Ecological Protection and Socioeconomic Development and Their Coupling Coordination across Riverfront Resources along the Yangtze River in Jiangsu Province, China. J. Nat. Conserv. 2026, 89, 127067. [Google Scholar] [CrossRef]
  53. Zhang, K.; Jin, Y.; Li, D.; Wang, S.; Liu, W. Spatiotemporal Variation and Evolutionary Analysis of the Coupling Coordination between Urban Social-Economic Development and Ecological Environments in the Yangtze River Delta Cities. Sustain. Cities Soc. 2024, 111, 105561. [Google Scholar] [CrossRef]
  54. Chang, Q.; Sha, Y.; Chen, Y. The Coupling Coordination and Influencing Factors of Urbanization and Ecological Resilience in the Yangtze River Delta Urban Agglomeration, China. Land 2024, 13, 111. [Google Scholar] [CrossRef]
  55. Zhong, Y.; Zhou, M.; Ding, Y. Spatio-temporal Evolution and Trend Prediction of the Coupling Coordination Between Ecological Protection and Economic Development in the Dongting Lake Ecological Economic Zone. Environ. Sci. 2025, 1–20. [Google Scholar] [CrossRef]
  56. Feng, Z.; Tang, Y.; Yang, Y.; Zhang, D. The Relief Degree of Land Surface in China and Its Correlation with Population Distribution. Acta Geogr. Sin. 2007, 62, 1073–1082. [Google Scholar]
  57. Zhou, S.; Li, W.; Zhang, W.; Wang, Z. The Assessment of the Spatiotemporal Characteristics of the Eco-Environmental Quality in the Chishui River Basin from 2000 to 2020. Sustainability 2023, 15, 3695. [Google Scholar] [CrossRef]
  58. Sun, M.; Li, X.; Yang, R.; Zhang, Y.; Zhang, L.; Song, Z.; Liu, Q.; Zhao, D. Comprehensive Partitions and Different Strategies Based on Ecological Security and Economic Development in Guizhou Province, China. J. Clean. Prod. 2020, 274, 122794. [Google Scholar] [CrossRef]
  59. Na, R.; Xu, X.; Wang, S. Spatiotemporal Analysis of Economic and Ecological Coupled Coordination: A Case Study of the Beijing–Tianjin–Hebei Urban Agglomeration. Land. 2024, 13, 1138. [Google Scholar] [CrossRef]
  60. Fan, Z.; Xiong, K.; Li, L.; Guo, Q. Research on Coupling and Coordinated Development of Agricultural Eco-Economic System in Karst Ecologically Vulnerable Region: A Case Study of Guizhou Province. Resour. Environ. Yangtze Basin 2022, 31, 482–491. [Google Scholar]
  61. Meng, G.; Wang, K.; Wang, F.; Dong, Y. Analysis of the Tourism-Economy-Ecology Coupling Coordination and High-Quality Development Path in Karst Guizhou Province, China. Ecol. Indic. 2023, 154, 110858. [Google Scholar] [CrossRef]
  62. Zhang, J.; Li, Z.; Song, X.; Ning, H. Deep Tobit Networks: A Novel Machine Learning Approach to Microeconometrics. Neural Netw. 2021, 144, 279–296. [Google Scholar] [CrossRef] [PubMed]
  63. Huang, W.; Gao, S.; Hu, P.; Han, Y.; Ding, S. Is the Coupling and Coordination of Economic, Social and Environmental Development Crucial to the Governance of Relative Poverty? PLoS ONE 2024, 19, e0306641. [Google Scholar] [CrossRef] [PubMed]
  64. Zou, H.; Duan, X.; Ye, L.; Wang, L. Locating Sustainability Issues: Identification of Ecological Vulnerability in Mainland China’s Mega-Regions. Sustainability 2017, 9, 1179. [Google Scholar] [CrossRef]
  65. Xue, R.; Gu, R.; Ong, T. How Does Coupling Coordination between Industrial Structure Optimization and Ecosystem Services Dynamically Affect Carbon Emissions in the Yellow River Basin? J. Clean. Prod. 2025, 517, 145872. [Google Scholar] [CrossRef]
  66. Guan, Q.; Hao, J.; Shi, X.; Gao, Y.; Wang, H.; Li, M. Study on the Changes of Ecological Land and Ecosystem Service Value in China. J. Nat. Resour. 2018, 33, 195–207. [Google Scholar]
  67. Lima, F.A.; Bhattacharjee, S.; Sarker, J.; Salam, M.A. Ecological Risk Assessment of Potentially Toxic Elements (PTEs) in Agricultural Soil, Vegetables and Fruits with Respect to Distance Gradient in Proximity to Lead-Acid Battery Industry. Environ. Nanotechnol. Monit. Manag. 2024, 21, 100932. [Google Scholar] [CrossRef]
  68. Xu, X.; Gao, Y. Local Legislative Scheme for Handling Common Affairs Related to Watershed Environmental Protection: Thoughts on the Three-province ‘Joint Legislation’ for Chishui River Protection. Chin. J. Popul. Resour. Environ. 2023, 33, 73. [Google Scholar]
  69. Liu, Z.; Zhang, W.; Lu, H.; Ji, J.; Yang, Z.; Chen, C. Exploring Evolution Characteristics of Eco-Environment Quality in the Yangtze River Basin Based on Remote Sensing Ecological Index. Heliyon 2023, 9, e23243. [Google Scholar] [CrossRef]
  70. Xiong, K.; Chi, Y. The Problems in Southern China Karst Ecosystem in Southern of China and Its Countermeasures. Ecol. Econ. 2015, 31, 23–30. [Google Scholar]
  71. Sun, Y.; Tang, Z.; Wang, Z.; Ma, G. Horizontal Ecological Compensation for Ecosystem Services in Chishui River Basin. J. Nat. Resour. 2025, 40, 786–796. [Google Scholar] [CrossRef]
  72. Fang, J.; Liu, H.; Zhang, D.; Chen, S. Construction of China’s Green Development Potential Assessment System: Comparative Analysis Based on Fixed and Heterogeneous Rights. Ecol. Environ. Sci. 2026, 35, 15. [Google Scholar] [CrossRef]
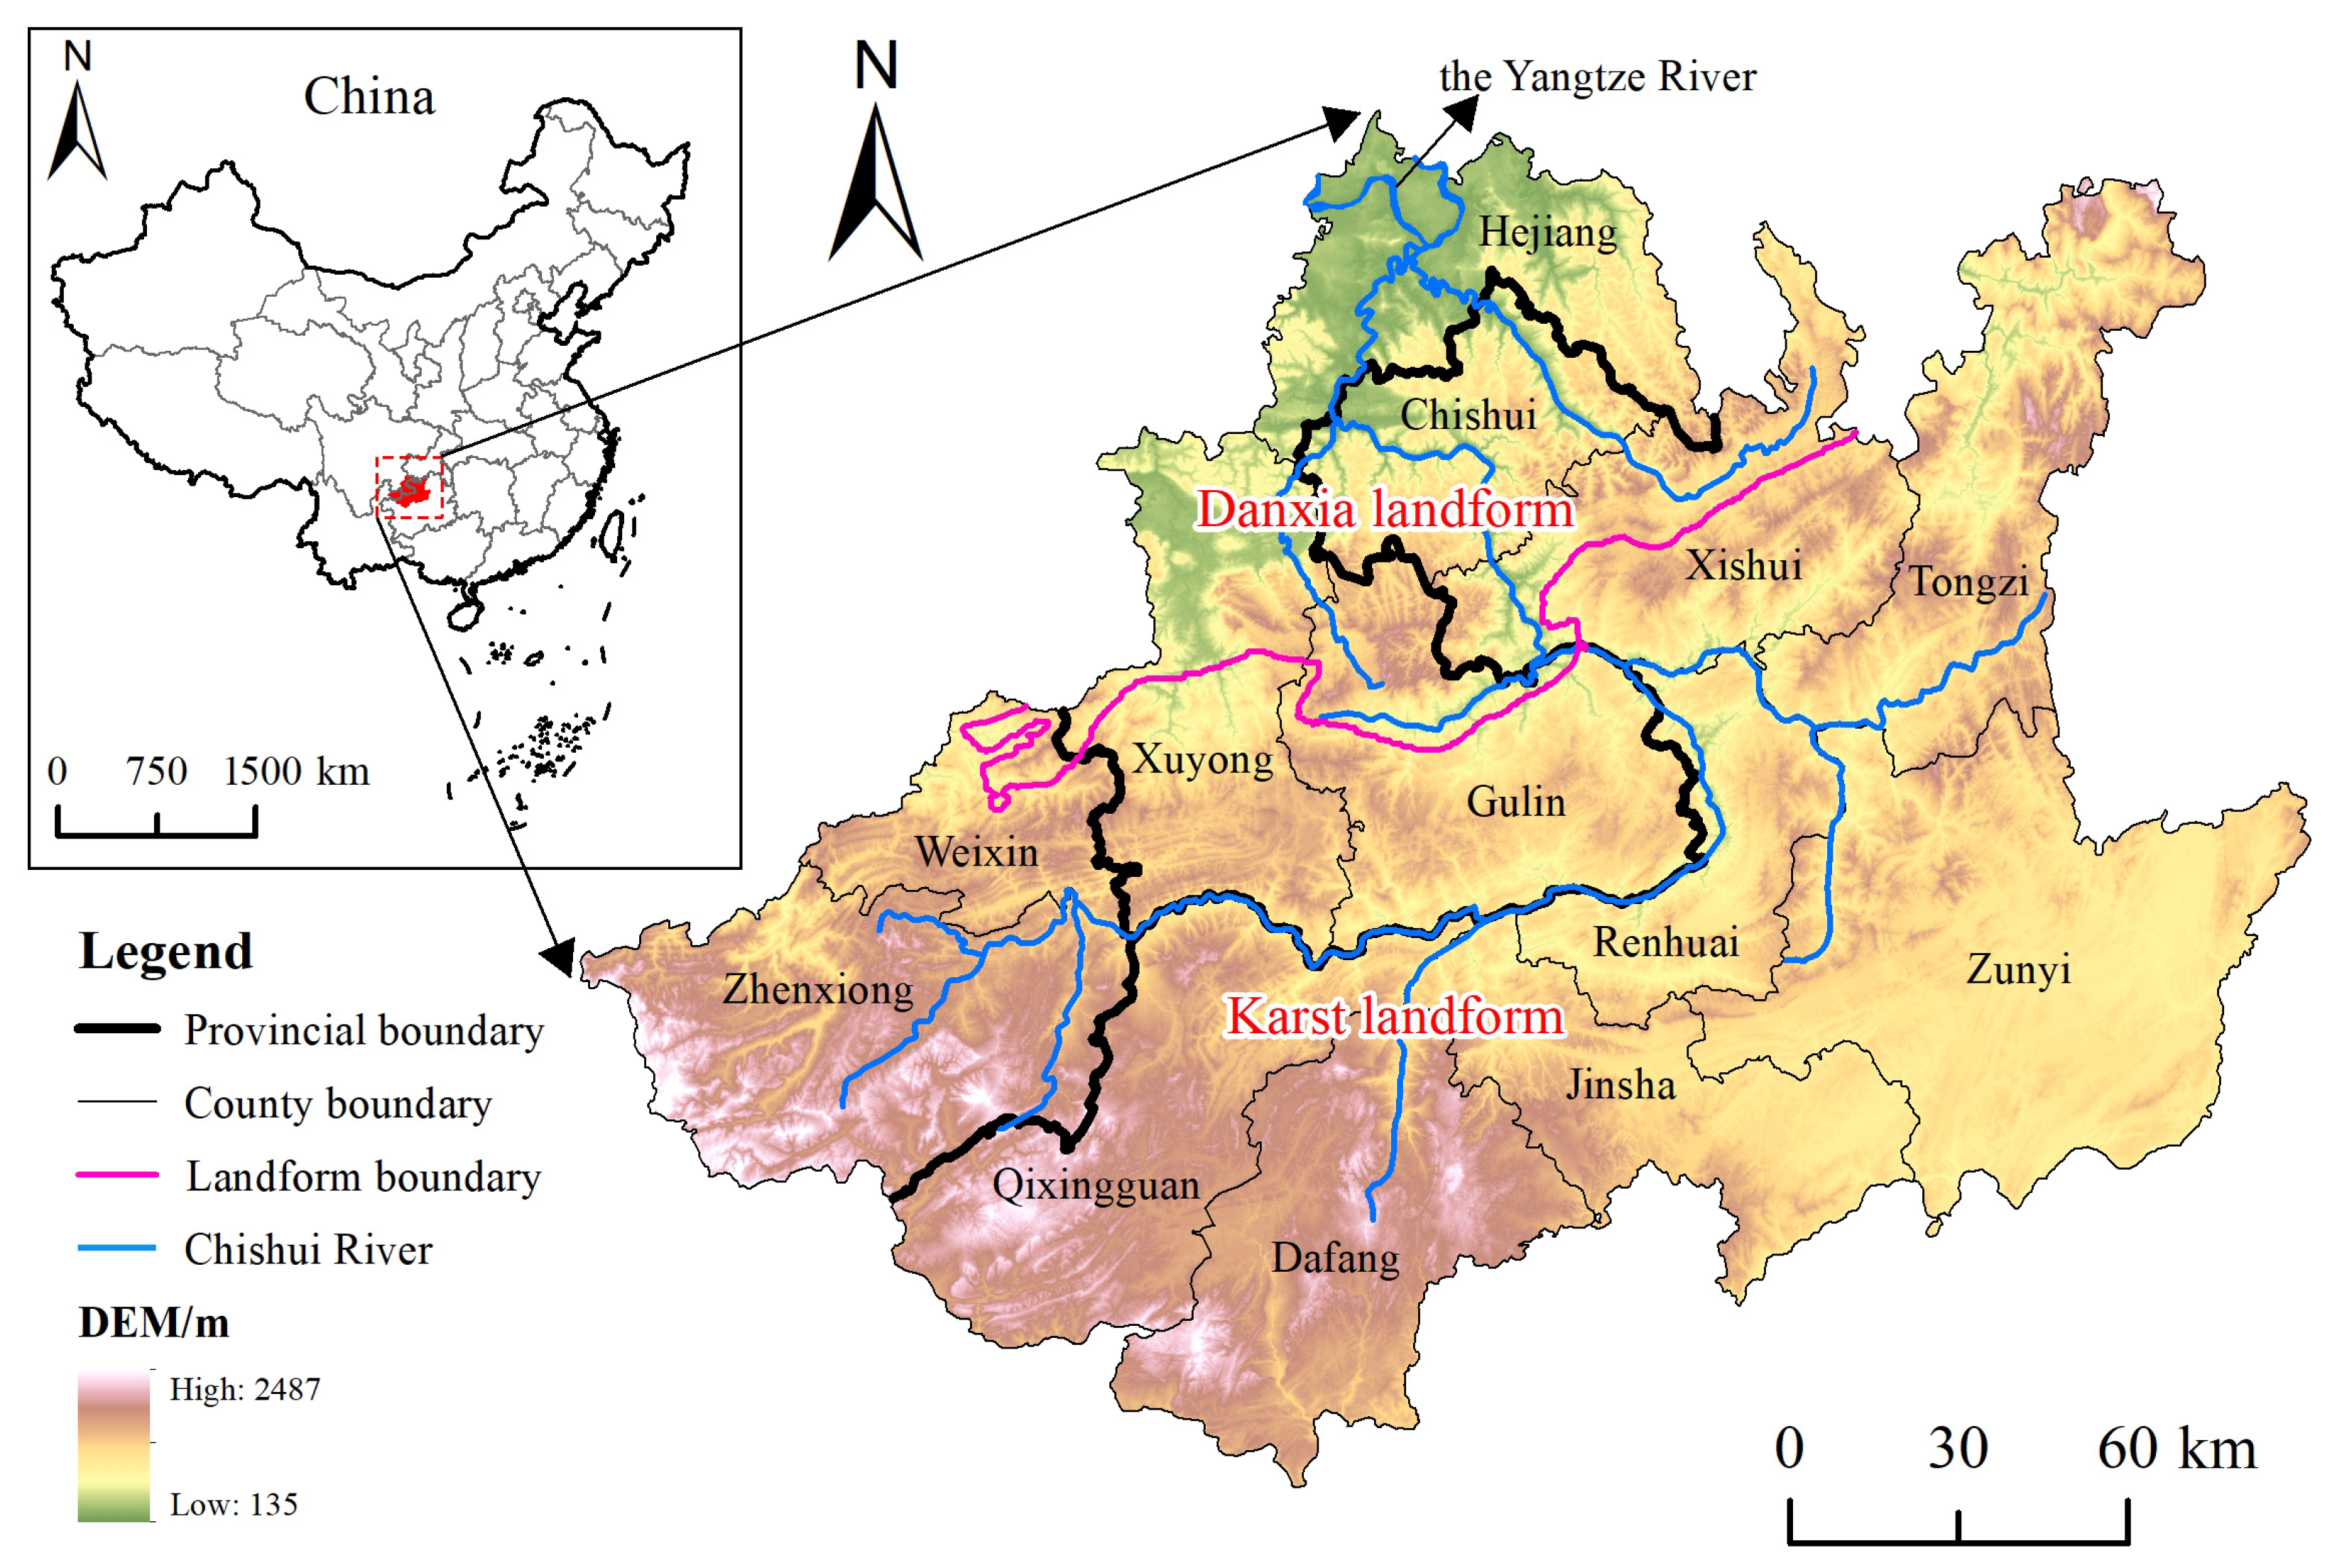
Figure 1. Study area.
Sustainability 18 03534 g001
Figure 2. Trends in the evolution of the EEI in the CRB.
Sustainability 18 03534 g002
Figure 3. Spatial evolution pattern of the EEI in the CRB ((a): distribution map in 2000; (b): distribution map in 2005; (c): distribution map in 2010; (d): distribution map in 2015; (e): distribution map in 2020; (f): distribution map in 2022).
Sustainability 18 03534 g003
Figure 4. Trends in the evolution of the EDI in the CRB.
Sustainability 18 03534 g004
Figure 5. Spatial evolution pattern of the EDI in the CRB ((a): distribution map in 2000; (b): distribution map in 2005; (c): distribution map in 2010; (d): distribution map in 2015; (e): distribution map in 2020; (f): distribution map in 2022).
Sustainability 18 03534 g005
Figure 6. Evolution of the CCR in the CRB (I-3: moderate imbalance; I-4: mild imbalance; II-1: near imbalance; II-2: barely coordinated; III-1: primary coordination; III-2: moderate coordination).
Sustainability 18 03534 g006
Figure 7. Kernel density estimation of CCD in the CRB.
Sustainability 18 03534 g007
Figure 8. Spatial evolution of the CCD in the CRB ((a): distribution map in 2000; (b): distribution map in 2005; (c): distribution map in 2010; (d): distribution map in 2015; (e): distribution map in 2020; (f): distribution map in 2022).
Sustainability 18 03534 g008
Figure 9. Mean CCD of different regions in the CRB.
Sustainability 18 03534 g009
Figure 10. System level obstacle degrees.
Sustainability 18 03534 g010
Figure 11. Indicator level obstacle degrees (X1: population density; X2: land development intensity; X3: fertilizer application intensity; X4: average NDVI; X5: landscape fragmentation; X6: ecological resilience; X7: forest and grassland coverage; X8: proportion of nature reserve area; X9: proportion of tertiary industry output value in GDP; X10: per capita GDP; X11: economic density; X12: per capita local fiscal revenue; X13: ratio of urban to rural disposable income; X14: proportion of GDP accounted for by secondary and tertiary industries; X15: ratio of regional per capita GDP to national per capita GDP; X16: GDP growth rate; X17: per capita balance of savings deposits; X18: per capita total retail sales of consumer goods).
Sustainability 18 03534 g011
Table 1. Evaluation Indicator System.
SystemPrimary
Indicator
Secondary IndicatorReferencesUnitTypeWeight
Ecological
environment
PressurePopulation density (X1)[40,41,42,43]persons/km2-0.1170
Land development intensity (X2)——-0.1225
Fertilizer application intensity (X3)t/km2-0.0503
StateAverage NDVI (X4)——+0.1043
Landscape fragmentation (X5)——-0.0871
Ecological resilience (X6)——+0.1310
ResponseForest and grassland coverage (X7)%+0.1337
Proportion of nature reserve area (X8)%+0.1532
Proportion of tertiary industry output value in GDP (X9)%+0.1009
Economic
development
ScalePer capita GDP (X10)[16,20,44,45,46,47]yuan/person+0.0793
Economic density (X11)10,000 yuan/km2+0.0797
Per capita local fiscal revenue (X12)yuan/person+0.0784
StructureRatio of urban to rural disposable income (X13)%-0.0707
Proportion of GDP accounted for by secondary and tertiary industries (X14)%+0.0904
Ratio of regional per capita GDP to national per capita GDP (X15)%+0.0917
BenefitGDP growth rate (X16)%+0.1514
Per capita balance of savings deposits (X17)yuan/person+0.1834
Per capita total retail sales of consumer goods (X18)yuan/person+0.1751
Note: The weights of the indicators are determined based on Equations (4)–(8) in Section 2.3.1.
Table 2. Classification Criteria for CCR.
CCDStage of DevelopmentTypes of CCR
0.00 ≤ CCD ≤ 0.10Disorder decline period (I)Extreme imbalance (I-1)
0.10 < CCD ≤ 0.20 Severe imbalance (I-2)
0.20 < CCD ≤ 0.30 Moderate imbalance (I-3)
0.30 < CCD ≤ 0.40 Mild imbalance (I-4)
0.40 < CCD ≤ 0.50Transitional development period (II)Near imbalance (II-1)
0.50 < CCD ≤ 0.60 Barely coordinated (II-2)
0.60 < CCD ≤ 0.70Coordinated development period (III)Primary coordination (III-1)
0.70 < CCD ≤ 0.80 Moderate coordination (III-2)
0.80 < CCD ≤ 0.90 Good coordination (III-3)
0.90 < CCD ≤ 1.00 High-quality coordination (III-4)
Table 3. CCD of ecological environment and economic development in the CRB (Ranks in Parentheses).
Area200020052010201520202022
Zunyi0.493 (2)0.519 (3)0.553 (7)0.567 (10)0.611 (8)0.603 (10)
Tongzi0.414 (9)0.494 (8)0.502 (13)0.628 (5)0.649 (4)0.632 (7)
Xishui0.461 (4)0.497 (7)0.546 (8)0.640 (3)0.654 (3)0.655 (5)
Chishui0.503 (1)0.557 (1)0.629 (1)0.738 (1)0.750 (1)0.757 (1)
Renhuai0.457 (5)0.466 (11)0.512 (12)0.529 (11)0.572 (12)0.544 (13)
Qixingguan0.413 (10)0.469 (10)0.545 (9)0.595 (8)0.598 (9)0.603 (9)
Dafang0.371 (12)0.476 (9)0.535 (10)0.585 (9)0.566 (13)0.575 (11)
Jinsha0.455 (6)0.519 (4)0.556 (6)0.607 (7)0.618 (6)0.617 (8)
Zhenxiong0.232 (13)0.377 (13)0.528 (11)0.528 (12)0.574 (11)0.568 (12)
Weixin0.389 (11)0.449 (12)0.569 (5)0.500 (13)0.586 (10)0.648 (6)
Hejiang0.487 (3)0.539 (2)0.602 (3)0.651 (2)0.668 (2)0.693 (2)
Xuyong0.421 (8)0.510 (5)0.594 (4)0.636 (4)0.631 (5)0.658 (4)
Gulin0.444 (7)0.508 (6)0.613 (2)0.607 (6)0.617 (7)0.665 (3)
Mean0.493 (2)0.519 (3)0.553 (7)0.567 (10)0.611 (8)0.603 (10)
Table 4. Global Moran’s I of CCD in the CRB.
Index200020052010201520202022
Moran’s I0.2500.2690.3140.2580.2800.305
Z-value2.3132.2162.2892.1592.4992.369
p-value0.0150.0210.0170.0230.0080.015
Table 5. Descriptive statistics of the variables.
VariablesSpecific FactorsUnitMinimum ValueMaximum ValueAverage ValueStandard
Deviation
Economic
development level
GDP100 million yuan4.351706.70200.93320.47
Industrialization levelProportion of secondary industry output value in GDP%14.2173.8038.2012.54
Industrial
structure
Industrial structure coefficient——1.732.472.140.17
Urbanization levelUrbanization rate%6.9376.4733.115.62
Government
capacity
Per capita government fiscal expenditureyuan/person167.5272,014.825554.538646.22
Ecological
endowment
Proportion of ecological land area%42.3390.6362.1512.03
Terrain conditionsDegree of topographical undulation——0.721.891.380.31
Landform typesDanxia landform county = 0, Karst landform county = 1——0.001.000.850.36
Table 6. Panel Tobit model regression results.
VariablesRegression
Coefficient
p-ValueStandard Error
Economic development level0.01050.3380.0109
Industrialization level0.05300.0010.0158
Industrial structure0.23270.0140.0945
Urbanization level0.02150.2550.0189
Government capacity0.02650.0000.0070
Ecological endowment0.19200.0000.0501
Terrain conditions−0.08180.0430.0405
Landform types−0.01360.6340.0286
Constants−0.89130.0000.2294
Disclaimer/Publisher’s Note: The statements, opinions and data contained in all publications are solely those of the individual author(s) and contributor(s) and not of MDPI and/or the editor(s). MDPI and/or the editor(s) disclaim responsibility for any injury to people or property resulting from any ideas, methods, instructions or products referred to in the content.