Article

Home-to-Campus Commuting Mode Choice Among University Students in a Small-Scale City: A Mixed Multinomial Logit Analysis of Sustainable Mode Preferences


by
Raziye Peker
1,*,
Mustafa Sinan Yardım
2 and
Kadir Berkhan Akalın
3
1
Transportation Program, Department of Civil Engineering, Graduate School of Science and Engineering, Yildiz Technical University, Istanbul 34220, Türkiye
2
Department of Civil Engineering, Yildiz Technical University, Istanbul 34220, Türkiye
3
Department of Civil Engineering, Eskisehir Osmangazi University, Eskisehir 26480, Türkiye
*
Author to whom correspondence should be addressed.
Sustainability 2026, 18(7), 3501; https://doi.org/10.3390/su18073501
Submission received: 15 February 2026 / Revised: 10 March 2026 / Accepted: 24 March 2026 / Published: 2 April 2026

Abstract

Rapid growth in urban population, vehicle ownership, and spatial expansion places increasing pressure on urban transportation networks, necessitating a shift toward sustainable mobility solutions. Accordingly, this study examines the determinants of university students’ mode choice preferences for home-to-campus commuting in a small-scale city. The analysis incorporates socio-demographic factors, mobility resources, and travel attributes as potential influencers of mode choice. For modeling preferences, a Multinomial Logit (MNL) model was initially used to estimate deterministic effects, followed by a Mixed Multinomial Logit (MMNL) model to capture unobserved heterogeneity at the individual level. The results demonstrate that gender, vehicle ownership, and travel distance play statistically significant roles in mode choice. Crucially, the MMNL analysis reveals that while students’ sensitivity to travel time is relatively homogeneous, their sensitivity to travel cost exhibits significant unobserved heterogeneity. Moreover, the study reveals the potential for a modal shift toward sustainable options such as walking, cycling, and public transport. These findings offer valuable insights for promoting sustainable urban mobility and developing data-driven transport policies, specifically in alignment with the “Sustainable Cities and Communities” goal of the United Nations (UN) Sustainable Development Goals (SDGs).

1. Introduction

With the rapid growth of urban populations, increasing vehicle ownership, and spatial expansion, the efficiency and sustainability of urban transportation systems remain critical subjects of research [1]. Factors such as urban size, infrastructure conditions, and land use characteristics are key elements shaping individuals’ transportation preferences [2,3]. In this context, the home-to-campus commuting habits of university students are of significant importance for both individual well-being and the development of urban transportation policies.
However, university students face specific real-world challenges and pain points in their daily mobility [4,5]. Especially in smaller urban centers, campus transportation is often hindered by bottlenecks such as poorly coordinated networks, insufficient bus lines, and a lack of diverse infrastructure [6,7,8]. These systemic inefficiencies, coupled with the slow development of public transport, increase traffic pressures and create significant barriers to sustainable commuting [4,7,8]. Recent studies also highlight that in other small-scale universities, the choice of one transport mode over another is closely connected to the efficiency of the public service offered [9]. Furthermore, students -particularly those from lower-income backgrounds-face intense economic pressure and limited access to digitally enabled, smart mobility solutions due to high costs and usability issues [8,10,11]. These factors often force a heavy and burdensome reliance on personal vehicles [4,8,10]. While university students represent a demographic group whose travel behaviors are shaped by a complex interaction of multidimensional factors [4,8], the practical difficulties they encounter in smaller cities -ranging from accessibility issues to physical inactivity caused by inadequate facilities- remain a pressing urban problem [4,5,8].
The literature highlights that mode choices are shaped by a diverse set of socio-demographic characteristics [12,13], economic factors [14,15], urban scale [12,16], infrastructure quality [17,18,19,20], and attitudes toward sustainable transport modes [21,22,23]. Socio-demographically, higher income levels are consistently associated with a preference for private vehicles [4,24], while age and gender also play critical roles; for example, younger students and females are often more likely to walk or use public transit, whereas males show a higher propensity for cycling and driving [4,24]. From an economic and operational perspective, reductions in travel time and lower travel costs are decisive in shifting preferences away from private cars and toward public transport utilization [4,24,25]. Furthermore, psychological and policy-related factors heavily influence mobility: positive attitudes toward health and the environment increase active mode adoption [24], while the implementation of parking fees and a reduction in free parking effectively decrease car use. Improved physical infrastructure, such as well-maintained sidewalks and bike lanes, directly promotes walking and cycling [4,24,25]. In addition to these various factors cited in the broader literature, recent studies highlight how, particularly in small-scale universities, the choice of one mode of transport over another is deeply connected to the efficiency of the public service offered [8,9]. When public transit is inefficient or unreliable, students are often forced to rely on personal vehicles, which subsequently increases the overall carbon footprint.
Despite these insights, limitations in existing studies persist. Most research focuses on large metropolises, leaving a gap in understanding the unique spatial dynamics of smaller cities. Furthermore, existing studies often fail to sufficiently capture the heterogeneity in how students perceive travel costs and time, often assuming uniform preferences across the population.
Accordingly, the research objective of this study is to address these gaps by analyzing the individual, mobility-related, and travel attributes influencing university students’ home-to-campus mode choices in the city of Kütahya. By examining the relationship between individual preferences and urban/infrastructural factors in this specific context, the study aims to provide context-specific insights for developing sustainable transportation policies.
The innovations of this study are characterized by its focus on a small-scale urban environment and its methodological depth. Unlike many studies that rely on base models, this research employs a Mixed Multinomial Logit (MMNL) model to explicitly account for unobserved heterogeneity at the individual level. By testing random coefficients for travel time and cost using various constrained distributions, this study reveals the hidden sensitivity variations in student decision-making processes that standard models overlook. This detailed modeling approach contributes to the urban planning literature by providing a more nuanced understanding of transport mode choice in small-to-medium-sized cities.

2. Background

It is well-established that individual characteristics, gender, and socio-economic status significantly influence students’ transportation preferences [16,20,22]. For instance, while female students exhibit a higher propensity for private vehicle use, male students are found to be more likely to switch transportation modes throughout the year [12]. Travel distance is also a key determinant; studies indicate that public transport and walking are the preferred modes among university students, particularly for short distances [14]. Active transport modes are generally preferred for distances up to 3 km, whereas public transport becomes more attractive for distances exceeding 4 km [17].
Urban scale is a critical factor directly affecting university students’ mode choices. In small urban areas, the central location of campuses and the concentration of activities within short distances encourage active modes such as walking and cycling [12,16]; however, low-cost parking facilities and adverse weather conditions can increase private vehicle usage [19]. Conversely, in medium and large-scale cities, accessibility, diversity, and quality of public transport become prominent. While advanced public transport systems like subways and buses positively influence student preferences in large cities, improving these services in suburban areas can reduce individual vehicle use by up to 9.5% [19].
Land use diversity is another significant determinant of mode choice. High land use diversity encourages the use of sustainable transport modes, particularly public transport, cycling, and walking [17,20]. As walkability elements improve [26], pedestrian volume increases. Furthermore, the presence of residential, commercial, and recreational areas in the immediate vicinity increases students’ orientation toward active transport modes [22]. The density and accessibility of land use play a decisive role in walking distance, the efficiency of public transport services [27], and travel time [17,19].
It has been observed that university students’ travel behaviors, including their reliance on private cars for commuting to campus, can significantly impact traffic congestion, sustainability, and the well-being of surrounding communities [28]. Similarly, research suggests that transportation choices made during pre-university years can have a lasting effect on individuals’ future travel preferences [29]. Individuals’ sustainable transportation choices are closely linked to environmental awareness [19,30]. Studies demonstrate that information campaigns on environmental issues can reduce private vehicle use by 5.8% [16] and significantly promote sustainable travel behaviors. Improvements in public transport services have been found to provide environmental benefits by not only increasing accessibility but also reducing traffic congestion and emissions [22,31]. These benefits also encompass environmental perceptions, safety, and the enhancement of infrastructure and service quality [32,33].
To develop sustainable transportation policies aligned with universities’ environmental goals, urban mobility must be considered within a broader context. While developed countries may need to retrofit existing systems, developing countries have the opportunity to build low-carbon transport systems from scratch [34]. This dual approach can lead to more inclusive and climate-friendly urban growth, benefiting both the environment and society [35]. Addressing land use and transportation planning holistically can enable the development of public transport infrastructure and a reduction in private vehicle dependency. In small urban areas, transit-oriented development approaches can positively shape transportation behaviors around university campuses by increasing accessibility [13,16,19].
In this context, this study provides context-specific insights that promote environmental sustainability in alignment with the Sustainable Development Goals (SDGs), specifically sustainable cities and communities (SDG 11) and climate action (SDG 13) [34].
Despite the extensive research on student mobility, several critical gaps remain in the current literature. First, most studies have been confined to the limitations of MNL models, which fail to capture the complex, unobserved heterogeneity in individual preferences due to the restrictive Independence of Irrelevant Alternatives (IIA) assumption [36,37]. By assuming uniform coefficients for travel time and cost, these models often underestimate the value of travel time savings and overlook how different students perceive and react to these factors differently [38,39].
Second, existing research has largely focused on mega-cities and metropolitan areas, creating an urban bias that neglects the unique mobility patterns and infrastructural constraints of smaller cities or suburban contexts [40,41]. While some studies on mobility in small-scale contexts do exist, they remain notably limited and seldom incorporate the rigorous travel behavior modeling required to explain mode choice [7,8,10]. Consequently, there is a distinct lack of research simultaneously examining the interaction of socio-demographic, travel attributes and economic factors through a formal behavioral lens in these smaller urban settings.
By employing an MMNL approach, this study aims to uncover hidden variations in cost and time sensitivity that traditional models fail to reveal [25,42,43]. Integrating such robust econometric methods allows for a more flexible specification of travel behavior [37,44], thereby filling these critical gaps and providing a more precise empirical foundation for mode choice analysis in similar small-scale urban contexts.
A literature summary presenting the themes, methods, and key findings of studies conducted in different countries and samples regarding university students’ transportation preferences is provided in Table 1.
As summarized in Table 1, existing literature predominantly utilizes MNL and MMNL models to explore the impact of socio-demographic characteristics, travel attributes, land use, and infrastructure on mode choice across various global contexts. However, the synthesis of these studies reveals a persistent gap in comprehensively addressing preference heterogeneity, particularly within small-scale and transit-developing urban environments. This study aims to contribute to addressing this gap.

3. Methods

In this study, Multinomial Logit (MNL) and Mixed Multinomial Logit (MMNL) models were employed to model the transportation preferences of university students for educational trips. These methods, falling within the scope of discrete choice modeling, allow for the quantitative examination of factors influencing individuals’ choices among different transport modes [50,51].
While analyzing decision-making processes based on utility maximization, the MNL model evaluates the effects of variables such as travel time, cost, and access on mode choice [52,53]. Although widely preferred in transportation research due to its simple structure and computational ease, its assumption of fixed coefficients for all individuals can sometimes be insufficient in reflecting unobserved heterogeneity in preferences [54,55].
The MMNL model, used to address this limitation, represents preference heterogeneity more flexibly by defining parameters that are randomly distributed across individuals. This approach has the potential to predict the transportation preferences of different user groups more accurately [46,54]. However, the MMNL model introduces higher computational complexity and challenges in parameter interpretation. Therefore, when selecting a model, both predictive power and ease of application must be considered.

3.1. Multinomial Logit (MNL) Model

The MNL model is a widely used statistical tool for predicting outcomes when the dependent variable is categorical with two or more possible outcomes. Based on the random utility maximization theory, this model assumes that individuals choose the transportation alternative that provides the highest utility. In transport-related research, the MNL model is extensively utilized due to its ability to model discrete choice behavior, offering a mathematically convenient and computationally efficient closed-form solution for predicting travel mode and route choices [24,39,56]. This model is particularly effective in identifying the significance of various attributes—such as price, convenience, and user demographics—on individuals’ decision-making processes [4,56]. The utility associated with each alternative is modeled as a function of observable attributes and individual-specific characteristics [51,57,58].
U i j = V i j + ε i j = β j 0 + k = 1 K β j k x i j k + ε i j
where U i j   is the utility of mode j for individual i , V i j is the deterministic component, and ε i j is the error term. β j 0   represents the alternative-specific constant, β j k are the parameters of mode j with k   explanatory variables, and x i j k   is the vector of explanatory variables.
The probability P i j that individual i chooses mode j is given by [50,51,59]:
P i j = e V i j j J e V i j
The parameters of the MNL model are estimated using the maximum likelihood method. To facilitate estimation, the log-likelihood (LL) function is used, which simplifies computations by converting products of probabilities into sums [50,51,59]:
L L ( β ) = i = 1 N j J δ i j ln ( P i j )
where δ i j is the selection indicator, taking the value 1 if individual i chooses mode j , and 0 otherwise.
The practical applicability of the MNL model in urban mobility is well-illustrated in recent literature. For instance, in a study identifying the factors influencing the choice of different ride-hailing services in Shenzhen, China, the MNL model was employed to analyze how service-specific attributes and user profiles dictate market shares [56]. Such applications demonstrate that the model can effectively calibrate significant factors—including age, income, travel purpose, and comfort levels—to predict the probability of choosing specific transport services. By comparing these predictions with actual survey data, the model provides a robust framework for validating travel behavior patterns and informing policy-making in diverse urban contexts.

3.2. Mixed Multinomial Logit (MMNL) Model

The Mixed Logit model, an extension of the traditional logit family, accommodates random taste variation by allowing at least one parameter vector ( β ) to vary randomly across individuals in the population. These random parameters are assumed to follow continuous probability distributions—such as normal, constrained normal, uniform, or triangular—thereby capturing unobserved heterogeneity in preferences. The choice probability of individual n selecting alternative i under the MMNL framework is defined as follows [45,60]:
P n i = L n i ( β ) f ( β | θ ) d β
where L n i ( β ) is the logit probability evaluated at parameters β , and f ( β | θ ) is a density function of the random parameters defined by θ .
The MMNL model has gained wide acceptance in the literature for modeling individual preference heterogeneity (e.g., value of time) by relaxing the restrictive assumptions of the MNL model [61,62]. A critical methodological decision in this process is selecting the appropriate probability distribution for random parameters such as travel time and cost [63]. In this study, the following distributions were considered:
  • Normal Distribution (n): While commonly preferred due to its symmetric structure and ease of application [64], its unbounded nature assigns probability to every real number. This can lead to the wrong sign problem, where the model implies that a portion of the population derives positive utility from higher travel times or costs, a result that contradicts rational economic behavior [62,65].
  • Uniform Distribution (u): This distribution assumes that preference parameters are distributed evenly across a specific range without a distinct peak [65]. Similar to the Normal distribution, if the spread is sufficiently large relative to the mean, the Uniform distribution can cross into the positive domain. This results in theoretical inconsistencies where a segment of the population is estimated to have positive coefficients for cost or time [62,66].
  • Triangular Distribution (t): Favored for its bounded nature and defined peak, the triangular distribution avoids the infinite tails of the Normal distribution. However, in its unconstrained form, it shares the same flaw as the Normal and Uniform distributions, potentially extending into the positive domain. To resolve this, it is often applied under linear constraints to guarantee the negativity of the cost parameter while allowing for flexible modeling of heterogeneity [65,67].
  • Constrained (or Truncated) Normal Distribution (cn): This specification restricts the domain of the Normal curve, typically truncating it at zero. By doing so, the analyst enforces theoretical consistency, preventing the model from estimating positive coefficients for cost or time (ensuring negative marginal utility). This approach effectively handles issues of indifference and avoids the variance inflation associated with Log-normal distributions, allowing for more controlled and consistent modeling of outliers [52,65].
Although the lognormal distribution is sometimes used to fix parameter signs, its long tail can lead to excessive standard deviation estimates and convergence issues [68,69]. Research suggests that using constrained distributions, with bounds derived directly from the data, is a more robust methodological approach to minimize estimation bias caused by fixed or unbounded distributions [65]. Particularly for Value of Time (VoT) estimations, fixing the cost parameter or carefully constraining the distribution is vital for the reliability of the economic values obtained [70].

3.3. Factors Affecting Mode Choice

Individuals’ mode choice preferences are shaped by the interaction of numerous individual and environmental variables. In this context, demographic characteristics, socioeconomic status, and travel attributes factors significantly influence the choice between sustainable and non-sustainable transport modes.
  • Demographic Characteristics: Age, gender, household size, and resident status play a determining role in individuals’ transportation preferences. Notably, women and individuals in lower income groups exhibit a higher tendency to prefer sustainable transport modes, such as public transport [71].
  • Socioeconomic Variables: Income, vehicle ownership, financial considerations and environmental awareness are critical for promoting sustainable transportation options [32,71]. Limited access to economic resources and sensitivity to environmental issues can encourage individuals to shift from private motorized vehicle use toward more sustainable choices.
  • Travel Attributes: Trip-specific characteristics, particularly travel time, travel cost, and travel distance, constitute the core components of the utility function in discrete choice models. According to rational economic theory, an increase in travel time or cost is expected to reduce the utility of a specific mode [51,59]. However, the sensitivity to these factors can vary significantly across individuals, necessitating the use of models like MMNL to capture this heterogeneity [72]. Additionally, travel distance imposes physical constraints on active modes while making motorized options more feasible for longer journeys. The spatial location of the campuses further defines these distance constraints and the accessibility of public transport networks. A comparative examination of the independent variables reveals that the tendency toward high-speed modes is generally associated with psychological and physical factors such as comfort, speed, and the desire for personal space. Conversely, the orientation toward sustainable modes is observed to have a stronger correlation with factors such as economic reasons, environmental awareness, and accessibility [73,74].
To measure the impact of these variables, the MNL model provides the capability to analyze factors affecting students’ transportation preferences across multiple alternatives [75]. The model specifically estimates the propensity to choose sustainable modes by measuring the effects of variables such as travel time, cost, distance, and individual characteristics [73].
Furthermore, the MMNL model is employed to account for preference differences across individuals and to evaluate the impact of these variations on the model [60]. This allows for more flexible estimation that reflects heterogeneity in individual preferences. These modeling approaches provide evidence-based data for sustainable urban transport strategies, such as developing public transport infrastructure, expanding bike-sharing systems, and designing university-oriented transportation policies [73,74,75,76].

3.4. Case Study and Data Source

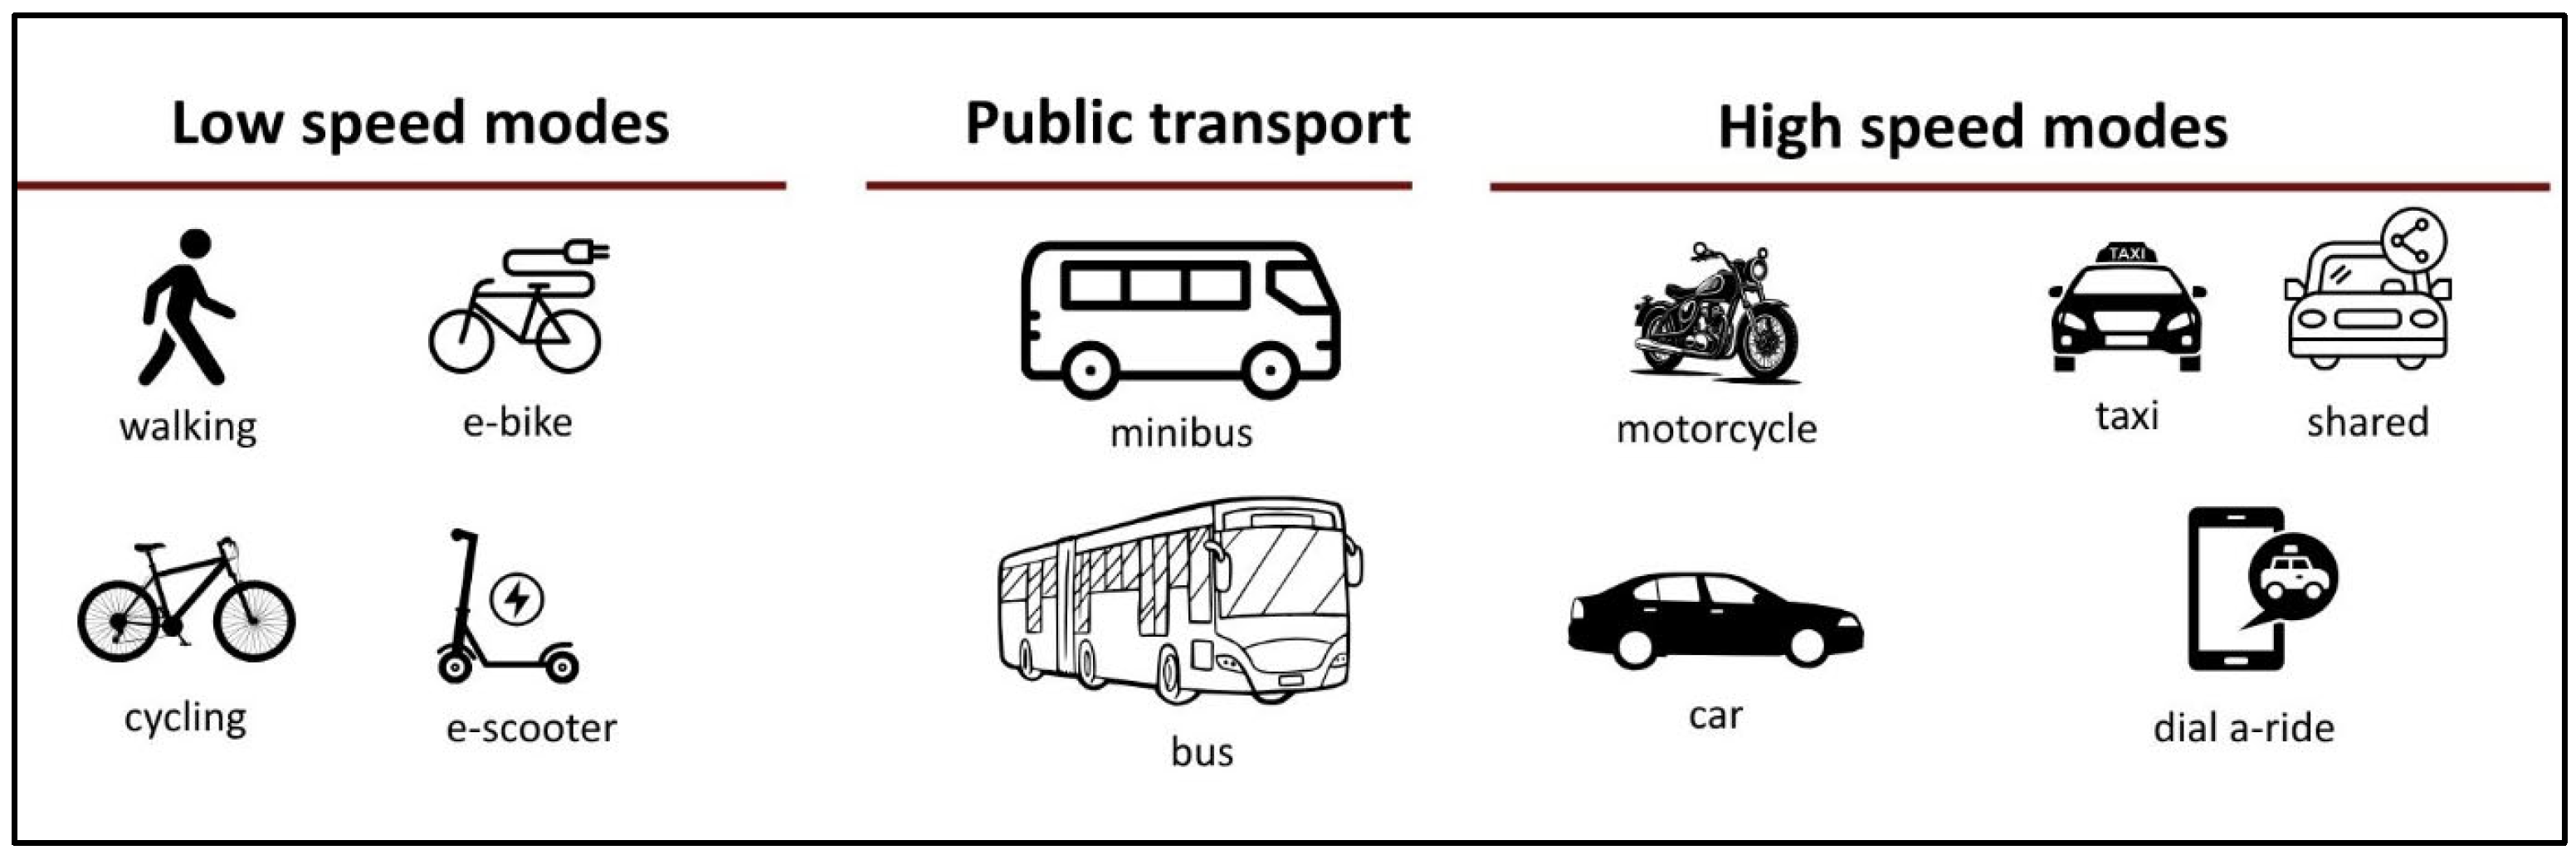
This study investigates the transportation mode preferences of university students residing in Kütahya, a small-scale city in Türkiye, with a particular focus on home-based educational trips. The classification of transportation alternatives was specifically designed to reflect the unique urban context of Kütahya. For analytical purposes, these alternatives were grouped into three distinct categories, as illustrated in Figure 1.
Low-speed modes (LSM) encompass walking, bicycles, e-bikes, and e-scooters. Although these modes exhibit different operational characteristics, they were grouped together to effectively observe the potential behavioral shifts toward active transportation. Public transport (PT) comprises buses and minibuses. Finally, high-speed modes (HSM) cover private cars, motorcycles, taxis, and shared vehicles. Within the HSM category, private cars and motorcycles are the dominant modes, whereas taxis and shared vehicles account for a very limited number of observations. Because HSM constitutes a minority class within the overall dataset, all high-speed alternatives were aggregated into a single category to ensure statistical reliability.
Data were obtained from the survey database developed within the framework of the Kütahya Transportation and Parking Master Plan (KTPMP). The dataset consists of revealed preference (RP) travel surveys conducted with students of Kütahya Dumlupınar University and Kütahya Health Sciences University. The survey was administered during the 2022–2023 fall semester as part of the master plan study.
The sampling strategy was designed within the KTPMP framework based on zonal distribution principles, ensuring that respondents were proportionally selected from different zones of the city in order to represent the spatial distribution of university students. The original survey dataset was collected and pre-processed by the master plan research team and then provided to the authors for further analysis.
In total, 1514 valid student responses were included in the analysis. Considering that the total number of university students in Kütahya is approximately 44,000, this sample size corresponds to a 95% confidence level with an approximate margin of error of 2.5%, demonstrating a highly robust and representative sample for discrete choice modeling.
The final dataset includes socio-demographic, socio-economic, and travel-related variables used to model students’ mode choice behaviour. The variables used in the model are defined in Table 2. The survey collected RP information, including students’ actual travel modes and related attributes for their regular trips. Travel attributes such as travel time and cost were obtained from respondents’ reported travel experiences and were incorporated into the model as explanatory variables for the available transport alternatives.
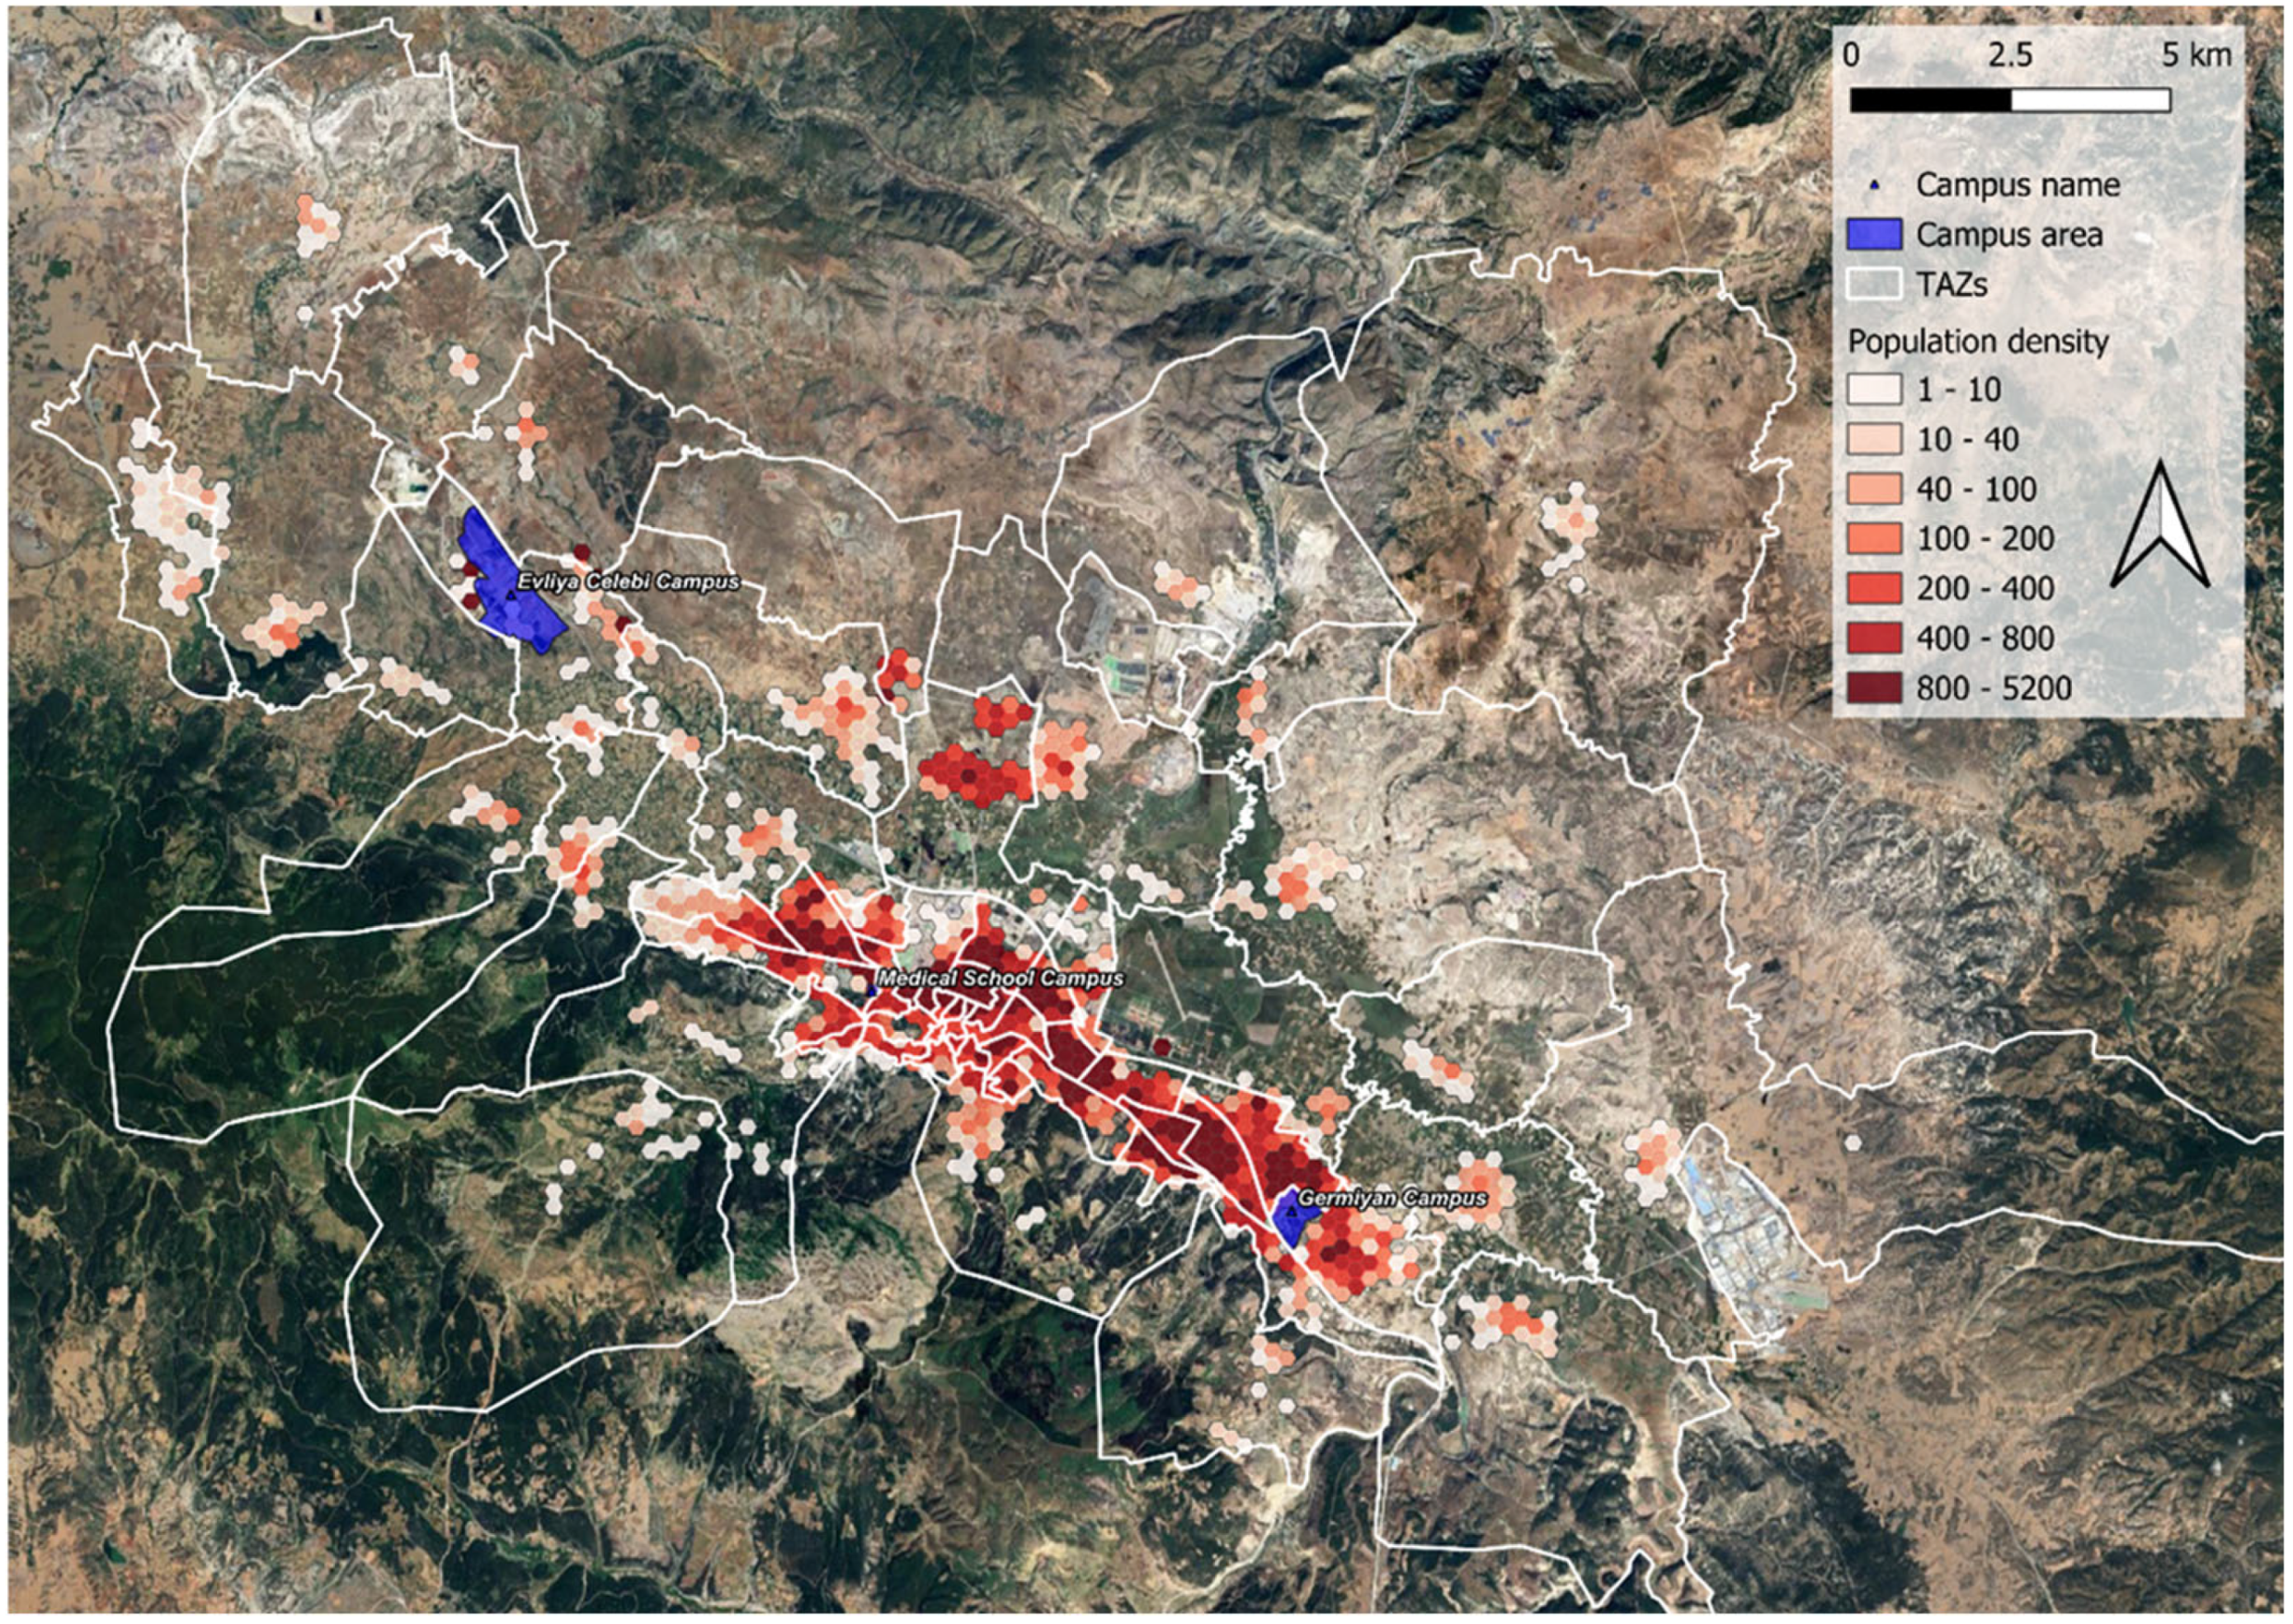
Within the scope of the study, the transportation behaviors of university students were examined from a multidimensional perspective, considering the physical and spatial locations of two different higher education campuses situated in the center of Kütahya province (Figure 2). The distance of the campuses to the city center, the surrounding transportation infrastructure, and physical facilities for micromobility directly influence students’ mode choice preferences. In this context, travel distance emerges as a primary determinant; the propensity for walking increases for short-distance trips, whereas public transport systems or private vehicle usage become more dominant for long-distance access requirements.
Furthermore, individual and socio-economic variables, such as vehicle ownership and household income, play a decisive role in transportation preferences. A higher tendency toward HSM is observed among students who own vehicles, while walking and public transport usage are more prevalent among students without vehicles and those with lower socio-economic status. Income level is evaluated as a multi-layered factor that shapes not only the cost-related dimension of mode choice but also students’ expectations regarding time, comfort, and accessibility.
The findings demonstrate that spatial and socio-economic conditions interact to exert a decisive influence on students’ transportation behaviors. Consequently, it is evident that the physical location of university campuses, their integration with public transport, bicycle networks, and planning for campus-city connectivity play a critical role in shaping transportation preferences. These analyses offer significant strategic inputs for local authorities and university administrations in terms of transportation planning and sustainability-based policy formulation.

3.5. Modeling Framework

The study utilizes household survey data obtained within the scope of the KTPMP. The primary objective is to understand university students’ transportation behaviors based on key variables such as housing type, mode choice preference, travel distance, vehicle ownership, and income level. Within the framework of discrete choice modeling, the analysis aims to identify the determinants of students’ home-to-campus mode choices while accounting for both observable characteristics and unobserved preference heterogeneity.
In this study, a sequence of MNL and MMNL models was estimated following a systematic and theory-guided specification strategy. The classical MNL model was first applied to analyze the deterministic effects of observable individual and environmental variables on mode choice. However, since the MNL model assumes fixed coefficients across individuals and therefore cannot capture preference heterogeneity, Mixed Logit models were subsequently estimated to allow selected parameters to vary randomly across individuals.
Alternative model specifications differed only with respect to the distributional assumptions of the travel time and travel cost parameters, while the remaining attributes and utility structure were kept identical across all models. Specifically, four alternative distributions were tested for these parameters—normal, truncated normal, uniform, and constrained normal—resulting in a total of 16 MMNL specifications in addition to the baseline MNL model.
Model performance was evaluated using several goodness-of-fit indicators, including LL, adjusted McFadden’s R2 (ρ2), the Akaike Information Criterion (AIC), and the Bayesian Information Criterion (BIC). In addition, model accuracy was assessed using a deterministic preference approach by comparing predicted choice outcomes with the observed choices. To ensure behavioral validity, coefficient sign expectations were examined alongside these performance measures. However, model selection was primarily guided by information criteria, overall goodness-of-fit, and predictive accuracy. All explanatory variables were retained across model specifications to maintain comparability. A minimum confidence level of 90% was required for statistical significance; however, the number of significant coefficients was not used as a model selection criterion. After identifying the best-performing specification, the consistency of the estimated coefficient signs with theoretical expectations was further evaluated.
All MMNL models were estimated using maximum simulated likelihood with 500 pseudo-random draws, applying the same random seed across all model estimations to ensure reproducibility. Model convergence was assessed through the stability of the log-likelihood values and gradient convergence diagnostics, and all estimated models achieved stable convergence.
Model estimations were performed using the R version 4.5.1 statistical computing environment [77]. The mlogit [78] and gmnl [79] packages were utilized for estimating the MNL and MMNL models, while ggplot2 [80] was employed for graphical visualization of the results.
The analytical framework provided by the final model not only offers insights into current preferences but also enables impact analysis of policy scenarios regarding transportation systems. By quantitatively demonstrating the variable effects on sustainable and high-speed modes, the study contributes to structuring decision-making mechanisms in transportation planning and environmental policy-making in a more data-driven and effective manner. In this context, the study is directly aligned with the sustainable cities and communities goal of the SDGs. The findings indicate that students’ transportation preferences are not solely shaped by individual tendencies but possess a structure that can be strategically guided toward sustainability.

4. Results

Table 3 presents a comparison of the estimated MNL and MMNL models. As a baseline, the MNL model was first estimated, yielding an LL value of −450.3, an adjusted ρ2 of 0.587, and a prediction accuracy of 91.48%. While these goodness-of-fit statistics and overall accuracy indicate a satisfactory level of explanatory performance, the MNL model assumes homogeneous preferences across individuals. Consequently, it has limited ability to capture the behavioral heterogeneity in students’ transportation mode preferences.
Table 3 also provides insights into the distributional assumptions and statistical significance of the estimated parameters. Across the MMNL specifications, the number of statistically significant coefficients remains relatively stable, typically ranging between 13–14 parameters significant at the 95% confidence level and 3–4 parameters at the 90% level. This stability indicates that differences in model performance are mainly attributable to the specification of random parameter distributions rather than changes in the statistical relevance of the explanatory variables.
However, the sign of the travel time parameter varies depending on the assumed distribution. In particular, models employing normal and uniform distributions occasionally produce a positive travel time coefficient, which contradicts the theoretical expectation that increases in travel time reduce the utility of a transportation mode. In contrast, specifications using constrained normal or triangular distributions consistently yield negative and statistically significant coefficients for travel time, aligning with behavioral expectations. Similarly, the travel cost parameter generally maintains the expected negative sign across both MMNL and MNL models, although its level of statistical significance varies slightly depending on the assumed distribution.
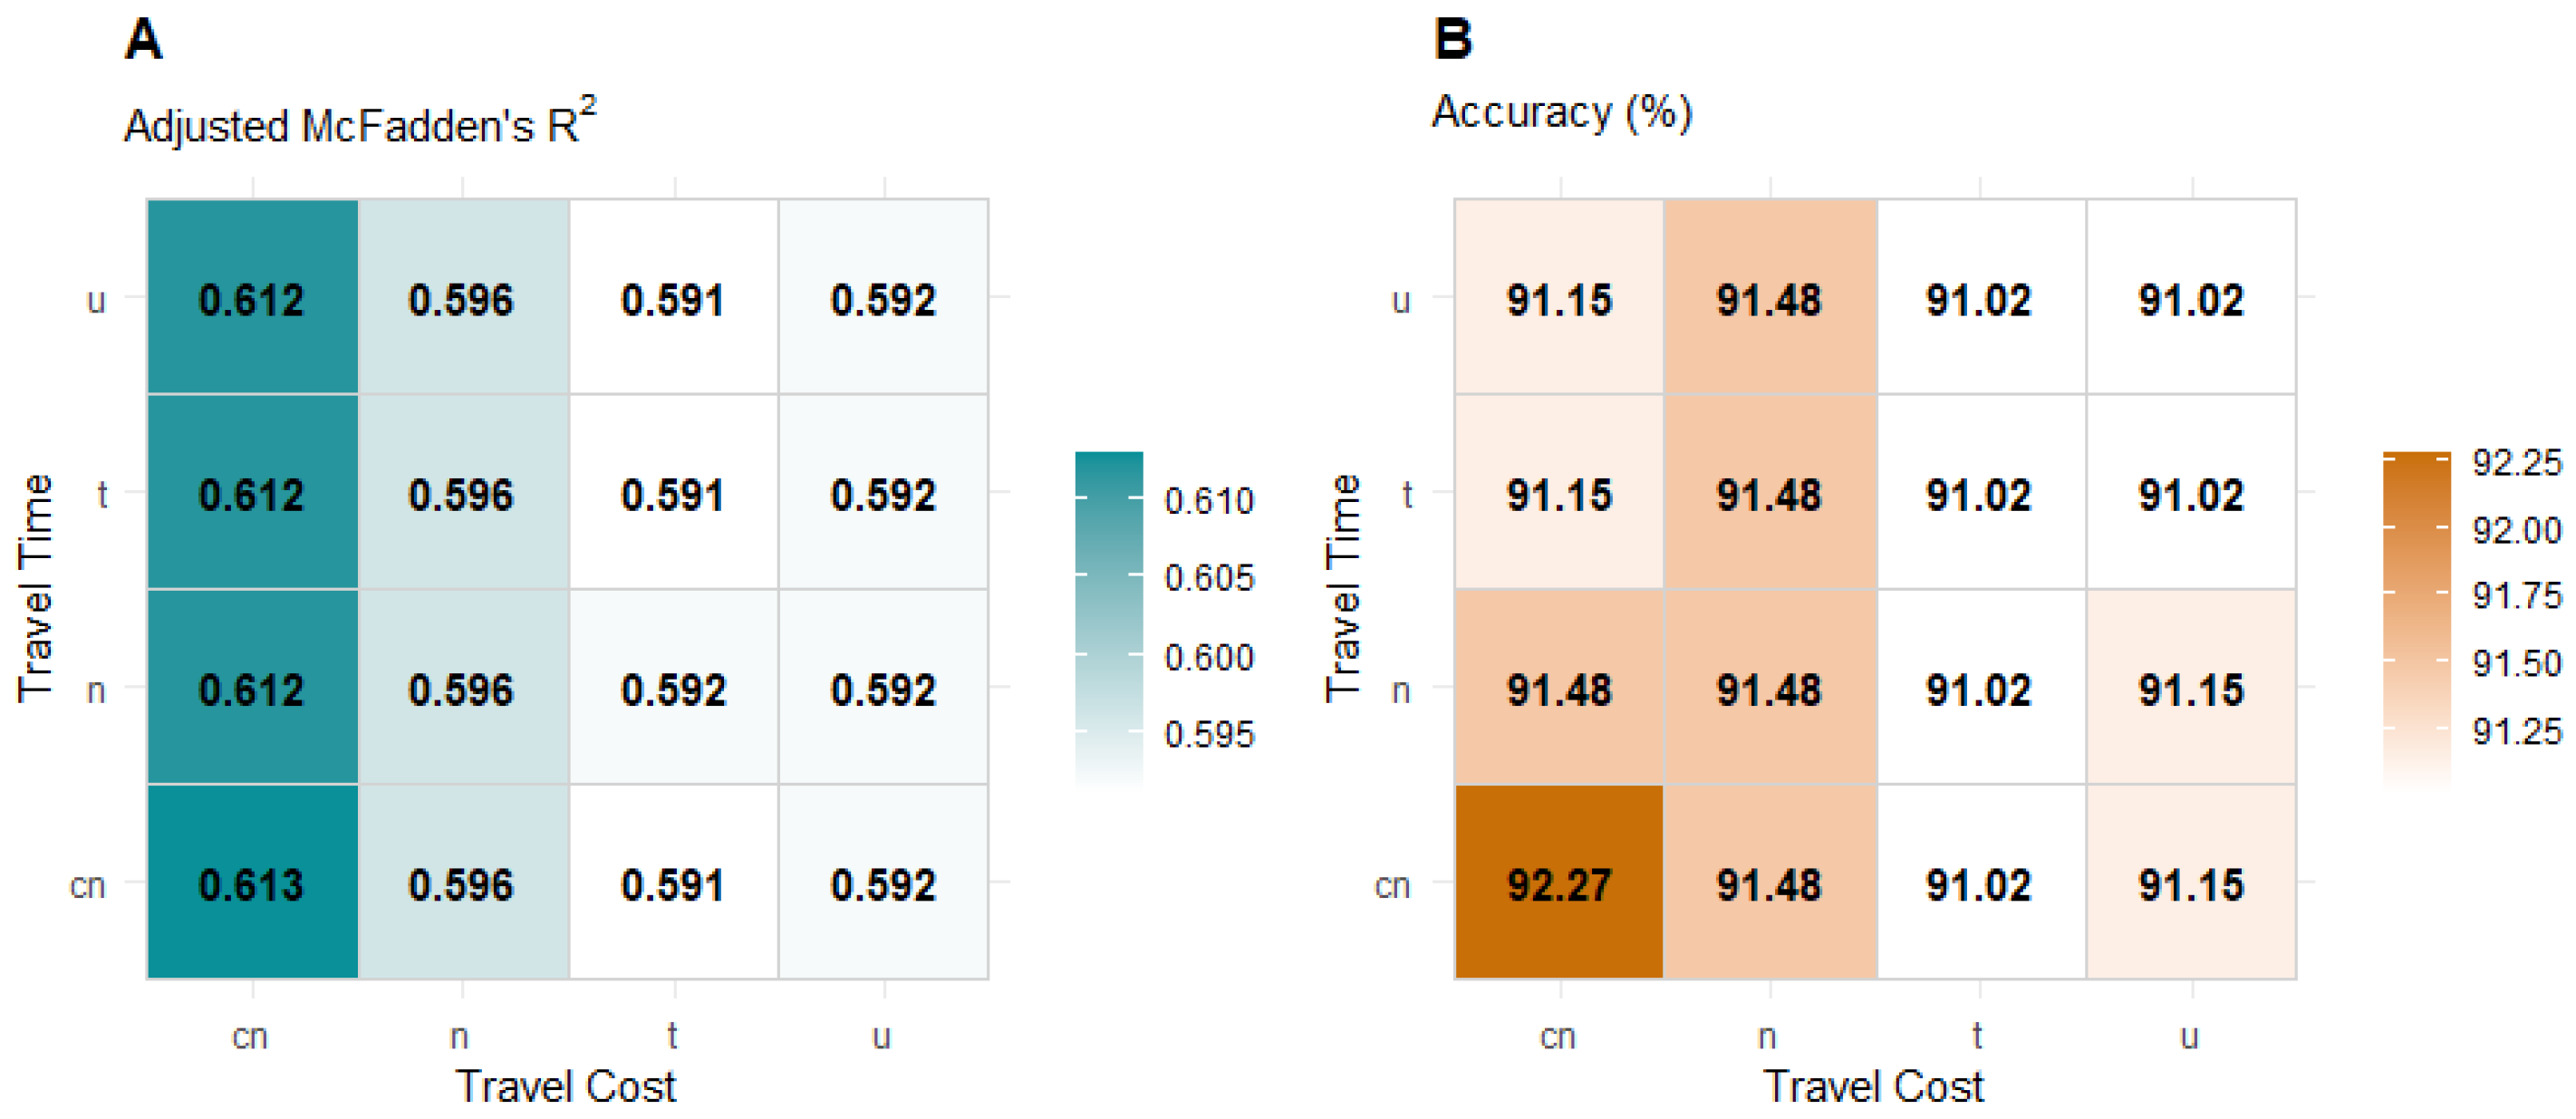
The results indicate that the MMNL models consistently outperformed the MNL baseline. The LL values for the MMNL specifications ranged from −444.5 to −418.4, all showing improvement over the MNL model. Similarly, the Adjusted ρ2 for the MMNL models ranged between 0.591 and 0.613, surpassing the baseline performance. This improvement serves as a clear indicator of the random parameters’ capacity to capture unobserved heterogeneity in students’ transportation preferences.
A detailed examination of Figure 3 reveals a distinct pattern regarding parameter sensitivity. While varying the distributional assumption of travel cost parameter leads to substantial changes in evident from the distinct vertical bands in the heatmaps—altering the distribution of travel time has a minor effect on model performance. This suggests that the model fit is driven primarily by how the heterogeneity in travel cost is specified.
Considering prediction accuracy together with all other evaluation metrics, the specification in which both travel time and travel cost were modeled using a constrained normal (cn) distribution emerged as the best-performing model. This specification achieved the highest overall model fit while simultaneously ensuring theoretical consistency by yielding the expected negative signs for both travel time and travel cost parameters.
The fact that the adjusted ρ2 reached significantly higher levels compared to the MNL model demonstrates the substantial improvement provided by the mixed logit specification. Crucially, the standard deviations for travel time and cost variables were found to be statistically significant, confirming the existence of inter-individual heterogeneity. The finding that travel cost, in particular, is perceived differently across individuals highlights the theoretical advantage of the MMNL framework. In light of these findings, when model fit, information criteria, and explanatory power are evaluated collectively, it was concluded that the MMNL model with constrained normal distributions for both travel time and cost is the most appropriate model for this study. This model best meets the study’s objectives both theoretically and in terms of statistical performance.
Table 4 presents the estimation results of the final MMNL model—utilizing constrained normal (cn) distributions for travel time and travel cost—compared with the classical MNL model. In both models, HSM was set as the reference alternative. Consequently, the coefficients represent the utility of LSM and PT relative to HSM. Although HSM represents a relatively small share of the observations (4.82%), it was deliberately selected as the baseline category because it represents the most carbon-intensive and cost-dominant mode. Setting HSM as the reference provides the most intuitive and policy-relevant interpretation for the coefficients of sustainable alternatives (LSM and PT). In addition, robustness checks—including stochastic cumulative probability assessments across all model specifications—yielded consistent behavioral interpretations.
Travel attributes: In the MMNL model, the travel time coefficient (−0.131) is negative and statistically significant, aligning with theoretical expectations that an increase in travel time reduces the utility of a transportation mode. Conversely, the MNL model yielded a positive coefficient for travel time (0.081), a result that contradicts fundamental economic theory and behavioral expectations. Because the standard MNL specification assumes fixed parameters across individuals and relies on the IIA property, it may inadequately represent variations in sensitivity to travel time within a heterogeneous student population. As a result, the estimated coefficient may partially reflect aggregated behavioral responses or correlations with other travel attributes, such as travel distance. When a single uniform sensitivity parameter is imposed across individuals with diverse travel patterns, the model may fail to accurately capture the expected negative marginal utility of travel time. This correction of the coefficient sign in the MMNL specification demonstrates its superior capability in modeling realistic travel behavior compared to the base MNL model.
Regarding travel cost, the mean coefficient in the MMNL model (−4.342) is both negative and statistically significant, confirming that higher costs systematically reduce the utility of a chosen mode. Crucially, the standard deviation for the travel cost parameter (sd. Travel cost) was estimated at 5.840 and also found to be statistically significant. This finding is pivotal: while the population generally exhibits price sensitivity (indicated by the significant negative mean), there is substantial unobserved heterogeneity in how intensely individual students perceive these costs (indicated by the significant standard deviation). This variance justifies the use of the MMNL framework over the fixed-parameter MNL model. In contrast, the standard deviation for travel time (0.010) was not significant, suggesting that sensitivity to travel time is relatively homogeneous across the sample.
Travel distance exhibits a dual effect: it has a strong negative correlation with LSM (−1.057), confirming that active modes are less preferred as distance increases. However, it shows a positive association with PT (0.395), suggesting that for longer distances, students are more likely to choose public transport over high-speed modes (likely due to the cost constraints of HSM options like taxis for non-car owners).
Socio-economic factors: Mobility resources are among the strongest predictors of mode choice. Car ownership has a substantial negative impact on both LSM (−11.984) and PT (−11.106) preferences. This indicates that students who own cars are significantly less likely to walk, cycle, or use public transport compared to using high-speed modes. Similarly, possessing a driving license negatively influences the choice of sustainable modes.
Motorbike ownership, on the other hand, shows a positive effect on LSM (3.876). This finding suggests that students who own motorbikes may still exhibit a greater tendency toward active modes for short-distance trips, possibly due to greater familiarity with flexible and individual mobility options or the relatively compact urban structure of the study area.
Monthly income has a small but negative impact on LSM (−0.004), indicating that as students’ income levels increase, the likelihood of choosing active transportation modes slightly decreases. This pattern suggests that higher-income students may be more inclined to shift toward faster or more comfortable motorized modes as their financial capacity allows.
Socio-demographic factors: Regarding demographics, gender (female) shows a positive coefficient for both LSM and PT. Specifically, female students are significantly more likely to choose Public Transport compared to males (2.651). Household size also shows a positive relationship with sustainable modes, reaching statistical significance for LSM in the MMNL model.
Age generally exhibits a negative association with LSM and PT, though the significance levels vary between the MNL and MMNL specifications. This variation highlights the ability of the mixed logit model to account for unobserved heterogeneity and to provide more reliable estimates of demographic effects.
Possessing a driving license has a strong negative effect on the likelihood of choosing sustainable modes. This finding indicates that students who are licensed drivers are significantly less likely to prefer active transportation or public transport, as access to driving privileges increases the attractiveness of private or high-speed motorized travel options.

5. Discussion

In this study, the transportation mode preferences of university students in a small-scale city were analyzed using MNL and MMNL models. The comparative analysis revealed distinct performance differences between the two modeling approaches in determining mode choice for educational trips. The MNL model, one of the most widely used methods in discrete choice analysis, relies on the assumption of independent and identically distributed (IID) error terms and the IIA [51,81]. However, these assumptions are often insufficient to reflect the preference heterogeneity among individuals [82]. The MMNL model, employed to overcome this limitation, offers a structure where coefficients are randomly distributed across individuals, thus modeling heterogeneous preferences more realistically [62,83]. Because the primary objective of this study was to explicitly capture unobserved heterogeneity and unconditionally relax the restrictive IIA assumption, a formal pre-test (e.g., Hausman-McFadden) for the baseline MNL was bypassed. The highly significant standard deviations of the random parameters in the subsequent MMNL estimations empirically confirm that the strict IIA assumption was indeed violated, fully justifying the transition to the mixed logit framework. Indeed, in this study, the MMNL model provided a significant improvement in the log-likelihood value and an increase in the ρ2 value. This empirical evidence supports the model flexibility–fit improvement relationship emphasized by [62,82].
The findings demonstrate that individual and environmental factors exert significant effects on transportation preferences. Gender emerged as a significant determinant; the probability of female students choosing both LSM (walking, e-scooter, etc.) and PT (minibus or bus) is significantly higher compared to male students. This indicates that women possess higher sensitivity regarding safety, accessibility, and planned transport infrastructure, suggesting that gender equity must be prioritized in transportation planning. Similarly, household size exhibits a positive correlation with the preference for public transport and low-speed modes. This tendency likely stems from lower vehicle availability per capita in larger families or the economic necessity of using shared transport options in communal living arrangements. Although the age coefficient is not statistically significant its negative sign is consistent with previous findings [84] suggesting that younger individuals may have a greater tendency to prefer active transport modes.
Car ownership and driver license possession variables were found to negatively affect the orientation toward low-speed modes. This parallels findings by [85] and [86], which highlight the reductive effect of private vehicle ownership on public transport and active mobility usage. This suggests that some students utilize private cars not merely as a means of transport but as a tool for flexibility and creating alternatives. Conversely, a positive relationship was observed between bicycle ownership and the preference for PT and LSM. This finding indicates that bicycle ownership does not compete with public transport but rather reinforces the adoption of sustainable transportation habits. It implies that students who own bicycles are more likely to engage in multimodal travel (potentially using bicycles for the first/last mile of public transport trips) or simply possess a stronger propensity for active mobility compared to car-dependent students.
Contrary to the general consensus in the literature [65,82], which typically identifies the heterogeneity of time sensitivity as the primary justification for employing MMNL models, this study observed a distinct pattern. Although the mean coefficient for travel time was estimated as negative and statistically significant—confirming the theoretical expectation that students consistently derive lower utility from longer journeys—its standard deviation was statistically insignificant. This indicates that while the student population is universally sensitive to travel time, this sensitivity is relatively homogeneous. Consequently, the superior performance of the MMNL model in this context is driven primarily by its ability to capture substantial unobserved heterogeneity in travel cost.
Regarding travel cost, both the mean coefficient and its standard deviation were found to be statistically significant. As expected, the mean effect is negative, indicating that as costs increase, the utility of a mode decreases. However, the significance of the standard deviation reveals that students’ sensitivity to price varies substantially across the sample. This likely reflects the varying degrees of economic sensitivity and vulnerability among university students; while the entire group is cost-conscious, the intensity of this constraint differs from person to person. Consequently, this underscores the necessity of developing student-specific pricing policies, subscription systems, and incentive-based applications in public transportation to address these diverse economic constraints effectively.
In conclusion, it has been determined that gender, vehicle ownership, economic status, and trip characteristics must be evaluated holistically to encourage sustainable transport behaviors in small-scale cities. The study’s findings demonstrate that the MMNL model offers higher explanatory power than the MNL model from both methodological and empirical perspectives, consistent with trends reported in the literature. However, since the advantages provided by MMNL come with higher computational costs and interpretation challenges [62], model selection in policy applications should be made by considering data structure, sample size, and analysis objectives. These findings provide critical strategic inputs for both local transport planners and university campus administration in the policy development process.

6. Conclusions

In this study, the determinants affecting the transportation mode preferences of university students were analyzed using data from 1514 students in Kütahya, Türkiye. Compared to existing studies that predominantly focus on large metropolises and assume uniform preferences, the innovative aspect of this research lies in its dual focus: empirically addressing the unique mobility dynamics of a small-scale city and employing a robust MMNL framework to uncover hidden unobserved heterogeneity. The MNL model was used as a baseline, while the MMNL model was applied to capture individual preference heterogeneity. The results revealed that travel time, travel cost, driving license possession, gender, car ownership, household size, and travel distance exert statistically significant effects on mode choice. Crucially, the MMNL analysis highlighted a distinct behavioral pattern: while sensitivity to travel cost exhibited substantial unobserved heterogeneity across the student population, sensitivity to travel time was found to be relatively homogeneous. This finding distinguishes the behavioral dynamics of student populations in small-scale cities from the patterns commonly reported in the broader literature and underscores the need for differentiated pricing strategies in sustainable transport policy.
Accordingly, it has been established that transport policies must focus not merely on basic demographics but also on daily mobility habits, vehicle ownership, and environmental factors to meet the SDGs. In developing sustainable transport policies, key intervention areas include supporting active transport modes (walking and cycling), reducing the number of transfers or enhancing comfort in public transport, and improving safe transport opportunities for female students.
The findings derived from this study, conducted to understand the factors affecting school-related transport choices in a small-scale city, revealed the multidimensional structure of travel behavior. Based on the significant effects of gender, vehicle ownership, trip characteristics, environmental factors, and cost, the following policy implications are proposed to contribute to sustainable and inclusive transportation planning:
  • Gender-sensitive infrastructure: The tendency of female students toward low-speed and public transport highlights the critical importance of safety, accessibility, and comfort. Consequently, infrastructure around the campus should prioritize adequate lighting, safe waiting areas, and gender-sensitive transport services.
  • Integration of private and micromobility: The strong influence of car and motorcycle ownership on mode choice suggests a need to manage the transition from private vehicles to sustainable modes. To achieve this, integrating vehicle parking areas with micromobility points (e.g., shared e-scooter or bicycle stations) should be encouraged to promote multi-modal travel.
  • Encouraging Multimodality through Cycling: Although the current model suggests limited integration between cycling and public transport, positioning cycling as a complementary feeder mode is essential for sustainable mobility. Therefore, to capitalize on this multimodal potential, cycling infrastructure must be seamlessly integrated with public transport networks (e.g., bike racks on buses, secure parking at stops).
  • Economic accessibility: The negative effect of transportation cost acts as a barrier for economically vulnerable student groups accessing sustainable modes. To address this, specific discounted subscription systems, supportive subsidies for public transport, and financial support policies for low-income students should be developed.
In conclusion, transportation choice for university students in small-scale cities is a multidimensional process shaped by infrastructure, safety, socio-economic status, and mobility habits, rather than individual preferences alone. The findings underscore that factors such as safety, timing, cost, and vehicle ownership are decisive in students’ orientation toward slow modes and public transport. Therefore, campus transportation policies must be redesigned to consider not only physical infrastructure but also social inclusion and economic accessibility. Holistic and student-centered strategies developed in this context will contribute both to ensuring sustainable urban mobility and enhancing the quality of university life.
Several avenues for future research emerge from this study. First, the cross-sectional design limits causal inference; longitudinal or panel data could better capture how students’ mode choices evolve over their academic tenure. Second, integrating stated preference experiments alongside the revealed preference data used here would enable the evaluation of hypothetical policy interventions, such as congestion pricing or new cycling infrastructure. Third, the incorporation of attitudinal and perceptual variables—such as environmental awareness, perceived safety, and comfort—could enrich the behavioral interpretation of the model. Fourth, a methodological limitation of this study is the aggregation of specific transport modes into broad categories (such as LSM and HSM) due to the marginal usage rates of micro-mobility and specific high-speed options in the local context. Future research should aim to disaggregate these modes to uncover more nuanced substitution patterns. Finally, applying latent class models as an alternative to the continuous mixing approach of MMNL could help identify distinct student segments with qualitatively different decision-making patterns.
Furthermore, as part of our ongoing research utilizing a more comprehensive dataset, future studies will significantly benefit from conducting sensitivity analysis. Utilizing integrated frameworks, such as deep learning combined with global sensitivity analysis, can effectively prioritize explanatory factors and assess the robustness of model conclusions against simultaneous variations in key parameter assumptions [87,88].

Author Contributions

Conceptualization, R.P., M.S.Y. and K.B.A.; Methodology and Supervision, K.B.A. and M.S.Y.; Software, Formal Analysis and Visualization, K.B.A. and R.P.; Resources, Validation, Investigation, Data Curation and Writing—Original Draft Preparation, K.B.A. and R.P.; Writing—Review and Editing, K.B.A., M.S.Y. and R.P. All authors have read and agreed to the published version of the manuscript.

Funding

This work has been supported by Yildiz Technical University Scientific Research Projects Coordination Unit under project number FDK-2025-7231.

Institutional Review Board Statement

Not applicable.

Informed Consent Statement

Not applicable.

Data Availability Statement

The data are not publicly available due to privacy restrictions.

Acknowledgments

The authors would like to acknowledge that this paper is submitted in partial fulfilment of the requirements for a PhD degree at Yildiz Technical University.

Conflicts of Interest

The authors declare no conflicts of interest.

References

  1. da Silva Neiva, S.; Prasath, R.A.; de Amorim, W.S.; de Andrade Lima, M.; Barbosa, S.B.; Ribeiro, J.M.P.; Ceci, F.; Schneider, J.; Deggau, A.B.; de Andrade Guerra, J.B.S.O. Sustainable urban development: Can the balanced scorecard contribute to the strategic management of sustainable cities? Sustain. Dev. 2021, 29, 1155–1172. [Google Scholar] [CrossRef]
  2. Kara, C.; Ozden, A.; Yavuz, A.A.; Bilgic, S. Modeling and variable selection of healthcare trip behaviours using statistical learning techniques. Transp. Policy 2025, 170, 12–23. [Google Scholar] [CrossRef]
  3. Urrutia-Mosquera, J.; Cortés, Y.; Flórez-Calderón, L.; Lufín, M. Sustainable urban development and mobility. The role of spatial heterogeneity in sustainable trip patterns. Sustain. Dev. 2024, 33, 2171–2188. [Google Scholar] [CrossRef]
  4. Ribeiro, P.; Fonseca, F.; Meireles, T. Sustainable mobility patterns to university campuses: Evaluation and constraints. Case Stud. Transp. Policy 2020, 8, 639–647. [Google Scholar] [CrossRef]
  5. Radebe, S.S.; Breukelman, G.J.; Joubert, A.S.; Millard, L. Primary motives and barriers to physical activity participation among students registered at a semi-rural university: A mixed-methods study. Int. J. Environ. Res. Public. Health 2025, 22, 344. [Google Scholar] [CrossRef]
  6. Du, G. Study on Countermeasures of the Development of Public Transport in Small and Mid-Sized Cities in China. In Proceedings of the 18th COTA International Conference of Transportation Professionals; American Society of Civil Engineers: Reston, VA, USA, 2018; pp. 959–966. [Google Scholar]
  7. Liu, Y.; Xin, F.; Ye, Y. Research on the Characteristics of Public Transport Infrastructure and Operation in Small Cities. In CICTP 2015; American Society of Civil Engineers: Reston, VA, USA, 2015; pp. 1367–1376. [Google Scholar]
  8. Cáceres-Merino, J.; Coloma, J.F.; García, M.; Monzon, A. The Unsustainable Proximity Paradox in Medium-Sized Cities: A Qualitative Study on User Perceptions of Mobility Policies. Land 2025, 14, 944. [Google Scholar] [CrossRef]
  9. D’Apuzzo, M.; Silvestri, A.; Nardoianni, S.; Cappelli, G. Towards the Evaluation of Carbon Footprint for University Communities’ Mobility: Challenges, Opportunities, and Reduction Strategies. In Proceedings of the 2024 Third International Conference on Sustainable Mobility Applications, Renewables and Technology (SMART); IEEE: New York, NY, USA, 2024; pp. 1–6. [Google Scholar]
  10. Islam, R.; Rafique, S.; Bredikhina, O.A.; Jones, S. Getting around in a college town: A case study of transportation barriers faced by international students at UA. arXiv 2022, arXiv:220806434. [Google Scholar]
  11. Baudens, P.; Hassen, M.; Pasini, J.; Mawussi, A. Mobility capacities and smartphone use of students in Kinshasa, Democratic Republic of Congo. Mobilities 2025, 20, 536–554. [Google Scholar] [CrossRef]
  12. Delmelle, E.M.; Delmelle, E.C. Exploring spatio-temporal commuting patterns in a university environment. Transp. Policy 2012, 21, 1–9. [Google Scholar] [CrossRef]
  13. Gehrke, S.R.; Clifton, K.J. Operationalizing land use diversity at varying geographic scales and its connection to mode choice: Evidence from Portland, Oregon. Transp. Res. Rec. 2014, 2453, 128–136. [Google Scholar] [CrossRef]
  14. Kriswardhana, W.; Esztergár-Kiss, D. Identifying heterogeneity in university students’ transport mode choice. In Proceedings of the IOP Conference Series: Earth and Environmental Science; IOP Publishing: Bristol, UK, 2024; Volume 1294, p. 012027. [Google Scholar]
  15. Trček, B.; Mesarec, B. Pathways to alternative transport mode choices among university students and staff—Commuting to the University of Maribor since 2010. Sustainability 2022, 14, 11336. [Google Scholar] [CrossRef]
  16. Cattaneo, M.; Malighetti, P.; Morlotti, C.; Paleari, S. Students’ mobility attitudes and sustainable transport mode choice. Int. J. Sustain. High. Educ. 2018, 19, 942–962. [Google Scholar] [CrossRef]
  17. Chaudhry, S.K.; Elumalai, S.P. Assessment of sustainable school transport policies on vehicular emissions using the IVE model. J. Clean. Prod. 2024, 434, 140437. [Google Scholar] [CrossRef]
  18. Ferdman, A.; Shefer, D.; Bekhor, S. Land use variables in trip generation models: The case of the light rail transit in Tel Aviv. In Railway Development: Impacts on Urban Dynamics; Springer: Berlin/Heidelberg, Germany, 2007; pp. 385–413. [Google Scholar]
  19. Min, B.; Lee, G.; Kim, S. Effects of land-use characteristics on transport mode choices by purpose of travel in Seoul, South Korea, based on spatial regression analysis. Sustainability 2021, 13, 1767. [Google Scholar] [CrossRef]
  20. Shakeel, N.; Jahanzaib, M. Influence of land use, socio-demographic and travel attributes on travel behaviour in city of Lahore. Archit. Urban Plan. 2019, 15, 67–74. [Google Scholar] [CrossRef]
  21. Heeres, N.; Tillema, T.; Arts, J. Overcoming lock-in: Instruments for value creation and assessment early in the infrastructure planning process. In Place-Based Evaluation for Integrated Land-Use Management; Routledge: Oxfordshire, UK, 2016; pp. 225–248. [Google Scholar]
  22. Masoumi, H.; Mehriar, M.; Nosal-Hoy, K. Logit and Probit Models Explaining Mode Choice and Frequency of Public Transit Ridership among University Students in Krakow, Poland. Urban Sci. 2024, 8, 113. [Google Scholar] [CrossRef]
  23. Waldeck, L.; Holloway, J.; Van Heerden, Q. Integrated land use and transportation modelling and planning. J. Transp. Land Use 2020, 13, 227–254. [Google Scholar] [CrossRef]
  24. Hasnine, M.S.; Lin, T.; Weiss, A.; Habib, K.N. Determinants of travel mode choices of post-secondary students in a large metropolitan area: The case of the city of Toronto. J. Transp. Geogr. 2018, 70, 161–171. [Google Scholar] [CrossRef]
  25. Mwale, M.; Ho, C.; Luke, R.; Pisa, N. Forecasting road-based public transport needs of developing cities: A case of Lusaka City. Res. Transp. Bus. Manag. 2025, 63, 101473. [Google Scholar] [CrossRef]
  26. Kadja, C.J.M.; Dandonougbo, I.; Korem, A.; Allagbe, B.S. Pedestrian profile and perception of walkability in Hêvié, Ouèdo, and Togba in Abomey Calavi, Republic of Benin in West Africa. Edelweiss Appl. Sci. Technol. 2025, 9, 2109–2130. [Google Scholar] [CrossRef]
  27. Bouhouras, E.; Dimos, T.; Mastoras, D.; Basbas, S. Urban Mobility Choices of University Students: Insights into Satisfaction Levels and Preferences in the Thessaloniki Metropolitan Area. Urban Sci. 2025, 9, 44. [Google Scholar] [CrossRef]
  28. Obaid, L.; Hamad, K. Modelling Mode Choice at Sharjah University City, United Arab Emirates. In Proceedings of the MATEC Web of Conferences; EDP Sciences: London, UK, 2020; Volume 308, p. 02004. [Google Scholar]
  29. Ofentse, H.M.; Zuidgeest, M. Identifying transport policy gaps in student travel demand management in South Africa. J. Transp. Supply Chain Manag. 2020, 14, a522. [Google Scholar] [CrossRef]
  30. Fabio, R.A.; Croce, A.; Calabrese, C. Construction and psychometric properties of the sustainable behavior questionnaire among Italian adults. Sustain. Dev. 2024, 32, 4374–4384. [Google Scholar] [CrossRef]
  31. Ghafouri-Azar, M.; Diamond, S.; Bowes, J.; Gholamalizadeh, E. The sustainable transport planning index: A tool for the sustainable implementation of public transportation. Sustain. Dev. 2023, 31, 2656–2677. [Google Scholar] [CrossRef]
  32. Peker, R.; Yardim, M.S.; Akalin, K.B. Factors Influencing Transportation Mode Preferences for Educational Trips Among Dormitory Resident University Students in Kütahya, Türkiye. Sustainability 2024, 16, 9660. [Google Scholar] [CrossRef]
  33. Tepecik, A. The Role of Transportation in Environmental Sustainability and Climate Change Mitigation. In Interdisciplinary Approaches to Transportation and Urban Planning; IGI Global: Hershey, PA, USA, 2025; pp. 1–22. [Google Scholar]
  34. UNSD. United Nations Sustainable Development Goals 2025; United Nations: New York, NY, USA, 2025. [Google Scholar]
  35. Alves, B.B.; Mjahed, L.B.; Moody, J. Decarbonizing Urban Transport for Development; World Bank: Washington, DC, USA, 2023. [Google Scholar]
  36. Zou, Y.; Han, W.; Lin, B.; Wu, B.; Li, L.; Wu, S.; Abid, M.M. Cross-Border Travel Behavior Analysis of Hong Kong-Zhuhai-Macao Bridge Using MXL-BMA Model. J. Adv. Transp. 2023, 2023, 6690346. [Google Scholar] [CrossRef]
  37. Salas, P.; De la Fuente, R.; Astroza, S.; Carrasco, J.A. A systematic comparative evaluation of machine learning classifiers and discrete choice models for travel mode choice in the presence of response heterogeneity. Expert Syst. Appl. 2022, 193, 116253. [Google Scholar] [CrossRef]
  38. Dhibi, M.; Belkacem, L. The sampling effect on the value of travel-time savings: Estimation by discrete choice models on Tunisian data. Adv. Transp. Stud. 2013, 29, 59–70. [Google Scholar]
  39. Li, B. The multinomial logit model revisited: A semi-parametric approach in discrete choice analysis. Transp. Res. Part B Methodol. 2011, 45, 461–473. [Google Scholar] [CrossRef]
  40. Pojani, D.; Stead, D. Sustainable urban transport in the developing world: Beyond megacities. Sustainability 2015, 7, 7784–7805. [Google Scholar] [CrossRef]
  41. Alonso, A.; Monzón, A.; Aguiar, I.; Ramírez-Saiz, A. Explanatory factors of daily mobility patterns in suburban areas: Applications and taxonomy of two metropolitan corridors in Madrid region. ISPRS Int. J. Geo-Inf. 2023, 12, 16. [Google Scholar] [CrossRef]
  42. Tan, L.S. Stochastic variational inference for large-scale discrete choice models using adaptive batch sizes. Stat. Comput. 2017, 27, 237–257. [Google Scholar] [CrossRef]
  43. Hasnine, M.S.; Chung, B.; Nurul Habib, K. How far to live and with whom? Role of modal accessibility on living arrangement and distance. Transp. Transp. Sci. 2023, 19, 2055197. [Google Scholar] [CrossRef]
  44. Alam, M.J.; Mahmud, N.; Habib, M.A. Integrating machine learning and discrete choice modeling for enhanced shopping destination choice model. Travel Behav. Soc. 2025, 40, 100998. [Google Scholar] [CrossRef]
  45. Pasha, M.M.; Hickman, M.D.; Prato, C.G. Modeling mode choice of air passengers’ ground access to Brisbane Airport. Transp. Res. Rec. 2020, 2674, 756–767. [Google Scholar] [CrossRef]
  46. Mariante, G.L.; Ma, T.-Y.; Van Acker, V. Modeling discretionary activity location choice using detour factors and sampling of alternatives for mixed logit models. J. Transp. Geogr. 2018, 72, 151–165. [Google Scholar] [CrossRef]
  47. dell’Olio, L.; Cordera, R.; Ibeas, A.; Barreda, R.; Alonso, B.; Moura, J.L. A methodology based on parking policy to promote sustainable mobility in college campuses. Transp. Policy 2019, 80, 148–156. [Google Scholar] [CrossRef]
  48. Kohlrautz, D.; Kuhnimhof, T. Cyclists’ heterogeneous parking preferences and their implications for bicycle parking facilities. Transp. Res. Part Policy Pract. 2025, 191, 104298. [Google Scholar] [CrossRef]
  49. Liu, Y.; Sanko, N. Willingness to pay for shared autonomous vehicles as last-mile mobility: A case study between railway stations and university campuses in Japan. J. JSCE 2025, 12, 24-20021. [Google Scholar] [CrossRef]
  50. Akalın, K.B. Improving Trip Production and Attraction Models Using Random Regret Minimization and Random Utility Maximization Methods. Ph.D. Thesis, Eskisehir Osmangazi University, Eskişehir, Türkiye, 2021. [Google Scholar]
  51. de Dios OrtÃozar, J.; Willumsen, L.G. Modelling Transport; John Wiley & Sons: Hoboken, NJ, USA, 2011. [Google Scholar]
  52. Bei, H.; Chen, H.; Li, L.; Gao, X.; Xia, Y.; Sun, Y. Joint prediction of travel mode choice and purpose from travel surveys: A multitask deep learning approach. Travel Behav. Soc. 2023, 33, 100625. [Google Scholar] [CrossRef]
  53. Çevik, H.; Přibyl, O.; Samandar, S. Understanding travel behavior: A deep neural network and shap approach to mode choice determinants. Neural Netw. World 2024, 34, 219–241. [Google Scholar] [CrossRef]
  54. Al-Salih, W.Q.; Esztergár-Kiss, D. Effects of Individual Characteristics on Travel Behavior: An Application of the Multinomial Logit Model on the Travellers Behaviour in Budapest City. In Proceedings of the 2021 7th International Conference on Models and Technologies for Intelligent Transportation Systems (MT-ITS); IEEE: New York, NY, USA, 2021; pp. 1–6. [Google Scholar]
  55. Wang, Q.R. Towards zero-emission urban mobility: Leveraging AI and LCA for targeted interventions. In Proceedings of the Building Simulation; Springer: Berlin/Heidelberg, Germany, 2024; Volume 17, pp. 1653–1657. [Google Scholar]
  56. Li, X.; Du, M.; Zhang, Y.; Yang, J. Identifying the factors influencing the choice of different ride-hailing services in Shenzhen, China. Travel Behav. Soc. 2022, 29, 53–64. [Google Scholar] [CrossRef]
  57. Mohamad, N.A.; Ali, Z.; Noor, N.M.; Baharum, A. Multinomial logistic regression modelling of stress level among secondary school teachers in Kubang Pasu District, Kedah. In Proceedings of the AIP Conference Proceedings; AIP Publishing: Melville, NY, USA, 2016; Volume 1750. [Google Scholar]
  58. Su, P.; Liu, Y.; Zhao, L. General Deep Multinomial Logit Model. Comput. Inform. 2022, 41, 1240–1259. [Google Scholar] [CrossRef]
  59. McFadden, D. The measurement of urban travel demand. J. Public Econ. 1974, 3, 303–328. [Google Scholar] [CrossRef]
  60. McFadden, D.; Train, K. Mixed MNL models for discrete response. J. Appl. Econom. 2000, 15, 447–470. [Google Scholar] [CrossRef]
  61. Bhat, C.R. Random utility-based discrete choice models for travel demand analysis. Transp. Syst. Plan. Methods Appl. 2003, 10, 1–30. [Google Scholar]
  62. Hensher, D.A.; Greene, W.H. The mixed logit model: The state of practice. Transportation 2003, 30, 133–176. [Google Scholar] [CrossRef]
  63. Greene, W.H.; Hensher, D.A.; Rose, J.M. Using classical simulation-based estimators to estimate individual WTP values: A mixed logit case study of commuters. In Applications of Simulation Methods in Environmental and Resource Economics; Springer: Dordrecht, The Netherlands, 2005; pp. 17–33. [Google Scholar]
  64. Sillano, M.; de Dios Ortúzar, J. Willingness-to-pay estimation with mixed logit models: Some new evidence. Environ. Plan. A 2005, 37, 525–550. [Google Scholar] [CrossRef]
  65. Hess, S.; Bierlaire, M.; Polak, J.W. Estimation of value of travel-time savings using mixed logit models. Transp. Res. Part Policy Pract. 2005, 39, 221–236. [Google Scholar] [CrossRef]
  66. Lu, J.; Saito, K. Mixed Logit and Pure Characteristics Models; Working Paper; California Institute of Technology: Pasadena, CA, USA, 2021. [Google Scholar]
  67. Hossan, M.S.; Asgari, H.; Jin, X. Investigating preference heterogeneity in Value of Time (VOT) and Value of Reliability (VOR) estimation for managed lanes. Transp. Res. Part Policy Pract. 2016, 94, 638–649. [Google Scholar] [CrossRef]
  68. Algers, S.; Bergström, P.; Dahlberg, M.; Lindqvist Dillén, J. Mixed Logit Estimation of the Value of Travel Time; Working paper; Uppsala University: Uppsala, Sweden, 1998. [Google Scholar]
  69. Bai, T.; Li, X.; Sun, Z. Effects of cost adjustment on travel mode choice: Analysis and comparison of different logit models. Transp. Res. Procedia 2017, 25, 2649–2659. [Google Scholar] [CrossRef]
  70. Vichiensan, V.; Wasuntarasook, V.; Malaitham, S.; Fukuda, A.; Rujopakarn, W. Willingness to Pay for Station Access Transport: A Mixed Logit Model with Heterogeneous Travel Time Valuation. Sustainability 2025, 17, 6715. [Google Scholar] [CrossRef]
  71. Rocha, H.; Lobo, A.; Tavares, J.P.; Ferreira, S. Exploring Modal Choices for Sustainable Urban Mobility: Insights from the Porto Metropolitan Area in Portugal. Sustainability 2023, 15, 14765. [Google Scholar] [CrossRef]
  72. Mabit, S.E. Mixed logit applications in travel behaviour research. Transp. Res. Part Policy Pract. 2026, 203, 104728. [Google Scholar] [CrossRef]
  73. Xiao, W.; Zhang, W. Prediction of traffic mode selection based on MNL model. In Proceedings of the 2022 International Conference on Intelligent Transportation, Big Data & Smart City (ICITBS); IEEE: New York, NY, USA, 2022; pp. 315–317. [Google Scholar]
  74. Tang, L.; Tang, C.; Fu, Q.; Ma, C. Predicting travel mode choice with a robust neural network and Shapley additive explanations analysis. IET Intell. Transp. Syst. 2024, 18, 1339–1354. [Google Scholar] [CrossRef]
  75. Salas, P.; De la Fuente, R.; Astroza, S.; Carrasco, J.A. Analizing the Variable Importance from Multinomial Logit Model Using Shapley Values-Based Methods: A Travel Mode Choiceapplication. SSRN 2023. [Google Scholar] [CrossRef]
  76. Shkera, A.; Vaishali, P. Cycling, walking, and public transport versus private cars: An empirical investigation of travel mode choices for shopping trips in Mumbai metropolitan region. Trans. Transp. Sci. 2024, 15, 4–16. [Google Scholar] [CrossRef]
  77. Posit Team. RStudio: Integrated Development Environment for R; RStudio: Boston, MA, USA, 2025. [Google Scholar]
  78. Croissant, Y. Estimation of random utility models in R: The mlogit package. J. Stat. Softw. 2020, 95, 1–41. [Google Scholar] [CrossRef]
  79. Sarrias, M.; Daziano, R. Multinomial logit models with continuous and discrete individual heterogeneity in R: The gmnl package. J. Stat. Softw. 2017, 79, 1–46. [Google Scholar] [CrossRef]
  80. Wickham, H. ggplot2: Elegant Graphics for Data Analysis; Springer: Cham, Switzerland, 2016. [Google Scholar]
  81. McFadden, D. Conditional Logit Analysis of Qualitative Choice Behavior; Academic Press: New York, NY, USA, 1972. [Google Scholar]
  82. Train, K.E. Discrete Choice Methods with Simulation; Cambridge University Press: Cambridge, UK, 2009. [Google Scholar]
  83. Greene, W.H.; Hensher, D.A. Modeling Ordered Choices: A Primer; Cambridge University Press: Cambridge, UK, 2010. [Google Scholar]
  84. Heinen, E.; Van Wee, B.; Maat, K. Commuting by bicycle: An overview of the literature. Transp. Rev. 2010, 30, 59–96. [Google Scholar] [CrossRef]
  85. Pucher, J.; Buehler, R. Integrating bicycling and public transport in North America. J. Public Transp. 2009, 12, 79–104. [Google Scholar] [CrossRef]
  86. Beirão, G.; Cabral, J.S. Understanding attitudes towards public transport and private car: A qualitative study. Transp. Policy 2007, 14, 478–489. [Google Scholar] [CrossRef]
  87. Owais, M.; Alshehri, A.; Gyani, J.; Aljarbou, M.H.; Alsulamy, S. Prioritizing rear-end crash explanatory factors for injury severity level using deep learning and global sensitivity analysis. Expert Syst. Appl. 2024, 245, 123114. [Google Scholar] [CrossRef]
  88. Owais, M.; Ramadan, I. Integrated Deep Learning and Global Sensitivity Analysis Framework for Transportation Link Criticality Evaluation. Transp. Res. Rec. 2025. [Google Scholar] [CrossRef]
Figure 1. Classification of transportation modes.
Sustainability 18 03501 g001
Figure 2. Map of the study area (Kütahya).
Sustainability 18 03501 g002
Figure 3. Performance evaluation of MMNL models with varying random parameter distributions: (A) Adjusted McFadden’s R2 (B) Model Accuracy.
Sustainability 18 03501 g003
Table 1. Summary of literature review on university-related transportation preferences.
Author(s)YearRegion/CountrySampleThemeMethodKey Findings
Cattaneo
et al. [16]
2018Italy827 participantsIndividual Characteristics & Socioeconomic FactorsMNLGender and environmental awareness significantly impact private vehicle use. Information campaigns can reduce vehicle usage by 5.8%.
Shakeel and Jahanzaib [20]2019Pakistan400 householdsIndividual Characteristics & Environmental PerceptionMNLSocioeconomic status is a significant determinant in the preference for public transport and cycling.
Chaudhry and Elumala [17]2024India945 participantsDistance & Land UseMNLActive transport is preferred for distances up to 3 km, while public transport becomes more attractive for distances over 4 km.
Obaid and Hamad [28]2020Saudi Arabia4000+ participantsPrivate Vehicle DependencyMNLPrivate vehicle dependency has a negative impact on traffic congestion and sustainability.
Peker et al. [32]2024Türkiye1027 participantsSafety & InfrastructureMNLSafety and service quality are critical determinants of mode choice.
Tepecik [33]2025Türkiye280 participantsInfrastructure & Service QualityMNLAn increase in service quality correlates with a higher preference for public transport.
Gehrke and Clifton [13]2014USA4183 home-based tripsTransit-Oriented Development (TOD)MNLTransit-oriented development effectively reduces dependency on private vehicles.
Pasha et al. [45]2020Australia
(Brisbane)
1435 participantsAirport Access Mode ChoiceMNL & MMNLIncome, trip purpose, luggage, and group size are key factors. MMNL outperformed MNL by better capturing heterogeneity in user preferences.
Mariante et al. [46]2018Luxembourg (Cross-border: DE, FR, BE)955 participantsCross-border Commuting & Discretionary TripsMMNLTravel time, distance, and individual differences are critical. MMNL offered more realistic results than MNL. Appropriate policies can enhance public transport appeal despite car dominance.
Dell’Olio et al. [47]2019Spain (Univ. of Cantabria)200 participantsParking Policies & Sustainable TransportMMNLParking fees reduce private vehicle use and promote sustainability. The study revealed user heterogeneity and showed that optimized fees can fund sustainable transport policies.
Kohlrautz and Kuhnimhof [48]2025Germany
(RWTH Aachen)
2960 participantsBicycle Parking PreferencesMMNLKey factors include sensitivity to walking distance, preference for secure/indoor parking, and bicycle value. Significant heterogeneity exists among user groups.
Liu and Sanko [49]2025Japan
(Kobe Univ.)
208 participantsShared Autonomous Vehicles (SAV) & Last-MileMMNLStudents showed no resistance to SAVs for station-to-campus trips, perceiving them similarly to taxis. SAVs should be prioritized for last-mile connectivity.
Table 2. Variable definitions.
VariableMeanTypeDescription
Dependent Variable
Mode Choice Categorical
      High-speed modes4.82% High-speed mode is chosen by traveller.
      Low-speed modes27.15%Low-speed mode is chosen by traveller.
      Public transport68.03%Public transport is chosen by traveller.
Independent variables
Travel time36.90NumericalTravel time (minutes)
Travel cost0.36NumericalTravel cost (USD)
Monthly income266.79NumericalMonthly income of the traveller (USD).
Dormitory24.37%Dummy1 if the traveller lives in a dormitory, 0 otherwise.
Age20.81NumericalAge of the traveller.
Female46.04%Dummy1 if female, 0 if male.
Car37.32%Dummy1 if the traveller owns a car, 0 otherwise.
Motorbike3.57%Dummy1 if the traveller owns a motorbike, 0 otherwise.
Bike20.28%Dummy1 if the traveller owns a bicycle, 0 otherwise.
Driving licence44.85%Dummy1 if the traveller has a driving licence, 0 otherwise.
Household size4.22NumericalNumber of persons in the household.
Distance7.85NumericalTravel distance (km)
Daylight90.69%Dummy1 if the trip was made during daylight, 0 otherwise
Table 3. Comparison of Estimated MNL and MMNL Models.
Model
ID
Model
Type
Travel Time
(Dist., Sign)
Travel Cost
(Dist., Sign)
Number of Significant βLLAICBICAdj. ρ2Accuracy
M1MNLFixed (+ **)Fixed (− *)15 **/1 *−450.3952.61091.00.58791.48%
M2MMNLcn (− **)cn (− **)13 **/4 *−418.4892.81041.80.61392.27%
M3MMNLn (+ **)cn (− **)13 **/4 *−419.6895.21044.20.61291.48%
M4MMNLt (− **)cn (− **)13 **/4 *−419.9895.81044.80.61291.15%
M5MMNLu (+ **)cn (− **)13 **/4 *−419.4894.81043.80.61291.15%
M6MMNLcn (− **)n (− *)14 **/3 *−437.8931.61080.60.59691.48%
M7MMNLn (+ **)n (− *)14 **/3 *−437.8931.61080.60.59691.48%
M8MMNLt (− **)n (− *)14 **/3 *−437.8931.61080.60.59691.48%
M9MMNLu (+ **)n (− *)14 **/3 *−437.8931.61080.60.59691.48%
M10MMNLcn (− **)t (− **)13 **/3 *−444.5945.01094.00.59191.02%
M11MMNLn (+ **)t (− **)13 **/3 *−443.2942.41091.40.59291.02%
M12MMNLt (− **)t (− **)13 **/3 *−444.5945.01094.00.59191.02%
M13MMNLu (+ **)t (− **)13 **/3 *−444.5945.01094.00.59191.02%
M14MMNLcn (− **)u (− *)14 **/3 *−443.1942.21091.20.59291.15%
M15MMNLn (+ **)u (− *)14 **/3 *−443.1942.21091.20.59291.15%
M16MMNLt (− **)u (− *)14 **/3 *−443.1942.21091.20.59291.02%
M17MMNLu (+ **)u (− *)14 **/3 *−443.1942.21091.20.59291.02%
** Significant at 95% confidence interval, * Significant at 90% confidence interval.
Table 4. Estimation results for the final MMNL and the classical MNL models.
CoefficientsFinal MMNLClassical MNL
Estimatep-ValueEstimatep-Value
Travel time −0.131 **<0.0010.081 **<0.001
Travel cost −4.342 **0.018−0.214 *0.075
sd. Travel time 0.0100.982--
sd. Travel cost 5.840 **0.004--
ConstantLSM18.681 **0.0027.726 **0.001
PT14.957 **0.0094.789 **0.005
Monthly incomeLSM−0.004 *0.0850.0000.677
PT−0.0030.235−0.0010.418
DormitoryLSM0.6980.7510.1110.877
PT0.0550.980−0.6070.382
AgeLSM−0.4160.102−0.228 **0.008
PT−0.3590.136−0.166 **0.006
FemaleLSM2.439 *0.0560.5510.154
PT2.651 **0.0330.838 **0.010
CarLSM−11.984 **<0.001−3.913 **<0.001
PT−11.106 **<0.001−3.287 **<0.001
MotorbikeLSM3.876 *0.0802.435 **0.007
PT0.6250.767−0.5140.476
BikeLSM0.9620.3420.1830.664
PT1.1660.2260.4620.155
Driving licenceLSM−3.446 **0.030−1.122 **0.005
PT−3.236 **0.036−1.058 **0.001
Household sizeLSM0.723 **0.0310.489 **0.003
PT0.565 *0.0870.362 **0.005
DistanceLSM−1.057 **<0.001−1.004 **<0.001
PT0.395 **0.0040.141 **0.000
DaylightLSM1.7550.1510.4250.437
PT1.3440.252−0.0460.919
** Significant at 95% confidence interval, * Significant at 90% confidence interval. HSM is used as the reference category.
Disclaimer/Publisher’s Note: The statements, opinions and data contained in all publications are solely those of the individual author(s) and contributor(s) and not of MDPI and/or the editor(s). MDPI and/or the editor(s) disclaim responsibility for any injury to people or property resulting from any ideas, methods, instructions or products referred to in the content.