Article

Mechanisms and Mitigation of Nitrate Vertical Transport in Black Soil Croplands of Northeast China: Evidence from a 15N-Tracing Study

1
School of Environment and Chemical Engineering, Shenyang Ligong University, Shenyang 110016, China
2
Key Laboratory of Conservation Tillage and Ecological Agriculture, Institute of Applied Ecology, Chinese Academy of Sciences, Shenyang 110016, China
3
Sanya Institute of Breeding and Multiplication, Hainan University, Sanya 572000, China
4
Institute of Plant Ecology, Justus-Liebig University Giessen, Heinrich-Buff-Ring 26, 35392 Giessen, Germany
5
School of Biology and Environmental Science and Earth Institute, University College Dublin, Belfield, D04V1W8 Dublin, Ireland
*
Author to whom correspondence should be addressed.
Sustainability 2026, 18(7), 3351; https://doi.org/10.3390/su18073351
Submission received: 14 February 2026 / Revised: 21 March 2026 / Accepted: 26 March 2026 / Published: 30 March 2026
(This article belongs to the Section Sustainable Agriculture)

Abstract

In Northeast China’s degraded croplands, nitrate (NO3-N) leaching is the dominant pathway for fertilizer-nitrogen (N) loss, which presents an increasing threat to the quality of groundwater. Conservation tillage, defined as no-tillage (NT) and straw retention, is a widely adopted management strategy to maintain cropland fertility in the black soil (BS) regions. At present, however, the impact of shifting from conventional to conservation tillage on the vertical distribution and regulatory mechanisms of NO3-N derived from applied fertilizer-N (FNO3) remains poorly understood. Based on a 12-year field experiment, we integrated 15N-tracing field monitoring with 15N-paired-labeling incubation to quantify the vertical migration of FNO3 into deep soil profiles, and specify the dominant processes regulating N retention and supply. Across the tested BS croplands, total NO3-N production rates (4.06–6.58 mg N kg−1 soil day−1) were faster than their consumption rates (0.36–0.92 mg N kg−1 soil day−1), leading to a net accumulation of NO3-N, and implying a potential for leaching of NO3-N, from the perspective of substrate availability. The results of the field 15N micro-plot experiment also indicated that, by maize maturity in the first growing season, an average of 7.5% of FNO3 had migrated to the 80–100 cm soil layer. During the following two growing seasons, the maximum accumulation of FNO3 had shifted downward to 140–160 cm and 180–220 cm, respectively. Such a pattern, particularly in light of the increased extreme precipitation in the studied regions, raises clear concerns about NO3-N leaching losses. Compared with conventional management, no-tillage with full-rate straw mulching decreased net rates of NO3-N production from 6.22 to 3.14 mg N kg−1 soil day−1. This reduction resulted from a decline in the gross oxidation of NH4+-N to NO3-N (from 6.39 to 3.70 mg N kg−1 soil day−1) and an increase in DNRA (from 0.35 to 0.85 mg N kg−1 soil day−1), which collectively delayed the downward transport of FNO3. Conservation tillage also increased the gross rate of heterotrophic nitrification (from 0.19 to 0.36 mg N kg−1 soil day−1) and its proportion relative to total nitrification (from 2.8% to 8.9%). Despite this shift, autotrophic nitrification remained the dominant process for NO3-N production in the tested BS croplands, likely due to a pH constraint on heterotrophic nitrification. With the increasingly widespread promotion of conservation tillage for soil fertility improvement, heterotrophic nitrification warrants greater attention, particularly in BS regions where pH < 6.5 and C/N contents are relatively high. Collectively, our findings provide a scientific basis for tailoring tillage practices to maintain sustainable agriculture in Northeast China.

1. Introduction

The black soil (BS) region of Northeast China is a critical granary for national grain production, serving as the cornerstone in safeguarding national food security [1]. Decades of conventional intensive tillage and unsustainable straw removal, however, have degraded these croplands, manifesting in topsoil erosion, nutrient depletion, and soil compaction [2]. Sustained high crop yields, in turn, have become heavily dependent on additional fertilizer-N application [3]. Excessive N inputs further intensify the environmental risks of N losses [4], exacerbating the contradiction of increasing grain production versus improving fertilizer-N use efficiency (NUE) across the degraded croplands [5].
In their study, Wang et al. (2025) [6] found that, across the global maize and wheat cropping systems during 1961–2020, NO3-N leaching was the main factor responsible for fertilizer-N loss. In the BS croplands of Northeast China, a conservation tillage (CT) strategy, based on no-tillage (NT) and at least 30% straw mulching (termed the ‘Lishu-Mode’), has been widely implemented to alleviate soil degradation [7,8]. Against the backdrop of tillage transition, it is important to clarify the vertical migration and regulatory mechanisms of fertilizer-derived NO3-N (FNO3). Such understanding is a critical step towards developing evidence-based N management strategies that promote grain productivity and environmental sustainability in the degraded croplands.
Upon application to soil, fertilizer-N accumulates and is sequentially transported among the different N pools, including soil NH4+-N, NO3-N, fixed NH4+-N, and organic-N [9]. Ultimately, it is partitioned into three major routes: (i) uptake by the seasonal crop, which determines fertilizer NUE and crop yield [10]; (ii) retention in the soil system as residual fertilizer-N, which exerts a residual N effect on subsequent crops [11]; and (iii) loss of fertilizer-N from soil–crop systems with corresponding environmental effects [12]. Consequently, using 15N stable isotope tracing initiated in long-term field experimental platforms makes it possible to perform quantitative analyses of the vertical movement of FNO3 under contrasting tillage management practices [13], which provides a more effective assessment of NO3-N leaching potential in degraded agroecosystems.
Within the soil–crop–environment system, the allocation of fertilizer-N is primarily regulated by soil N transformation processes and their respective rates [14,15]. Although the net nitrification rate may still provide information on NO3-N availability and the associated potential risk of leaching loss [16,17], a low net nitrification rate does not necessarily imply slow turnover dynamics of soil NO3-N, given the fact that rapid gross nitrification coinciding with equally rapid microbial immobilization can also ensure that soil maintains a low NO3-N concentration [18]. As such, solely considering net N transformation rates is inadequate to identify the specific processes that dominate N supply and conservation in soil [19]. Gross N transformation rates (GNTR), in contrast, offer a more mechanistic view by simultaneously quantifying production and consumption rates of individual N processes [20]. Shifting the analytical emphasis from net changes to GNTR thus provides a process-based insight into the underlying mechanisms that drive efficient N supply and retention in agricultural soils [21,22].
The results of recent studies have demonstrated that soil organic carbon, total nitrogen, microbial diversity, and composition reach relatively stable states after 8–10 years of continuous maize straw mulching [23,24]. Based on a 12-year field experiment, we aimed to accomplish the following three linked objectives: (1) a 15N-tracing micro-plot experiment was performed over three maize growing seasons to accurately quantify the vertical migration patterns of FNO3 in deep soil profiles under different tillage management strategies; (2) we combined 15N paired-labeling incubation with an MCMC-based numerical analysis model to elucidate the turnover dynamics of GNTR during the tillage transition; and (3) we investigated the key processes regulating the retention of nitrate-N and mitigated its leaching potential from the perspective of substrate availability. These findings ultimately provide scientific evidence highlighting NO3-N leaching potential and its regulatory mechanisms in the BC croplands of Northeast China.

2. Materials and Methods

2.1. Site Description

A long-term field experiment was conducted at the Lishu Conservation Tillage Research and Development Base (43°19′ N, 124°14′ E) in Jilin Province. The site is located in a typical temperate semi-humid continental monsoon climate zone. The average amount of rainfall is 614 mm per year, with roughly 75% of the average rainfall distributed over the period from June to September. The average annual air temperature is 6.9 °C, and the lowest and highest monthly mean temperatures are recorded in January (–13.5 °C) and July (23.7 °C), respectively. The soil is a Mollisol with a loamy clay texture [25]. Baseline physicochemical properties in the 0–20 cm soil layer in 2007 are shown in Table 1.

2.2. Long-Term Field Experimental Platform

The long-term field experiment followed a randomized block design with four treatments: (1) traditional ridge tillage (RT), and three CT managements—(2) NT with maize straw removed (NT), (3) NT with reduced straw mulching (2500 kg ha−1, NT + RS), and (4) NT with full-rate straw mulching (7500 kg ha−1, NT + FS). Each of the four treatments was replicated four times in the individual main plot (8.7 m × 30 m).
A continuous maize monoculture system was adopted throughout the studied site. In the RT treatment, soil was plowed to a depth of 25–30 cm in autumn after maize harvest annually, and all aboveground maize debris was removed. For CT treatments, sowing and fertilization were simultaneously conducted using a 2BMZF-4 no-till planter (Jilin Kangda Agricultural Machinery Co., Ltd., Jilin, China). For NT + RS and NT + FS plots, maize straw was applied manually at the designated rates. Spring maize cultivar ‘Heyu 9’ was sown at 60,000 plants ha−1. Basal fertilizers were applied at 10−15 cm soil depth, with application rates of 240 kg N ha−1, 110 kg P2O5 ha−1 and 110 kg K2O ha−1.

2.3. 15N-Tracing Field Micro-Plot Experiment

In May of 2016, after 9 years of continuous application of CT management, 2 m × 2 m micro-plots bounded by PVC boards were established in each of the 16 main plots (4 treatments × 4 replications). Considering the main distribution zone of the maize root in the studied site and minimizing soil disturbance to the NT agroecosystem, the PVC boards were inserted 60 cm below the ground and extended 10 cm above the surface. For each 15N micro-plot, fertilizers were applied at the same rate as their respective main plots. The sole difference was the use of urea labeled with 15N abundance of 10% at spring sowing in the first growing season, whereas unlabeled urea was used in the subsequent growing seasons.
Following three years of continuous 15N-tracing micro-plot observation, soil samples were collected annually after maize maturity using a 2.5 cm diameter soil auger. Composite samples (from three points in each micro-plot) were taken at 20 cm intervals within a soil profile ranging from 0 to 100 cm (five soil layers on 14 October 2016) and from 0 to 300 cm (fifteen soil layers on 13 October 2017 and 10 October 2018). The soil samples (16 main plots × 5 or 15 soil layers × 3 replications) were analyzed to determine NO3-N concentrations and their respective 15N abundance across the profile, to thus more effectively quantify the vertical distribution and leaching potential of FNO3 under the different tillage regimes.

2.4. 15N Paired-Labeling Incubation Experiment

As long-term application of CT practices improved soil fertility predominantly in the near-surface soil layer [26], topsoil (0–10 cm, 6 points, S-shaped) from the 16 main field plots was collected in October 2018 after maize harvest for the determination of GNTR. Fresh samples were promptly transported to the laboratory, where visible gravel, plant roots, and debris were removed. After sieving (2 mm) and homogenization, the soil was split into two parts: one subsample was used to determine soil water holding capacity (WHC) and then stored at 4 °C for the following 15N-paired labeling incubation experiment, and the other subsample was air-dried for the determination of pH, SOC, and TN content.
For the 15N-paired labeling incubation experiment, homogenized fresh soil (equivalent to 30 g of dry soil weight) was placed into 250 mL Erlenmeyer flasks, with 24 replicates for each treatment (2 types of 15N labeling × 3 replicates × 4 sampling times). After 1 day of pre-incubation at 25 °C, labeling solutions, i.e., either 15NH4NO3 (4.85 atom% 15N excess) or NH415NO3 (4.89 atom% 15N excess), were applied dropwise to ensure uniform distribution at a rate of 50 mg NH4+-N or NO3-N kg−1 soil. Soil moisture was adjusted to 60% of WHC using deionized water. Each flask was sealed with perforated plastic film to maintain the aerobic conditions, and incubation was continued at 25 °C. Three random flasks from each labeling treatment were destructively sampled at 0.5, 12, 24, and 48 h after labeling to measure the concentrations and 15N abundance of NH4+-N and NO3-N, respectively.
The measured concentrations and 15N atom% excess values of NH4+-N and NO3-N were incorporated into an MCMC-based numerical model of N transformation processes [27]. The model iteratively adjusted the kinetic parameters of individual N transformation pathways to fit the simulated curves to the observed incubation data. The model ultimately output the following three paired GNTR regarding the turnover dynamics of NO3-N: organic-N mineralization (MNorg) and NH4+-N immobilization (INH4); oxidation of NH4+-N to NO3-N (ONH4) and dissimilatory NO3-N reduction to NH4+-N (DNRA); and oxidation of organic-N to NO3-N (ONrec) and NO3-N immobilization (INO3). It should be noted that the model specifically parameterized DNRA and INO3 as the primary biological consumption pathway for NO3-N. In comparison, other potential NO3-N loss pathways, such as denitrification (which would require the measurements of 15N gas flux), were not directly quantified in this incubation experiment. For further details on the 15N-paired labeling incubation experiment, refer to the works of Xie et al. (2018) [28] and Zhang et al. (2023) [29].

2.5. Analysis of Basic Soil Properties

Soil physicochemical properties were determined following the Soil Agro-Chemical Analysis Procedures [30]. In detail, soil pH was measured with a DMP 2 mV/pH meter. Soil WHC was determined using the oven-drying method. SOC was quantified via potassium dichromate oxidation. Soil TN was quantified using an elemental analyzer (Elementar Vario MACRO cube, Langenselbold, Germany). NH4+-N and NO3-N were extracted with 2M KCl, and their concentrations were determined on a continuous-flow chemical analyzer (SmartChem 200, AMS, Guidonia Montecelio, Italy). 15N abundance was measured using an isotope-ratio mass spectrometer (DELTAplus XP, Thermo Finnigan, Waltham, USA).

2.6. Data Calculations

The content of FNO3 and its proportion in the total applied urea-N (PNO3) were quantified as follows [31]:
S N O 3   =   C × H × ρ × 10 1
F N O 3 = S N O 3 × a c b c
P N O 3 = F N O 3 F N × 100 %
where SNO3 is the stock of NO3-N in the soil profile (kg N ha−1), C is the concentration of NO3-N in a given soil layer (mg N kg−1), H is the thickness of a given soil layer (cm), ρ is the bulk density of a given soil layer (g cm−3), and 10−1 is a unit conversion factor. a is the 15N abundance of NO3-N in a given soil layer; b is the 15N abundance of applied urea-N (10%); c is the natural 15N abundance (0.3663%); and F N is the amount of urea-N applied (240 kg N ha−1).
The associated GNTR were calculated as follows [19,20]:
Gross NO3-N production rate (GNO3) = ONH4 + ONrec
Gross NO3-N consumption rate (CNO3) = DNRA+ INO3
Net NO3-N production rate (NNO3) = GNO3 − CNO3
Data are expressed as the mean ± standard deviation using Microsoft Excel 2021. ANOVA followed by the LSD test was conducted to evaluate the treatment effects on the proportion of FNO3, soil basic physicochemical properties, and GNTR. Correlation analysis was performed to examine the relationships between these variables. Differences were considered statistically significant at p < 0.05. All the statistical analyses were conducted in R 4.2.1 [32], and figures were prepared using OriginPro 2022.

3. Results

3.1. Distribution of FNO3 in the Soil Profile

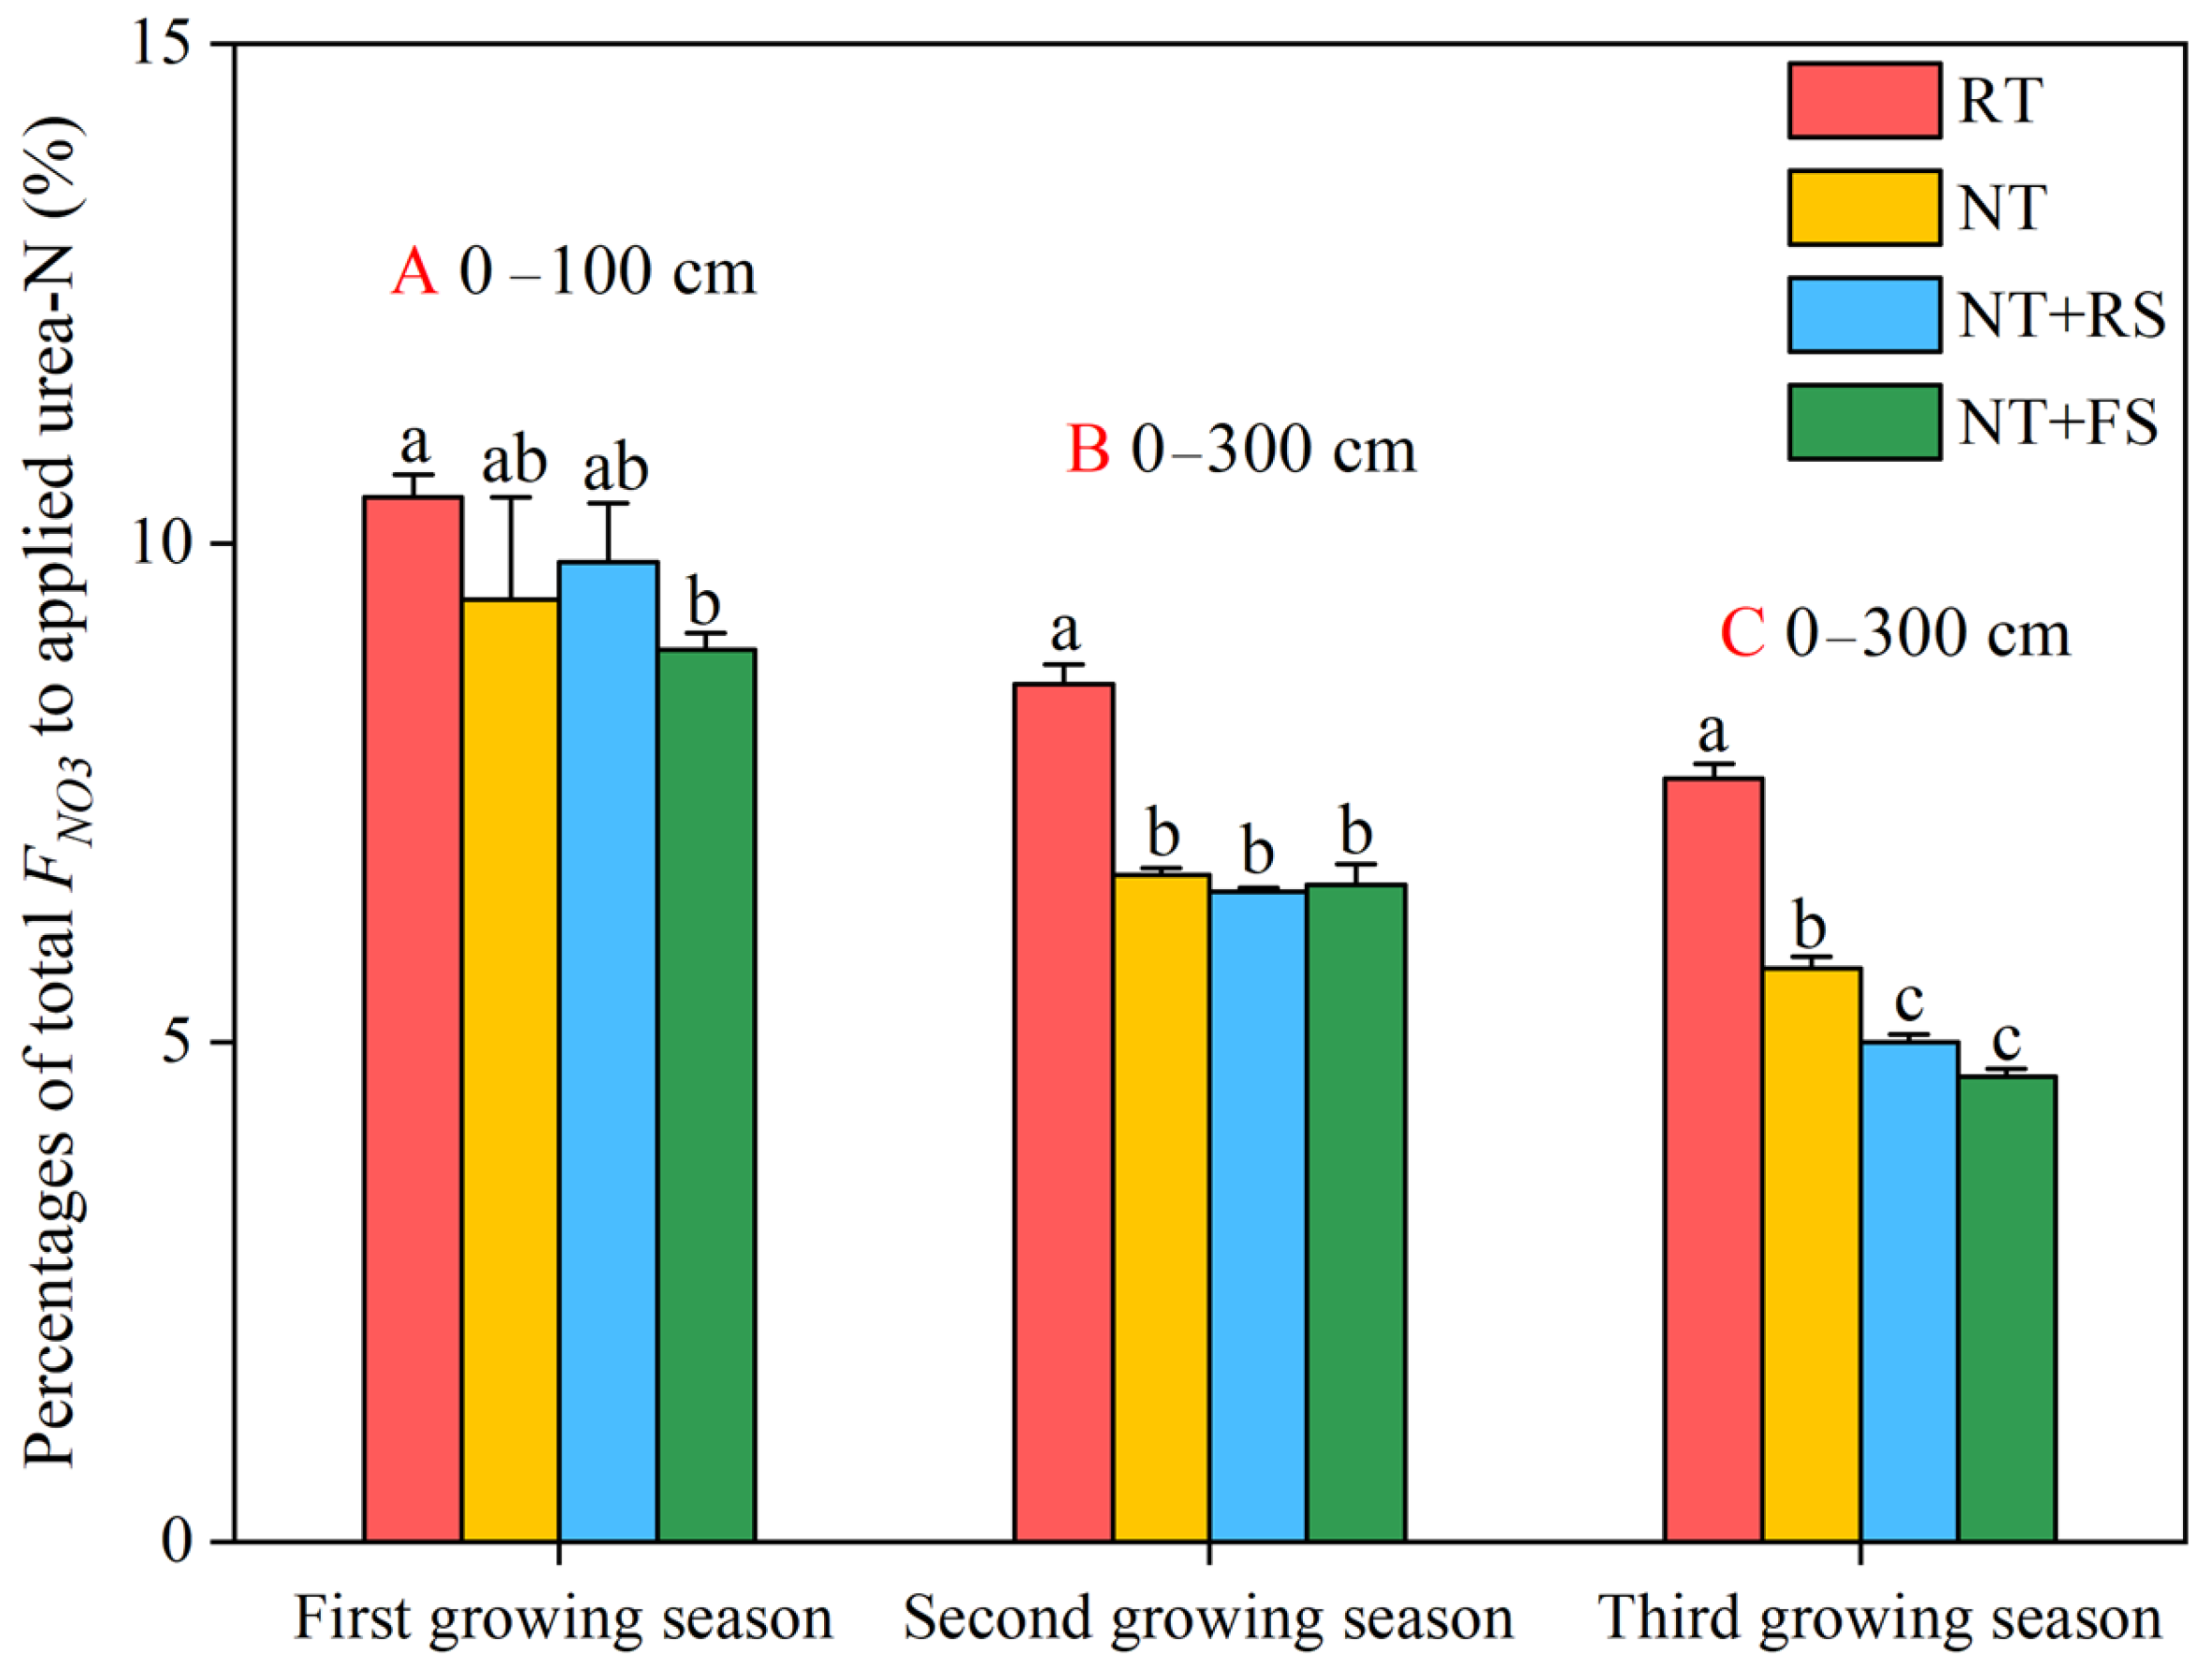
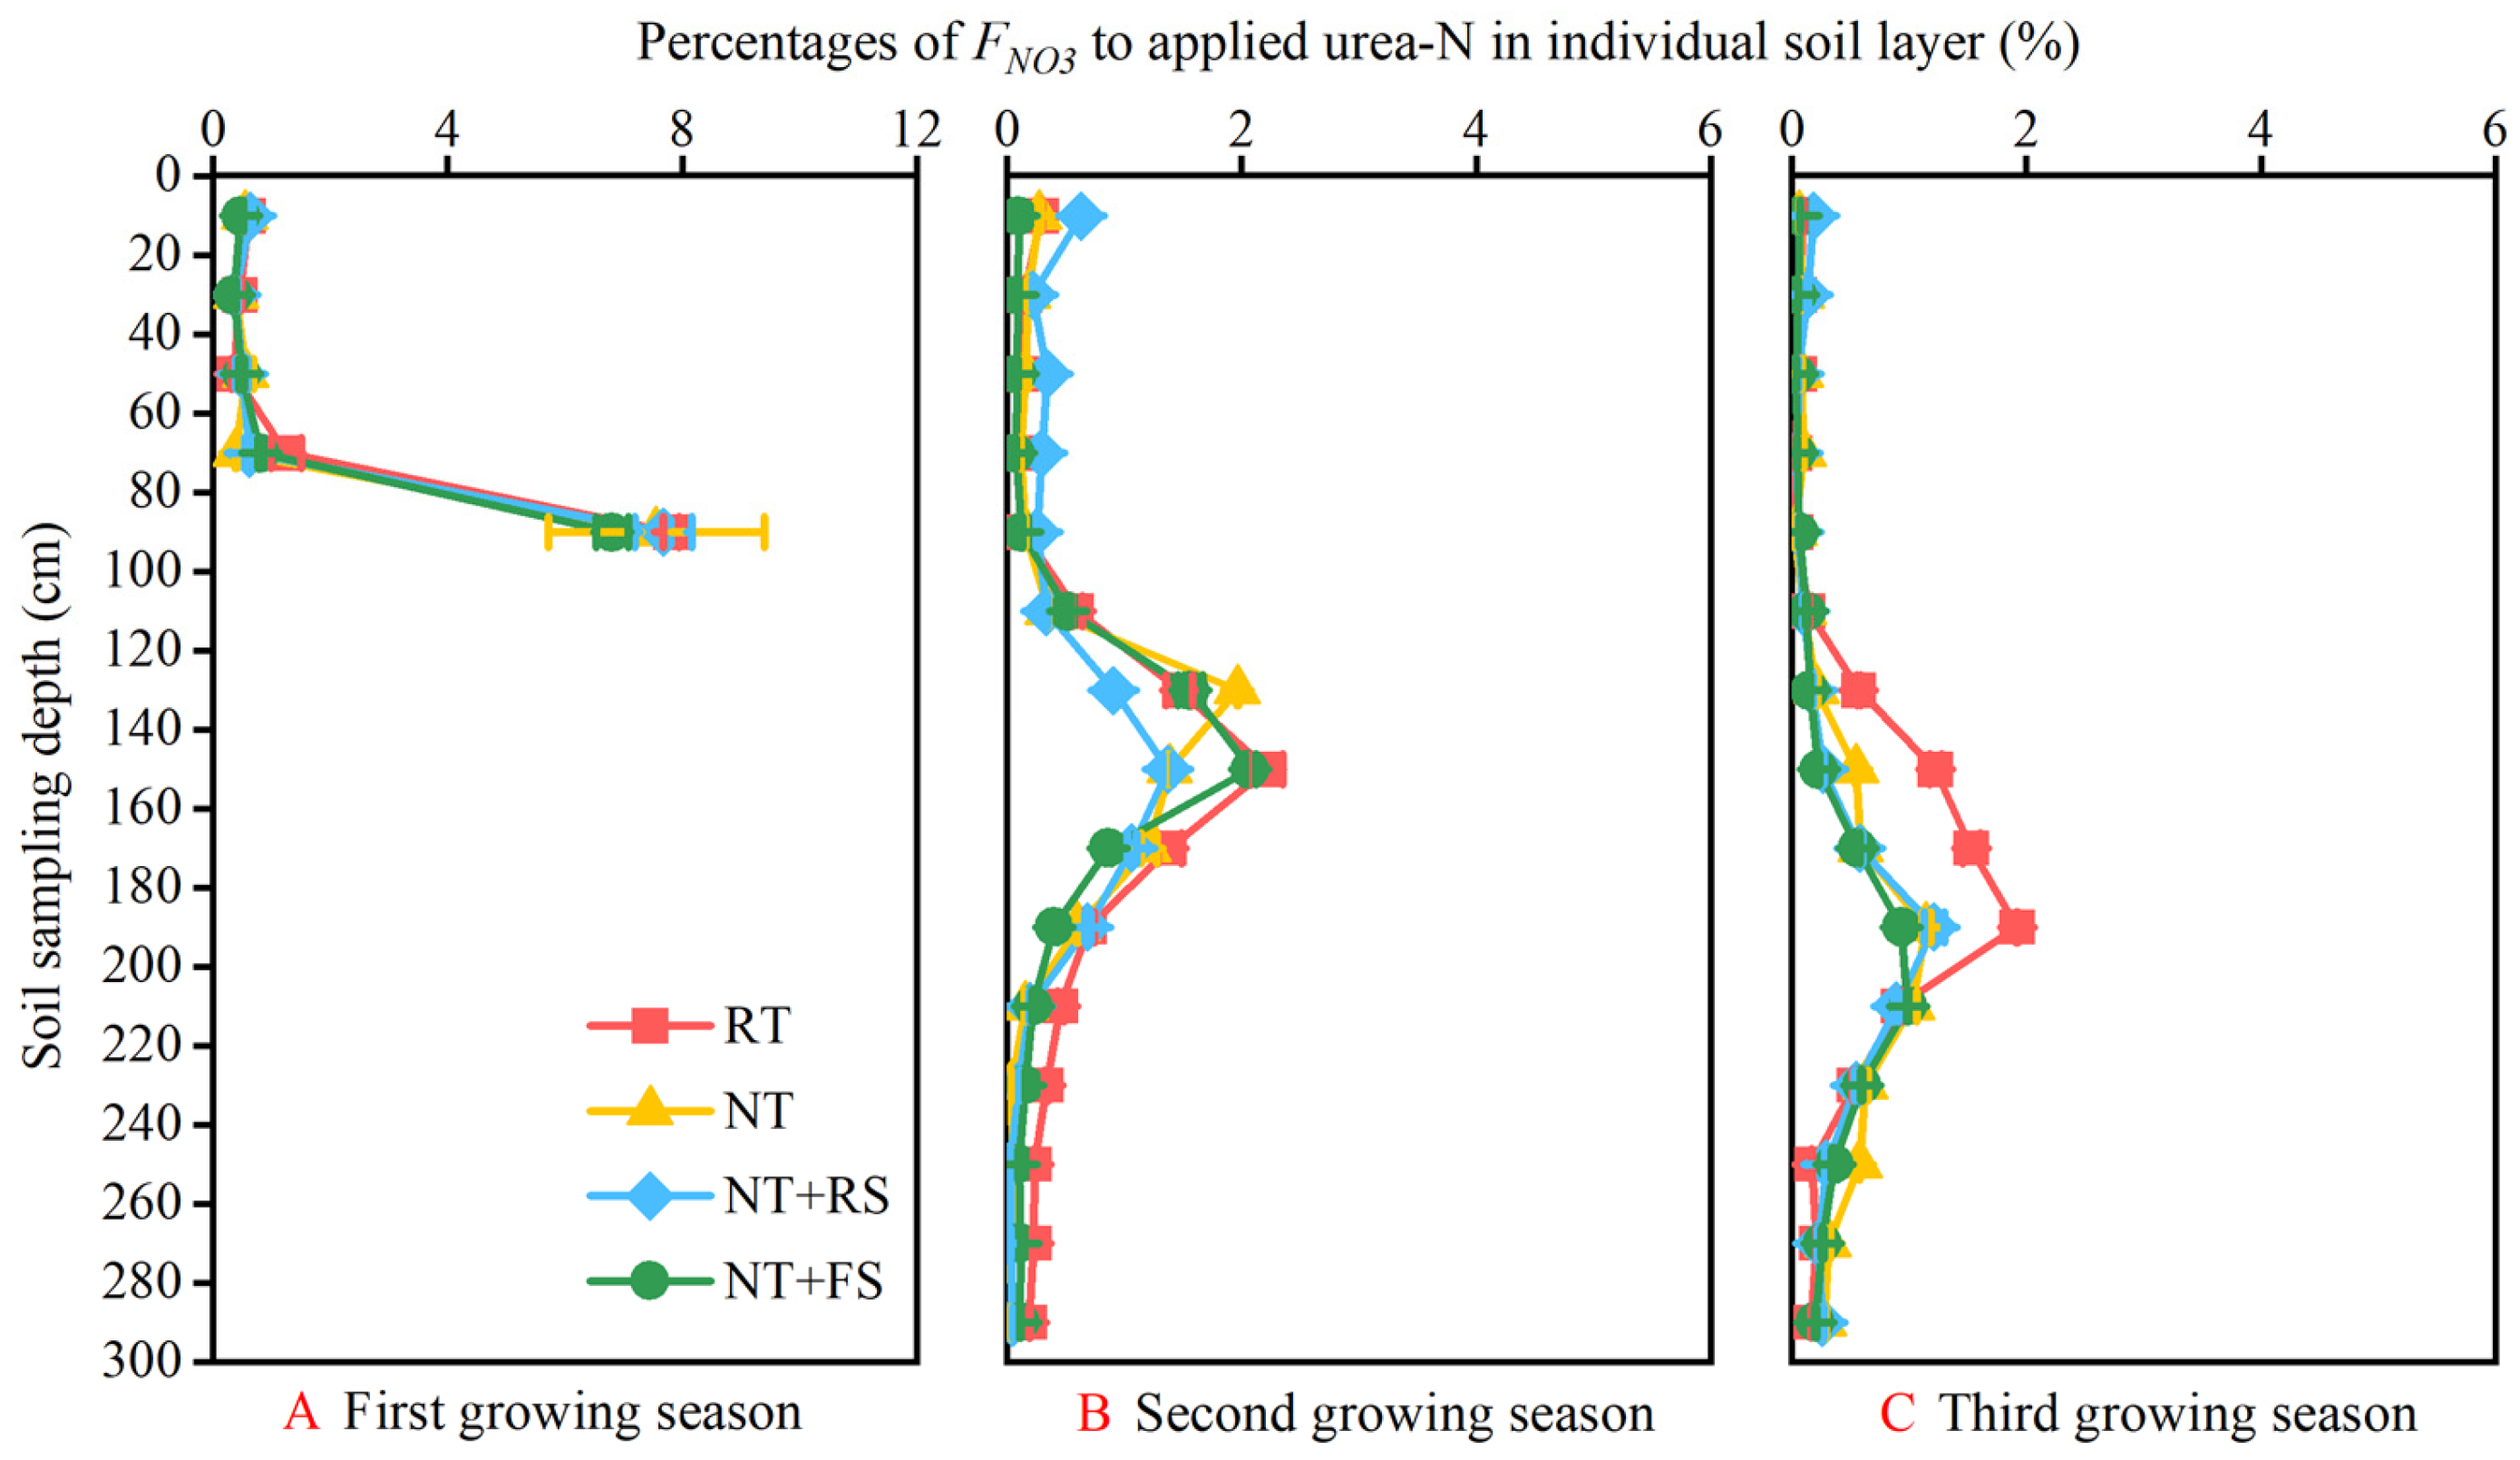
During the first growing season after urea-N application, the results of the 15N-tracing field micro-plot experiment indicated that, roughly 8.9–10.5% (average 9.7%) of the applied 15N-urea persisted as NO3-N within the 0–100 cm soil profile (Figure 1A). Within this fraction, more than 74.7% of FNO3 had already accumulated in the 80–100 cm soil layer (Figure 2A).
By the second growing season, after further uptake by the crop, approximately 6.5–8.6% (average 7.1%) of the initial 15N-urea remained as NO3-N across the 0–300 cm profile (Figure 1B). The peak accumulation of FNO3 appeared to shift downward, concentrating in the 120–160 cm soil layer (Figure 2B).
For the third growing season, approximately 4.7–7.6% (average 5.8%) of the applied 15N-urea was still present as NO3-N in the 0–300 cm soil profile (Figure 1C). Correspondingly, the FNO3 peak was observed to migrate deeper to the depth of 180–220 cm (Figure 2C).
Across the three consecutive growing seasons, compared with the RT treatment, no-tillage with full-rate straw mulching (NT + FS) significantly decreased the proportion of FNO3 relative to the total applied 15N-urea in the soil profile (Figure 1), and also appeared to effectively delay the downward migration and accumulation of FNO3 in the deeper soil layer (Figure 2).

3.2. Soil Physicochemical Properties

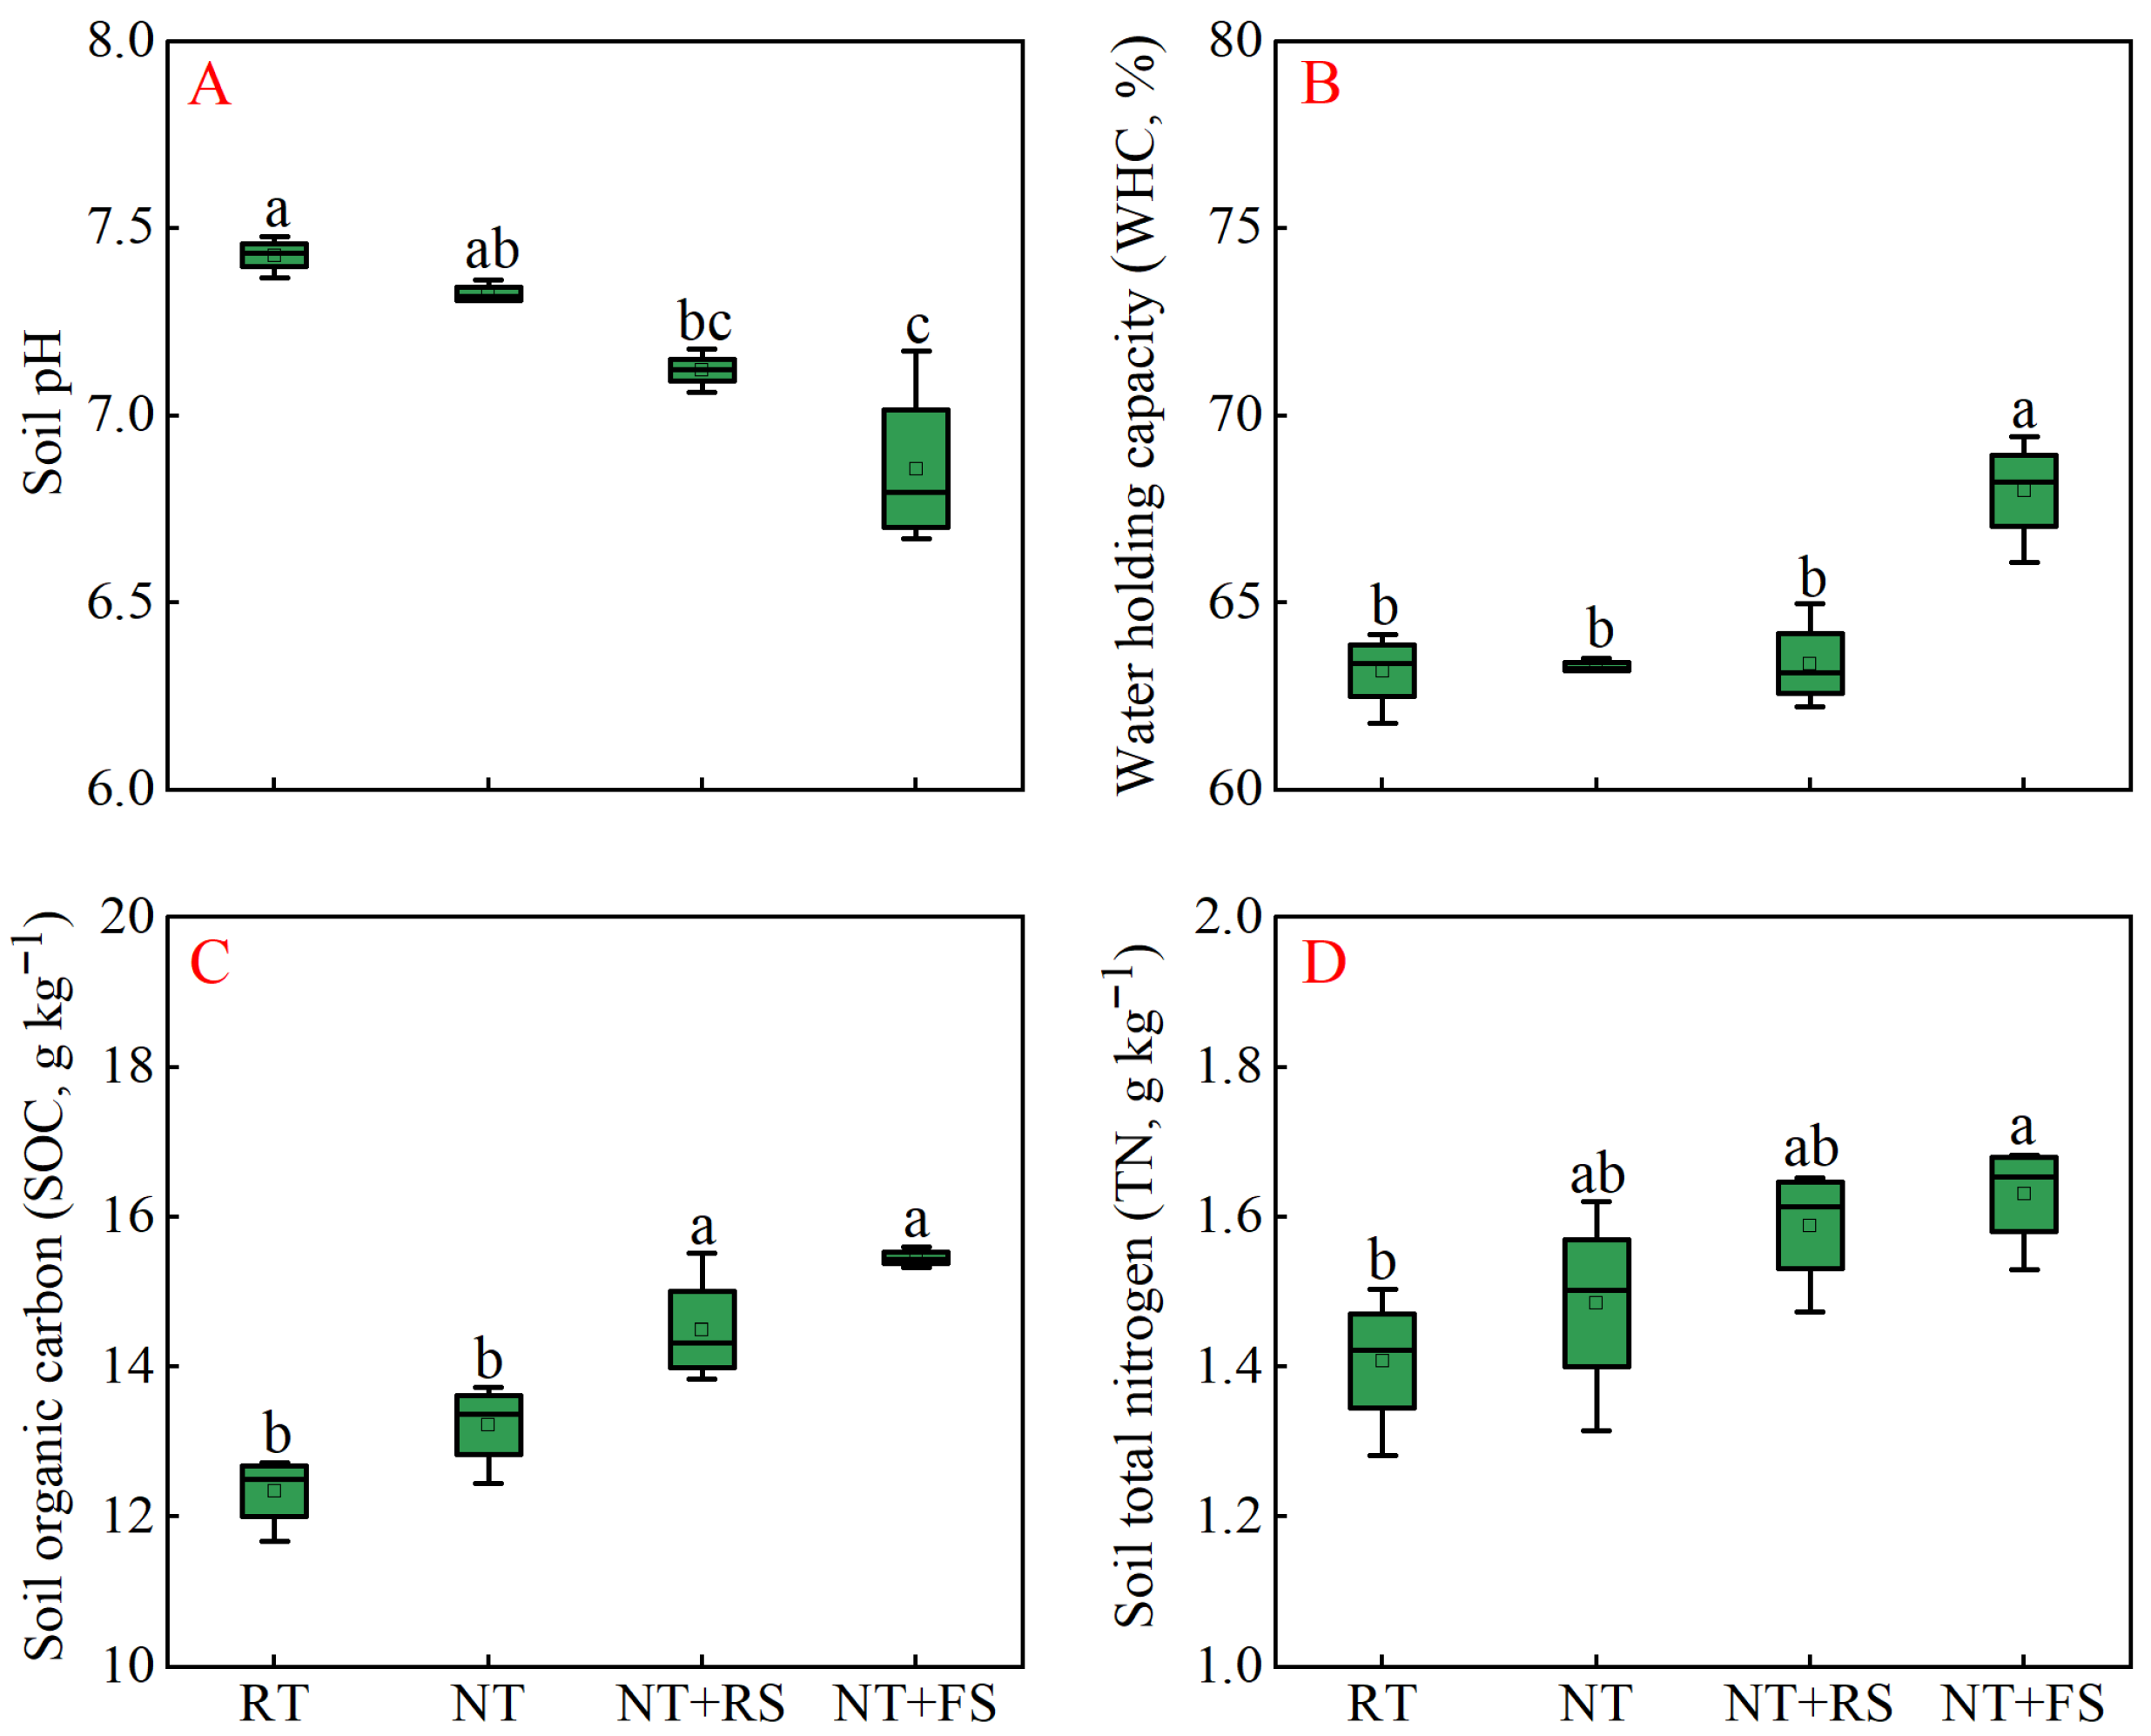
The soil pH in the studied BS croplands ranged between 6.7 and 7.5. Compared with the RT treatment, both reduced (NT + RS) and full-rate (NT + FS) straw mulching under no-tillage management significantly decreased soil pH by 0.3 and 0.6 units, respectively (Figure 3A). Across all the tillage regimes, the soil WHC, SOC, and TN contents varied, spanning 61.8–69.4%, 11.67–15.60 g kg−1, and 1.28–1.68 g kg−1, respectively. In contrast to the soil pH response, no-tillage with straw mulching consistently increased the WHC, SOC, and TN contents compared with RT. These increases were significant for the full-rate straw mulching treatment (NT + FS), which enhanced WHC by 7.6% (Figure 3B), SOC by 25.1% (Figure 3C), and TN by 15.8% (Figure 3D), respectively.

3.3. Gross N Transformation Rates

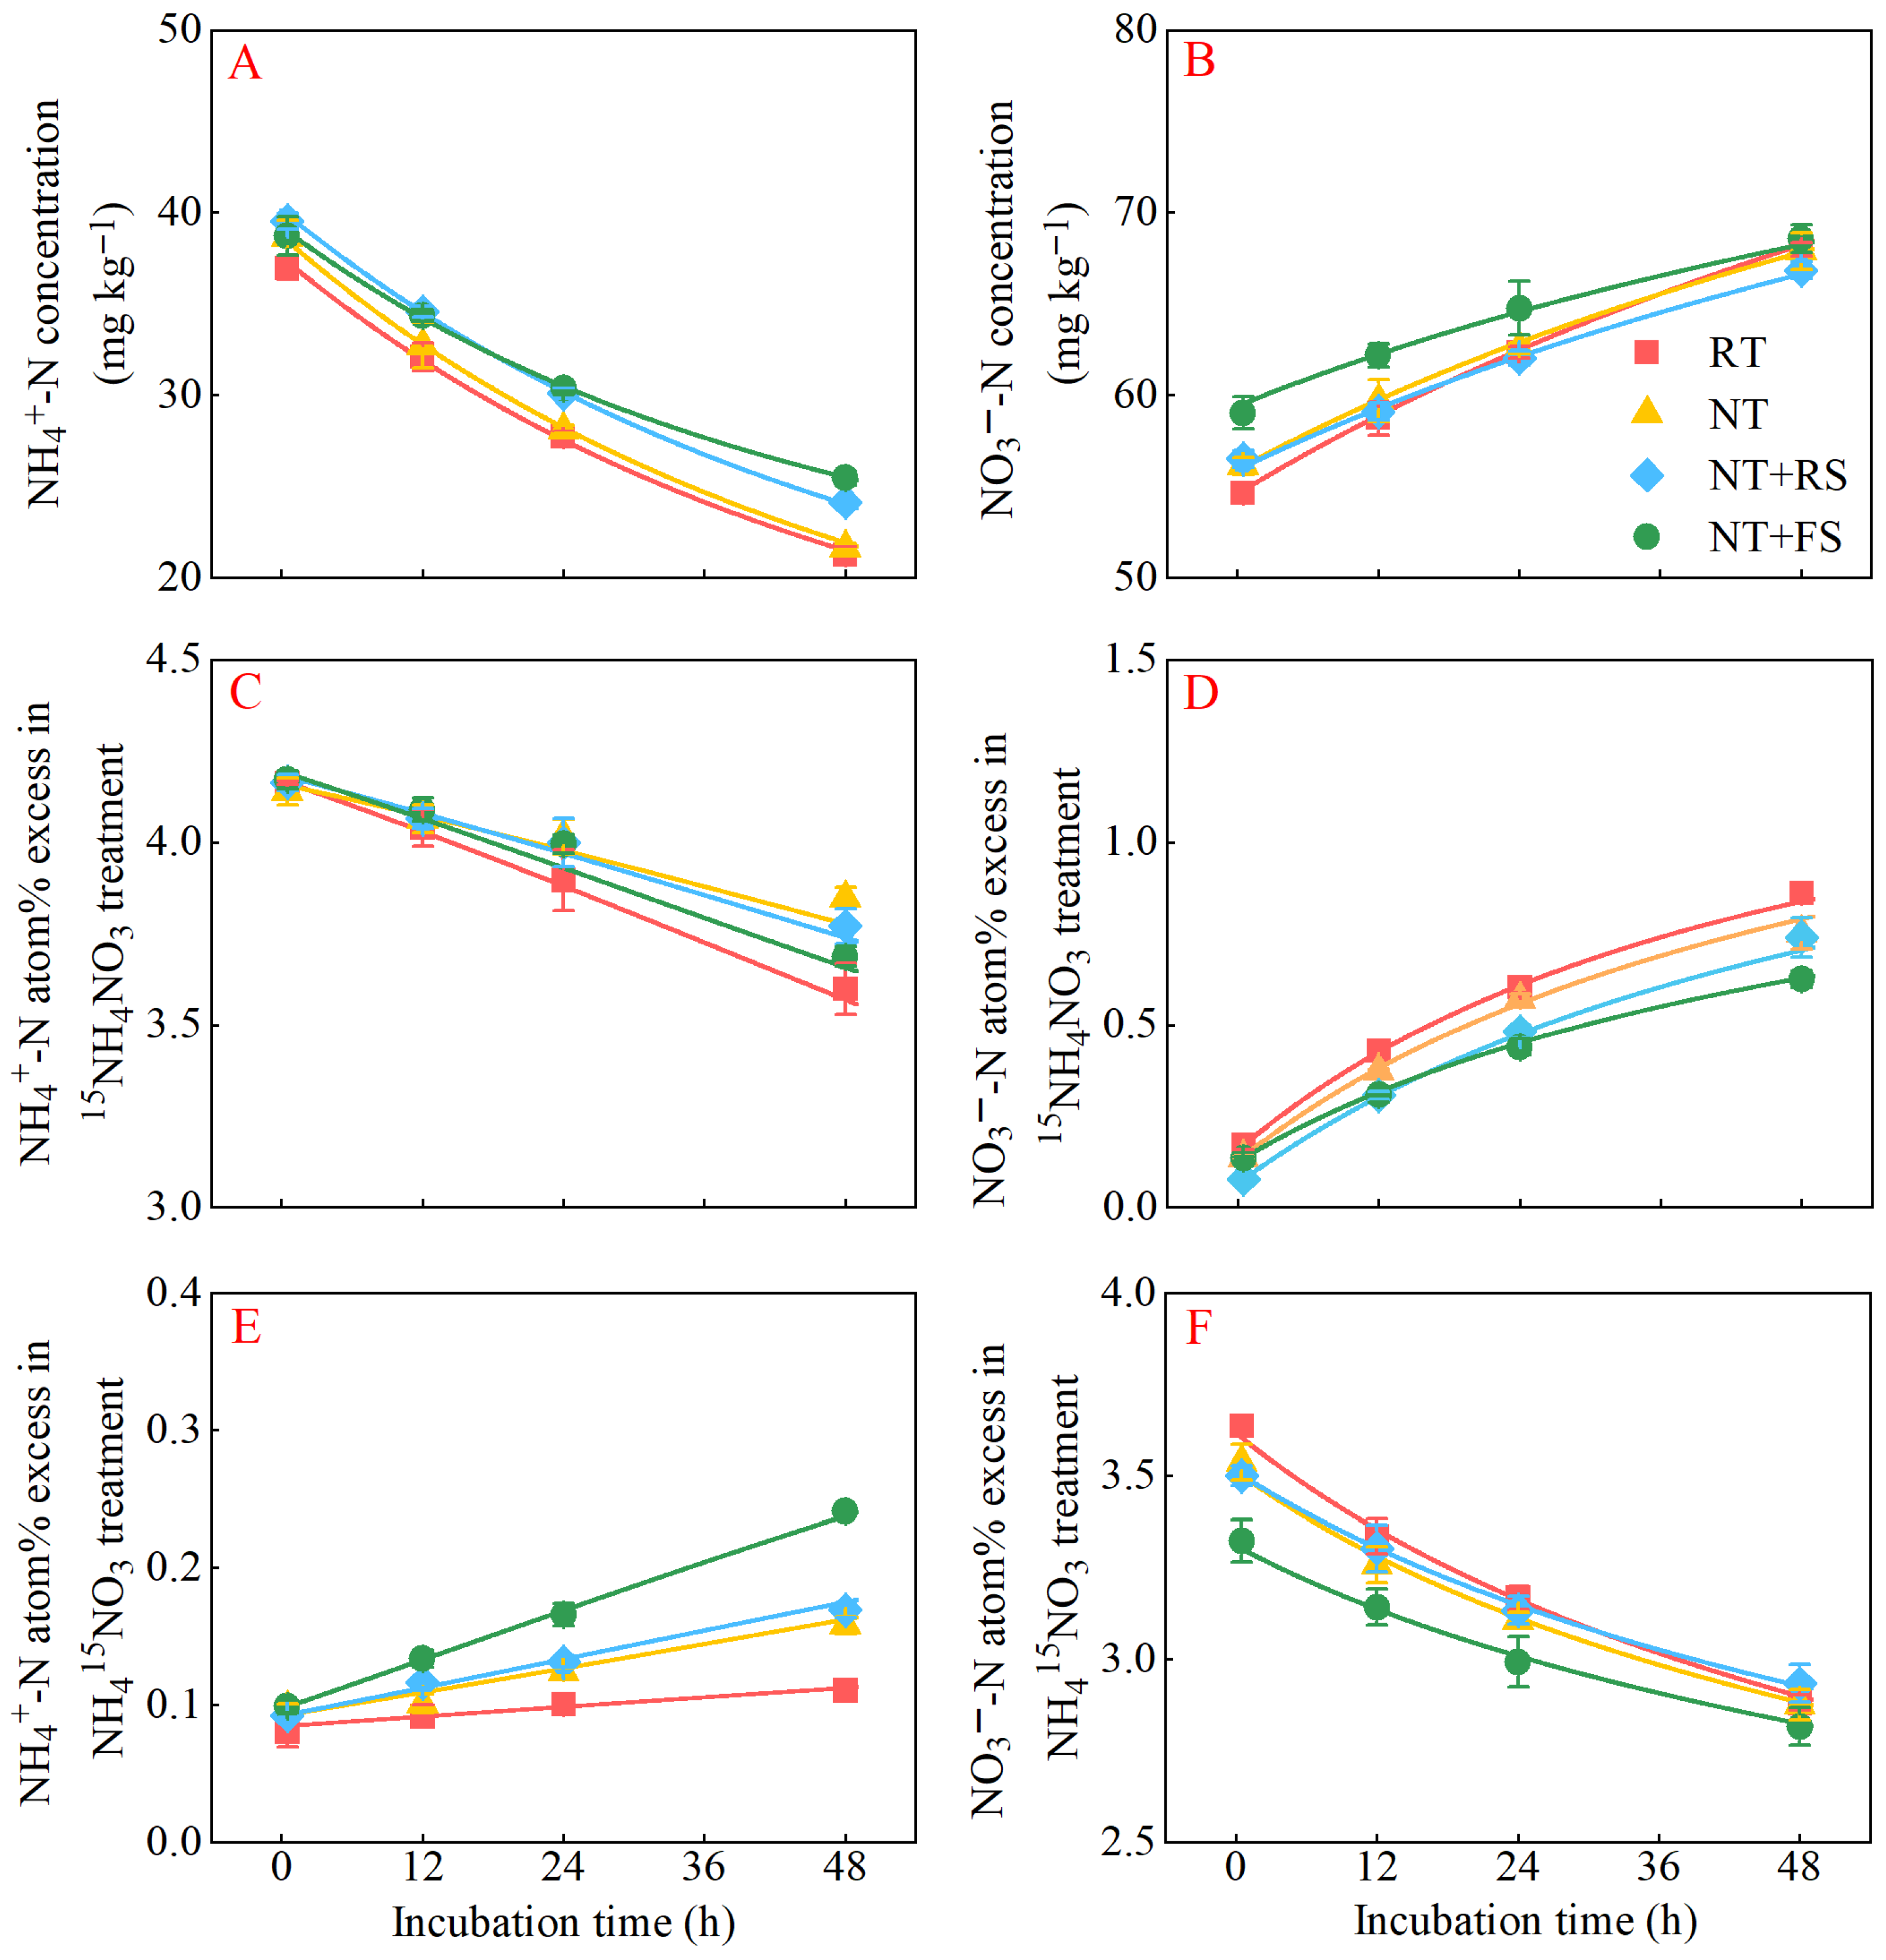
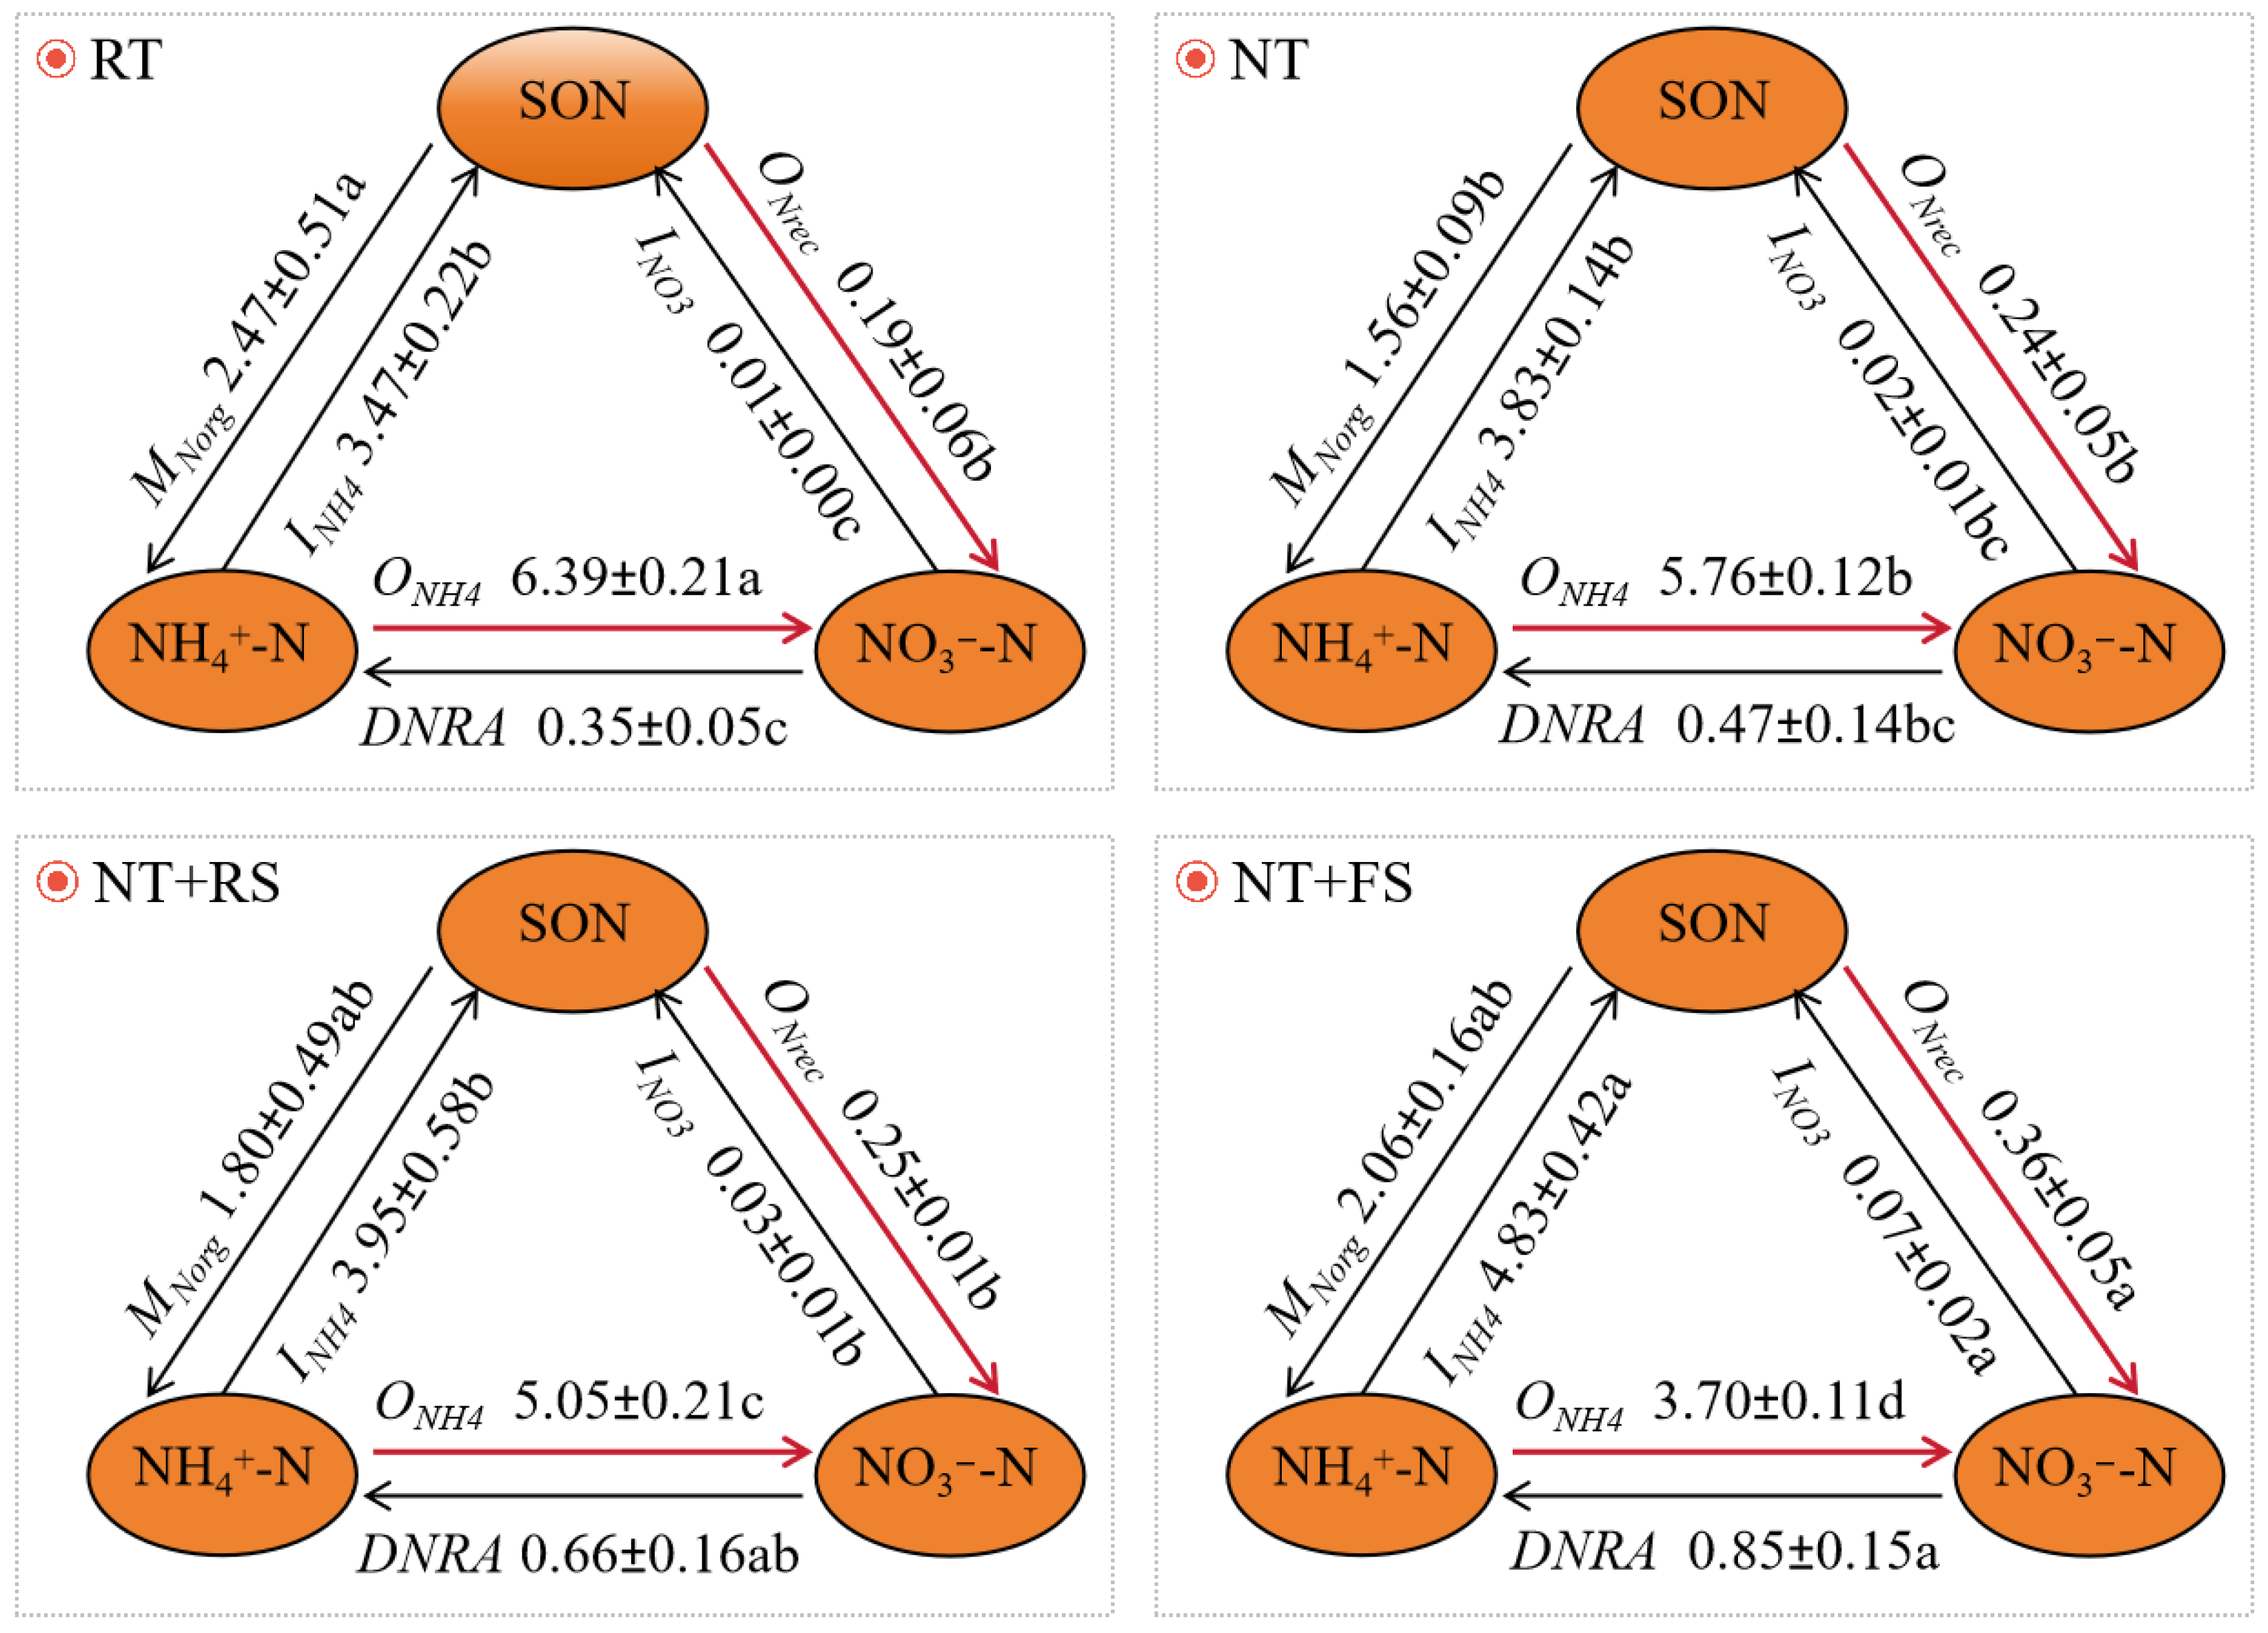
The results of the 15N-paired-labeling incubation experiment showed that, throughout the incubation process, the NH4+-N concentrations decreased gradually across all the tillage management strategies (Figure 4A); in comparison, the NO3-N concentrations increased correspondingly (Figure 4B), denoting net nitrification in the studied BS croplands. After 100,000 iterations, the MCMC-based numerical model accurately simulated the dynamics of inorganic-N concentrations (Figure 4A,B) and their corresponding 15N atom% excess values (Figure 4C–F), as the simulated curves consistently fluctuated within the variability of the measured data (mean ± standard deviation). Quantitative fit diagnostics further indicated high R2 values (typically > 0.95) for all the treatments, confirming the robust performance and reliability of the MCMC-based model in simulating the turnover dynamics of the soil N cycle. The final output of the paired GNTR for each tillage management strategy is summarized in Figure 5.
GNO3 in the studied BS croplands ranged from 4.06 to 6.58 mg N kg−1 soil day−1 (Table 2). Autotrophic nitrification (ONH4) contributed over 90% of the total GNO3, whereas heterotrophic nitrification (ONrec/GNO3) accounted for less than 10%. Compared with the RT treatment, all the CT managements (NT, NT + RS, and NT + FS) significantly reduced the gross rate of ONH4 (Figure 5), and thus, the total GNO3 decreased by 8.8%, 19.3%, and 38.3%, respectively.
CNO3 in the studied BS croplands varied from 0.36 to 0.92 mg N kg−1 soil day−1 (Table 2), among which DNRA accounted for more than 93% of the total NO3-N consumption pathways parameterized in our model. Both NT + RS and NT + FS significantly increased DNRA relative to RT (Figure 5), and consequently, enhanced the total CNO3 by 92.0% and 156.4%, respectively.
Across the treatments, gross NO3-N production (GNO3) was consistently higher than the corresponding consumption (CNO3), which resulted in net NO3-N production (NNO3 ranging between 3.14 and 6.22 mg N kg−1 soil day−1). CT management decreased GNO3 while increasing CNO3 and accordingly led to respective declines in NNO3 of 11.4%, 25.7%, and 49.6% for NT, NT + RS, and NT + FS compared to RT (Table 2). Ratios of ONH4 to INH4 (N/I) in the studied BS ranged from 0.77 to 1.85, which decreased by 18.6%, 29.9%, and 58.5% under the NT, NT + RS, and NT + FS treatments, respectively (Table 2).

3.4. Correlation Analysis

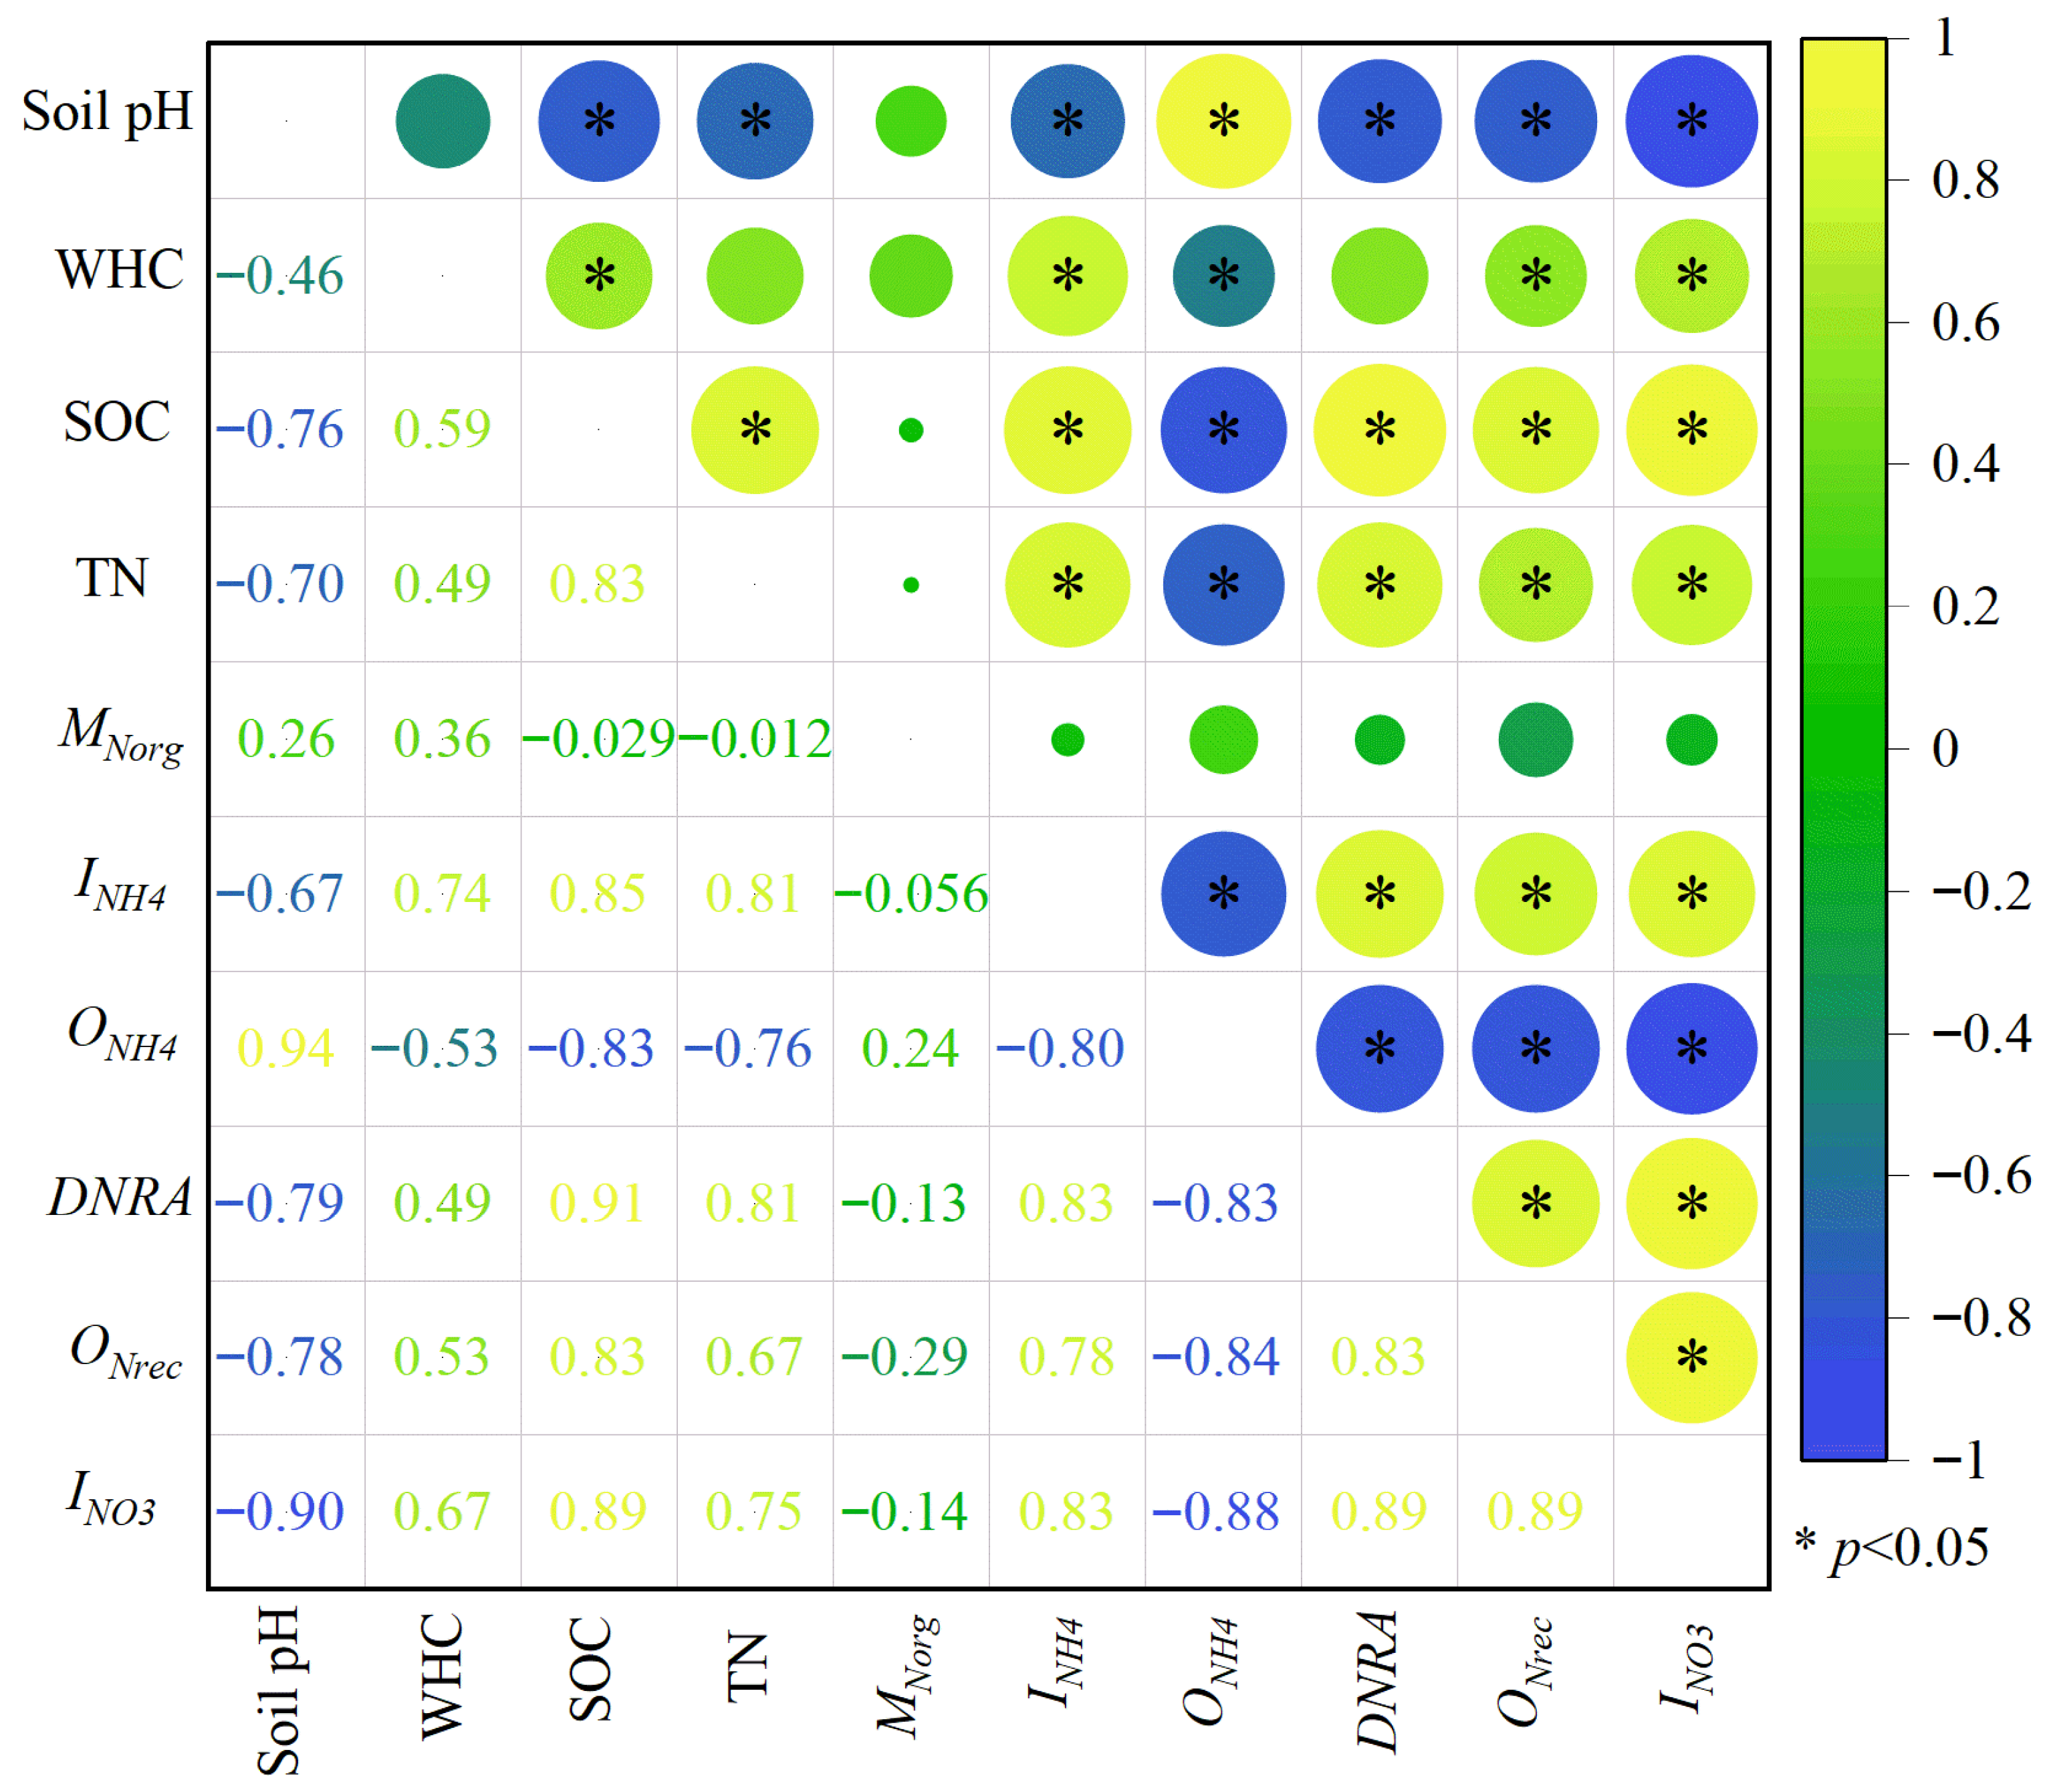
Correlations between soil physicochemical properties and GNTR are provided in Figure 6. In detail, ONH4 correlated positively with soil pH, but negatively with both SOC content and the gross rate of INH4. In contrast, ONrec exhibited a significant positive correlation with the WHC, SOC, and TN content, but was inversely related to soil pH. Both the gross rate of INO3 and DNRA were positively correlated with the SOC content across all the tillage management strategies (p < 0.05, n = 16).

4. Discussion

4.1. Leaching Potential

The fates of fertilizer-N in soil–crop–environment systems are largely controlled by soil N transformation processes and their respective rates [14,15]. As GNO3 was significantly higher than CNO3 in all tillage management strategies, net production of NO3-N was consistent in the studied BS croplands (Table 2). Similar results were also recorded in our 15N paired-labeling incubation experiment, during which the NH4+-N concentration decreased gradually, whereas the NO3-N concentration increased progressively (Figure 4A,B). In a recent study by Manono et al. (2026) [33], the authors revealed that nitrogen leaching from ecosystems is driven by a complex interplay of environmental factors, including soil properties (e.g., availability of NO3-N and microbial activity), topography, and hydrology (e.g., preferential flow through macropores). These lines of evidence collectively suggest that, from the perspective of substrate availability, FNO3 is prone to leaching losses in the studied spring maize agroecosystems. The results of the field 15N-micro-plot experiment further indicated that, after three years of continuous tracing, FNO3 was observed to migrate into the 180–220 cm soil layer (Figure 2C). Such a rapid vertical redistribution, particularly under the increasing frequency of extreme precipitation events recorded for Northeast China [34], implies that NO3-N leaching potential and its associated threat to regional groundwater pollution cannot be overlooked.

4.2. Mitigation Mechanisms

Soil N cycling is essentially a microbe-driven process, which mediates the turnover dynamics between inorganic and organic-N pools [35]. Shifting tillage practices reshapes the soil N cycle through two interlinked mechanisms: (i) a substrate effect, by which changing TN content directly modifies the substrate available for soil N cycling [36,37], and (ii) a microbe effect, whereby shifts in soil key environmental conditions—such as pH, WHC, availability of SOC, and TN content—affect microbial activity and indirectly regulate the rates and products of the soil N transformation processes [38,39]. Our findings further support this synergistic view, as verified by the significant correlations between the paired GNTR and soil physicochemical properties (Figure 6). Consequently, elucidating the turnover dynamics of individual NO3-N production and consumption processes under different tillage regimes, based on the framework of ‘substrate–microbe interplay’ [15], is essential to identify the specific mechanisms that regulate both the efficient retention and supply of NO3-N in the studied BS croplands.
Reduced total NO3-N production in CT agroecosystems: In the tested BS croplands, ONH4 accounted for more than 90% of the total GNO3 (Table 2). With soil pH ranging from 6.7 to 7.5 (Figure 3A), ammonia-oxidizing bacteria (AOB) represent the key functional microbes driving nitrification in agricultural soils [40,41]. These results collectively reveal that NO3-N production in the tested BS croplands is primarily derived from AOB-dominated autotrophic nitrification, which was in accordance with the results of previous studies conducted by Zhang et al. (2013) [42] and Elrys et al. (2023) [22]. Relative to RT, NT significantly reduced the gross rate of MNorg (Figure 5). This suppression likely results from the lower soil disturbance and higher soil aggregation in the CT agroecosystems [43], which physically protect organo-mineral complexes and limit microbial access to organic-N substrates [44]—a strategy more effective in clay-rich soils [45]. Straw mulching also improves soil micro-environmental conditions (such as moisture and C/N availability), thereby stimulating microbial NH4+-N immobilization (INH4) [46]. Consequently, a key factor governing the low total GNO3 under CT agroecosystems is the limited supply of substrate (NH4+-N) for ONH4. CT management strategies, particularly with full-rate straw mulching, also considerably reduced soil pH (Figure 3A). This acidification is likely to have resulted from the leaching of base cations (such as K+, Ca2+, Na+, and Mg2+), accelerated by the organic acids released during straw decomposition [47], which can subsequently suppress the abundance and activity of AOB [39]. Combining this microbial effect with the substrate limitation mentioned above, no-tillage and straw mulching dramatically decreased the ratio of ONH4/INH4 (Table 2). This shift, in turn, reflects a more efficient N conservation cycle established in the CT management strategies [48,49], and ultimately reduced total NO3-N production in CT agroecosystems.
Enhanced total NO3-N consumption in CT agroecosystems: INO3 and DNRA were identified as the two major biological consumption pathways for soil nitrate. Across all tillage management strategies, the gross rate of INO3 was negligible relative to INH4 (Figure 5), which could be attributed to the high energy cost required for INO3 [50]. As a result, among the NO3-N consumption pathways directly quantified using our 15N model, DNRA accounted for over 93% of the total CNO3 in the tested BS croplands (Table 2). This finding is consistent with the previous study, in which the results indicated that, in neutral to alkaline agricultural soils, DNRA serves as the predominant process for NO3-N consumption [51]. Relative to RT, no-tillage and straw mulching significantly stimulate the DNRA process. This improvement can mainly be attributed to the increased availability of labile SOC and TN substrates [52]. By sequestering NO3-N into the plant- microbe-available NH4+-N form, CT managements thus substantially increased total NO3-N consumption, and thereby prevented its potential loss through leaching [53].

4.3. Management Implications

Relative to RT, CT management strategies significantly enhanced both the gross rate of heterotrophic nitrification (ONrec, Figure 5) and its proportion in total nitrification (ONrec/GNO3, Table 2). Two factors likely explain this stimulation: (i) long-term CT practices increase the stock of soil organic-N [54,55], maintaining a constant substrate supply for ONrec, and (ii) the improved soil micro-environment conditions under CT managements likely favor the abundance and activity of fungi [56], which are recognized as key drivers of heterotrophic nitrification in soil [57]. It is noteworthy that the observed ONrec/GNO3 ratio for the tested BS croplands fell within the range of 3% to 9%, which is substantially lower than the global average ratio of 32%, reported by Zhang et al. (2023) [58] from 491 observations for agroecosystems. This inconsistency could be related to the pH threshold of ONrec, which is generally considered negligible in soils with pH > 6.5 [59].
Despite its relatively low contribution, no-tillage with full-rate straw mulching nevertheless doubled the ratio of ONrec/GNO3 relative to conventional management. As 54.8% of croplands in the tested BS regions are characterized by a pH lower than 6.5 [60], and regional variations in SOC and TN contents are significant across Northeast China [61], widespread application of CT management—particularly in areas with lower soil pH (<6.5) and higher C/N contents—could substantially stimulate ONrec. Under these conditions, heterotrophic nitrification can contribute more substantially to total nitrification, which should not be overlooked. In order to more effectively quantify the spatial variability of ONrec and its impact on soil N cycling, future studies should conduct experiments at different soil pH gradients and C/N contents within BS croplands. Such efforts will refine our theoretical insight into soil NO3-N transformation dynamics, and thus provide tailored strategies for the sustainable development of regional agriculture.

4.4. Experimental Limitations

In the 15N-tracing field micro-plot experiment, the PVC boards were simply inserted to a depth of 60 cm, making it impossible to exclude the potential for lateral migration of FNO3 throughout the deep soil profile. Future studies could address this limitation by simultaneously characterizing both vertical and lateral distributions of FNO3 in response to different management practices, thereby providing a more precise assessment of the distribution of FNO3 in agroecosystems.
Additionally, in this study, we focused exclusively on the availability of substrate (nitrate) as a single factor while neglecting the role of hydrological characteristics in the vertical migration of FNO3 within the soil profile. As the experimental platform used in this study was based on a long-term field trial, future research could install lysimeters or similar devices to quantitatively collect leachate, thereby enabling a more robust evaluation of FNO3 leaching losses under different management practices.
In the 15N-paired-labeling incubation experiment, all the GNTR measurements were conducted on near-surface soil samples based on the assumption that surface processes largely govern the nitrate supply entering the transport domain (source control). Future studies investigating GNTR at different soil depths will enhance our understanding of N turnover dynamics throughout the entire soil profile and provide a better assessment of the contribution of subsoil processes to overall nitrate retention or loss potential in agroecosystems.

5. Conclusions

In the black soil croplands of Northeast China, FNO3 exhibited a rapid vertical translocation, which was observed to migrate into the 180–220 cm soil layer after three years of continuous observation. As the extreme precipitation has become increasingly frequent in the studied regions, this pattern suggests a potential for leaching of FNO3. Relative to RT, no-tillage with full-rate straw mulching substantially reduces the deep distribution potential and thus the leaching potential of FNO3 through two synergistic mechanisms: (i) suppression of autotrophic nitrification to reduce total NO3-N production, and (ii) enhancement of DNRA to increase total NO3-N consumption, which significantly decreased net NO3-N production, and thereby delayed the downward transport of FNO3 into the deeper soil layer. It should also be noted that, while autotrophic nitrification remains the dominant pathway for NO3-N production in the tested black soils, CT practices significantly stimulate both the turnover dynamics of heterotrophic nitrification and its proportion in total nitrification. In light of the widespread adoption of conservation tillage in recent management guidelines and the evident high leaching potential in the studied regions, critical consideration should be given to the role of heterotrophic nitrification in soil N cycling, particularly in black soil regions with a pH below 6.5 and relatively high SOC and TN contents. These findings offer a scientific basis for designing site-specific tillage strategies for sustainable agriculture in Northeast China.

Author Contributions

Conceptualization, J.Z.; methodology, C.M.; software, C.M.; validation, Y.L.; formal analysis, Y.L.; investigation, Y.L.; resources, J.Z.; data curation, Y.L.; writing—original draft, Y.L.; writing—review and editing, L.Y.; supervision, L.Y.; funding acquisition, L.Y. All authors have read and agreed to the published version of the manuscript.

Funding

This study was financially supported by the National Key R&D Program of China (Grant 2022YFD1500305), the National Natural Science Foundation of China (Grant 42507404, U22A20610), and the Scientific Research Foundation for High-level Talents of Shenyang Ligong University (Grant 1010147001206).

Institutional Review Board Statement

Not applicable.

Informed Consent Statement

Not applicable.

Data Availability Statement

The data will be made available on request.

Acknowledgments

We would like to thank the three anonymous reviewers for their valuable feedback on this paper.

Conflicts of Interest

The authors declare that they have no known competing financial interests or personal relationships that could have appeared to influence the work reported in this paper.

References

  1. Wang, S.; Huang, X.L.; Zhang, Y.; Yin, C.B.; Richel, A. The effect of corn straw return on corn production in Northeast China: An integrated regional evaluation with meta-analysis and system dynamics. Resour. Conserv. Recycl. 2021, 167, 105402. [Google Scholar] [CrossRef] [Scilit]
  2. Li, R.; Hu, W.; Jia, Z.; Liu, H.; Zhang, C.; Huang, B.; Yang, S.; Zhao, Y.; Zhao, Y.; Shukla, M.K.; et al. Soil degradation: A global threat to sustainable use of black soils. Pedosphere 2025, 35, 264–279. [Google Scholar] [CrossRef] [Scilit]
  3. Yu, Z.; Liu, J.; Kattel, G. Historical nitrogen fertilizer use in China from 1952 to 2018. Earth Syst. Sci. Data 2022, 14, 5179–5194. [Google Scholar] [CrossRef] [Scilit]
  4. Galloway, J.N.; Townsend, A.R.; Erisman, J.W.; Bekunda, M.; Cai, Z.C.; Freney, J.R.; Martinelli, L.A.; Seitzinger, S.P.; Sutton, M.A. Transformation of the nitrogen cycle: Recent trends, questions, and potential solutions. Science 2008, 320, 889–892. [Google Scholar] [CrossRef] [Scilit]
  5. Gu, B.J.; Zhang, X.M.; Lam, S.K.; Yu, Y.L.; van Grinsven, H.J.M.; Zhang, S.H.; Wang, X.X.; Bodirsky, B.L.; Wang, S.T.; Duan, J.K.; et al. Cost-effective mitigation of nitrogen pollution from global croplands. Nature 2023, 613, 77–84. [Google Scholar] [CrossRef] [Scilit]
  6. Wang, C.; Ye, T.Y.; Tang, L.; Xiao, S.Q.; Ma, R.Y.; Han, Z.Q.; Liu, X.J.; Tian, H.Q.; Liu, S.W.; Ciais, P.; et al. Historical changes in fertilizer-induced soil nitrogen losses from upland grain crops and impacts of climate change. Environ. Sci. Technol. 2025, 59, 27291–27304. [Google Scholar] [CrossRef] [Scilit]
  7. FAO. What Is Conservation Agriculture? FAO-CA. 2014. Available online: http://www.fao.org/ag/ca/1a.html (accessed on 20 March 2026).
  8. Zhao, J.; Li, N.; Yang, X.G.; Sun, Z.X. For the protection of black soils. Nat. Food 2025, 6, 119–120. [Google Scholar] [CrossRef] [Scilit]
  9. Yuan, L.; Chen, X.; Jia, J.C.; Chen, H.H.; Shi, Y.; Ma, J.; Liang, C.; Liu, Y.; Xie, H.T.; He, H.B.; et al. Stover mulching and inhibitor application maintain crop yield and decrease fertilizer N input and losses in no-till cropping systems in Northeast China. Agr. Ecosyst. Environ. 2021, 312, 107360. [Google Scholar] [CrossRef] [Scilit]
  10. Quan, Z.; Zhang, X.; Fang, Y.; Davidson, E.A. Different quantification approaches for nitrogen use efficiency lead to divergent estimates with varying advantages. Nat Food 2021, 2, 241–245. [Google Scholar] [CrossRef] [Scilit]
  11. Zhao, X.; Wang, Y.Y.; Cai, S.Y.; Ladha, J.K.; Castellano, M.J.; Xia, L.L.; Xie, Y.X.; Xiong, Z.Q.; Gu, B.J.; Xing, G.X.; et al. Legacy nitrogen fertilizer in a rice-wheat cropping system flows to crops more than the environment. Sci. Bull. 2024, 69, 1212–1216. [Google Scholar] [CrossRef] [Scilit]
  12. Zhang, X.; Davidson, E.A.; Mauzerall, D.L.; Searchinger, T.D.; Dumas, P.; Shen, Y. Managing nitrogen for sustainable development. Nature 2015, 528, 51–59. [Google Scholar] [CrossRef] [Scilit]
  13. Scheer, C.; Rütting, T. Use of 15N tracers to study nitrogen flows in agro-ecosystems: Transformation, losses and plant uptake. Nutr. Cycl. Agroecosyst. 2023, 125, 89–93. [Google Scholar] [CrossRef] [Scilit]
  14. Zhang, X.; Zou, T.; Lassaletta, L.; Mueller, N.D.; Tubiello, F.N.; Lisk, M.D.; Lu, C.; Conant, R.T.; Dorich, C.D.; Gerber, J.; et al. Quantification of global and national nitrogen budgets for crop production. Nat. Food 2021, 2, 529–540. [Google Scholar] [CrossRef] [Scilit] [PubMed]
  15. Guo, S.M.; Bol, R.; Li, Z.T.; Wu, J.; Lin, H.Y.; Bo, X.M.; Zhang, Z.W.; Han, Z.Q.; Wang, J.Y.; Zou, J.W. Patterns and drivers of soil autotrophic nitrification and associated N2O emissions. Soil Biol. Biochem. 2025, 203, 109730. [Google Scholar] [CrossRef] [Scilit]
  16. Booth, M.S.; Stark, J.M.; Rastetter, E. Controls on nitrogen cycling in terrestrial ecosystems: A synthetic analysis of literature data. Ecol. Monogr. 2005, 75, 139–157. [Google Scholar] [CrossRef] [Scilit]
  17. Müller, C.; Clough, T.J. Advances in understanding nitrogen flows and transformations: Gaps and research pathways. J. Agric. Sci. 2013, 152, 34–44. [Google Scholar] [CrossRef] [Scilit]
  18. Stark, J.M.; Hart, S.C. High rates of nitrification and nitrate turnover in undisturbed coniferous forests. Nature 1997, 385, 61–64. [Google Scholar] [CrossRef] [Scilit]
  19. Elrys, A.S.; Chen, S.D.; Kong, M.R.; Liu, L.J.; Zhu, Q.L.; Dan, X.Q.; Tang, S.R.; Wu, Y.Z.; Meng, L.; Zhang, J.B.; et al. Organic fertilization strengthens multiple internal pathways for soil mineral nitrogen production: Evidence from the meta-analysis of long-term field trials. Biol. Fert. Soils 2024, 60, 1173–1180. [Google Scholar] [CrossRef] [Scilit]
  20. Wang, G.; Zhu, Z.H.; Cao, J.H.; Zhu, T.B.; Zhou, J.C.; Müller, C.; Li, J.R.; Freese, D.; Le Roux, X. Agricultural cultivation duration affects soil inorganic N turnover and supply capacity: Evidence in subtropical karst regions. Agr. Ecosyst. Environ. 2025, 381, 109462. [Google Scholar] [CrossRef] [Scilit]
  21. Jansen-Willems, A.B.; Zawallich, J.; Müller, C. Advanced tool for analysing 15N tracing data. Soil Biol. Biochem. 2022, 165, 108532. [Google Scholar] [CrossRef] [Scilit]
  22. Elrys, A.S.; Wang, J.; Meng, L.; Zhu, Q.L.; El-Sawy, M.M.; Chen, Z.X.; Tu, X.S.; El-Saadony, M.T.; Zhang, Y.H.; Zhang, J.B.; et al. Integrative knowledge-based nitrogen management practices can provide positive effects on ecosystem nitrogen retention. Nat. Food 2023, 4, 1075–1089. [Google Scholar] [CrossRef] [Scilit]
  23. Li, Y.; Zhang, W.; Li, J.; Zhou, F.; Liang, X.N.; Zhu, X.F.; He, H.B.; Zhang, X.D. Complementation between microbial necromass and plant debris governs the long-term build-up of the soil organic carbon pool in conservation agriculture. Soil Biol. Biochem. 2023, 178, 108963. [Google Scholar] [CrossRef] [Scilit]
  24. He, Z.M.; Zhu, X.F.; Zhou, F.; Zhu, M.T.; Bao, X.L.; Deng, F.B.; He, H.B.; Zhang, X.D. How bacterial traits scale to soil organic matter pool buildup revealed by long-term maize straw mulching experiment. Agr. Ecosyst. Environ. 2025, 393, 109816. [Google Scholar] [CrossRef] [Scilit]
  25. Wang, X.Y.; Chen, J.Q.; Yuan, L.; Chen, H.H.; Yuan, L.; Hu, Y.Y.; Chen, X.; Xie, H.T.; He, H.B.; Zhang, X.D.; et al. Enhancing fertilizer nitrogen environmental safety and soil sustainability: The role of no-tillage with straw mulching in maize production. Agr. Ecosyst. Environ. 2025, 382, 109480. [Google Scholar] [CrossRef] [Scilit]
  26. Blanco-Canqui, H.; Ruis, S.J. No-tillage and soil physical environment. Geoderma 2018, 326, 164–200. [Google Scholar] [CrossRef] [Scilit]
  27. Müller, C.; Rütting, T.; Kattge, J.; Laughlin, R.J.; Stevens, R.J. Estimation of parameters in complex 15N tracing models by Monte Carlo sampling. Soil Biol. Biochem. 2007, 39, 715–726. [Google Scholar] [CrossRef] [Scilit]
  28. Xie, Y.; Yang, L.; Zhu, T.B.; Yang, H.; Zhang, J.B.; Yang, J.L.; Cao, J.H.; Bai, B.; Jiang, Z.C.; Liang, Y.M.; et al. Rapid recovery of nitrogen retention capacity in a subtropical acidic soil following afforestation. Soil Biol. Biochem. 2018, 120, 171–180. [Google Scholar] [CrossRef] [Scilit]
  29. Zhang, C.; Ju, X.; Zhang, J.; Rees, R.M.; Müller, C. Soil pH and long-term fertilization affect gross N transformation and N2O production pathways in Chinese and UK croplands. Biol. Fert. Soils 2023, 59, 527–539. [Google Scholar] [CrossRef] [Scilit]
  30. Lu, R.K. Soil Agricultural Chemical Analysis Methods; China Agricultural Science and Technology: Beijing, China, 2000. [Google Scholar]
  31. Chen, H.H.; Liu, Y.; Lv, L.P.; Yuan, L.; Jia, J.C.; Chen, X.; Ma, J.; Zhao, J.X.; Liang, C.; Xie, H.T.; et al. Effects of no-tillage and stover mulching on the transformation and utilization of chemical fertilizer N in Northeast China. Soil Till. Res. 2021, 213, 105131. [Google Scholar] [CrossRef] [Scilit]
  32. R Development Core Team. R: A Language and Environment for Statistical Computing; R Foundation for Statistical Computing: Vienna, Austria, 2022. [Google Scholar]
  33. Manono, B.O.; Kimiti, J.M.; Musyoka, D.K. Landscape determinants of nitrogen leaching risk: Mechanisms, impacts, and mitigation strategies. Nitrogen 2026, 7, 20. [Google Scholar] [CrossRef] [Scilit]
  34. Li, Z.H.; Wu, Y.F.; Zhang, G.X.; Xu, Y.J.; Ni, B.B.; Hu, B.T.; Sun, J.X.; Zhang, Q.S.; Yu, Y.X. China’s Black Soil Granary is approaching the climax phase of agricultural water security risk. Agric. Water Manag. 2025, 319, 109780. [Google Scholar] [CrossRef] [Scilit]
  35. Kuypers, M.M.M.; Marchant, H.K.; Kartal, B. The microbial nitrogen-cycling network. Nat. Rev. Microbiol. 2018, 16, 263–276. [Google Scholar] [CrossRef] [Scilit] [PubMed]
  36. He, X.X.; Dai, S.Y.; Meng, L.; He, M.Q.; Wang, X.G.; Cai, Z.C.; Zhu, B.; Zhang, J.B.; Nardi, P.; Müller, C. Effects of 18 years repeated N fertilizer applications on gross N transformation rates in a subtropical rain-fed purple soil. Appl. Soil Ecol. 2023, 189, 104952. [Google Scholar] [CrossRef] [Scilit]
  37. Pan, W.K.; Tang, S.; Zhou, J.J.; Wanek, W.; Gregory, A.S.; Ge, T.D.; Marsden, K.A.; Chadwick, D.R.; Liang, Y.C.; Wu, L.H.; et al. Long-term manure and mineral fertilisation drive distinct pathways of soil organic nitrogen decomposition: Insights from a 180-year-old study. Soil Biol. Biochem. 2025, 207, 109840. [Google Scholar] [CrossRef] [Scilit]
  38. Ding, B.J.; Xu, D.; Wang, S.; Liu, W.Z.; Zhang, Q.F. Additive effects of multiple global change drivers on terrestrial nitrogen cycling worldwide. Glob. Change Biol. 2025, 31, e70176. [Google Scholar] [CrossRef] [Scilit]
  39. Jia, M.R.; Kooijman, A.; Bol, R.; Wessel, W.W.; Hassler, K.; Tietema, A. Gross soil N transformations and microbial communities in Luxembourg beech forest (Fagus sylvatica L.) soils along a pH gradient. Geoderma 2025, 454, 117194. [Google Scholar] [CrossRef] [Scilit]
  40. Zhang, L.M.; Hu, H.W.; Shen, J.P.; He, J.Z. Ammonia-oxidizing archaea have more important role than ammonia-oxidizing bacteria in ammonia oxidation of strongly acidic soils. ISME J. 2012, 6, 1032–1045. [Google Scholar] [CrossRef] [Scilit]
  41. Bai, X.; Hu, X.J.; Liu, J.J.; Wei, D.; Zhu, P.; Cui, X.A.; Zhou, B.K.; Chen, X.L.; Liu, J.D.; Jin, J.; et al. Ammonia oxidizing bacteria dominate soil nitrification under different fertilization regimes in black soils of Northeast China. Eur. J. Soil Biol. 2022, 111, 103410. [Google Scholar] [CrossRef] [Scilit]
  42. Zhang, J.B.; Zhu, T.B.; Meng, T.Z.; Zhang, Y.C.; Yang, J.J.; Yang, W.Y.; Müller, C.; Cai, Z.C. Agricultural land use affects nitrate production and conservation in humid subtropical soils in China. Soil Biol. Biochem. 2013, 62, 107–114. [Google Scholar] [CrossRef] [Scilit]
  43. Zhu, M.T.; Yuan, L.; Zhou, F.; Ma, S.C.; Zhang, W.; Miltner, A.; He, H.B.; Zhang, X.D. Time-dependent regulation of soil aggregates on fertilizer N retention and the influence of straw mulching. Soil Biol. Biochem. 2024, 198, 109551. [Google Scholar] [CrossRef] [Scilit]
  44. Kristensen, H.L.; McCarty, G.W.; Meisinger, J.J. Effects of soil structure disturbance on mineralization of organic soil nitrogen. Soil Sci. Soc. Am. J. 2000, 64, 371–378. [Google Scholar] [CrossRef] [Scilit]
  45. Li, Z.L.; Zeng, Z.Q.; Tian, D.S.; Wang, J.S.; Wang, B.X.; Chen, H.Y.H.; Quan, Q.; Chen, W.N.; Yang, J.L.; Meng, C.; et al. Global variations and controlling factors of soil nitrogen turnover rate. Earth Sci. Rev. 2020, 207, 103250. [Google Scholar] [CrossRef] [Scilit]
  46. Wang, X.L.; Zhou, M.H.; Zhu, B.; Zhang, J.B.; Müller, C.; Kiese, R.; Butterbach-Bahl, K. Contrasting effects of crop straw and green manure amendments on soil gross N transformations in a soil-maize system: A short-term 15N incubation case study. Plant Soil 2024, 512, 1297–1310. [Google Scholar] [CrossRef] [Scilit]
  47. Guo, Y.L.; Zhang, Z.X.; Liang, F.; Cao, W.C.; Wang, Y.J.; Chen, J.S.; Guo, J.H. Meta-analysis reveals that returning crop straw to arable land causes soil acidification at the global scale. Eur. J. Agron. 2025, 164, 127511. [Google Scholar] [CrossRef] [Scilit]
  48. Zhang, Y.S.; Pan, B.B.; Lam, S.K.; Bai, E.; Hou, P.; Chen, D. Predicting the ratio of nitrification to immobilization to reflect the potential risk of nitrogen loss worldwide. Environ. Sci. Technol. 2021, 55, 7721–7730. [Google Scholar] [CrossRef] [Scilit] [PubMed]
  49. Uwiragiye, Y.; Wang, J.; Huang, Y.Y.; Wu, L.P.; Zhou, J.K.; Zhang, Y.H.; Chen, M.Q.; Jing, H.; Qian, Y.F.; Elrys, A.S.; et al. Global ecosystem nitrogen cycling reciprocates between land-use conversion and its reversal. Glob. Change Biol. 2024, 30, e17537. [Google Scholar] [CrossRef] [Scilit]
  50. Geisseler, D.; Horwath, W.R.; Joergensen, R.G.; Ludwig, B. Pathways of nitrogen utilization by soil microorganisms—A review. Soil Biol. Biochem. 2010, 42, 2058–2067. [Google Scholar] [CrossRef] [Scilit]
  51. Chen, Z.M.; Ding, W.X.; Xu, Y.H.; Müller, C.; Rütting, T.; Yu, H.Y.; Fan, J.L.; Zhang, J.B.; Zhu, T.B. Importance of heterotrophic nitrification and dissimilatory nitrate reduction to ammonium in a cropland soil: Evidences from a 15N tracing study to literature synthesis. Soil Biol. Biochem. 2015, 91, 65–75. [Google Scholar] [CrossRef] [Scilit]
  52. Cheng, Y.; Elrys, A.S.; Merwad, A.M.; Zhang, H.M.; Chen, Z.X.; Zhang, J.B.; Cai, Z.C.; Müller, C. Global patterns and drivers of soil dissimilatory nitrate reduction to ammonium. Environ. Sci. Technol. 2022, 56, 3791–3800. [Google Scholar] [CrossRef] [Scilit]
  53. Yang, Q.N.; Li, H.; Gong, L.X.; Zhang, X.L.; Wang, L.L. Dissimilatory nitrate reduction to ammonium (DNRA) and nrfA gene in crop soils: A meta-analysis of cropland management effects. GCB Bioenergy 2025, 17, e70039. [Google Scholar] [CrossRef] [Scilit]
  54. Xu, L.; Chen, H.; Zhou, Y.; Zhang, J.; Nadeem, M.Y.; Miao, C.; You, J.; Li, W.; Jiang, Y.; Ding, Y.; et al. Long-term straw returning improved soil nitrogen sequestration by accelerating the accumulation of amino acid nitrogen. Agr. Ecosyst. Environ. 2024, 362, 108846. [Google Scholar] [CrossRef] [Scilit]
  55. Dong, S.H.; Deng, F.B.; Zhou, F.; Ma, S.C.; Wang, Z.Y.; Wang, W.Q.; Zhang, W.; He, H.B.; Zhang, X.D. Internal transformation of fertilizer-derived organic nitrogen fractions in an arable soil and the regulation of maize residue mulching. Geoderma 2025, 459, 117385. [Google Scholar] [CrossRef] [Scilit]
  56. Yang, Y.L.; Xie, H.T.; Mao, Z.; Bao, X.L.; He, H.B.; Zhang, X.D.; Liang, C. Fungi determine increased soil organic carbon more than bacteria through their necromass inputs in conservation tillage croplands. Soil Biol. Biochem. 2022, 167, 108587. [Google Scholar] [CrossRef] [Scilit]
  57. Zhang, Y.; Liu, S.Y.; Cheng, Y.; Cai, Z.C.; Müller, C.; Zhang, J.B. Composition of soil recalcitrant C regulates nitrification rates in acidic soils. Geoderma 2019, 337, 965–972. [Google Scholar] [CrossRef] [Scilit]
  58. Zhang, Y.; Cai, Z.C.; Zhang, J.B.; Müller, C. The controlling factors and the role of soil heterotrophic nitrification from a global review. Appl. Soil Ecol. 2023, 182, 104698. [Google Scholar] [CrossRef] [Scilit]
  59. Wang, J.; Wang, L.; Feng, X.J.; Hu, H.F.; Cai, Z.C.; Müller, C.; Zhang, J.B. Soil N transformations and its controlling factors in temperate grasslands in China: A study from 15N tracing experiment to literature synthesis. J. Geophys. Res. Biogeosci. 2016, 121, 2949–2959. [Google Scholar] [CrossRef] [Scilit]
  60. Wang, J.K.; Xu, X.R.; Pei, J.B.; Li, S.Y. Current situations of black soil quality and facing opportunities and challenges in Northeast China. Chin. J. Soil Sci. 2021, 52, 695–701, (In Chinese with English Abstract). [Google Scholar]
  61. Ou, Y.; Rousseau, A.N.; Wang, L.X.; Yan, B.X. Spatio-temporal patterns of soil organic carbon and pH in relation to environmental factors—A case study of the Black Soil Region of Northeastern China. Agr. Ecosyst. Environ. 2017, 245, 22–31. [Google Scholar] [CrossRef] [Scilit]
Figure 1. Percentages of total FNO3 in the soil profile relative to the applied urea-N. Note: Different lowercase letters in the same column indicate significant differences among treatments at p < 0.05.
Sustainability 18 03351 g001
Figure 2. Percentages of FNO3 relative to the applied urea-N for individual soil layers.
Sustainability 18 03351 g002
Figure 3. Soil pH (A), WHC (B), SOC (C) and TN (D) under different tillage practices in 2018. Note: Different lowercase letters indicate significant differences among treatments at p < 0.05.
Sustainability 18 03351 g003
Figure 4. Dynamics of ammonium and nitrate concentrations (A,B) and 15N atom% excess (CF) during the 15N paired-labeling incubation. Note: Symbols represent the measured data at four sampling time points in the 15N paired-labeling incubation experiment, whereas solid curves are the fitted results from the MCMC-based numerical model for N transformation processes.
Sustainability 18 03351 g004
Figure 5. Dynamics of GNTR under the contrasting tillage management regimes. Note: Different lowercase letters within the same N transformation process indicate significant differences among treatments at p < 0.05.
Sustainability 18 03351 g005
Figure 6. Correlation between soil physicochemical properties and paired GNTR (n = 16).
Sustainability 18 03351 g006
Table 1. Soil physicochemical properties in the 0–20 cm layer of 2007.
Physical PropertiesChemical Properties
Soil texture
(%)
Sand28.5Available
nutrient
(mg kg−1)
Alkeline N90.1
Silt38.6Available P6.9
Clay32.9Available K143.6
Clay mineral composition
(<2 µm, %)
Chlorite30.0Total nutrient
(g kg−1)
Soil organic C
Total N
Total P
Total K
11.3
1.2
0.38
24.3
Montmorillonite24.2
Illite14.5
Vermiculite2.7
Kaolinite23.3
Quartz5.0
Feldspar0.3
Note: Sand: 2–0.05 mm; Silt: 0.05–0.002 mm; Clay: <0.002 mm.
Table 2. Dynamics of the gross NO3-N production and consumption rates under different tillage management strategies.
ParametersRTNTNT + RSNT + FS
GNO3 6.58 ± 0.24 a5.99 ± 0.14 b5.31 ± 0.21 c4.06 ± 0.16 d
ONH4/GNO3 (%)97.22 ± 0.84 a96.03 ± 0.71 ab95.22 ± 0.22 b91.13 ± 0.86 c
ONrec/GNO3 (%)2.78 ± 0.84 c3.97 ± 0.71 bc4.78 ± 0.22 b8.87 ± 0.86 a
CNO3 0.36 ± 0.05 c0.48 ± 0.15 bc0.69 ± 0.16 ab0.92 ± 0.16 a
DNRA/CNO3 (%)96.73 ± 0.76 a96.04 ± 0.17 a94.97 ± 2.07 a92.61 ± 0.87 b
INO3/CNO3 (%)3.27 ± 0.76 b3.96 ± 0.17 b5.03 ± 2.07 b7.39 ± 0.87 a
NNO36.22 ± 0.21 a5.51 ± 0.03 b4.62 ± 0.32 c3.14 ± 0.09 d
ONH4/INH4 (N/I)1.85 ± 0.18 a1.50 ± 0.05 b1.30 ± 0.18 b0.77 ± 0.04 c
Note: Different lowercase letters in the same row indicate significant differences among treatments at p < 0.05.
Disclaimer/Publisher’s Note: The statements, opinions and data contained in all publications are solely those of the individual author(s) and contributor(s) and not of MDPI and/or the editor(s). MDPI and/or the editor(s) disclaim responsibility for any injury to people or property resulting from any ideas, methods, instructions or products referred to in the content.