Article

Data Elements and Enterprise Green Total Factor Productivity: Evidence from China’s Big Data Comprehensive Pilot Zones

School of Economics, Harbin University of Commerce, Harbin 150028, China
*
Author to whom correspondence should be addressed.
Sustainability 2026, 18(7), 3274; https://doi.org/10.3390/su18073274
Submission received: 3 February 2026 / Revised: 18 March 2026 / Accepted: 25 March 2026 / Published: 27 March 2026

Abstract

In the digital economy era, how to effectively leverage data elements to promote green productivity has become a critical issue. The Big Data Comprehensive Pilot Zone (BDCPZ) serves as an institutional arrangement to promote data circulation, governance, and efficient allocation. Utilizing panel data from Chinese A-share listed firms spanning 2012–2023, this study treats the 2016 establishment of BDCPZ as a quasi-natural experiment and employs a difference-in-differences (DID) model to investigate how improvements in the data institutional environment induced by BDCPZ affect enterprise green total factor productivity (GTFP). Empirical results indicate that the establishment of BDCPZ significantly enhances GTFP, with results remaining robust across specification tests. Heterogeneity analyses demonstrate that these positive effects are more pronounced among non-heavily polluting enterprises, high-technology enterprises, and enterprises in less competitive markets. Mechanism analyses suggest that data-oriented institutional reforms primarily enhance GTFP through innovation incentives, human capital accumulation, and industrial structure upgrading. Furthermore, superior managerial efficiency and stronger managerial equity ownership amplify these positive effects. This study provides firm-level empirical evidence on the relationship between data-oriented institutional reforms and GTFP enhancement, contributing to the literature on data-driven institutional reforms and green productivity, and policy implications for optimizing data element utilization and promoting sustainable development.

1. Introduction

Globally, rapid economic growth has generated substantial material wealth, yet it has also exacerbated ecological degradation and resource over-exploitation. This exposes economies to the dual pressures of rising energy consumption and pollution emissions. Against the increasingly urgent climate crisis, achieving green economic growth without compromising development quality has become a central challenge on the global sustainability agenda. The United Nations Environment Programme estimates that global greenhouse gas emissions must decline by approximately 42% by 2030 to remain consistent with the Paris Agreement temperature targets. Improving the quality and efficiency of growth under environmental constraints is therefore not only of immediate practical importance but also constitutes a fundamental question in research on green transition.
In this context, identifying new growth drivers that can simultaneously enhance economic and environmental performance has attracted increasing attention. With the rapid diffusion of big data analytics, cloud computing, and artificial intelligence, data have gradually evolved from auxiliary information resources into a key factor of production. Data are now widely embedded in corporate operations, resource allocation, and decision-making processes [1]. Distinct from conventional factor inputs, data demonstrate unique characteristics including non-rivalry, low marginal replication costs, positive externalities, and increasing returns to scale [2]. These characteristics suggest data’s potential to serve as a new engine for green transformation.
Whether such a growth engine can reconcile economic expansion with environmental sustainability ultimately hinges on productivity performance under environmental constraints. GTFP has emerged as a key measure of how economies or firms generate output while minimizing environmental costs given a set of inputs. Extending the concept of conventional total factor productivity (TFP), which focuses primarily on the relationship between factor inputs (e.g., capital and labor) and output, GTFP distinctively integrates adverse outputs including pollutant emissions and resource depletion into efficiency measurement frameworks. This offers a more holistic evaluation of sustainable growth. Examining whether data element development can improve GTFP is therefore of substantial theoretical and practical relevance.
Given that GTFP improvement is associated with both the digital technology adoption and the effective allocation and utilization of data elements within appropriate institutional environments, this study further clarifies the concept of data elements. Compared with data analytics, data science, and the broader concept of digital economy, data elements emphasize the economic attributes of data as a factor of production, as well as the institutional conditions surrounding their circulation, sharing, allocation, and utilization. The latter primarily emphasizes technological tools, analytical capabilities, or overall digitalization levels. As a key institutional arrangement by the Chinese government to promote data element circulation, governance, and efficient allocation, the critical role of BDCPZ lies in improving the data institutional environment. This study therefore focuses not on the isolated impact of data elements, but rather on how the BDCPZ affects GTFP by optimizing the data institutional environment. This also provides empirical evidence for institutional design and policy refinement.
Existing research has examined the determinants of GTFP from multiple perspectives including environmental regulation, digital economy development, and green finance [3,4,5]; yet the role of data element development remains insufficiently and directly tested. Moreover, most related empirical studies are conducted at regional or industry levels. This may obscure firm-level behavioral responses and adjustment mechanisms under environmental constraints. Micro-level evidence on whether and how institution-driven data element development enhances GTFP therefore remains scarce. To address this gap, this study treats the establishment of the BDCPZ as a quasi-natural experiment. Based on the policy changes induced by this institutional implementation, we construct a DID framework to estimate the impact of data element development on GTFP, thereby providing firm-level evidence on how data-oriented institutional reforms affect GTFP.
This study contributes in three main respects. First, it employs BDCPZs as a policy proxy for improvements in the data element development environment, providing firm-level evidence on the relationship between data elements and GTFP. Second, by decomposing GTFP into two components—green technological change (TC) and green efficiency change (EC)—this study finds that BDCPZ-related GTFP improvements primarily stem from efficiency gains, while outward shifts in the technological frontier receive limited support during the sample period. Third, this study identifies significant heterogeneity in policy effects across firm characteristics, market environments, and corporate governance conditions, highlighting the boundary conditions under which data governance reforms translate into GTFP improvements.

2. Literature Review and Research Hypotheses

2.1. Literature Review

Research on GTFP determinants spans multiple analytical perspectives. By incorporating undesirable outputs such as pollution emissions into traditional productivity analysis frameworks, GTFP enables more comprehensive measurement of production performance under environmental constraints [6]. Given that firms are primary sources of energy consumption and pollution emissions, related research has gradually shifted from macro-level to firm-level analysis in recent years [7,8]. Existing studies indicate that institutional quality, market environment, technological progress, and green innovation all exert significant impacts on GTFP [9,10,11,12,13,14]. Among these, sound institutional and market environments facilitate improved resource allocation efficiency, while technological progress and innovation drive improvements in green production performance. Additionally, digitalization and green finance influence green development by affecting energy transitions [15].
In the context of digital transformation, the role of data-related factors in promoting GTFP has attracted increasing attention. Data elements, as defined in this study, refer to data resources that, after processing and development through information technology, can function as production factors in production, resource allocation, and operational decision-making [16]. Their value realization depends on their integration with factors such as labor, technology, and management [17]. Existing research suggests that data elements may enhance GTFP through production optimization and innovation promotion [18,19]. This impact exhibits nonlinear characteristics, depending on firms’ digital capabilities and the stringency of environmental regulations [20]. However, empirical identification of data-related effects still faces certain challenges. Many studies employ entropy methods to construct composite indicators for measuring data element development [21,22]. Such approaches may suffer from endogeneity and measurement bias, making it difficult to accurately identify institutional development effects related to data. To mitigate these issues, some recent literature has begun conducting quasi-natural experiments using relevant policy shocks. In this context, BDCPZ has been confirmed to be associated with productivity improvements and enhanced low-carbon development outcomes [23,24]. Moreover, research on data trading platforms indicates that data market institutions may facilitate GTFP improvement, highlighting the role of data circulation [25].
At the firm level, related research further finds that active data utilization behaviors and data analytics capabilities promote innovation, labor productivity, and organizational performance improvements [26,27,28,29]. The effectiveness of data elements also varies significantly across industries and firm-specific characteristics [30]. A review of the literature reveals two important limitations. First, most studies conceptualize data as technological capabilities or managerial resources. However, the value of data elements depends not only on firms’ internal analytical capabilities but also on external institutional conditions. Second, even as the literature begins to address data-related variables, most studies still focus on broad digitalization composite indicators. Direct micro-level evidence on how institution-driven improvements in the data element environment affect GTFP remains limited. Building on this, this study examines the impact of BDCPZ establishment on GTFP, thereby providing micro-level evidence for understanding how data element institutional environments promote green development.

2.2. Theoretical Analysis

2.2.1. The Impact of Data Elements on GTFP

The impact of data elements on GTFP is generally expected to be positive. Theoretically, the economic attributes of data elements differ from those of traditional production factors. These distinctive attributes provide a foundation for understanding how to enhance GTFP under environmental constraints.
First, data elements can reduce information frictions. The non-rivalry of data means that the same dataset can be collected, shared, and reused across multiple production and management scenarios. Firms can access information in a more timely and accurate manner. BDCPZ improves data infrastructure, enabling firms to more easily reduce information asymmetry and enhance management efficiency.
Second, data elements can enhance GTFP by optimizing resource allocation. Data elements improve the transparency of production, market, and risk information. This helps firms allocate input factors such as capital, labor, and energy more effectively, reducing resource misallocation and driving a shift from high-carbon, energy-intensive production modes toward cleaner and more efficient production arrangements.
Third, data elements guide the direction of green technological development. The near-zero marginal replication costs and network effects of data enable related information to diffuse more rapidly within and across firms. This helps firms assess green markets and accelerates the diffusion of environmentally friendly production practices. Consequently, data elements direct innovation activities toward greener technological pathways. Green technological innovation and renewable energy use help suppress carbon emissions and improve environmental performance [31].
Finally, data elements can also enhance GTFP by improving firm decision-making and governance efficiency. More abundant data supply and stronger data connectivity enable firms to make management decisions more precisely. Meanwhile, data-enabled risk identification and information acquisition also help strengthen internal governance and external financing support, thereby improving the implementation efficiency of green transformation.
Building on this theoretical foundation, this study proposes the following hypothesis:
Hypothesis 1.
Data elements significantly enhance GTFP.

2.2.2. Impact Mechanisms of Data Elements on GTFP

BDCPZs improve the environment for data circulation, sharing, and utilization, reduce information frictions, and enhance the efficiency of resource allocation and governance efficiency. Consequently, the positive effects of data elements on GTFP can be further translated into observable firm-level adjustment behaviors at the firm level. Theoretically, data elements may affect GTFP through multiple channels.
First, the R&D investment channel. BDCPZs strengthen the direct effect of data in guiding the direction of green technology. Environmental carrying capacity analysis, pollutant emission forecasting, and environmental regulation assessment reinforce firms’ demand for green technologies. This, in turn, guides firms to increase the proportion of green R&D investment and reducing information search costs and trial-and-error costs, thereby raising firms’ R&D investment. Technologies such as digital twins and simulation design can also shorten R&D cycles and reduce material consumption, further enhancing firms’ willingness to expand R&D investment. According to endogenous growth theory, sustained productivity improvement depends on continuous innovation and knowledge accumulation [32]. The replicability and increasing returns to scale of data elements enable firms to accelerate technological progress through information acquisition and learning effects. Adequate R&D investment can develop production processes that reduce resource dependence and pollution emissions. This data-driven green technological progress ultimately enhances GTFP significantly.
Second, the human capital channel. Whether the promotional effect of data elements on GTFP can be truly realized largely depends on whether firms possess the capacity to absorb, process, and utilize data. Upgrading human capital quality can reduce information frictions, improve firms’ information processing capabilities, and strengthen internal organizational capabilities. The establishment of BDCPZs attracts high-quality talent, bringing advanced production knowledge and experience, thereby optimizing firms’ human capital structures [33]. As high-pollution and repetitive positions are phased out, substantial cross-disciplinary talent demand emerges in fields such as data analytics, industrial management, and environmental management. The skills required of the workforce undergo substantial transformation. Firms’ human capital structures gradually shift from quantity-oriented to quality- and efficiency-oriented configurations [34]. Human capital quality is an important determinant of GTFP. High-quality human capital helps firms identify inefficient segments in production processes, reducing resource misallocation caused by insufficient information and judgment biases. Improvements in human capital quality also transform dispersed information into actionable decisions, supporting firms in forming more timely and precise management decisions. Thus, data elements promote GTFP improvement by enhancing firms’ human capital quality.
Third, the industrial upgrading channel. The optimization effects brought by data elements are not limited to individual firms but also drive broader production structure adjustments. Drawing on industrial agglomeration theory, big data technologies can achieve optimal allocation of industrial structure and energy structure [35]. At the macro level, BDCPZs guide the deep integration of data elements with traditional industries, promoting industrial upgrading [36] and reducing the inefficient use of scarce resources. At the micro level, big data provides a basis for differentiated environmental regulation, accelerating the exit of environmentally non-compliant firms. Surviving firms increase their use of green technologies to expand market share and improve efficiency. By enhancing synergies between firms and across industries, this industrial upgrading can improve firms’ external innovation environment, strengthening knowledge spillovers. Industrial structure upgrading drives the flow of production factors toward high-efficiency, low-pollution industries, improving firms’ resource endowments and factor allocation while reducing pollution emissions [37]. Therefore, industrial upgrading provides a structural pathway through which data-oriented institutional reforms promote GTFP improvement.
Based on the above analysis, this study proposes the following hypothesis:
Hypothesis 2.
Data elements positively influence GTFP through enhancing R&D investment, improving human capital quality, and facilitating industrial upgrading.

3. Research Method

3.1. Sample Selection and Data Collection

Based on data availability and consistency of statistical caliber, this study selects manufacturing firms listed on the Shanghai and Shenzhen A-share markets from 2012 to 2023 as the research sample. The sample period is determined based on two main considerations. First, since early 2010, China’s data infrastructure construction has continuously advanced and digital economy-related policies have been intensively introduced, providing a more complete institutional environment for the utilization of data elements among firms. Second, limiting the sample period to 2023 helps ensure a sufficiently adequate observation window before and after policy implementation to assess the dynamic changes in policy effects, while also maintaining data source consistency to a large extent.
The initial sample includes all manufacturing firms listed on the Shanghai and Shenzhen stock exchanges during the sample period. To ensure the reliability of the empirical results, this study conducts the following screening procedures. First, firms designated as special treatment (ST) and delisting risk warning (*ST) are excluded. In China’s capital market, ST refers to listed companies that receive special treatment from stock exchanges due to abnormal financial or operational conditions, while *ST further identifies companies with delisting risks based on this classification. These firms typically face severe financial problems such as consecutive losses and abnormal audit opinions. Their operational behaviors and financial data may be distorted by shell-preservation motives, making it difficult to reflect normal production and operational conditions. Including them in the research sample would interfere with empirical results and they are therefore excluded. Second, firms that were suspended or delisted during the sample period are removed. Finally, observations with substantial missing values in key financial or fundamental variables are excluded.
The data used in this study are sourced from multiple channels. Firm-level financial characteristics and corporate governance data are primarily obtained from the China Stock Market & Accounting Research (CSMAR) database. Information related to data elements is primarily compiled from listed companies’ annual reports, corporate social responsibility reports, and supplementary data materials. City- and regional-level variables required for calculating GTFP are primarily sourced from the China City Statistical Yearbook, China Regional Economic Statistical Yearbook, and China Environmental Statistical Yearbook. To mitigate the impact of extreme values on estimation results, this study winsorizes all continuous variables at the 1% level. After completing data matching and cleaning, a balanced panel dataset of 685 listed manufacturing firms is ultimately obtained, comprising 8232 firm-year observations.

3.2. Variable Definitions

3.2.1. Independent Variable

The core explanatory variable is the DID-based policy shock indicator. This study treats the establishment of BDCPZs as a quasi-natural experiment. Since 2014, China has continuously advanced big data infrastructure construction and digital economy development, with policy focus gradually expanding from digital technology applications to data resource governance and factor-based allocation. In 2015, the State Council issued the Action Plan for Promoting Big Data Development, proposing to promote big data development and institutional innovation through regional pilots. Building on this, the National Development and Reform Commission, the Ministry of Industry and Information Technology, and other departments successively approved the establishment of two batches of BDCPZs in 2016. Unlike single technology support policies, BDCPZs represent a comprehensive institutional arrangement covering multiple aspects including digital infrastructure construction, data sharing and governance, talent agglomeration, and industrial synergistic development, aimed at optimizing the regional data element allocation environment. This policy contributes to improving firms’ efficiency in utilizing data resources while also providing an appropriate policy context for examining the impact of data element environment changes on GTFP. The selection of BDCPZ pilots is primarily based on macro-level conditions such as regional informatization and digital economy development levels, as well as local governments’ institutional innovation capabilities. The selection of pilot regions is not directly determined by individual firms’ micro-level decisions. Consequently, policy can be regarded as an exogenous shock to a certain extent. This correspondingly mitigates the policy endogeneity problem, enhancing the validity of treating BDCPZ establishment as a quasi-natural experiment.
Specifically, Guizhou Province was approved as the first BDCPZ in February 2016. The second batch of pilot zones was announced in October 2016, covering the Beijing-Tianjin-Hebei region, the Pearl River Delta region, Shanghai, Henan Province, Chongqing, Shenyang, and Inner Mongolia Autonomous Region. Based on the above two batches of pilot lists, cities at the prefecture level and above within the pilot zone coverage are designated as the treatment group, totaling 63 pilot cities. Following the DID research framework, the core explanatory variable is defined as the interaction term between the regional grouping variable ( T r e a t i ) and the time dummy variable ( P o s t t ): D I D i t = T r e a t i × P o s t t . If a firm’s city belongs to the pilot cities, T r e a t i takes the value of 1; otherwise, it equals 0. This study uniformly designates 2016 as the starting year of the policy shock, meaning P o s t t equals 1 in 2016 and thereafter, and 0 before that. Although the second batch of pilot zones was officially approved in October 2016, the formulation, application, and preliminary preparation work for related policies had already been initiated since early 2016. Local governments had already begun advancing data infrastructure construction and related institutional deployment under policy expectations. The actual starting point of policy effects preceded the official approval date. The D I D i t interaction term captures the average differential change in firm outcome variables induced by BDCPZs after policy implementation.

3.2.2. Dependent Variable

The dependent variable is Enterprise Green Total Factor Productivity (GTFP). This study employs the super-efficiency SBM model with undesirable outputs combined with the Malmquist index for measurement. The base period GTFP is normalized to 1. The ML indices for each year are cumulatively multiplied to obtain firms’ annual GTFP. Meanwhile, to further explore the sources of GTFP, this study decomposes the ML index into two dimensions: TC and EC. The selection of input-output indicators follows existing literature. The specific settings are as follows. Input indicators include three factors: labor, capital, and energy. Labor input is measured by the number of employees. Capital input is measured by the net value of fixed assets. Energy input is measured as the total consumption of coal, fuel oil, and natural gas converted to standard coal equivalents. Output indicators are divided into desirable outputs and undesirable outputs. Desirable output is measured by total operating revenue. Undesirable outputs include emissions of sulfur dioxide, nitrogen oxides, and soot from industrial waste gas, chemical oxygen demand and ammonia nitrogen emissions from industrial wastewater, as well as total carbon emissions.
According to the Greenhouse Gas Protocol, corporate carbon emissions can be categorized into Scope 1, Scope 2, and Scope 3. Among these, Scope 1 represents direct emissions from sources owned or controlled by the firm. Scope 2 represents indirect emissions from purchased electricity and heat, while Scope 3 includes other indirect emissions from supply chains, transportation, product use, and other sources. Currently, most Chinese listed companies do not systematically disclose Scope 3 emissions. Data availability is severely limited. Estimating these emissions would introduce substantial measurement error. Therefore, this study’s carbon emission calculation is primarily based on Scope 1 and Scope 2. Generally, the “total carbon emissions” disclosed by firms primarily correspond to the sum of Scope 1 and Scope 2. In the specific calculation, this study follows the approach of Wang et al. [38], categorizing the sample into two types based on firms’ carbon information disclosure. For firms that directly disclose annual direct carbon emissions, indirect carbon emissions, or total carbon emissions, this study directly uses the disclosed data and standardizes measurement units. For firms that do not directly disclose total carbon emissions but disclose fossil fuel consumption, electricity consumption, and heat consumption, emissions are calculated in accordance with the Guidelines for Accounting and Reporting Corporate Greenhouse Gas Emissions issued by the National Development and Reform Commission for each industry, calculating Scope 1 and Scope 2 emissions separately and summing them to obtain total carbon emissions.
It should be noted that this study excludes Scope 3 emissions, which may not fully capture supply chain-related indirect carbon emissions of manufacturing firms. Meanwhile, calculating Scope 1 and Scope 2 based on firm disclosure information may also be affected by differences in disclosure completeness. Therefore, the GTFP measured in this study primarily reflects firms’ green productivity levels under current disclosure conditions, and the related results should be interpreted with caution given data disclosure constraints.

3.2.3. Control Variables

Following the existing literature, this study includes a set of control variables that are closely related to GTFP. The impact of data elements on GTFP depends on both firm-specific factors and external factors. Firm-level control variables include: (1) Return on assets (ROA): measured as the ratio of net profit to total assets, used to control for firm profitability. (2) Cash flow from operations (CFO): net cash flow generated from operating activities, used to control for financial condition and internal financing capacity. (3) State ownership (SOE): a dummy variable equal to 1 if the firm is state-owned and 0 otherwise, used to control for differences in government support and institutional environment. (4) Firm age (AGE): measured as the number of years since the firm’s establishment, used to control for differences in life cycle and operational experience. In addition, to control for external influences from the regions where firms are located, this study incorporates city-level control variables, including: (1) Population density (PEO): the ratio of registered population to administrative land area, reflecting urban agglomeration effects. (2) Financial development level (FIN): the ratio of year-end deposits and loans of financial institutions to regional GDP, capturing the availability of regional financial resources. (3) Fiscal capital investment intensity (FCI): the ratio of fixed asset investment to general government fiscal expenditure, measuring the intensity of regional capital formation. (4) Healthcare service level (MED): the number of hospital and health center beds per 100 people, reflecting the level of public health service provision.

3.3. Econometric Model

In this study, the establishment of BDCPZs is regarded as a quasi-natural experiment. Firms in pilot cities are classified as the treatment group, while those in non-pilot cities serve as the control group. Although the intensity of implementation varies across regions, the 2016 BDCPZ policy represents a significant institutional reform in data governance. To examine the impact of data governance reforms on GTFP, this study employs a two-way fixed effects DID model to estimate the average treatment effect on treated firms. The baseline econometric model is specified as follows:
GTFPit = α0 + α1DIDit + α2Controlsit + μi + λt + εit
where G T F P i t denotes the GTFP of enterprise i in year t ; D I D i t is the core explanatory variable, defined as the interaction between the treatment group indicator and the post-policy time dummy, capturing the policy effect of BDCPZs; C o n t r o l s i t represents a set of control variables that may affect GTFP; μ i and λ t denote firm fixed effects and year fixed effects, respectively; and ε i t is the error term. The coefficient of interest is α 1 . A significantly positive α 1 indicates that the establishment of BDCPZs is associated with improved GTFP after policy implementation. The fundamental premise of the DID approach is the parallel trends assumption. This assumption requires that in the absence of policy intervention, the GTFP of the treatment and control groups should follow similar trends. To verify this assumption, following Beck et al. [39], this study employs an event-study specification to examine the dynamic effects of the policy and test the parallel trends hypothesis. The model is specified as follows:
G T F P i t = β 0 + k = 1 3 γ k B e f o r e k t + β 1 C u r r e n t i t + k = 1 8 γ k A f t e r k t + β 2 C o n t r o l s i t +   μ i + λ t + ε i t
where B e f o r e k t and A f t e r k t are dummy variables indicating the k-the year before and the year after the implementation of the BDCPZ, respectively, with the year immediately preceding the policy serving as the baseline period. C u r r e n t i t denotes the policy implementation year. The remaining variables have the same definitions as in Equation (1).
The coefficients estimated from the event study model capture the dynamic impact of the policy over time. If the coefficients for the pre-policy periods are not significant, this indicates that there are no systematic differences in GTFP trends between the treatment and control groups prior to policy intervention. The post-policy coefficients reflect the dynamic effects of data element development induced by BDCPZs on GTFP.

3.4. Descriptive Statistics of Variable

Table 1 reports the descriptive statistics of the main variables in this study. Overall, GTFP exhibits a mean of 1.386, a standard deviation of 1.747, with values ranging from 0.072 to 72.630, indicating substantial heterogeneity in green development levels among sample firms. This variation reflects differences in firms’ resource endowments, pollution control capabilities, levels of digitalization, and green management practices. It also suggests uneven progress in the green transformation across firms. Decomposing GTFP into EC and TC shows that EC has a higher mean (1.624) than TC (1.149), and exhibits greater volatility. This suggests that improvements in GTFP may be more closely associated with EC during the sample period, with improvements in firms’ green performance potentially reflecting improvements in resource allocation and production efficiency. Regarding the core explanatory variable, DID has a mean of value of 0.257, indicating that approximately 25.7% of the observations correspond to treated firms in the post-policy period. Its minimum is 0 and maximum is 1, confirming that the variable is constructed as a binary policy indicator. Overall, the distributions and dispersion of the main variables fall within reasonable ranges, providing a solid foundation for subsequent empirical tests.

4. Empirical Results

4.1. Parallel Trend Test

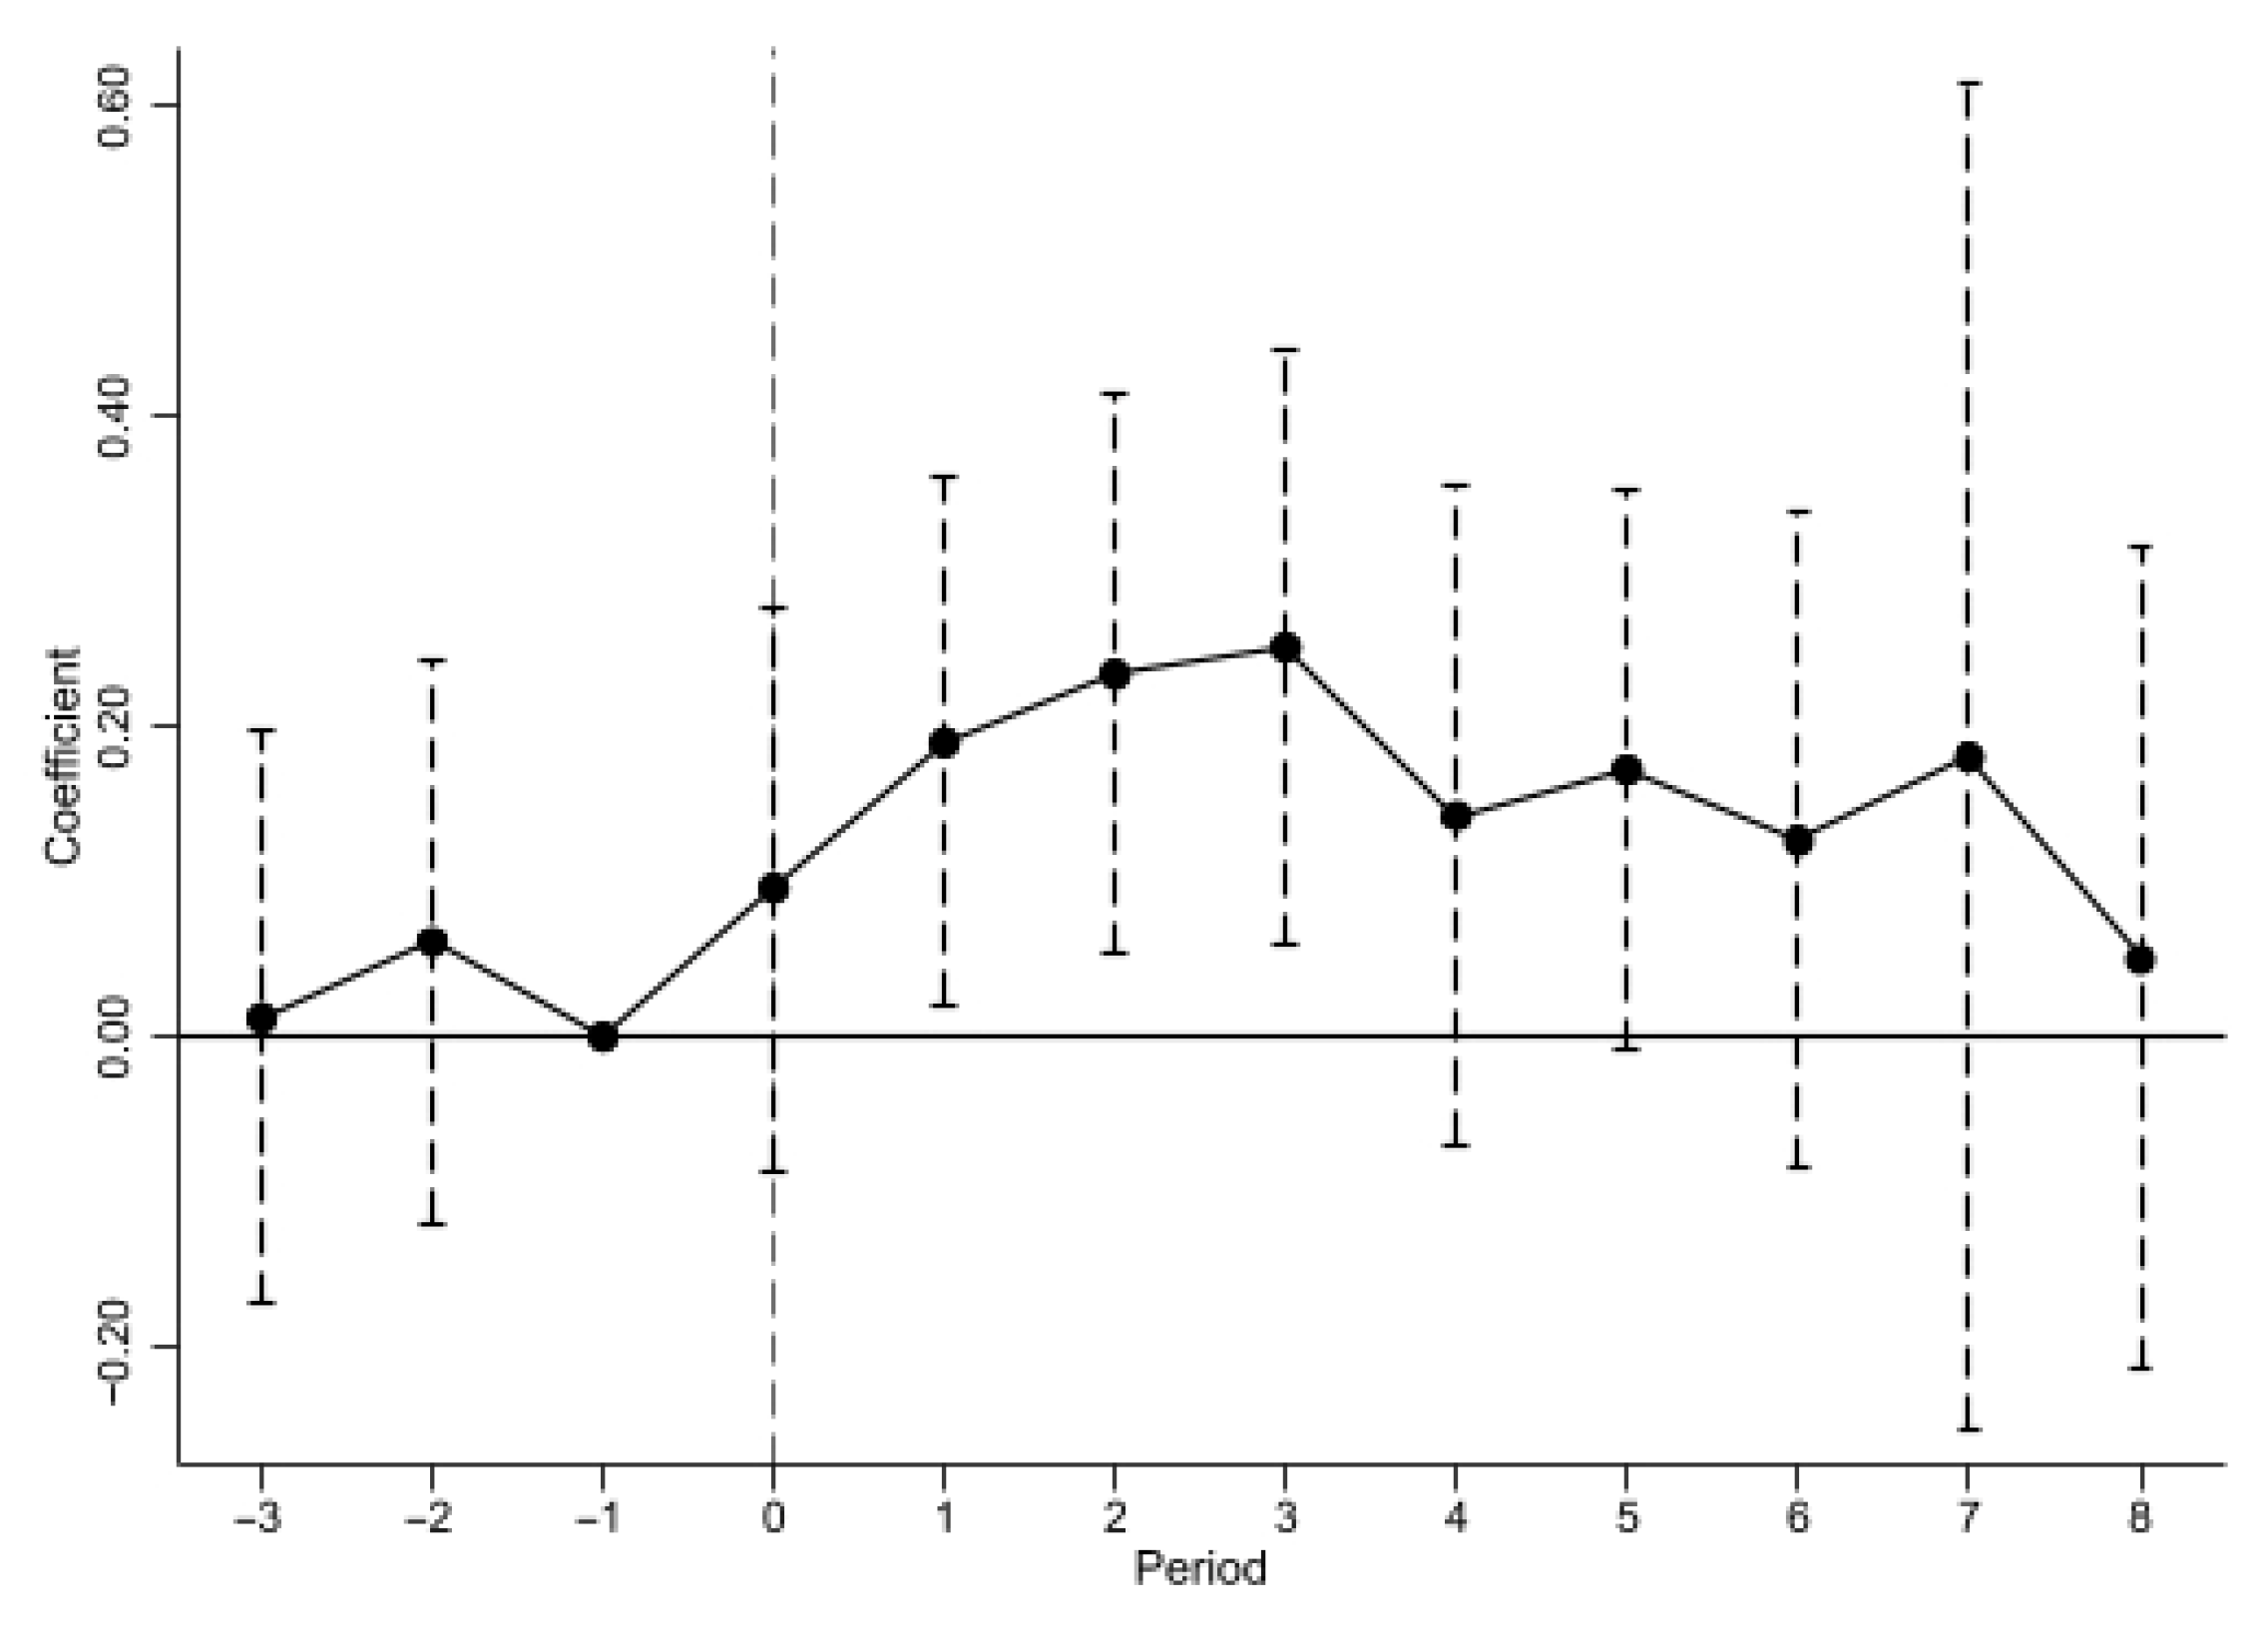
Using period −1 as the reference period, Figure 1 presents the parallel trends test results and the dynamic policy effects of BDCPZ establishment on GTFP. The coefficients for all pre-policy periods are statistically insignificant, indicating that there are no systematic differences in GTFP trends between treatment and control group firms prior to policy implementation. This finding provides supporting evidence for the validity of the parallel trends assumption. In the post-policy period, the coefficients are significantly positive and remain so in subsequent years, indicating that BDCPZ establishment is associated with sustained improvement in GTFP for the treatment group. Meanwhile, the magnitude of the estimated effects varies over time. The attenuation observed in later periods may reflect the influence of subsequent macroeconomic shocks, which prompts us to conduct further robustness checks to exclude the effects during the pandemic period. Overall, the dynamic pattern suggests a persistent but time-varying association between BDCPZs and GTFP, which is consistent with temporal heterogeneity in policy effects.

4.2. Baseline Regression Results

This study conducts a Hausman test, and the results support the use of fixed effects models in the empirical analysis. Based on the two-way fixed effects DID framework, Table 2 reports the baseline regression results examining the impact of data elements on GTFP. As shown in column (1) of Table 2, the DID coefficient is significantly positive at the 5% level, indicating that BDCPZ establishment has a positive effect on GTFP, which is consistent with the view that institution-driven data element development enhances GTFP. This finding is consistent with Hypothesis 1.
Furthermore, to explore the potential sources of policy effects, this study decomposes GTFP into EC and TC. The regression results in columns (2) and (3) show that the estimated coefficient for TC is statistically insignificant, indicating that BDCPZ establishment did not induce a statistically detectable shift in firms’ technological frontier during the sample period. In contrast, the coefficient for EC is positive and statistically significant at the 10% level, indicating that the observed GTFP improvement is primarily driven by efficiency gains within existing technology and resource allocation structures. Overall, the evidence suggests that BDCPZ policy enhances GTFP primarily through efficiency improvements rather than substantive technological breakthroughs.

4.3. PSM-DID Results

To address endogeneity issues arising from selection bias due to the non-random establishment of BDCPZs, this study employs the propensity score matching difference-in-differences (PSM-DID) method. By constructing a counterfactual sample comparable to treatment group units, PSM-DID helps mitigate observable heterogeneity between treatment and control groups, thereby enhancing the credibility of causal identification.
Specifically, a Logit model is used to estimate propensity scores based on the control variables based on pre-treatment characteristics. Subsequently, kernel matching using the Epanechnikov kernel function is applied, where weights are assigned to control observations based on the distance in propensity scores. A common support condition is imposed during the matching process to ensure sufficient overlap in the propensity score distributions of treatment and control groups. After completing the matching procedure, the DID model specified in Equation (1) is re-estimated using the weighted sample. The estimation results are presented in column (1) of Table 3. Although the number of observations after matching is reduced, the coefficient of the DID estimator remains significantly positive, indicating that BDCPZs have a robust positive effect on GTFP. Overall, the PSM-DID results are consistent with the baseline regression results, confirming the reliability and robustness of the main findings. Post-matching balance diagnostics show that covariate balance between treatment group firms and their matched controls is significantly improved.

4.4. Robustness Test

4.4.1. Placebo Test Results

To further verify the robustness of the baseline regression results and rule out the possibility that the estimated policy effects are driven by unobservable random shocks, this study conducts a placebo test by constructing randomly generated pseudo-treatment groups. The pseudo-treatment groups are designed to be completely independent of the actual treatment group assignment, containing fictitious policy implementation samples and spurious intervention structures. If the placebo estimation results are similar to the baseline results, this would imply that the identified policy effects may be spurious rather than attributable to BDCPZ policy.
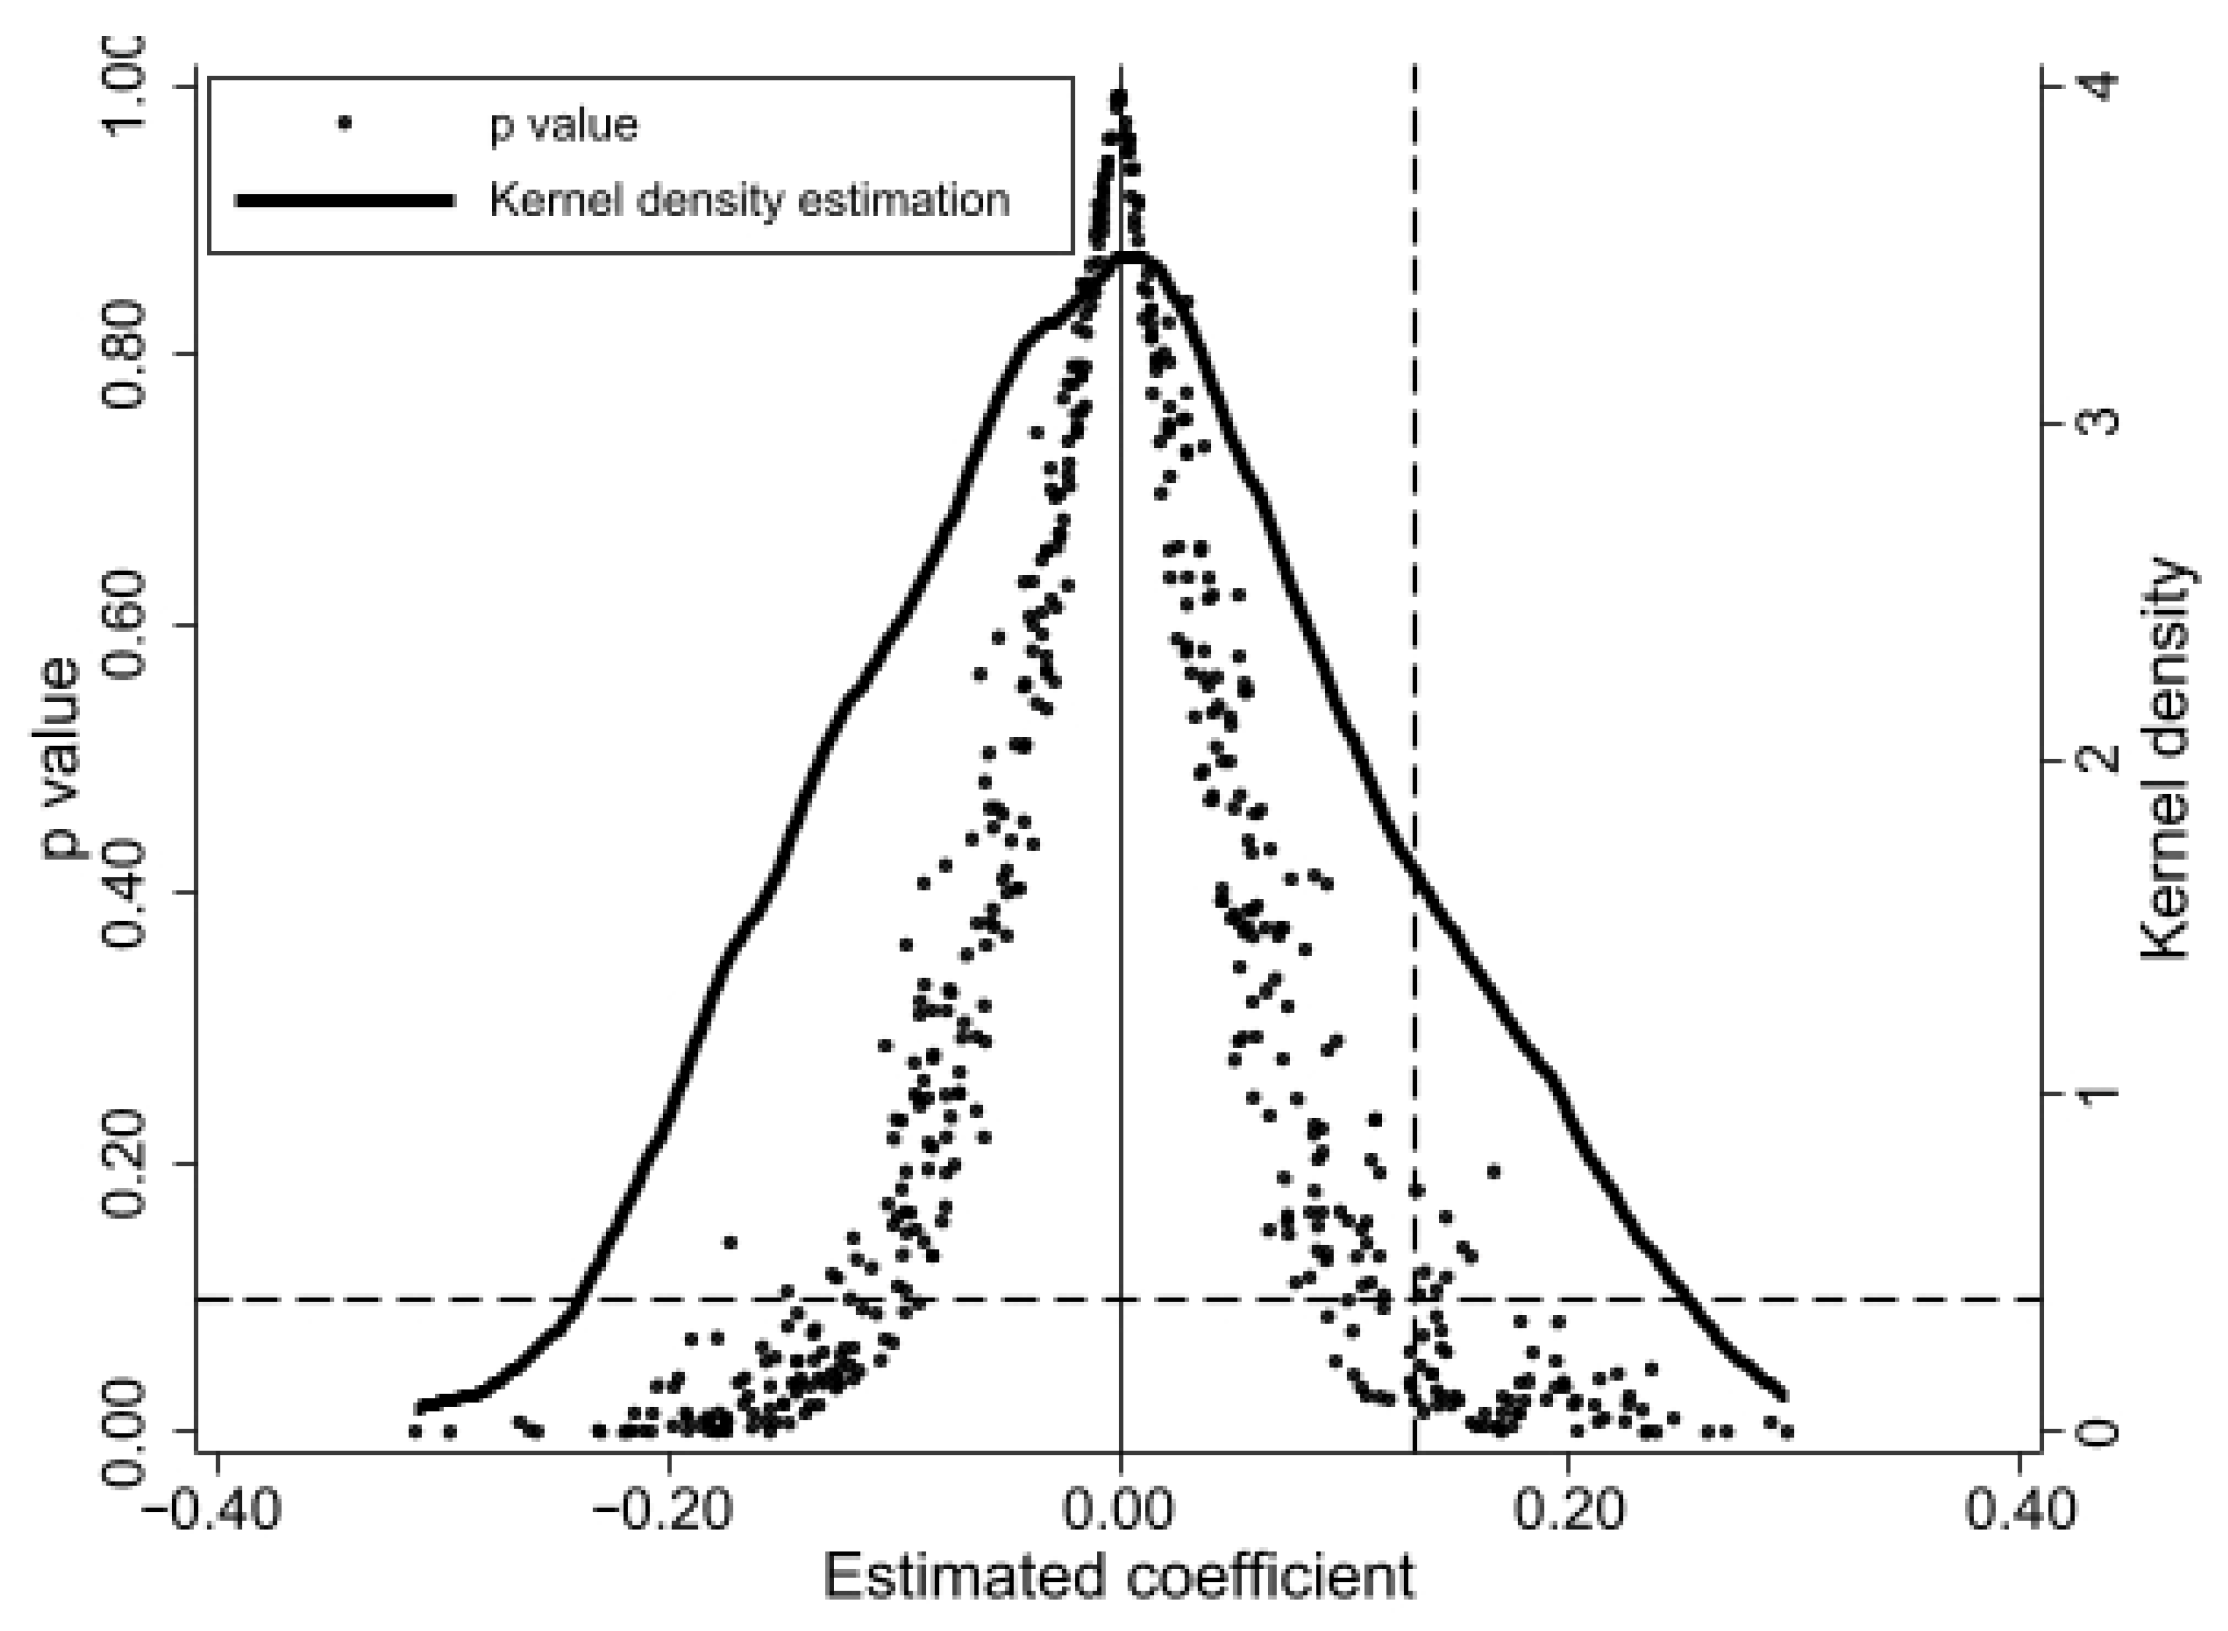
Specifically, following a randomization inference-based placebo design, treatment status is randomly assigned at the provincial level in each iteration, selecting ten provinces to approximate the empirical treatment group proportion [40]. Based on this random assignment, fictitious policy intervention variables are generated, and the estimation procedure is repeated 500 times using the baseline specification. As shown in Figure 2, the kernel density curve of placebo coefficient estimates exhibits a sharp symmetric distribution centered around zero, indicating that the estimated coefficients generated under random assignment are primarily concentrated near the zero effect. Furthermore, the p-values corresponding to the vast majority of scatter points exceed 0.10, indicating that most placebo estimates fail to reach conventional significance levels. These results suggest that the policy effects identified in the baseline regression are unlikely to be driven by random shocks or unobservable confounding factors. Overall, the placebo test provides further evidence that BDCPZs significantly enhance GTFP and that this result is robust.

4.4.2. Replacement of the Dependent Variable

To ensure the reliability of the baseline regression results, this study adopts the alternative measurement approach of Zhang et al. [41], which employs the entropy weight method to weight undesirable output indicators in the GTFP system. Subsequently, the dependent variable is recalculated using the EBM-GML model. The estimation results are presented in column (2) of Table 3. After adopting the alternative GTFP measurement, the coefficient for data elements maintains a significantly positive effect on GTFP. This finding confirms the robustness of the baseline conclusions, indicating that the positive relationship between data elements and GTFP is not sensitive to alternative measurement specifications.

4.4.3. Excluding the Influence of Concurrent Policy Interventions

A potential concern regarding the baseline estimation is that concurrent policy interventions implemented during the sample period may confound the estimated effects of BDCPZ policy on GTFP, thereby introducing bias into the regression results. For example, to advance information infrastructure construction, China’s National Development and Reform Commission formulated the Broadband China strategy in three batches during 2014–2016. This initiative aims to improve broadband coverage and connection speeds but has potential overlap with BDCPZ policy in terms of digital infrastructure construction, potentially exerting indirect effects on GTFP. To address this issue, this study incorporates a dummy variable capturing “Broadband China” pilot cities into the baseline specification of Equation (1) and re-estimates the model. As shown in column (3) of Table 3, the coefficient for data elements is significantly positive at the 1% level. These findings indicate that the concurrent implementation of the Broadband China initiative does not substantively alter the impact of BDCPZ policy on GTFP.

4.4.4. Excluding the Impact of the COVID-19 Pandemic

The COVID-19 pandemic broke out in early 2020. This unprecedented exogenous shock severely disrupted firms’ normal operations and production activities, which may introduce confounding effects into the baseline estimation. To mitigate the potential impact of this exceptional period on policy evaluation, this study excludes sample observations from pandemic-affected years (2020–2021) and re-conducts the regression analysis. As shown in column (4) of Table 3, after excluding pandemic-affected observations, the coefficient estimate for the core explanatory variable remains unchanged in both magnitude and statistical significance. These results validate the effectiveness of BDCPZ policy in enhancing GTFP and promoting sustainable development capacity, enhancing the credibility of the main empirical results.

4.5. Heterogeneity Testing

4.5.1. Heterogeneity Analysis Based on Pollution Intensity

Although all firms are incorporated into the development wave of the digital economy, heavy-polluting firms have historically been key targets of public and government regulatory scrutiny and are the primary sources of environmental pollution emissions. Following the Guidelines for Industry Classification of Listed Companies (2012) (GICLC), this study categorizes sample firms into heavy-pollution firms and non-heavy-pollution firms and conducts separate tests. The regression results are shown in columns (1) and (2) of Table 4. Data element has a significantly positive promoting effect on GTFP for non-heavy-pollution firms, while the impact coefficient for heavy-pollution firms is not significant, indicating that BDCPZ have a stronger impetus for green transformation of firms in light-polluting or non-polluting industries.

4.5.2. Heterogeneity Analysis Based on Industry Characteristics

Firms’ industry attributes determine their technological endowments, data processing capabilities, and capacity to absorb policy dividends. Therefore, it is necessary to analyze whether the impact of data elements on GTFP differs across different technology levels. This study divides the sample into high-tech firms and non-high-tech firms according to the GICLC (2012). The results are shown in columns (3) and (4) of Table 4. The data element coefficient is significantly positive for high-tech firms, while the coefficient is not significant for non-high-tech firms, indicating that the positive impact of BDCPZ policy on GTFP is greater for high-tech firms.

4.5.3. Heterogeneity Analysis Based on Market Competition Intensity

The market competition environment may exert heterogeneous effects on firms’ production decisions and performance. Based on this, this study employs the Herfindahl-Hirschman Index (HHI) calculated from firms’ main business revenue as a measure of market competition intensity, calculates the time-series mean for the sample and computes the median of the HHI, classifies observations with means above the median as the high market competition intensity group and those below as the low market competition intensity group, to analyze whether the impact of data elements on GTFP differs across different market environments. The results are shown in columns (5) and (6) of Table 4. Data elements have a significantly positive effect on GTFP in low-competition environments, whereas the effect is insignificant in high-competition environments. This pattern may reflect differences in firms’ incentives and resource constraints under varying levels of market competition.

4.6. Mechanism Analysis

Based on the theoretical framework, the impact of data elements on GTFP may operate through three potential transmission channels: increased R&D investment, improved human capital, and industrial structure upgrading. To empirically examine whether these mechanisms underpin the observed policy effects, this study employs a mediation model framework to analyze how improvements in the data institutional environment driven by BDCPZs affect GTFP. The model is specified as follows:
M i t = δ 0 + δ 1 D I D i t + δ 2 C o n t r o l s i t + μ i + λ t + ε i t
G T F P i t = ρ 0 + ρ 1 D I D i t + ρ 2 M i t + ρ 3 C o n t r o l s i t + μ i + λ t + ε i t
where M i t captures the intermediate mechanisms, consisting of R&D investment intensity ( I N V ), human capital level ( H U M ), and industrial structure upgrading ( I S ). All other variables retain their definitions from Equation (1).

4.6.1. Mechanism Test for R&D Investment

This study employs experimental R&D expenditure as a proxy for firm-level R&D investment intensity, measured by the sum of capitalized development costs and intangible assets, with higher values indicating greater commitment to technological advancement and innovation activities. As shown in Column (1) of Table 5, the coefficient estimate of DID on INV is positive and significant at the 1% level, indicating that BDCPZ significantly stimulates increases in firm R&D investment. As shown in Column (2) of Table 5, INV exhibits a significantly positive effect on GTFP at the 1% level. Firms pursuing technological frontiers and green innovation tend to intensify R&D investment, which may facilitate product innovation and market expansion, thereby contributing to improvements in GTFP through technological progress [42]. Therefore, the data-oriented institutional reform represented by BDCPZ is associated with increased firm R&D investment, which is, in turn, linked to GTFP improvement.

4.6.2. Mechanism Test for Human Capital

This study measures firm-level human capital quality by the number of employees holding bachelor’s degrees or above. Higher values of this indicator reflect greater concentration of highly skilled and multidisciplinary talent within the firm. As shown in Column (3) of Table 5, the coefficient estimate of DID on HUM is positive and significant at the 1% level, indicating that BDCPZ significantly enhances human capital quality in pilot-region firms. As shown in Column (4) of Table 5, when HUM and the policy variable are simultaneously included in the equation, HUM is significantly and positively associated with GTFP. Existing research suggests that such policies not only enhance the attractiveness to high-quality talent but also improve talent retention through better development environments and organizational support, thereby providing stable human capital support for corporate green transformation and sustained innovation. Therefore, BDCPZ provides suggestive evidence of improving GTFP by enhancing firm-level human capital quality, which strengthens firm’s capacity to absorb and apply digital technologies.

4.6.3. Mechanism Test for Industrial Structure Upgrading

This study measures industrial structure upgrading using an industrial structure advancement index, specifically calculated as the ratio of tertiary industry output to secondary industry output. Higher values indicate that the regional economic structure is shifting from labor-intensive and capital-intensive sectors toward knowledge-intensive, technology-intensive, and data-intensive sectors. As shown in Column (5) of Table 5, the DID coefficient is positive and significant at the 1% level, indicating that the establishment of BDCPZ is associated with a higher degree of industrial structure upgrading in pilot regions. As shown in Column (6) of Table 5, when IS and the policy variable are simultaneously included in the equation, industrial structure upgrading is significantly and positively associated with GTFP. The institutional environment fostered by BDCPZ facilitates the modernization of regional industrial ecosystems, promoting the reallocation of productive resources toward environmentally sustainable and efficiency-oriented sectors [43]. This structural adjustment may provide a favorable macroeconomic foundation for sustained GTFP improvement.
In summary, the results provide suggestive evidence consistent with Hypothesis 2, indicating that BDCPZ is associated with higher R&D investment, stronger human capital accumulation, and industrial upgrading. These channels enable data-oriented institutional reforms to translate into GTFP enhancement.

5. Further Analysis: The Moderating Role of Corporate Governance

The preceding results suggest that improvements in the data institutional environment associated with the BDCPZ policy are linked to GTFP enhancement. However, whether policy shocks can be effectively translated into productivity gains also depends on firms’ internal governance conditions. Existing research focuses more on the availability of data elements and external policy support, with relatively limited attention to the role of corporate governance in the policy transmission process. In fact, corporate governance affects both resource allocation efficiency and firms’ capacity to process, integrate, and apply digital information. From the governance capability perspective, management efficiency reflects firms’ organizational absorption and resource allocation capacity for data elements, thereby capturing firms’ ability to translate external data institutional environment improvements into actual operational performance; from the governance incentive perspective, managerial equity ownership reflects the degree of alignment between management and firms’ long-term interests, which may shape managers’ incentives to promote digital application and green transformation. Therefore, this study introduces two moderating variables—management efficiency (ME) and managerial equity ownership (MS)—to examine how corporate governance influences the relationship between BDCPZ and GTFP. Based on this, the following moderating effect model is specified:
G T F P i t = ω 0 + ω 1 D I D i t + ω 2 M E i t + ω 3 D I D i t × M E i t + ω 4 C o n t r o l s i t + μ i + λ t + ε i t
G T F P i t = θ 0 + θ 1 D I D i t + θ 2 M S i t + θ 3 D I D i t × M S i t + θ 4 C o n t r o l s i t + μ i + λ t + ε i t
where M E i t represents management efficiency, following Yang et al. (2015) [44], it is measured as the ratio of the sum of administrative expenses and selling expenses to total operating revenue. This variable is defined as a reverse indicator: higher values indicate higher management and selling expenses per unit of operating revenue, reflecting lower management efficiency; conversely, lower values indicate more effective organizational operations and expense control, reflecting higher management efficiency. M S i t represents managerial equity ownership, with higher values indicating stronger equity incentives for management; all other variables are as defined as in Equation (1).
The results in Column (1) of Table 6 show that the coefficient of the interaction term ( D I D × M E ) is significantly negative at the 10% level. Given that ME is a reverse indicator, a decrease in ME implies an improvement in management efficiency, which strengthens the positive effect of BDCPZ on GTFP. In other words, management efficiency plays a positive moderating role in the relationship between BDCPZ and GTFP—higher management efficiency provides favorable conditions for the value realization of data elements. Column (2) of Table 6 shows that the coefficient of the interaction term ( D I D × M S ) is significantly positive at the 1% level, indicating that in firms with higher managerial equity ownership, the positive association between BDCPZ and GTFP is more pronounced. This suggests that sound governance incentive arrangements help strengthen firms’ motivation and capacity to leverage improvements in the data institutional environment to advance green transformation.

6. Discussion

6.1. Discussion on the Effect of Data Elements on GTFP

This study’s results indicate that improvements in the data institutional environment represented by BDCPZ enhance GTFP, but this appears to be primarily driven by gains in EC rather than increases in TC. From the perspective of the operational mechanism of data elements, they can reduce information asymmetry, optimize production decision precision, and strengthen resource allocation efficiency. This suggests that improvements in the data institutional environment primarily alter how firms organize and utilize existing technologies, information, and resources, helping firms that have not yet reached the production frontier move closer to best practices. Specifically, this is reflected in: achieving refined energy consumption management through real-time data monitoring, reducing raw material waste through supply chain platforms, and reducing pollutant emission intensity through production process digitalization. These improvements all constitute efficiency enhancements under existing technological conditions rather than directly leading to technological innovation in the short term. The technological breakthroughs corresponding to TC typically depend on high-risk, long-cycle R&D investments, which are difficult for data elements to directly stimulate in the short term. This finding is broadly consistent with the international literature regarding digitalization impact pathways: digitalization improvements primarily concentrate on organizational capabilities and operational efficiency rather than fundamental expansions of the technological frontier [45,46]. BDCPZ’s promotion of data infrastructure construction tends to promote firms’ efficiency improvements rather than directly driving high-intensity green R&D. Therefore, efficiency enhancement preceding technological frontier breakthroughs represents a realistic starting point for data elements empowering green transformation and aligns with expectations regarding short-term policy effects.
From the perspective of dynamic effects, the decline in statistical significance after Period 4 in the parallel trends test does not necessarily imply the disappearance of policy effects, but may instead reflect relative effect convergence under the joint influence of multiple factors. First, external shocks. The weakening of statistical significance highly coincides with the timing of the COVID-19 pandemic outbreak in 2020, and pandemic-induced supply chain disruptions increased firm-level uncertainty [47]. Significant declines in firm TFP [48] and DID evidence from German firm-level data similarly documents the persistent inhibitory effects of the pandemic [49]. Second, diminishing marginal policy effects and decelerating learning effects. The institutional novelty of pilot policies in their early stages generates strong incentive effects. However, as policy dividends are gradually absorbed by the market, marginal returns tend to decline [50]; moreover, the accumulation of firms’ digital capabilities follows a phased pattern, characterized by high initial learning costs and subsequent stabilization, and the incremental policy effects consequently slow. Third, spillover effects and potential control group contamination. As BDCPZ’s policy effects diffuse to surrounding regions, the institutional differences between treatment and control groups gradually narrow, and the identifiable differences between treatment and control groups consequently diminish [51]. Additionally, the first-mover advantages of early-benefiting firms are gradually diluted by catch-up effects, and the overall treatment effect also tends toward moderation. Therefore, the later-stage statistical weakening may reflect the combined effects of policy evolution, external environmental disturbances, and spatial rebalancing mechanisms, suggesting that sustaining policy effects may require coordinated advancement of supporting capacity building and institutional deepening.

6.2. Discussion on the Heterogeneity Effect

Heterogeneity analysis reveals that the impact of data elements on GTFP is not uniform but varies with firms’ pollution attributes, technological endowments, and market competition environments.
First, the policy effect is more pronounced in non-heavily polluting firms. Firms with lower regulatory compliance burdens are more likely to integrate data-driven technologies into production processes and more rapidly convert them into green efficiency gains. In contrast, heavily polluting firms often face binding environmental constraints and competing investment demands, and the efficiency gains from improved data institutional environments may be partially offset by transformation costs and adjustment delays [52]. This finding is consistent with the revised version of the Porter Hypothesis: excessively stringent regulatory constraints may inhibit rather than incentivize efficiency-oriented innovation in the short term, particularly when compliance investments have already consumed substantial strategic resources [53].
Second, the positive effect is stronger in high-tech firms. This suggests that the productivity effect of data elements is not purely exogenous but depends on firms’ capacity to absorb digital technologies for realization. This result aligns with the policy orientation of BDCPZ. The policy emphasizes digital infrastructure and technological innovation, generating agglomeration economies and innovation externalities. These synergistic effects amplify the benefits that firms derive from the policy, and high-tech and data-intensive industries can be strengthened through knowledge spillover and collaborative innovation channels [54].
Finally, the effectiveness of data elements is constrained by market competition intensity. Data-driven green technology enhancement typically involves high upfront investment and has long payback periods, and therefore requires sufficient financial buffers and long-term commitment. In markets with lower competition intensity, relatively stable market positions and profit margins enable firms to continuously advance green investments without being disrupted by short-term survival pressures. In highly competitive markets, firms face stronger performance pressures and are more inclined to concentrate resources on immediate competitive responses rather than long-cycle green technology investments. Under conditions of high competition and uncertainty, competitive pressures may generate a crowding-out effect on innovation investment, making it more difficult for firms to sustain green technology innovation [55].
The promotion of GTFP by data elements exhibits clear conditional heterogeneity. Therefore, the policy effect of BDCPZ is better understood as an institutional dividend that is reinforced under specific conditions rather than a universal shock uniformly affecting all firms.

6.3. Discussion on the Moderating Effects of Corporate Governance

This study finds that both higher management efficiency and stronger managerial equity ownership strengthen the positive association between BDCPZ and GTFP. This suggests that improvements in the data institutional environment do not automatically translate into enhanced corporate green performance; the realization process still depends on the coordination and support of internal governance structures.
Management efficiency measures a firm’s capacity to execute organizational decisions and allocate internal resources. The effective utilization of data elements is not automatic but depends on efficient internal organizational structures [56]. Only when firms possess strong capabilities in information integration, process optimization, and decision implementation can data resources be effectively embedded in production and operations processes and translated into green efficiency improvements. This aligns with the logic of the resource-based view: governance quality itself constitutes a complementary strategic resource that influences firms’ capacity to absorb and utilize external policy opportunities [57]. Management efficiency should not be viewed merely as cost control but rather a critical governance capability for firms to internalize external policy shocks into GTFP improvements.
Managerial equity ownership reflects the degree of interest alignment between managers and shareholders and serves as an important governance mechanism for mitigating agency problems. Data-elements-driven GTFP enhancement typically involves upfront systematic investment and strategic deployment, while myopic incentive structures will weaken firms’ willingness to proactively position themselves in digital green transformation. According to the agency cost theory of Jensen and Meckling [58], when managerial equity ownership increases, managers become more aligned with residual claimants, the incentive misalignment between ownership and control is mitigated, thereby reducing myopic decision-making and opportunistic behavior, and managers’ intrinsic motivation to promote green transformation is strengthened accordingly. This incentive facilitates the deep integration of data elements into strategic decision-making and production upgrading, thereby making data-driven GTFP improvements more sustainable.
These findings enrich the understanding of the relationship between data elements and GTFP: the strength of BDCPZ’s effect also depends on firms’ internal governance conditions. Effective governance capabilities and sound incentive mechanisms are important complementary conditions for policy transmission, and may determine to a considerable extent whether firms can effectively capture policy benefits and translate them into actual GTFP improvements.

7. Conclusions and Practical Implications

BDCPZ serves as an institutional vehicle for promoting the circulation, governance, and allocation efficiency of data elements. This study employs BDCPZ as a policy proxy for improvements in the data elements development environment and examines the impact of data elements development on GTFP using a DID approach. The empirical results indicate that data elements are associated with significant improvements in GTFP, and this finding remains robust after robustness checks. Heterogeneity analysis reveals that this positive effect is more pronounced in non-heavily polluting firms, high-tech firms, and firms operating in less competitive markets environment. Mechanism analysis reveals that data elements operate through three channels: increasing R&D investment, enhancing human capital quality, and promoting industrial structure upgrading. Moderating effect analysis shows that higher management efficiency and managerial equity ownership significantly strengthen the positive relationship between BDCPZ and GTFP. This study focuses on Chinese A-share listed manufacturing firms, with the research context grounded in China’s BDCPZ policy framework. Small and medium-sized enterprises (SMEs) often face stronger financing constraints, weaker digital capability foundations, and more limited data management capabilities, which may result in heterogeneous responses to data-oriented institutional arrangements and varying green performance outcomes. Building on this, research on SMEs represents an important topic warranting further investigation and a priority direction for future research.
Based on the above empirical findings, this study proposes policy recommendations at three levels. First, at the data institutional level. This study finds that the establishment of BDCPZ significantly enhances GTFP. To this end, governments should continue to improve the institutional environment for data elements, as exemplified by BDCPZ. Establishing cross-regional and cross-departmental data circulation and sharing mechanisms can strengthen the role of data elements in supporting corporate green transformation. Improving data property rights, privacy protection, and security regulation rules can enhance institutional transparency and predictability, thereby reducing the costs for firms to acquire and utilize data resources. Second, at the firm capability level. Data elements affect GTFP through channels such as increased R&D investment, enhanced human capital, and industrial structure upgrading. Policy design should focus on encouraging firms to continuously increase R&D investment, particularly in R&D activities related to green transformation and digital applications. Strengthening the cultivation of talent with both digital skills and green governance capabilities can enhance firms’ capacity to utilize data elements. Promoting the integration of data governance into production management, energy management, and environmental governance processes can facilitate the more effective transformation of data elements into GTFP enhancement. Policies can also support industrial upgrading by encouraging firms to shift toward data-intensive and green production activities. In light of the moderating effects of corporate governance, policies should also guide firms to improve internal governance mechanisms. By improving management efficiency and optimizing executive incentive arrangements, the implementation effectiveness of data-driven green transformation can be enhanced. Third, at the differentiated support level. Policy design should pay greater attention to inter-firm heterogeneity. Given that BDCPZ has more pronounced effects on non-heavily polluting firms, high-tech firms, and firms operating in less competitive market environments, policies can prioritize promoting the deep integration of data elements and green transformation in these firms to generate stronger demonstration and diffusion effects. For heavily polluting firms, environmental regulation should be combined with green technology upgrade subsidies; for traditional low-tech firms, emphasis should be placed on enhancing their digital absorption capacity; for firms facing high market competition intensity, policies can grant firms greater autonomy in data resource allocation. Meanwhile, policy implementation also needs to balance inclusiveness and sustainability. As data infrastructure construction and data elements development deepen, issues such as rising data center energy consumption, environmental cost transfer along supply chains, and widening digital divides may emerge. Therefore, governments should leverage more refined sustainable energy planning and decision support tools [59] to coordinate resource-environment constraints and distributional effects in data elements policy implementation, thereby improving the effectiveness and precision of policy implementation and ensuring more balanced green transformation opportunities across different types of firms.

Author Contributions

J.F. conceived the study, wrote, reviewed, and edited the manuscript. L.A. drafted the initial manuscript. Y.W. translated the manuscript, and contributed to reviewing and editing. All authors have read and agreed to the published version of the manuscript.

Funding

Basic This research is supported by the Teacher Innovation Project Support Program of Harbin University of Commerce in 2022 (No. 21TJE356); Basic Scientific Research Fund for Provincial Universities in Heilongjiang Province (No. XW0274) and Heilongjiang Provincial Excellent Returnee Scholars Funding Program (No. 18300101).

Institutional Review Board Statement

Not applicable.

Informed Consent Statement

Not applicable.

Data Availability Statement

The data presented in this study are available on request from the corresponding author.

Conflicts of Interest

The authors declare no conflicts of interest.

References

  1. Dabbous, A.; Aoun Barakat, K.; Tarhini, A. Digitalization, crowdfunding, eco-innovation and financial development for sustainability transitions and sustainable competitiveness: Insights from complexity theory. J. Innov. Knowl. 2024, 9, 100460. [Google Scholar] [CrossRef]
  2. Leonelli, S. Data—From objects to assets. Nature 2019, 574, 317–320. [Google Scholar] [CrossRef]
  3. Lv, K.J.; Cheng, Y.; Fan, B.J. Analysis of the impact of environmental regulation on green total factor productivity in China’s manufacturing industry. Ecol. Econ. 2017, 33, 49–52. [Google Scholar]
  4. Gong, X.S.; Du, J. Digital economy, green innovation and enterprise green total factor productivity. Stat. Decis. 2024, 40, 35–40. [Google Scholar]
  5. Zhao, J.G.; Si, F.W.; Li, A.R. Mechanism of green finance on green total factor productivity of industrial enterprises in the Yellow River Basin. Eng. Manag. Sci. Technol. Front. 2024, 43, 75–82. [Google Scholar]
  6. Färe, R.; Grosskopf, S.; Norris, M. Productivity growth, technical progress, and efficiency change in industrialized countries: Reply. Am. Econ. Rev. 1997, 87, 1040–1044. [Google Scholar]
  7. Wu, S.; Fan, M.; Wu, L.; Liu, Z.; Xiang, Y. Path to green development: How do ESG ratings affect green total factor productivity? Sustainability 2024, 16, 10653. [Google Scholar] [CrossRef]
  8. He, Z.; Chen, Z.; Feng, X. Different types of industrial agglomeration and green total factor productivity in China: Do institutional and policy characteristics of cities make a difference? Environ. Sci. Eur. 2022, 34, 64. [Google Scholar] [CrossRef]
  9. Sun, H.; Zhu, L.; Wang, A.; Wang, S.; Ma, H. Analysis of regional social capital, enterprise green innovation and green total factor productivity—Based on Chinese A-share listed companies from 2011 to 2019. Sustainability 2022, 15, 34. [Google Scholar] [CrossRef]
  10. Cheng, Z.; Jin, W. Agglomeration economy and the growth of green total-factor productivity in Chinese industry. Socio-Econ. Plan. Sci. 2022, 83, 101003. [Google Scholar] [CrossRef]
  11. Norton, R.D.; Rees, J. The product cycle and the spatial decentralization of American manufacturing. Reg. Stud. 2007, 41, S61–S71. [Google Scholar] [CrossRef]
  12. Acemoglu, D.; Restrepo, P. The race between man and machine: Implications of technology for growth, factor shares, and employment. Am. Econ. Rev. 2018, 108, 1488–1542. [Google Scholar] [CrossRef]
  13. Wu, J.; Xia, Q.; Li, Z. Green innovation and enterprise green total factor productivity at a micro level: A perspective of technical distance. J. Clean. Prod. 2022, 344, 131070. [Google Scholar] [CrossRef]
  14. Liu, X.; Liu, F.; Ren, X. Firms’ digitalization in manufacturing and the structure and direction of green innovation. J. Environ. Manag. 2023, 335, 117525. [Google Scholar] [CrossRef] [PubMed]
  15. Habiba, U.; Zhang, R.W.; Sarwar, M.A. Assessing the impact of green finance and the digital economy on energy transition. Appl. Ecol. Environ. Res. 2025, 23, 8941–8968. [Google Scholar] [CrossRef]
  16. Wang, Q.; Fu, X.D. Mechanism of data elements empowering economic growth. Shanghai Econ. Res. 2021, 04, 55–66. [Google Scholar]
  17. Xie, K.; Xia, Z.H.; Xiao, J.H. Mechanism for big data as a production factor: From the perspective of product innovation. China Ind. Econ. 2020, 05, 42–60. [Google Scholar]
  18. Ma, G.; Qin, R.; Lei, S.; Tang, Y. Influence of data elements on China’s agricultural green total factor productivity. Sci. Rep. 2025, 15, 31358. [Google Scholar] [CrossRef] [PubMed]
  19. Ren, J.; Wang, M.; Li, X.; Ding, X. Data elements and agricultural green total factor productivity: Evidence from a quasi-natural experiment. Agriculture 2025, 15, 1130. [Google Scholar] [CrossRef]
  20. Dai, P.; Lu, C.; Xu, J.; Zhang, J. A study on the impact of data elements on green total factor productivity in China’s logistics industry. Sustainability 2025, 17, 8624. [Google Scholar] [CrossRef]
  21. Peng, Y.; Zhang, Y.; Gao, W.; Fan, S. Integration of data elements and artificial intelligence for synergistic pollution and carbon reduction. Sustainability 2025, 17, 10299. [Google Scholar] [CrossRef]
  22. Qi, P.; Sun, D.; Xu, C.; Li, Q.; Wang, Q. Can data elements promote the high-quality development of China’s economy? Sustainability 2023, 15, 7287. [Google Scholar] [CrossRef]
  23. Qiu, Z.X.; Zhou, Y.H. Digital economy development and regional total factor productivity: Evidence from national big data comprehensive pilot zones. J. Financ. Econ. 2021, 47, 4–17. [Google Scholar]
  24. Li, J.; Liu, Q. How does the digital economy empower urban green total factor productivity? Mod. Manag. Sci. 2023, 05, 133–142. [Google Scholar]
  25. Liu, X.W.; Yang, L.F. Can data trading platforms improve green total factor productivity? West Forum 2025, 35, 36–51. [Google Scholar]
  26. Thompson, P.; Williams, R.; Thomas, B. Are UK SMEs with active web sites more likely to achieve both innovation and growth? J. Small Bus. Enterp. Dev. 2013, 20, 934–965. [Google Scholar] [CrossRef]
  27. Wu, L.; Hitt, L.; Lou, B. Data analytics, innovation, and firm productivity. Manag. Sci. 2020, 66, 2017–2039. [Google Scholar] [CrossRef]
  28. Wamba, S.F.; Gunasekaran, A.; Akter, S.; Ren, S.J.F.; Dubey, R.; Childe, S.J. Big data analytics and firm performance: Effects of dynamic capabilities. J. Bus. Res. 2017, 70, 356–365. [Google Scholar] [CrossRef]
  29. Akter, S.; Wamba, S.F.; Gunasekaran, A.; Dubey, R.; Childe, S.J. Big data analytics capability and firm performance. Int. J. Prod. Econ. 2016, 182, 113–131. [Google Scholar] [CrossRef]
  30. Sultana, S.; Akter, S.; Kyriazis, E. Data-driven innovation capability and competitive performance. Technol. Forecast. Soc. Change 2022, 174, 121260. [Google Scholar] [CrossRef]
  31. Habiba, U.; Xinbang, C.; Anwar, A. Do green technology innovations help curb carbon emissions? Renew. Energy 2022, 193, 1082–1093. [Google Scholar] [CrossRef]
  32. Aghion, P.; Howitt, P. A Model of Growth Through Creative Destruction; Working Paper No. 3223; National Bureau of Economic Research: Cambridge, MA, USA, 1990. [Google Scholar]
  33. Wan, Y.J.; Rao, B.T.; Guo, S.T. Has the establishment of national big data comprehensive pilot zones improved enterprise total factor productivity? Commer. Res. 2025, 01, 67–78. [Google Scholar]
  34. Wang, Z.; Shou, M.; Wang, S.; Dai, R.; Wang, K. An empirical study on the key factors of intelligent upgrade of small and medium-sized enterprises in China. Sustainability 2019, 11, 619. [Google Scholar] [CrossRef]
  35. Shi, D. Evolution of industrial development trends under the digital economy. China Ind. Econ. 2022, 11, 26–42. [Google Scholar]
  36. Zou, X.C.; Lai, H.B. Impact of digital transportation on industrial radiation intensity. Technol. Innov. Manag. 2024, 45, 94–108. [Google Scholar]
  37. Zhu, C.L.; Yang, M.; Li, B.X. Has the digital economy improved green total factor productivity in manufacturing? Environ. Econ. Res. 2024, 9, 1–20. [Google Scholar]
  38. Wang, H.; Liu, J.Z.; Zhang, L.H. Carbon emissions and asset pricing. J. Econ. 2022, 9, 28–75. [Google Scholar]
  39. Beck, T.; Levine, R.; Levkov, A. Big bad banks? J. Financ. 2010, 65, 1637–1667. [Google Scholar] [CrossRef]
  40. Zhang, Y.Z.; Bian, R.M.; Wang, J.Y.; Liu, Y.K. Impact of the digital economy on green total factor productivity in manufacturing. Technol. Innov. Manag. 2025, 46, 1–11. [Google Scholar]
  41. Zhang, Z.H.; Wang, L.L.; Song, Y. Corporate social responsibility disclosure and green total factor productivity. Audit Econ. Res. 2024, 39, 103–115. [Google Scholar]
  42. Cheng, L.W.; Xiao, C.X. Enterprise green total factor productivity under environmental regulation. J. Dalian Univ. Technol. (Soc. Sci.) 2023, 44, 35–45. [Google Scholar]
  43. Zhang, C.H.; Xu, P.J. Data element agglomeration and economic resilience. Macroecon. Res. 2024, 06, 59–76. [Google Scholar]
  44. Yang, J.S.; Yang, J.H. Administrative monopoly and costs of state-owned enterprises. Econ. Res. J. 2015, 50, 50–61. [Google Scholar]
  45. Chen, B.; Wang, K.; Li, Y.; Wang, W. Digitalization and green energy efficiency. Environ. Sci. Pollut. Res. 2024, 31, 23055–23076. [Google Scholar] [CrossRef]
  46. Bindeeba, D.S.; Tukamushaba, E.K.; Bakashaba, R. Digital transformation and sustainable business performance. Futur. Bus. J. 2025, 11, 90. [Google Scholar] [CrossRef]
  47. Sağlam, Ü. From pandemic shock to sustainable recovery: Data-driven insights into global eco-productivity trends during the COVID-19 era. J. Risk Financ. Manag. 2025, 18, 473. [Google Scholar] [CrossRef]
  48. Bloom, N.; Bunn, P.; Mizen, P.; Smietanka, P.; Thwaites, G. The impact of COVID-19 on productivity. Rev. Econ. Stat. 2025, 107, 28–41. [Google Scholar] [CrossRef]
  49. Trunschke, M.; Peters, B.; Czarnitzki, D.; Rammer, C. Pandemic effects: Do innovation activities of firms suffer from long COVID? Res. Policy 2024, 53, 105024. [Google Scholar] [CrossRef]
  50. Wang, Y.; Pei, R.; Gu, X.; Liu, B.; Liu, L. Has the healthy city pilot policy improved urban health development performance in China? Evidence from a quasi-natural experiment. Sustain. Cities Soc. 2023, 88, 104268. [Google Scholar] [CrossRef]
  51. Xiong, D.; Li, W. Digital economy and urban economic resilience: Evidence from China’s national big data policy. Environ. Dev. Sustain. 2025, 1–27. [Google Scholar] [CrossRef]
  52. Wang, J.; Liu, Y.; Wang, W.; Wu, H. Digital transformation and green productivity. J. Clean. Prod. 2023, 406, 136954. [Google Scholar] [CrossRef]
  53. Ambec, S.; Cohen, M.A.; Elgie, S.; Lanoie, P. The Porter hypothesis at 20. Rev. Environ. Econ. Policy 2013, 7, 2–22. [Google Scholar] [CrossRef]
  54. Huang, P.; Chen, X. Data factor-driven industry and GTFP. Sci. Rep. 2024, 14, 25377. [Google Scholar] [CrossRef] [PubMed]
  55. Aghion, P.; Dechezleprêtre, A.; Hémous, D.; Martin, R.; Van Reenen, J. Carbon taxes and technical change. J. Polit. Econ. 2016, 124, 1–51. [Google Scholar] [CrossRef]
  56. Bloom, N.; Sadun, R.; Van Reenen, J. Organization of firms across countries. Q. J. Econ. 2012, 127, 1663–1705. [Google Scholar] [CrossRef]
  57. Teece, D.J.; Pisano, G.; Shuen, A. Dynamic capabilities and strategic management. Strateg. Manag. J. 1997, 18, 509–533. [Google Scholar] [CrossRef]
  58. Jensen, M.C.; Meckling, W.H. Theory of the firm: Managerial behavior, agency costs and ownership structure. J. Financ. Econ. 1976, 3, 305–360. [Google Scholar] [CrossRef]
  59. Habiba, U.; Zhang, R.; Sarwar, M.A.; Gong, Y. Decision support framework for sustainable energy planning. Sci. Rep. 2025, 15, 31503. [Google Scholar] [CrossRef]
Figure 1. Parallel trend test.
Sustainability 18 03274 g001
Figure 2. Placebo test results.
Sustainability 18 03274 g002
Table 1. Descriptive statistics of variables.
Variable TypeVariable NameObserved ValueMeanStandard
Deviation
MinimumMaximum
Dependent VariableGTFP82321.3861.7470.07272.630
EC82321.6242.1980.02469.820
TC82321.1490.8580.03426.060
Independent VariableDID82320.2570.4370.0001.000
Control VariablesROA82320.0500.061−0.1580.247
CFO82320.0560.060−0.0920.232
PEO82326.5210.7404.3908.058
FIN82323.7511.6741.2187.506
FCI82325.8404.2280.88421.350
MED82320.6630.2130.2601.112
SOE82320.4050.4910.0001.000
AGE82322.9840.2922.0793.555
Mediating VariablesINV82320.6571.4560.00710.790
HUM82321.5012.5990.00115.360
IS82321.4940.9760.1895.691
Moderating VariablesME82320.9901.7640.04111.600
MS82320.0990.1660.0000.627
Table 2. Basic regression results.
Variables(1)(2)(3)
GTFPTCEC
DID0.130 **0.0240.156 *
(2.318)(1.225)(1.840)
ROA6.375 ***−0.2045.405 ***
(6.035)(−1.104)(7.208)
CFO1.927 ***−0.0230.733
(2.910)(−0.164)(1.513)
PEO−0.2480.301 ***−0.271
(−1.288)(2.917)(−0.981)
FIN−0.0640.019−0.038
(−1.627)(1.472)(−0.806)
FCI0.029 **−0.0050.010
(2.146)(−1.529)(0.982)
MED−0.561−0.229 **−0.773 *
(−1.355)(−2.556)(−1.879)
AGE0.0870.730 ***0.248
(0.232)(3.048)(0.725)
SOE0.2010.0180.025
(1.267)(1.005)(0.264)
_cons2.645−2.884 ***2.889
(1.439)(−3.851)(1.299)
N823282328232
Firm FEYesYesYes
Year FEYesYesYes
R20.36100.75050.4266
Note: Significance levels of 1%, 5%, and 10% are indicated by ***, **, and *, respectively. The values in parentheses represent t-statistics.
Table 3. The result of PSM-DID test and the robustness test involving the independent variable, excluding the Influence of Concurrent Policy Interventions and excluding the Impact of the COVID-19 Pandemic.
Variables(1)(2)(3)(4)
PSM-DIDEBM-GMLControl for PoliciesExcl. Pandemic
DID0.1211 **0.060 **0.258 ***0.163 **
(0.0584)(2.031)(2.732)(2.528)
ROA6.4465 ***3.691 ***6.356 ***7.503 ***
(1.0564)(11.539)(4.827)(5.544)
CFO1.8033 **0.520 **2.150 ***1.910 **
(0.7019)(2.435)(2.901)(2.399)
PEO−0.1744−0.047−1.429 ***−0.385
(0.1783)(−0.421)(-2.650)(−1.433)
FIN−0.0588−0.030 *−0.154 ***−0.042
(0.0429)(−1.665)(−3.574)(−0.792)
FCI0.0301 **0.0020.028 **0.036 **
(0.0149)(0.475)(1.974)(2.208)
MED−0.7941 *−0.353 **0.596−0.738
(0.4249)(−2.566)(1.223)(−1.439)
AGE0.4742 *0.403 **0.0250.167
(0.2824)(2.247)(0.049)(0.450)
SOE0.1398−0.0400.368 *0.224
(0.1431)(−1.127)(1.652)(1.307)
_cons1.18860.4699.645 **3.187
(1.6718)(0.518)(2.392)(1.352)
N8196823257246860
Firm FEYesYesYesYes
Year FEYesYesYesYes
R20.30920.60560.34800.3518
Note: Significance levels of 1%, 5%, and 10% are indicated by ***, **, and *, respectively. The values in parentheses represent t-statistics.
Table 4. Heterogeneity in Pollution Intensity, Industry Characteristics and Market Competition Intensity.
Variables(1)(2)(3)(4)(5)(6)
Heavy
Pollution
Non-Heavy
Pollution
High-TechNon-High-TechLow
Competition
High
Competition
DID0.1260.119 *0.183 ***−0.0580.249 ***0.002
(1.175)(1.932)(2.584)(−0.958)(3.234)(0.025)
ROA7.647 ***5.044 ***7.166 ***3.553 ***5.299 ***7.674 ***
(3.484)(4.666)(5.187)(7.631)(4.810)(4.075)
CFO2.861 **1.342 *2.277 ***0.687 **1.647 *2.294 **
(2.370)(1.773)(2.670)(2.088)(1.941)(2.229)
PEO−1.024 **0.106−0.240−0.280−0.104−0.509
(−2.067)(0.594)(−1.023)(−0.993)(−0.572)(−1.230)
FIN−0.129 *−0.019−0.089 *0.110 **−0.0770.001
(−1.901)(−0.415)(−1.921)(1.974)(−1.497)(0.026)
FCI0.061 **0.0160.035 **0.0160.0160.046 *
(2.298)(1.142)(2.110)(1.622)(1.035)(1.879)
MED0.124−0.519−0.309−0.880 ***−0.065−1.373 *
(0.141)(−1.235)(−0.619)(−2.618)(−0.144)(−1.858)
AGE−0.4800.337−0.4061.600 ***0.2790.018
(−0.514)(1.137)(−0.834)(4.071)(0.779)(0.026)
SOE0.6080.0240.2070.280 **0.0060.453
(1.353)(0.599)(1.034)(2.308)(0.111)(1.315)
_cons8.564 *−0.4183.926 *−1.9101.0194.596
(1.901)(−0.255)(1.683)(−1.028)(0.586)(1.246)
N287153526384184044403792
Firm FEYesYesYesYesYesYes
Year FEYesYesYesYesYesYes
R20.38710.35850.34530.62680.37020.3634
Note: Significance levels of 1%, 5%, and 10% are indicated by ***, **, and *, respectively. The values in parentheses represent t-statistics.
Table 5. Testing the mediating effect of R&D investment intensity, human capital level, and industrial structure upgrading.
Variables(1)(2)(3)(4)(5)(6)
INVGTFPHUMGTFPISGTFP
DID0.155 ***0.0820.242 ***0.090 *0.216 ***0.099 *
(4.340)(1.446)(5.105)(1.654)(18.955)(1.813)
INV 0.275 ***
(2.952)
HUM 0.141 ***
(4.959)
IS 0.116 *
(1.830)
ROA0.2396.235 ***0.1686.277 ***−0.196 ***6.324 ***
(1.462)(6.293)(0.881)(6.239)(−3.444)(6.287)
CFO−0.1501.877 ***−0.476 **1.903 ***0.0401.831 ***
(−1.008)(3.024)(−2.403)(3.074)(0.811)(2.959)
PEO−0.510 ***−0.1030.095−0.257−0.491 ***−0.186
(−4.926)(−0.533)(0.610)(−1.366)(−14.336)(−0.951)
FIN0.042 **−0.077 **0.013−0.067 *0.052 ***−0.071 **
(1.966)(−2.145)(0.474)(−1.841)(6.302)(−1.961)
FCI0.0040.027 **−0.013 **0.030 **−0.005 ***0.029 **
(0.851)(2.108)(−2.313)(2.273)(−4.340)(2.182)
MED−0.092−0.5060.301−0.5740.628 ***−0.605
(−0.528)(−1.275)(1.449)(−1.452)(11.933)(−1.507)
AGE−0.365 *0.207−0.751 ***0.2130.0530.100
(−1.681)(0.557)(−3.176)(0.579)(0.940)(0.273)
SOE0.0380.190−0.0470.207−0.0010.200
(0.903)(1.218)(−0.939)(1.323)(−0.116)(1.281)
_cons4.894 ***1.2132.926 **2.1433.906 ***2.102
(5.636)(0.639)(2.393)(1.183)(14.252)(1.130)
N823282328232823282328232
Firm FEYesYesYesYesYesYes
Year FEYesYesYesYesYesYes
R20.79500.38080.89150.37510.95600.3707
Note: Significance levels of 1%, 5%, and 10% are indicated by ***, **, and *, respectively. The values in parentheses represent t-statistics.
Table 6. Testing the moderating effect of managerial efficiency and executive equity ownership.
Variables(1)(2)
GTFPGTFP
DID0.130 **0.129 **
(2.396)(2.297)
ME1.243 *
(1.770)
DID × ME−1.059 **
(−2.196)
MS −0.052
(−0.309)
DID × MS 0.716 ***
(3.178)
ROA6.305 ***6.422 ***
(6.276)(6.052)
CFO1.764 ***1.903 ***
(2.782)(2.872)
PEO−0.221−0.302
(−1.152)(−1.539)
FIN−0.064 *−0.062
(−1.732)(−1.594)
FCI0.029 **0.029 **
(2.185)(2.103)
MED−0.498−0.574
(−1.222)(−1.381)
AGE0.043−0.085
(0.117)(−0.222)
SOE0.2020.202
(1.295)(1.273)
_cons2.4573.521 *
(1.351)(1.879)
N82328232
Firm FEYesYes
Year FEYesYes
R20.37090.3615
Note: Significance levels of 1%, 5%, and 10% are indicated by ***, **, and *, respectively. The values in parentheses represent t-statistics.
Disclaimer/Publisher’s Note: The statements, opinions and data contained in all publications are solely those of the individual author(s) and contributor(s) and not of MDPI and/or the editor(s). MDPI and/or the editor(s) disclaim responsibility for any injury to people or property resulting from any ideas, methods, instructions or products referred to in the content.