Article

Landscape Pattern Reconfiguration and Surface Runoff Response Driven by Vegetation Restoration in the Loess Plateau


1
School of Hydraulic Engineering, Zhejiang University of Water Resources and Electric Power, Hangzhou 310018, China
2
Nanxun Innovation Institute, Zhejiang University of Water Resources and Electric Power, Hangzhou 310018, China
3
College of Land and Resources, Hebei Agricultural University, Baoding 071001, China
4
School of Geography and Planning, Sun Yat-sen University, Guangzhou 510006, China
*
Author to whom correspondence should be addressed.
Sustainability 2026, 18(7), 3206; https://doi.org/10.3390/su18073206
Submission received: 13 February 2026 / Revised: 15 March 2026 / Accepted: 23 March 2026 / Published: 25 March 2026

Abstract

Clarifying the relationship between landscape patterns and runoff coefficient, along with identifying key influencing pathways, is crucial for formulating sustainable water resource management strategies. Since the launch of the Grain-for-Green (GfG) project in 1999, the landscape pattern of the Loess Plateau has been profoundly reshaped, altering regional rainfall-runoff processes. Assessment across 27 catchments selected in the central Loess Plateau demonstrated forest and grassland areas expanded by 738.8 km2 and 480.4 km2, respectively, paralleled by a 20.1% enhancement in vegetation coverage. Correspondingly, surface runoff decreased by 28.1–90.6% in the 2000s and 12.8–95.5% in the 2010s compared to the 1960s, with a similar decline in runoff coefficient. This study further developed a novel landscape unit mapping method, integrating vegetation coverage, land use, slope, and soil type to compute landscape metrics. Partial least squares regression (PLSR) and piecewise structural equation modeling (piecewiseSEM) were constructed to systematically analyze the linkage between landscape patterns and surface runoff. The constructed landscape metrics explained 64.6% of the variance in the runoff coefficient, with perimeter area fractal dimension (PAFRAC), mean perimeter-area ratio (PARA_MN), and aggregation index (AI) exerting significant influence. The findings provide a scientific basis for water resource management in regions with similar environmental characteristics.

1. Introduction

Surface runoff is essential to water resources, sustaining agricultural irrigation, significant economic activities, and public health. Recent improvements in vegetation have considerably altered runoff trends, resulting in an annual decrease of 15.54 mm in global runoff [1,2]. In arid and semi-arid regions, the substantial increase in vegetation greening has profoundly transformed local landscapes [3], reducing surface runoff by more than 50% in some areas [4]. Previous studies have shown that regions experiencing rapid vegetation restoration are projected to face further declines in surface runoff [5,6]. Therefore, it is crucial to understand how landscape arrangements impact runoff and examine their interconnected relationship. Considering potential future challenges enables such insights to significantly enhance water security in river basins.
The arrangement of landscape patterns plays an important role in the natural water cycle, with changes primarily stemming from vegetation restoration, which affects water use in the atmosphere or soils, groundwater recharge, and surface runoff [7,8]. Recent research indicates that converting farmland to grassland or shrubland improves soil drainage and reduces surface runoff [9]. Forests and grasslands mainly mitigate water loss through interception, while bare land, particularly sloping farmland, tends to generate more runoff [10]. The interaction between land use patterns and surface runoff has been extensively studied [11,12,13]. Notably, surface runoff generally decreases as vegetation cover increases under the same land use type [14]. However, few studies have comprehensively coupled land use and vegetation changes to hydrological responses. The runoff coefficient, defined as the ratio of surface runoff to precipitation, serves as an integrated metric that captures the effect of multiple hydrological processes at the watershed scale [15]. It depends on precipitation intensity and duration, as well as on basin geohydrological attributes and antecedent moisture conditions [16]. Therefore, examining how landscape patterns influence runoff coefficient can provide insight into the hydrological mechanisms through which vegetation restoration affects water yield.
Landscape patterns integrate land use, soil properties, topography, and vegetation cover [17]. Soil characteristics and topographic factors are critical in hydrological processes, alongside the more frequently noted land use and vegetation cover. For instance, slope gradients influence runoff velocity, retention time, infiltration rates, and total runoff volumes [18]. Neglecting any of these factors may lead to an incomplete understanding of landscape patterns and their significant impact on runoff dynamics. Landscape metrics are widely employed to quantify landscape structure, composition, and spatial configuration, thereby facilitating the analysis of relationships between landscape patterns and runoff. Over recent decades, landscape metrics including Patch Density, Largest Patch Index, and Edge Density have been developed to characterize the spatial structural attributes of landscape elements [19,20,21]. Concurrently, several studies have highlighted substantial correlations between multiple landscape metrics and runoff, sediment yield, water quality, and ecological quality assessments, which provided a basis for quantifying ecological functions [22,23,24]. However, these metrics are generally derived from land use patch units, without considering the roles of topography, soil properties, and other elements in landscape patterns. More attention is now being directed toward integrated patch units that incorporate land use, soil properties, and topography, strengthening the reliability of landscape pattern-runoff relationship analysis [20].
Known as a major ecologically fragile region globally, the Chinese Loess Plateau has faced challenges in soil conservation and environmental management. To improve ecological conditions, the Chinese government launched the GfG project in 1999 [25,26]. Since the 2000s, large-scale conversion of cropland to grassland, shrubland, and forests has significantly increased vegetation cover [27]. Alterations in landscape types have profoundly affected surface conditions and runoff generation processes, leading to approximately 30% reductions in surface runoff and over 70% decrease in sediment discharge in many watersheds [28,29]. However, although ecological benefits are apparent, surface water scarcity has become a critical constraint on regional sustainable development [30]. Due to the complicated interactions between landscape patterns and hydrological processes, multiple confounding factors obscure how landscape patterns influence surface runoff. Therefore, integrated analysis of landscape patterns and surface runoff is essential for sustainable water resource management. This study aims to: (1) determine the variations in surface runoff and runoff coefficient in the central Loess Plateau over recent decades; (2) explore the dynamic changes and diversity characteristics of landscape patterns; (3) investigate the driving relationships and identify the dominant influence pathways between landscape metrics and surface runoff.

2. Materials and Methods

2.1. Study Area

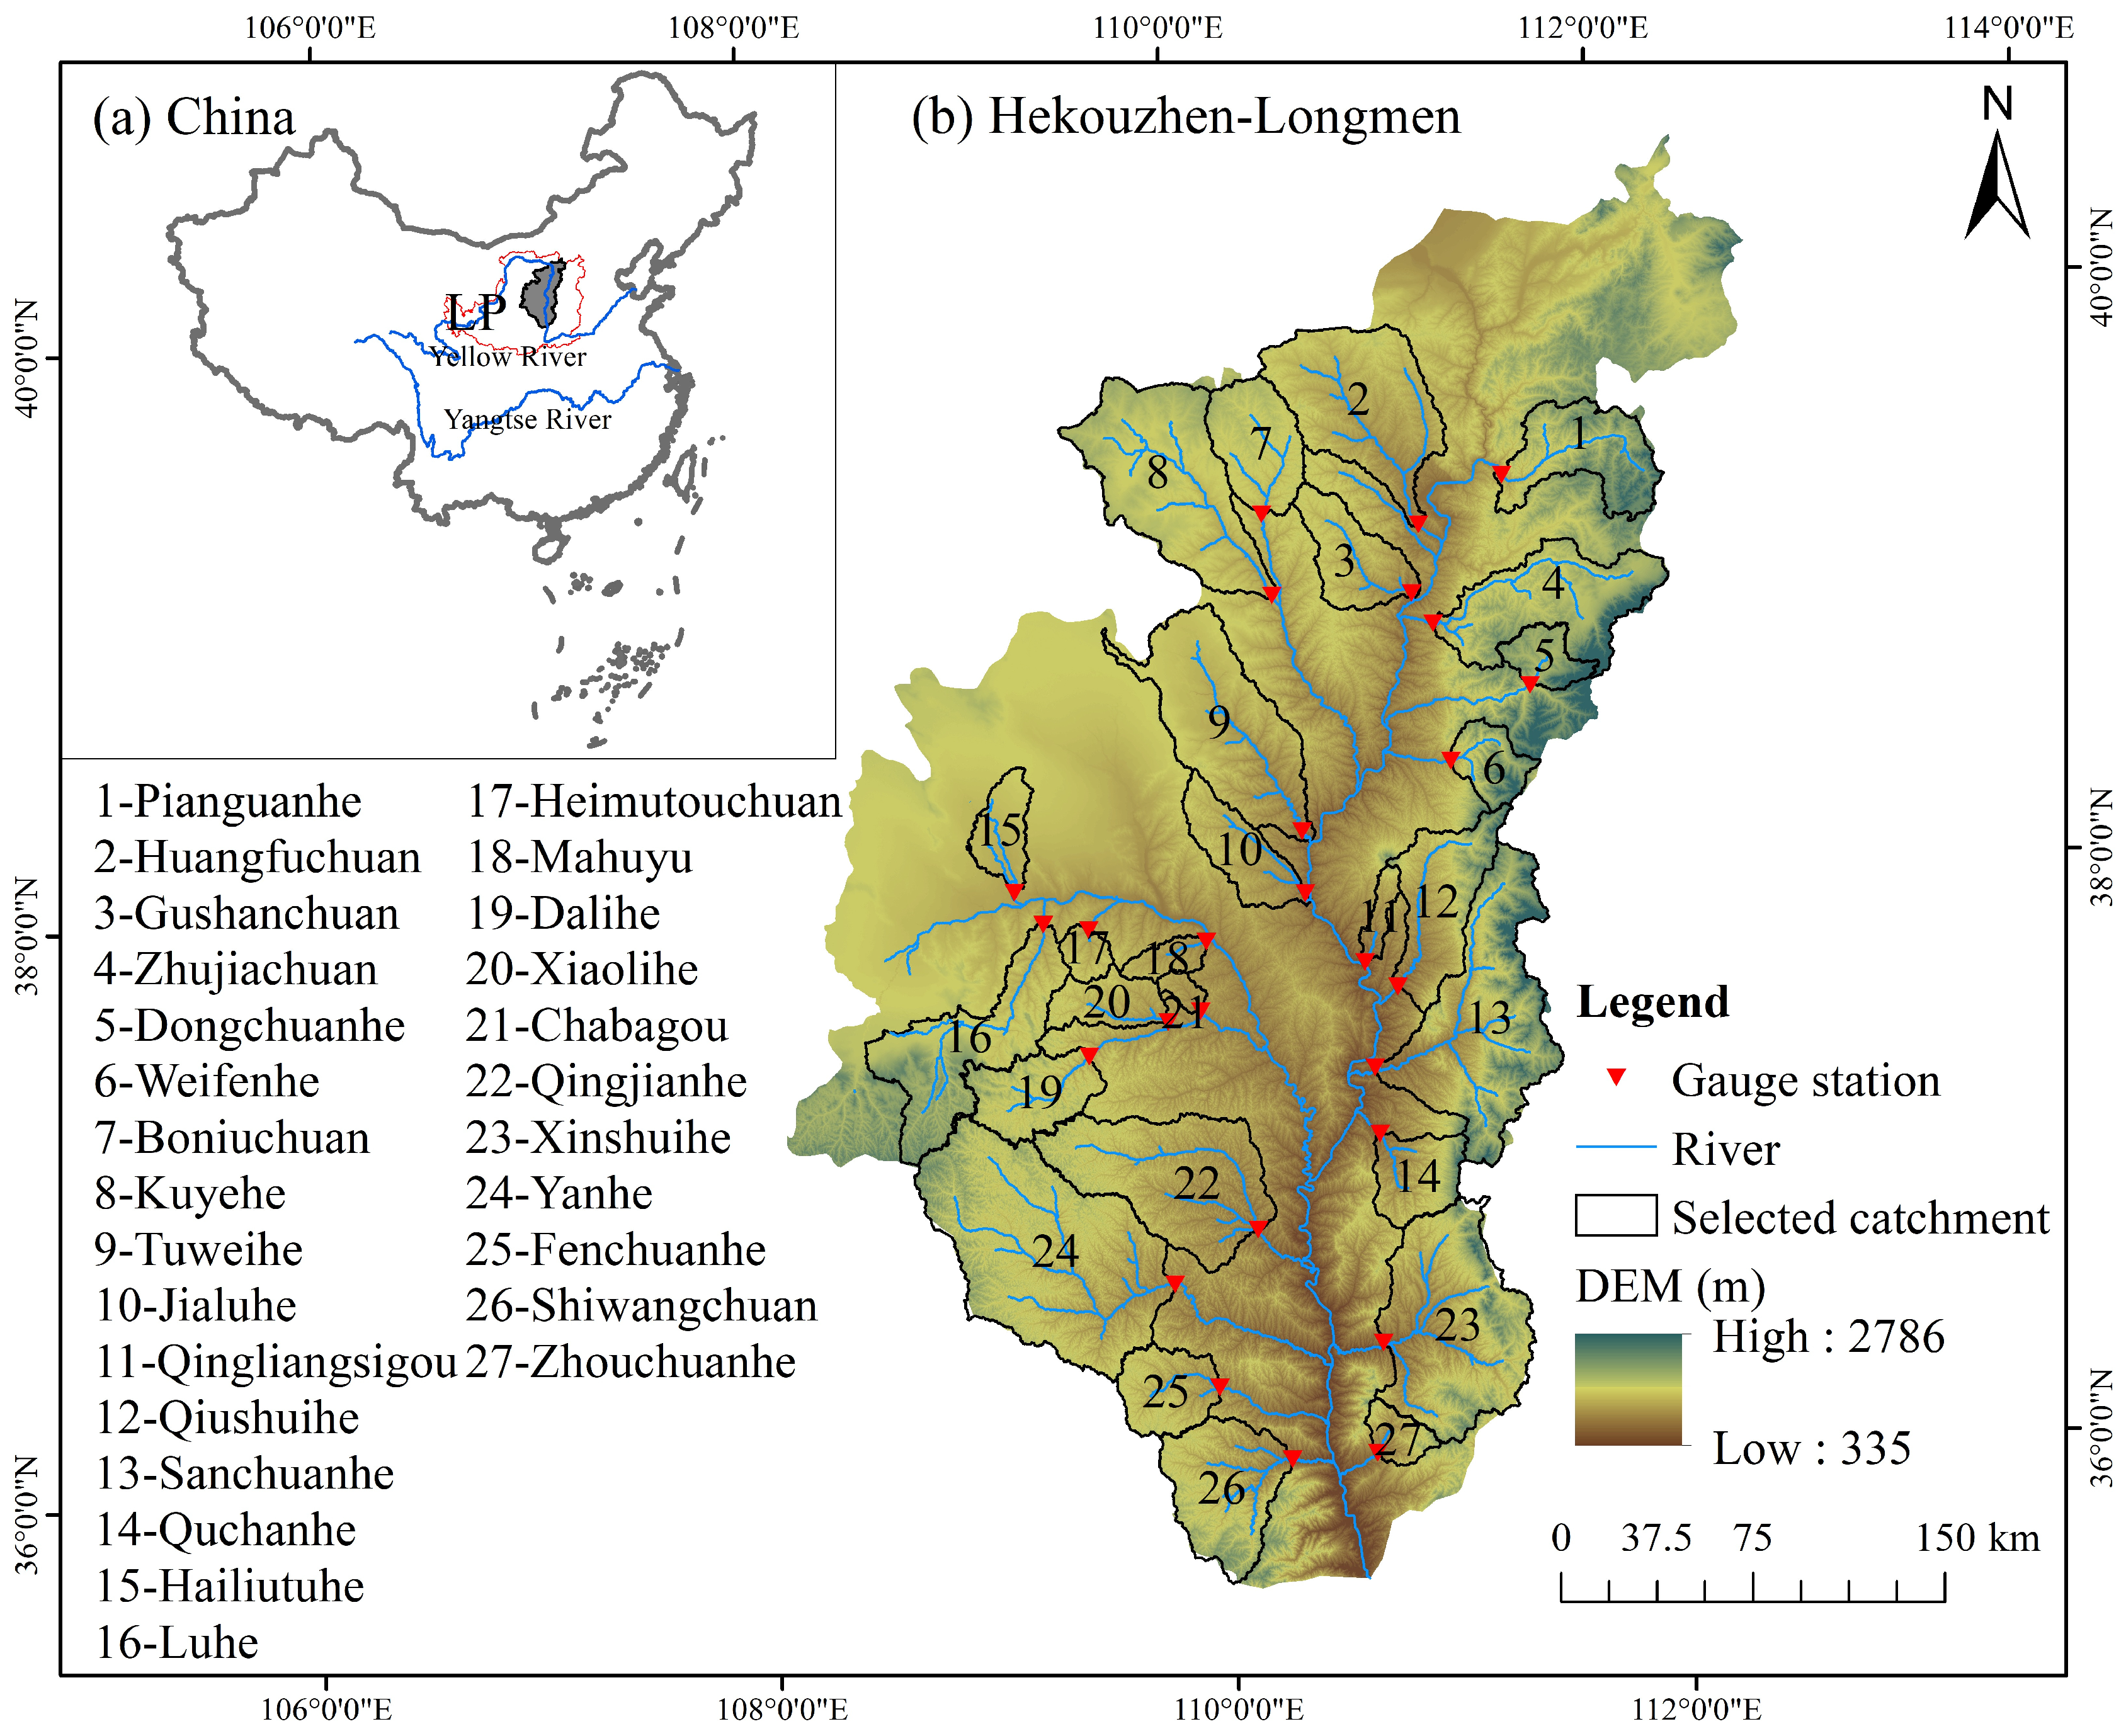
The Loess Plateau, located in the middle and upper reaches of the Yellow River (33°43′–41°16′ N, 100°54′–114°33′ E), covers approximately 640,000 km2 (Figure 1a). The region is covered by thick Quaternary loess deposits, with thickness generally ranging from tens to hundreds of meters deep [31]. The loess is highly erodible, and long-term water erosion has created fragmented topography characterized by dense gully systems and deep river valleys [30]. The climate transitions from sub-humid to semi-arid from southeast to northwest, with mean annual temperature ranging from 3 to 15 °C and annual precipitation from 200 to 800 mm [32]. Based on the criteria of the Köppen–Geiger climate classification system [33], most of the region is classified as the cold semi-arid climate (BSk). Annual potential evapotranspiration exceeds 1000 mm, and mean annual aridity index (the ratio of precipitation to potential evapotranspiration) was 0.45 from 1961 to 2014 [34], indicating a persistent water deficit across most of the plateau. These geomorphological and climatic characteristics profoundly influence the hydrological conditions and erosion processes of the Loess Plateau, contributing to its recognition as one of the most severely eroded areas globally.
The study area is located in the central part of the Loess Plateau, within the Hekouzhen–Longmen region, specifically between the Toudaoguai and the Longmen hydrological control stations in the middle reaches of the Yellow River (Figure 1b). Covering an area of approximately 1.30 × 10⁵ km2, the region experiences a temperate semi-arid climate. The average annual temperature is 8.4 °C, and annual precipitation is 443 mm, 77.4% of which occurs as rainstorms between July and September.
For this analysis, 27 major catchments distributed from north to south across the region were selected. Hydrological observations from 1960 to 2015 indicate that these watersheds collectively contribute about 74.8% of the total surface runoff in the central Loess Plateau. The average annual precipitation in the study region ranges from 379.4 mm to 538.2 mm, exhibiting a decreasing gradient from south to north. Similarly, annual runoff depth is higher in the southern areas and lower in the north, varying between 7.95 mm and 95.42 mm. The detailed characteristics of the selected catchments are provided in Table 1.

2.2. Data Sources

Multiple datasets from authoritative sources were collected to investigate the relationship between landscape patterns and hydrological processes. Table 2 summarizes the data sources, temporal coverage, and spatial resolution.
The selection of 1960 as the starting year for hydrological analysis was based on two considerations. Firstly, hydrological monitoring networks in the middle Yellow River region became systematically established around 1960, providing consistent long-term records suitable for long-term trend analysis. Secondly, extending the hydrological time series to 1960 enables assessment of runoff changes over a longer period that encompasses both pre-restoration (1960–1999) and post-restoration (2000–2015) phases of the Grain-for-Green project. For landscape data, 1990 was selected as the pre-restoration baseline, representing conditions before project implementation, while the post-restoration snapshots (2000, 2005, 2010, 2015) capture landscape evolution following policy initiation. To construct the modeling dataset, we matched annual runoff coefficients to the five landscape snapshot years (1990, 2000, 2005, 2010, and 2015) for each catchment using a same-year matching rule. This design allows us to link long-term hydrological trends to discrete landscape observations while maintaining temporal correspondence through the matching procedure described.

2.3. Optimization of Landscape Pattern Indices Incorporating Multiple Factors

A landscape unit is the smallest homogeneous polygon that can be identified at a specified spatial resolution, serving as a foundational element in landscape mapping. While traditional research has primarily focused on the effects of land use patterns on hydrological processes, such studies typically rely on land cover units for analysis, which inadequately capture hydrological responses.
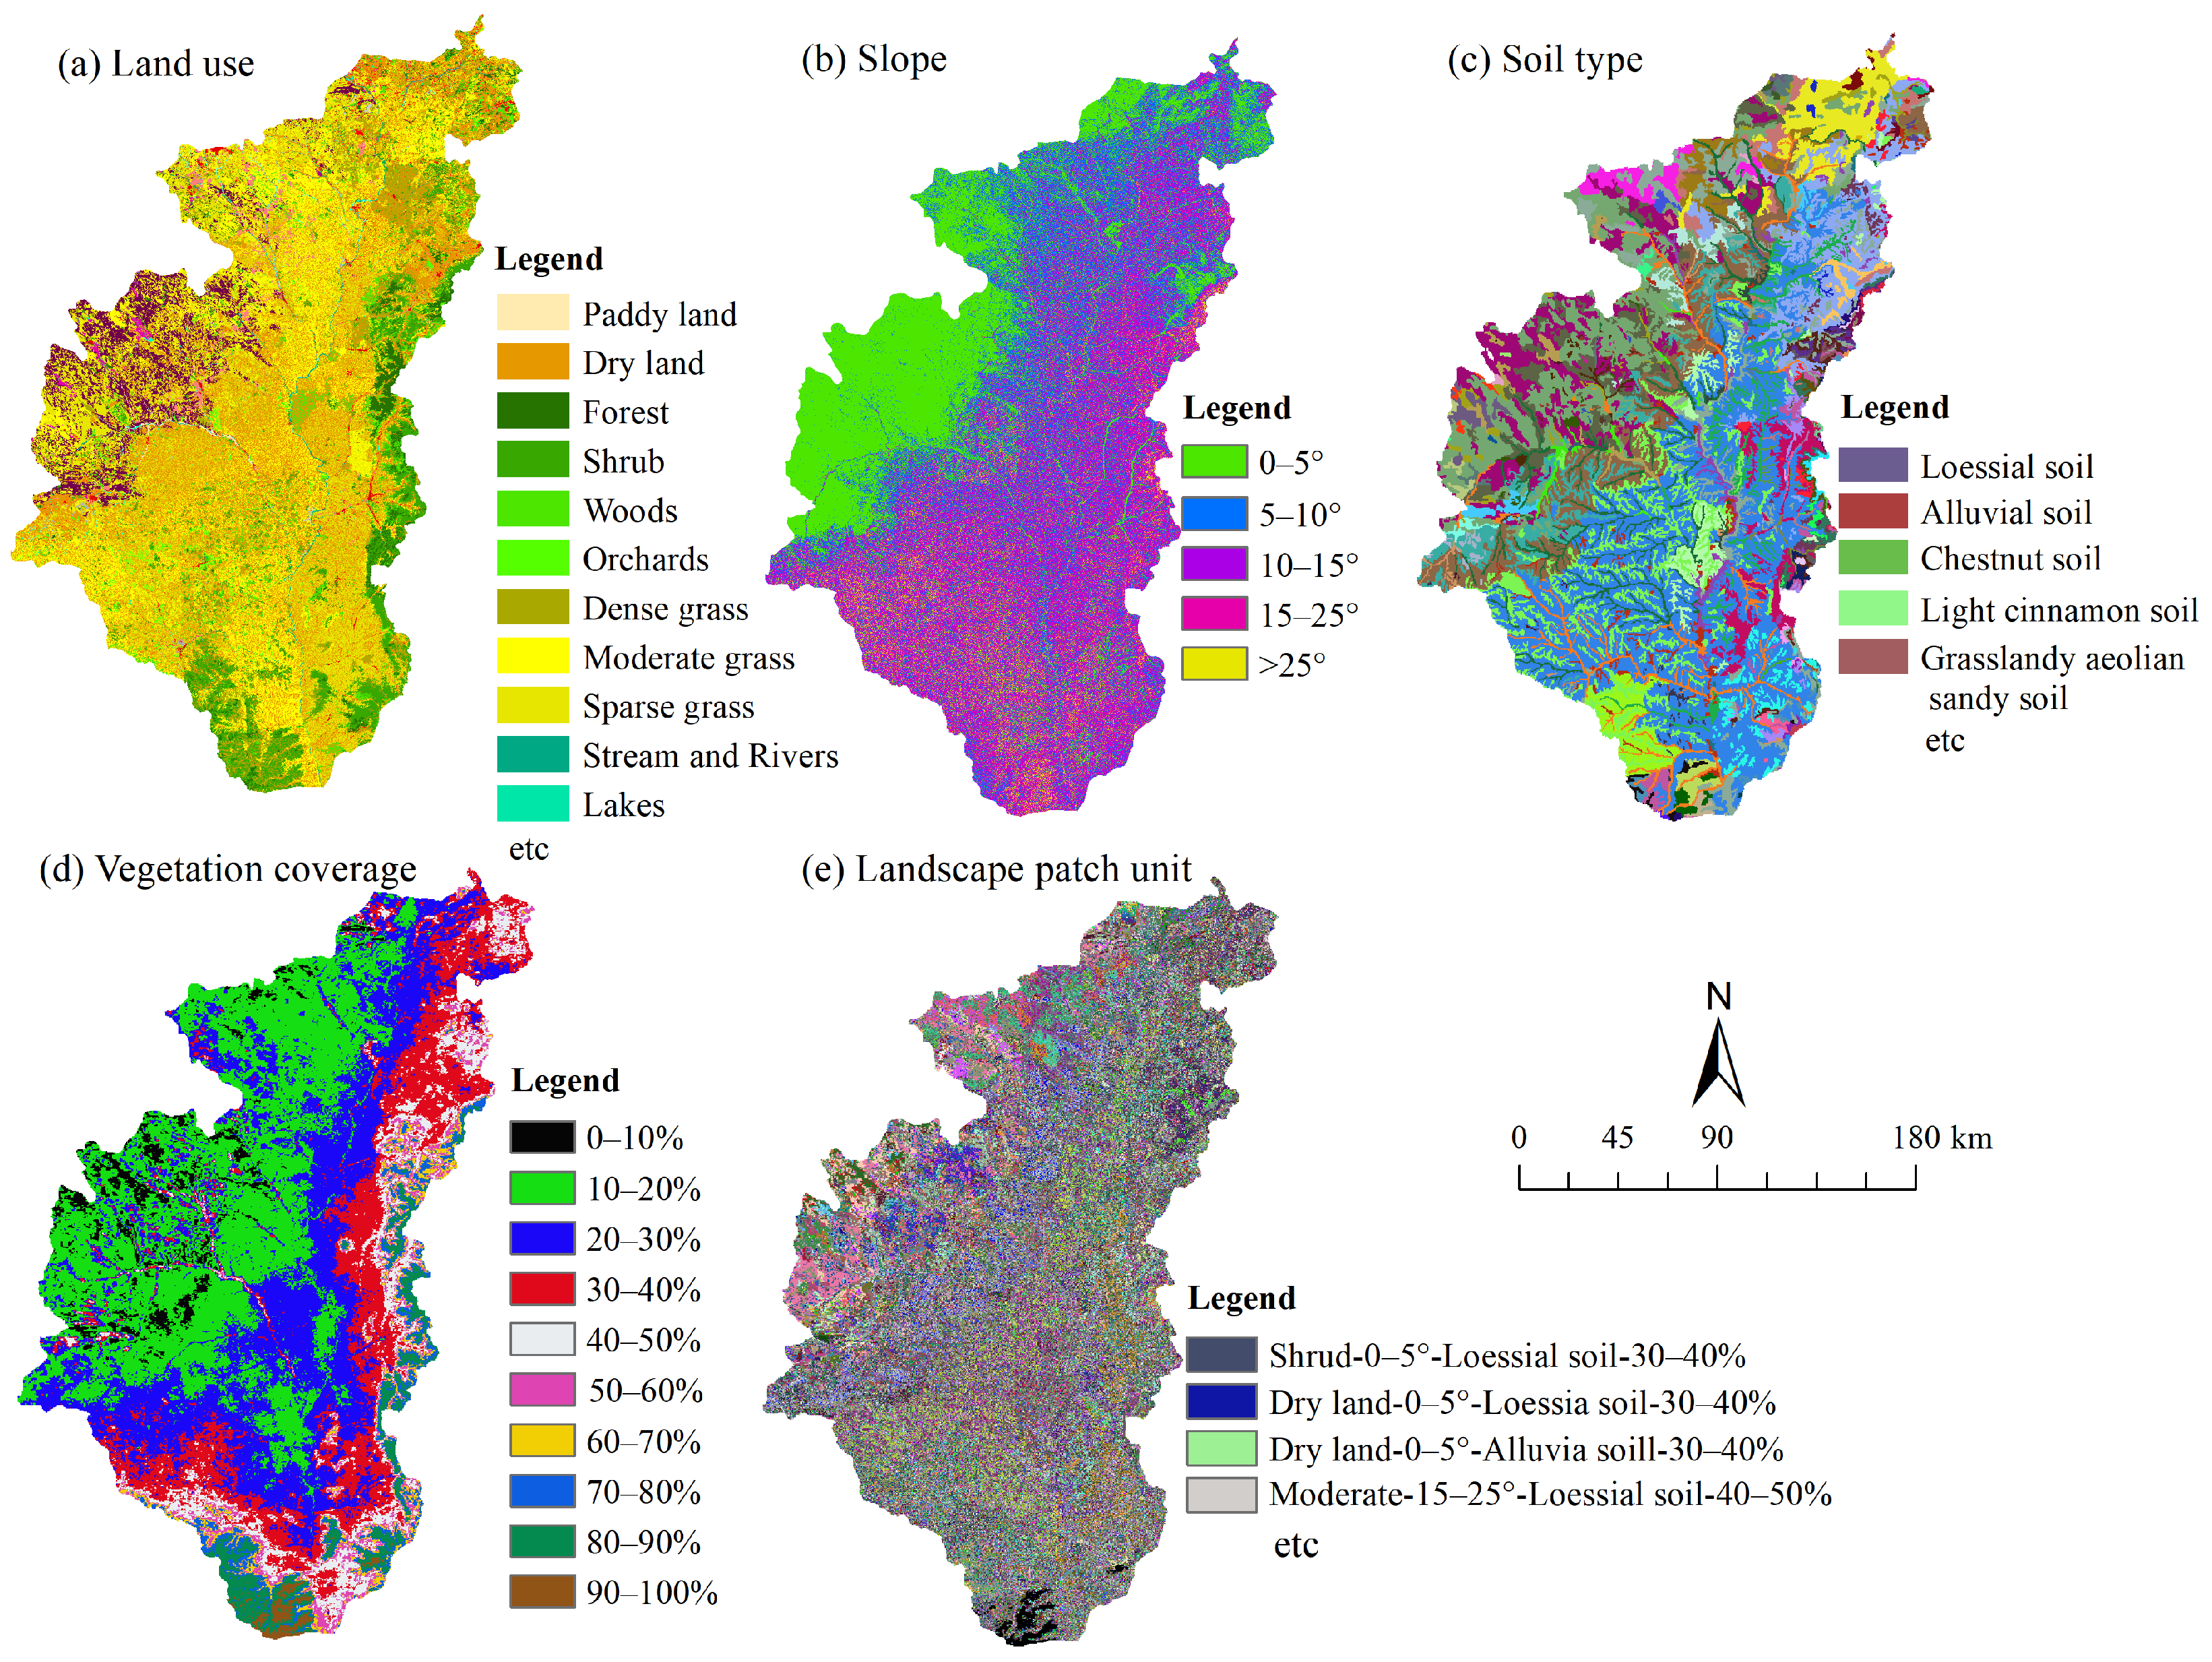
To overcome this limitation, we developed a novel mapping method that defines landscape units by integrating land use, topography, soil, and vegetation coverage (Figure 2). The classification schemes are as follows: (1) According to the land use/cover classification system proposed by Liu et al. [35] in China, land use types were categorized into 25 classes, such as dry land, irrigated land, and high-coverage grassland (Figure 2a). (2) For the classification of slope, it was classified into five levels: four categories at 5° intervals for slopes below 25°, and one category for slopes above 25° (Figure 2b). Regarding the 25° threshold, based on the legal provisions, cultivation on slopes steeper than 25° is strictly forbidden [36]. In addition, evidence of simulation experiments from the study region indicates a positive correlation between runoff generation and slope, with maximum flow velocity and runoff quantity occurring at a 25° incline [37,38]. The choice of 5° intervals for slope classification was based on previous hydrological studies in the Loess Plateau, which have commonly used 5° increments to capture the nonlinear relationship between slope gradient and runoff generation [39,40]. This interval width balances sufficient detail with practical mapping considerations. (3) Soil, through its physical properties such as infiltration and water-holding capacity, also influences surface runoff. Based on the soil data obtained from the Loess Plateau Data Center, 15 soil types were identified in the study area (Figure 2c). (4) Vegetation changes significantly impact hydrology. For instance, the GfG program increased vegetation coverage by 14% in the middle reaches of the Yellow River, reducing runoff by 35.4% [10]. In the absence of a standardized measurement approach [41], vegetation coverage was divided into 10 levels in our study (Figure 2d). The 10% interval provides sufficient resolution to capture ecologically meaningful differences in vegetation cover while maintaining adequate sample sizes within each class for landscape unit delineation.
The new landscape unit is generated using a GIS-based raster overlay procedure in ArcGIS 10.6 (http://www.esri.com, accessed on 1 May 2020). Four spatial layers, including land use, slope, soil type, and vegetation coverage, were resampled to a consistent spatial resolution of 30 m, corresponding to the resolution of the land-cover dataset. The slope layer was derived from the DEM, and vegetation coverage from NDVI. These layers were then combined using a spatial overlay operation, and each resulting spatial polygon represents a unique combination of the four attributes. Any change in one attribute (e.g., slope class or vegetation coverage) results in a new landscape-unit category (Figure 2e).
The newly generated landscape unit in this study can be used for effective analysis of runoff patterns due to its consistent internal hydrological response characteristics. Landscape pattern indices provide important insights into the relations between landscape structure and eco-hydrological processes such as runoff, sediment deposition, and water quality. Key landscape features, including the composition and arrangement of land use, were examined by applying 17 representative landscape metrics. These metrics are commonly categorized into area, fragmentation, shape, spatial structure, and evenness [22,29]. The landscape variables were calculated from the patch map of our study area using Fragstats 4.2 (https://fragstats.org/index.php, accessed on 1 May 2020), a specialized software from Oregon State University [42]. Detailed explanations of these metrics are provided in Table 3.

2.4. Partial Least-Squares Regression (PLSR)

Landscape metrics derived from multiple spatial factors (land use, slope, soil, and vegetation) are often highly collinear, as they capture different aspects of the same underlying landscape structure. Such collinearity can introduce redundancy and instability in traditional multivariate regression methods. Conventional approaches have well-documented limitations when dealing with multicollinear datasets. To address these challenges, this study employed PLSR, a method specifically designed to handle highly collinear and noisy datasets by extracting latent components that maximize covariance between predictors and response variables [43].
The PLSR enables the modelling of relationships between several dependent variables (Y) and multiple independent variables (X). It proves especially effective when analyzing datasets containing substantial auto-correlated noise [11]. The primary objective of PLSR is to extract the principal components from both X and Y that maximize their covariance, thereby establishing the strongest possible linkage between the two datasets. In this study, the landscape pattern indices served as independent variables, while the selected runoff coefficient was the dependent variable. Cross-validation was employed to determine the optimal number of principal components in the PLSR model for an appropriate balance between explained variance and predictive accuracy. The cross-validation scheme used in the PLSR model was leave-one-out cross-validation (LOOCV). A model is generally considered to provide reliable predictions when its R2 exceeds 0.5 [44]. The optimal PLSR model usually achieves the highest Q2 and the lowest RMSECV. The computation procedures are as follows:
Q 2 = 1.0 P R E S S S S
PRESS = i = 1 n ( Pr ^ i Q i ) 2
SS = i = 1 n ( Pr i Q i ) 2
Q cum 2 = 1.0 Π ( PRESS SS ) k ( k   =   1 ,   2 ,   ,   m )
RMSECV = PRESS n
where PRESS represents the sum of squared prediction errors; SS refers to the sum of squared residuals; P r ^ i denotes the predicted runoff coefficient for the leave-one-out sample. P r i and Q i represent the predicted and measured runoff coefficients, respectively. Q2 indicates the model’s prediction ability; Q c u m 2 refers to the prediction ability of the cumulative model constructed by sequentially incorporating principal components; m is the number of main components, and n is the number of samples.

2.5. Piecewise Structural Equation Modeling (piecewiseSEM)

To explore the complex relationships between vegetation characteristics and landscape pattern variables, we constructed a piecewise Structural Equation Model (piecewiseSEM) [45]. Before model construction, linear mixed-effects models (LMMs) were developed to quantify the relationships among vegetation and landscape pattern variables while accounting for potential random effects. These component models were then integrated into a unified SEM framework using the piecewiseSEM approach. Model fit was evaluated using several commonly applied statistics, including Fisher’s C statistic, Akaike Information Criterion (AIC), degrees of freedom (DF), and the associated p-value.
Fisher s   C = 2 i = 1 k ln ( P i )
where P i represents the ith independence claim in a basis set composed of k claims; Fisher s   C can then be compared to a X2-distribution with 2k degrees of freedom. A non-significant Fisher’s C test (p ≥ 0.05) indicates that the hypothesized causal structure is consistent with the observed data, suggesting that the difference between the proposed model and the saturated model is not statistically significant and the model provides an acceptable fit to the data; If p < 0.05, it means that at least one path is not accepted and should check the path.
AIC can be computed from Fisher s   C statistic by the following formula [46]:
AIC   =   Fisher s   C + 2 K
where K denotes the likelihood degrees of freedom. In the piecewiseSEM model, vegetation characteristics were represented by a composite variable (Vegetation) derived from forest area, grassland area, and vegetation coverage, while landscape pattern was represented by a composite variable (Landscape) constructed from multiple landscape metrics, including patch density (PD), largest patch index (LPI), edge density (ED), mean patch size (AREA_MN), mean shape index (SHAPE_MN), mean perimeter-area ratio (PARA_MN), perimeter area fractal dimension (PAFRAC), splitting index (SPLIT), and aggregation index (AI). These variables were incorporated into the piecewiseSEM to evaluate the direct and indirect relationships between vegetation characteristics and landscape pattern structure. The structural equation model was constructed by the ‘piecewiseSEM’ package in R (version 4.5.2) (https://cran.r-project.org/, accessed on 1 December 2025).

3. Results

3.1. Changing Characteristics of Surface Runoff and Precipitation

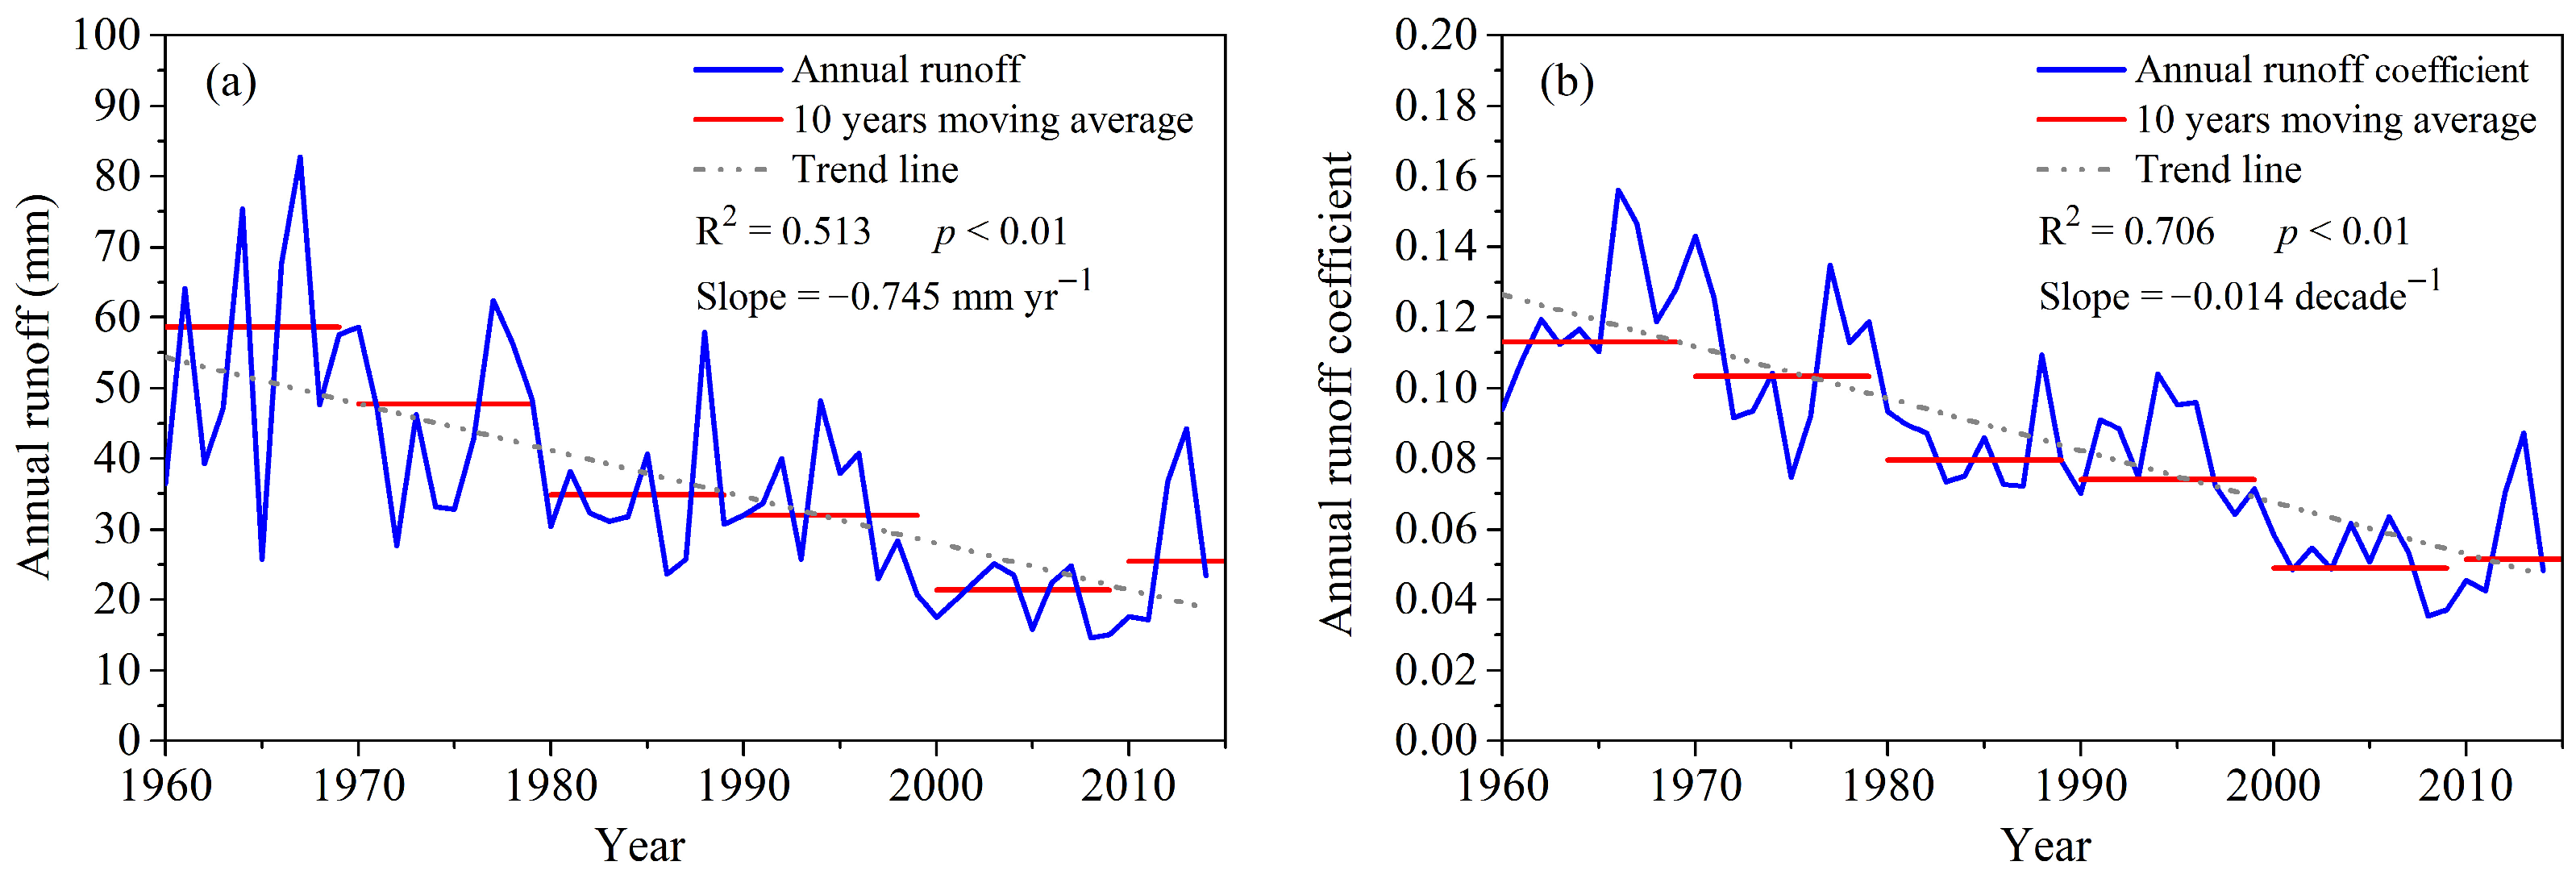
Both the average annual surface runoff and runoff coefficient demonstrated significant declines from 1960 to 2015 across the Hekouzhen–Longmen region, at rates of −0.745 mm per year (p < 0.01) and −0.014 per decade (p < 0.01), respectively (Figure 3). A downward trend was also observed in the 10-year averages of surface runoff and runoff coefficient throughout the 1960s to 2010s. After the implementation of the GfG program, surface runoff and runoff coefficients decreased by 64.4% and 58.2% in the 2000s, and 57.6% and 55.8% in the 2010s, respectively, compared to the 1960s.
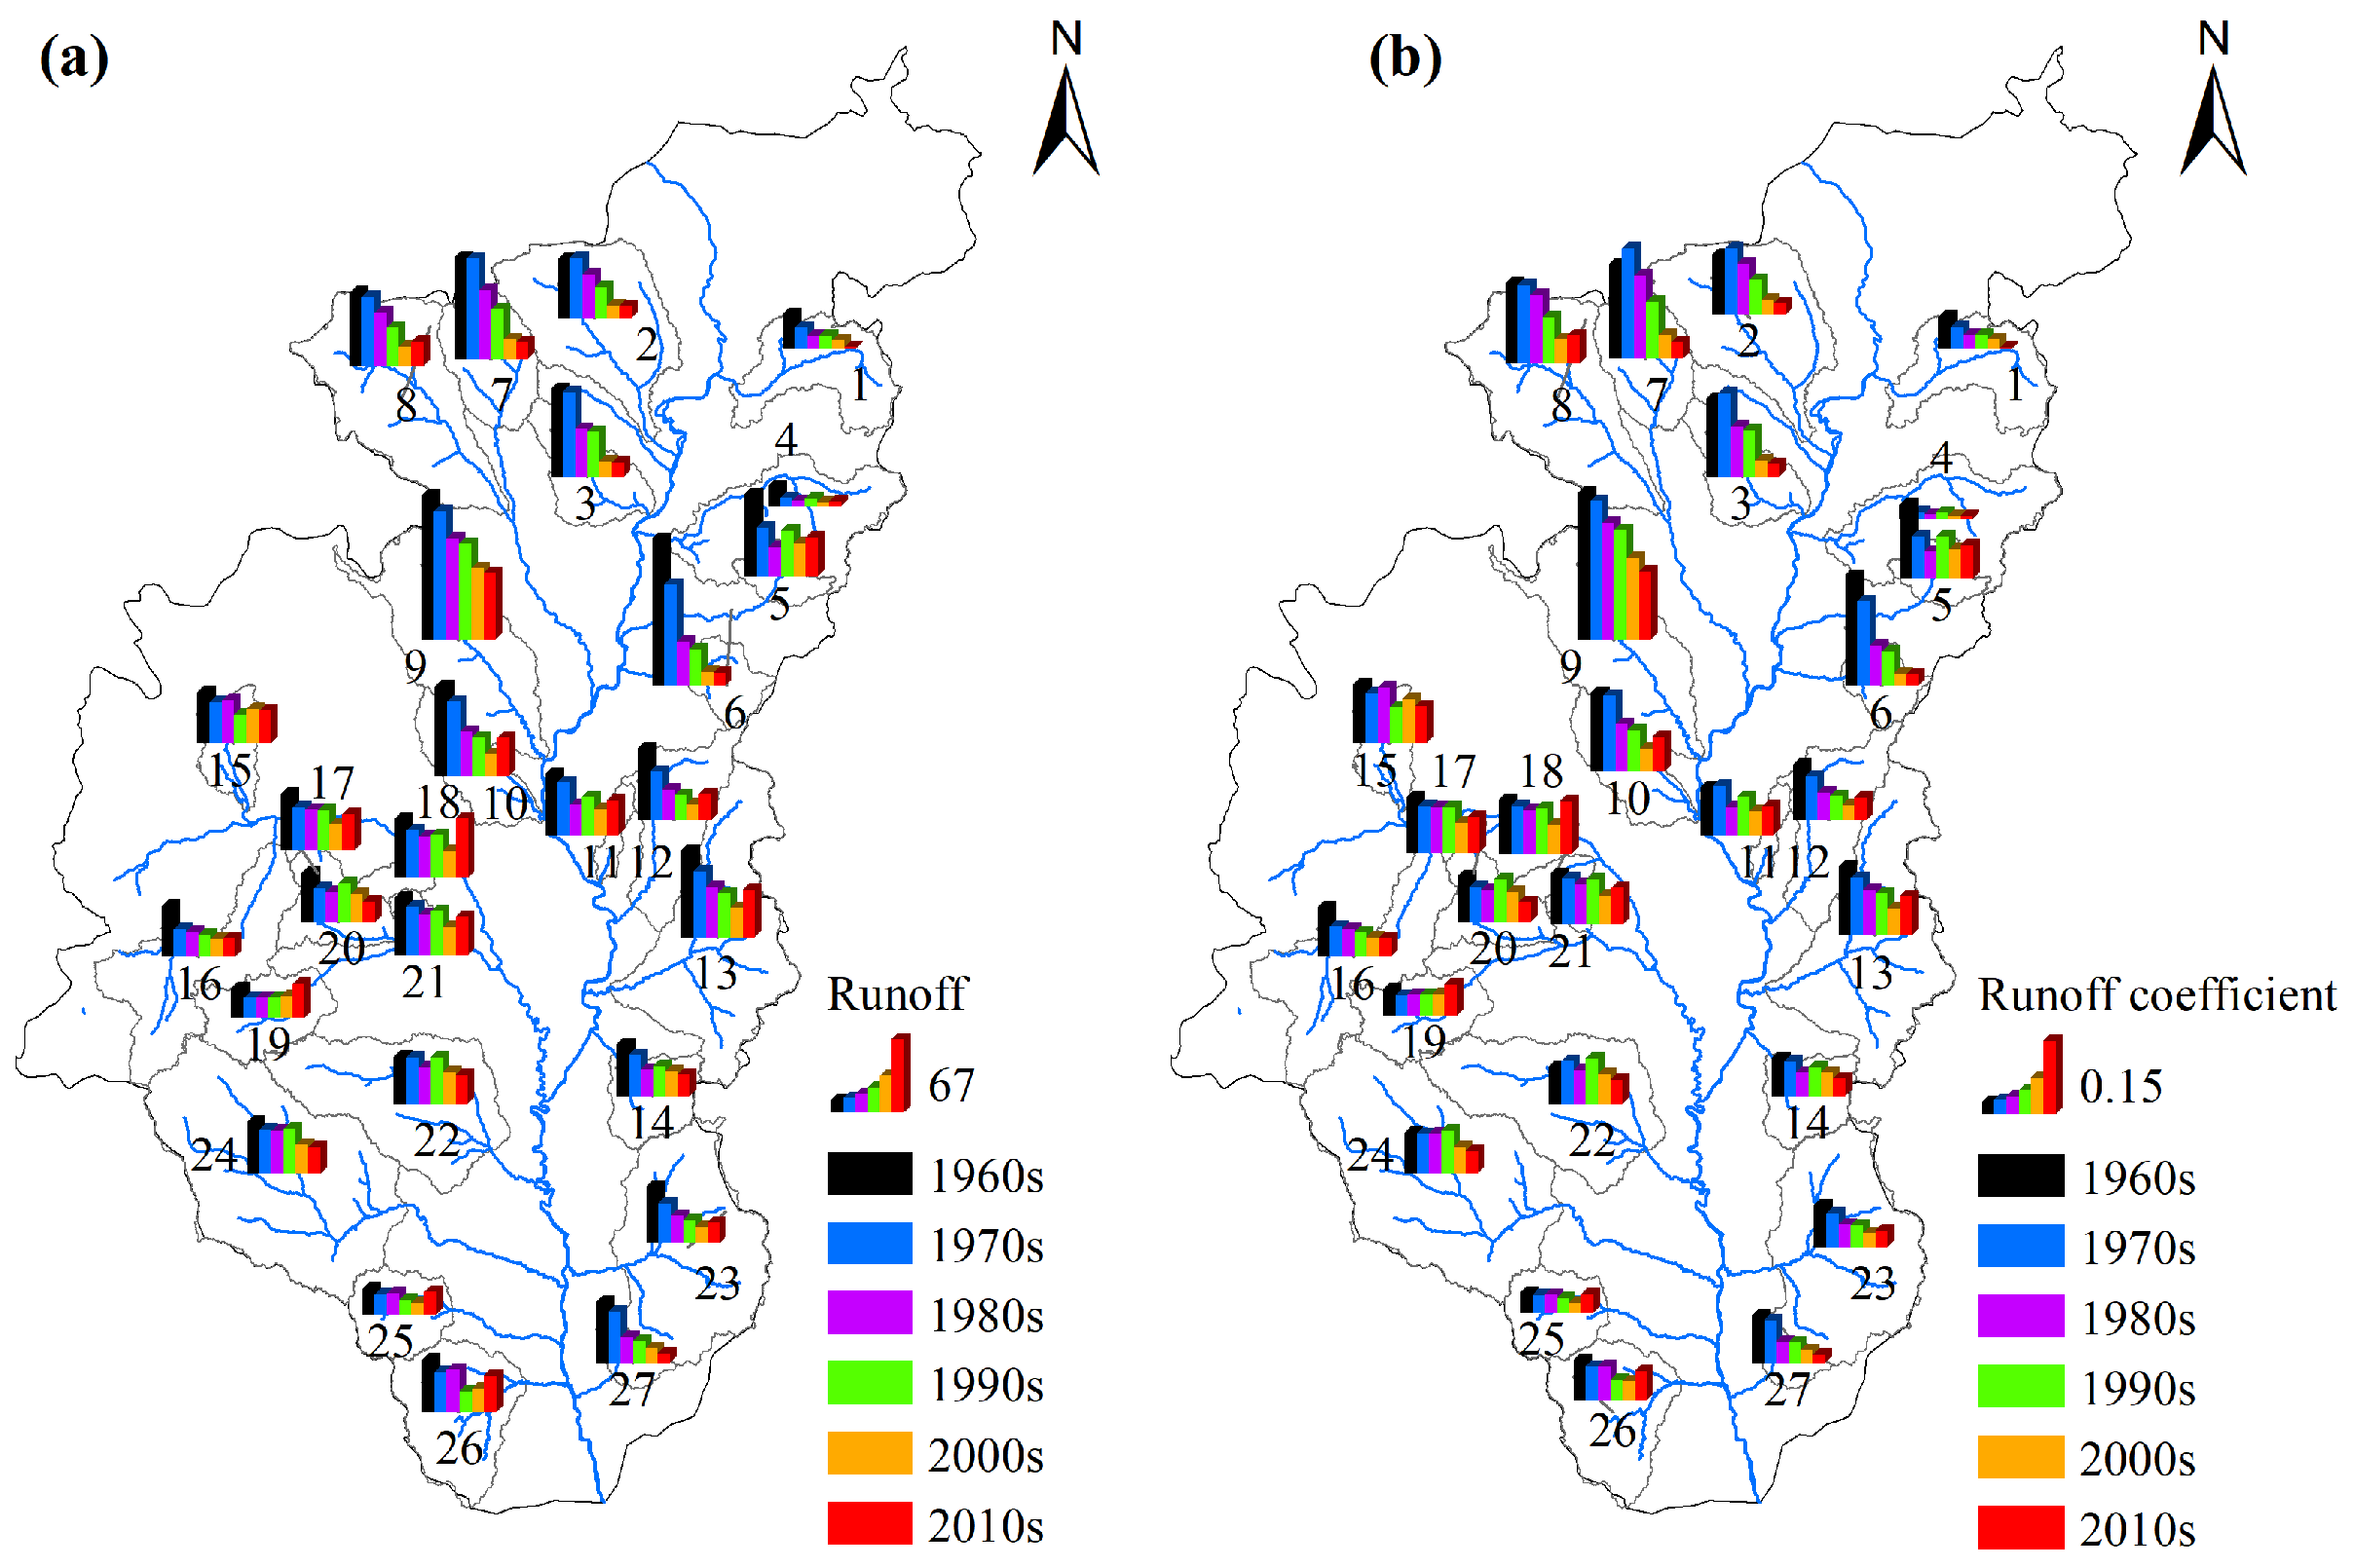
Figure 4 shows that average annual surface runoff and runoff coefficient both showed a significant decreasing trend, ranging from −0.17 to −2.46 mm per year (p < 0.01) and −0.01 to −0.041 per decade (p < 0.01) in the 27 catchments analyzed. When compared to the 1960s, surface runoff declined by 28.1% to 90.6% in the 2000s and by 12.8% to 95.5% in the 2010s. Similarly, runoff coefficients decreased by 20.2% to 89.0% in the 2000s and by 10.0% to 95.4% in the 2010s. A reduction of over 50% was observed in 20 of the catchments, with the Weifenhe, Gusanchuan, Bonuchua, and Huangfuchuan catchments showing reductions greater than 80%.
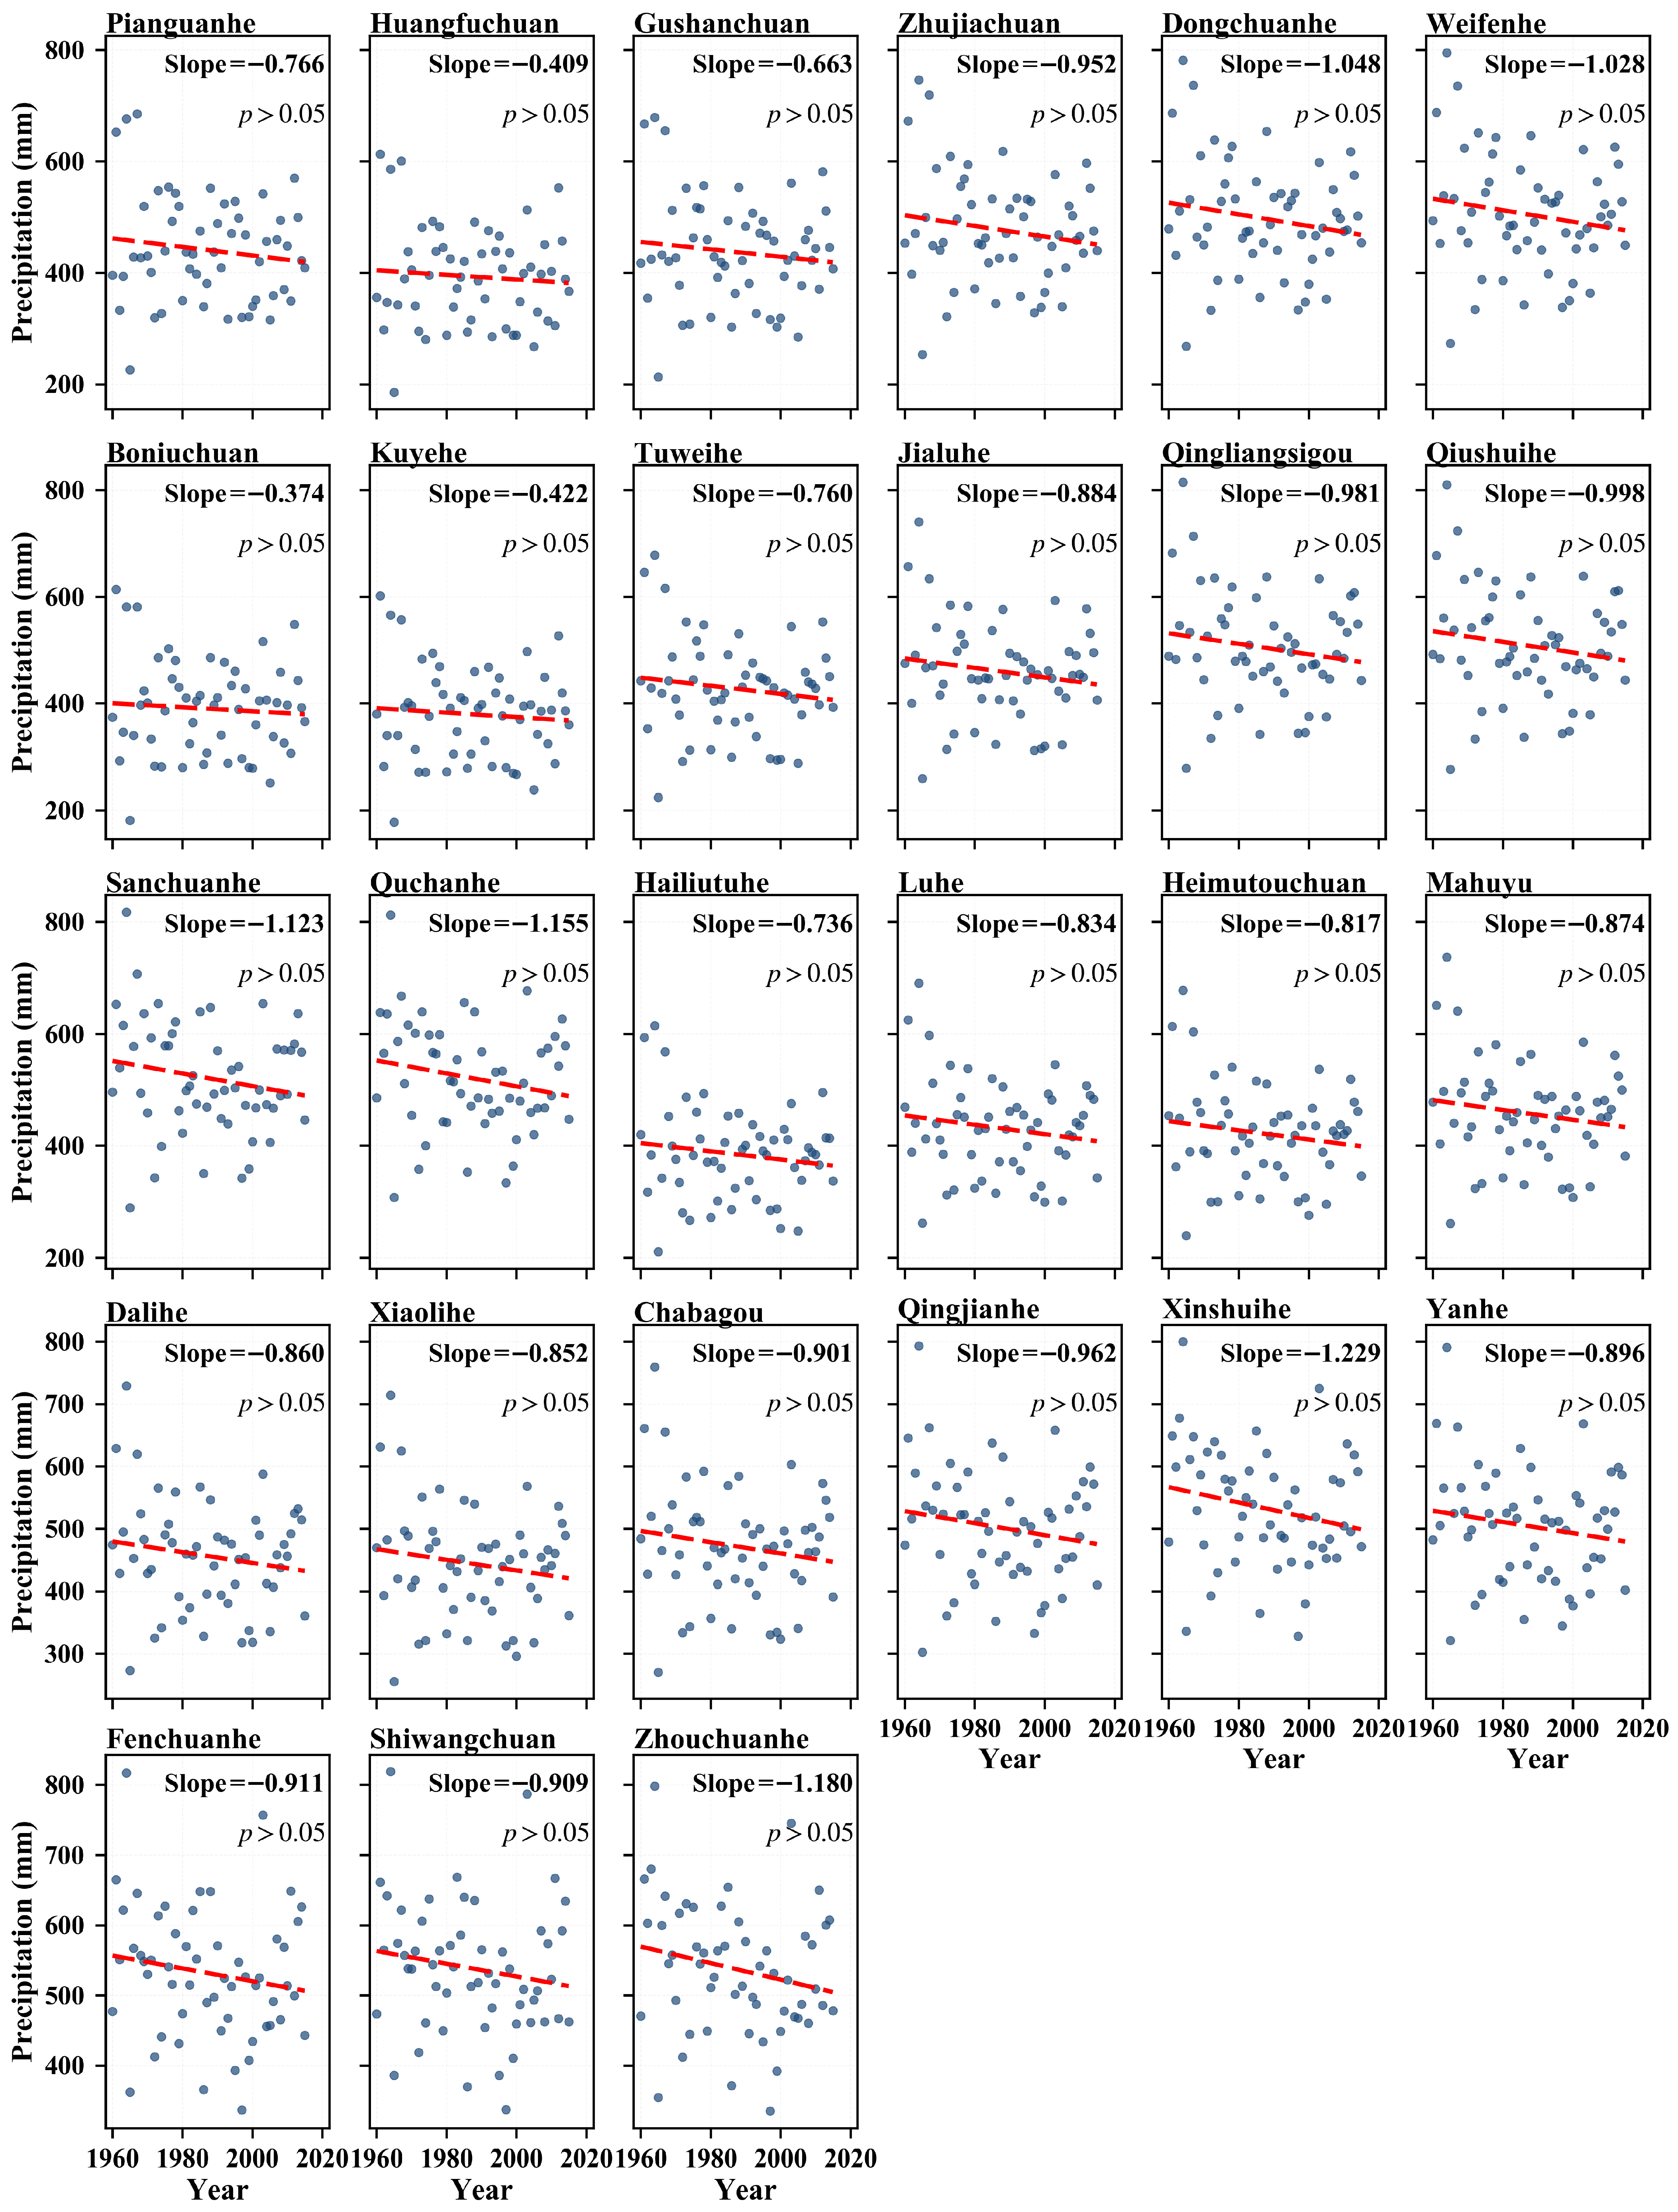
The trends of precipitation from 1960 to 2015 were analyzed to better understand climate change and water balance in the selected 27 catchments (Figure 5). As shown in Figure 5, the annual precipitation in these catchments presented non-significant change trends (p > 0.05).

3.2. Variations in the Landscape Patterns

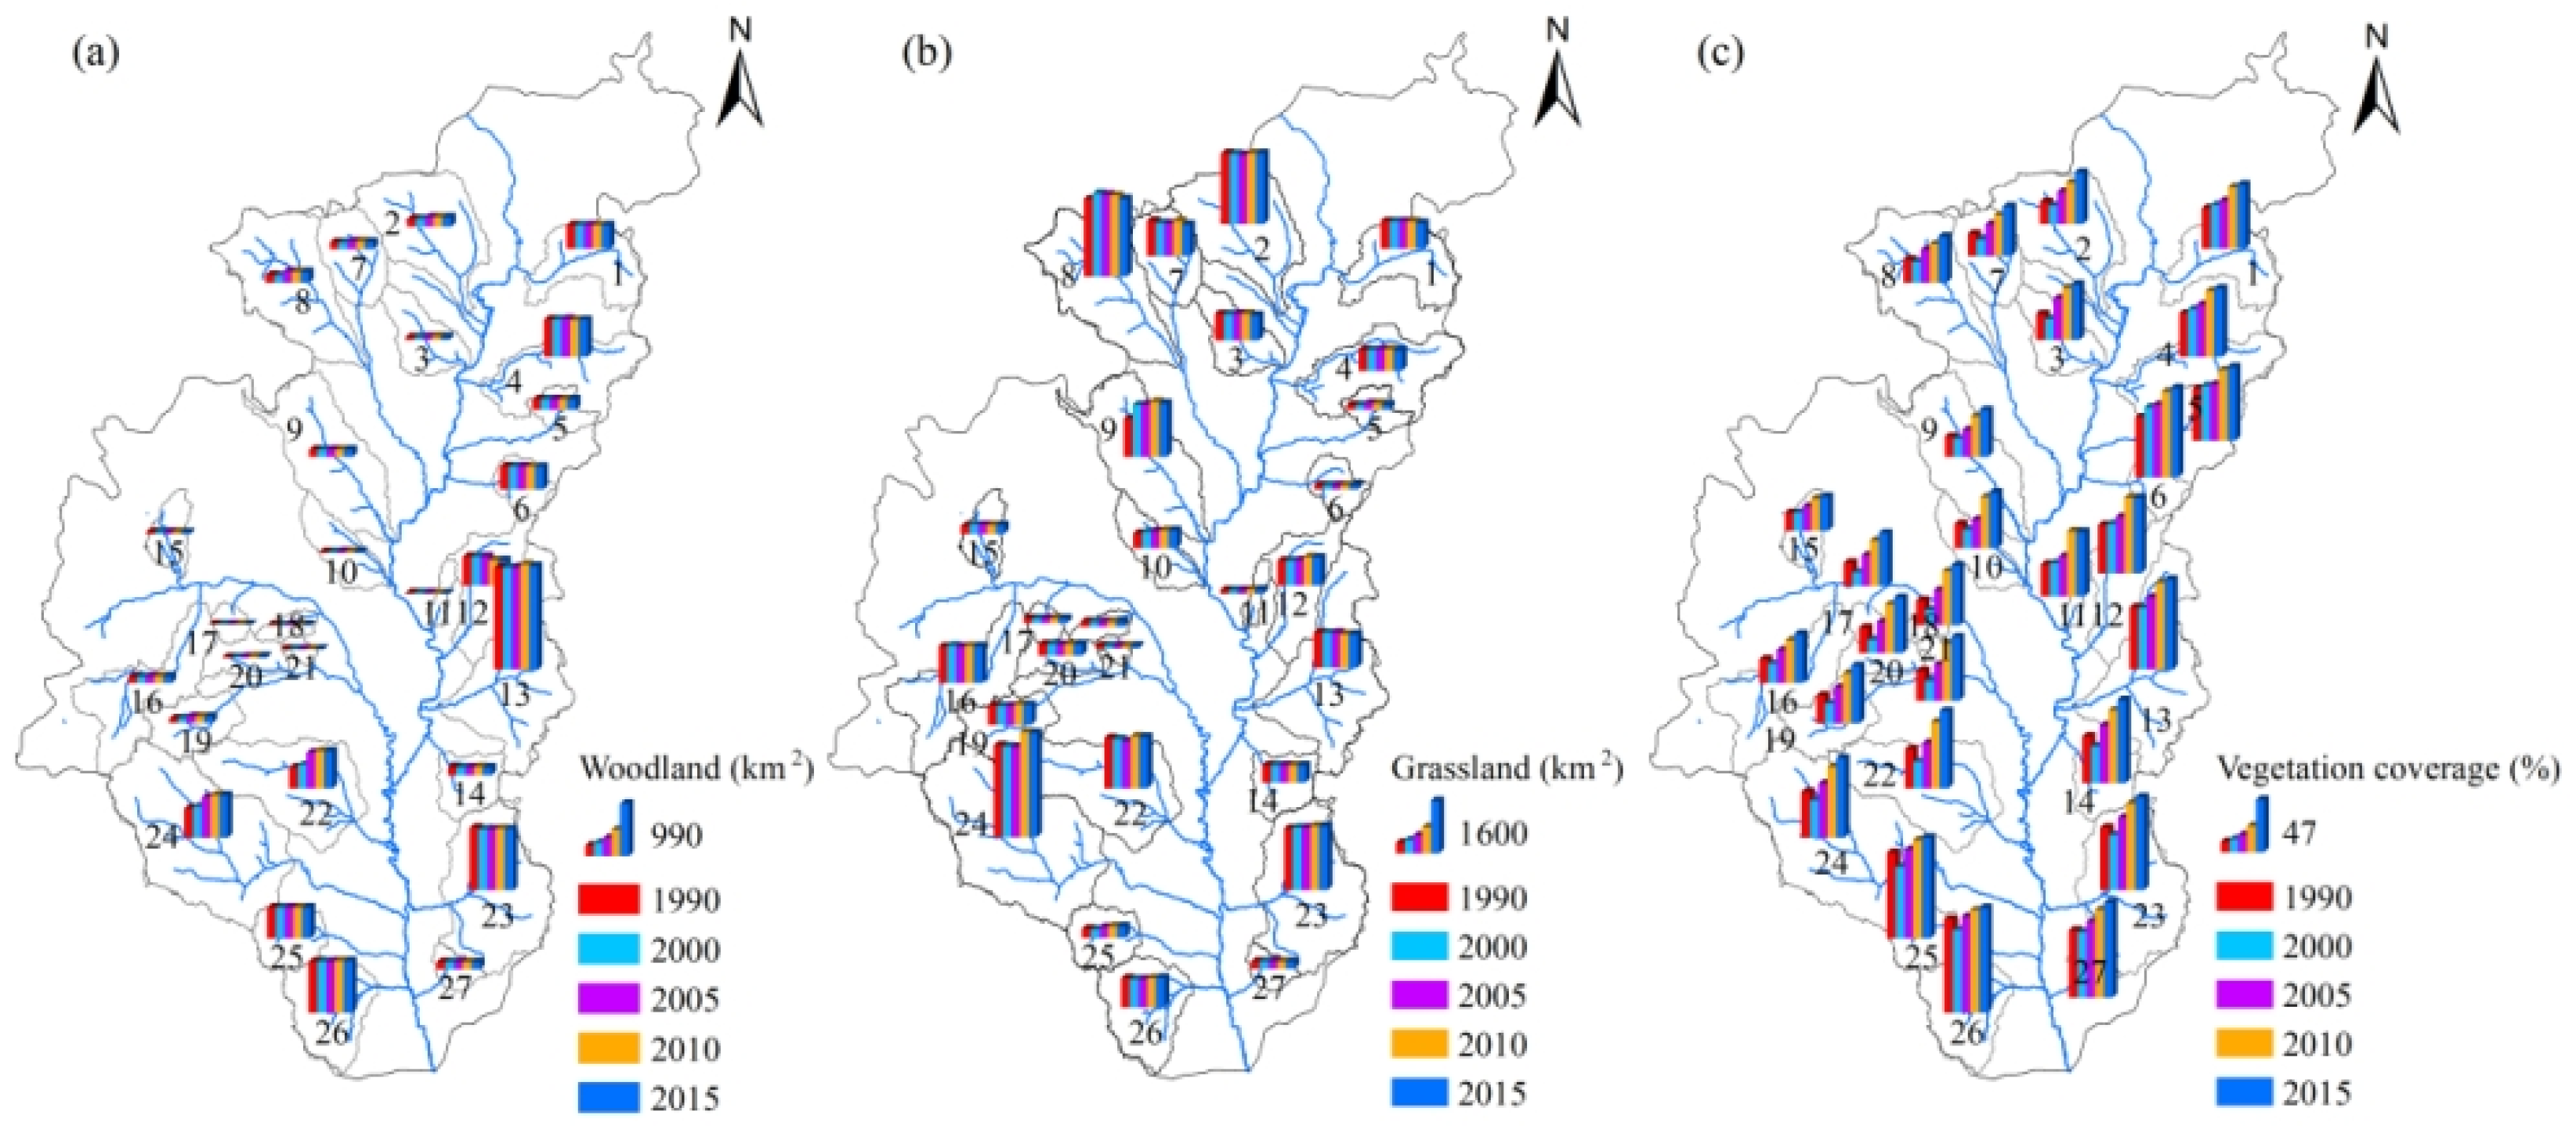
The GfG program has profoundly transformed the landscape of the study area by substantially reducing arable land while expanding forestland and grassland areas, driving a remarkable increase in vegetation coverage (Figure 6). Between 1990 and 2015, arable land decreased by 10.1%, whereas forest and grassland areas expanded by 8.1% and 6.8%, respectively. This land-use conversion has led to a striking improvement in vegetation coverage, which increased by 21.9% over the same period. Specifically, vegetation coverage exhibited steady growth from 35.5% in 1990 to 38.2% in 2000, surged to 52.2% in 2010, and reached 57.4% in 2015. Across the selected catchments, forest land area increased dramatically, with growth ranging from 1.5% to an extraordinary 78.5%. The Qingjianhe catchment experienced the largest gain, while the Yanhe and Fenhe catchments also demonstrated substantial increases exceeding 40%. Grassland area showed similarly notable expansion, ranging from 0.2% to 39.8%, with the Tuweihe catchment showing the highest increase, followed by the Yanhe catchment. Each catchment exhibited a steady rise in vegetation coverage, with increases between 10.3% and 34.7%. In comparison with the others, the Qingjianhe catchment showed the strongest growth, and the Yanhe and Chabugou catchments also achieved increases greater than 30%.
As shown in Table 4, the study area exhibited a trend from 1990 to 2015 characterized by lower connectivity, higher fragmentation, and enhanced diversity and heterogeneity. The largest patch index (LPI) decreased from 0.33% to 0.08%, and the aggregation index (AI) declined from 14.66% to 12.92%. The splitting index (SPLIT) showed a steady rise, suggesting a more dispersed distribution of landscape elements across the region. The increase in Euler nearest neighbors distance (ENN_MN) from 18,761.39 m to 35,426.32 m implies that previously proximate landscape types have become more isolated. Concurrently, the consistent increases in Shannon’s diversity index (SHDI) and Shannon’s evenness index (SHEI) together point to an ongoing enrichment of the landscape components and a more evenly spatial allocation.

3.3. Simulations on Surface Runoff Incorporating Landscape Effects

Table 5 presents the correlation analysis between runoff coefficient and landscape metrics during the study period. Most landscape metrics showed a significant correlation with runoff coefficient (p < 0.05). Specifically, patch density (PD), edge density (ED), mean perimeter-area ratio (PARA_MN), and perimeter area fractal dimension (PAFRAC) were positively correlated with runoff coefficient. In contrast, the largest patch index (LPI), mean patch size (AREA_MN), mean shape index (SHAPE_MN), and aggregation index (AI) exhibited negative correlations with runoff coefficient. The results, based on preliminary Pearson correlation analysis, confirm a strong association between runoff coefficients and landscape metrics. Consequently, these metrics were then selected as predictor variables in the partial least squares regression (PLSR) model to examine their relationship with surface runoff.
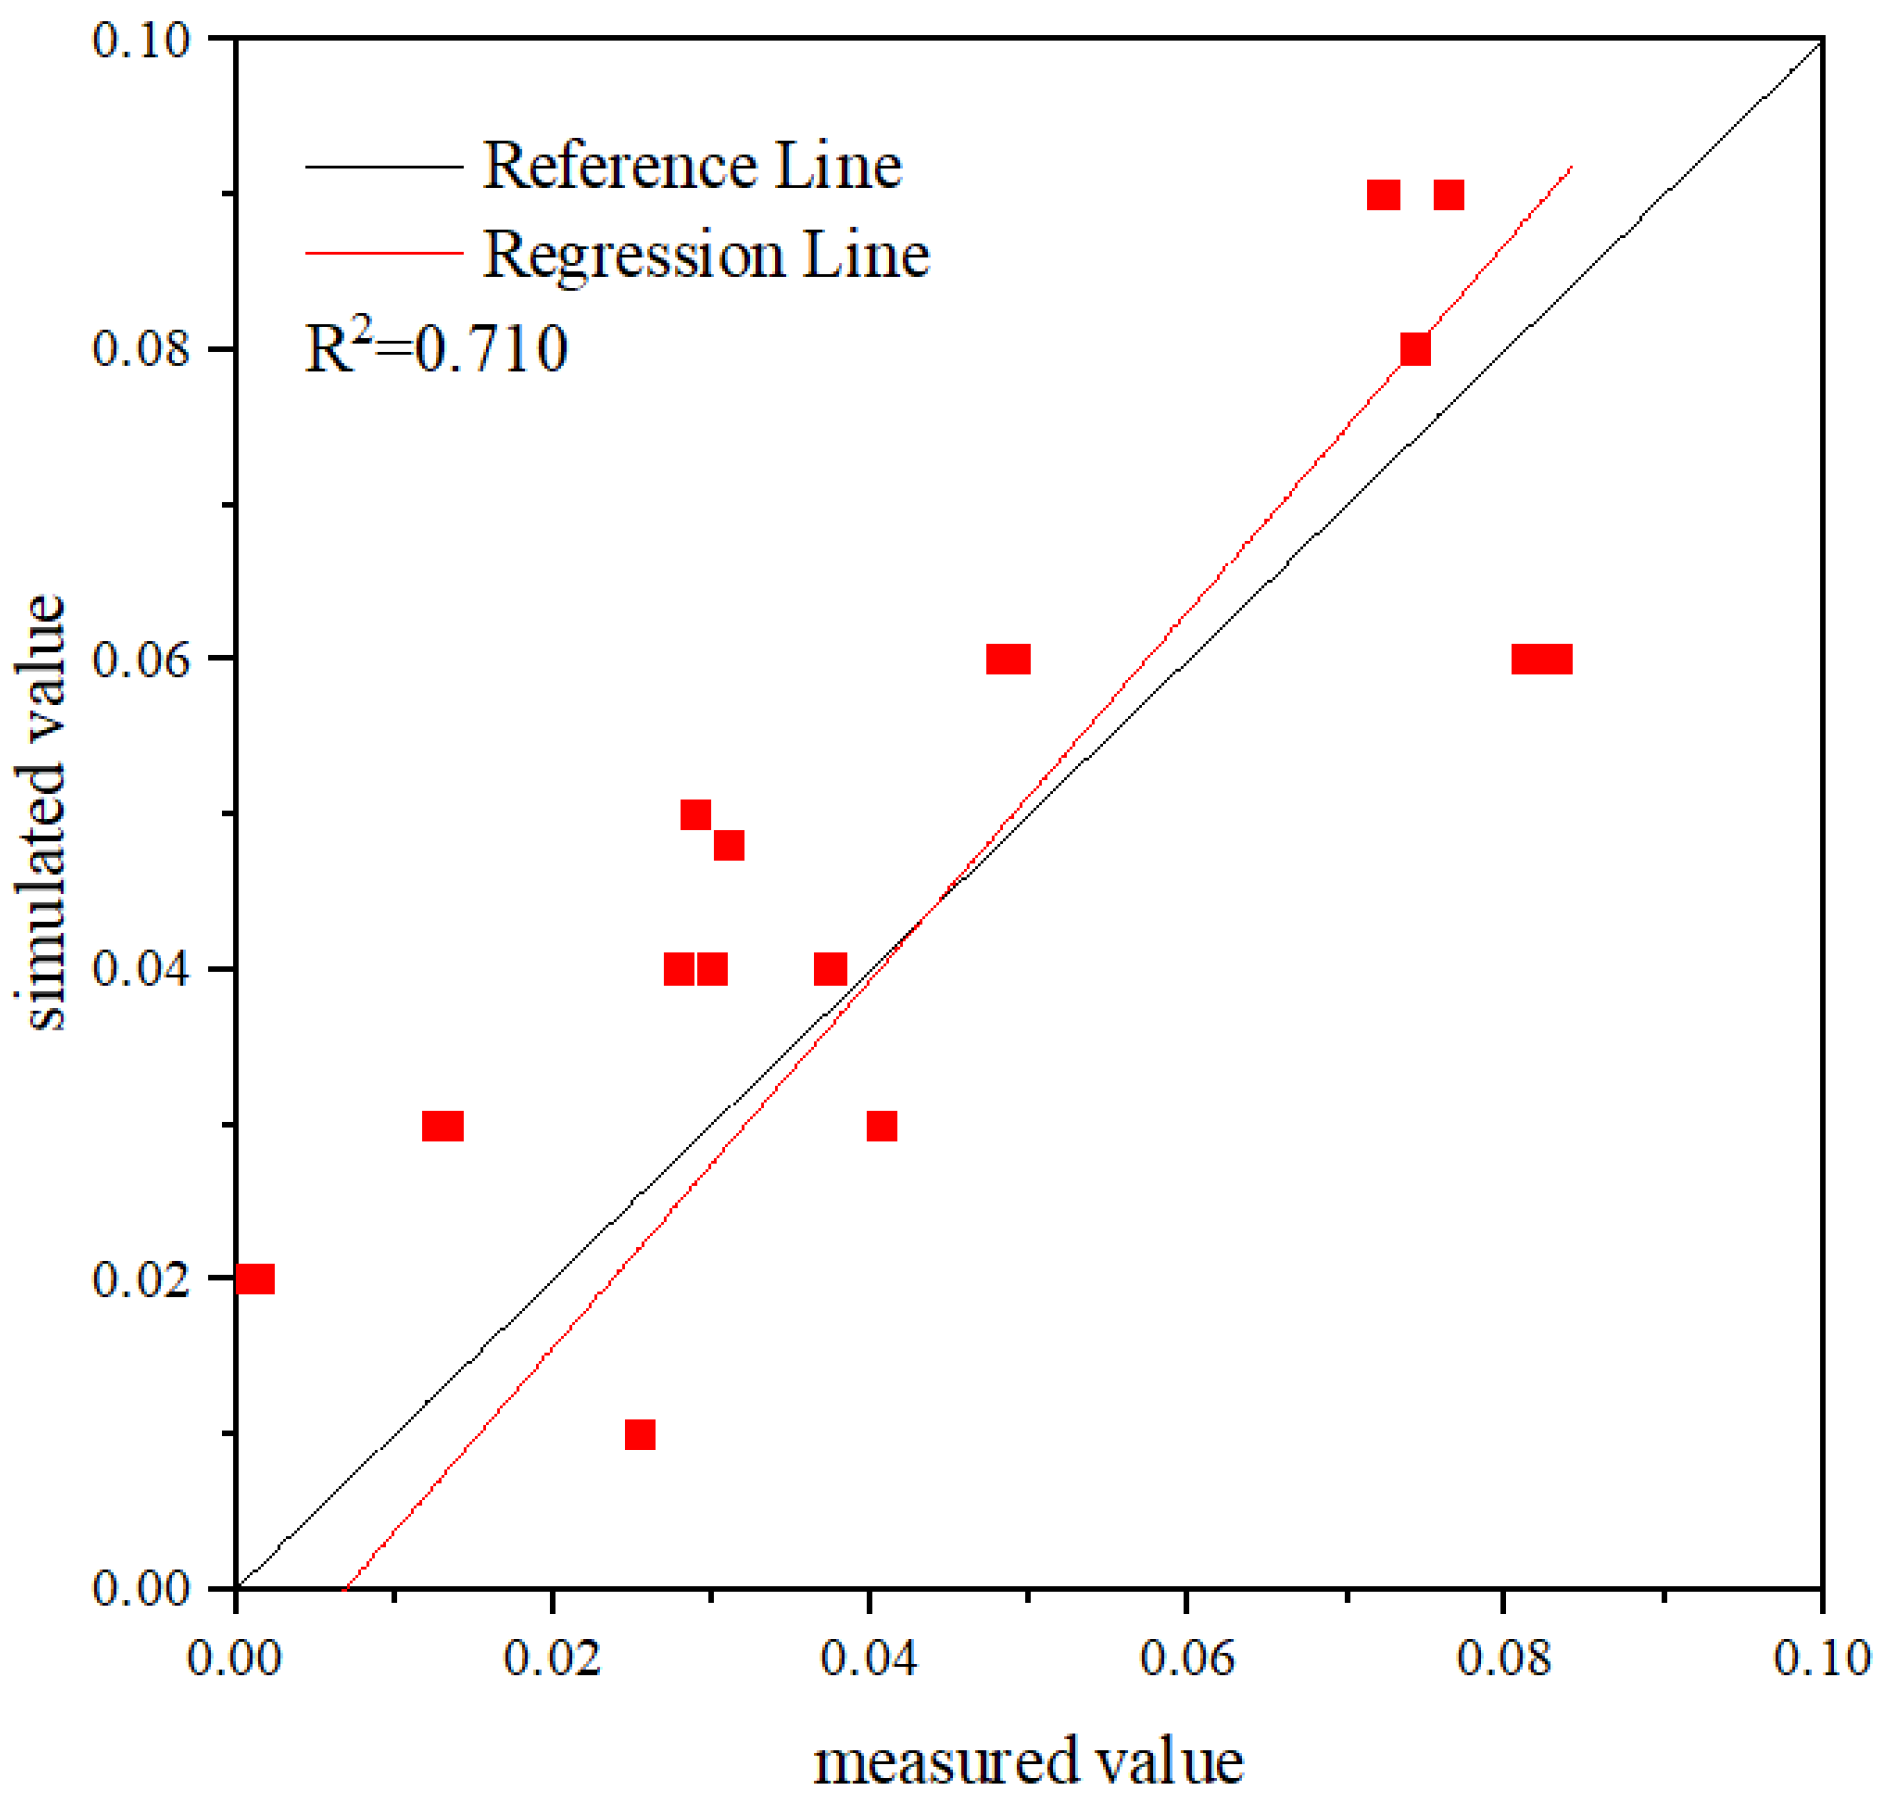
Table 6 summarizes the results of the PLSR model for landscape metrics and runoff coefficient. The first component explained 41.7% of the variance, and adding a second component increased the explained variance to 49.6%. Overall, landscape patterns accounted for 64.6% of the total variance in runoff coefficient. The Variable Importance in Projection (VIP) values highlighted the most influential metrics, with PAFRAC ranking highest (1.33), followed by PARA_MN (1.17), AI (1.10), ED (1.09), AREA_MN (1.07), PD (1.07), and SHAPE_MN (1.02), underscoring their significant contributions to runoff variation. The optimized PLSR model demonstrated robust predictive performance, with Q2 = 0.579 and R2 = 0.646, confirming its predictive accuracy. This model effectively estimates the runoff coefficient using landscape pattern indices (Figure 7), balancing explained variance and predictive performance.

3.4. Influencing Pathways of Landscape Patterns on Surface Runoff Variations

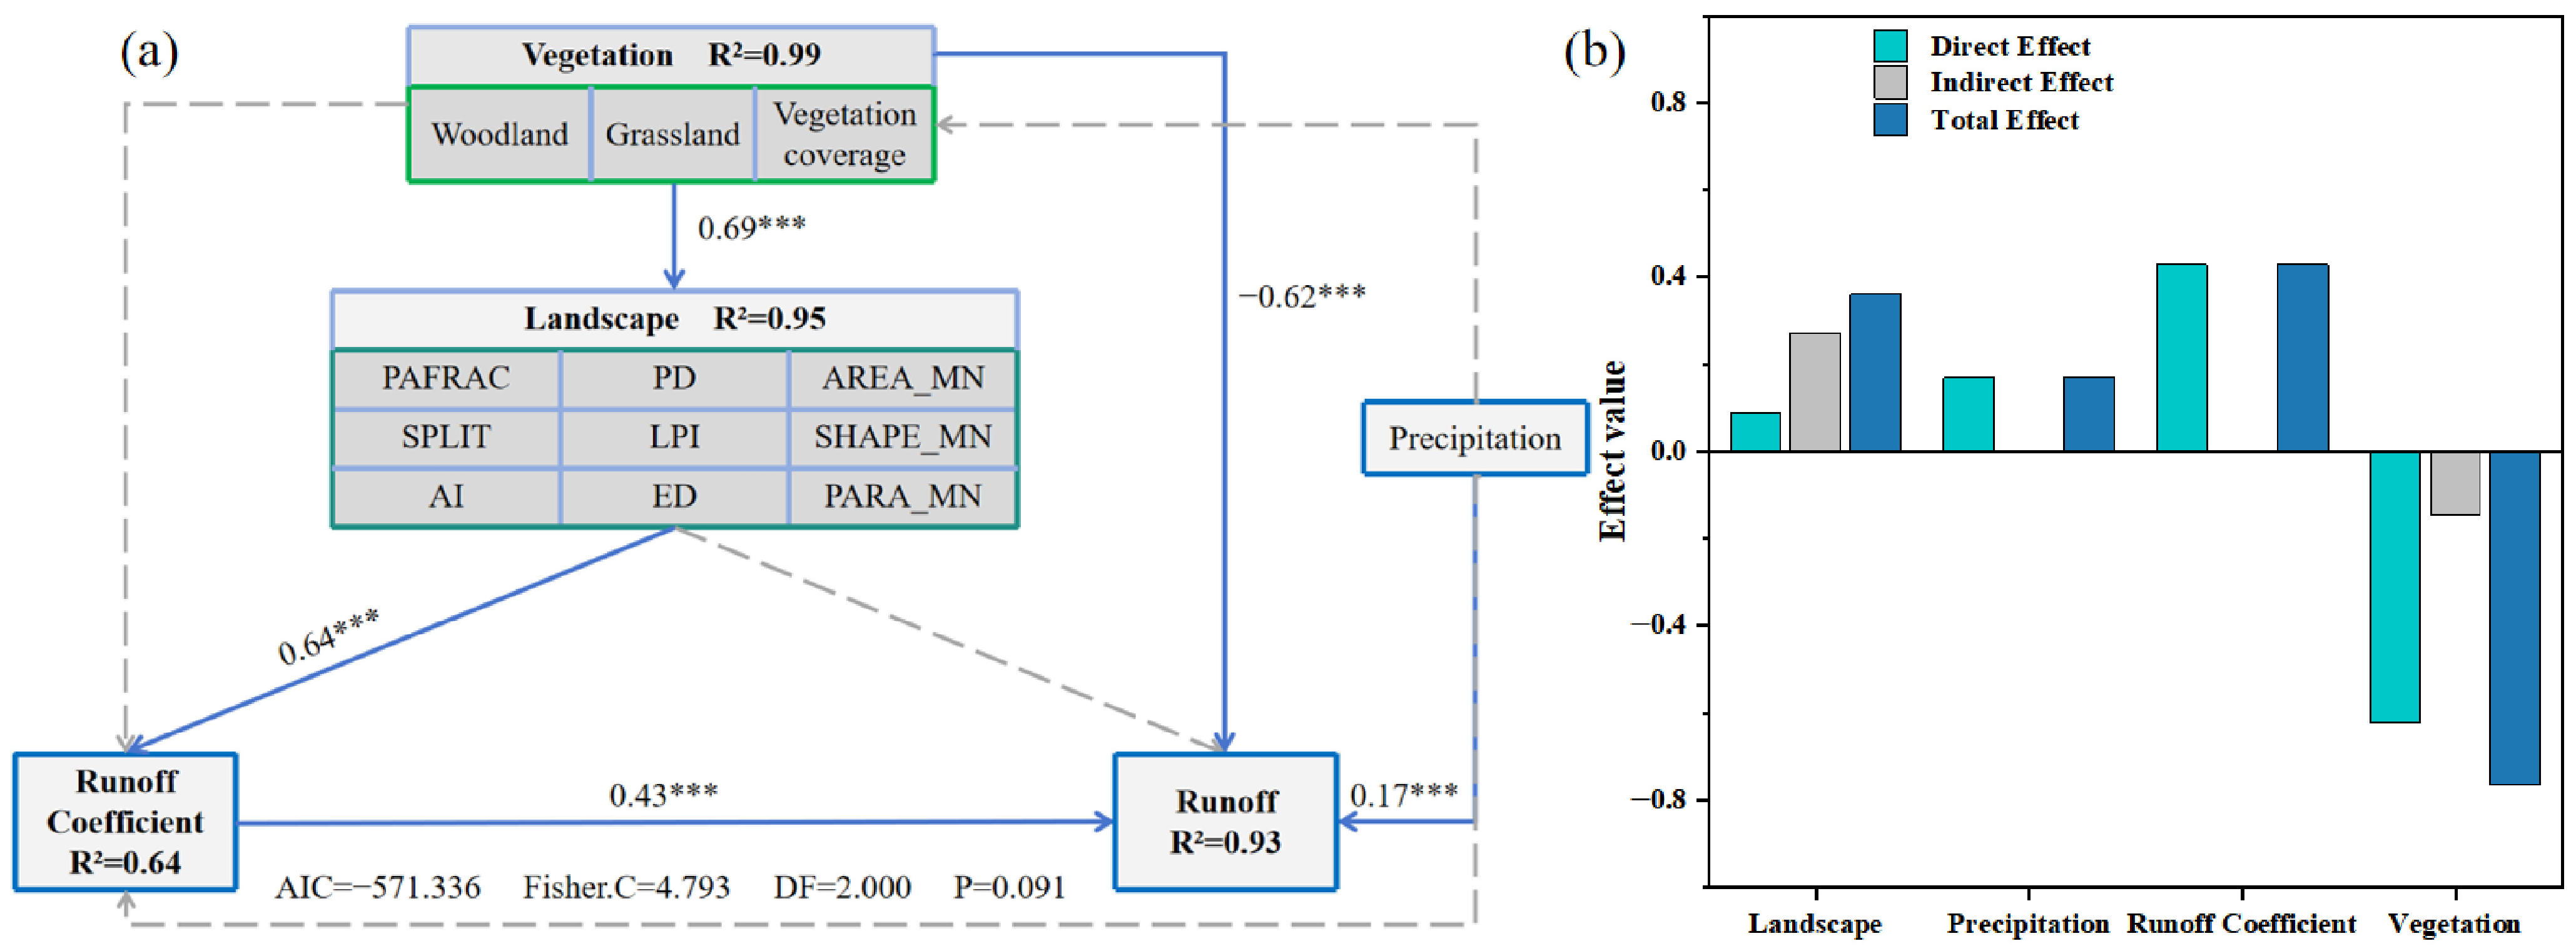
Variations in landscape patterns triggered by vegetation restoration have remarkably enhanced the vegetation coverage and structure complexity, potentially altering surface runoff processes. Consequently, the piecewiseSEM was applied to elucidate the influencing pathways from the key landscape metrics to the runoff dynamics within the Loess Plateau (Figure 8). The implementation of large-scale vegetation restoration measures has directly led to a substantial increase in vegetation greenness, the improvement of vegetation structure, and the expansion of woodland and grassland areas [47]. These changes have certainly modified the connectivity, fractal characteristic, and aggregation of vegetation patches, affecting the interactions between landscape elements (Figure 8a) and thus regulating runoff transport processes (Figure 8b). Simultaneously, increased surface roughness and infiltration capacity, as well as improved soil structure caused by vegetation restoration, play a direct role in precipitation redistribution and runoff generation, effectively reducing runoff volume. Notably, vegetation and landscape patterns exert a more pronounced influence on surface underlying conditions than other factors.

4. Discussion

4.1. Landscape Transformation and Hydrological Response Under Ecological Restoration

Landscape transformation in the Loess Plateau has been largely driven by China’s ecological restoration efforts, particularly through vegetation reconstruction [48]. These measures have substantially altered precipitation-runoff conversion processes within the catchments [49]. Focusing on the GFG project in the Chinese Loess Plateau, this study examined the increase in woodland and grassland areas and the overall enhancement of vegetation coverage. As demonstrated in this research and supported by studies such as those by Wang et al. [50], such landscape transformation would lead to decreased surface runoff. The hydrological mechanisms through which vegetation restoration reduces runoff involve multiple processes. Firstly, vegetation restoration significantly improves soil saturated hydraulic conductivity and infiltration capacity [51]. Secondly, it can increase canopy interception [52] and transpiration water consumption [53]. In addition, surface roughness prolongs runoff concentration time, creating more infiltration opportunities.
Based on these findings, this study proposes a novel approach to develop landscape metrics that integrate vegetation recovery status, land use changes, and green cover transformations into landscape unit delineation. The modifications in landscape pattern induced by restoration are evaluated using landscape metrics, revealing a close relationship between these metrics and the runoff coefficient. The study suggests that vegetation restoration strongly affects important landscape metrics, which in turn influence runoff generation and movement in the system (Figure 8). Furthermore, correlation analyses show that landscape metrics derived from these composite units have stronger associations with surface runoff than those based solely on land cover (Table 7). This approach improves the research framework by quantitatively connecting vegetation restoration to hydrological changes through landscape metrics, offering insights into vegetation-hydrology interactions and potential applications in other arid and semiarid regions with similar environmental characteristics.
When vegetation coverage decreases, runoff generally increases across various spatial scales. Conversely, increases in vegetation coverage reduce runoff at the slope, small catchment, and regional scales [54,55,56]. To improve the explanatory power of landscape-process models, this study incorporates topography, soil type, and land use into composite landscape unit construction. The resulting landscape patterns explain 65% of the variance in surface runoff, which is similar to the rate reported in earlier studies [57]. However, runoff reduction in the Loess Plateau results from multiple interacting factors beyond vegetation restoration. The region has simultaneously experienced climate variability, large-scale terracing, check dam construction, groundwater extraction, and other soil conservation measures [58]. Engineering measures such as terrace construction, check dams, and reservoir operations would intercept surface runoff and alter flow regimes. Groundwater extraction for agricultural and domestic use may further reduce baseflow contribution to streamflow. While landscape patterns explain 65% of runoff variation, the remaining 35% may be partially attributed to these unaccounted factors. This study’s findings reveal statistical associations and potential pathways, but establishing strict causal inference would require more rigorous approaches such as stage-wise attribution analysis or paired catchment comparisons. Future research could enhance model accuracy by incorporating weighted prioritization of landscape factors and might integrate multiple drivers, including climate variability and engineering interventions, into comprehensive analytical frameworks, advancing the understanding of complex interactions between landscape structure and hydrological dynamics.

4.2. Synergistic Effects of Climate and Landscape Patterns on Runoff Dynamics

Precipitation is the primary driver of runoff and a key determinant of its magnitude [59]. Landscape patterns influence runoff mainly through modulating the precipitation-runoff relationship. Even under unchanged landscape patterns, variations in precipitation intensity and distribution can lead to significant differences in runoff volumes [60]. Therefore, landscape patterns should be considered as modulators of precipitation-runoff interactions, rather than direct causes of runoff. To quantify this relationship, this study employs the runoff coefficient, a metric that reflects the combined influence of physical factors (e.g., topography, soil type, and land use) on runoff generation within a catchment. Correlation analysis indicates that landscape metrics show a stronger association with the runoff coefficient than with direct runoff measurements (Table 8). Path analysis reveals that while the direct effect of landscape patterns on runoff is not statistically significant, their indirect effect mediated through the runoff coefficient is both substantial and robust.
Besides precipitation, other climatic factors also play critical roles in regulating water budget and runoff dynamics [61,62]. The annual potential evapotranspiration decreased significantly (p < 0.05) from 1960 to 1990 and increased significantly (p < 0.001) during 1991–2013, whereas a non-significant (p > 0.05) increase was found from 1960 to 2013. Conversely, annual temperature showed non-significant increasing trends for the two sub-periods, while it increased significantly (p < 0.001) from 1960 to 2013 [63]. Rising temperatures accelerate evaporative losses from open water, soil, shallow groundwater, and vegetation, thereby reducing runoff. Concurrently, they also intensify snow and ice melt, which may temporarily increase runoff contribution. In this study, annual precipitation in 27 catchments showed inter-annual variability but no significant trend, while annual surface runoff and runoff coefficient both showed a significant decreasing trend (p < 0.05). This suggests that under stable precipitation, warming-induced evapotranspiration demand may independently contribute to runoff dynamics. In future research, incorporating these climatic variables into landscape-runoff models may enhance the accuracy and explanatory power.

4.3. Application and Optimization of Landscape Metrics in Hydrological Analysis

Landscape metrics are widely applied to analyze interactions between landscape patterns and ecological processes. These indices capture key landscape characteristics, such as edge length and fragmentation, which exhibit positive correlations with watershed runoff depth [64]. In contrast, higher landscape connectivity and diversity facilitate increased runoff generation [65]. Notably, intensified landscape fragmentation and heterogeneity significantly inhibit runoff processes [66], which is consistent with the results of this study. Slope runoff experiments further demonstrate that vegetation restoration (e.g., artificial forests and grasslands), compared to bare or agricultural land, significantly enhances surface roughness and hydraulic resistance, thereby reducing runoff energy and collectively suppressing runoff generation [67,68]. Furthermore, numerous studies have demonstrated that vegetation-induced landscape changes influence not only surface runoff but also groundwater storage, deep soil moisture, and base flow generation. For instance, Han et al. [30] revealed groundwater storage in the Loess Plateau significantly decreased (p < 0.01) during 2003–2015, and groundwater consumption is more intense in regions characterized by significant vegetation dynamics. Gou et al. [69] found that vegetation restoration reduced soil moisture in deep layers (200–1000 cm), with natural grassland maintaining higher deep soil moisture than planted forests. Yan et al. [70] reported that large-scale revegetation reduced both surface runoff and subsurface runoff in the 13 basins across the Loess Plateau. The decrease in surface runoff stemmed primarily from enhanced soil infiltration associated with revegetation and human interventions. For the subsurface flow, its decline was largely due to higher evapotranspiration from vegetation restoration.
While conventional landscape metrics have been widely used to assess surface runoff responses, weakening their ability to link landscape patterns with runoff dynamics, their ability to reflect hydrological changes remains less explored. Cao et al. [71] noted that afforestation in water-limited regions without considering hydrological conditions can lead to environmental degradation and water shortages. Future research should examine whether specific landscape metrics can serve as indicators for these subsurface hydrological responses, thereby extending the application of landscape metrics to more comprehensive hydrological assessments. These indices might be further refined by developing new metrics that more closely reflect hydrological processes and improving the representation of interactions among metrics, patterns, and processes. Such an integrated approach will deepen our understanding of their relationships. Additionally, using multiple landscape metrics collectively can provide a more comprehensive characterization of landscape patterns and establish clearer connections to specific ecological processes.

4.4. Limitations and Uncertainties

Despite the methodological innovations and meaningful findings of this study, several limitations and uncertainties should be acknowledged. First, due to the limited availability of high-resolution land cover and vegetation data, landscape pattern analysis was restricted to five discrete time points (1990, 2000, 2005, 2010, and 2015). This temporal resolution may not fully capture the continuous and dynamic nature of landscape changes driven by vegetation restoration. Additionally, the 30 m resolution of DEM and land cover data may not capture fine-scale topographic or land-use variations, and NDVI-derived vegetation coverage can be affected by atmospheric conditions and sensor calibration. Future studies should leverage time-series remote sensing data (e.g., Landsat or MODIS) with higher spatial and temporal resolution to enable more detailed monitoring of landscape evolution. Second, while the PLSR and piecewiseSEM models effectively identified key landscape metrics influencing runoff, they did not explicitly incorporate climatic variables such as temperature, potential evapotranspiration, or extreme weather events, which are known to modulate hydrological responses. Integrating these factors could enhance model robustness and predictive capacity. Moreover, although the PLSR method adequately addressed high multicollinearity among landscape metrics in this study, the collinearity reflects inherent redundancy in landscape pattern quantification. These metrics capture overlapping spatial structure rather than providing independent information. Future research should develop more orthogonal metrics or apply theory-based variable selection to reduce redundancy while maintaining ecological significance. Third, the mechanistic pathways through which landscape patterns influence runoff generation remain partially unresolved. The use of landscape indices alone may not fully reflect hydrological connectivity or processes. Future research should consider coupling landscape ecological approaches with process-based hydrological models (e.g., SWAT) to elucidate the physical mechanisms underlying runoff responses. Finally, this study was conducted in the Loess Plateau, a region with unique geomorphological and climatic characteristics. The extent to which these findings can be generalized to other ecologically fragile regions requires further comparative investigation. Addressing these limitations will contribute to a comprehensive understanding of landscape-hydrology interactions and support informed watershed management decisions.

5. Conclusions

This study applied optimized landscape metrics, PLSR, and piecewiseSEM to elucidate the long-term impacts of the GfG program on surface runoff, runoff coefficients, and landscape features within the 27 major catchments in the central Loess Plateau. The principal conclusions can be summarized as follows:
(1) Hydrological processes have undergone significant changes from 1960 to 2015. Both annual surface runoff and runoff coefficient decreased significantly (p < 0.01), at rates of −0.745 mm per year and −0.014 per decade, respectively. After the implementation of the GfG program, surface runoff decreased by 64.4% in the 2000s and 57.6% in the 2010s compared to the 1960s, whereas the runoff coefficient dropped by 58.2% and 55.8%, respectively. More than 50% runoff reductions were observed in 20 out of 27 catchments.
(2) Landscape structure exhibited pronounced transformation between 1990 and 2015. Cropland area decreased by 10.1%, while forestland and grassland areas expanded by 8.1% and 6.8%, respectively, accompanied by a 21.9% increase in vegetation coverage. Landscape patterns shifted toward higher fragmentation and heterogeneity, with LPI declining to 0.08% and SHDI showing a consistent rise.
(3) Quantitative linkages exist between landscape patterns and the runoff coefficient. The results of PLSR indicated that landscape patterns explained 64.6% of the variance in runoff coefficient, with PAFRAC, PARA_MN, and AI being the most influential metrics. The PiecewiseSEM model further revealed that vegetation restoration drives changes in landscape metrics, which subsequently impact runoff dynamics.

Author Contributions

Conceptualization, Y.S. and X.Y.; methodology, X.T.; software, X.T. and X.L.; validation, H.W.; formal analysis, Y.S., Y.Q. and H.W.; investigation, Y.S., X.T. and X.Y.; resources, X.T. and X.Y.; data curation, Y.Q. and X.Y.; writing—original draft preparation, Y.S.; writing—review and editing, Y.S. and X.Y.; visualization, X.L.; supervision, X.Y.; project administration, Y.S. and X.Y.; funding acquisition, Y.S. and X.Y. All authors have read and agreed to the published version of the manuscript.

Funding

This research was funded by the National Natural Science Foundation of China (Grant number 42107346), Nanxun Scholars Program for Young Scholars of ZJWEU (Grant number RC2024021162) and Students’ innovation and entrepreneurship training program of Zhejiang University of Water Resources and Electric Power (Grant number S202411481023).

Institutional Review Board Statement

Not applicable.

Informed Consent Statement

Not applicable.

Data Availability Statement

The data presented in this study are available on request from the corresponding author (the data are not publicly available due to privacy or ethical restrictions).

Conflicts of Interest

The authors declare no conflicts of interest.

References

  1. Zhou, S.; Yu, B.F.; Lintner, B.R.; Findell, K.L.; Zhang, Y. Projected increase in global runoff dominated by land surface changes. Nat. Clim. Change 2023, 13, 442–449. [Google Scholar] [CrossRef]
  2. Wang, S.P.; McVicar, T.R.; Zhang, Z.Q.; Brunner, T.; Strauss, P. Globally partitioning the simultaneous impacts of climate-induced and human-induced changes on catchment streamflow: A review and meta-analysis. J. Hydrol. 2020, 590, 125387. [Google Scholar] [CrossRef]
  3. Liu, K.; Li, X.K.; Wang, S.D.; Zhou, G.S. Past and future adverse response of terrestrial water storages to increased vegetation growth in drylands. npj Clim. Atmos. Sci. 2023, 6, 113. [Google Scholar] [CrossRef]
  4. Hoek van Dijke, A.J.; Herold, M.; Mallick, K.; Benedict, I.; Machwitz, M.; Schlerf, M.; Pranindita, A.; Theeuwen, J.J.E.; Bastin, J.F.; Teuling, A.J. Shifts in regional water availability due to global tree restoration. Nat. Geosci. 2022, 15, 363–368. [Google Scholar] [CrossRef]
  5. Li, C.J.; Fu, B.J.; Wang, S.; Stringer, L.C.; Wang, Y.P.; Li, Z.D.; Liu, Y.X.; Zhou, W.X. Drivers and impacts of changes in China’s drylands. Nat. Rev. Earth Environ. 2021, 2, 858–873. [Google Scholar] [CrossRef]
  6. Wei, C.; Dong, X.H.; Ma, Y.M.; Leng, M.H.; Zhao, W.Y.; Zhang, C.Y.; Yu, D.; Su, B. Relationships between Landscape Patterns and Hydrological Processes in the Subtropical Monsoon Climate Zone of Southeastern China. Remote Sens. 2023, 15, 2290. [Google Scholar] [CrossRef]
  7. Ludwig, J.A.; Wilcox, B.P.; Breshears, D.D.; Tongway, D.J.; Imeson, A.C. Vegetation patches and runoff-erosion as interacting ecohydrological processes in semiarid landscapes. Ecology 2005, 86, 288–297. [Google Scholar] [CrossRef]
  8. Shanafield, M.; Gutiérrez-Jurado, H.; Rodríguez-Burgueño, J.E.; Ramírez-Hernández, J.; Jarchow, C.J.; Nagler, P.L. Short- and long-term evapotranspiration rates at ecological restoration sites along a large river receiving rare flow events. Hydrol. Process. 2017, 31, 4328–4337. [Google Scholar] [CrossRef]
  9. Bai, R.H.; Wang, X.Z.; Li, J.W.; Yang, F.; Shangguan, Z.P.; Deng, L. The impact of vegetation reconstruction on soil erosion in the Loess plateau. J. Environ. Manag. 2024, 363, 121382. [Google Scholar] [CrossRef]
  10. Yang, X.N.; Sun, W.Y.; Mu, X.M.; Gao, P.; Zhao, G.J. Run-off affected by climate and anthropogenic changes in a large semi-arid river basin. Hydrol. Process. 2020, 34, 1906–1919. [Google Scholar] [CrossRef]
  11. Shi, Z.H.; Ai, L.; Li, X.; Huang, X.D.; Wu, G.L.; Liao, W. Partial least-squares regression for linking land-cover patterns to soil erosion and sediment yield in watersheds. J. Hydrol. 2013, 498, 165–176. [Google Scholar] [CrossRef]
  12. Li, J.; Zhou, Z.X. Coupled analysis on landscape pattern and hydrological processes in Yanhe watershed of China. Sci. Total Environ. 2015, 505, 927–938. [Google Scholar] [CrossRef]
  13. Boongaling, C.G.K.; Faustino-Eslava, D.V.; Lansigan, F.P. Modeling land use change impacts on hydrology and the use of landscape metrics as tools for watershed management: The case of an ungauged catchment in the Philippines. Land Use Policy 2018, 72, 116–128. [Google Scholar] [CrossRef]
  14. Wen, B.J.; Duan, G.H.; Lu, J.X.; Zhou, R.L.; Ren, H.Y.; Wen, Z.M. Response relationship between vegetation structure and runoff-sediment yield in the hilly and gully area of the Loess Plateau, China. Catena 2023, 227, 107107. [Google Scholar] [CrossRef]
  15. Zhang, Z.C.; Chen, X.; Huang, Y.Y.; Zhang, Y.F. Effect of catchment properties on runoff coefficient in a karst area of southwest China. Hydrol. Process. 2014, 28, 3691–3702. [Google Scholar] [CrossRef]
  16. Massari, C.; Pellet, V.; Tramblay, Y.; Crow, W.T.; Gründemann, G.J.; Hascoet, T.; Penna, D.; Modanesi, S.; Brocca, L.; Camici, S.; et al. On the relation between antecedent basin conditions and runoff coefficient for European floods. J. Hydrol. 2023, 625, 130012. [Google Scholar] [CrossRef]
  17. Long, J.; Nelson, T.; Wulder, M. Regionalization of Landscape Pattern Indices Using Multivariate Cluster Analysis. Environ. Manag. 2010, 46, 134–142. [Google Scholar] [CrossRef]
  18. Hu, Y.T.; Zhang, F.; Luo, Z.Z.; Badreldin, N.; Benoy, G.; Xing, Z.S. Soil and water conservation effects of different types of vegetation cover on runoff and erosion driven by climate and underlying surface conditions. Catena 2023, 231, 107347. [Google Scholar] [CrossRef]
  19. Corry, R.C.; Nassauer, J.I. Limitations of using landscape pattern indices to evaluate the ecological consequences of alternative plans and designs. Landsc. Urban Plan. 2005, 72, 265–280. [Google Scholar] [CrossRef]
  20. Li, Z.W.; Xu, X.L.; Wang, K.L. Effects of distribution patterns of karst landscapes on runoff and sediment yield in karst watersheds. Catena 2023, 223, 106947. [Google Scholar] [CrossRef]
  21. Wu, J.H.; Lu, J. Spatial scale effects of landscape metrics on stream water quality and their seasonal changes. Water Res. 2021, 191, 116811. [Google Scholar] [CrossRef]
  22. Yohannes, H.; Soromessa, T.; Argaw, M.; Dewan, A. Impact of landscape pattern changes on hydrological ecosystem services in the Beressa watershed of the Blue Nile Basin in Ethiopia. Sci. Total Environ. 2021, 793, 148559. [Google Scholar] [CrossRef]
  23. Zhang, T.J.; Chen, Y.N. The effects of landscape change on habitat quality in arid desert areas based on future scenarios: Tarim River Basin as a case study. Front. Plant Sci. 2022, 13, 1031859. [Google Scholar] [CrossRef] [PubMed]
  24. Qin, Y.L.; Shi, P.; Hu, Y.; Li, Q.; Wang, Y.P.; Wang, Q.Q.; Zhou, D.D. Landscape indices explain different responses of runoff and sediment yield to land use/cover change on the Loess Plateau, China. Catena 2025, 249, 108674. [Google Scholar] [CrossRef]
  25. Wang, W.; Sun, L.; Luo, Y. Changes in Vegetation Greenness in the Upper and Middle Reaches of the Yellow River Basin over 2000–2015. Sustainability 2019, 11, 2176. [Google Scholar] [CrossRef]
  26. Xiao, J.F. Satellite evidence for significant biophysical consequences of the “Grain for Green” Program on the Loess Plateau in China. J. Geophys. Res.-Biogeosci. 2014, 119, 2261–2275. [Google Scholar] [CrossRef]
  27. Ni, Y.X.; Yu, Z.B.; Lv, X.Z.; Ma, L.; Zhang, Q.F.; Wang, J.W. Response of runoff to vegetation change in typical basin of the Loess Plateau. Ecol. Eng. 2022, 182, 106704. [Google Scholar] [CrossRef]
  28. Yang, Y.Y.; Li, Z.B.; Li, P.; Ren, Z.P.; Gao, H.D.; Wang, T.; Xu, G.C.; Yu, K.X.; Shi, P.; Tang, S.S. Variations in runoff and sediment in watersheds in loess regions with different geomorphologies and their response to landscape patterns. Environ. Earth Sci. 2017, 76, 517. [Google Scholar] [CrossRef]
  29. Zhang, S.H.; Fan, W.W.; Li, Y.Q.; Yi, Y.J. The influence of changes in land use and landscape patterns on soil erosion in a watershed. Sci. Total Environ. 2017, 574, 34–45. [Google Scholar] [CrossRef]
  30. Han, Z.M.; Huang, S.Z.; Huang, Q.; Bai, Q.J.; Leng, G.Y.; Wang, H.; Zhao, J.; Wei, X.T.; Zheng, X.D. Effects of vegetation restoration on groundwater drought in the Loess Plateau, China. J. Hydrol. 2020, 591, 125566. [Google Scholar] [CrossRef]
  31. Fu, B.; Wang, S.; Liu, Y.; Liu, J.; Liang, W.; Miao, C. Hydrogeomorphic Ecosystem Responses to Natural and Anthropogenic Changes in the Loess Plateau of China. Annu. Rev. Earth Planet. Sci. 2017, 45, 223–243. [Google Scholar] [CrossRef]
  32. Guo, J.; Fan, L.X.; Feng, P.F.; Sun, X.L.; Xue, S. Response of vegetation evapotranspiration to landscape pattern changes in an arid region: A case study of the Loess Plateau, China. Catena 2025, 252, 108878. [Google Scholar] [CrossRef]
  33. Peel, M.C.; Finlayson, B.L.; McMahon, T.A. Updated world map of the Koppen-Geiger climate classification. Hydrol. Earth Syst. Sci. 2007, 11, 1633–1644. [Google Scholar] [CrossRef]
  34. Wen, M.; Cheng, D.D.; Song, J.X.; Zhang, G.T.; Lai, W.L.; Jiang, W.W. Impacts of climate change on aridity index and its spatiotemporal variation in the Loess Plateau of China, from 1961 to 2014. Environ. Earth Sci. 2018, 77, 137. [Google Scholar] [CrossRef]
  35. Liu, J.Y.; Zhang, Z.X.; Zhuang, D.F.; Wang, Y.M.; Zhou, W.C.; Zhang, S.W.; Li, R.D.; Jiang, N.; Wu, S.X. A study on the spatial-temporal dynamic changes of land-use and driving forces analyses of China in the1990s. Geogr. Res. 2003, 22, 1–12. [Google Scholar]
  36. Tang, K.L.; Zhang, K.L.; Aling, L. Critical slope gradient for compulsory abandonment of farmland on the hilly Loess Plateau. Chin. Sci. Bull. 1998, 43, 409–412. [Google Scholar] [CrossRef]
  37. Jiang, D.S.; Huang, G.J. Simulation experiment on the influence of ground slope on precipitation infiltration. Bull. Soil Water Conserv. 1984, 10–13. [Google Scholar] [CrossRef]
  38. Pan, C.Z.; Shangguan, Z.P. Experimental study on runoff and erosion processes on vegetation slope. In Proceedings of the 9th International Symposium on River Sedimentation, Yichang, China, 18–21 October 2004; pp. 2330–2334. [Google Scholar]
  39. Lei, T.W.; Zhang, Q.W.; Zhao, J.; Xia, W.S.; Pan, Y.H. Soil detachment rates for sediment loaded flow in rills. Trans. ASAE 2002, 45, 1897–1903. [Google Scholar] [CrossRef]
  40. Wu, L.; Peng, M.L.; Qiao, S.S.; Ma, X.Y. Effects of rainfall intensity and slope gradient on runoff and sediment yield characteristics of bare loess soil. Environ. Sci. Pollut. Res. 2018, 25, 3480–3487. [Google Scholar] [CrossRef]
  41. Chen, Y.P.; Wang, K.B.; Fu, B.J.; Wang, Y.F.; Tian, H.W.; Wang, Y.; Zhang, Y. 65% cover is the sustainable vegetation threshold on the Loess Plateau. Environ. Sci. Ecotechnol. 2024, 22, 100442. [Google Scholar] [CrossRef]
  42. McGarigal, K.; Wan, H.Y.; Zeller, K.A.; Timm, B.C.; Cushman, S.A. Multi-scale habitat selection modeling: A review and outlook. Landsc. Ecol. 2016, 31, 1161–1175. [Google Scholar] [CrossRef]
  43. Wold, S.; Sjöström, M.; Eriksson, L. PLS-regression: A basic tool of chemometrics. Chemom. Intell. Lab. Syst. 2001, 58, 109–130. [Google Scholar] [CrossRef]
  44. Roy, P.P.; Roy, K. On some aspects of variable selection for partial least squares regression models. QSAR Comb. Sci. 2008, 27, 302–313. [Google Scholar] [CrossRef]
  45. Lefcheck, J.S. PIECEWISESEM: Piecewise structural equation modelling in R for ecology, evolution, and systematics. Methods Ecol. Evol. 2016, 7, 573–579. [Google Scholar] [CrossRef]
  46. Shipley, B. The AIC model selection method applied to path analytic models compared using a d-separation test. Ecology 2013, 94, 560–564. [Google Scholar] [CrossRef]
  47. Rosier, I.; Diels, J.; Somers, B.; Van Orshoven, J. Maximising runoff retention by vegetated landscape elements positioned through spatial optimisation. Landsc. Urban Plan. 2024, 243, 104968. [Google Scholar] [CrossRef]
  48. Miao, J.D.; Zhang, X.M.; Zhao, Y.; Wei, T.X.; Yang, Z.; Li, P.; Zhang, Y.E.; Chen, Y.X.; Wang, Y.S. Evolution patterns and spatial sources of water and sediment discharge over the last 70 years in the Yellow River, China: A case study in the Ningxia Reach. Sci. Total Environ. 2022, 838, 155952. [Google Scholar] [CrossRef] [PubMed]
  49. Zhang, S.Y.; Zhao, G.J.; Mu, X.M.; Tian, P.; Gao, P.; Sun, W. Changes in streamflow regimes and their responses to different soil and water conservation measures in the Loess Plateau watersheds, China. Hydrol. Process. 2021, 35, e14401. [Google Scholar] [CrossRef]
  50. Wang, W.; Zhang, Y.Y.; Tang, Q.H. Impact assessment of climate change and human activities on streamflow signatures in the Yellow River Basin using the Budyko hypothesis and derived differential equation. J. Hydrol. 2020, 591, 125460. [Google Scholar] [CrossRef]
  51. Qiu, D.X.; Xu, R.R.; Gao, P.; Mu, X.M. Effect of vegetation restoration type and topography on soil water storage and infiltration capacity in the Loess Plateau, China. Catena 2024, 241, 108079. [Google Scholar] [CrossRef]
  52. Li, Y.R.; Liang, Y.S.; Wei, T.X.; Chen, P.; Ji, X.D.; Liu, X.H. Spatiotemporal dynamics of rainfall interception and effective precipitation in the Loess Plateau after large-scale afforestation. Land Degrad. Dev. 2023, 34, 5004–5016. [Google Scholar] [CrossRef]
  53. Wei, W.; Pan, D.; Feng, J. Tradeoffs between soil conservation and soil-water retention: The role of vegetation pattern and density. Land Degrad. Dev. 2021, 33, 18–27. [Google Scholar] [CrossRef]
  54. Li, Y.; Piao, S.L.; Li, L.Z.X.; Chen, A.P.; Wang, X.H.; Ciais, P.; Huang, L.; Lian, X.; Peng, S.S.; Zeng, Z.Z.; et al. Divergent hydrological response to large-scale afforestation and vegetation greening in China. Sci. Adv. 2018, 4, eaar4182. [Google Scholar] [CrossRef] [PubMed]
  55. Wang, D.L.; Feng, H.M.; Zhang, B.Z.; Wei, Z.; Tian, Y.L. Quantifying the impacts of climate change and vegetation change on decreased runoff in China’s yellow river basin. Ecohydrol. Hydrobiol. 2022, 22, 310–322. [Google Scholar] [CrossRef]
  56. Zhang, H.Y.; Meng, Q.; You, Q.J.; Huang, T.S.; Zhang, X.M. Influence of Vegetation Filter Strip on Slope Runoff, Sediment Yield and Nutrient Loss. Appl. Sci. 2022, 12, 4129. [Google Scholar] [CrossRef]
  57. Yin, S.W.; Wang, Y.F.; Lei, C.G.; Zhang, J.Y. Runoff responses to landscape pattern changes and their quantitative attributions across different time scales in ecologically fragile basins. Catena 2025, 249, 108716. [Google Scholar] [CrossRef]
  58. Gu, C.; Mu, X.; Gao, P.; Zhao, G.; Sun, W. Changes in run-off and sediment load in the three parts of the Yellow River basin, in response to climate change and human activities. Hydrol. Process. 2019, 33, 585–601. [Google Scholar] [CrossRef]
  59. Du, Y.; Bao, A.M.; Zhang, T.; Ding, W. Quantifying the impacts of climate change and human activities on seasonal runoff in the Yongding River basin. Ecol. Indic. 2023, 154, 110839. [Google Scholar] [CrossRef]
  60. Bai, X.L.; Zhao, W.Z. Impacts of climate change and anthropogenic stressors on runoff variations in major river basins in China since 1950. Sci. Total Environ. 2023, 898, 165349. [Google Scholar] [CrossRef]
  61. Abbas, M.; Zhao, L.S.; Wang, Y.N. Perspective Impact on Water Environment and Hydrological Regime Owing to Climate Change: A Review. Hydrology 2022, 9, 203. [Google Scholar] [CrossRef]
  62. Li, S.; Liang, W.; Fu, B.J.; Lu, Y.H.; Fu, S.Y.; Wang, S.; Su, H.M. Vegetation changes in recent large-scale ecological restoration projects and subsequent impact on water resources in China’s Loess Plateau. Sci. Total Environ. 2016, 569, 1032–1039. [Google Scholar] [CrossRef] [PubMed]
  63. Li, Y.Z.; Liang, K.; Bai, P.; Feng, A.Q.; Liu, L.F.; Dong, G.T. The spatiotemporal variation of reference evapotranspiration and the contribution of its climatic factors in the Loess Plateau, China. Environ. Earth Sci. 2016, 75, 354. [Google Scholar] [CrossRef]
  64. Bin, L.L.; Xu, K.; Xu, X.Y.; Lian, J.J.; Ma, C. Development of a landscape indicator to evaluate the effect of landscape pattern on surface runoff in the Haihe River Basin. J. Hydrol. 2018, 566, 546–557. [Google Scholar] [CrossRef]
  65. Xu, H.; Chen, C.Y.; Liu, L.Y.; Li, Q.Z.; Wei, B.J.; Hu, X.J. Response of Surface Runoff Evolution to Landscape Patterns in Karst Areas: A Case Study of Yun-Gui Plateau. Sustainability 2024, 16, 7338. [Google Scholar] [CrossRef]
  66. Wang, L.Y.; Hou, H.; Li, Y.; Pan, J.; Wang, P.; Wang, B.; Chen, J.; Hu, T.A. Investigating relationships between landscape patterns and surface runoff from a spatial distribution and intensity perspective. J. Environ. Manag. 2023, 325, 116631. [Google Scholar] [CrossRef]
  67. Peña-Angulo, D.; Nadal-Romero, E.; González-Hidalgo, J.C.; Albaladejo, J.; Andreu, V.; Bagarello, V.; Barhi, H.; Batalla, R.J.; Bernal, S.; Bienes, R.; et al. Spatial variability of the relationships of runoff and sediment yield with weather types throughout the Mediterranean basin. J. Hydrol. 2019, 571, 390–405. [Google Scholar] [CrossRef]
  68. Zhang, X.X.; Song, J.X.; Wang, Y.R.; Deng, W.J.; Liu, Y.F. Effects of land use on slope runoff and soil loss in the Loess Plateau of China: A meta-analysis. Sci. Total Environ. 2021, 755, 142418. [Google Scholar] [CrossRef]
  69. Gou, Q.P.; Zhu, Q.K. Response of deep soil moisture to different vegetation types in the Loess Plateau of northern Shannxi, China. Sci. Rep. 2021, 11, 15098. [Google Scholar] [CrossRef] [PubMed]
  70. Yan, X.; Nunes, J.P.; Sun, J.E.; Tang, D.W.S.; Wen, Y.X.; Li, Z. Restored vegetation dominates the decrease in surface and subsurface runoff on the Loess Plateau. J. Hydrol. 2024, 640, 131730. [Google Scholar] [CrossRef]
  71. Cao, S.X.; Chen, L.; Shankman, D.; Wang, C.M.; Wang, X.B.; Zhang, H. Excessive reliance on afforestation in China’s arid and semi-arid regions: Lessons in ecological restoration. Earth-Sci. Rev. 2011, 104, 240–245. [Google Scholar] [CrossRef]
Figure 1. Overview of the study area.
Sustainability 18 03206 g001
Figure 2. Classification of land use types, slopes, soil types, vegetation coverage and landscape units in the Hekou–Longmen region. (a) land cover types: the legend showed eight main land cover types; (b) class of slope; (c) soil types: the legend showed six main soil types; (d) class of vegetation coverage; (e) landscape unit: the legend showed four landscape unit.
Sustainability 18 03206 g002
Figure 3. Change trends of (a) annual surface runoff and (b) annual runoff coefficient in the Hekou–Longmen region from 1960 to 2015.
Sustainability 18 03206 g003
Figure 4. Spatiotemporal variation of 10-year (a) average surface runoff and (b) average runoff coefficient in the Hekou–Longmen region from the 1960s to the 2010s.
Sustainability 18 03206 g004
Figure 5. Change trends of the annual precipitation in the 27 catchments from 1960 to 2015. The red dashed lines indicate linear trend lines.
Sustainability 18 03206 g005
Figure 6. The changes in (a) forestland area, (b) grassland area, and (c) vegetation coverage in the 27 catchments from 1990 to 2015.
Sustainability 18 03206 g006
Figure 7. The relationship between the simulated value and the measured value for runoff coefficient.
Sustainability 18 03206 g007
Figure 8. The Piecewise Structural Equation Modeling (piecewiseSEM) path analysis and results of effect sizes of key drivers on runoff in the study area. (a) The path diagram illustrates the direct and indirect effects of precipitation, vegetation restoration, and landscape metrics on runoff. Standardized path coefficients are displayed adjacent to arrows, with significance levels indicated as *** p < 0.001. Grey dashed lines represent non-significant effects, while blue solid lines indicate significant effects. (b) The bar chart of standardized total, direct, and indirect effect sizes of landscape metrics, precipitation, runoff coefficient, and vegetation restoration on runoff.
Sustainability 18 03206 g008
Table 1. Characteristics of the 27 catchments from 1960 to 2015 in the central Loess Plateau.
IDCatchmentControl StationDrainage Area (km2)Runoff Depth
(mm)
Precipitation
(mm)
Mean Slope
(°)
Mean Drainage Density
(km/km2)
Dominant Soil TextureMain Land Cover Types
1PianguanhePianguan189614.86440.612.612.01Silt loamDry land, Dense grass
2HuangfuchuanHuangfu317535.17393.17.580.54Silt loamModerate grass, Sparse grass, Dry land
3GushanchuanGaoshiya126347.16437.110.030.55Silt loamModerate grass, Dry land
4ZhujiachuanQiaotou29017.95476.910.350.71Silt loamDry land, Shrub
5DongchuanheKelan47444.61497.011.611.72Silt loamDry land, Shrub
6WeifenheBicun65062.57504.515.491.76Silt loamForest, Dry land
7BoniuchuanXinmiao152752.27389.96.30.55Silt loamModerate grass, Sparse grass
8KuyeheWenjiachuan851543.34379.44.10.54Silt loamSparse grass, Moderate grass
9TuweiheGaojiachuan325395.42427.45.682.23Silt loamSparse grass, Dry land
10JialuheShenjiawan112148.30459.910.272.08LoamDry land, Sparse grass
11QingliangsigouYangjiapo28337.74504.414.661.62LoamDry land, Sparse grass
12QiushuiheLinjiaping187333.96508.012.432.4Silt loamDry land, Sparse grass
13SanchuanheHoudacheng410249.93520.614.062.12Silt loamShrub, Dry land
14QuchanhePeigou102329.78520.514.481.85Silt loamSparse grass, Dry land
15HailiutuheHanjiamao234835.87384.43.181.81Silt loamSandy land, Sparse grass
16LuheHengshan241526.20431.18.530.56Silt loamDry land, Sparse grass
17HeimutouchuanDianshi32737.11421.310.120.55Silt loamDry land, Sparse grass
18MahuyuMahuyu37141.51457.311.430.54Silt loamDry land, Sparse grass
19DaliheQingyangcha126021.27455.813.581.84Silt loamDry land, Sparse grass, Moderate grass
20XiaoliheLijiahe80731.20443.611.680.52Silt loamDry land, Sparse grass
21ChabagouCaoping18739.46471.512.510.58Silt loamDry land, Moderate grass
22QingjianheYanchuan346837.55501.615.352.06Silt loamDry land, Moderate grass
23XinshuiheDaning399228.79532.713.672.17Silt loamSparse grass, Shrub, Dry land
24YanheGanguyi589136.93504.015.390.55Silt loamDry land, Sparse grass, Moderate grass
25FenchuanheXinshi166217.48531.615.011.88Silt loamShrub, Dense grass
26ShiwangchuanDacun214132.82538.214.620.76Silt loamShrub, Dense grass
27ZhouchuanheJixian43629.13537.115.991.85Silt loamSparse grass, Shrub
Table 2. Summary of the data used in this study.
Data TypeSourceWebsitePeriodResolution
Runoffthe Yellow River Water Conservancy Commission-1960–2015Annual
Precipitationthe National Meteorological Information Centrehttp://data.cma.cn
(accessed on 23 May 2018)
1960–2015Daily, 43 stations
Land coverthe National Special Environment and Function of Observation and Research Stations Shared Service Platformhttp://www.crensed.ac.cn/portal (accessed on 1 May 2020)1990, 2000, 2005, 2010, and 201530 m
Vegetation coveragethe National Geospatial Data Cloudhttps://www.gscloud.cn
(accessed on 1 May 2020)
1990–2015500 m
DEM (the Digital Elevation Model)the National Geospatial Data Cloudhttps://www.gscloud.cn
(accessed on 1 May 2020)
-30 m
Soilthe Loess Plateau Data Centerhttps://loess.geodata.cn
(accessed on 1 May 2020)
-1:1,000,000
Table 3. Detailed descriptions of 17 key landscape pattern indices.
CategoryIndex NameAbbreviationUnit
Area indexPatch densityPDn/100 ha
Largest patch indexLPI%
Mean patch sizeAREA_MNha
Fragmentation indexEdge densityEDm/ha
Euler nearest neighbors distanceENN_MNm
Shape indexLandscape shape indexLSI-
Mean shape indexSHAPE_MN-
Mean perimeter-area ratioPARA_MN-
Perimeter area fractal dimensionPAFRAC-
Spatial structure indexContagion indexCONTAG%
Interspersion juxtaposition indexIJI%
Division indexDIVISION%
Splitting indexSPLIT%
Aggregation indexAI%
Evenness indexShannon’s diversity indexSHDI-
Simpson indexSIDI-
Shannon’s evenness indexSHEI-
Table 4. The variations in landscape metrics from 1990 to 2015 in the Hekou–Longmen region.
YearPDLPIEDLSIAREA_MNSHAPE_MNPARA_MNPAFRACENN_MNCONTAGIJIDIVISIONSPLITSHDISIDISHEIAI
19900.670.3317.38146.08148.181.0838.211.628359.9141.1056.841.0018,761.396.710.990.7414.66
20000.680.2917.41146.19147.521.0538.221.598872.3341.0858.521.0020,504.966.931.000.7914.01
20050.700.1317.58147.65143.661.0438.261.589400.6540.1759.281.0030,939.817.051.000.8013.13
20100.700.1117.60147.83143.381.0438.271.589297.1539.9359.491.0032,109.257.051.000.8013.04
20150.710.0817.64147.94142.951.0438.281.608982.5139.5759.831.0035,426.327.071.000.8112.92
Table 5. Correlation analysis between runoff coefficient and landscape metrics (* significant at p < 0.05; ** significant at p < 0.01).
YearPDLPIEDLSIAREA_MNSHAPE_MNPARA_MNPAFRACENN_MNCONTAGIJIDIVISIONSPLITSHDISIDISHEIAI
19900.582 *−0.530 *0.597 *0.446−0.546 *−0.545 *0.640 **0.541 *−0.331−0.0870.0330.524 *0.578 *0.032−0.083−0.092−0.598 *
20000.710 **−0.549 * 0.725 **0.099−0.653 **−0.613 **0.700 **0.668 **−0.506 *−0.3580.2220.3240.437−0.370−0.4020.054−0.728 **
20050.606 **−0.573 **0.621 **0.214−0.623 **−0.585 **0.679 **0.551 *−0.420−0.2040.1380.1830.515 *−0.313−0.407−0.137−0.629 **
20100.517 *−0.568 *0.534 *0.312−0.570 *−0.466 *0.590 **0.512 *−0.265−0.2000.4140.3130.483 *0.1020.1240.116−0.531 *
20150.589 **−0.560 *0.606 **0.216−0.613 **−0.597 **0.622 **0.620 **−0.405−0.3630.12140.2050.574 **−0.340−0.485 *−0.021−0.607 **
Total0.614 **−0.536 **0.620 **0.150−0.612 **−0.569 **0.664 **0.608 **−0.403 **−0.279 *0.1750.289 *0.443 **−0.250 *−0.330 **−0.027−0.622 **
Table 6. Summary of the PLSR model between landscape metrics and runoff coefficient.
YR2Q2ComponentExplained Variability in Y/%Cumulative Explained Variability in Y%RMSECVQ2cum
runoff coefficient0.6460.579141.741.70.0150.402
27.8649.60.0140.456
36.8256.40.0120.500
48.2064.60.0110.579
Table 7. Correlation analysis between runoff coefficient and landscape metrics based on land cover units (* significant at p < 0.05; ** significant at p < 0.01).
YearPDLPIEDLSIAREA_MNSHAPE_MNPARA_MNPAFRACENN_MNCONTAGIJIDIVISIONSPLITSHDISIDISHEIAI
19900.489 *0.473 *0.523 *0.326−0.512 *−0.2300.2160.488 *−0.427−0.037−0.313−0.211−0.378−0.268−0.187−0.212−0.488 *
20000.479 * 0.192 0.610 **0.196−0.546 *−0.2720.541 *0.581 **−0.570 *−0.098−0.379−0.117−0.286−0.320−0.142−0.101−0.613 **
20050.534 *−0.3040.495 *0.283−0.641 **−0.3960.3320.542 *−0.542 *−0.015−0.219−0.224−0.336−0.299−0.212−0.142−0.493 *
20100.507 *−0.2130.506 *0.361−0.550 *−0.3260.4500.548 *−0.553 *−0.029−0.258−0.245−0.252−0.158−0.150−0.159−0.529 *
20150.538 *0.2000.607 **0.225−0.488 *−0.480 *0.622 **0.408−0.587 **−0.620−0.416−0.190−0.118−0.143−0.0290.226−0.611 **
Total0.512 **0.286 *0.547 **0.168−0.482 **−0.305 *0.359 **0.493 **−0.524 **−0.081−0.273 *−0.147−0.234 *−0.267 *−0.159−0.116−0.542 **
Table 8. Correlation analysis between surface runoff and landscape metrics (* significant at p < 0.05; ** significant at p < 0.01).
YearPDLPIEDLSIAREA_MNSHAPE_MNPARA_MNPAFRACENN_MNCONTAGIJIDIVISIONSPLITSHDISIDISHEIAI
19900.495 *0.513 *0.487 *0.205−0.523 *−0.490 *0.506 *0.347−0.221−0.129−0.118−0.2560.506 *−0.162−0.196−0.106−0.499 *
20000.562 * 0.581 ** 0.560 *0.283−0.547 *−0.495 *0.591 **0.489 *−0.263−0.2320.1570.4100.513 *−0.066−0.1180.024−0.557 *
20050.519 *−0.570 *0.501 *0.393−0.555 *−0.552 *0.623 **0.350−0.240−0.1010.1050.2970.641 **−0.102−0.205−0.118−0.508 *
20100.418−0.546 *0.4260.399−0.492 *−0.3860.517 *0.384−0.137−0.1010.0710.3350.507 *0.2450.2560.087−0.421
20150.569 *−0.532 *0.556 *0.218−0.570 *−0.561 *0.633 **0.501 *−0.267−0.2620.1780.1130.391−0.163−0.343−0.025−0.559 *
Total0.527 **−0.544 *0.510 **0.294 *−0.526 **−0.488 **0.521 **0.418 **−0.175−0.1310.0890.2420.513 **−0.116 *−0.148−0.093−0.536 **
Disclaimer/Publisher’s Note: The statements, opinions and data contained in all publications are solely those of the individual author(s) and contributor(s) and not of MDPI and/or the editor(s). MDPI and/or the editor(s) disclaim responsibility for any injury to people or property resulting from any ideas, methods, instructions or products referred to in the content.