Article

Harnessing the Industrial Digitalization for Carbon Productivity: New Insights from China

School of Economics, Beijing Technology and Business University, Beijing 100048, China
*
Author to whom correspondence should be addressed.
Sustainability 2026, 18(6), 3032; https://doi.org/10.3390/su18063032
Submission received: 26 January 2026 / Revised: 10 March 2026 / Accepted: 17 March 2026 / Published: 19 March 2026

Abstract

Industrial digitalization reshapes production processes and can potentially improve carbon productivity by optimizing factor allocation and energy efficiency. Using panel data for 30 Chinese provinces from 2012 to 2022, this study constructs a comprehensive industrial digitalization index with four dimensions and 13 indicators using the entropy method and examines its impact on carbon productivity (GDP per unit of CO2 emissions). We employ the Dagum Gini coefficient and kernel density estimation to describe regional disparities and their evolution, a dynamic panel threshold model to test the nonlinear role of industrial transformation and upgrading, and a spatial Durbin model to identify spatial spillover effects. The results indicate that industrial digitalization has risen nationwide but remains uneven; industrial digitalization significantly enhances carbon productivity, with stronger effects in the eastern and western regions and in plain areas; the effect exhibits a double-threshold pattern with respect to industrial transformation and upgrading, implying a U-shaped relationship; and industrial digitalization generates positive spatial spillovers. These findings suggest that policy should coordinate digital infrastructure investment with industrial upgrading and regional collaboration to accelerate low-carbon, high-efficiency growth.

1. Introduction

The International Energy Agency (IEA) reports that global energy-related CO2 emissions rose by 1.1% in 2023, increasing by about 410 million tons to a record 37.4 billion tons [1]. Additionally, against the backdrop of intensifying climate change, over 70 carbon-oriented policies have been enacted by national and subnational governments worldwide by 2024 [2]. These policies are designed to steer the digital transformation of the energy industry to advance carbon abatement and carbon neutrality. Enhancing carbon productivity, measured as the gross domestic product generated per unit of carbon dioxide emissions, has emerged as a central strategic priority for economies to tackle climate change. Improving carbon productivity has become the core strategic choice for all countries to cope with climate change [3]. As one of the major carbon emitters, China has been taking the initiative to undertake the task of low-carbon emissions reduction through diversified strategies such as optimizing energy mix and reshaping industrial structure. However, the contradiction between the pace of economic development and the demand for greenhouse gas emissions has become more and more prominent during the critical period when the Chinese economy is moving towards high-quality development, and the problems of low energy efficiency and high carbon emissions have gradually intensified. China still faces huge challenges in achieving the “dual carbon” goals, and the pursuit of low-carbon development has become the focus of China’s policy. In this context, how to reduce the total amount of carbon emissions, improve carbon productivity, and seek a balance between economic development and carbon emissions has become the focus of scholars.
With the rapid development of digital technologies (e.g., the internet, big data, and artificial intelligence), the digital economy has been reshaping traditional industrial systems at an unprecedented scale and depth, becoming an important pillar for high-quality economic development. According to the China Digital Economy Development Research Report [4], China’s digital economy reached 53.9 trillion yuan in 2023, accounting for 42.8% of GDP, which has significantly supported steady economic growth. Moreover, industrial digitalization exceeded 43.84 trillion yuan in 2023 and represented 81.3% of the total digital economy, highlighting its central role in economic transformation and upgrading.
Industrial digitalization refers to a data-centered transformation supported by digital technologies, integrating information, communication, and data-related tools to upgrade, transform, and reconstruct the full-factor digitalization of upstream and downstream segments of the industrial chain [5]. However, China’s industrial digitalization still faces constraints such as weak digital infrastructure, insufficient scale effects of platform technologies, and an incomplete digital industrial chain among industrial enterprises [6,7]. These challenges imply an urgent need to reduce resource misallocation, lower energy consumption, and improve productivity through deeper integration between industry and digital technologies.
Against this background, emerging models such as the platform economy, the industrial internet, and intelligent manufacturing can contribute to low-carbon development by improving matching and utilization efficiency, reducing idle capacity and redundant production, strengthening supply-chain coordination, and lowering resource and energy inputs per unit of output. In particular, platform-based models can reduce excessive dependence on natural resources by (i) enabling the sharing and more intensive use of existing productive assets and capacities (thereby lowering the demand for new resource-intensive expansion), (ii) improving real-time demand–supply matching to avoid overproduction and inventory waste, and (iii) facilitating servitization and data-driven value creation that increases output value with relatively lower material throughput. These mechanisms help mitigate ecological degradation while ultimately supporting carbon-emission reductions and higher carbon productivity [8,9]. Nevertheless, systematic evidence on how industrial digitalization improves carbon productivity—and under what conditions the effect may differ across regions and development—remains limited, motivating the research questions addressed in this study.
In the process of promoting China’s economy towards the goal of “carbon neutrality”, industrial transformation and upgrading occupies a pivotal position and is an important driving force for promoting the transformation of the economy to a low-carbon model. Industrial transformation and upgrading plays an important role in accelerating the deep integration of industrial digitalization and carbon productivity. On the one hand, most scholars generally believe that industrial transformation and upgrading can reduce carbon emissions and effectively increase carbon productivity. Under the premise of maintaining the stability of manufacturing industry and the fluctuation of employment market, the adjustment of industrial structure can reduce carbon emissions by 7.47% [10,11,12,13]. By optimizing the allocation of production factors, industrial transformation and upgrading strengthens the synergistic effect between products, promotes the efficient use of inter-industry resources, and then achieves a significant increase in carbon productivity [14,15,16,17,18]. On the other hand, some scholars have found that the effects of industrial transformation and upgrading on carbon emissions are not significant and may even be negative. Specifically, in the process of transformation and transfer of some traditional industries, in order to control the cost of migration to neighboring areas, this process is often accompanied by the transfer of pollution and carbon emissions, which in turn has a negative impact on the carbon production efficiency of the surrounding areas [19]. What is the level of industrial digitalization? How does industrial digitalization affect carbon productivity? What role does industrial transformation and upgrading play in the mechanism through which industrial digitalization drives carbon productivity? How do the spatial spillover effects of industrial digitalization influence carbon productivity, and how can such effects be effectively utilized? This article focuses on answering the above questions.
Based on the theoretical analysis above, this study proposes the following hypotheses:
H1: 
Industrial digitalization can drive the enhancement of carbon productivity.
H2: 
The impact of industrial digitalization on carbon productivity exhibits a threshold effect of industrial transformation and upgrading. Within an appropriate range, industrial transformation and upgrading significantly promotes the enhancement of carbon productivity through the empowerment of industrial digitalization.
H3: 
Industrial digitalization not only significantly enhances carbon productivity within a given region, but also fosters improvements in carbon productivity in neighboring regions through spatial spillover effects.

2. Data and Methods

2.1. Indicator Selection

To measure industrial digitalization, we constructed an evaluation system comprising four subsystems (industrial digitalization input, industrial digitalization capability, industrial digitalization application, and industrial digitalization infrastructure) and thirteen indicators (Table 1). We employed the entropy method to determine indicator weights. Specifically, we first performed dimensional processing of each indicator, then calculated the indicator proportions, evaluated the information entropy redundancy, and finally determined the indicator weights to achieve objective and scientific weighting of industrial digitalization.
(1) Industrial digitalization foundation [20]. The industrial digitalization foundation can help enterprises make their production processes intelligent and green. It can lead to the innovation of industrial production patterns and the remodeling of industrial chains and can also be effective in reducing energy consumption and carbon emissions. This is an important building block for improving carbon productivity. The basis for industrial digitalization includes optical cable coverage, network rollout, science and technology support, mobile phone rollout, and internet broadband rollout, and one of these indicators, science and technology support, refers to the ratio of scientific and technological spending to public financial spending. (2) Industrial digitalization investment [21]. Industrial digitalization investment accelerates the transformation and upgrading of traditional industries through technological research and development, which can reduce resource consumption and environmental pollution, and provide strong impetus for the low-carbon transformation of the economy. Investment in industrial digitalization includes R&D personnel and R&D funding support for industrial enterprises. The R&D staff of an industrial enterprise is the full-time equivalent of the R&D staff of an industrial enterprise above the designated size, and the R&D funding support is the ratio of R&D funding to GDP. (3) Industrial digitalization capability [22]. Industrial digitalization capability can enable precise control of production data, thereby optimizing resource allocation and significantly improving carbon productivity. Industrial digitalization capability includes four indicators: e-commerce transactions, software revenue, proportion of high-tech employees, and computer usage. The percentage of high-tech employees refers to the ratio of computer services and software employees to the total number of employees, while computer usage refers to the number of computers used per hundred people. (4) Industrial digitalization application [23]. Industrial digitalization application can improve operational methods, effectively promote carbon reduction, and lay a solid foundation for the green development of the economy and society. Industrial digitalization applications are based on e-commerce enterprises and enterprise websites as indicators, where e-commerce enterprises refer to the ratio of the number of enterprises with e-commerce transaction activity to the total number of enterprises, and enterprise websites refer to the number of websites per hundred enterprises.

2.2. Variable Definitions

Explained variable: carbon productivity (CAR). Carbon productivity is a crucial indicator for measuring the quality of economic development, which can help stabilize the growth of gross domestic product (GDP) and effectively slow down the growth rate of carbon emissions. Based on the Environmental Kuznets Curve hypothesis (EKC), the improvement of carbon productivity can promote the research and application of low-carbon technologies, reduce production costs and improve product quality for enterprises, effectively enhance industrial competitiveness, and achieve the dual goals of controlling carbon emissions and economic development [24]. The concept of carbon productivity, defined as GDP per unit of carbon emissions, was first introduced by Kaya and Yokobori. Following the computational method commonly used in academia, we use a single-factor carbon productivity measure, calculated as follows:
C A R = G D P C O 2
CAR represents regional carbon productivity, GDP represents regional gross domestic product and CO2 represents regional carbon emissions. The accounting method for CO2 is derived from the epigenetic calculation method of the China Carbon Accounting Database (CEADS).
Core explanatory variables: industrial digitalization (DIG). The results of the calculation of the industrial digitalization index system constructed in the previous text.
Threshold variable: industrial transformation and upgrading (TRA). Industrial structure directly reflects the economic benefits and efficiency levels of energy use. Industrial transformation and upgrading can drive industries to achieve upward transition within the vertical division of labor framework, generate positive radiation effects on adjacent and related industries in the horizontal division of labor, promote the transformation of industries towards low consumption, high added value, and capital technology intensive, achieve resource optimization and energy efficient utilization, thereby reducing carbon emissions and improving carbon production efficiency [22,25]. According to Clark’s Law, industrial structure upgrading is the process of transitioning from a low-level system to a high-level system. Therefore, we use the industrial structure hierarchy coefficient to measure the evolution process of industries from the relative changes in proportion. The calculation formula is as follows:
T R A = i = 1 3 x i , m , t × i
Among them, is the proportion of the industry in the m region to the regional GDP in the t-th year.
Control variables:
Urbanization rate (URB). Urbanization is a significant driver of carbon emissions. As the urbanization rate increases, the population gradually converges from rural areas to cities and the economic activity of residents increases significantly, leading to a significant increase in urban industrial emissions, transportation emissions, and household waste and other pollutants. This will result in a large amount of air pollution and carbon emissions, hindering the improvement of carbon productivity [26]. Therefore, we measure the proportion of urban permanent residents to the total population of the region.
Degree of opening up (OPE). Opening up to the outside world could not only introduce foreign investment and energy-saving and emission-reduction technologies, accelerate industrial upgrading and optimize energy consumption structure, but also inject financial vitality into low-carbon and green development through international trade revenue. This facilitates the development of low-carbon and green production activities in society, ultimately achieving effective improvement in carbon productivity [27]. We measure it by the ratio of total import and export trade volume to GDP.
Social consumption level (CON). An increase in the level of social consumption often leads to a shift in the consumption structure. The increased consumer demand for high-quality, low-carbon and environmentally friendly products and services have optimized and upgraded the industrial structure in a more environmentally friendly and low-carbon direction. This is conducive to reducing the intensity of carbon emissions and increasing carbon productivity. Therefore, we measure it by the ratio of total retail sales of consumer goods to GDP.
Marketization index (MAR). Properly increasing the level of marketization is conducive to optimizing the manufacturing industry’s production scale and operational processes to achieve efficient utilization and rational allocation of resources. By introducing advanced energy-saving technologies and equipment, the manufacturing industry can significantly improve energy efficiency in the production process, reduce resource consumption and waste, and lower carbon emission intensity [28]. We use the marketization index from the Chinese Marketization Index database for our measurements.

2.3. Data Sources

We selected panel data of 30 provincial-level regions in China from 2012 to 2022 (not included in the sample due to the lack of data in Xizang, Hong Kong, Macao and Taiwan). The original data comes from the National Bureau of Statistics of China, China Emission Accounts and Datasets (CEADS), Chinese Research Data Service Platform (CNRDS), and the Wind database. We used STATA18.0 to complete the data processing and empirical analysis. The descriptive statistics of the relevant variables are shown in Table 2.

2.4. Model Construction

This paper takes carbon productivity (CAR) as the dependent variable, Industrial digitalization (DIG) as the core explanatory variable, and industrial transformation and upgrading (TRA) as the threshold variable. Additionally, it incorporates urbanization rate (URB), degree of opening to the outside world (OPE), social consumption level (CON), and marketization index (MAR) as control variables to establish the following models:
  • Dagum Gini coefficient method
G = j = 1 k h = 1 k i = 1 n j r = 1 n j y j i y h r 2 n 2 y j ¯
Among them, G is the overall Gini coefficient, G = G w + G n b + G t within-group Gini coefficient, G n b for the between-group Gini coefficient, G t overlapping Gini coefficient, y j ¯ the mean value of industrial digitalization level for the j-th group.
2.
Kernel density estimation
f ( D ) = 1 n h i = 1 n K ( D i D h )
f ( D ) represents the three-dimensional kernel density value. Among them, is the number of observed values; D is an independent and identically distributed observation value; K ( · ) represents the Gaussian kernel density function; is the bandwidth.
3.
Baseline Regression Model
C A R i t = β 0 + β 1 D I G i t + β 2 U R B i t + β 3 O P E i t + β 4 C O N i t + β 5 M A R i t + ε i t
where β 0 , β 1 , β 2 , β 3 , β 4 , β 5 are the regression coefficients of industrial digitalization and the control variables, respectively, and ε i t is the random disturbance term.
4.
Dynamic Threshold Model
C A R i t = θ + α 1 L 1 + α 2 L 2 + α 3 U R B i t + α 4 O P E i t + α 5 C O N i t + α 6 M A R i t + β 1 D I G i t I ( T R A i t γ 1 ) + β 2 D I G i t I ( γ 1 < T R A i t γ 2 ) + β 3 D I G i t I ( T R A i t > γ 2 ) + μ i + v t + ε i t
where L 1 , L 2 is the lagged term, I ( · ) is the indicator function, γ is the threshold value of the variable, μ i is the individual-specific effect, v t is the time-specific effect, and ε i t is the random disturbance term.
5.
Revised gravity model
K i j = C i C i + C j
Y ij = K i j C i P i G i 3 × C j P j G j 3 d i j g i g j 2
K i j is the contribution rate of province i to the digitalization of industries in province i and province j , which is used to modify the gravity model. Y ij is the spatial connection strength of industrial digitalization between province i and province j ; C i , C j represents the entropy score of the industrial digitalization index system for province i and province j ; P i , P j represents the year-end permanent residents of province i and province j ; G i , G j is the GDP of province i and province j ; d i j is the spatial distance between province i and province j ; g i , g j represents the per capita GDP of province i and province j .
6.
Spatial Durbin Model
C A R i t = ρ W T R A j t + η 1 D I G + η 2 U R B + η 3 O P E + η 4 C O N + η 5 M A R + W X δ + ε i t
where W X is the spatial lagged term of the explanatory variables.

3. Results

3.1. Measurement, Spatial Differentiation, and Dynamic Evolution of Industrial Digitization

3.1.1. Measurement Results of Industrial Digitization

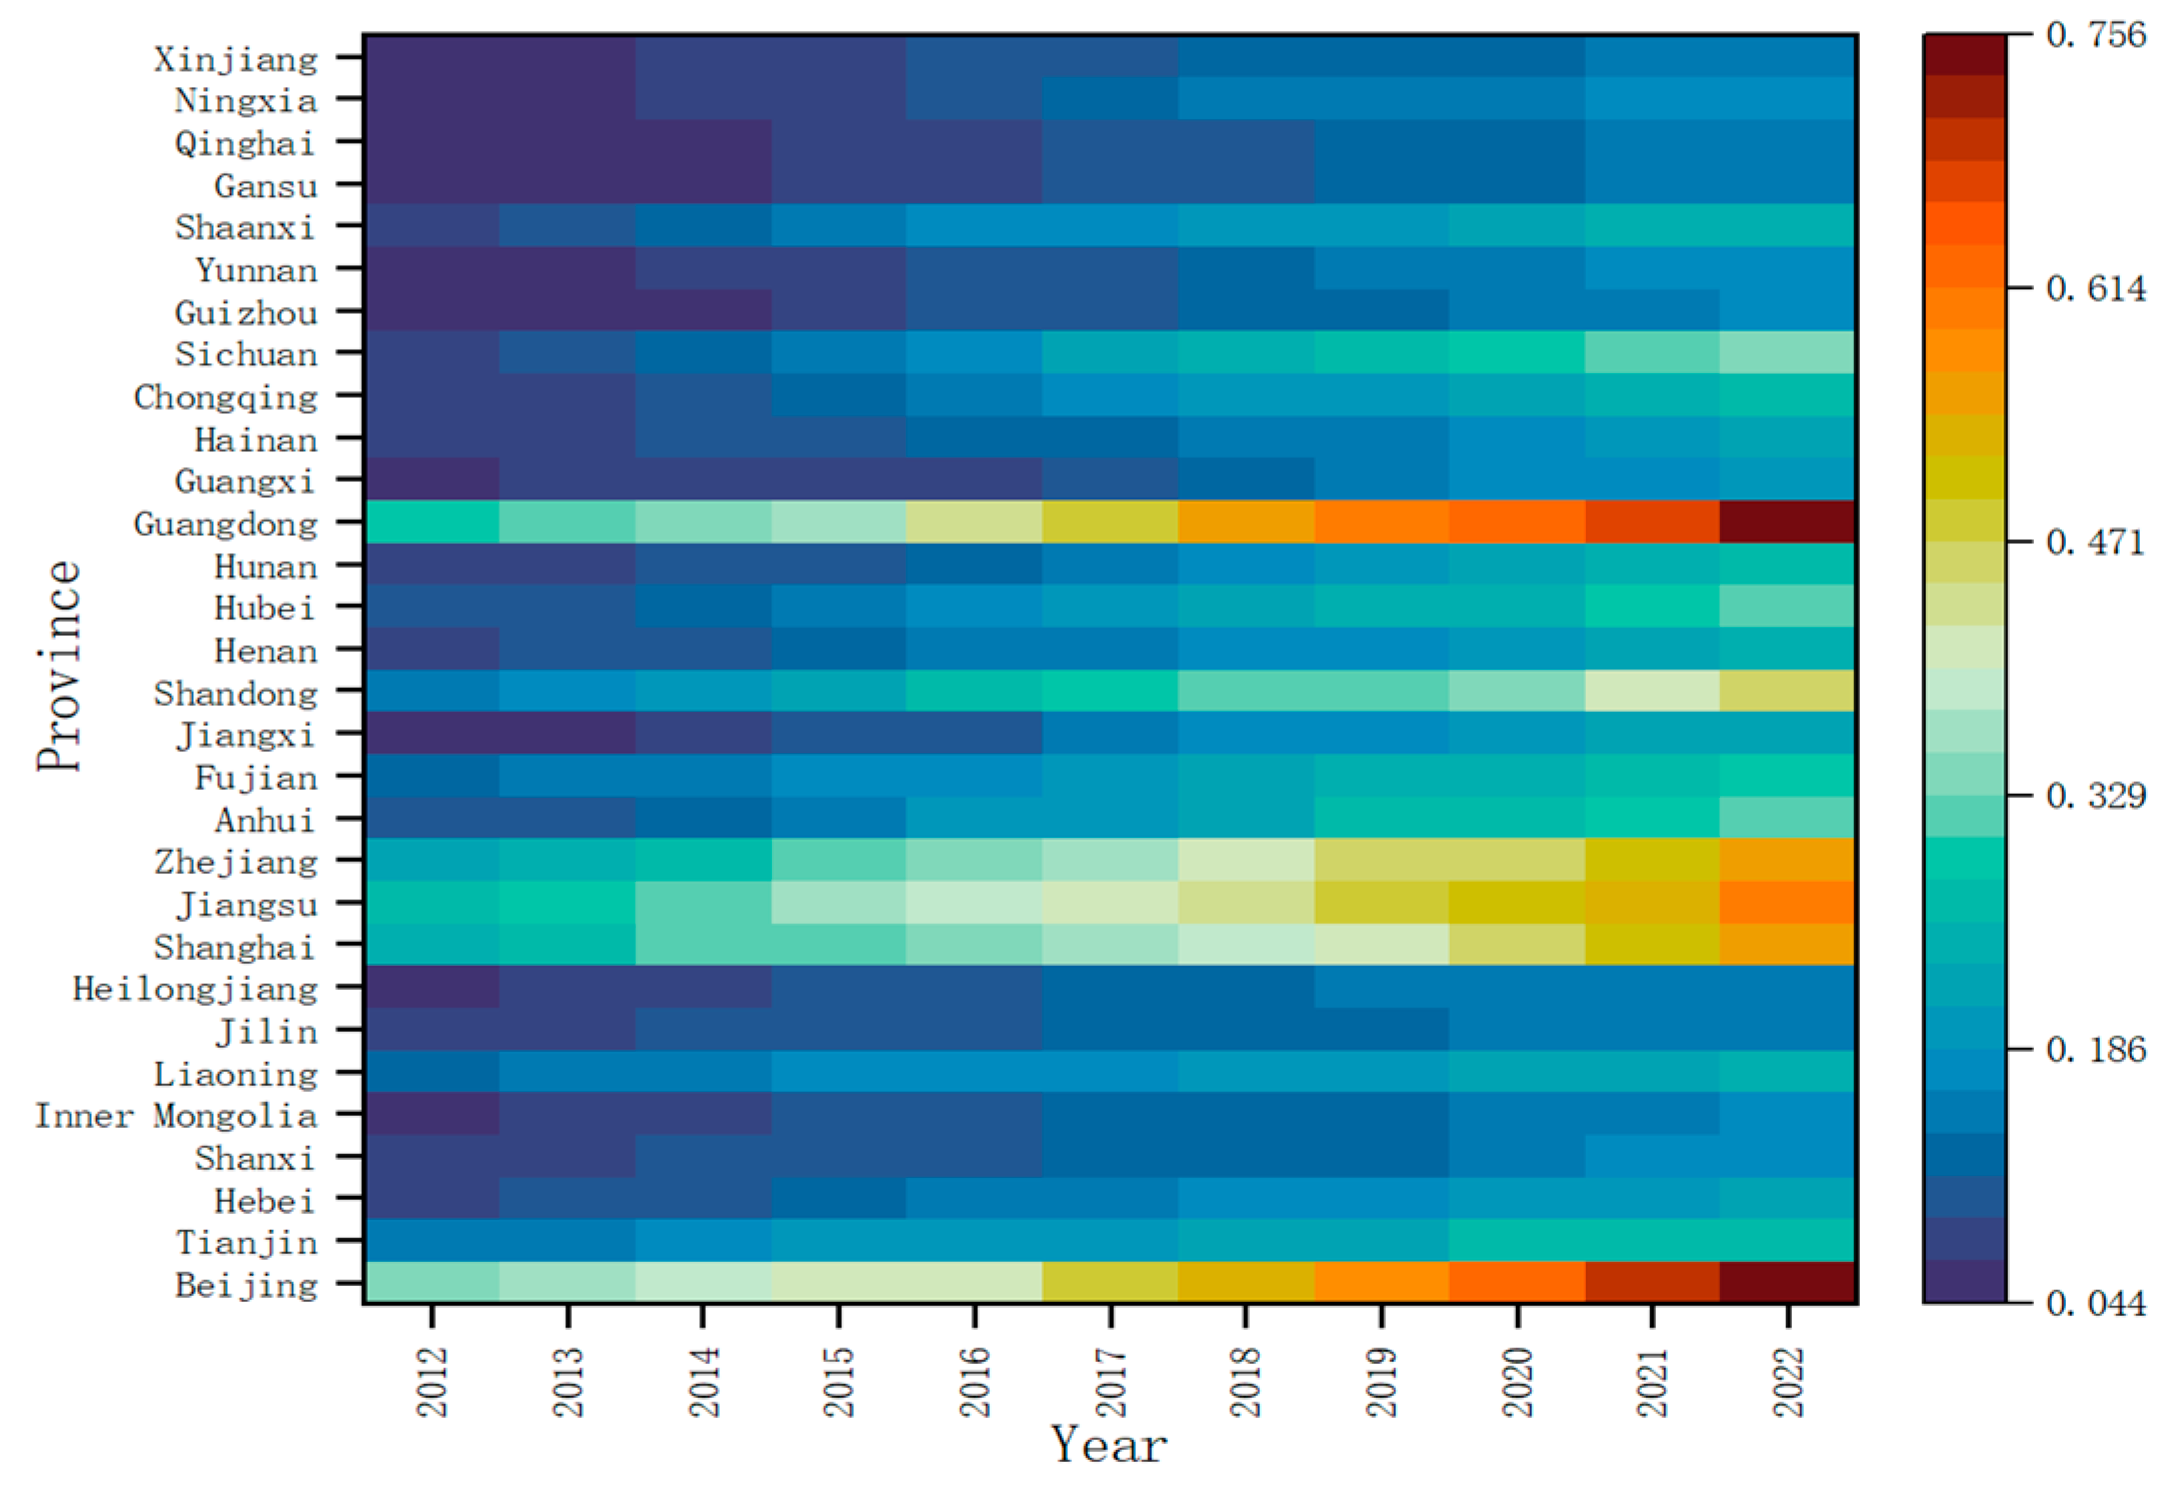
To visually depict the spatiotemporal differentiation characteristics of industrial digitalization in China, we employ the industrial digitalization index constructed and measured in this study to plot the heatmap, as presented in Figure 1. From the figure, it can be seen that the overall level of China’s industrial digitalization development has shown an upward trend from 2012 to 2022. The level of industrial digitalization development in most provinces is relatively low.
The city with the highest level of industrial digitalization development is Beijing. As a “highland” for the development of China’s digital economy, Beijing has continuously promoted the construction of a “global benchmark city for digital economy” in recent years, actively committed to the construction of “3 + X” characteristic industrial clusters, and gradually deepened the synchronous development stage of “digital+” and “data+”. Qinghai Province has the lowest level of industrial digitalization. As a barrier to China’s ecological security, Qinghai Province’s industrial development is easily restricted, and its digital transformation of industries faces huge challenges such as low production efficiency and weak innovation capabilities. With the rapid development of the digital economy, the development level of the digital economy industry in remote areas of China is relatively low, and there is a significant gap in the level of industrial digitalization. The development results have not yet reached the ideal expectations. Finally, with the rapid development of the digital economy, the development of the digital economy in remote areas of China remains at a relatively low level, and a substantial gap exists in industrial digitalization across regions. To date, such areas have not yet fulfilled the ideal expectation of achieving in-depth digital technology penetration, realizing the full-chain digital transformation, significantly improving total-factor productivity, upgrading the value chain to a higher end, and thereby establishing a data-driven modern industrial system.

3.1.2. Decomposition of Spatial Differences in Industrial Digitization

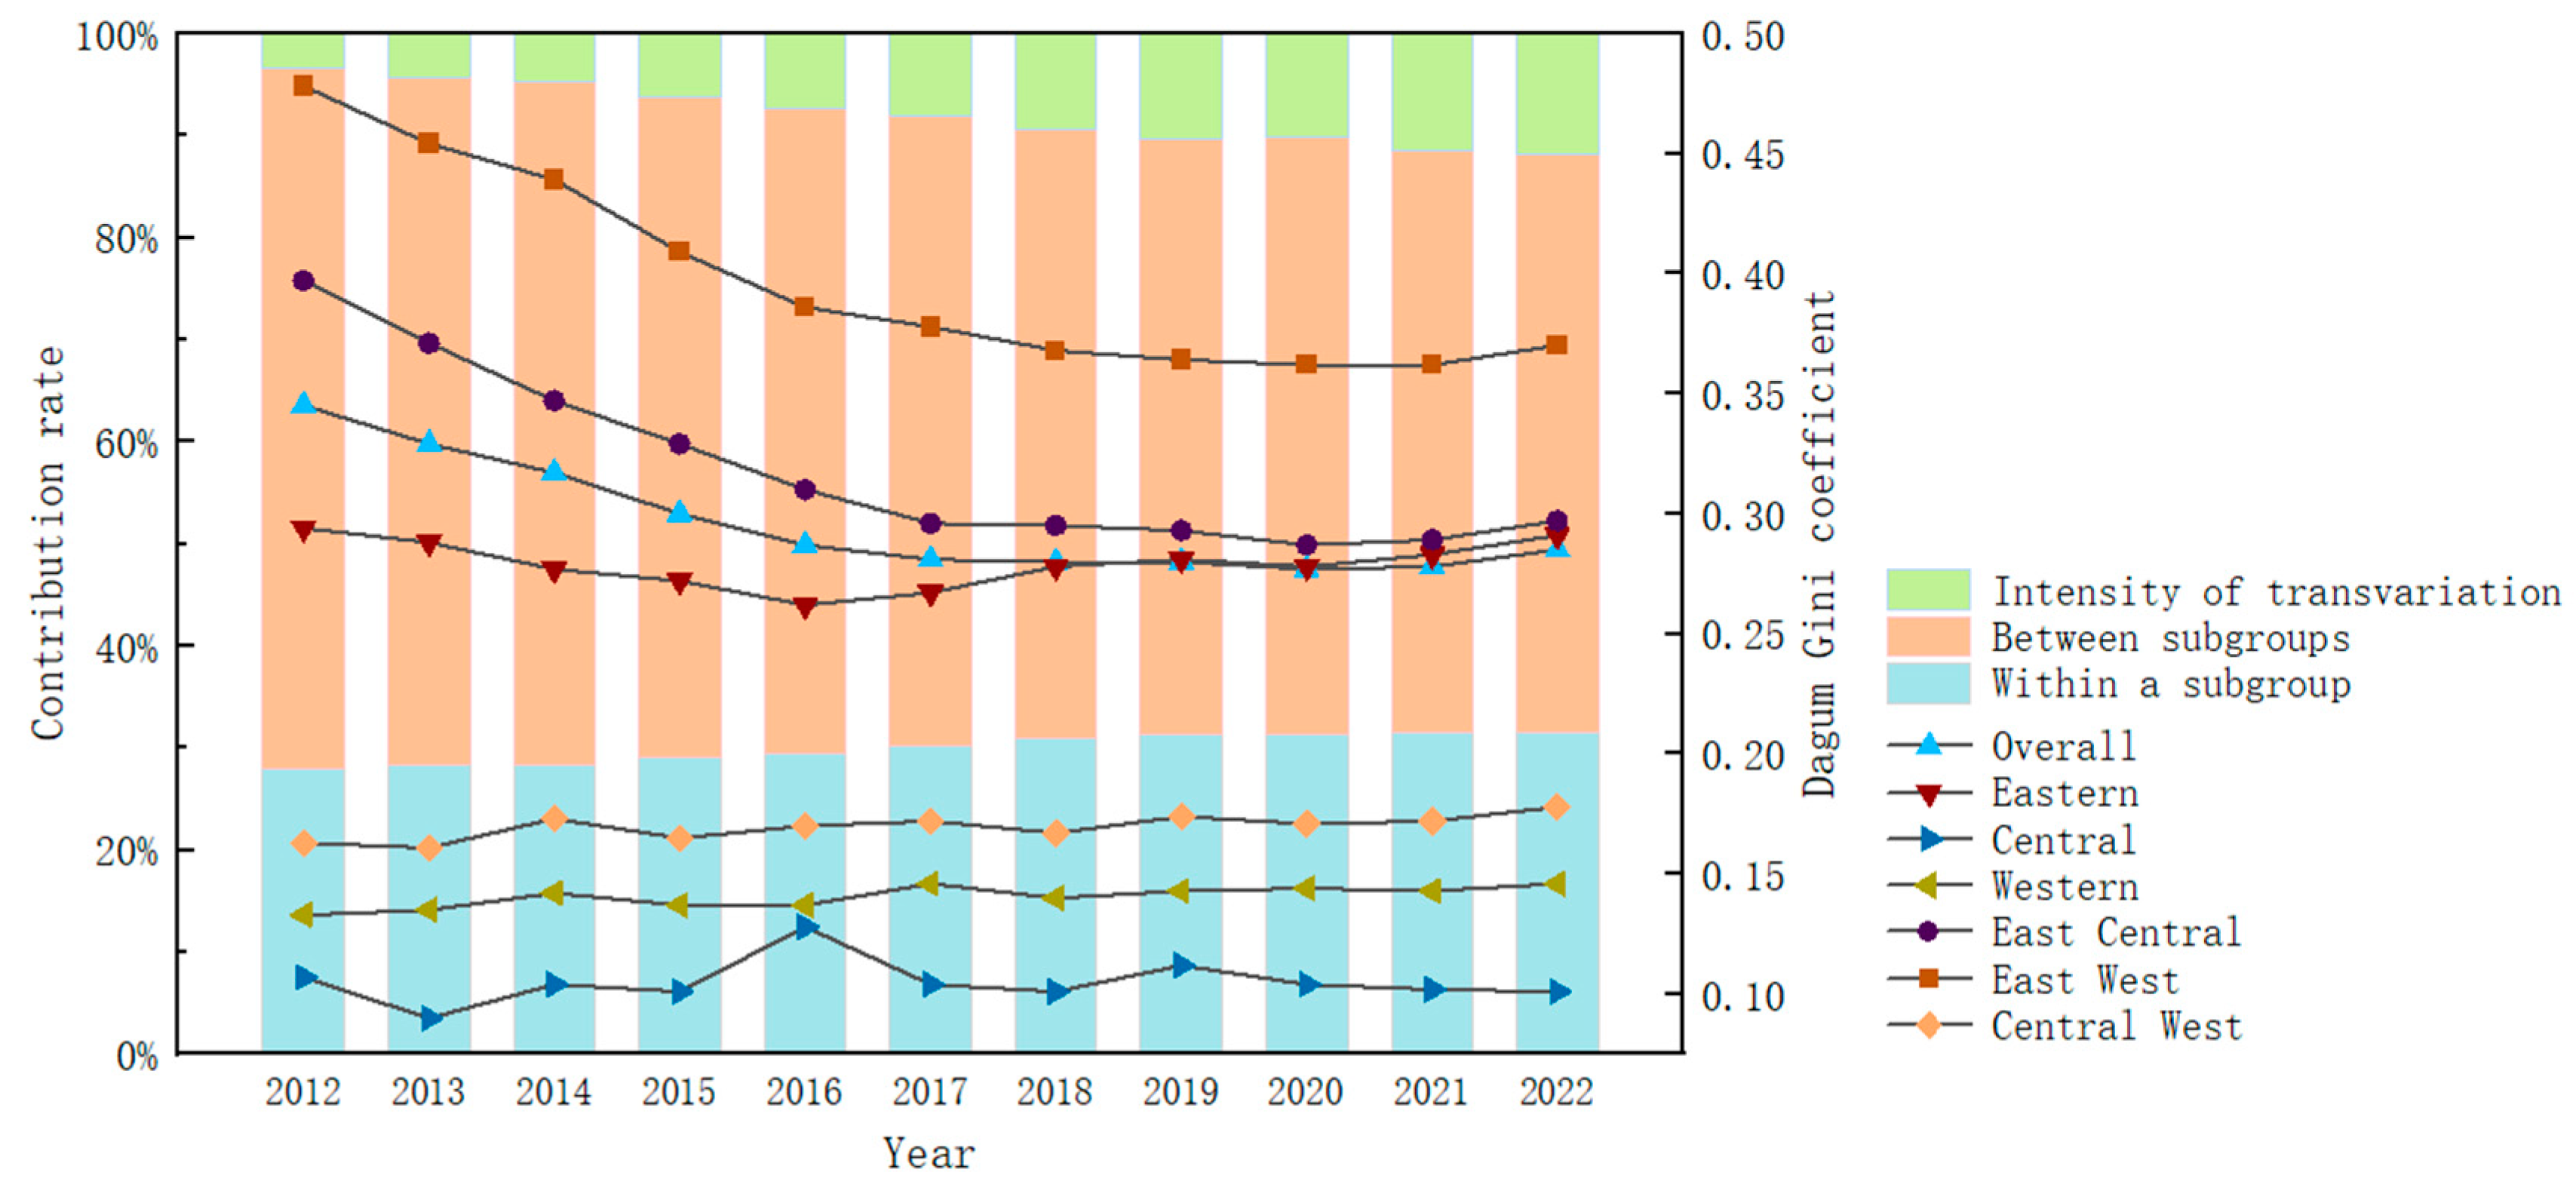
Using Dagum Gini coefficient to calculate the regional differences in China’s industrial digitalization level, as shown in Figure 2.
From the overall dynamic evolution trend analysis, the regional differences in the level of digital development of Chinese industries are gradually narrowing. The fluctuation range of industrial digitalization differences in the eastern region is relatively significant, while the fluctuations in the central and western regions are relatively flat. Specifically, the differences in the digitalization level of industries in the eastern region exhibit a fluctuating pattern of “decline rise”; the difference in industrial digitalization between the central and western regions is relatively small before and after. Overall, the level of digital development in China’s industries shows a distribution pattern of “eastern > western > central”. The eastern region has a developed economy, strong innovation capabilities, rapid digital development, and complex industries, resulting in significant differences and fluctuations. The industrial structure in the central region is balanced, and the overall progress is stable after undertaking industrial transfer, with small differences. The industrial foundation in the western region is weak, and digital development is in its infancy, with no significant differences.
From the perspective of between-region evolution, the trends of the east–central and east–west coefficients are broadly consistent, and the overall difference between the east and west remains larger than that between the east and central regions. The between-region Dagum Gini coefficient for the central–west pair shows a mild upward trend, indicating a slight expansion in the digitalization gap between the central and western regions. Industrial transfer from the east to the central and western regions has promoted digital development in these areas; however, constraints such as weaker digital infrastructure and limited talent reserves reduce their absorptive capacity, so the gap with the east persists. In addition, the central region has generally progressed faster than the western region, contributing to the widening central–West gap. The three major contribution rate indicators exhibit nonlinear dynamic evolution characteristics, specifically manifested as a decreasing trend in both intra-regional and inter regional differential contribution rates, while the contribution rate of hypervariable density shows a reverse upward trend. Among them, the contribution rate of inter-regional differences plays a dominant role in influencing the digital development of industries, followed by the contribution rate of intra-regional differences, and the contribution rate of super variable density differences has the smallest impact.

3.1.3. Dynamic Evolution Analysis of Industrial Digitalization Development Level

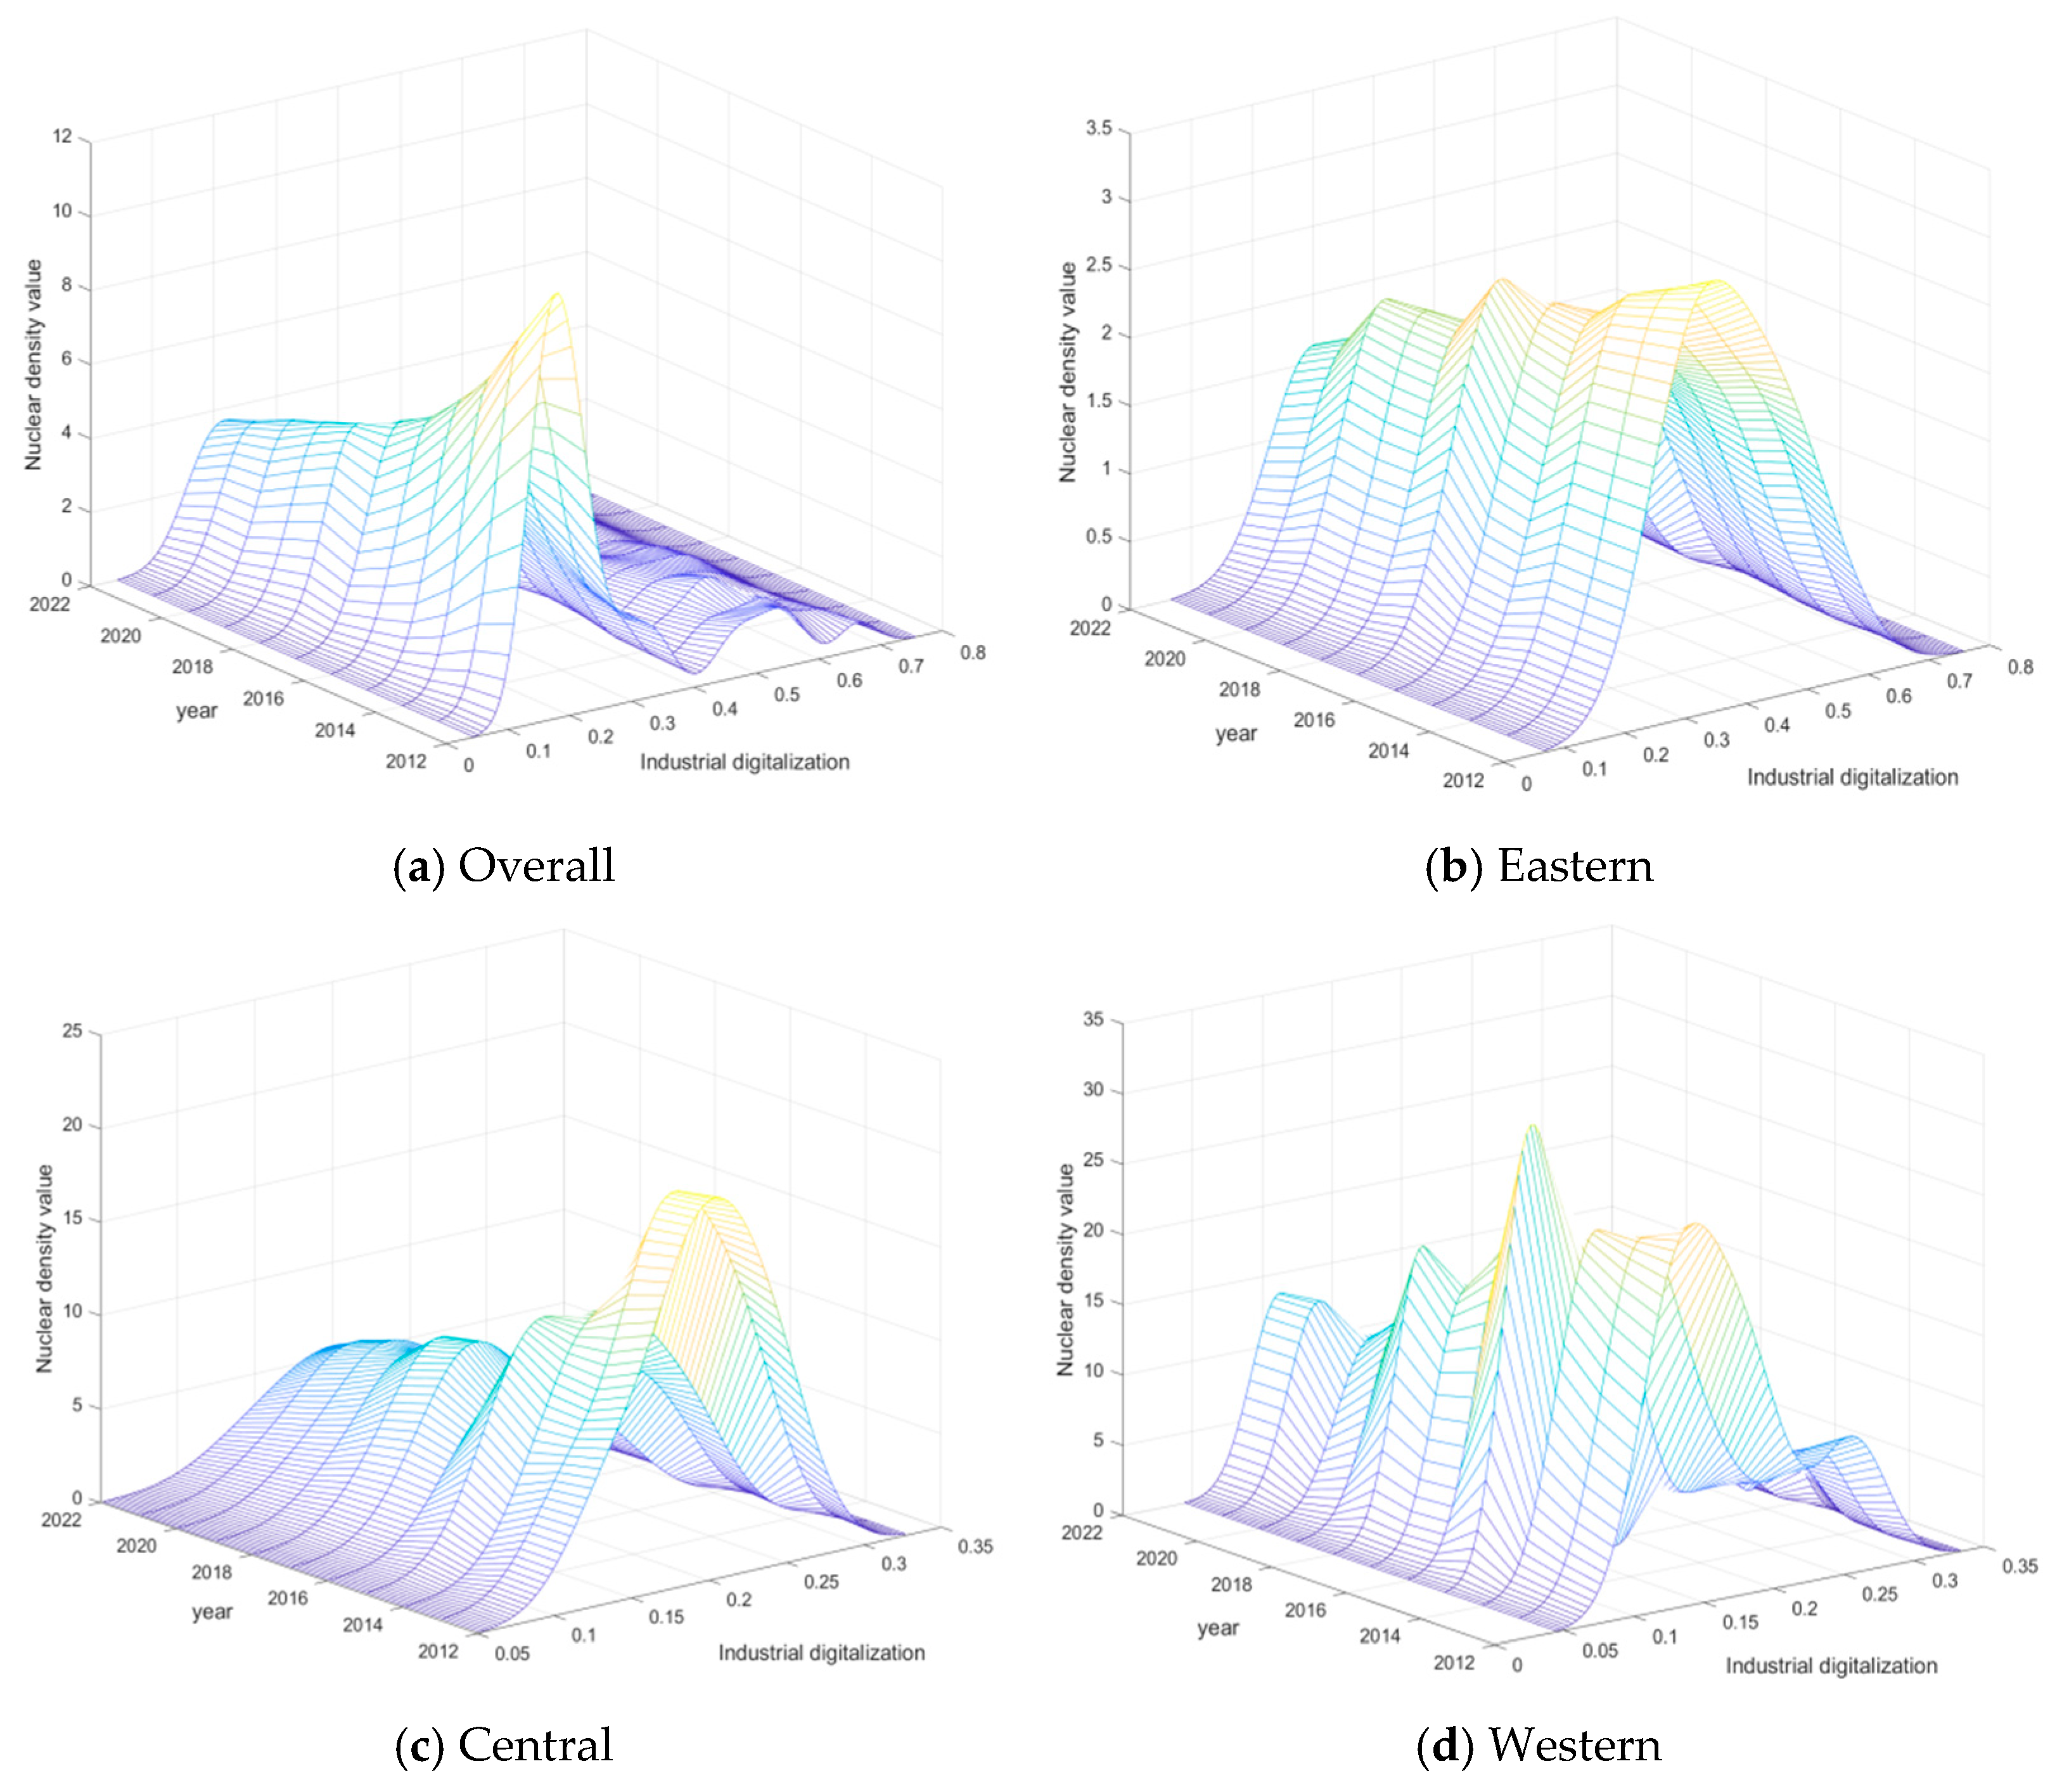
Kernel density values were calculated using industrial digitalization data, and 3D kernel density plots were plotted for the whole country as well as the eastern, central, and western regions. The results indicate that the national industrial digitalization level has continuously improved and the interregional gap has tended to narrow. However, the evolution of intraregional differences in the eastern, central, and western regions is significantly differentiated: the eastern region remains relatively stable, the central region shows a continuous expansion trend, and the western region presents a phased characteristic of first shrinking and then expanding (Figure 3).
From the national level kernel density curve in Figure 3a, it can be seen that over time, the curve shifts to the right as a whole, indicating that the level of industrial digitalization is continuously improving nationwide. At the same time, the peak value of the kernel density curve has decreased and the width has increased, with a trailing phenomenon on the right side, reflecting the expansion of the absolute distribution range of industrial digitalization level. Some regions have developed rapidly, but the overall trend shows a transition from “multi peak” to “single peak”, indicating that the gap in industrial digitalization among different regions in the country is narrowing, and the overall trend is still towards balanced development. Figure 3b–d shows the development dynamics of various regions. The overall rightward shift in the nuclear density curves in the eastern, central, and western regions indicates that the level of industrial digitalization development in these areas is also constantly improving. The peak value of the main peak of the nuclear density distribution curve in the eastern region has slightly decreased, but the main peak shows a trend of decreasing width, indicating that the differences in industrial digitalization in the eastern region have not shown a significant expansion trend. The nuclear density curve in the central region shows a trend of decreasing peak to peak values and increasing width, indicating that the differences in industrial digitalization in the central region are constantly expanding, reflecting the imbalance in the process of industrial digitalization in the central region. The nuclear density curve in the western region shows a phased change of “increasing decreasing” peak values, indicating that the digital differences generally show a trend of first narrowing and then expanding. In addition, the number of peaks shows a trend of transitioning from “double peak” to “single peak”, indicating that the degree of digital polarization in the western region’s industries is gradually decreasing, and the development of the digital economy is showing initial results.

3.2. The Direct Effect of Industrial Digitalization on Carbon Productivity

3.2.1. Benchmark Regression Results

In this article, we set industrial digitalization as the core explanatory variable of the study and constructed random effects models and fixed effects models respectively. Through the Hausman test, the null hypothesis was rejected and a fixed effects model was used for analysis, as shown in Table 3. On the basis of controlling for province and time effects, column (1) of Table 3 only includes the core explanatory variable, and the results show that the coefficient of industrial digitalization shows a significant positive correlation at the 1% significance level. Continuing to add control variables in columns (2) to (5) of Table 3, the regression analysis results show that even after adjusting for the control variables, the coefficient of industrial digitalization on carbon productivity is positively correlated at the 1% level. Regardless of the introduction of control variables, industrial digitalization can significantly improve carbon productivity. Therefore, H1 is confirmed.

3.2.2. Robustness and Endogeneity Tests

  • Changing the time window
To further enhance the credibility and robustness of the regression results, this paper adopts the method of adjusting the time window for regression analysis. Specifically, the original data time range from 2012 to 2022 is revised to 2013 to 2021, and new regression results are obtained accordingly, which are shown in Column (1) of Table 4. Within this adjusted time frame, the coefficient of industrial digitalization still presents a positive value and reaches the 1% statistical significance level, which is consistent with the benchmark regression results.
2.
Adjusting the sample size
Considering that the economic development level of municipalities directly under the central Government is relatively high, which may significantly aggravate the imbalance between regions, it is decided to exclude the samples of municipalities directly under the central Government in the robustness test. The results are shown in Column (2) of Table 4. Accordingly, we observe that there is no fundamental change in the significance level and numerical value of industrial digitalization, maintaining a high consistency with the results of the benchmark regression analysis.
3.
GMM regression
In view of the potential endogeneity between the core explanatory variable and the explained variable, this paper adopts the first-difference generalized method of moments (GMM) for estimation. The relevant estimation results are shown in Column (3) of Table 4. The results show that the lagged first-order term of carbon productivity exhibits significant statistical characteristics, which strongly supports the view that the carbon productivity in the previous period has a significant impact on that in the later period, thereby further verifying the dynamic characteristics of changes in carbon productivity. In addition, through the Arellano-Bond second-order autocorrelation test (AR (2) test), we confirm that there is no second-order serial correlation problem. From the final regression results, the sign of the coefficient of industrial digitalization is consistent with the benchmark regression results, which further enhances the robustness and reliability of the conclusions in this paper.

3.2.3. Spatial Geographic Heterogeneity

To further analyze whether there is heterogeneity in the impact of industrial digitalization on carbon productivity, the regions were divided into eastern, central, western, plain, and non-plain areas, and benchmark regressions were conducted separately. The results are shown in Table 5. From the comparative analysis of the eastern, central, and western regions, industrial digitalization has shown a positive effect on improving the development level of carbon productivity. However, this improvement effect exhibits significant heterogeneity among different regions. The impact of industrial digitalization on carbon productivity in the eastern and western regions is significant and positive, with impact coefficients of 4.687 and 7.385, respectively, both showing a positive correlation at the 1% confidence level of statistics. For the central region, industrial digitalization has also significantly improved carbon productivity, with an impact coefficient of 3.258, which also maintains positive significance at a 1% confidence level, but the degree of impact is relatively low. The reason for this difference is that the eastern region, with its profound economic background, has built a solid economic foundation, enabling it to efficiently accept and apply new technologies. For the western region, the high attention of the national and local governments and the implementation of a series of “agriculture, rural areas, and farmers” policies have not only optimized the policy environment for the digital development of industries, but also promoted the deep integration of industrial digitalization and carbon productivity. Although the central region has a certain industrial foundation, traditional industries still occupy a large proportion in its economic structure, resulting in relatively insufficient industrial technological innovation capabilities and core competitiveness of enterprises.
Compared with non-plain areas, the impact coefficient of industrial digitalization on carbon productivity in plain areas is 5.724, and it is significantly positive at the 1% confidence level of statistics; for non-plain areas, the impact coefficient of industrial digitalization on carbon productivity is 2.640, which also shows a significant positive impact at a 1% confidence level. Plain areas, with their flat terrain, fertile soil, and developed transportation networks, have accelerated the circulation of agricultural products and the interaction of personnel, technology, and information, promoted rural economic diversification and industrial upgrading, and significantly improved carbon productivity. Non-plain areas, relying on abundant natural resources and unique terrain conditions, have developed agricultural industries with distinct regional characteristics, such as high-altitude vegetables and traditional Chinese medicine. These industries not only enhance the added value of agricultural products and provide broader market opportunities for the deep application of industrial digitalization but also have a positive impact on the improvement of carbon productivity.

3.3. The Indirect Effect of Industrial Digitalization Empowering Carbon Productivity

3.3.1. The Threshold Effect of Industrial Digitalization on Industrial Transformation and Upgrading of Carbon Productivity

We start with the heterogeneous threshold of industrial transformation and upgrading and use the dynamic panel threshold model to explore the impact of industrial digitalization on carbon productivity.
First of all, according to the threshold effect test of industrial transformation and upgrading in Table 6, the single threshold is significant at the 1% significance level, the double threshold is significant at the 5% level, while the triple threshold does not meet the significance standard. It can be seen that there is a significant dual threshold effect between industrial digitalization and carbon productivity. Based on this, we adopt a dual threshold model of industrial transformation and upgrading to estimate the development mechanism of industrial digital enabling carbon productivity.
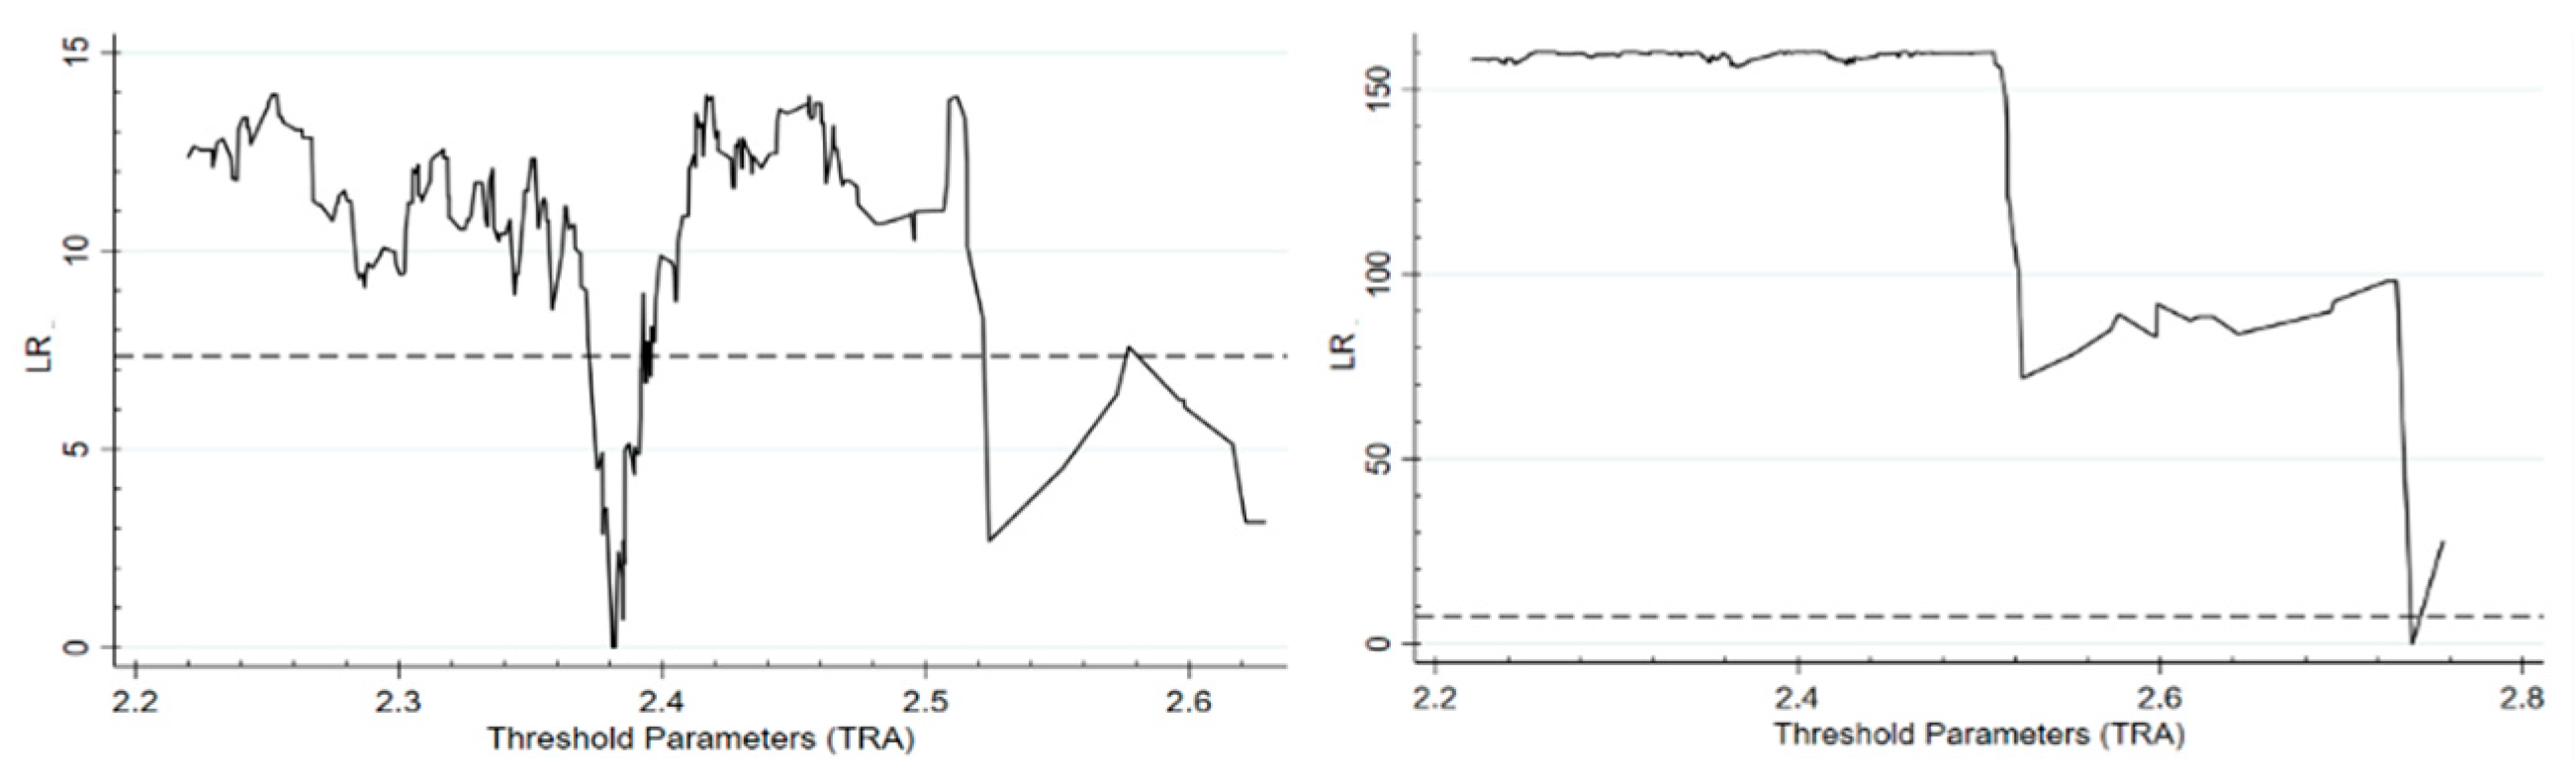
Second, the results of the estimation of the double threshold are shown in Table 7. Among them, the estimated values of the double threshold are 2.382 and 2.739, respectively, which are within the 95% confidence interval [2.375, 2.629] and [2.739, 2.739] respectively. Therefore, according to the threshold value, the sample data can be divided into three categories: primary industry transformation and upgrading (TRA ≤ 2.382), intermediate industry transformation and upgrading (2.382 < TRA ≤ 2.739) and senior industry transformation and upgrading (TRA > 2.739). At the same time, Figure 4 clearly reflects the estimated value of the threshold and the confidence interval. As can be seen from Figure 4, industrial digitalization has a significant industrial transformation and upgrading dual threshold effect on carbon productivity.
Furthermore, this paper divides different intervals based on the threshold values and employs the aforementioned first-difference generalized method of moments (GMM) to analyze the threshold effects and differences in industrial digitalization on carbon productivity across various levels of industrial transformation and upgrading.
It can be seen from Table 8 that when the level of industrial transformation and upgrading is low (TRA ≤ 2.382), industrial digitalization has a significant inhibitory effect on the development of carbon productivity; when the industrial transformation and upgrading is at the medium level (2.382 < TRA ≤ 2.739), the negative impact of industrial digitalization on carbon productivity is significantly weakened; with the gradual improvement of the level of industrial transformation and upgrading (TRA > 2.739), industrial digitalization can promote carbon productivity. The above results reflect that there is a significant threshold effect of industrial transformation and upgrading in the mechanism of industrial digital enabling carbon productivity. In general, when the industrial transformation and upgrading is at the primary and intermediate levels, industrial digitalization has a significant inhibitory effect on carbon productivity; as the level of industrial transformation and upgrading increases and exceeds the threshold (TRA > 2.739), industrial transformation and upgrading will improve carbon productivity to a certain extent. Thus, H2 is confirmed.

3.3.2. Spatial Spillover Effects of Industrial Digitalization Empowering Carbon Productivity

  • The spatial relationship between Industrial Digitalization and Carbon Productivity
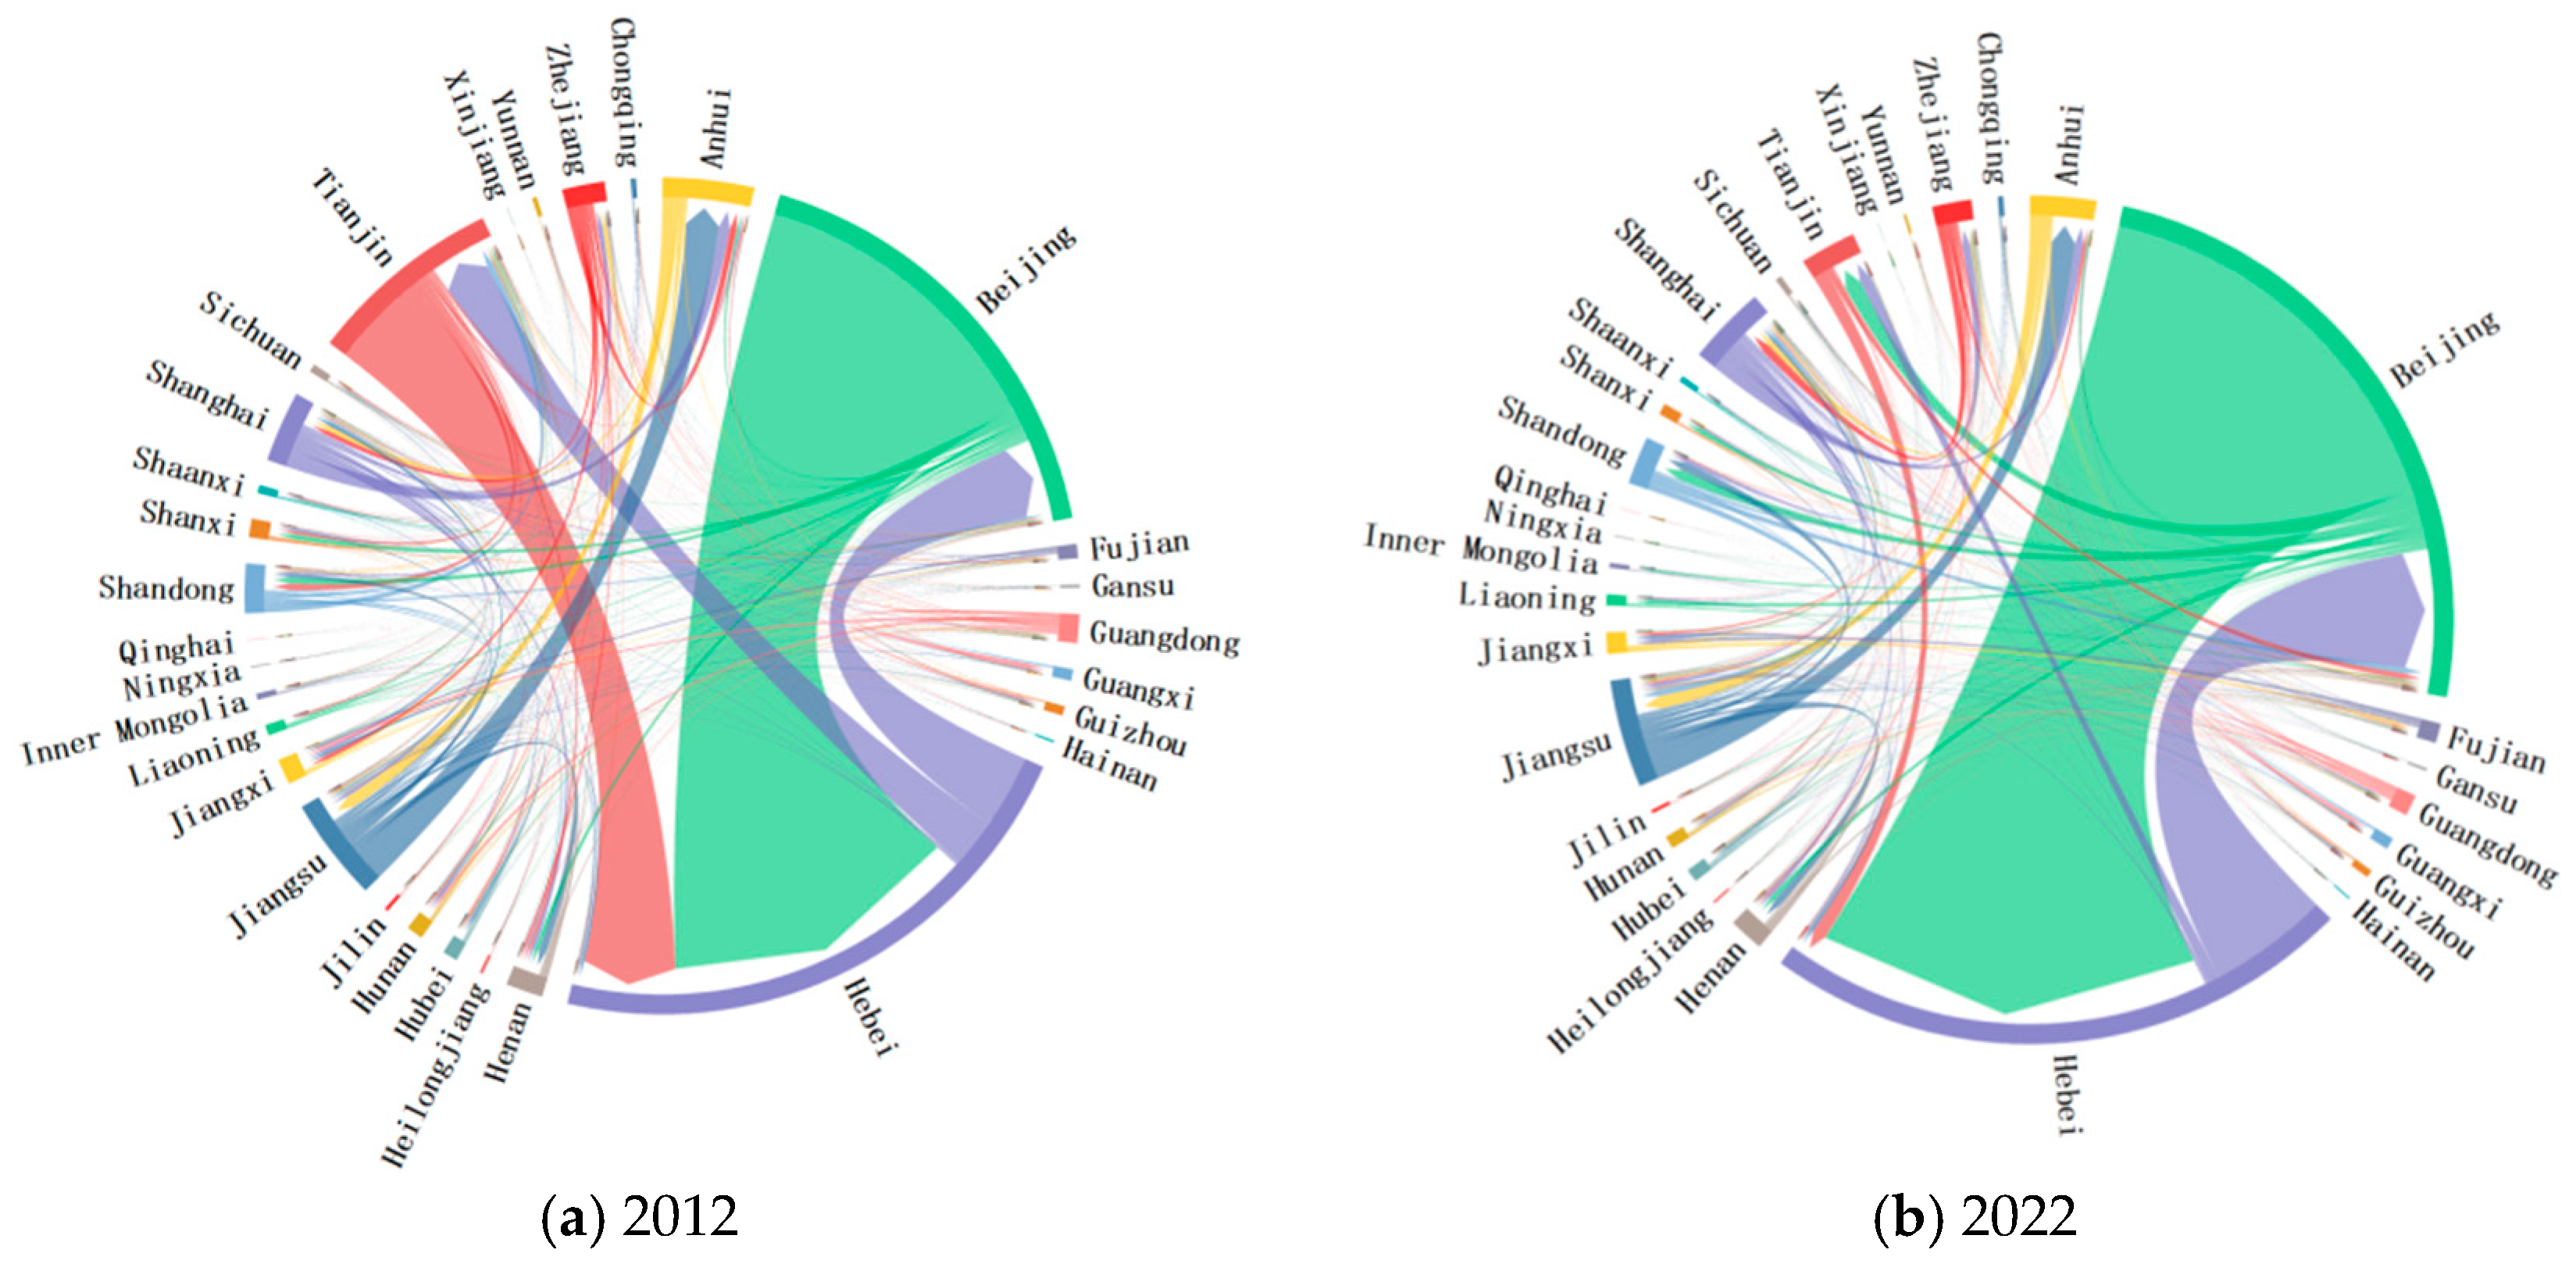
We used the global Morans’ I index to identify the spatial correlation of industrial digitalization, and the test results were all positive and passed the significance test, indicating that there is a significant spatial correlation in industrial digitalization. Subsequently, based on the modified gravity model, the spatial correlation strength between different provinces was calculated and visualized using a string graph, as shown in Figure 5.
The main reasons for this are twofold: Firstly, leading provinces in industrial digitalization, relying on digital industry, technology, and capital advantages, closely linking with neighboring provinces through digital industry transfer, technology promotion, and talent flow, helping them upgrade their industries digitally, optimize energy utilization, improve carbon productivity, and strengthen the spatial correlation of regional carbon productivity improvement. The second is the acceleration of regional integration, with each province breaking down administrative barriers and building a collaborative governance system. Under the background of industrial digitalization, they establish cross regional digital policy coordination, resource sharing, and benefit distribution mechanisms to promote the free flow and optimized allocation of low-carbon resource elements, and deepen the interactive cooperation among provinces in improving carbon productivity. Beijing, Hebei, Tianjin and other key provinces play a crucial role as “leaders” in the carbon productivity improvement network, serving as important hubs for the flow of low-carbon digital elements and collaborative carbon reduction in industries. Therefore, to enhance carbon productivity in the context of industrial digitalization, it is necessary to strengthen the vitality of regional digital low-carbon development, leverage the radiation effect of advantageous regions, encourage other regions to cultivate new growth poles, and promote comprehensive, coordinated, and sustainable improvement of regional carbon productivity.
2.
Analysis of regression results of spatial Durbin model
According to the gravity model, there is a significant spatial correlation between industrial digitization and carbon productivity. Therefore, constructing a spatial econometric model can more accurately measure the impact of industrial digitization on carbon productivity.
The LM test aims to determine the type of spatial effect and select the most appropriate spatial econometric model for subsequent analysis based on this. The specific test results are shown in Table 9. It can be seen from Table 9 that both Robust LM-lag and Robust LM-err are significant at the 1% significance level, indicating the simultaneous existence of spatial lag and spatial error correlation. LR-sdm-sar and LR-sdm-sem strongly reject the null hypothesis that SDM can be degraded to SAR or SEM, confirming the necessity of SDM setting. The above tests show that in the analysis of spatial dependence, spatial correlation is significantly present, the model setting is robust, and the spatial Durbin model (SDM) is a better model choice.
We have passed the LM test for industrial digitalization and selected the spatial Durbin model for analysis. The results are shown in Table 10. According to Table 10, the direct, indirect, and total effects of the level of industrial digitalization development are all positive and have passed the 1% significance test, indicating that the development of industrial digitalization in this region not only has a positive driving effect on the carbon productivity of the region, but also has significant spillover effects. The development of industrial digitalization not only has a positive impact on the improvement of carbon productivity in this region, but also has a significant driving effect on carbon productivity in other regions. Therefore, H3 is confirmed.
Among the control variables, the direct effect of the urbanization level is positive but not significant, while the indirect effect is significant and negative. The possible reason is that the negative externalities of urbanization, such as environmental pollution and resource competition, are transmitted among neighboring regions, leading to a decrease in carbon productivity in the local region. The direct effect of industrial structure is not significant, but the indirect and total effects are significantly positive. This may be due to the optimization of industrial structure in neighboring regions, such as the development of low-carbon and environmentally friendly industries, which reduce resource consumption and emissions, thereby producing a positive spillover effect on carbon productivity in the local region. The direct, indirect, and total effects of the degree of marketization are not significant, suggesting that while an increase in the degree of marketization may promote the efficient allocation of resources and the promotion of energy-saving and emission-reduction technologies, these positive effects may be offset by factors such as increased energy consumption resulting from market competition, leading to insignificant overall effects. The direct and total effects of openness to the outside world are negative, while the indirect effect is not significant. This indicates that openness may bring more industrial production and energy consumption, while the implementation of energy-saving and emission-reduction measures may lag behind economic development, resulting in a decrease in carbon productivity.

4. Discussion

First, based on panel data of industrial digitalization and carbon productivity for 30 provinces in China, this paper analyzes the mechanism through which industrial digitalization affects carbon productivity, and reveals the spatial heterogeneity between industrial digitalization and carbon productivity. The promotion effect of industrial digitalization on carbon productivity is relatively significant in the eastern and western regions. The industrial structure in the eastern region is dominated by high-tech industries and modern service industries, which are characterized by low carbon emission coefficients, thus leading to a more prominent marginal emission reduction effect of digital transformation. The western region benefits from its abundant renewable energy resources, which expand the path of green growth and provide clean energy support for industrial digitalization. The limited improvement effect on carbon productivity in the central region can be attributed to the fact that the central region is dominated by resource-processing and labor-intensive manufacturing industries, which face greater difficulties in digital transformation and find it difficult to change their high-carbon emission characteristics in the short term.
Secondly, with regard to the threshold of industrial transformation and upgrading; when industrial transformation and upgrading is low, regional industries are often dominated by energy-intensive and pollution-intensive activities. In such contexts, digital investments may concentrate on incremental automation or administrative digitization rather than fundamental process optimization, and the additional electricity demand from digital equipment and infrastructure can offset potential efficiency gains. Moreover, limited digital infrastructure, skilled labor, and absorptive capacity reduce adoption efficiency, making it difficult for digital technologies to translate into effective resource allocation and emissions reductions [29]. When industrial transformation and upgrading is at a medium level, complementary conditions improve but may still be insufficient for full-scale optimization across production and supply chains. Therefore, the negative effect of industrial digitization on carbon productivity is weakened, yet the net impact may remain adverse because structural dependence on traditional industries and the lag in low-carbon process upgrading persist. Once industrial transformation and upgrading surpasses the threshold, industrial digitization can more effectively improve carbon productivity. Regions at this stage typically have stronger digital infrastructure and more optimized industrial structures, enabling technologies such as industrial internet platforms, smart manufacturing, and data-driven energy management to support real-time monitoring, precise control, and factor reallocation. These mechanisms reduce waste and over-production, improve energy and resource utilization efficiency, and accelerate the shift toward higher value-added and lower-carbon activities, thereby promoting carbon productivity and contributing to the carbon-neutral (net-zero) transition [30,31].
Third, regarding the positive spillover effect of industrial digitalization on carbon productivity; while promoting the improvement of local carbon productivity, it also exerts a positive impact on carbon productivity in neighboring regions. Digitally advanced enterprises can export intelligent energy consumption management solutions and low-carbon technical standards to surrounding areas through supply chain linkages, driving supporting enterprises to achieve green transformation simultaneously. Cross-regional mobility of digital talents accelerates the diffusion of tacit knowledge and the replication of successful practices, thereby improving carbon productivity. In addition, neighboring regions can access high-quality digital services from developed areas at a relatively low cost, avoiding resource waste caused by redundant construction. However, the full release of this spillover effect depends on the neighboring regions’ absorptive capacity of digital technology, human capital stock, and institutional compatibility. Without effective coordination mechanisms and supporting policies, it is difficult to translate such spillovers into substantial improvements in carbon productivity.

5. Conclusions, Implications and Future Research Directions

5.1. Conclusions

1. The current level of digital development in China’s industries is relatively low, but it is showing a continuous upward trend. Among them, Guangdong Province, Jiangsu Province, and Zhejiang Province rank among the top three in terms of new quality productivity, while Qinghai Province has the lowest level of new quality productivity. The Gini coefficient in the three major regions of east, central, and west has been declining, and the polarization phenomenon between regions has weakened.
2. The digitalization of industries has a significant promoting effect on the improvement of carbon productivity, and the spatial heterogeneity is relatively significant. From the perspective of differences between the east, west, and central regions, industrial digitalization has a more significant effect on improving carbon productivity in the eastern and western regions, while its effect on improving carbon productivity in the central region is limited. From the comparison between plain and non-plain areas, the impact of industrial digitalization on carbon productivity in plain areas is more significant.
3. There is a significant heterogeneous threshold effect of industrial transformation and upgrading in the mechanism of industrial digitalization empowering carbon productivity. The lower level of industrial transformation and upgrading will significantly hinder the impact of industrial digitalization on carbon productivity. However, as industrial transformation and upgrading increase and exceed the critical value, it will effectively stimulate the driving effect of industrial digitalization, thereby promoting the improvement of carbon productivity, that is, the relationship between industrial digitalization and carbon productivity presents a “U” shape.
4. Spatial analysis shows that industrial digitalization can generate positive spatial spillover effects, which not only promote the improvement of local carbon productivity, but also have a positive impact on the carbon productivity of surrounding areas.

5.2. Theoretical Contribution

1. At the theoretical level, most existing studies have focused on the pathway mechanisms through which the digital economy influences carbon emissions and carbon productivity, with limited attention given to incorporating industrial digitalization, a subsystem of the digital economy, as a driving factor into the mechanism affecting carbon productivity. Especially against the backdrop of high-quality economic development, irrational industrial structures and significant heterogeneity in industrial transformation and upgrading coexist. Industrial digitalization, industrial transformation and upgrading, and carbon productivity do not exist in isolation but should be explored within a unified framework to investigate their synergistic effects. In response to these issues, we innovatively integrate industrial digitalization and industrial transformation and upgrading into the theoretical mechanism framework of carbon productivity. This framework addresses how to effectively leverage industrial transformation and upgrading to achieve industrial digitalization and boost carbon productivity under the “dual-carbon” target and verifies the nonlinear “threshold” heterogeneity factors arising from regional variations in industrial transformation and upgrading that impact industrial digitalization and carbon productivity. In addition, we empirically analyze the spatial spillover effects of industrial digitalization on carbon productivity and formulate targeted industrial digitalization strategies to promote the enhancement of carbon productivity, further expanding the theoretical analysis framework of carbon productivity.
2. As for the research systems, the existing literature has not yet established a unified measurement system for industrial transformation and upgrading. Therefore, we built an industrial digitalization evaluation index system and measurement framework including four subsystems of “industrial digitalization foundation—industrial digitalization investment—industrial digitalization capability—industrial digitalization application” and 13 indicators to comprehensively, scientifically and systematically measure the level of industrial digitalization in various regions, overcome the measurement errors caused by incomplete dimensions, and provide systematic reference for subsequent research. Secondly, we analyze the heterogeneous characteristics of industrial digitalization from a spatial-geographical perspective. Lastly, by employing a dynamic threshold model, we delve into the mechanism through which heterogeneity in industrial transformation and upgrading facilitates the enhancement of carbon productivity via industrial digitalization. Additionally, we empirically analyze the spatial spillover effects of industrial digitalization using a spatial Durbin model, adding new perspectives and content to existing research.
3. In a practical sense, different from the existing studies, we start with the differences in industrial transformation and upgrading, study the mechanism of digital enabling carbon productivity in regional industries, design the mechanism of improving carbon productivity, and clarify the development trend and differences (“new phenomenon”) in the process of improving carbon productivity in the region. Based on industrial transformation and upgrading, we build a modern and effective matching system, provide a solid basis for regional governments to formulate and improve carbon productivity, further activate the vitality of industrial digitalization, and give full play to the role of industrial digitalization in promoting carbon productivity.

5.3. Policy Recommendations

1. How to strengthen, optimize, and stabilize industrial digitalization in developing countries: According to our evaluation index data, firstly, promote digital infrastructure and improve industrial operation efficiency. Developing countries should fully promote the construction of “digital infrastructure” projects such as 5G networks, industrial internet and big data centers, improve network coverage and transmission rate, narrow the digital gap with developed countries, and improve industrial operation efficiency through intelligent and automated means to achieve low-carbon development. Second, strengthen scientific research investment and improve digital technology capabilities. Developing countries should provide sufficient financial support for scientific research activities through the establishment of incentive and preferential policies such as science and technology innovation funds, special funds or subsidy projects, strengthen the establishment of close scientific research cooperation with internationally renowned scientific research institutions, universities and enterprises, actively deploy digital technology innovation projects, and accelerate technological innovation and achievement transformation. Third, make rational use of data resources and deepen the digitalization of the industrial end. Developing governments should take the lead in opening up public data resources, encourage the establishment of data sharing platforms among countries, enterprises and industries, encourage enterprises to widely apply digital technology in production processes, business management and daily operations, improve the digital level of the upstream and downstream of the industrial chain, and promote the intelligent upgrading of the entire industrial chain.
2. Based on low-carbon economic development, digital transformation is a key driver to boost the high-quality development of the industry. Given the current situation, where digital economic facilities are imperfect and the proportion of traditional industries with high energy consumption and pollution is too large, industrial digitalization is an important means to help the economy move toward lower carbon and sustainable development. First, encourage scientific research innovation and accelerate the digital transformation of industry. Governments of developing countries should introduce a series of preferential policies such as tax relief, financial subsidies, low interest loans, etc., encourage enterprises to increase investment in digital and intelligent transformation, use digital technology to transform and upgrade industries, improve the production efficiency and product quality of enterprises, reduce energy consumption and carbon emissions, and improve carbon productivity. Second, strengthen international cooperation and learn from the experience of low-carbon development. Developing countries should actively cooperate with developed countries and international organizations, to introduce advanced industrial digital technology, and accelerate the process of domestic industrial digitalization. They can also learn from the successful experiences and cases of other developing countries in reducing emissions through industrial digitalization in the form of international forums and seminars, so as to avoid repeated trial and error. Finally, build a service platform to provide digital consulting and training services. Developing regions should use digital technology to build industrial digital services platforms to provide online technology consulting, solution display and case sharing for green transformation, and help enterprises to digitalize intelligence and low carbon production; less developed regions can also build digital talent training systems, rely on diversified channels such as higher education and vocational education, enhance the digital skills and low-carbon innovation capabilities of their employees, and jointly promote the low-carbon and efficient development of the industry.
3. In the process of promoting the improvement of carbon productivity, the heterogeneous role of industrial transformation and upgrading cannot be ignored. Governments should formulate optimal driving paths and implement heterogeneous governance strategies based on the specific conditions in different regions. For regions with low industrial transformation and upgrading, these regions still face challenges in many aspects, such as high pressure on industrial structure adjustment and upgrading, excessive consumption of energy and resources, which makes industrial transformation and upgrading more difficult. Therefore, these regions should promote the coordinated development of traditional and emerging industries, as well as the green transformation of traditional industries such as steel smelting, petrochemical and chemical industries, and textile industries, which have low resource utilization, high energy consumption and severe environmental pollution; these regions should also increase support for green and low-carbon industries such as e-commerce and platform economy, encourage enterprises to develop and produce low-carbon and environmentally friendly products and services, reduce carbon emission intensity and improve carbon productivity. For regions with high industrial transformation and upgrading, these regions should make full use of the radiation effect of surrounding developed regions and the agglomeration effect of urban agglomerations, implement policies such as financial subsidies and tax incentives to encourage internet enterprises to continue to penetrate into the industry, boost the growth of emerging industries such as information technology and biomedicine, gradually adjust and optimize the spatial layout of regional industries, increase the proportion of clean energy use, strengthen the substitution of electric energy for traditional energy, and enhance energy efficiency, so as to achieve the purpose of improving carbon productivity.
4. As an emerging “growth engine”, industrial digitalization not only enhances carbon productivity locally, but also has a wide-ranging positive impact on surrounding regions. In regions with advanced industrial digitalization, it is necessary to accelerate the efficient integration and optimization of core elements such as information and data at various nodes of the industrial chain and across regions. Through close cooperation between regions, we can jointly build infrastructure such as digital industrial parks and intelligent energy management systems, achieve efficient allocation and sharing of resources, and build a solid digital service platform for various industries. Based on this platform, it can effectively reduce the operational energy consumption of enterprises, significantly improve carbon productivity, and further enhance their competitiveness in the green and sustainable development market.

Author Contributions

X.C.: conceptualization, methodology, validation, data curation, writing—review and editing, funding acquisition, resources. Y.Z.: supervision, conceptualization, methodology, analysis, investigation, resources, data curation, writing—original draft. F.Y.: supervision, conceptualization, methodology, analysis, investigation, resources, data curation, writing—original draft. All authors have read and agreed to the published version of the manuscript.

Funding

This research received no external funding.

Institutional Review Board Statement

No applicable.

Informed Consent Statement

No applicable.

Data Availability Statement

The original contributions presented in this study are included in the article. Further inquiries can be directed to the corresponding author.

Conflicts of Interest

The authors declare no conflict of interest.

References

  1. International Energy Agency. CO2 Emissions in 2023. 2024. Available online: https://www.iea.org/reports/co2-emissions-in-2023 (accessed on 23 February 2026).
  2. World Bank. Global Economic Prospects: Weak Growth Amid Rising Risks; [Research report]; World Bank: Washington, DC, USA, 2024; Available online: https://www.worldbank.org/en/publication/global-economic-prospects (accessed on 20 March 2024).
  3. Pan, J.; Cross, J.L.; Zou, X.; Zhang, B. To tax or to trade? A global review of carbon emissions reduction strategies. Energy Strategy Rev. 2024, 55, 101508. [Google Scholar] [CrossRef]
  4. China Academy of Information and Communications Technology. Research Report on the Development of China’s Digital Economy. 2023. Available online: https://dsj.hainan.gov.cn/2023gbztzl/rmzt/szzgjs/acwj/202305/t20230510_3413998.html (accessed on 23 February 2026).
  5. Vial, G. Understanding digital transformation: A review and a research agenda. Manag. Digit. Trans-Form. 2019, 28, 118–144. [Google Scholar] [CrossRef]
  6. Lin, D.; Duan, Y.; Ma, J. Industrial Digitalization And Regional Innovation Efficiency: Evidence from 30 Provinces and Cities in China. Transform. Bus. Econ. 2024, 23, 161. [Google Scholar]
  7. Kang, S.; Shang, Y. How artificial intelligence drives industrial digitalization and greening synergies? Evidence from China’s AI innovation and development pilot zones. Technol. Soc. 2025, 83, 103011. [Google Scholar] [CrossRef]
  8. Zhuofan, Y. Models, Shortcomings, and Countermeasures of China’s Industrial Digital Transformation. China Bus. Mark. 2020, 34, 60–67. [Google Scholar] [CrossRef]
  9. Zhou, X.; Zhou, D.; Zhao, Z.; Wang, Q. A framework to analyze carbon impacts of digital economy: The case of China. Sustain. Prod. Consum. 2022, 31, 357–369. [Google Scholar] [CrossRef]
  10. Wang, Y. The impacts of improvements in the unified economic and environmental efficiency of transportation infrastructure on industrial structure transformation and upgrade from the perspective of resource factors. PLoS ONE 2022, 17, e0278722. [Google Scholar] [CrossRef]
  11. Zhu, W.; Zhu, Y.; Lin, H.; Yu, Y. Technology progress bias, industrial structure adjustment, and regional industrial economic growth motivation—Research on regional industrial transformation and upgrading based on the effect of learning by doing. Technol. Forecast. Soc. Change 2021, 170, 120928. [Google Scholar] [CrossRef]
  12. Wang, X. Application of internet of things technology to promote high-quality development of resource-based city industrial transformation and upgrading demonstration areas. Mob. Inf. Syst. 2022, 2022, 9263632. [Google Scholar] [CrossRef]
  13. Yang, Z.; Duan, J.; Fan, N. Towards carbon neutrality: The decoupling effect of industrial restructuring and non-fossil energy substitution on carbon emissions. Energy 2024, 308, 132787. [Google Scholar] [CrossRef]
  14. You, J.; Zhang, W. How heterogeneous technological progress promotes industrial structure upgrading and industrial carbon efficiency? Evidence from China’s industries. Energy 2022, 247, 123386. [Google Scholar] [CrossRef]
  15. Dai, S.; Wang, C.; Meng, F.; Gu, W.; Tian, J. Optimizing carbon responsibility allocation in the steel supply chain: A cradle-to-cradle life cycle assessment approach. Struct. Change Econ. Dyn. 2025, 75, 590–605. [Google Scholar] [CrossRef]
  16. Han, J.; Ouyang, W.; Gai, Z.; Feng, Z. Optimizing Resource Allocation to Enhance Sustainable Management of Agricultural Enterprises: Insights from Biological Asset Management Practices of Listed Companies in China. Agribusiness 2025, 1–18. [Google Scholar] [CrossRef]
  17. Lyu, X.; Pang, Z.; Xu, Y. Has the digital transformation promoted energy-saving-biased technological progress in China’s manufacturing sector? Appl. Econ. 2025, 57, 1637–1654. [Google Scholar]
  18. Kotulic, R.; Pavelkova, J.; Vozarova, I.K.; Vavrek, R. Managerial view on the production analysis in agriculture-the application of the Cobb-Douglas production function. In International Multidisciplinary Scientific Conferences on Social Sciences and Arts Sgem; SGEM: Albena, Bulgaria, 2014; pp. 459–466. [Google Scholar]
  19. Dong, Z.; He, Y.; Wang, H.; Wang, L. Is there a ripple effect in environmental regulation in China?–Evidence from the local-neighborhood green technology innovation perspective. Ecol. Indic. 2020, 118, 106773. [Google Scholar] [CrossRef]
  20. Jiang, H.; Elahi, E.; Gao, M.; Huang, Y.; Liu, X. Digital economy to encourage sustainable consumption and reduce carbon emissions. J. Clean. Prod. 2024, 443, 140867. [Google Scholar] [CrossRef]
  21. Zhai, Z.; Zhang, T.; Yi, M.; Guan, Y.; Zhou, Y. Digital economy and the synergistic governance of pollutants and carbon emissions: Facilitation or obstruction? Environ. Res. 2024, 258, 119470. [Google Scholar] [CrossRef]
  22. Chang, H.; Ding, Q.; Zhao, W.; Hou, N.; Liu, W. The digital economy, industrial structure upgrading, and carbon emission intensity——Empirical evidence from China’s provinces. Energy Strategy Rev. 2023, 50, 101218. [Google Scholar] [CrossRef]
  23. Huang, C.; Lin, B. Digital economy solutions towards carbon neutrality: The critical role of energy efficiency and energy structure transformation. Energy 2024, 306, 132524. [Google Scholar] [CrossRef]
  24. Xiao, Y.; Ma, D.; Zhang, F.; Zhao, N.; Wang, L.; Guo, Z.; Zhang, J.; An, B.; Xiao, Y. Spatiotemporal differentiation of carbon emission efficiency and influen-cing factors: From the perspective of 136 countries. Sci. Total Environ. 2023, 879, 163032. [Google Scholar] [CrossRef]
  25. Ge, L.; Mo, L.; Huang, N. Development of digital economy upgrading of industrial structure urban carbon emission. Mod. Financ. Econ. J. Tianjin Univ. Financ. Econ. 2022, 42, 20–37. [Google Scholar]
  26. Li, L.; Cai, Y.; Liu, L. Research on the effect of urbanization on China’s carbon emission efficiency. Sustainability 2019, 12, 163. [Google Scholar] [CrossRef]
  27. Hao, Y.; Wu, Y.; Wu, H.; Ren, S. How do FDI and technical innovation affect environmental quality? Evidence from China. Environ. Sci. Pollut. Res. 2020, 27, 7835–7850. [Google Scholar]
  28. Yi, M.; Liu, Y.; Sheng, M.S.; Wen, L. Effects of digital economy on carbon emission reduction: New evidence from China. Energy Policy 2022, 171, 113271. [Google Scholar] [CrossRef]
  29. Qian, W.; Liu, H.A.; Pan, F.H. Digital economy, industry heterogeneity, and service industry resource allocation. Sustainability 2022, 14, 8020. [Google Scholar] [CrossRef]
  30. Zeng, P.; Wang, Y.; Tian, Z. Regional differences source decomposition formation mechanism of urban digital economy energy market integration in China. J. Clean. Prod. 2024, 451, 141960. [Google Scholar] [CrossRef]
  31. Luo, K.; Liu, Y.; Chen, P.-F.; Zeng, M. Assessing the impact of digital economy on green development efficiency in the Yangtze River Economic Belt. Energy Econ. 2022, 112, 106127. [Google Scholar] [CrossRef]
Figure 1. China’s industrial digitalization development level.
Sustainability 18 03032 g001
Figure 2. Dagum Gini coefficient for industrial digitalization.
Sustainability 18 03032 g002
Figure 3. Industrial digitalization density map.
Sustainability 18 03032 g003
Figure 4. Threshold confidence interval of industrial transformation and upgrading (TRA).
Sustainability 18 03032 g004
Figure 5. Industrial digitalization spatial correlation network.
Sustainability 18 03032 g005
Table 1. Evaluation indicator system of industrial digitalization.
Primary IndicatorsSecondary IndicatorsVariable DescriptionAttributeWeight
Industrial digitalization foundationFiber optic cable coverageLength of optical cable line (km)+7.02%
Internet popularizationNumber of internet broadband access ports/number of permanent residents at the end of the year (%)+4.16%
Scientific and technological supportProportion of science and technology expenditure in public finance expenditure (%)+7.98%
Mobile phone popularizationMobile phone popularization (department/hundred people)+2.93%
Internet broadband popularizationInternet broadband penetration rate (households/person)+4.21%
Industrial digitalization investmentR&D personnel in industrial enterprisesFull-time equivalent of R&D personnel in industrial enterprises above designated size (ten thousand people)+14.35%
R&D funding supportR&D expenditure as a percentage of GDP (%)+6.84%
Industrial digitalization capabilityE-commerce transactionsE-commerce sales revenue (ten thousand yuan)+14.43%
Software revenueSoftware business revenue (ten thousand yuan)+18.64%
Proportion of high-tech professionalsProportion of computer service and software professionals (%)+10.04%
Computer usageNumber of people using computers per 100 people (units/Hundred people)+4.87%
Industrial digitalization applicationE-commerce enterprisesProportion of e-commerce enterprises (%)+3.32%
corporate websiteNumber of websites per hundred enterprises (number per- hundred)+1.21%
Table 2. Descriptive statistics of the variables.
Variable AbbreviationCalculation MethodMeanP50S.DMinMax
DIGindicator construction0.2000.1590.1340.0440.756
CARGDP/CO20.9650.7570.8230.0826.128
TRA i = 1 3 x i , m , t × i 2.3922.3820.1262.1822.836
URBurban permanent residents/Region’s total population0.6080.5930.1170.3630.896
OPEtotal import and export trade volume/GDP0.2650.1450.2680.0081.354
CONtotal retail sales of consumer goods in society/GDP0.3820.3880.0690.1830.603
MARMarketization index8.2508.3371.9153.35912.864
Table 3. Baseline results of industrial digitalization and carbon productivity.
VariableWithout Control Variables (1)With Control Variables (2)With Control Variables (3)With Control Variables (4)With Control Variables (5)
DIG3.995 ***
(18.74)
5.066 ***
(15.73)
5.234 ***
(16.20)
5.219 ***
(15.60)
4.518 ***
(11.73)
URB −2.283 ***
(−4.35)
−2.655 ***
(−4.97)
−2.719 ***
(−4.27)
−2.307 ***
(−3.63)
CON 0.936 ***
(2.95)
0.938 ***
(2.95)
0.825 ***
(2.63)
MAR 0.006
(0.19)
0.023
(0.73)
OPEN −0.839 ***
(−3.48)
Provincial Fixed EffectsControlledControlledControlledControlledControlled
Year Fixed EffectsControlledControlledControlledControlledControlled
Constant Term0.165 ***
(3.67)
1.338 ***
(4.89)
1.173 ***
(4.25)
1.166 ***
(4.18)
1.181 ***
(4.32)
R20.5460.5670.5800.5800.596
Number of Observations330330330330330
Note: *** denote significance at the 1% level.
Table 4. Robustness and endogeneity tests.
VariableChange the Time Window (1)Adjust the Sample
(2)
GMM Regression
(3)
DIG5.128 ***
(11.04)
2.143 ***
(8.38)
0.546 **
(1.98)
Lagged term of the dependent variable 0.733 ***
(8.48)
Control variableControlledControlledControlled
Provincial Fixed EffectsControlledControlledControlled
Year Fixed EffectsControlledControlledControlled
Constant Term1.285 ***
(4.02)
−0.532
(−3.22)
R20.6060.647
AR (1) 0.000
AR (2) 0.288
Sargan inspection 0.012
Observed value270286270
Note: **, and *** denote significance at the 5% and 1% levels, respectively.
Table 5. Results of regional heterogeneity.
VariableEastern Region
(1)
Central Region (2)Western Region
(3)
Plain Area
(4)
Non-Plain Area (5)
DIG4.687 ***
(7.92)
3.258 ***
(3.17)
7.385 ***
(7.15)
5.724 ***
(10.26)
2.640 ***
(5.71)
Control VariablesControlledControlledControlledControlledControlled
Province Fixed EffectsControlledControlledControlledControlledControlled
Year Fixed EffectsControlledControlledControlledControlledControlled
Constant Term4.801 ***
(6.11)
−0.462
(−0.75)
1.524 ***
(3.07)
2.837 ***
(5.47)
−0.710 ***
(−3.02)
R20.6470.8470.6400.7170.615
Observations14366121165154
Note: *** denote significance at the 1% level.
Table 6. Threshold effect test.
Critical Value
F-Value p-Value BS Times 1%5%10%
Single threshold73.527 ***0.00730071.50035.16816.043
Double threshold9.926 **0.04730017.9649.7586.612
Triple threshold0.0000.1033000.0000.0000.000
Note: ** and *** denote significance at the 5% and 1% levels, respectively.
Table 7. Threshold estimation results.
ThresholdThreshold Estimate95% Confidence Interval
Single threshold2.739[2.739, 2.739]
Double threshold2.382[2.375, 2.629]
2.739[2.739, 2.739]
Triple threshold2.552[2.552, 2.598]
Table 8. Parameter estimation results.
VariableCoef.Std. Err.Zp Value[95% Conf. Interval]
L1.1.052865 ***0.0075356139.720.000[1.0380951.067634]
L2.−0.046465 ***0.0107211−4.330.000[−0.0674779−0.0254521]
URB−0.1640073 ***0.0308319−5.320.000[−0.2244367−0.103578]
OPE0.0839705 ***0.01794764.680.000[0.04879390.1191471]
CON0.0901897 **0.04080182.210.027[0.01021970.1701597]
MAR0.013018 ***0.00265524.900.000[0.00781390.0182222]
DIG(TRA ≤ 2.382)−0.2192954 ***0.0556509−3.940.000[−0.3283332−0.1101855]
DIG(0.958 < TRA ≤ 2.739)−0.1617879 ***0.0417977−3.870.000[−0.24371−0.0798658]
DIG(TRA > 2.739)0.487719 ***0.07844996.220.000[0.333960.6414781]
_cons0.01402380.03245010.430.666[−0.04957730.0776248]
Note: ** and *** denote significance at the 5% and 1% levels, respectively.
Table 9. Spatial dependence test of carbon productivity.
TestStatisticp-Value
Robust LM_lag5.623 **0.018
Robust LM_err10.930 ***0.001
LR_sdm_sar149.28 ***0.000
LR_sdm_sem143.91 ***0.000
Wald_sar189.25 ***0.000
Wald_sem167.04 ***0.000
Note: **, and *** denote significance at the 5% and 1% levels, respectively.
Table 10. Decomposition results of spatial effects on carbon productivity.
Influencing FactorsLR_DirectLR_IndirectLR_Total
DIG1.0637 ***
(5.48)
0.9749 **
(2.33)
2.0386 ***
(4.97)
URB2.4469
(1.45)
−30.3516 ***
(−12.03)
−27.9047 ***
(−12.39)
CON0.1197
(0.38)
2.6546 ***
(3.71)
2.7743 ***
(3.50)
MAR0.0257
(0.96)
0.0697
(1.06)
0.0954
(1.37)
OPEN−0.3234
(−1.28)
−0.0686
(−0.16)
−0.3921
(−0.83)
Note: ** and *** denote significance at the 5% and 1% levels, respectively.
Disclaimer/Publisher’s Note: The statements, opinions and data contained in all publications are solely those of the individual author(s) and contributor(s) and not of MDPI and/or the editor(s). MDPI and/or the editor(s) disclaim responsibility for any injury to people or property resulting from any ideas, methods, instructions or products referred to in the content.