Article

Microplastics in Mediterranean Agricultural Soils: Effects on Soil Properties, Metal Accumulation in Plants, and Implications for Sustainable Agroecosystems

by
Dimitrios Alexiadis
1,
Evangelia E. Golia
1,*,
Rafaella Vogia
1,
Vasiliki Liava
1,2 and
Ana Pérez-Gimeno
3
1
Soil Science Laboratory, School of Agriculture, Faculty of Agriculture, Forestry and Natural Environment, Aristotle University of Thessaloniki, University Campus, 541 24 Thessaloniki, Greece
2
Department of Agriculture, Crop Production and Agricultural Environment, University of Thessaly, 384 46 Volos, Greece
3
Department of Agrochemistry and Environment, University Miguel Hernández of Elche, 03202 Elche, Spain
*
Author to whom correspondence should be addressed.
Sustainability 2026, 18(6), 2777; https://doi.org/10.3390/su18062777
Submission received: 15 January 2026 / Revised: 25 February 2026 / Accepted: 11 March 2026 / Published: 12 March 2026

Abstract

The influence of three different types of microplastics (PE, PET, and PS) on soil physicochemical properties is the main scope of the present investigation. To this end, a pot experiment has been conducted, incorporating each kind of microplastic (MP) in two different soil samples in equal portions. The soils were typical of Mediterranean areas, moderately contaminated with Pb and Zn. Furthermore, two different plants, Nicotiana tabacum L. (Burley cv.) and Cannabis sativa L. (Fedora cv.), were planted to study the influence of a multi-contaminated soil environment on plant growth, along with their ability to absorb metals in their tissues. The addition of microplastics caused stronger reactions in slightly acidic soil, where the bioavailability of zinc and lead increased by 5–20% compared to alkaline soil rich in CaCO3. Plant-to-soil indices have been calculated to monitor the plant’s capacity to transfer metals from the soil environment to plant tissues. PE induced the strongest and most consistent responses, increasing Zn and Pb bioavailability and systematically enhancing total concentration factors (TC), bioaccumulation factors (BAF), and translocation factors (TF) by up to 20%, particularly in acid soil, while PET reduced the mobility of metals on the surface while enhancing vertical transport, and PS caused moderate but stable changes. Plant responses were cultivar-dependent. Plant biomass increased by approximately 7–15% in Cannabis sativa L. (cv. Fedora 17), while Nicotiana tabacum L. (cv. Burley) showed greater sensitivity to the presence of microplastics. Even low MP inputs can subtly but persistently modify soil structure, metal dynamics, and soil–plant transfer processes without increasing total metal loads, highlighting the importance of soil chemistry and polymer type in assessing the environmental risk of microplastics for sustainable agroecosystems.

1. Introduction

It is well-known that environmental pollution is one of the major problems humanity has been facing since ancient times [1]. However, in recent decades, pollution, combined with the immense increase of the human population on earth, seems to pose a significant threat to the quality of human life [2]. Heavy metals are known to pose a health risk to adults and children in large, densely populated cities, mainly due to various human activities [3]. In rural environments, their presence is still dangerous, although their levels would be expected to be very low compared to urban or industrial areas. There are numerous studies showing that Cd is found in phosphorus-based fertilizers [4,5]. Diakoloukas et al. [6] concluded that Cd and Fe concentrations have been steadily increasing in four soil classes (Alfisols, Verisols, Endisols, and Inceptisols) where phosphate fertilizers have been used extensively for at least 10 years. In addition, in rural areas, farmers have used older technology wheeled vehicles equipped with burners suitable for leaded fuels [7].
The use of unleaded gasoline was introduced relatively recently, but areas alongside national and rural roads were already contaminated with high levels of Pb, Zn, and other heavy metals [8]. The researchers, Prokeš et al. [9], found high levels of Pb in soils and grapes grown on farms near highways or national roads.
Plastic pollution is frightening even at the sound of its name, as it reflects the magnitude of the dangers it poses but also the enormous extent of its global reach. Kibria et al. [10] have found that plastic pollution of varying chemical composition accounts for a great part of total pollution on land, higher than the percentage of pollution in the sea and oceans. According to the United Nations Environment Program (UNEP) [11], microplastic pollution on land (terrestrial) is many times higher than in the ocean, with estimates suggesting it could be 4 to 23 times higher. On terrestrial soils, the most common types of plastic are poly(ethylene) (PE), polypropylene (PP), polystyrene (PS), poly(ethylene terephthalate) (PET), poly(vinyl-chloride) (PVC), polyamide (PA, e.g., nylon), and rubber and synthetic elastomers [12]. In agricultural areas, the presence of PE predominates, reaching 40–75% [13], while in urban areas, PS seems to be more common due to its frequent use in disposable food containers and coffee cups [14].
Polymers enter soil systems and generate various problems, mainly due to their size and chemical composition [15]. Polymers that are between 5 and 20 mm in size are classified as mesoplastics, while those that are less than 5 mm in size are classified as microplastics (MPs). Those that are even smaller are called nanoplastics (smaller than 1 μm), which can penetrate plant roots and cause physical growth problems [16]. However, even if plastics do not enter plants, they can trigger various changes in metabolism, as they activate several indirect changes in plants by modifying the plant-growing environment. The researchers, Erdem et al. [17], found that the presence of PE in the soil caused a decrease in soil pH and an increase in electrical conductivity, along with nutrient imbalance. On the other hand, Gharahi and Zamani-Ahmadmahmoodi [18] found that the presence of PET fragments in the soil caused a decrease in soil pH and, at the same time, an increase in soil organic matter. On the other hand, Liu et al. [19] found that PS MPs caused changes in soil acidity, enhancing soil pH and influencing Solanum lycopersicum L. growth. Chen et al. [20] explained that the MPs induced changes in both chemical and physical properties, entering and remaining in the soil environment.
The coexistence of MPs and heavy metals (HMs) is a challenge that humanity must address, as it is self-evident that in areas where pollution exists, there is often more than one type of pollutant [21]. Bethanis and Golia [22] found that the joint presence of MPs and HMs does not simply create double pollution in the soil, but rather the adverse effects of this can be multiplied, posing a threat to soil health. The function of soil microbes is significantly altered, disrupting various balances within the soil ecosystem, as found by Trojan et al. [23]. It also disrupts both the carbon and nitrogen cycles, creating serious soil fertility issues (Liu et al. [24]). In addition, researchers Chen et al. [20] found that metal ions are adsorbed onto the surface of polymers, so MPs often act as carriers of heavy metals.
MPs together with HMs in soils alter plants’ behavior as far as metal accumulation is concerned [25]. Apart from the fact that MPs can enter the plant, they can significantly alter the way and the amount of nutrients that plants can absorb. Oladimeji et al. [26] found that by altering the physicochemical properties of the soil, MPs cause chain reactions in the availability of trace elements in the soil and, consequently, in their uptake by plants. It is therefore possible to alter the ability of plants to absorb both essential and toxic elements, causing changes in soil pollution levels [27].
Despite increasing research on the presence of MPs in soil, available information on the combined effects of various microplastic polymers and heavy metals on soil chemical properties and soil–plant transfer processes under contrasting soil conditions is limited. In particular, comparative studies that simultaneously assess the effects of specific polymers on metal bioavailability and plant uptake in Mediterranean agricultural soils remain scarce.
The present study offers a new assessment of the combined effects of three common microplastic polymers (poly(ethylene), poly(ethylene terephthalate), and polystyrene) and heavy metals on soil properties and metal uptake by plants. By simultaneously examining two different crops, Nicotiana tabacum L. (Burley cv.) and Cannabis sativa L. (Fedora cv.), grown in soils with different properties, the research provides new information regarding the effects of selected polymers on metal bioavailability and transport processes from soil to plants.

2. Materials and Methods

2.1. Soil Sampling, Pot Filling, and Plant Growth Experiment

A randomized experiment was conducted using two soils (Soil 1 and Soil 2), where PE, PET, and PS MPs were added at 2% v/v. Two plants, Cannabis sativa L. (cv. Fedora 17) and Nicotiana tabacum (cv. Burley), were cultivated in the soil–MPs mixtures. The soil samples were selected from agricultural areas in central and northern Greece. Specifically, the first soil (S1) was collected from the largest cultivation area of Greece, placed in central Greece (Thessaly) [28]. The second soil (S2) was collected from a cultivation area of northern Greece, near Thessaloniki city [25]. The two soil samples consisted of four sub-samples from an area with a radius of approximately 1 m. They were selected for having almost equal contamination of Pb and Zn for the purposes of the present study.
Three replications were carried out for each pot of this experiment. After concluding preliminary tests and experiments, 2% v/v was decided to be the appropriate content of MPs in the pots [29]. The number of pots came from the design of the experiment, which was: (1 control soil + 1 soil with application) × 2 soils × 2 plants × 3 replicates × 3 plastic types = 36 pots. The pots were sizable enough so that the plants could develop their root systems and grow. All experimental pots containing soil treatments had a volume of 5.1 L. The MPs were then added to the pots at a ratio of 2% v/v, as shown to be the representative content of MPs in Mediterranean agricultural soils in previous studies [22,25,30]. To ensure proper incorporation of the plastics, the soil samples were moistened and maintained at a moisture content of 60–65%. Seedlings were transplanted one month after the initial addition of the powder. The growth period was 128 days for Cannabis sativa and 139 days for Nicotiana tabacum [25].

2.2. Physicochemical Analysis of Soil and Plant Tissue

Particle-size distribution was determined using the Bouyoucos hydrometer method following standard procedures for sedimentation analysis. Soil samples were air-dried and passed through a 2 mm sieve in order to be ready for physicochemical analyses [31]. Approximately 50 g of soil was dispersed in a solution containing sodium hexametaphosphate (5% w/v) and shaken mechanically for 12 h. The suspension was transferred into a 1 L sedimentation cylinder and brought to volume with deionized water. Hydrometer readings were taken at 40 s and 2 h to determine sand, silt, and clay fractions, applying temperature corrections when necessary.
The electrical conductivity (EC) was measured in a 1:1 soil-to-water extract. Ten grams of air-dried, 2 mm sieved soil were mixed with 10 mL of deionized water and mechanically shaken for 1 h. The suspensions were allowed to equilibrate for an additional 30 min before measurement. EC was determined by using a calibrated conductivity meter with temperature compensation.
The soil’s pH was measured potentiometrically in a 1:2.5 soil–water suspension. Ten grams of air-dried and sieved soil were mixed with 25 mL of deionized water and stirred thoroughly. The mixture was allowed to stand for 30 min with occasional agitation. pH was recorded using a glass combination electrode calibrated with pH 4.00 and 7.00 buffer standards.
DTPA-extractable Zn and Pb were determined using the Lindsay and Norvell [32] method. A 10 g sample of air-dried, <2 mm soil was extracted with 20 mL of a DTPA solution of 0.005 M DTPA, 0.01 M CaCl2, and 0.1 M triethanolamine, adjusted to pH 7.3. The suspension was shaken for 2 h at room temperature and filtered through Whatman No. 42 paper (Sigma Aldrich, Darmstadt, Germany).
Total elemental concentrations, both in soil and plant tissues, were analyzed using an aqua regia digestion system. Approximately 0.5 g of finely ground soil (<2 mm) was placed in a digestion vessel and treated with 9 mL of concentrated hydrochloric acid (HCl, 37%) and 3 mL of concentrated nitric acid (HNO3, 65%) in a 3:1 ratio. The thermal program of the closed system was followed by heating for 1 h at 120 °C and 2.5 h at 240 °C [33]. Elemental concentrations were measured using an atomic absorption spectrophotometer (Shimatzu 6300, Kyoto, Japan), with flame or graphite furnace equipment, according to their detection limits. A certified material for soil, as well as for plant tissues, has been used to maintain the accuracy and reproducibility of the measurements.

2.3. Soil and Plant Metals Indices

Soil pollution indices were calculated according to Golia et al. [34] study, as follows.
Bioavailability Factor (BF), the Bioavailability Factor (BF) was used to assess the proportion of metals in soil that are potentially available for plant uptake. It was calculated as the ratio of DTPA-extractable metal concentration (CDTPA) to the total metal concentration (CTotal) expressed as a percentage:
BF   ( % ) = C DTPA × 100 C Total
where C DTPA represents the DTPA-extractable metal fraction, and C Total represents the total metal concentration.
The degree of soil contamination was evaluated using the Contamination Factor (CF):
CF = C S C RefS
where C S is the measured metal concentration in the soil sample and C RefS is the background reference concentration in uncontaminated soils, according to Kabata-Pendias [35] (Zn: 70 mg/kg, Pb: 20 mg/kg). Soils were classified into four categories based on CF values: CF < 1 (class I, pristine soil), CF = 1–3 (class II, moderate contamination), CF = 3–6 (class III, considerable contamination), and CF > 6 (class IV, very high contamination).
The Geo-accumulation Index (Igeo) was calculated as
I geo = l o g 2 C S 1.5 × C RefS
where the factor 1.5 accounts for potential natural variations in background concentrations due to lithogenic effects. Based on Igeo values, soils were classified following Tomczyk et al. [36] into seven categories: Igeo < 0 (class I, unpolluted), 0–1 (class II, unpolluted to moderately polluted), 1–2 (class III, moderately polluted), 2–3 (class IV, moderately to heavily polluted), 3–4 (class V, heavily polluted), 4–5 (class VI, heavily to extremely polluted), and >5 (class VII, extremely contaminated).
The Transfer Factor (TF) was used to quantify the efficiency of metal transfer from soil to plant roots. Metals were quantified in both plant roots and corresponding soil samples using ICP–OES or AAS after digestion with aqua regia (soil) or nitric acid (plant tissue). TF was calculated according to the following equation:
TF = C root C soil
where C root (mg kg−1 dry weight) is the concentration of the element in plant root tissues and C soil (mg kg−1) is the concentration of the element in the corresponding soil sample.
The Bioaccumulation Factor (BAF) was used to assess the overall accumulation of metals by plant shoots relative to soil concentrations. Metal concentrations in shoot tissues were measured after nitric acid digestion, and soil concentrations were obtained from aqua regia digests. BAF was calculated using
BAF = C shoot C soil
where C shoot (mg kg−1 dry weight) is the metal concentration in plant shoot material and C soil is the corresponding concentration in soil.
The Translocation Coefficient (TC) was used to quantify the mobility of metals from root to shoot tissues. Root and shoot samples were digested with concentrated HNO3, and element concentrations were measured by ICP–OES or AAS. TC was calculated as
TC = C shoot C root
where C shoot is the concentration of the metal in shoots and C root is the concentration in roots.

2.4. Statistical Analysis

After completing the experimental procedures and conducting all soil and chemical analyses, SPSS Statistics V29, accessible through the PS IMAGE PRO 10 software, was used to generate all graphical outputs and to conduct preliminary statistical exploration. Pairwise comparisons were performed using the paired t-test, as each measurement in one group corresponded directly to a measurement in the comparison group, and normality of paired differences was assessed using Shapiro–Wilk tests and visual inspection of Q–Q plots. No substantial deviations from normality were detected; therefore, parametric tests were applied. The influence of plastics on metal uptake was evaluated for each plant cultivar, soil type, and metal element. To assess these effects, factorial analyses of variance (two-way ANOVA) were applied under several model configurations to ensure robustness and reliability of the results. In figures presenting the statistically processed results, distinct letters beside the bars or data points denote the presence or absence of statistically significant differences among the compared parameters, treatment, and soil type as fixed factors, including their interaction. Statistical significance was evaluated at α = 0.05. Homogeneity of variances was assessed using Levene’s test. When significant effects were detected, post hoc multiple comparisons were conducted using Tukey’s honestly significant difference (HSD) test. Results are presented as mean ± standard deviation.

3. Results and Discussion

3.1. Influence of Microplastics on Soil Physicochemical Properties

In Table 1, the values of main characteristics, depending upon their physicochemical properties, of the soil samples studied are presented.
As presented in Table 1, we can determine that across both soils, the presence of MPs affects the values of physicochemical properties, thus, consequently, promoting physical structure, hydrological processes, and soil biota [37]. MPs can modify the physicochemical properties of soil; however, the direction and magnitude of the changes depend largely on the soil type and the characteristics of the MPs. The addition of PE, PET, and PS in the present study led to a decrease in soil pH, especially in acidic soil, and a significant decrease in EC in Soil 1, while Soil 2 showed a smaller decrease in pH and a slight increase in EC. Wang et al. [38] found that PE addition induces modifications in soil acidity and, thus, can determine metal availability. Cruz et al. [39] report minimal effects of polyethylene MPs on pH and EC under certain conditions (soil pH and cation exchange capacity, etc.), while Arévalo-Hernández et al. [40], in their study, indicated the different changes that PE MPs can cause to soil physicochemical properties under different land uses.
Ref. [41] highlights that interactions between microplastic surfaces and soil meshes can modify ion exchange and water distribution, potentially reducing pH and altering electrical properties depending on soil composition and particle concentration. Such soil responses suggest that measurable changes in soil chemistry already occur at low concentrations of MPs, affecting cation exchange, microbial activity, and dissolved organic carbon dynamics, and consequently modifying fundamental soil chemical processes.

3.2. Influence of Microplastics on Soil Metal Levels

In Table 2, the influence of different types of MPs on both available and total Zn and Pb concentrations in the two soils are presented and discussed.
The dataset of Table 2 shows that total concentrations of Zn and Pb remain nearly constant across all soil and MP treatments, indicating that polymers do not alter the total metal content but mainly affect metal availability. Soil 1 consistently shows higher available Zn and Pb than Soil 2, despite similar total levels, suggesting that its lower pH and lack of CaCO3 promote greater metal solubility. The addition of PE increases available Zn and Pb in Soil 1 more than any other plastic, reaching 2.20 mg/kg for Zn and 0.66 mg/kg for Pb, likely due to PE-driven changes in soil structure or redox conditions that enhance desorption. In Soil 2, however, PE produces minimal changes, reflecting the stabilizing effect of its alkaline, carbonate-rich matrix. PET produces moderate increases in available metals in Soil 1 but negligible effects in Soil 2, consistent with weaker interactions that primarily disturb microaggregates rather than strongly altering sorption chemistry. PS behaves similarly to PET, increasing available Zn and Pb only in Soil 1, again indicating that Soil 1 is more sensitive to microplastic-induced shifts in porosity and sorption dynamics. Across all treatments, Soil 2 remains comparatively stable due to stronger metal retention mechanisms associated with higher pH and CaCO3 content. Overall, the data indicate that MPs do not change the total metal load but can significantly influence metal mobility and bioavailability depending on polymer type and soil chemical properties, with PE having the strongest mobilizing effect and Soil 1 showing the greatest susceptibility to changes in metal availability.
Table 3 presents the results of the zinc-related indicators obtained from the experiment, including indicators describing Zn accumulation under different microplastic treatments.
Table 3, with Zn values, shows that, regardless of the soil type (Soil 1 and Soil 2) and the treatment (PE, PET, and PS), the total Zn concentrations remain practically constant and significantly lower than the reference concentration of 70 mg/kg [35]. This is reflected in the Contamination Factor (CF) values, which range around 0.25–0.26 for all treatments, classifying the soil in the CF < 1 category, i.e., in a pristine state. Correspondingly, the geo-accumulation index (Igeo) values are in all cases negative (Igeo < 0), which confirms that the soils are uncontaminated with respect to Zn, according to the Müller classification. The uniformity of CF and Igeo values between treatments suggests that the addition of plastic materials (PE, PET, and PS) does not affect the total accumulation of Zn in the soil. However, differentiation is observed in the Bioavailability Factor (BF). Specifically, in Soil 1, BF values are systematically higher compared to Soil 2, while the treatments with PE, PET, and PS show slightly increased BF compared to the corresponding unenriched soils. This suggests that, although the total Zn concentration does not change, the presence of polymeric materials may affect the chemical distribution of the metal and increase its percentage in the bioavailable form. This effect is more evident in Soil 1, which is probably related to intrinsic soil characteristics (e.g., pH, organic matter, or granulometric composition). Overall, the results for Zn show that the treatments do not cause pollution but can modify the bioavailability of the metal, an element that is particularly important from an ecotoxicological point of view. Published studies show that CF values for Zn are typically below 1 in background or weakly impacted soils, indicating uncontaminated conditions, whereas soils affected by Pb–Zn mining or industrial activities frequently exhibit CF values between 2 and >5, corresponding to moderate to high contamination [35,42]. Elevated CF values reflect total Zn concentrations exceeding natural background levels and are largely insensitive to short-term soil treatments, as CF mainly depends on cumulative Zn inputs rather than changes in soil chemistry. Igeo values for Zn reported in the literature are generally negative or close to zero in uncontaminated soils, classifying them as practically uncontaminated [34]. In contrast, soils influenced by mining or industrial emissions commonly show Igeo values between 1 and 3, indicating moderate to heavy contamination, with higher values reported near smelters [42,43]. As with CF, Igeo primarily reflects long-term Zn accumulation and remains stable unless total concentrations change. Unlike CF and Igeo, the Bioavailability Factor (BF) for Zn shows high variability across soil types. Sequential extraction studies indicate that Zn is relatively mobile, with BF values often ranging from 15% to over 40% in contaminated soils [43,44]. Variations in pH, organic matter, and soil amendments can shift Zn toward more exchangeable fractions, increasing potential ecological risk even when total Zn concentrations remain unchanged.
Table 4 presents the results of lead-related indicators obtained from the experiment, including indicators describing Pb accumulation under different types of microplastic treatments.
Similarly to Zn, total Pb concentrations in all treatments are low and clearly lower than the reference value of 20 mg/kg. The Contamination Factor (CF) values range around 0.23–0.25, which classifies all samples in the category of uncontaminated soils. This observation is also confirmed by the Igeo values, which are consistently negative (Igeo < 0), indicating the absence of anthropogenic Pb accumulation. The stability of CF and Igeo between Soil 1 and Soil 2, as well as between the different treatments, suggests that the addition of plastic materials does not affect the total Pb concentration in the soil. This is particularly important, as Pb is considered an element of high toxicity and low mobility, and any increase in its total concentration would constitute a serious environmental risk. In contrast to the pollution indices, the Bioavailability Factor (BF) shows notable variations. The PE, PET, and PS treatments, especially in Soil 1, show increased BF values compared to the corresponding soils without added plastics. This finding suggests that, although total Pb concentrations remained unchanged, the addition of MPs increased the proportion of Pb present in potentially bioavailable forms, suggesting a redistribution of Pb between soil fractions rather than an increase in total Pb accumulation. This is crucial, since the bioavailability of Pb is directly linked to its toxicity to plants and microorganisms. The difference between Soil 1 and Soil 2 suggests that soil properties play a decisive role in the behavior of Pb and the ability of plastic materials to affect its chemical form. The literature consistently reports higher CF values for Pb than for Zn due to Pb’s strong accumulation in soils. While background soils usually show CF < 1, contaminated soils affected by mining, traffic, or industry commonly exhibit CF values between 3 and 10, with even higher values near smelters [35,42]. These values primarily reflect historical Pb deposition and are largely unaffected by soil treatments that do not introduce additional Pb. Igeo values for Pb clearly demonstrate its anthropogenic origin in polluted soils. Uncontaminated soils generally present negative Igeo values, whereas mining- and industry-impacted soils frequently show Igeo values between 2 and 4, corresponding to moderate to heavy contamination [42,43]. Extremely high Igeo values (>5) have been reported near smelting sites, indicating very strong Pb accumulation driven by long-term inputs. Although Pb often exhibits high CF and Igeo values, its BF is generally lower than that of Zn due to strong sorption to soil constituents. Reported BF values for Pb are commonly below 10% but can increase under acidic conditions or low organic matter content [44,45]. Such shifts toward more exchangeable Pb fractions are environmentally significant, as Pb toxicity is closely linked to its bioavailable form rather than total concentration.
Table 5 presents the effects of the treatments on the growth of Cannabis sativa L. (cv. Fedora 17) and Nicotiana tabacum L. (cv. Burley).
The dataset reveals distinct cultivar-specific and plastic-dependent patterns across height, biomass accumulation, chlorophyll content (SPAD), and mid-stem thickness. Between the two cultivars, Fedora consistently produces higher biomass than Burley across all treatments, indicating greater robustness or more efficient resource allocation under the given soil conditions. Height remains relatively stable for both cultivars in the untreated soils, with Soil 2 providing a slight advantage, likely due to improved nutrient availability or more favorable pH–CaCO3 interactions. The addition of PE exerts contrasting effects across traits. Burley experiences slight reductions in height and SPAD. This is consistent with the results of [45], where SPAD chlorophyll values in Nicotiana tabacum leaves showed a significant decrease due to the addition of PE–MPs, while stem thickness increased considerably, especially in Soil 2, suggesting compensatory structural growth despite reduced shoot elongation. Fedora shows notable increases in weight and mid-stem thickness under PE, particularly in Soil 2, indicating that PE-induced soil structural changes (e.g., altered water retention or pore distribution) may enhance biomass accumulation. SPAD values rise slightly in Fedora but fall in Burley, implying cultivar-dependent physiological sensitivity to microplastic presence. PET produces the largest increase in SPAD values for Burley, with readings more than doubling relative to controls in both soils. This suggests that PET may induce stress-related changes or modify nutrient dynamics that accentuate chlorophyll concentration. PET also increases stem thickness in both cultivars, especially under Soil 2, where Fedora reaches its highest recorded thickness (4.15 cm). Height remains stable or slightly improved. These patterns indicate that PET may impose physiological stress that elevates SPAD yet simultaneously promotes reinforcing stem growth, possibly through altered soil aeration or microaggregate formation. In contrast, in the study by [46], PET–MPs were taken up by the underground part of Oryza sativa and translocated to the aerial tissues, where they markedly suppressed chlorophyll biosynthesis. The presence of PET–MPs caused oxidative stress and a reduction in plant height and biomass. PS generates divergent effects on height and weight. Burley height decreases under PS treatments, most strongly in Soil 2 (110 cm), while biomass increases dramatically in Fedora, reaching the highest weight observed (0.67 kg in Soil 1 + PS). This suggests that PS alters root–soil interactions in ways that favor biomass accumulation in Fedora. According to Zhang et al. [47], MP treatments exerted measurable but compound-dependent effects on the soil–plant system. Polystyrene MPs (PS-MPs) did not cause significant inhibition of key plant growth parameters under the tested conditions, indicating a relatively limited impact on above-ground development. Stem thickness increases greatly in Fedora, peaking at 4.62 cm under Soil 1 + PS, implying that PS enhances radial growth, possibly due to changes in soil compaction or water movement. Overall, Fedora benefits more than Burley from all MP treatments, with pronounced increases in weight and stem thickness. Burley tends to reduce height or SPAD under PE and PS, while PET produces notable SPAD increases. Soil 2 generally enhances growth traits relative to Soil 1, but the magnitude of plastic effects often exceeds the soil differences. PET exhibits the strongest influence on SPAD and axial tissue thickness, whereas PS most strongly promotes radial stem development. PE induces moderate but consistent structural changes, particularly in stem thickness.

3.3. Influence of Microplastics and Metals on Soil-to-Plants Indices

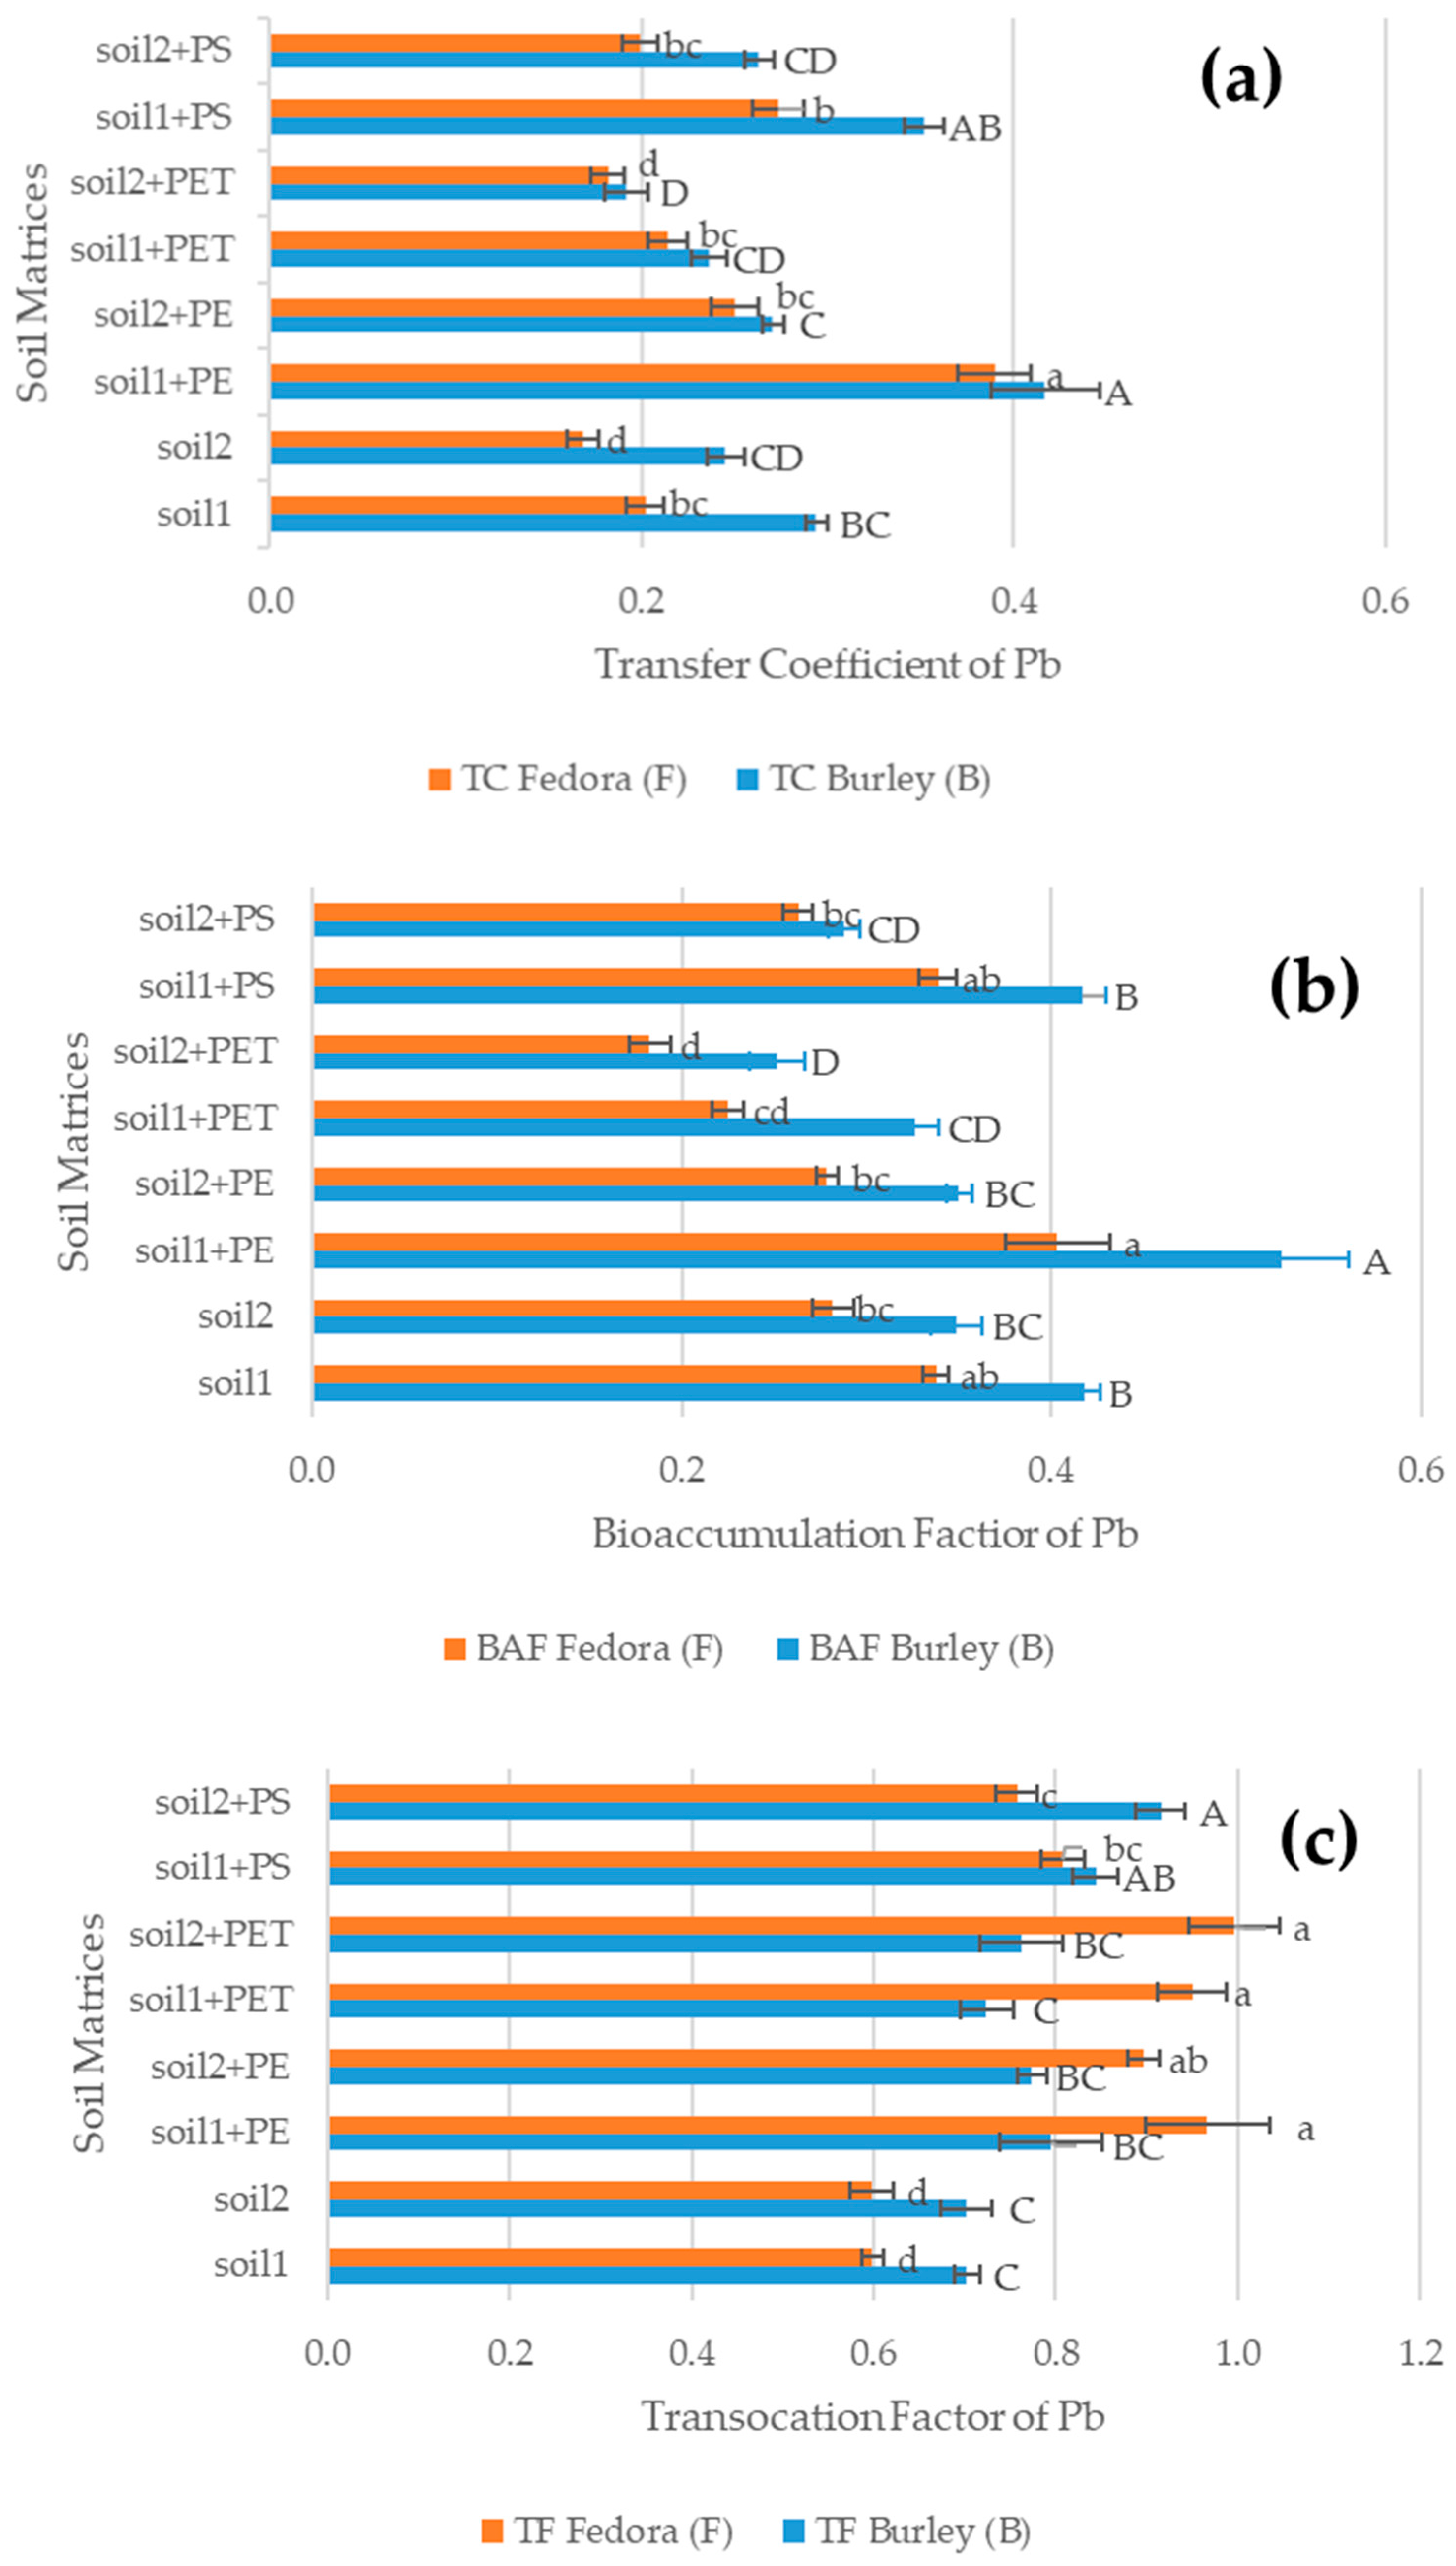
In this section, the impact of MPs on the transportation of examined metals in plants was thoroughly examined using the soil-to-plant indices (Figure 1). The export results were presented and fully discussed. Regarding the latter, the following figure presents the lead (Pb)-related indices associated with Pb transport from soil to plants, highlighting the influence of MP type on their values.
For Burley, the introduction of MPs in the presence of Pb produces distinct shifts in the TC, BAF, and TF indices, reflecting the differing behaviors of each polymer. PE consistently increases all three indices in both soils, with stronger effects in Soil 1, indicating that PE enhances mobility, pore connectivity, and vertical transfer. Jadhav et al. [48] observed that in the presence of PE-MPs, Pb had the lowest concentration in the root of Lactuca sativa L. In contrast, PET generally decreases TC and BAF, particularly in Soil 2, suggesting that PET restricts mobility—likely by occupying fine pores or stabilizing micro-aggregates, while producing only moderate increases in TF. PS shows a mixed pattern: it elevates TC and BAF modestly but causes pronounced increases in TF, especially in Soil 2, where TF reaches the highest value across all treatments. This suggests that PS strongly facilitates vertical transfer, possibly through its hydrophobicity and effects on preferential flow. Overall, PE tends to amplify all soil processes represented by the indices, PET tends to constrain them, and PS particularly enhances transfer mechanisms. These differences highlight the role of polymer type and soil chemistry in determining MP impacts. According to the study by Yu et al. [49], it appears that MPs might reduce the mobility of heavy metals through physical adsorption and co-precipitation or affect heavy metal speciation by changing the physical and chemical properties of the soil, thereby reducing the bioavailability of heavy metals. As for the hemp (Fedora), the values show that adding MPs again produces clear and polymer-specific effects on TC, BAF, and TF. PE substantially increases all three indices compared with untreated soils, with Soil 1 + PE showing the highest TC and BAF values and Soil 2 + PE exhibiting strong elevation in TF. This pattern indicates that PE enhances both chemical mobility and vertical transfer, particularly in the finer and less calcareous Soil 1. By contrast, PET lowers both TC and BAF in the two soils, with the most pronounced reduction occurring in Soil 2, indicating that PET limits mobility and helps stabilize micro-environmental conditions. Despite this, TF values under PET remain very high, especially in Soil 2 + PET, where TF is the highest recorded, implying that PET may limit surface-associated processes but still facilitate downward movement. PS produces moderate increases in TC and BAF, especially in Soil 1, while TF rises strongly in both soils, though less dramatically than under PE or PET. This suggests that PS impacts are more balanced, enhancing both horizontal and vertical dynamics without the extremes observed for other polymers. According to Chen et al. [50], in a corresponding experiment with ramie (Boehmeria nivea L.), an increase in the bioavailability and transport of Pb was observed due to changes in pH, organic matter, and microbial activity in the rhizosphere, supporting increased TF values. The findings show trends that are specific to each polymer, with PE showing a tendency to enhance various soil-related indicators, PET showing opposite effects on metal mobility and transport pathways, and PS producing moderate and consistent responses.
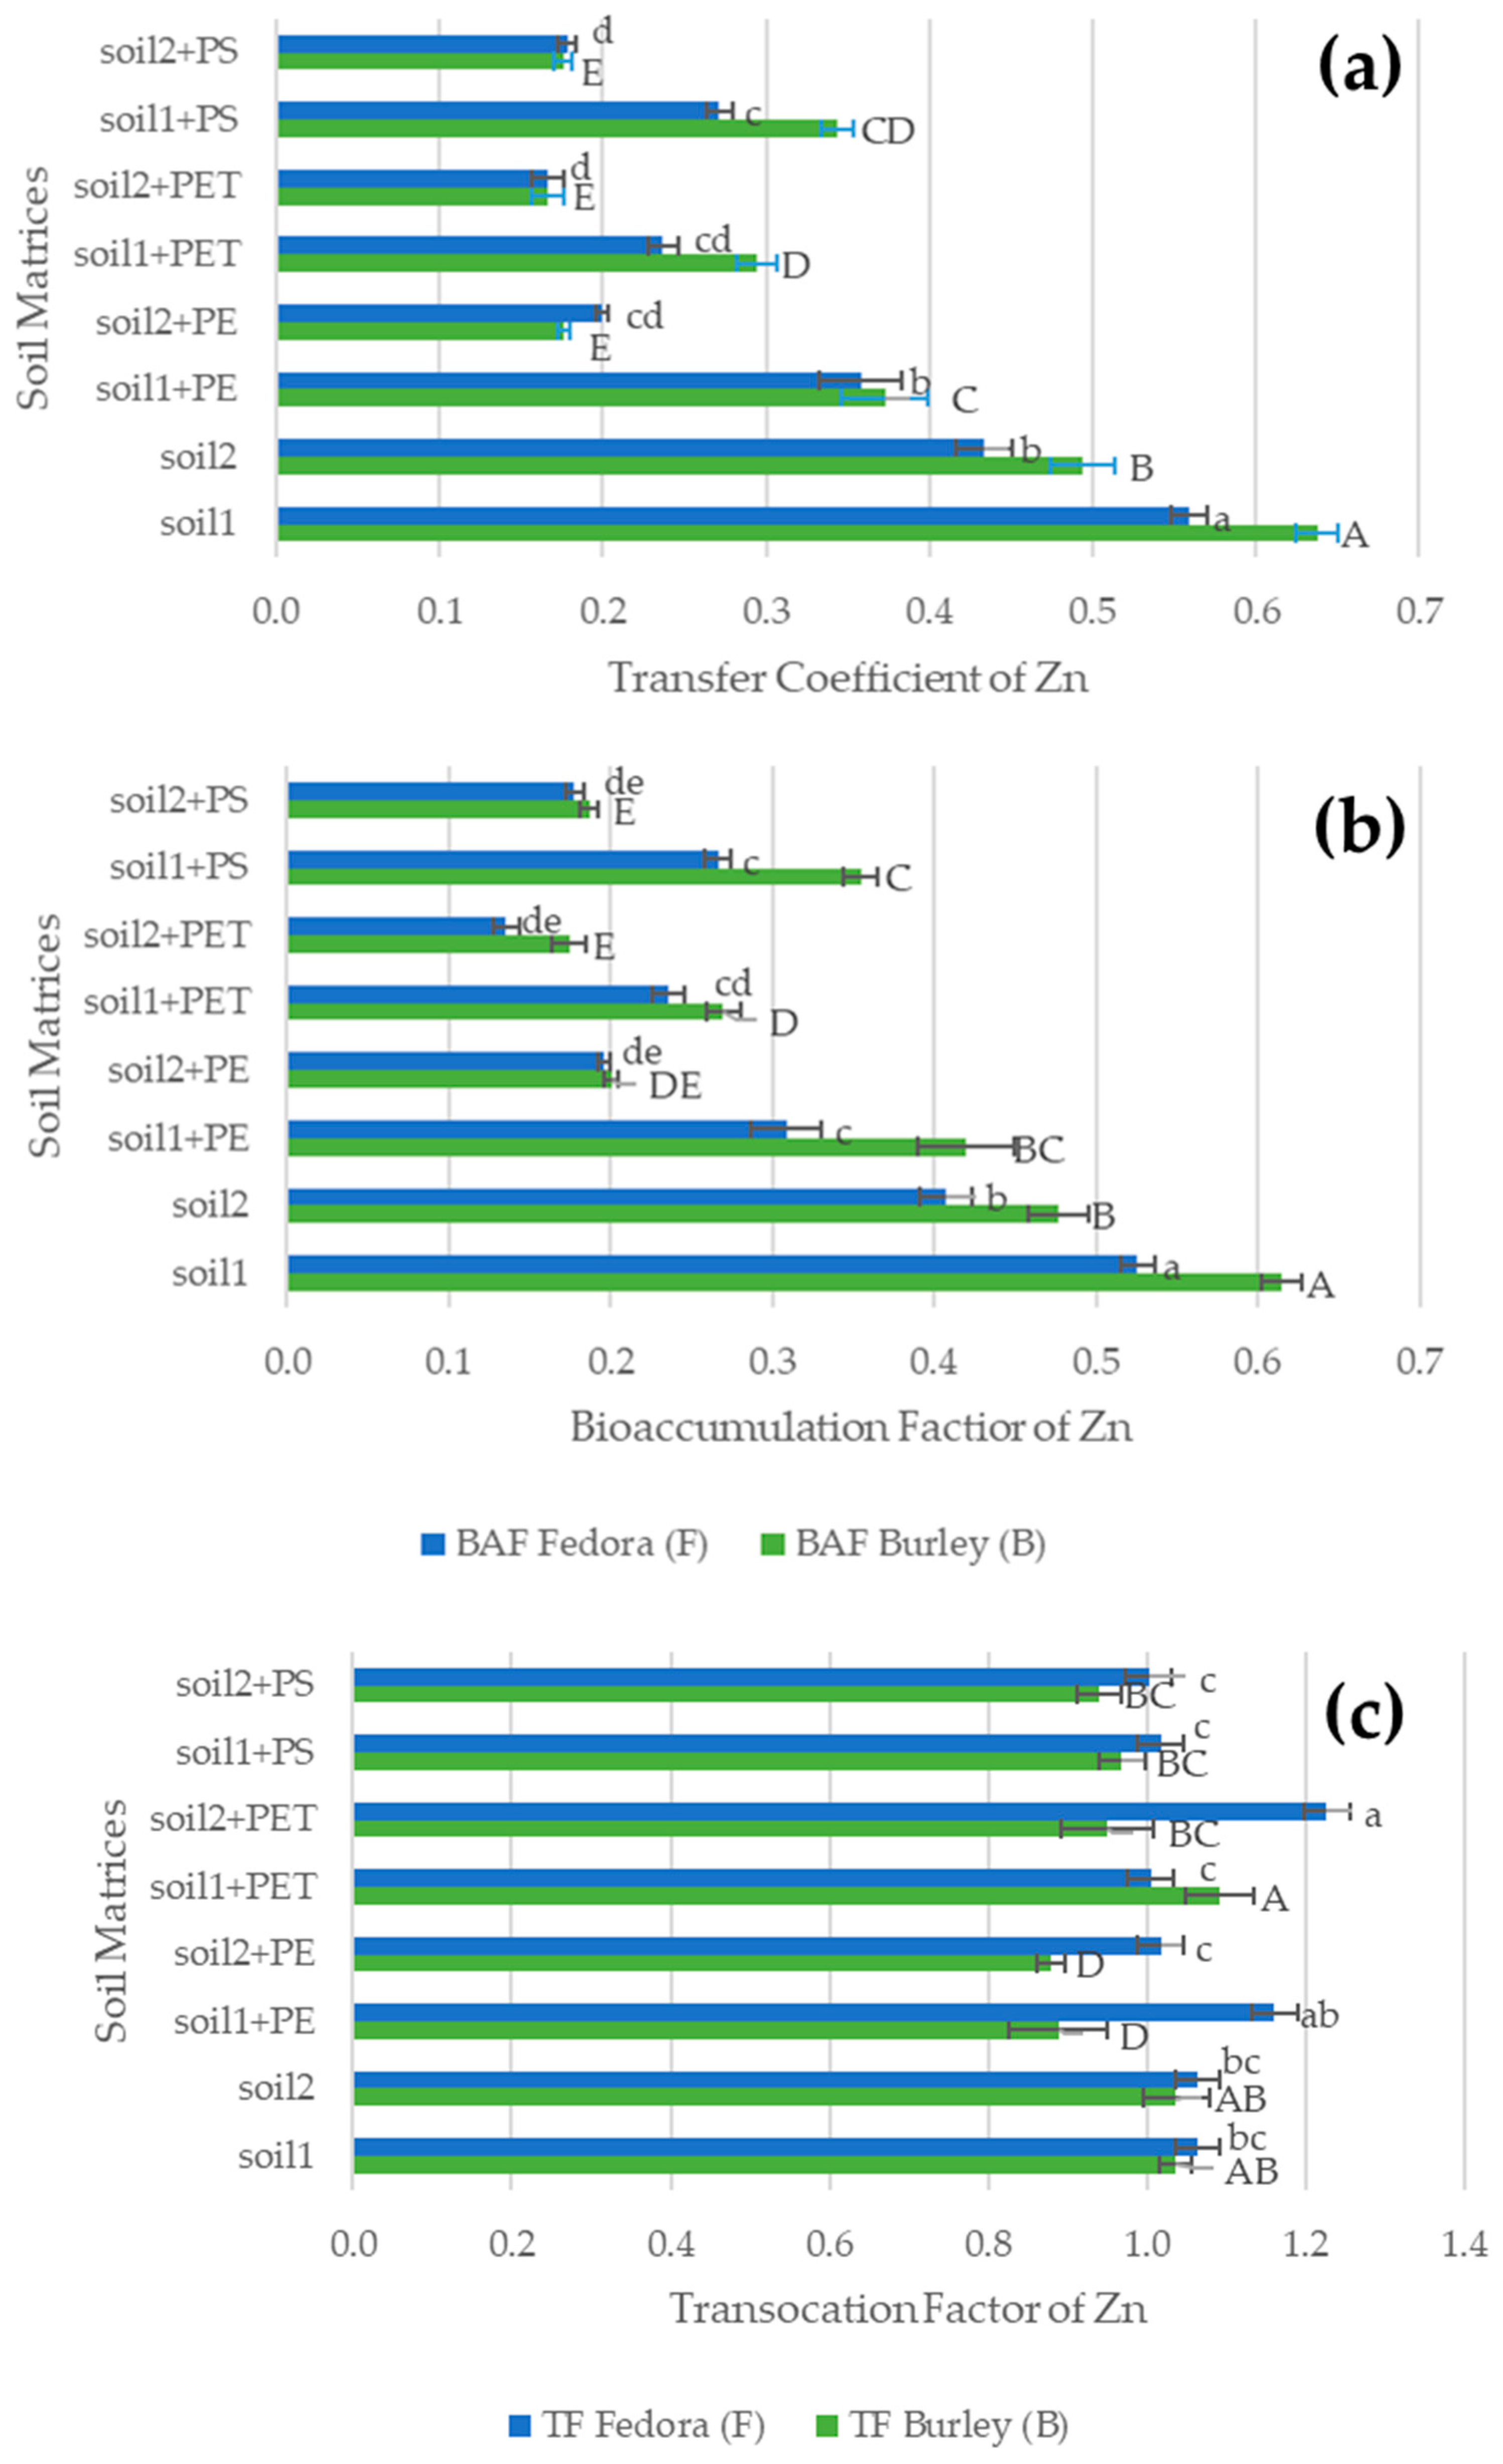
Concerning the examination of Zn transportation in the studied plants and the impact of MPs on this process, the results are illustrated in Figure 2, where the three selected soil-to-plant indices (TC, BAF, and TF) highlight the influence of MPs on this process.
In the presence of Zn, both Soil 1 and Soil 2 show similar TF values, but Soil 1 exhibits higher TC and BAF, suggesting greater baseline mobility. PE reduces TC and BAF in both soils compared to untreated conditions yet maintains relatively high TF values; this indicates that PE may diminish surface-level or sorption-related processes while still enhancing downward transfer, especially in Soil 2, where TF remains elevated. This is in agreement with recent findings showing that PE MPs can decrease Zn bioavailability through adsorption and aggregation effects while simultaneously enhancing vertical transport by modifying soil pore structure and water flow pathways [51]. PET produces a different pattern, lowering TC and BAF further than PE—particularly in Soil 2—but generating the highest TF value across all treatments in Soil 1 + PET. This suggests that PET restricts lateral or chemical mobility while strongly promoting deep translocation under Soil 1 conditions. PS yields moderate increases in TC and BAF compared to PET, along with consistently high TF values in both soils, indicating a more balanced influence on both mobility and transfer. In summary, PE limits mobility while preserving transfer pathways, PET exerts the strongest restriction on mobility while promoting vertical transport, and PS leads to a moderate increase across all indices.
These patterns confirm that polymer chemistry interacts closely with soil properties to influence mobility and translocation processes. As for the Fedora baseline, values show Soil 1 with higher TC and BAF than Soil 2, while both share identical TF, indicating similar transfer potential but differing mobility characteristics. PE strongly increases TF in Soil 1 while reducing TC and BAF relative to the control, suggesting that PE limits horizontal or surface-related mobility while enhancing deeper movement. In Soil 2, PE produces lower TC and BAF but maintains a high TF, confirming this trend. PET shows the greatest divergence: PET drastically lowers TC and BAF—especially in Soil 2 + PET, which records the lowest mobility values—yet it produces the highest TF observed across all treatments, indicating exceptionally strong vertical transfer. PS induces moderate reductions in TC and BAF compared with untreated soils, while TF remains high and relatively stable, reflecting a balanced influence on both retention and transfer processes. Overall, PE restricts mobility while maintaining transfer processes, PET reduces mobility to the greatest extent while enhancing vertical flux, and PS produces moderate and uniform effects across all metrics. These results reinforce that the interaction between microplastic type and soil properties governs both the magnitude and direction of soil system response [51]. The moderate increases in TC and BAF combined with significantly increased TF values for Zn treated with PS are consistent with evidence showing that PS MPs enhance metal leaching and preferential flow, thus promoting vertical transport without proportionally increasing bioaccumulation, a pattern that has been observed previously for Zn in PS-treated soils [28,52]. It may improve fertility and at the same time limit pollution, as the toxic elements of the soil are much less available to plants and therefore to humans. A significant reduction was observed in the water-soluble concentration of the metal elements. This fraction of metals is, under certain conditions, possible to be taken up by plants, but its concentration is significantly less than that available (extracted with the DTPA solution) and about 100 times less than the pseudo-total concentration of each metal.
Among the polymers, PE had the most significant and consistent effect, increasing the bioavailability of Zn and Pb, enhancing soil–plant transfer, and systematically increasing the TC, BAF, and TF indices. PET exhibited differentiated behavior, often limiting the mobility of metals in the surface soil but enhancing their vertical transport, suggesting a modification of transport pathways. PS caused moderate but stable effects, mainly related to the vertical movement of metals. Plant responses depended on plant response, with Fedora showing increased biomass and stem thickening, while Burley proved to be more sensitive to the presence of MPs. Overall, the results show that even low doses of MPs can cause subtle but persistent changes in soil chemistry, metal behavior, and plant uptake pathways, highlighting the importance of soil mechanisms in determining the long-term environmental risk of MPs.
The present study supports soil and agriculture research with an emphasis on sustainability, demonstrating how different types of MPs affect soil properties and the behavior of zinc (Zn) and lead (Pb) in Mediterranean agricultural soils. Although the addition of MPs did not increase overall metal concentrations, it altered the bioavailability of Zn and Pb and their transfer from soil to plants. By linking the effects of specific polymers to metal mobility and plant responses, this work highlights the importance of considering MPs as an emerging factor in sustainable soil management and long-term agroecosystem resilience.
Further experiments on a wider range of soils, with more species and more specific dimensions of MPs, as well as under field conditions, need to be carried out in the future. This will enable us to draw more reliable conclusions about the ways and mechanisms that influence the accumulation of toxic elements in hyperaccumulator plants due to the presence of polymers (MPs) within the soil in which they are cultivated.

4. Conclusions

An investigation has been conducted regarding the effect of three different types of MPs (PE, PET, and PS) on the behavior of two heavy metals, Zn and Pb, in two fine-textured soils, as well as on the responses of two plant metal accumulators. The MPs’ addition did not affect the total Zn and Pb contents, so the soil remained as virgin soil. However, MPs’ incorporation caused measurable and systematic changes in metals’ bioavailability and mobility, confirming that the main environmental risk of MPs is not related to the overall accumulation of metals but to the change in their forms and transport pathways.
MPs’ effects were largely controlled by soil properties. The slightly acidic and non-calcareous Soil 1 proved to be clearly more sensitive to MP additions compared to the alkaline, CaCO3-rich Soil 2, highlighting the decisive role of pH in metal behavior. Furthermore, high clay content of both soils promoted the retention of MPs, indicating that such soils can act as long-term “reservoirs” of MPs pollution.
PE had the most significant impact, enhancing both metals’ bioavailability, leading to higher TC, BAF, and TF indices. PET seems to limit metal mobility, suggesting a modification of transport pathways, while PS caused moderate but stable effects. Fedora (Cannabis sativa L.) showed increased biomass and stem thickening, while Burley (Nicotiana tabacum L.) proved to be more sensitive to the presence of MPs. Overall, the findings show that even small amounts of MPs can lead to slight yet long-lasting alterations in soil chemical properties, metal dynamics, and plant uptake mechanisms.
The existence of MPs seems to be a cruel reality in both urban and agricultural soils that we cannot overcome. Their coexistence with toxic metals can lead to serious alterations in both soil and cultivated plants’ properties. A deeper investigation may lead to useful knowledge concerning metal transfer to plants, directly connected to phytoremediation techniques, that can become a cost-effective and eco-friendly perspective regarding environmental health.

Author Contributions

Conceptualization, E.E.G. and D.A.; methodology, E.E.G., D.A. R.V., and V.L.; software, E.E.G., D.A., R.V. and V.L.; validation, E.E.G. and D.A.; formal analysis, E.E.G. and D.A.; investigation, E.E.G., D.A., R.V., A.P.-G. and V.L.; resources, E.E.G.; data curation, E.E.G. and D.A.; writing—original draft preparation, D.A., E.E.G. and R.V.; writing—review and editing, D.A., E.E.G. and R.V.; visualization, D.A., E.E.G. and R.V.; supervision, E.E.G. All authors have read and agreed to the published version of the manuscript.

Funding

This research received no external funding.

Institutional Review Board Statement

Not applicable.

Informed Consent Statement

Not applicable.

Data Availability Statement

Data that support the findings of this study are available from the corresponding author upon reasonable request.

Acknowledgments

The authors would like to express their gratitude to Eleni Tsaliki and Ioannis Panoras for their contribution to the experiment.

Conflicts of Interest

The authors declare no conflicts of interest.

Abbreviations

The following abbreviations are used in this manuscript:
BAFBioaccumulation Factors
TCTransfer Coefficient
TFTranslocation Factor
BFBioavailability Factor
CFContamination Factor
(Igeo)Geo-accumulation Index
PETPoly(ethylene Terephthalate)
PEPoly(ethylene)
PVCPoly(vinyl-chloride)
PAPolyamide
PSPolystyrene
MPsMicroplastics
HMHeavy Metals
ICP-OESInductively Coupled Plasma—Optical Emission Spectroscopy
AASAtomic Absorption Spectroscopy
ANOVAAnalysis Of Variance
HSDHonestly Significant Difference
ECElectrical Conductivity
OMOrganic Matter
DTPADiethylenetriaminepentaacetic Acid

References

  1. Siddiqua, A.; Hahladakis, J.N.; Al-Attiya, W.A.K.A. An overview of the environmental pollution and health effects associated with waste landfilling and open dumping. Environ. Sci. Pollut. Res. 2022, 29, 58514–58536. [Google Scholar] [CrossRef] [PubMed]
  2. Iram, S.; Qaisar, I.; Shabbir, R.; Pomee, M.S.; Schmidt, M.; Hertig, E. Impact of Air Pollution and Smog on Human Health in Pakistan: A Systematic Review. Environments 2025, 12, 46. [Google Scholar] [CrossRef]
  3. Gkoltsou, V.-S.; Papadimou, S.G.; Bourliva, A.; Skilodimou, H.D.; Golia, E.E. Heavy Metal Levels in Green Areas of the Urban Soil Environment of Larissa City (Central Greece): Health and Sustainable Living Risk Assessment for Adults and Children. Sustainability 2025, 17, 4421. [Google Scholar] [CrossRef]
  4. Amin, A.E.E.A.Z. Using Bone Char as a Renewable Resource of Phosphate Fertilizers in Sustainable Agriculture and its Effects on Phosphorus Transformations and Remediation of Contaminated Soils as well as the Growth of Plants. J. Soil Sci. Plant Nutr. 2024, 24, 6980–6998. [Google Scholar] [CrossRef]
  5. Jahan, N.; Mahmud, U.; Khan, M.Z. Sustainable plant-soil phosphorus management in agricultural systems: Challenges, environmental impacts and innovative solutions. Discov. Soil 2025, 2, 13. [Google Scholar] [CrossRef]
  6. Diakoloukas, V.; Koutopoulis, G.; Papadimou, S.G.; Spiliotopoulos, M.-E.; Golia, E.E. Predicting Heavy Metal and Nutrient Availability in Agricultural Soils Under Climatic Variability Using Regression and Mixed-Effects Models. Land 2025, 14, 1743. [Google Scholar] [CrossRef]
  7. Jensen, T.A.; Antille, D.L.; Tullberg, J.N. Improving On-farm Energy Use Efficiency by Optimizing Machinery Operations and Management: A Review. Agric. Res. 2025, 14, 15–33. [Google Scholar] [CrossRef]
  8. Lewandowski, M.; Landrat, M.; Kowalczyk, A. The Impact of Continuous Heavy Metal Emissions from Road Traffic on the Effectiveness of the Phytoremediation Process of Contaminated Soils. Appl. Sci. 2025, 15, 9748. [Google Scholar] [CrossRef]
  9. Prokeš, L.; Hegrová, J.; Průšová, B.; Baroň, M.; Hablovičová, B.; Sochor, J.; Ličbinský, R. Impact of traffic intensity and vehicular emissions on heavy metal content in vineyard soils, grapes, and wine: A comparative study of two vineyards in South Moravia (Czech Republic). Environ. Geochem. Health 2025, 47, 216. [Google Scholar] [CrossRef]
  10. Kibria, G.; Masuk, N.I.; Safayet, R.; Nguyen, H.Q.; Mourshed, M. Plastic Waste: Challenges and Opportunities to Mitigate Pollution and Effective Management. Int. J. Environ. Res. 2023, 17, 20. [Google Scholar] [CrossRef]
  11. UNEP. Plastic Planet: How Tiny Plastic Particles are Polluting Our Soil. Available online: https://www.unep.org/news-and-stories/story/plastic-planet-how-tiny-plastic-particles-are-polluting-our-soil (accessed on 10 March 2026).
  12. Rashid, S.; Majeed, L.R.; Mehta, N.; Radu, T.; Martín-Fabiani, I.; Bhat, M.A. Microplastics in terrestrial ecosystems: Sources, transport, fate, mitigation, and remediation strategies. Euro-Mediterr. J. Environ. Integr. 2025, 10, 2633–2659. [Google Scholar] [CrossRef]
  13. Hossain, M.; Engelhardt, I. Global plastic footprint: Unveiling property trends, environmental fate, and emerging threats of microplastic and nanoplastics pollution across ecosystems. Energy Ecol. Environ. 2025, 10, 637–674. [Google Scholar] [CrossRef]
  14. Singh, A.; Chauhan, A.; Gaur, R. A comprehensive review on the synthesis, properties, environmental impacts, and chemiluminescence applications of polystyrene (PS). Discov. Chem. 2025, 2, 47. [Google Scholar] [CrossRef]
  15. Sa’adu, I.; Farsang, A. Plastic contamination in agricultural soils: A review. Environ. Sci. Eur. 2023, 35, 13. [Google Scholar] [CrossRef]
  16. Boctor, J.; Hoyle, F.C.; Farag, M.A.; Ebaid, M.; Walsh, T.; Whiteley, A.S.; Murphy, D.V. Microplastics and nanoplastics: Fate, transport, and governance from agricultural soil to food webs and humans. Environ. Sci. Eur. 2025, 37, 68. [Google Scholar] [CrossRef]
  17. Erdem, H.; Gence, C.Ç.; Öztürk, M.; Buhan, E.; Kholikulov, S.T.; Kaya, Y. Microplastics in Soil Increase Cadmium Toxicity: Implications for Plant Growth and Nutrient Imbalance. Water Air Soil Pollut. 2025, 236, 575. [Google Scholar] [CrossRef]
  18. Gharahi, N.; Zamani-Ahmadmahmoodi, R. Effect of plastic pollution in soil properties and growth of grass species in semi-arid regions: A laboratory experiment. Environ. Sci. Pollut. Res. 2022, 29, 59118–59126. [Google Scholar] [CrossRef]
  19. Liu, S.; Suo, Y.; Wang, J.; Chen, B.; Wang, K.; Yang, X.; Zhu, Y.; Zhang, J.; Lu, M.; Liu, Y. Impact of Polystyrene Microplastics on Soil Properties, Microbial Diversity and Solanum lycopersicum L. Growth in Meadow Soils. Plants 2025, 14, 256. [Google Scholar] [CrossRef]
  20. Chen, X.-J.; Ma, J.-J.; Yu, R.-L.; Hu, G.-R.; Yan, Y. Bioaccessibility of microplastic-associated heavy metals using an in vitro digestion model and its implications for human health risk assessment. Environ. Sci. Pollut. Res. 2022, 29, 76983–76991. [Google Scholar] [CrossRef]
  21. Kajal, S.; Thakur, S. Coexistence of microplastics and heavy metals in soil: Occurrence, transport, key interactions and effect on plants. Environ. Res. 2024, 262, 119960. [Google Scholar] [CrossRef]
  22. Bethanis, J.; Golia, E.E. Revealing the Combined Effects of Microplastics, Zn, and Cd on Soil Properties and Metal Accumulation by Leafy Vegetables: A Preliminary Investigation by a Laboratory Experiment. Soil Syst. 2023, 7, 65. [Google Scholar] [CrossRef]
  23. Trojan, M.; Koutný, M.; Brtnický, M.; Holátko, J.; Gargošová, H.Z.; Fojt, J.; Procházková, P.; Kalčíková, G.; Kučerík, J. The Interaction of Microplastics and Microbioplastics with Soil and a Comparison of Their Potential to Spread Pathogens. Appl. Sci. 2024, 14, 4643. [Google Scholar] [CrossRef]
  24. Liu, Y.; Chen, S.; Zhou, P.; Li, H.; Wan, Q.; Lu, Y.; Li, B. Differential impacts of microplastics on carbon and nitrogen cycling in plant-soil systems: A meta-analysis. Sci. Total Environ. 2024, 948, 174655. [Google Scholar] [CrossRef] [PubMed]
  25. Alexiadis, D.; Bethanis, J.; Papadimou, S.G.; Barbieri, E.; Vogia, R.; Tatsi, E.; Tziourrou, P.; Tsaliki, E.; Golia, E.E. Effect of Plastics (Geotextiles) on Heavy Metal Accumulation by Industrial Hemp Plants Cultivated in Polluted Mediterranean Soils. Int. J. Plant Biol. 2025, 16, 53. [Google Scholar] [CrossRef]
  26. Oladimeji, T.E.; Oyedemi, M.O.; Odunfa, M.K.; Agboola, O.; Adeoye, J.B.; Oke, M.A.; Akindele, O.O. From origin to oversight: Properties, impacts and management of heavy metals. Discov. Appl. Sci. 2025, 7, 1353. [Google Scholar] [CrossRef]
  27. Soil Science of America. Chemical and Microbiological Properties; Soil Science of America: Madison, WI, USA, 1982. [Google Scholar]
  28. Vinod, V.; Amritha, P.S.; Harathi, P.B. Assessing the effects of microplastic pollution on soil and its impact on survival of earthworms and green gram plants. Discov. Soil 2025, 2, 25. [Google Scholar] [CrossRef]
  29. Bethanis, J.; Golia, E.E. Micro- and nano-plastics in agricultural soils: A critical meta-analysis of their impact on plant growth, nutrition, metal accumulation in plant tissues and crop yield. Appl. Soil Ecol. 2024, 194, 105202. [Google Scholar] [CrossRef]
  30. Golia, E.E.; Liava, V.; Achilias, D.S.; Navarro-Pedreño, J.; Zorpas, A.A.; Bethanis, J.; Girousi, S. Microplastics’ impact on soil health and quality: Effect of incubation time and soil properties in soil fertility and pollution extent under the circular economy concept. Waste Manag. Res. 2025, 43, 1146–1155. [Google Scholar] [CrossRef] [PubMed]
  31. Page, A.L.; Miller, H.R.; Keeney, R.D. Methods of Soil Analysis. Part II—Chemical and Microbiological Properties; American Society of Agronomy: Madison, WI, USA, 1982. [Google Scholar]
  32. Lindsay, W.L.; Norwell, W.A. Development of DTPA of Soil Test for Zn, Fe, Mn and Cu. J. Am. Soil Sci. 1978, 42, 421–428. [Google Scholar] [CrossRef]
  33. ISO/DIS 11466; Environment Soil Quality. ISO Standards Compendium: Geneva, Switzerland, 1994.
  34. Golia, E.E.; Chartodiplomenou, M.-A.; Papadimou, S.G.; Kantzou, O.-D.; Tsiropoulos, N.G. Influence of soil inorganic amendments on heavy metal accumulation by leafy vegetables. Environ. Sci. Pollut. Res. 2023, 30, 8617–8632. [Google Scholar] [CrossRef]
  35. Kabata-Pendias, A. Trace Elements in Soils and Plants, 4th ed.; CRC Press: Boca Raton, FL, USA, 2011. [Google Scholar] [CrossRef]
  36. Tomczyk, P.; Wdowczyk, A.; Wiatkowska, B.; Szymańska-Pulikowska, A. Assessment of heavy metal contamination of agricultural soils in Poland using contamination indicators. Ecol. Indic. 2023, 156, 111161. [Google Scholar] [CrossRef]
  37. Chen, Z.; Carter, L.J.; Banwart, S.A.; Kay, P. Microplastics in Soil–Plant Systems: Current Knowledge, Research Gaps, and Future Directions for Agricultural Sustainability. Agronomy 2025, 15, 1519. [Google Scholar] [CrossRef]
  38. Wang, Z.; Liu, S.; Zhao, P.; Li, G.; Duan, R.; Li, C.; Fu, H. Concentration-Dependent Effects of Polyethylene Microplastics on Cadmium and Lead Bioavailability in Soil. Toxics 2025, 13, 901. [Google Scholar] [CrossRef] [PubMed]
  39. Cruz, L.G.; Shen, F.-T.; Chen, C.-P.; Chen, W.-C. Dose Effect of Polyethylene Microplastics Derived from Commercial Resins on Soil Properties, Bacterial Communities, and Enzymatic Activity. Microorganisms 2024, 12, 1790. [Google Scholar] [CrossRef]
  40. Arévalo-Hernández, J.J.; Severo, E.M.; de Brito, A.D.B.; Tassinari, D.; Silva, M.L.N. Assessment of Soil Microplastics and Their Relation to Soil and Terrain Attributes Under Different Land Uses. AgriEngineering 2025, 7, 281. [Google Scholar] [CrossRef]
  41. Munhoz, D.R.; Beriot, N. Impacts of Nano- and Microplastic Contamination on Soil Organisms and Soil–Plant Systems. Microplastics 2025, 4, 68. [Google Scholar] [CrossRef]
  42. Saleem, M.; Pierce, D.; Wang, Y.; Sens, D.A.; Somji, S.; Garrett, S.H. Heavy Metal(oid)s Contamination and Potential Ecological Risk Assessment in Agricultural Soils. J. Xenobiotics 2024, 14, 634–650. [Google Scholar] [CrossRef]
  43. Shahrokh, V.; Martínez-Martínez, S.; Faz, Á.; Zornoza, R.; Acosta, J.A. Efficiency of large-scale aided phytostabilization in a mining pond. Environ. Geochem. Health 2023, 45, 4665–4677. [Google Scholar] [CrossRef]
  44. Peijnenburg, W.J.G.M. Bioavailability of heavy metals in soil: A review of tools, models, and regulatory applications. Environ. Biogeochem. Process. 2025, 1, e011. [Google Scholar] [CrossRef]
  45. Teng, L.; Zhu, Y.; Li, H.; Song, X.; Shi, L. Phytotoxicity of microplastics to the photosynthetic performance and transcriptome profiling of Nicotiana tabacum seedlings. Ecotoxicol. Environ. Saf. 2022, 231, 113155. [Google Scholar] [CrossRef] [PubMed]
  46. Li, Y.; Tang, C.; Qin, X.; Qin, W.; Fu, Y.; Shi, D.; Lan, W.; Tang, Y.; Wu, R.; Yu, F. Rhizosphere nutrient dynamics and physiological responses of Oryza sativa L. under polyethylene terephthalate microplastic stress. Plant Physiol. Biochem. 2025, 197, 110797. [Google Scholar] [CrossRef]
  47. Zhang, X.; Wang, Y.; Li, Z.; Chen, L.; Sun, H.; Xu, J. Microplastic-induced changes in Cd and Cr behavior in the agricultural soil-wheat system: Insights into metal bioavailability and phytotoxicity. Environ. Sci. Pollut. Res. 2025, 32, 14567–14580. [Google Scholar]
  48. Jadhav, B.; Medyńska-Juraszek, A. Microplastic-mediated heavy metal uptake in lettuce (Lactuca sativa L.): Implications for food safety and agricultural sustainability. Molecules 2025, 30, 2370. [Google Scholar] [CrossRef] [PubMed]
  49. Yu, H.; Hou, J.; Dang, Q.; Cui, D.; Xi, B.; Tan, W. Decrease in Bioavailability of Soil Heavy Metals Caused by the Presence of Microplastics Varies across Aggregate Levels. J. Hazard. Mater. 2020, 395, 122690. [Google Scholar] [CrossRef] [PubMed]
  50. Chen, G.; Huang, X.; Chen, P.; Gong, X.; Wang, X.; Liu, S.; Huang, Z.; Fang, Q.; Pan, Q.; Tan, X. Polystyrene influence on Pb bioavailability and rhizosphere toxicity: Challenges for ramie (Boehmeria nivea L.) in soil phytoremediation. Sci. Total Environ. 2024, 954, 176322. [Google Scholar] [CrossRef] [PubMed]
  51. Zhang, Z.; Bi, B. Coupled Effects of Polyethylene Microplastics and Cadmium on Soil–Plant Systems: Impact on Soil Properties and Cadmium Uptake in Lettuce. Toxics 2025, 13, 555. [Google Scholar] [CrossRef]
  52. Xu, G.; Lin, X.; Yu, H. Different effects and mechanisms of polystyrene micro- and nanoplastics on the uptake of heavy metals by plants. Environ. Pollut. 2023, 316, 120656. [Google Scholar] [CrossRef]
Figure 1. Influence of microplastics and Pb on soil-to-plant indices. The letters in front of the graphs (ac) represent the indices (TC, BAF, and TF). The letters inside the graphs (a–d and A–D) indicate the levels of statistical significance differences determined by the two-way ANOVA conducted with SPSS for the examined plants, Fedora and Burnley, respectively. The error bars represent ± standard deviation, and all experiments were conducted in triplicate (n = 3).
Sustainability 18 02777 g001
Figure 2. Influence of MPs and Zn on soil-to-plant indices. The letters in front of the graphs (ac) represent the indices (TC, BAF, and TF), and the letters inside the graphs (a–e and A–E) represent the levels of statistical significance differences determined by the two-way ANOVA conducted with SPSS for the examined plants, Fedora and Burnley, respectively. The error bars represent ± standard deviation, and all experiments were conducted in triplicate (n = 3).
Sustainability 18 02777 g002
Table 1. Influence of MPs on soil physicochemical properties. Values after ± represent the standard deviation of repeated measurements (n = 3). The letters (a–c) determine the significance level of each treatment (Tukey’s test).
TreatmentpH (1:2.5)EC (μS/cm)OM (%)CaCO3 (%)ClayTexture
Soil 16.10 ± 0.10 b1744 ± 32 a2.90 ± 0.21 c0.4 ± 0.1 b41 ± 1 aSilty Clay
Soil 27.90 ± 0.30 a1356 ± 78 bc3.02 ± 0.32 bc7.8 ± 0.2 a41 ± 3 aSilty Clay
Soil 1 + PE5.80 ± 0.20 b1288 ± 47 c2.99 ± 0.76 c0.4 ± 0.1 b40 ± 1 aSilty Clay
Soil 2 + PE7.60 ± 0.40 a1377 ± 56 bc3.16 ± 1.36 ab7.8 ± 0.2 a41 ± 2 aSilty Clay
Soil 1 + PET6.50 ± 0.60 b1298 ± 73 c2.98 ± 0.47 c0.4 ± 0.1 b40 ± 1 aSilty Clay
Soil 2 + PET7.90 ± 0.60 a1401 ± 67 b3.24 ± 0.45 a7.8 ± 0.2 a41 ± 1 aSilty Clay
Soil 1 + PS5.90 ± 0.30 b1299 ± 21 c2.97 ± 0.66 c0.4 ± 0.1 b40 ± 6 aSilty Clay
Soil 2 + PS7.80 ± 0.40 a1367 ± 27 bc3.31 ± 0.59 a7.8 ± 0.2 a41 ± 4 aSilty Clay
Table 2. Influence of MPs on soil metal concentrations; the value after ± represents the standard deviation of the repetition of the measurements taken (n = 3). The letters (a–c) determine the significance level of each treatment (Tukey’s test).
TreatmentTotalAvailable
Zn (mg/kg)Pb (mg/kg)Zn (mg/kg)Pb (mg/kg)
Soil 117.87 ± 2.11 a4.90 ± 0.86 a1.99 ± 0.12 a0.51 ± 0.07 b
Soil 218.11 ± 1.36 a4.70 ± 0.67 a1.56 ± 0.17 b0.40 ± 0.04 c
Soil 1 + PE17.83 ± 1.89 a4.91 ± 0.69 a2.20 ± 0.31 a0.66 ± 0.10 a
Soil 2 + PE18.02 ± 2.39 a4.67 ± 0.72 a1.57 ± 0.08 b0.42 ± 0.02 c
Soil 1 + PET17.81 ± 2.87 a4.89 ± 0.31 a2.00 ± 0.06 a0.63 ± 0.09 a
Soil 2 + PET17.99 ± 1.54 a4.71 ± 0.42 a1.61 ± 0.09 b0.41 ± 0.01 c
Soil 1 + PS17.81 ± 1.69 a4.91 ± 0.61 a2.13 ± 0.14 a0.67 ± 0.03 a
Soil 2 + PS18.11 ± 1.74 a4.69 ± 0.53 a1.65 ± 0.11 b0.46 ± 0.03 b
Table 3. Influence of MPs on soil pollution metals indices of Zn. The letters (a–d) determine the significance level of each treatment (Tukey’s test).
ZnBF (%)CFCF ClassificationIgeoIgeo Classification
Soil 111.18 c0.25 aPristine−2.56 aClass I
Soil 28.67 d0.26 aPristine−2.55 aClass I
Soil 1 + PE12.34 a0.25 aPristine−2.56 aClass I
Soil 2 + PE8.71 d0.26 aPristine−2.55 aClass I
Soil 1 + PET11.23 c0.25 aPristine−2.56 aClass I
Soil 2 + PET8.89 d0.26 aPristine−2.55 aClass I
Soil 1 + PS11.79 b0.25 aPristine−2.56 aClass I
Soil 2 + PS8.84 d0.26 aPristine−2.54 aClass I
Table 4. Influence of MPs in soil pollution metals indices of Pb. The letters (a–e) determine the significance level of each treatment (Tukey’s test).
PbBF (%)CFCF ClassificationIgeoIgeo Classification
Soil 110.20 c0.25 aPristine−2.61 aClass I
Soil 28.51 e0.24 aPristine−2.65 aClass I
Soil 1 + PE13.44 a0.25 aPristine−2.61 aClass I
Soil 2 + PE9.00 d0.23 aPristine−2.69 aClass I
Soil 1 + PET12.27 b0.24 aPristine−2.62 aClass I
Soil 2 + PET8.49 e0.24 aPristine−2.64 aClass I
Soil 1 + PS12.22 b0.25 aPristine−2.61 aClass I
Soil 2 + PS8.53 e0.23 aPristine−2.68 aClass I
Table 5. The values represent agronomic data obtained from the effects of MPs on the examined plants. Values after ± represent the standard deviation of repeated measurements (n = 3). The letters (a–e) following the values indicate groupings according to Tukey’s test.
Height (cm)Weight (kg)SPADMid Stem Thickness (cm)
Nicotiana tabacum L.Cannabis
sativa L.
Nicotiana
tabacum L.
Cannabis
sativa L.
Nicotiana
tabacum L.
Cannabis
sativa L.
Nicotiana
tabacum L.
Cannabis
sativa L.
Soil 1121.0 ± 2.1 a39.8 ± 1.2 e1.58 ± 0.32 c0.68 ± 0.08 b37.3 ± 0.5 bc30.9 ± 0.7 d1.65 ± 0.11 c 3.23 ± 0.21 de
Soil 2123.2 ± 6.2 a45.8 ± 3.1 d1.62 ± 0.15 c0.68 ± 0.02 b38.6 ± 0.8 b33.1 ± 0.9 cd 1.87 ± 0.31 c 3.13 ± 0.06 de
Soil 1 + PE118.3 ± 4.1 a55.4 ± 7.4 bc1.20 ± 0.19 d0.73 ± 0.31 ab35.9 ± 0.9 c38.8 ± 0.6 a2.16 ± 0.27 bc3.43 ± 0.41 cd
Soil 2 + PE115.2 ± 8.3 a54.8 ± 8.2 bc1.22 ± 0.28 d0.72 ± 0.21 ab32.6 ± 0.4 d38.1 ± 0.6 a2.43 ± 0.04 ab3.78 ± 0.37 c
Soil 1 + PET116.1 ± 1.2 a55.8 ± 5.0 bc2.98 ± 0.37 a0.89 ± 0.09 a35.1 ± 0.7 c33.7 ± 0.4 bc2.72 ± 0.51 a2.94 ± 0.21 e
Soil 2 + PET122.2 ± 3.2 a59.0 ± 4.3 b3.00 ± 0.40 a 0.85 ± 0.05 a37.9 ± 0.6 bc36.2 ± 0.9 ab2.91 ± 0.67 a4.15 ± 0.41 b
Soil 1 + PS116.2 ± 5.3 a67.0 ± 7.8 a2.10 ± 0.17 b0.65 ± 0.18 b40.8 ± 1.0 a33.2 ± 0.5 cd1.69 ± 0.03 c4.62 ± 0.38 a
Soil 2 + PS110.4 ± 7.1 a51.6 ± 5.2 c2.12 ± 0.58 b0.67 ± 0.0 b42.7 ± 1.1 a36.9 ± 0.7 a1.74 ± 0.16 c3.74 ± 0.33 c
Disclaimer/Publisher’s Note: The statements, opinions and data contained in all publications are solely those of the individual author(s) and contributor(s) and not of MDPI and/or the editor(s). MDPI and/or the editor(s) disclaim responsibility for any injury to people or property resulting from any ideas, methods, instructions or products referred to in the content.