Article

Balancing Soil Fertility and Emerging Contaminants Risk: Insights from a 15-Year Biosolid Application Study Under Maize Production


by
Eyob H. Tesfamariam
* and
Matome Peter Ngoetjana
Department of Plant and Soil Sciences, University of Pretoria, Pretoria 0002, South Africa
*
Author to whom correspondence should be addressed.
Sustainability 2026, 18(3), 1618; https://doi.org/10.3390/su18031618
Submission received: 13 January 2026 / Revised: 28 January 2026 / Accepted: 3 February 2026 / Published: 5 February 2026
(This article belongs to the Section Air, Climate Change and Sustainability)

Abstract

The use of biosolids in agriculture enhances soil fertility and organic matter, yet concerns remain over the accumulation of contaminants of emerging concern in soils and food crops. Despite increased land application, long-term field-based evidence on the environmental fate and plant uptake of these compounds is limited. This study hypothesized that prolonged biosolid application improves soil carbon and nitrogen without promoting triclosan (TCS) or sulfamethoxazole (SMX) persistence or uptake under rainfed and rainfed + irrigation maize systems. Over a decade and half, a field trial was conducted with biosolids applied at rates of 0, 4, 8, and 16 t ha−1 yr−1. Soil samples were analyzed for organic carbon, total nitrogen, pH, electrical conductivity, TCS, and SMX. Maize stem, leaves, and grain were similarly analyzed for TCS and SMX. Results showed that biosolids significantly improved soil organic carbon and nitrogen (p ≤ 0.0001), but also increased soil acidification and salinity. SMX was not detected in either soil or plant tissues at any rate. Although TCS was absent in soils six months post-application, it was detected in maize shoots and grains at 8 and 16 t ha−1 yr−1, highest in stems (6.66–8.92 ng g−1) and lowest in grains (3.25–4.28 ng g−1). Estimated dietary intake was well below health risk thresholds. These findings support biosolid application ≤ 16 t ha−1 yr−1 as a safe and effective treatment for improving soil fertility in maize systems. Future research should explore transformation products, microplastics, and cumulative exposure under varied agroecosystems.

Graphical Abstract

1. Introduction

Biosolids are treated residues generated from municipal wastewater processing, obtained from sewage sludge through different stabilization techniques, including drying, chemical treatment, and decomposition. These materials offer several beneficial functions in agricultural systems, with their primary role being the enhancement of soil organic matter. Additionally, biosolids contribute essential plant nutrients, thereby improving soil fertility and promoting sustainable land rehabilitation, particularly in degraded ecosystems [1]. Revitalizing degraded agricultural lands can significantly improve productivity and contribute to poverty alleviation [2]. Utilizing biosolids in farming systems may lower crop production costs by lessening the dependence on commercial inorganic fertilizers, which are often unaffordable for smallholder farmers. By acting as an alternative nutrient source, biosolids improve soil fertility while presenting a cost-effective and sustainable approach for nutrient management in resource-constrained farming environments [3]. Nonetheless, the use of biosolids in agriculture raises concerns regarding human and environmental health, as they may contain pathogens, microplastics, trace metals, and emerging contaminants that can eventually transfer to food crops.
Pharmaceutical substances and personal hygiene products rank among the most commonly identified categories of contaminants of emerging concern in treated sewage sludge [4,5]. Within the realm of personal hygiene items, triclosan, an antimicrobial agent frequently incorporated into everyday goods like toothpaste, antiperspirants, and cleansers, is often detected at elevated levels relative to other pollutants in biosolids [6]. Among medicinal compounds, sulfamethoxazole, an antibiotic extensively prescribed for urinary tract infections in humans, is also one of the most recurrently identified contaminants in biosolids [7]. The occurrence of both triclosan and sulfamethoxazole in biosolids largely stems from the incomplete degradation during wastewater treatment processes. Consequently, the agricultural use of biosolids may facilitate their buildup in the soil–plant continuum, potentially raising ecological and agronomic issues.
Studies have confirmed the presence of both triclosan and sulfamethoxazole in farmlands treated with biosolids [8]. As a result, these substances have also been detected in several crops cultivated in soils amended with biosolids, including radish and carrot [9]; wheat [10]; potato, sweetcorn, and tomato [11]; and cabbage [8], Nevertheless, data remain scarce regarding the extent of triclosan and sulfamethoxazole buildup in soil, their uptake by vegetation, and their distribution across various plant tissues over prolonged periods of biosolid application. This knowledge is crucial for evaluating the long-term effects of biosolid utilization in agriculture, particularly concerning potential groundwater contamination by triclosan and sulfamethoxazole and their transfer within the food web.
Previous investigations into the accumulation of triclosan and sulfamethoxazole in soils and crops grown in biosolid-amended fields have primarily focused on agricultural systems with relatively minimal cumulative biosolid application rates. However, comprehensive studies examining the persistence and potential ecological hazards of triclosan and sulfamethoxazole in agricultural soils subjected to continuous biosolid treatments remain scarce. Existing research has been conducted on soils that (i) received a once-time low biosolid application [11,12,13], (ii) experienced a single high biosolid dosage surpassing the nationally accepted limit [14,15], and (iii) underwent multiple applications (less or equal to four years) of both high and low biosolid rates [15]. Only limited extended studies, such as those by [16], provide exceptions. Nonetheless, the study by [16] was performed on rehabilitated mine spoils, which differ considerably from standard agricultural soils in their physical, chemical, and biological characteristics, thus limiting the applicability of the findings to conventional farming conditions.
This research assessed the prolonged effects of biosolid applications on agricultural soils, emphasizing soil properties, contaminant buildup, and potential health concerns associated with maize consumption. Specifically, this study investigated (i) the changes in soil pH, nitrogen, organic carbon, and salinity levels; (ii) the buildup of triclosan and sulfamethoxazole in the soil plough layer (30 cm); and (iii) the absorption and partitioning of triclosan and sulfamethoxazole in maize crop, along with associated dietary human health risk. We hypothesized that, extended biosolid applications would (i) improve soil organic carbon and total nitrogen levels; (ii) not adversely affect soil productivity due to salt accumulation, provided pH is managed through liming; (iii) not lead to significant triclosan and sulfamethoxazole accumulation in the upper 30 cm of soil at concentrations that could degrade soil quality; and (iv) not result in substantial uptake of triclosan and sulfamethoxazole by maize plants at levels that raise food safety concerns. The results of this study offer valuable insights into the behavior of triclosan and sulfamethoxazole in biosolid-amended soils and their potential risks in maize-based cropping systems under both rainfed and rainfed + supplemental irrigation conditions.

2. Material and Methods

2.1. General Description of the Study Area, Soil, and Biosolids

This research was carried out on a long-term field experiment spanning 15 years, located in the Ekurhuleni district near Johannesburg, South Africa. The experimental site lies at an elevation of 1577 m above sea level and experiences an average annual rainfall of around 700 mm, primarily during the summer months. The soil was a Hutton form with a clay loam texture (loamy, kaolinitic, mesic, Typic Eutrustox) with a pH (2.5:1 soil/water ratio) of 6.0 to 6.8. The biosolids utilized in the experiment were derived from anaerobically digested and paddy-dried municipal sludge that was obtained from a nearby wastewater treatment facility, which treats effluent from residential areas, commercial sectors, and health-care institutions. For each cropping season, the biosolids were sourced from a dedicated agricultural storage pile. Prior to their application to the field plots, representative samples of the biosolids were collected three to seven days beforehand for chemical characterization. These analyses were conducted to determine the suitability of the material for land application. A summary of the key chemical properties of the biosolids used is presented in Table 1.

2.2. Research Layout and Treatments

2.2.1. Layout

The field trial was arranged in a randomized complete block design comprising five treatments, each replicated four times, and implemented under two cropping systems: rainfed and rainfed supplemented with irrigation. Each experimental plot measured 5 × 5 m. The experimental setup included five different treatments: three levels of biosolid amendments applied at 4, 8, and 16 t ha−1; one plot receiving synthetic mineral fertilizer; and another left untreated as a control. The 8 t ha−1 biosolid application rate reflects the historical maximum permitted for agricultural use under the 1997 South African sludge guidelines, which were subsequently updated to allow up to 10 t ha−1 [17]. Accordingly, the 16 t ha−1 treatment exceeds the current regulatory limit and was included to assess the potential impacts of higher-than-permitted application rates.

2.2.2. Treatments

Municipal biosolids were applied annually to the designated treatment plots over a 15-year period, beginning in the 2004/2005 season and continuing through the 2018/2019 season. The biosolids were broadcast over the soil surface and then incorporated into the top 30 cm of the soil profile using a rotovator. Similarly, plots assigned to the commercial inorganic fertilizer treatment received annual split applications of fertilizer over the same 15-year period. Fertilizer application rates were determined in accordance with recommendations provided in the South African Fertilizer Handbook, as presented in the Supplementary Table S1. In the rainfed + irrigation system, soil moisture levels were maintained at field capacity through supplemental irrigation. Weed control was conducted manually using hand hoes as needed [18].

2.3. Selection of the Soil Chemical Parameters and Emerging Contaminants

2.3.1. Soil Chemical Parameters

The selection of soil chemical parameters was guided by two primary considerations: (i) the agronomic benefits associated with biosolid application, such as enhanced soil carbon and nitrogen sequestration, and (ii) the potential adverse effects, including soil salinization and acidification. Based on these criteria, the key soil properties analyzed in this study were total nitrogen, organic carbon, pH, and electrical conductivity.

2.3.2. Emerging Contaminants

This study targeted only two contaminants of emerging concern, triclosan and sulfamethoxazole, due to their prevalent and persistent detection in biosolids. Triclosan is a widely used antimicrobial agent commonly incorporated in personal care products. While sulfamethoxazole is an antibiotic frequently prescribed for urinary tract infections. Moreover, triclosan and sulfamethoxazole are characterized by varying hydrophobicity and water solubility, exhibiting distinct behaviors within soil–plant systems. The physicochemical characteristics of these contaminants are detailed in Table 2.

2.4. Sampling

2.4.1. Plant Sampling

At the end of the 15th growing season (At physiological maturity), maize plant samples were collected at harvest from all treatment plots, including the unfertilized control. The zero-control treatment served to account for potential background influences over the duration of the trial, independent of fertilizer input and cropping system. Plant material was harvested approximately 5 cm above the soil surface using a sickle and immediately placed in a CAMP MASTER™ cooler box (Johannesburg, South Africa) for transport to the laboratory. Upon arrival, samples were separated into stems, leaves, and grain components, and thoroughly rinsed with deionized water to remove any surface contaminants. The cleaned samples were then freeze-dried, pulverized with an IKA® A 10 basic mill (Staufen, Germany), and stored at –20 °C until further chemical analysis.

2.4.2. Soil Sampling

After the crops were harvested, soils were sampled from the top 0–30 cm depth using a galvanized steel auger. To eliminate the risk of cross-contamination between plots, the auger was cleaned with ultrapure water and rinsed with methanol prior to sampling each new plot. From each plot, approximately six randomly selected soil cores were combined to form a single composite sample representative of the entire plot. The composite samples were then divided into two portions: one for general chemical analysis and the other for the determination of emerging contaminants, specifically triclosan and sulfamethoxazole. Samples designated for contaminant analysis were dried at ambient temperature, screened through a 2 mm mesh, and preserved at –20 °C. For nutrient and elemental analysis, the soil was likewise dried to a stable mass, passed through a 2 mm sieve, and subsequently prepared for testing.

2.5. Extraction and Quantification Methods for Soil Chemical Parameters and Emerging Contaminants

2.5.1. Soil Chemical Parameters

Soil pH and electrical conductivity were determined on a 1:2.5 soil-to-water suspension using Consort pH (model C830) (Turnhout, Belgium) and EC (model C861) (Shenzhen, China) meters, respectively [19]. Total nitrogen was analyzed via dry combustion employing a Carlo Erba NA1500 carbon/nitrogen analyzer (Carlo Erba Strumentazione, Cornaredo, Italy) [20]. Soil organic carbon content was quantified using the Walkley–Black method [21].

2.5.2. Emerging Contaminants

The extraction of triclosan and sulfamethoxazole from the soil and plant samples was carried out using a modified version of previously published protocols [9,22]. In brief, 1 g of each homogenized soil or plant sample was transferred to a 50 mL centrifuge tube. A 10 mL mixture of methanol and acetone (1:1, v/v) was added to each tube, followed by agitation on a platform shaker for 10 min. The samples were then sonicated for 60 min in a water bath using a Fisher Scientific FS110H sonicator (Monterrey, Mexico). After sonication, the samples were centrifuged at 3000 rpm for 30 min. The extraction process was repeated three times on the same sample to ensure removal of all analytes. The supernatants from three extraction rounds were pooled. The combined extracts were then concentrated to a final volume of 10 mL under a gentle stream of nitrogen gas. For cleanup, the concentrated extracts were subjected to a solid-phase extraction using Supelclean™ ENVI™-18 cartridges (Darmstadt, Germany). The SPE cartridges were preconditioned sequentially with methanol and LC-MS-grade water prior to use. Extracts were loaded onto the cartridges and eluted with 2 × 5 mL of methanol. The eluates were further concentrated under nitrogen, reconstituted in 1000 µL of methanol, vortexed, and stored for subsequent analysis via LC-MS/MS.

2.6. Instrument Analysis and Quality Control Measures

2.6.1. Instrument Analysis

The quantification of the target analytes was conducted using a Shimadzu LC-MS/MS-8030 triple quadrupole (QqQ) mass spectrometer equipped with an electrospray ionization (ESI) source in positive and/negative mode (Shimadzu USA Manufacturing Inc., Canby, OR, USA). The instrument was equipped with a GL Sciences C18 column (2.1 × 150 mm; 3 µm particle size) for chromatographic separation of the target analytes. The column flow rate was set at 0.3 mL min−1. The mobile phase consisted of a mixture of 20 mM ammonium acetate in water (mobile phase A) and methanol (mobile phase B). The injection volume for the samples, blanks, solvents, and standards was exactly 10 µL and was performed in duplicate to measure the precision of the instrument. Samples, blanks, solvents, and standards were subjected to a run time of 4 min. The retention times for triclosan and sulfamethoxazole were 1.2 and 0.9 min, respectively. Quantification of the two target analytes was made by multiple reaction monitoring. The multiple reaction monitoring parameters of the target analytes using the LC-MS/MS instrument are summarized in Supplementary Table S2.

2.6.2. Quality Control Measures

Five standard solutions ranging from 1 to 100 ng mL−1 were used to obtain calibration curves for the targeted analytes (Supplementary Table S3). The calibration curves were constructed using the concentration (x-axis) vs. response (y-axis) (i.e., peak area of the analyte). The correlation coefficients (R2) of the calibration curves were greater than 0.99, indicating the validity of the calibration curves for the quantification the target analytes. Blanks were spiked with known concentrations of the analytes and extracted in triplicate to determine the percentage recoveries and relative standard deviations. The percentage recoveries (±relative standard deviation (%)) for triclosan in the soil and plant parts were 90% (±6%) and 105% (±12%), respectively, indicating that this method is reliable and reproducible. Similarly, the percentage recoveries (±relative standard deviation (%)) for sulfamethoxazole in the soil and plant parts were 85% (±8%) and 99% (±13%), respectively, indicating that this method is reliable and reproducible. The limits of quantification (LOQs) and limits of detection (LODs) were determined from the calibration curves as concentrations that give a signal-to-noise (S/N) ratio of 10 and 3, respectively [23]. LODs and LOQs were for triclosan and sulfamethoxazole were 0.83 and 2.76 ng g−1, and 0.28 and 0.97 ng g−1, respectively. At least one method blank was analyzed with every batch of samples to determine the availability of the target compounds in the blanks. None of the target compounds was detected in the method blanks. In addition, ultra-LC-MS-grade methanol, which was used as a mobile phase, was injected after every 10 samples to check for cross-contamination.

2.7. Statistical Data Analysis

A two-way analysis of variance (ANOVA) was conducted to assess the effects of treatments and cropping systems, as well as their interactions, on the measured parameters using SAS software (version 9.0). Where significant differences were identified (p ≤ 0.05), Student’s t-test was employed for mean separation. Statistical significance was determined at p ≤ 0.05.

2.8. Human Health Risk Assessment

To assess the potential human health risks linked to the consumption of maize cultivated on biosolid-amended soils, a risk assessment was conducted in accordance with established methodologies [24]. The evaluation involved estimating the daily intake of the target compounds—triclosan and sulfamethoxazole—using Equation (1) and comparing the calculated estimated daily intake values against the accepted daily intake thresholds.
E D I = C × G I B W
where GI = daily maize intake per individual in Sub-Saharan Africa, estimated at 350 g day−1 [25]; EDI = estimated daily intake (µg kg−1 day−1); BW = average body weight, assumed to be 70 kg for adults and 12 kg for toddlers in South Africa [26]; and C = maximum average concentration of triclosan or sulfamethoxazole detected in maize grains (µg g−1).
To model a worst-case exposure scenario, the highest average concentrations of triclosan and sulfamethoxazole measured in maize grains were used. A compound was considered a potential human health concern if the estimated daily intake exceeded its respective accepted daily intake value.

3. Results

3.1. Effects of Biosolid Applications on Soil Organic Carbon, pH, Electrical Conductivity, and Total Nitrogen

3.1.1. Soil pH

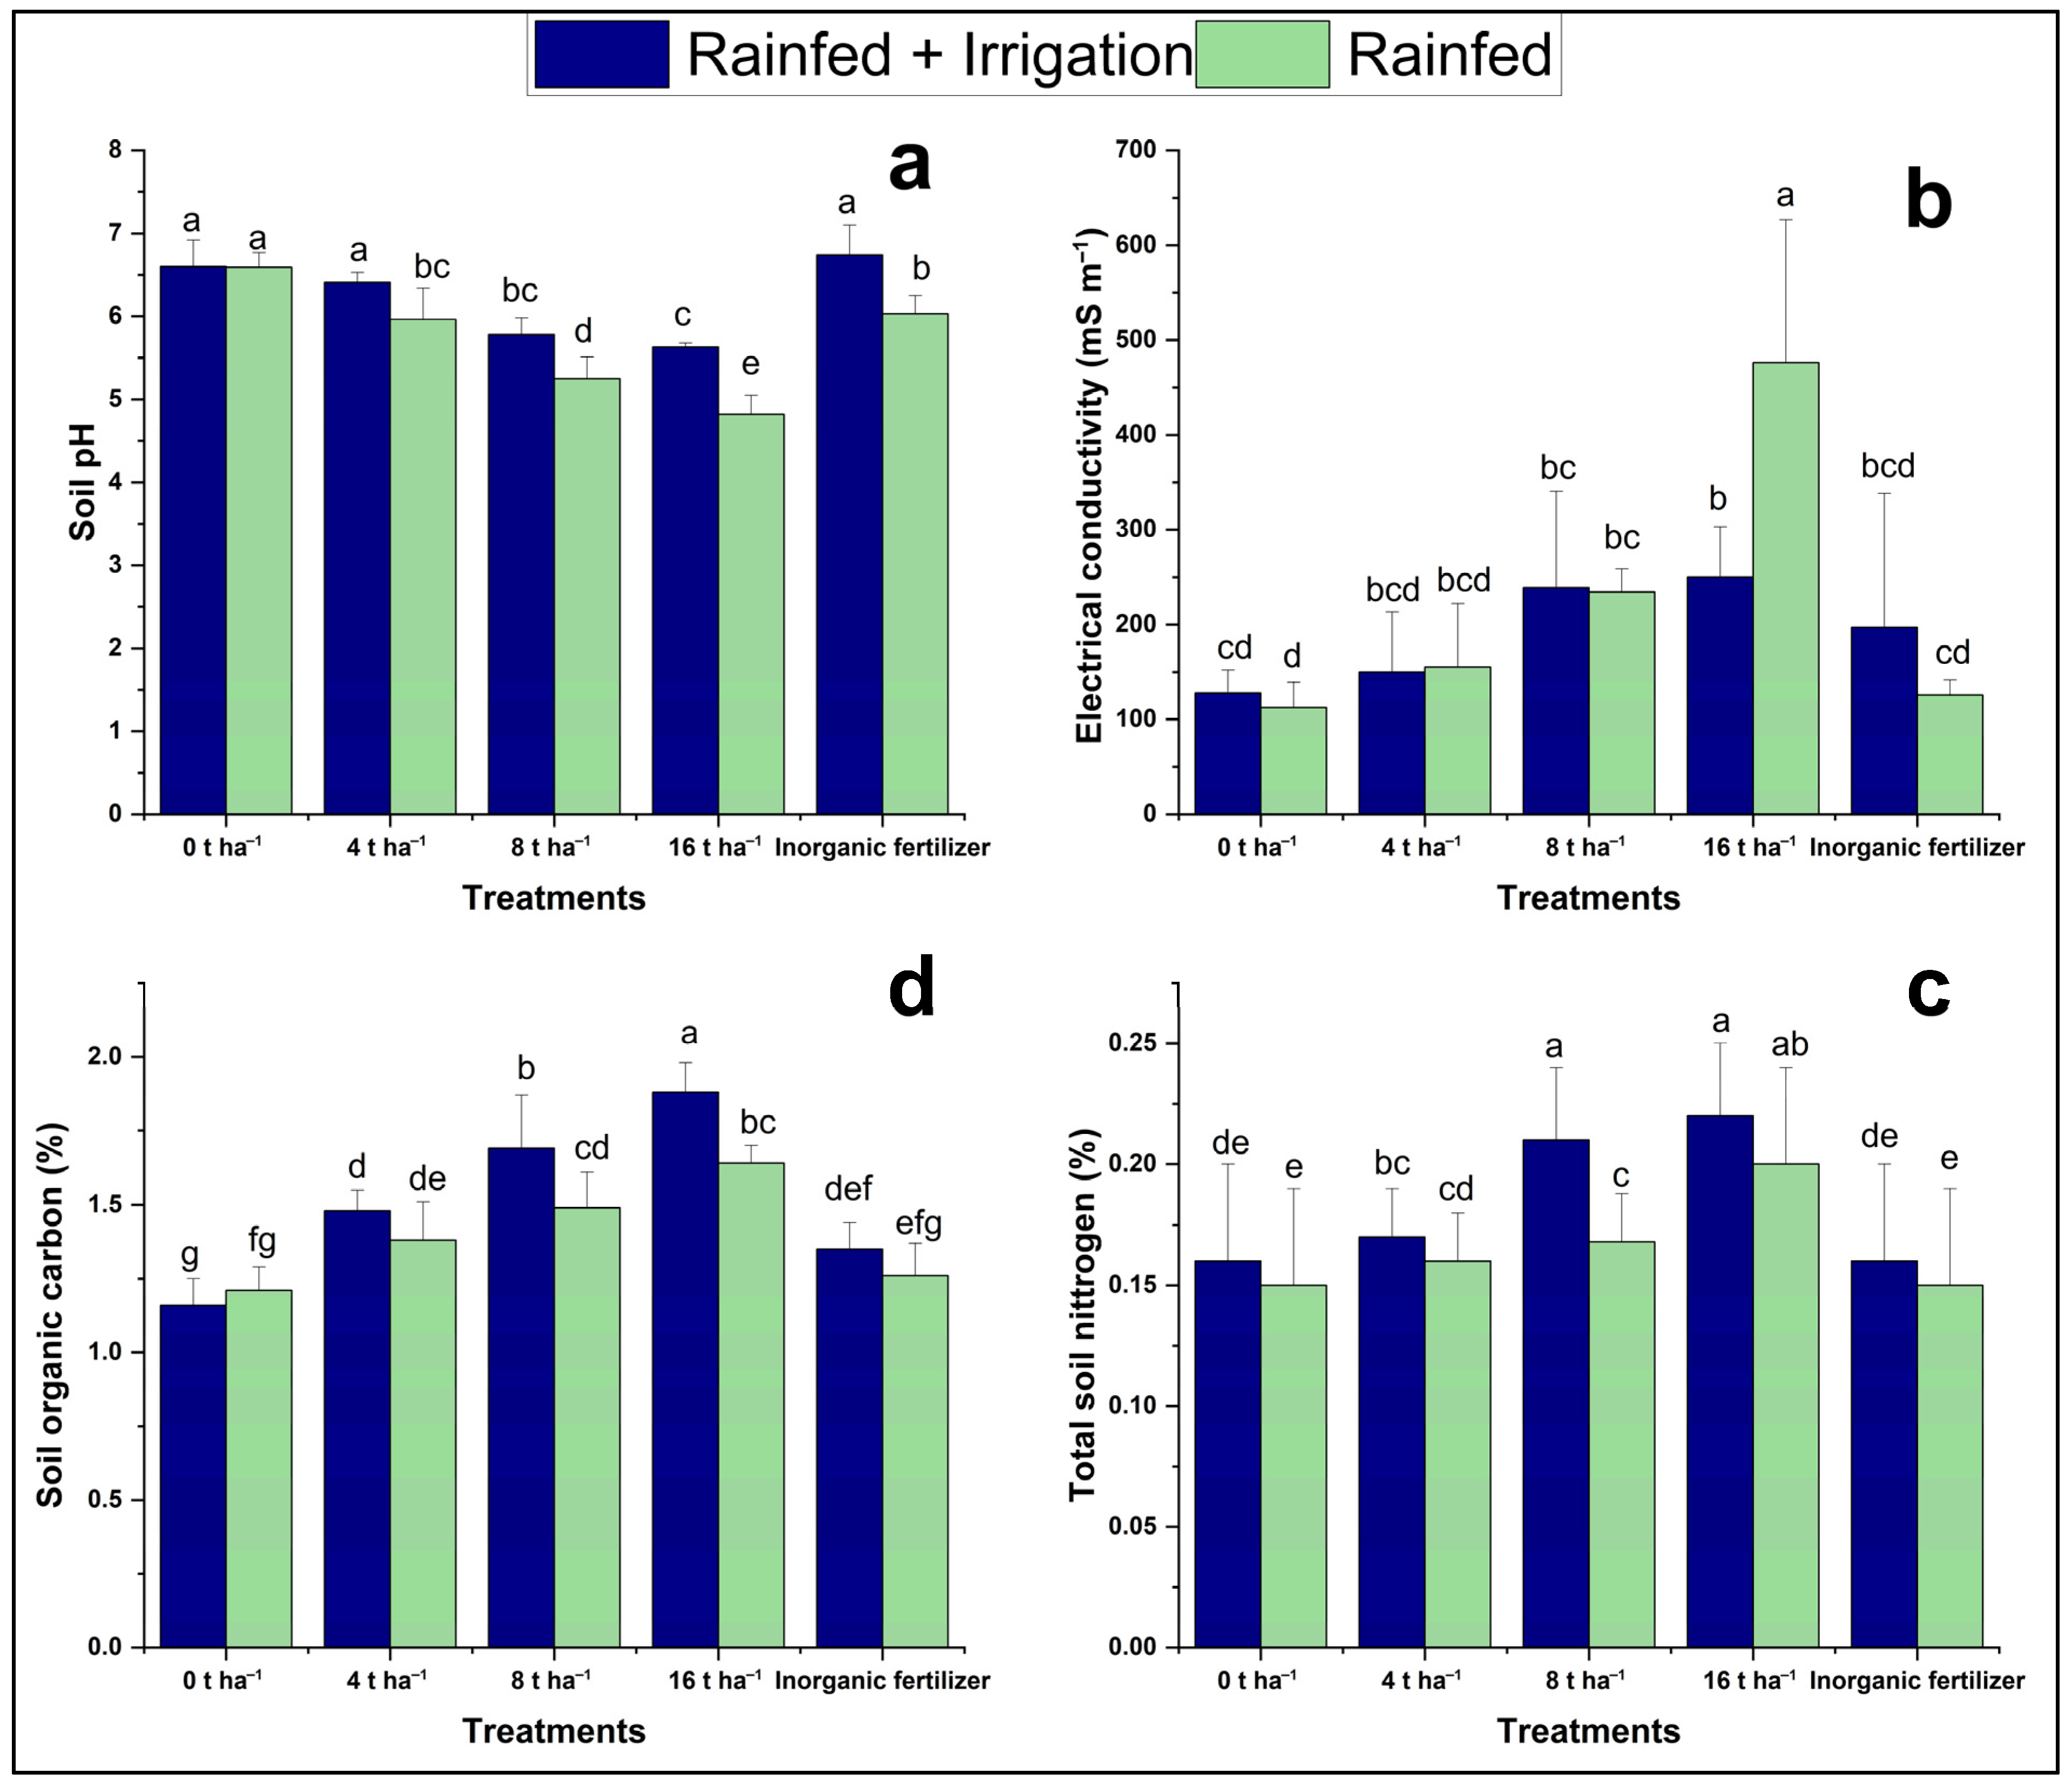
Soil pH was significantly affected by both cropping system and biosolid treatment (Table 3). The effect of cropping system was highly significant (p < 0.0001), with an F-value of 41.87, indicating that differences in soil pH were strongly influenced by whether the cropping was under irrigated or rainfed conditions. Similarly, the biosolid treatments had a very strong influence on soil pH (p < 0.0001; F = 44.32), showing that the type and amount of amendment applied had a considerable effect on this soil chemical parameter. The interaction effect of cropping system and biosolid treatments approached statistical significance (p = 0.0596), suggesting a potential trend of differing biosolid effects under different cropping systems; however, this interaction was not statistically confirmed at the conventional 5% significance level. In the control (0 t ha−1) and 4 t ha−1 treatments, both irrigated and rainfed systems maintained relatively high pH values (above 6.5), with no significant differences between the two cropping systems (Figure 1). A notable decrease in soil pH was observed with increasing biosolid application beyond 4 t ha−1. The 16 t ha−1 treatment recorded the lowest pH values, particularly under rainfed conditions, where pH dropped below 5.0. The 8 t ha−1 treatment showed a moderate decline in pH, significantly lower than the 0 and 4 t ha−1 treatments but higher than the 16 t ha−1 treatment. The inorganic fertilizer treatment maintained relatively high pH under irrigation (comparable to the control) but showed a slight decline under rainfed conditions. These results confirm that biosolid application rate and irrigation practice influence soil pH, with higher biosolid rates (8 and 16 t ha−1) associated with soil acidification, particularly in rainfed systems.

3.1.2. Soil Electrical Conductivity

The analysis of variance results showed that biosolid treatment had a highly significant effect on soil electrical conductivity (p < 0.0001) (Table 3). However, the cropping system alone did not significantly affect electrical conductivity (p = 0.2849), while the interaction between cropping system and biosolid treatment was significant (p = 0.0109), indicating that the response of electrical conductivity to biosolid application varied between irrigated and rainfed systems. As shown in Figure 1, electrical conductivity increased with higher biosolid application rates, with notable differences between the irrigated and rainfed conditions. The 16 t ha−1 biosolid treatment under rainfed conditions showed the highest electrical conductivity (~500 mS m−1), significantly higher than all other treatments. This peak suggests salt accumulation due to insufficient leaching in the absence of irrigation. Under irrigation, the electrical conductivity for the 16 t ha−1 treatment was considerably lower than in the rainfed counterpart but still significantly higher than the control and low application rates. The 0 t ha−1 control and 4 t ha−1 treatments had the lowest electrical conductivity values under both cropping systems, not differing significantly from each other, suggesting minimal salinity risk at these levels. Electrical conductivity in the inorganic fertilizer treatment was moderate under irrigation but dropped significantly under rainfed conditions. Overall, electrical conductivity values followed a trend of increasing with biosolid rate, and irrigation helped moderate electrical conductivity buildup compared to rainfed plots.

3.1.3. Soil Total Nitrogen

According to the analysis of variance results, cropping system and biosolid treatment both had a highly significant effect on soil total nitrogen content (p = 0.0008 and p < 0.0001, respectively; Table 3). In contrast, the interaction between cropping system and biosolid treatment was not statistically significant (p = 0.5591), indicating that biosolid effects on total nitrogen were consistent across both irrigated and rainfed systems. Irrigated plots consistently showed higher total nitrogen levels compared to rainfed plots, across all biosolid treatments (Figure 1). Total soil nitrogen was significantly enhanced by both irrigation and biosolid application. The greatest improvement was observed at 8 to t ha−1 biosolid rates, regardless of the cropping system. Statistically, 8 t ha−1 and 16 t ha−1 treatments had significantly higher total nitrogen than the control (0 t ha−1) and the inorganic fertilizer treatment. These findings highlight the beneficial role of biosolids in enhancing soil fertility, particularly in combination with irrigation.

3.1.4. Soil Organic Carbon

The analysis of variance revealed that both the cropping system and biosolid treatment had statistically significant effects on soil organic carbon content (Table 3). Specifically, biosolid treatments showed a highly significant impact on soil organic carbon (p < 0.0001), indicating that different biosolid application rates substantially influenced soil organic carbon levels. Similarly, the cropping system significantly affected soil organic carbon (p = 0.0018), suggesting that soil management under rainfed versus rainfed + irrigation systems resulted in differing soil organic carbon contents. However, the interaction effect between cropping system and biosolid treatment on soil organic carbon was not statistically significant (p = 0.1081), indicating that the influence of biosolid treatments on soil organic carbon was consistent across both cropping systems. These results demonstrate that biosolid application is a primary driver of soil organic carbon variation, with cropping system also playing a role, but without significant interaction between the two factors. Following biosolid applications over a decade and a half, soil organic carbon increased progressively with biosolid application rate, reaching the highest value at 16 t ha−1 under irrigation (1.89%), which was significantly greater than all other treatments (denoted by “a”; Figure 1). The lowest soil organic carbon was recorded in the untreated control (0 t ha−1) under rainfed conditions (1.20%). Under both cropping systems, biosolid application at 8 and 16 t ha−1 consistently resulted in higher soil organic carbon levels than the 0 and 4 t ha−1 rates, as well as the inorganic fertilizer treatment. The inorganic fertilizer treatment yielded intermediate soil organic carbon values that were significantly lower than the 8 and 16 t ha−1 biosolid treatments but generally higher than the untreated control.
Across all treatments, irrigated plots exhibited slightly higher soil organic carbon than rainfed plots, confirming the significant main effect of cropping system. However, the absence of a significant cropping system × biosolid treatments’ interaction (p = 0.1081) suggests that the effect of biosolid application on soil organic carbon was consistent across irrigation regimes.

3.2. Presence of Triclosan and Sulfamethoxazole in the Soil

Triclosan and sulfamethoxazole concentrations in the upper 30 cm soil layer were below the respective detection limits of 0.80 ng g−1 and 0.28 ng g−1 dry weight across all biosolid treatments and cropping systems. This indicates that long-term application of biosolids, under both rainfed and rainfed + irrigation conditions, did not result in detectable accumulation of triclosan or sulfamethoxazole in the topsoil.

3.3. Presence of Triclosan and Sulfamethoxazole in the Maize Plant

Triclosan was detected in maize stems, leaves, and grains, but only in treatments receiving the two highest biosolid application rates (8 and 16 t ha−1) and the inorganic fertilizer treatment under irrigation.
No triclosan was detected in plant tissues from the control (0 t ha−1) or the 4 t ha−1 biosolid treatments. Similarly, sulfamethoxazole was not detected in any maize tissue (stems, leaves, or grains), regardless of the biosolid application rate or cropping system. This suggests minimal-to-no uptake of sulfamethoxazole by maize under the experimental conditions.

3.3.1. Triclosan Concentration in Maize Stems

According to the analysis of variance (Table 4), the cropping system had a statistically significant effect on triclosan concentration in maize stems (F = 9.32, p = 0.0081), while neither the biosolid treatment (p = 0.0798) nor the interaction between cropping system and biosolid treatment (p = 0.2617) was significant.
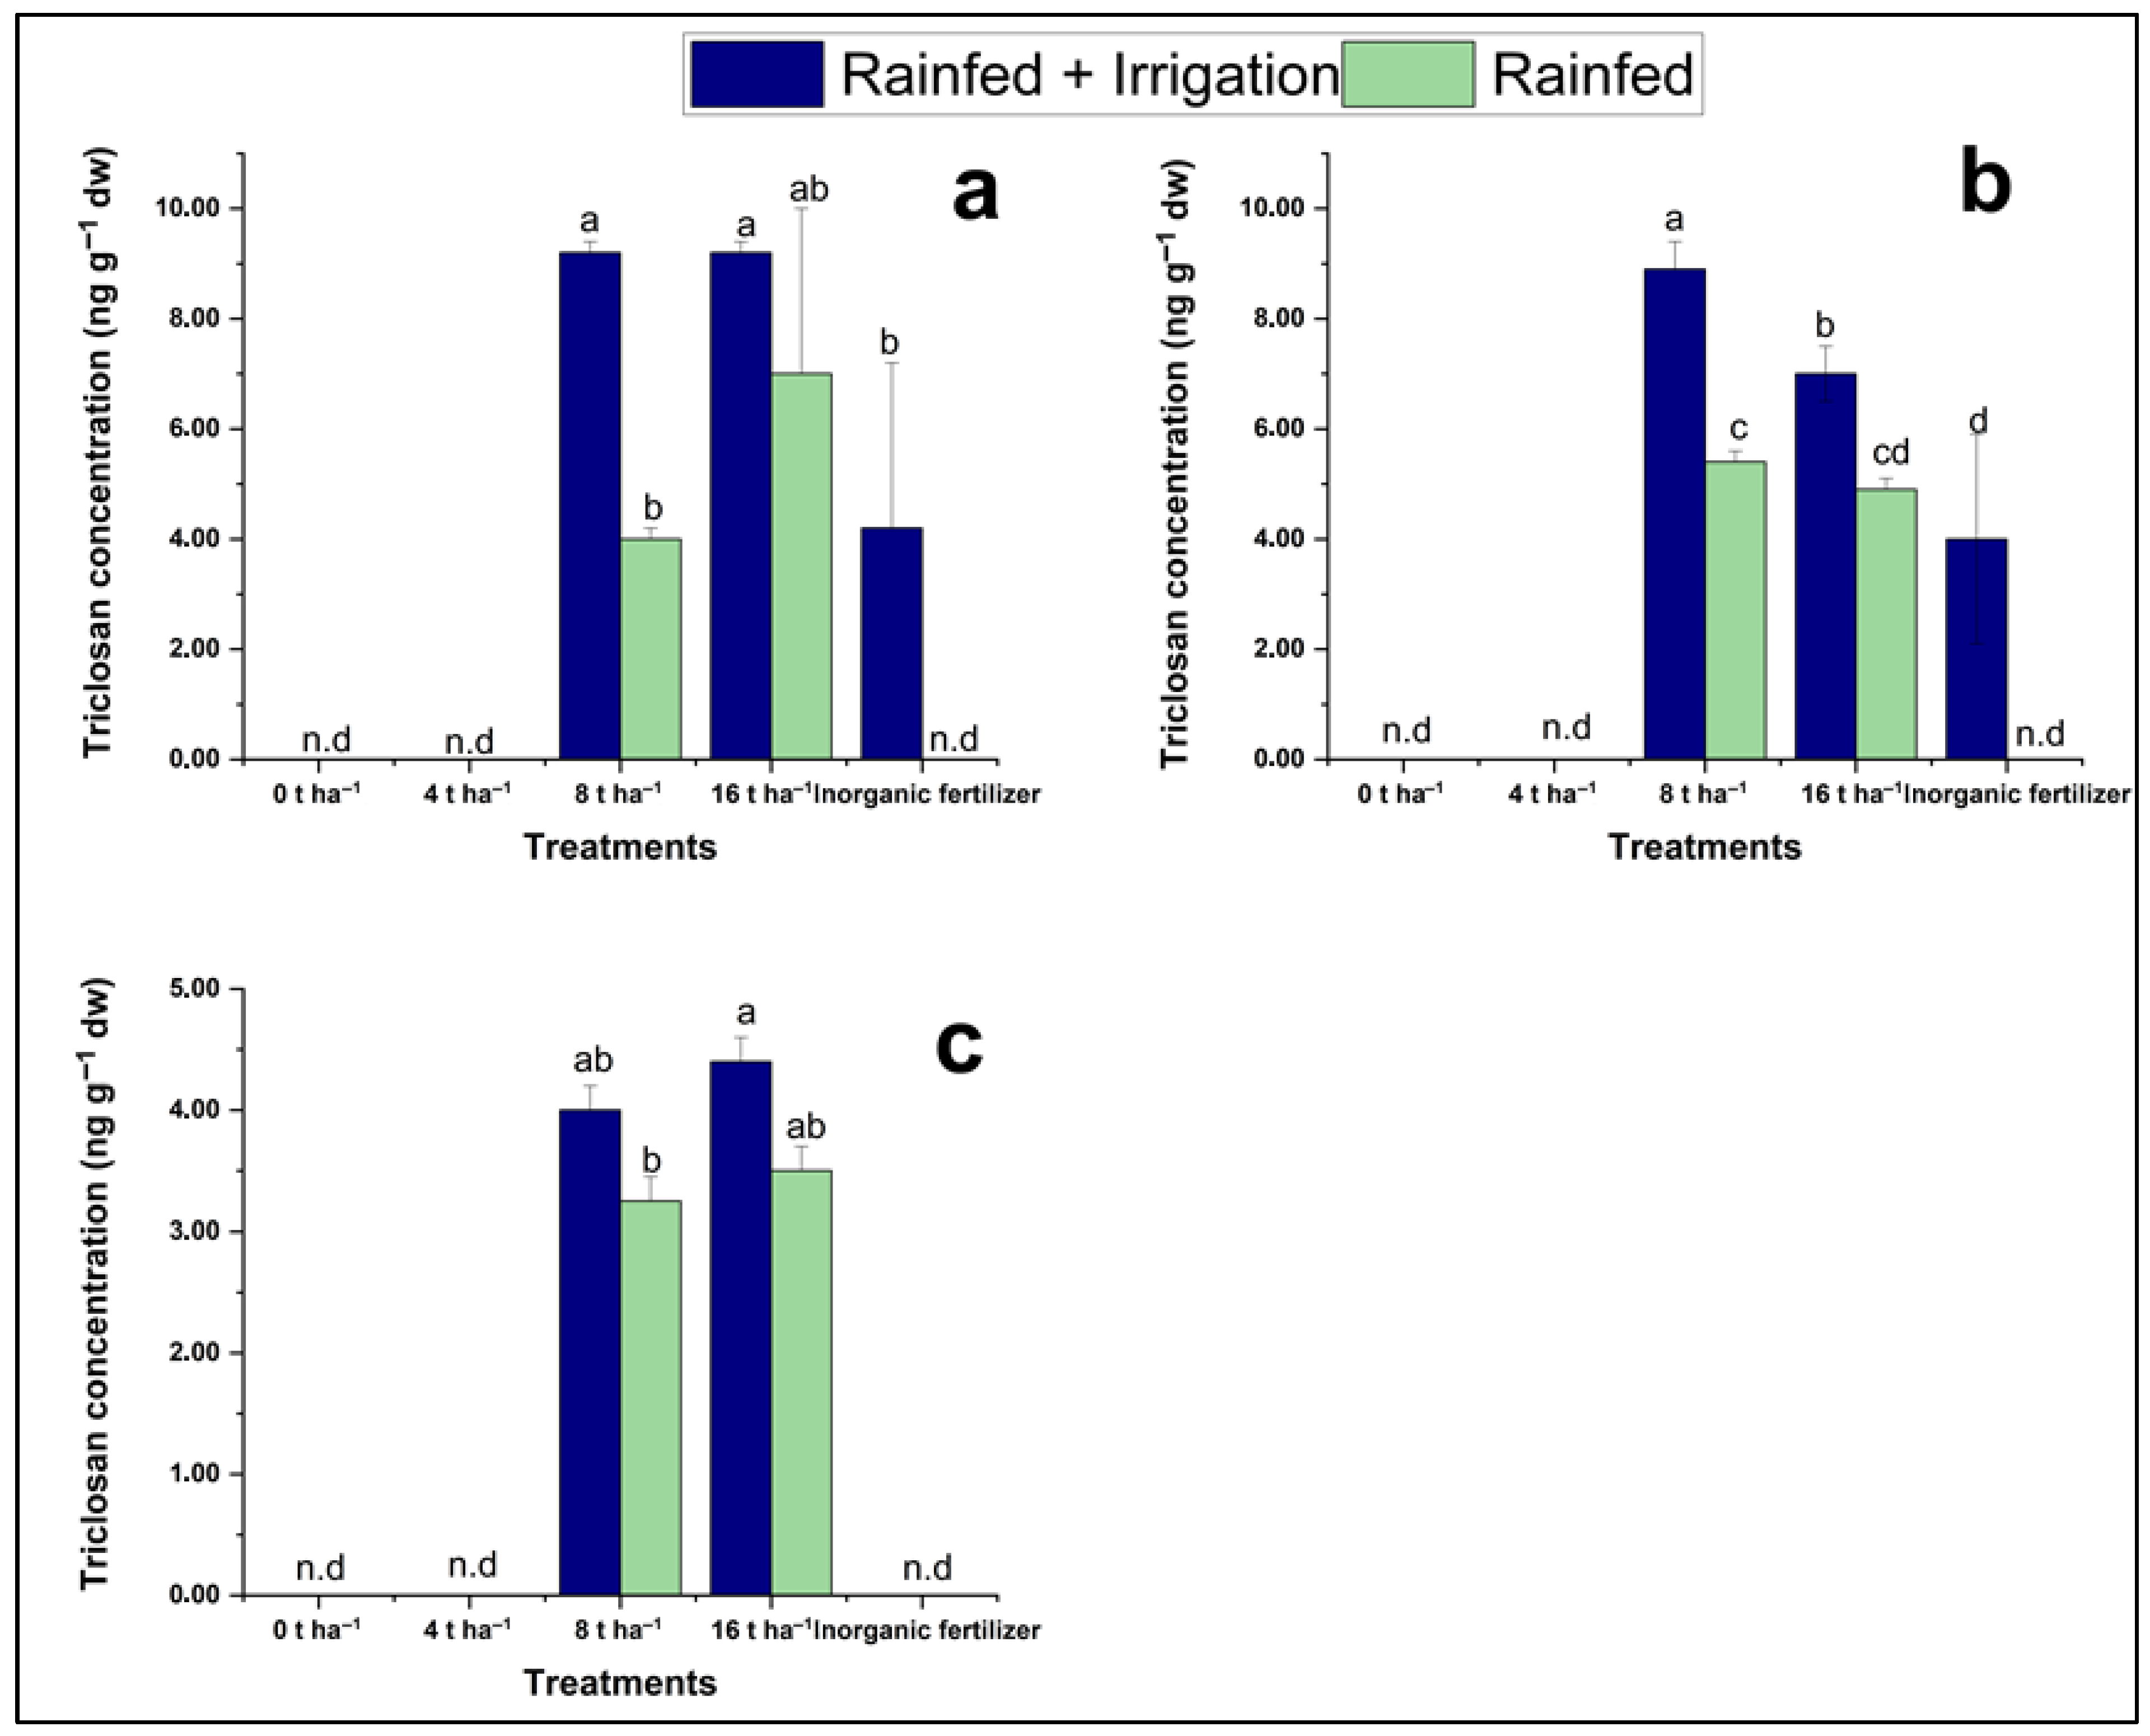
As shown in Figure 2a, under the rainfed + irrigation system, triclosan concentrations in stems peaked at 8 t ha−1 (approx. 9.2 ng g−1), followed closely by 16 t ha−1. No significant difference was observed between these two application rates within the same cropping system. Under rainfed conditions, triclosan concentrations were significantly lower, particularly at 8 t ha−1, where concentrations were approximately half of those in the irrigated system. Triclosan was not detected in stem samples from the control, 4 t ha−1 biosolid, or rainfed inorganic fertilizer treatments.

3.3.2. Triclosan Concentration in Maize Leaves

Triclosan concentrations in maize leaves were significantly affected by biosolid treatment (p < 0.0001), cropping system (p < 0.0001), and their interaction (p = 0.0485), as shown in Table 4. Figure 2b illustrates that the highest triclosan concentration in maize leaves was found under the 8 t ha−1 biosolid treatment with rainfed + irrigation (approx. 8.90 ng g−1), followed by 16 t ha−1 under the same system. Triclosan concentrations declined significantly as biosolid application increased from 8 to 16 t ha−1. Across all biosolid rates, triclosan concentrations in leaves were higher in irrigated treatments than in rainfed systems. Triclosan was undetectable in leaves from the control, 4 t ha−1 biosolid, and rainfed inorganic fertilizer treatments.

3.3.3. Triclosan Concentration in Maize Grains

Triclosan concentrations in maize grains were only detected in treatments receiving 8 and 16 t ha−1 biosolid applications. Triclosan was below detection limits in the control (0 t ha−1), 4 t ha−1, and inorganic fertilizer treatments, regardless of cropping system. The analysis of variance results (Table 4) indicated that the cropping system had a statistically significant effect on grain triclosan concentration (p = 0.0487), while the biosolid treatment (p = 0.3524) and the interaction between cropping system and biosolid treatment (p = 0.9815) were not significant. As shown in Figure 2c, under irrigated conditions, grain triclosan concentrations reached approximately 4.4 ng g−1 at 16 t ha−1 and 4.0 ng g−1 at 8 t ha−1. Under rainfed conditions, concentrations were slightly lower, with a significant drop observed at 8 t ha−1 (approx. 3.3 ng g−1), as indicated by the statistical grouping (letters “a” and “b”). No significant difference was found between 8 and 16 t ha−1 under either irrigation regime, though irrigated treatments consistently showed numerically higher triclosan accumulation.

4. Discussion

4.1. Effects of Biosolid Applications on Soil Organic Carbon, pH, Electrical Conductivity, and Total Nitrogen

4.1.1. Soil pH

A decline in soil pH is a well-documented effect of biosolid application in agricultural soils [27]. This decrease is primarily attributed to the release of organic acids during organic matter decomposition and the proton (2H+) release that accompanies the nitrification of ammonium (NH4+) derived from biosolids [28,29]. Similar acidifying effects have also been observed with the use of conventional ammonium-based nitrogen fertilizers due to the same microbial nitrification process. In the present study, biosolid application significantly reduced soil pH, with a more pronounced decline observed at higher application rates under both rainfed and rainfed + irrigation maize cropping systems. These findings align with previous reports [27] and can be attributed to the cumulative effects of organic acids release during decomposition [27,29], and proton release during NH4+ nitrification [28].
Additionally, irrigation influenced soil pH in this study. Generally, irrigated soils exhibited higher pH values than rainfed soils, due to the presence of alkaline salts in irrigation water that elevate soil alkalinity upon deposition [30]. This trend was confirmed in our results, where the rainfed + irrigation system exhibited significantly higher soil pH (p < 0.0001) across treatments. This difference may also be linked to enhanced biomass production in irrigated plots [31], which increases the return of plant residues [32], rich in base-forming cation (e.g., Ca2+, Mg2+, and K+) [33]. Upon decomposition, these cations contribute to neutralizing acidity. Furthermore, higher biomass also results in greater nitrogen cycling via ammonification, leading to NH4+ accumulation, which in certain soil types can act as a short-term pH buffer before nitrification sets in [33]. These findings suggest that long-term biosolid application, especially without liming, may lead to soil acidification, similar to commercial inorganic nitrogen fertilizers. This progressive acidification can increase the bioavailability of toxic metals such as cadmium and lead, alter nutrient-availability patterns, and impair plant nutrient uptake efficiency [34], negatively affecting overall crop yield [35]. To sustain agricultural productivity and minimize environmental risks, integrating biosolid application with appropriate liming strategies and irrigation management is essential. Regular soil pH monitoring, combined with site-specific agronomic planning, will help maintain soil health, improve nutrient use efficiency, and support long-term sustainability [36].

4.1.2. Soil Electrical Conductivity

An increase in soil electrical conductivity with higher biosolid application rates is a widely reported phenomenon in agricultural systems [27]. This increase is primarily due to the direct addition of soluble salts from biosolids [37], which are typically rich in electrolytes such as sodium, potassium, calcium, chloride, and sulphate. In the present study, a statistically significant rise in soil electrical conductivity was observed with increasing biosolid application rates under both rainfed and rainfed + irrigation maize cropping systems. This trend is consistent with prior findings and can be attributed to the high salt content in biosolids used in this trial, which had an average electrical conductivity of approximately 1600 mS m−1 (Table 1). The interaction between cropping systems and biosolid rate was also significant, suggesting that the effect of biosolid application on electrical conductivity varied between rainfed and irrigated conditions. This may be due to differences in water movement and leaching potential, which are influenced by irrigation. In irrigated plots, partial leaching of salts may occur, especially under higher water availability, slightly moderating electrical conductivity levels relative to rainfed conditions where salts can accumulate more easily in the root zone.
Elevated soil salinity can negatively affect plant growth and reduce yield [38]. High electrical conductivity levels reduce the osmotic potential of the soil solution, making it more difficult for plants to extract water. This osmotic stress can lead to reduced transpiration, impaired nutrient uptake, and stunted growth [39]. Moreover, excessive salinity can alter the structure and function of soil microbial community [40,41], leading to declines in microbial biomass, enzymatic activity, and nutrient cycling efficiency, further compromising soil fertility and crop productivity. Despite the observed increase in electrical conductivity, values in this study remained well below the salinity thresholds of most commonly grown crops, which range between 1.0 and 2.5 mS m−1 [41]. Nevertheless, continuous monitoring of soil salinity is warranted. To mitigate the risk of salt buildup, especially under high biosolid loading rates or limited leaching conditions, best management practices such as deep irrigation (leaching fraction management) [40], biosolid rate moderation, and salt-sensitive crop selection should be implemented. These findings underscore the importance of balancing biosolid application rates with appropriate irrigation and soil monitoring strategies to sustain productivity while avoiding adverse impacts on soil health and crop performance.

4.1.3. Soil Total Nitrogen

Biosolid application is widely recognized for its capacity to enhance total nitrogen levels in agricultural soils [37]. This enhancement stems from two primary sources: the direct nitrogen input from the biosolids themselves [37] and the indirect contribution through nitrogen-rich plant biomass, particularly root residues, that accumulate and decompose on biosolid-amended soils [42]. In the present study, a significant increase in total nitrogen was observed with increasing biosolid application rates under both rainfed and rainfed + irrigation maize cropping systems. This trend is consistent with earlier findings that demonstrate a linear relationship between biosolid loading rates and nitrogen availability in soils [37]. The elevated total nitrogen content is likely due to both immediate nutrient inputs from the biosolid and the plant residue decomposition, primarily from root biomass contributing to the soil nitrogen pool. This reinforces the established understanding that returning plant residues to the soil is a key mechanism for maintaining or enhancing soil nitrogen levels [42]. The cropping system also had a statistically significant effect on soil total nitrogen, with higher total nitrogen levels recorded in the rainfed + irrigation plots compared to rainfed plots. This is in agreement with [31], who reported that supplemental irrigation under water-limited conditions increases biomass and nitrogen content in grain crops. In this study, higher biomass under the rainfed + irrigation system likely resulted in more extensive root networks and greater nitrogen deposition through residue decomposition, thus contributing to the observed total nitrogen enrichment. Nitrogen plays a pivotal role in crop development, as it is central to chlorophyll formation and is a core component of amino acids, proteins, and nucleic acids [43]. Adequate nitrogen availability is also linked to increased photosynthetic efficiency via enhancements in leaf area index and chlorophyll content [44]. Therefore, the higher total nitrogen content in biosolid-treated plots not only reflects improved soil fertility but also supports the physiological and biochemical processes essential for optimal crop growth.
Recent studies reinforce the agronomic benefits of biosolids for nitrogen management. For instance, ref. [45] reported that biosolid application based on crop and site specificity produced comparable maize yield to commercial inorganic fertilizers while maintaining similar nitrate leaching levels below the root zone. Taken together, the findings from this study and the recent literature confirm that biosolids serve a dual role in nitrogen management: they act as a direct nutrient source while also stimulating plant productivity, which leads to further nitrogen cycling and accumulation in the soil via root biomass and residual organic matter. This positions biosolids as an effective, sustainable strategy for enhancing soil nitrogen status, crop productivity, and long-term soil fertility.

4.1.4. Soil Organic Carbon

An increase in soil organic carbon with higher biosolid application rates is a well-documented trend in agricultural systems [46,47]. This increase is primarily due to the direct addition of organic carbon from biosolids [47] and the enhanced plant biomass production, which contributes to soil organic carbon through litter and root decomposition [42]. Consistent with previous findings, the current study observed a significant rise in soil organic carbon as the biosolid application rate increased in both cropping systems. This increase can be attributed to the combined effects of direct organic carbon input from biosolids [47] and the greater accumulation of aboveground and root biomass, which enriches soil organic matter through decomposition [42]. Interestingly, soil organic carbon levels were higher in the rainfed + irrigation system compared to the rainfed. This difference is likely due to the greater above- and belowground biomass in the rainfed + irrigation system compared to the rainfed [31], which enhances organic matter inputs.
The results reinforce the role of biosolid application in carbon sequestration [48,49], making it an effective strategy for mitigating greenhouse gas emissions in agricultural landscapes. Beyond carbon sequestration, biosolids improve soil physical and chemical properties [37], enhancing nutrient and water retention. Thus, the use of biosolids in agriculture not only supports climate change mitigation through carbon storage but also contributes to improved soil health and productivity, and ultimately crop production.

4.2. Presence of Triclosan and Sulfamethoxazole in the Soil

Despite a decade and a half of biosolid applications, triclosan was not detected in the upper 30 cm of soil under both rainfed and irrigated maize cropping systems. This finding is consistent with previous studies reporting undetectable triclosan levels in field soils amended with municipal biosolids at moderate application rates (7–8 t ha−1 yr−1) over multiple years [50,51]. The lack of accumulation may be attributed to microbial degradation, photolysis, and sorption processes that reduce triclosan persistence in soil. Reported triclosan half-lives in biosolid-amended soils range between 43 and 107 days, depending on environmental conditions [52,53].
Conversely, detectable triclosan concentrations have been reported in soils receiving higher biosolid loads (>20 t ha−1) or biosolids with elevated triclosan content (>10,000 ng g−1) [14,54]. For instance, ref. [14] recorded triclosan levels of 98 ng g−1 six months after application at 22 t ha−1, while ref. [54] observed median concentrations of 1.5 ng g−1 four years post-application. These comparatively low levels, relative to initial biosolid triclosan concentrations, underscore the roles of environmental dissipation and sorption. The absence of detectable triclosan in the current study implies that biosolids of similar quality could be applied at rates up to 16 t ha−1 yr−1 without posing long-term triclosan accumulation risks under similar agro-environmental conditions. However, the potential ecotoxicological effects of even low triclosan residues—including disruptions to microbial respiration and nitrogen cycling [55]—highlight the need for ongoing monitoring and risk assessment.
Sulfamethoxazole, an antibiotic commonly detected in biosolids, was also undetectable in the 0–30 cm soil layer despite long-term applications. This contrasts with findings by [8], who observed sulfamethoxazole levels of 67.4 ng g−1 in greenhouse studies 71 days post-application at 8 t ha−1. The discrepancy likely stems from differences in experimental design and sampling intervals. The current field study, with a 210-day post-application sampling timeline, allowed more time for sulfamethoxazole degradation via photolysis, microbial activity, and leaching.
Given sulfamethoxazole’s high-water solubility and relatively low sorption affinity (Log Kow ≈ 0.89), its rapid downward mobility could account for the absence of detectable levels in the surface soil [56,57]. While this suggests limited environmental persistence in the upper soil profile under the current management regime, it also raises the possibility of subsurface transport, which was not assessed in this study.

4.3. Presence of Triclosan and Sulfamethoxazole in the Maize Plant

The detection of triclosan in maize tissues confirms the compound’s uptake from biosolid-amended soils, consistent with earlier studies [8,11]. Uptake mechanisms involve triclosan partitioning to soil particles, followed by adsorption to root lipid membranes, translocation via xylem flow, and accumulation in aboveground biomass [58].
Limited research has been conducted on the uptake of sulfamethoxazole by plants from biosolid-amended soils. Most studies have focused on sulfamethoxazole uptake from reclaimed wastewater-irrigated soils [56], soils irrigated with sulfamethoxazole-contaminated or fortified water [57], and sulfamethoxazole-spiked soils [59]. A few studies, such as that by [8], have explored sulfamethoxazole uptake from biosolid-amended soils. In their study, cabbage plants were grown in soils amended with a single application of 8 t ha−1 biosolids, and sulfamethoxazole was detected only in the roots of a single plant.
In contrast, the present study found that sulfamethoxazole concentrations in maize plants grown in biosolid-amended soils were below the limit of detection in both cropping systems. While this result differs from that of [8], their study similarly reported low sulfamethoxazole uptake, with sulfamethoxazole detected exclusively in the roots and not in the aerial parts of the plants, a finding consistent with the current study. Compared to triclosan, sulfamethoxazole exhibits much higher water solubility (approx. 61-fold; Table 2) and low sorption to soil organic matter, resulting in low retention, high mobility, and potential leaching in soils. Additionally, soil pH in biosolid-amended soils ranged from 4.8 to 6.6 (Figure 1), which is generally above the acid dissociation constants of sulfamethoxazole (pKa1 ≈ 1.6 and pKa2 ≈ 5.7; Table 2). This indicates that sulfamethoxazole predominantly exists in its anionic form, which is highly mobile in soil, poorly sorbed to organic matter, and exhibits reduced passive diffusion across root membranes, thereby limiting accumulation in plant tissues. However, since the current study assessed sulfamethoxazole levels only in the top 30 cm of the soil layer, conclusions about sulfamethoxazole leaching cannot be drawn from these results.
Even when sulfamethoxazole is present in the soil solution, plant uptake is often restricted by physiological and biochemical barriers. Sulfamethoxazole is preferentially retained in root tissues and rarely translocated to aerial parts of the plant due to limited xylem mobility and active efflux mechanisms [60]. Collectively, the findings of this study are supported by a growing body of literature indicating that sulfamethoxazole has low potential for plant uptake from biosolid-amended soils, especially in field conditions. The non-detection of sulfamethoxazole in maize tissues across both cropping systems suggests that risks of sulfamethoxazole accumulation in edible plant parts are minimal under typical agricultural practices. Nonetheless, further studies are needed to assess the long-term behavior of sulfamethoxazole and its transformation products in biosolid-amended systems, particularly under varying environmental and management conditions.

4.3.1. Triclosan Concentration in Maize Stems

Soil water availability is a critical factor influencing the mobility and bioavailability of triclosan in the rhizosphere, and hence its uptake and accumulation in aboveground plant tissues. In the present study, significantly higher triclosan concentrations were observed in maize stems under the rainfed + irrigation system compared to purely rainfed conditions. These findings are consistent with prior reports that supplemental irrigation enhances the solubility and diffusion of hydrophobic organic compounds like triclosan, facilitating their uptake by plant roots and translocation to shoots [61,62].
The stem serves as a primary conduit for the translocation of xylem-mobile compounds. Once absorbed, triclosan moves from the root to aerial parts via the transpiration stream, with stems acting as major repositories due to their role in water transport and storage. Studies by [60] demonstrated that stem tissues of several plant species, including tomato, cucumber, and lettuce, exhibited higher triclosan accumulation than leaves or fruits, particularly under irrigation or high-moisture conditions, which enhance mass flow and uptake efficiency.
The lipophilic nature of triclosan (Log Kow ≈ 4.8) facilitates its adsorption onto lipid-rich xylem parenchyma and vascular bundles, particularly in stem tissues with limited metabolic degradation capacity. Interestingly, in our study, triclosan was also detected in maize stems and leaves from inorganic fertilizer treatments under irrigation, but not under rainfed conditions. This observation can likely be explained by a combination of factors, including the irrigation water as a potential source, the ionic form of triclosan influenced by soil pH, and its sorption behavior modulated by soil organic carbon.
Under irrigation, elevated soil pH in the inorganic fertilizer treatment (Figure 1) likely shifted triclosan (pKa ≈ 7.9) toward its anionic form, which is less strongly sorbed to mineral surfaces and soil organic matter than the neutral species. This increases its concentration in soil pore water, enhancing root uptake via mass flow and transpiration [9]. In contrast, soils amended with 4 t ha−1 biosolids exhibited slightly lower pH and higher organic carbon content (Figure 1), which strongly sorbs triclosan and buffers pH effects, thereby reducing freely dissolved triclosan and its bioavailability [9]. The irrigated control lacked both the chemical mobilization induced by fertilizer salts and the enhanced plant uptake driven by greater biomass, resulting in triclosan concentrations below detection limits.
Overall, these findings highlight stems and leaves as key compartments for monitoring triclosan accumulation in biosolid-impacted cropping systems. Given that stem and leave biomass is frequently used as animal fodder, the potential for triclosan transfer into the food chain warrants careful risk evaluation and underscores the importance of considering water management practices in biosolid reuse strategies.

4.3.2. Triclosan Concentration in Maize Leaves

Triclosan accumulation in plant leaves is primarily governed by its uptake via roots, followed by translocation through the xylem under transpiration-driven bulk flow. In this study, triclosan concentrations in maize leaves increased significantly (p ≤ 0.05) under rainfed + irrigation conditions compared to purely rainfed systems, consistent with the patterns observed in stems and grains. This outcome supports previous findings that irrigation improves the bioavailability and transport of hydrophobic organic compounds like triclosan in the soil–plant system [61,62].
Triclosan mobility from roots to leaves is highly dependent on its solubility, partition coefficient (Log Kow ≈ 4.8), and affinity for plant lipid membranes. Its moderate hydrophobicity allows it to not only bind to root surfaces but also enter the xylem stream for upward transport [60]. Once in the xylem, triclosan is preferentially deposited in tissues with high transpiration rates—primarily leaves—due to evaporative water loss. However, our study found a significant decline in triclosan concentrations in maize leaves when biosolid application rates increased from 8 to 16 t ha−1 yr−1 under rainfed + irrigation conditions. This inverse relationship aligns with findings by [63], who observed reduced leaf tissue accumulation of triclosan at higher organic matter levels due to enhanced sorption and microbial degradation in the rhizosphere. Elevated organic matter not only reduces the bioavailable fraction of triclosan through strong adsorption but also enhances microbial communities capable of biodegrading pharmaceuticals and personal care products.
Collectively, these findings emphasize that both environmental conditions (e.g., irrigation and organic matter content) and plant physiological processes (e.g., transpiration rate, metabolism, and biomass accumulation) influence triclosan distribution in maize leaves. The role of irrigation is particularly critical in agroecosystems using biosolids, as it enhances solubility and upward translocation of triclosan, thereby increasing potential exposure in edible or exposed foliage.

4.3.3. Triclosan Concentration in Maize Grains

Consistent with patterns observed in maize stems and leaves, triclosan concentrations in maize grains were influenced by water availability, with significantly higher levels detected under the rainfed + irrigation system compared to the rainfed system. This trend aligns with findings by [62], who noted that supplemental irrigation enhanced triclosan bioavailability and plant uptake through increased solubility and improved mass flow dynamics. Despite this, triclosan concentrations in maize grains remained substantially lower than those in stems and leaves. This is consistent with the existing literature indicating limited translocation of triclosan into reproductive tissues due to its physicochemical properties—particularly its moderate hydrophobicity (Log Kow ≈ 4.8), which restricts systemic movement within plant vasculature.
Similarly, ref. [60] also documented significantly lower triclosan concentrations in rice grains than in leaves and stems after biosolid application, attributing this to physiological barriers such as limited phloem loading and in-plant metabolic transformation.
The observed differences in grain triclosan concentrations among biosolid treatments—particularly the lower values under the rainfed 8 t ha−1 application compared to the rainfed + irrigation 16 t ha−1 treatment—may reflect variations in transpiration-driven uptake, soil organic matter content, and in-plant metabolism. Additionally, microbial degradation in the rhizosphere and plant-specific physiological traits may further modulate triclosan translocation efficiency [60]. Notably, while the highest grain triclosan concentrations were recorded under the irrigated 16 t ha−1 biosolid treatment, they remained lower than those in vegetative tissues. Nevertheless, the detection of triclosan in maize grains, even at low levels, raises concerns about long-term dietary exposure, particularly with repeated biosolid applications. While the current levels are unlikely to pose immediate health risks, cumulative exposure and potential mixture effects with other contaminants necessitate further investigation, as emphasized by [64] in their review of pharmaceutical and personal care product dynamics in agroecosystems.

4.4. Human Health Risk Assessment

To evaluate potential human exposure to triclosan through maize consumption, estimated daily intake values were calculated using the highest recorded average triclosan concentration in maize grain from the present study (4.4 ng g−1, or 0.0044 µg g−1; Figure 2c). Following Equation (1), the resulting estimated daily intake values were 0.021 µg kg−1 day−1 for adults and 0.13 µg kg−1 day−1 for toddlers. These exposure estimates remain well below the established acceptable daily intake for triclosan, which is 83 µg kg−1 day−1 [24], indicating a low likelihood of health risks under the studied conditions.
These findings align with previous studies that have assessed triclosan accumulation in edible crops. For example, ref. [65] reported similarly low estimated daily intake values for triclosan in edible plant tissues cultivated and irrigated with reclaimed wastewater. Importantly, the current estimated daily intake values were derived from raw (uncooked) maize grains. Thermal processing, including boiling, steaming, and baking, has been shown to significantly reduce triclosan concentrations in food matrices due to thermal degradation and volatilization. Therefore, actual dietary exposure is likely to be even lower than reported, reinforcing the minimal risk profile associated with maize consumption from biosolid-amended soils.
Nevertheless, the present findings are specific to a long-term field experiment involving a single biosolid type applied to a sandy loam soil within a defined agro-ecological zone. The composition of biosolids, soil physicochemical properties, climatic conditions, and crop management practices all influence the fate, transport, and plant uptake of triclosan. Biosolids from different wastewater treatment plants may vary widely in their contaminant profiles, organic matter content, and stabilization status, all of which can affect triclosan availability for plant uptake. Similarly, soil organic carbon content and pH have been shown to significantly influence triclosan sorption and mobility. Moreover, studies have reported that repeated applications of biosolids or elevated rates of amendment may increase the cumulative load of triclosan and other personal care product residues in soils, potentially affecting long-term soil and plant health. While current biosolid regulations and guidelines aim to minimize such risks, continuous monitoring of trace organic contaminants is essential, especially in systems where food crops are cultivated for direct human consumption.
In conclusion, under the experimental conditions of this study, human exposure to triclosan through maize grain consumption appears to pose negligible health risks, with estimated daily intake values far below the acceptable daily intake. However, future studies should assess triclosan dynamics under varying biosolid types, soil conditions, and crop species, as well as consider potential cumulative effects from multi-season applications. In addition, evaluating triclosan degradation products and their toxicological profiles may further strengthen human health risk assessments.

5. Conclusions

This long-term field study (>15 years) demonstrates that the repeated application of municipal biosolids at agronomic rates significantly improves soil fertility by increasing total nitrogen and soil organic matter in the surface soil (0–30 cm) under both rainfed and rainfed + irrigation maize cropping systems. These improvements underscore the potential of biosolids to enhance crop productivity, support climate change mitigation through carbon sequestration, and promote sustainable nutrient management in resource-constrained agricultural systems. However, biosolid application was also associated with increased soil acidification and salinity. Although salinity remained within acceptable agronomic thresholds, the consistent decline in soil pH suggests that long-term biosolid use may necessitate periodic lime amendments to preserve soil health and maintain crop productivity. From an environmental and food safety perspective, sulfamethoxazole was not detected in either the soil or maize tissues across treatments, suggesting minimal risk of plant uptake or bioaccumulation under the studied conditions. In contrast, triclosan was detected in aboveground maize tissues at application rates of 8 and 16 t ha−1 yr−1, though concentrations in maize grain were low. Estimated daily intakes for both adults and toddlers remained far below the established acceptable daily intake thresholds, indicating negligible human health risk from dietary exposure. These findings support the safe use of biosolids with similar contaminant profiles at application rates ≤ 16 t ha−1 yr−1 on comparable soils and within similar agro-ecological zones. Nonetheless, this study assessed only the parent compounds of triclosan and sulfamethoxazole; transformation products, which may exhibit different environmental behavior or toxicity, were not analyzed. Future research should therefore focus on the persistence, mobility, and plant uptake potential of pharmaceutical transformation products in biosolid-amended soils, as well as their cumulative impacts on soil microbial dynamics and groundwater quality.

Supplementary Materials

The following supporting information can be downloaded at: https://www.mdpi.com/article/10.3390/su18031618/s1, Table S1: Types, chemical composition, and application rates of inorganic fertilizers used during various maize growth stages. Table S2: Multiple reaction monitoring parameters of the target analytes. Table S3: Linear equations and the correlation cofficients (R2) of the calibration curves for the target analytes.

Author Contributions

M.P.N. did the investigation, performed field and laboratory work, and wrote the original draft. E.H.T. supervised the research, organized funding, and performed the review and editing. All authors have read and agreed to the published version of the manuscript.

Funding

Funding was provided by the National Research Foundation, South Africa (NRF, project grant number 116268).

Institutional Review Board Statement

The maize cultivar used in the study was purchased from a seed company (Pannar, Johannesburg, South Africa).

Informed Consent Statement

Not applicable.

Data Availability Statement

The datasets generated and/or analyzed during the current study are available in Supplementary Materials and from the corresponding author upon reasonable request.

Acknowledgments

The authors wish to thank ERWAT for supplying biosolid and offering a piece of land. The authors wish to also thank O.J. Okonkwo, A.P. Daso, and SV Sibiya from Tshwane University of Technology, South Africa, for the laboratory assistance.

Conflicts of Interest

The authors declare no conflict of interest.

References

  1. Reid, C.J.; Farrell, M.; Kirby, J.K. Microbial communities in biosolids-amended soils: A critical review of high-throughput sequencing approaches. J. Environ. Manag. 2025, 375, 124203. [Google Scholar] [CrossRef]
  2. Ahmed, F.; Shakeel, A.; Ahmad, S.; Kaur, N. Exploring the Linkages Between Land Degradation and Food Insecurity. Asia-Pac. J. Rural Dev. 2025, 35, 71–90. [Google Scholar] [CrossRef]
  3. Tesfamariam, E.H.; Ogbazghi, Z.M.; Annandale, J.G.; Gebrehiwot, Y. Cost–benefit analysis of municipal sludge as a low-grade nutrient source: A case study from South Africa. Sustainability 2020, 12, 9950. [Google Scholar] [CrossRef]
  4. Li, Z.; Yuan, D. Global performance and trends of research on emerging contaminants in sewage sludge: A Bibliometric Analysis from 1990 to 2023. Ecotoxicol. Environ. Saf. 2024, 281, 116597. [Google Scholar] [CrossRef]
  5. Ngoetjana, M.P.; Tesfamariam, E.H.; Brown, S.; Wooding, M. Occurrence, distribution, and risk assessment of selected pharmaceuticals in municipal biosolids from the four wastewater treatment plants in Gauteng Province, South Africa. Sci. Rep. 2025, 15, 45232. [Google Scholar] [CrossRef]
  6. Guerra, P.; Teslic, S.; Shah, A.; Albert, A.; Gewurtz, S.B.; Smyth, S.A. Occurrence and removal of triclosan in Canadian wastewater systems. Environ. Sci. Pollut. Res. 2019, 26, 31873–31886. [Google Scholar] [CrossRef] [PubMed]
  7. He, Y.; Liu, L.; Wang, Q.; Dong, X.; Huang, J.; Jia, X.; Peng, X. Bio-degraded of sulfamethoxazole by microbial consortia without addition nutrients: Mineralization, nitrogen removal, and proteomic characterization. J. Hazard. Mater. 2024, 466, 133558. [Google Scholar] [CrossRef]
  8. Holling, C.S.; Bailey, J.L.; Vanden Heuvel, B.; Kinney, C.A. Uptake of human pharmaceuticals and personal care products by cabbage (Brassica campestris) from fortified and biosolids-amended soils. J. Environ. Monit. 2012, 14, 3029–3036. [Google Scholar] [CrossRef] [PubMed]
  9. Fu, Q.; Wu, X.; Ye, Q.; Ernst, F.; Gan, J. Biosolids inhibit bioavailability and plant uptake of triclosan and triclocarban. Water Res. 2016, 102, 117–124. [Google Scholar] [CrossRef] [PubMed]
  10. Franklin, A.M.; Williams, C.F.; Andrews, D.M.; Woodward, E.E.; Watson, J.E. Uptake of three antibiotics and an antiepileptic drug by wheat crops spray irrigated with wastewater treatment plant effluent. J. Environ. Qual. 2016, 45, 546–554. [Google Scholar] [CrossRef]
  11. Sabourin, L.; Duenk, P.; Bonte-Gelok, S.; Payne, M.; Lapen, D.R.; Topp, E. Uptake of pharmaceuticals, hormones and parabens into vegetables grown in soil fertilized with municipal biosolids. Sci. Total Environ. 2012, 431, 233–236. [Google Scholar] [CrossRef]
  12. Butler, E.; Whelan, M.J.; Sakrabani, R.; Van Egmond, R. Fate of triclosan in field soils receiving sewage sludge. Environ. Pollut. 2012, 167, 101–109. [Google Scholar] [CrossRef]
  13. Edwards, M.; Topp, E.; Metcalfe, C.D.; Li, H.; Gottschall, N.; Bolton, P.; Curnoe, W.; Payne, M.; Beck, A.; Kleywegt, S.; et al. Pharmaceutical and personal care products in tile drainage following surface spreading and injection of dewatered municipal biosolids to an agricultural field. Sci. Total Environ. 2009, 407, 4220–4230. [Google Scholar] [CrossRef]
  14. Gottschall, N.; Topp, E.; Metcalfe, C.; Edwards, M.; Payne, M.; Kleywegt, S.; Russell, P.; Lapen, D.R. Pharmaceutical and personal care products in groundwater, subsurface drainage, soil, and wheat grain, following a high single application of municipal biosolids to a field. Chemosphere 2012, 87, 194–203. [Google Scholar] [CrossRef]
  15. Lozano, N.; Rice, C.P.; Ramirez, M.; Torrents, A. Fate of triclosan and methyltriclosan in soil from biosolids application. Environ. Pollut. 2012, 160, 103–108. [Google Scholar] [CrossRef]
  16. Xia, K.; Hundal, L.S.; Kumar, K.; Armbrust, K.; Cox, A.E.; Granato, T.C. Triclocarban, triclosan, polybrominated diphenyl ethers, and 4-nonylphenol in biosolids and in soil receiving 33-year biosolids application. Environ. Toxicol. Chem. 2010, 29, 597–605. [Google Scholar] [CrossRef] [PubMed]
  17. Snyman, H.G.; Herselman, J.E. Guideline for Utilization and Disposal of Wastewater Sludge. Volume 2: Requirements for the Agricultural Use of Wastewater Sludge; Water Research Commission: Pretoria, South Africa, 2006; WRC rep. TT 262/06. [Google Scholar]
  18. Ogbazghi, Z.M.; Tesfamariam, E.H.; Annandale, J.G.; De Jager, P.C. Mobility and Uptake of Zinc, Cadmium, Nickel, and Lead in Sludge-Amended Soils Planted to dryland Maize and Irrigated Maize–Oat Rotation. J. Environ. Qual. 2015, 44, 655–667. [Google Scholar] [CrossRef] [PubMed][Green Version]
  19. McLean, E. Soil pH and lime requirement. In Methods of Soil Analysis: Part 2 Chemical and Microbiological Properties; ASA: Monroe, MI, USA, 1982; Volume 9, pp. 199–224. [Google Scholar]
  20. Verardo, D.J.; Froelich, P.N.; McIntyre, A. Determination of organic carbon and nitrogen in marine sediments using the Carlo Erba NA-1500 Analyzer. Deep Sea Res. Part A Oceanogr. Res. Pap. 1990, 37, 157–165. [Google Scholar] [CrossRef]
  21. Walkley, A.; Black, I. An examination of the Degtjareff method for determining soil organic matter, and a proposed modification of the chromic acid titration method. Soil Sci. 1934, 37, 29–38. [Google Scholar] [CrossRef]
  22. Pannu, M.W.; Toor, G.S.; O’Connor, G.A.; Wilson, P.C. Toxicity and bioaccumulation of biosolids-borne triclosan in food crops. Environ. Toxicol. Chem. 2012, 31, 2130–2137. [Google Scholar] [CrossRef]
  23. Wooding, M. Identification of Micropollutants by Combined Chromatography and Mass Spectrometry Techniques. Master’s Thesis, University of Pretoria, Pretoria, South Africa, 2017. [Google Scholar]
  24. Prosser, R.S.; Sibley, P.K. Human health risk assessment of pharmaceuticals and personal care products in plant tissue due to biosolids and manure amendments, and wastewater irrigation. Environ. Int. 2015, 75, 223–233. [Google Scholar] [CrossRef]
  25. Kornher, L. Maize Markets in Eastern and Southern Africa (ESA) in the Context of Climate Change. Background Paper for the State of Agricultural Commodity Markets; Food and Agricultural Organization: Rome, Italy, 2018. [Google Scholar]
  26. Abafe, O.A.; Martincigh, B.S. Determination and human exposure assessment of polybrominated diphenyl ethers and tetrabromobisphenol A in indoor dust in South Africa. Environ. Sci. Pollut. Res. 2016, 23, 7038–7049. [Google Scholar] [CrossRef]
  27. Buchanan, C.M.; Ippolito, J.A. Long-term biosolids applications to overgrazed rangelands improve soil health. Agronomy 2021, 11, 1339. [Google Scholar] [CrossRef]
  28. Gutiérrez-Ginés, M.J.; Lehto, N.J.; Madejón, E.; Robinson, B.H. The effect of contrasting biosolids application strategies on soil quality. Plant Soil 2023, 489, 423–438. [Google Scholar] [CrossRef]
  29. Medina-Herrera, M.d.R.; Negrete-Rodríguez, M.d.l.L.X.; Prieto-Rojas, M.A.; Bedolla-Rivera, H.I.; Barajas, E.C. Short-term amendment of biosolid on agricultural soil: Effects on C and N mineralization and microbial activity. Acta Univ. 2022, 32, 1–16. [Google Scholar] [CrossRef]
  30. Yang, G.; Liu, S.; Yan, K.; Tian, L.; Li, P.; Li, X.; He, X. Effect of drip irrigation with brackish water on the soil chemical properties for a typical desert plant (Haloxylon ammodendron) in the Manas River Basin. Irrig. Drain. 2020, 69, 460–471. [Google Scholar] [CrossRef]
  31. Tesfamariam, E.H. Sustainable Use of Sewage Sludge as a Source of Nitrogen and Phosphorus in Cropping Systems. Ph.D. Thesis, University of Pretoria, Pretoria, South Africa, 2010. [Google Scholar]
  32. Guo, Q.; Huang, G.; Guo, Y.; Zhang, M.; Zhou, Y.; Duan, L. Optimizing irrigation and planting density of spring maize under mulch drip irrigation system in the arid region of Northwest China. Field Crops Res. 2021, 266, 108141. [Google Scholar] [CrossRef]
  33. Xu, J.M.; Tang, C.; Chen, Z.L. The role of plant residues in pH change of acid soils differing in initial pH. Soil Biol. Biochem. 2006, 38, 709–719. [Google Scholar] [CrossRef]
  34. Qaswar, M.; Yiren, L.; Jing, H.; Kaillou, L.; Mudasir, M.; Zhenzhen, L.; Hongqian, H.; Xianjin, L.; Jianhua, J.; Ahmed, W.; et al. Soil nutrients and heavy metal availability under long-term combined application of swine manure and synthetic fertilizers in acidic paddy soil. J. Soils Sediments 2020, 20, 2093–2106. [Google Scholar] [CrossRef]
  35. Qin, S.; Liu, H.; Nie, Z.; Gao, W.; Li, C.; Zhao, P. Toxicity of cadmium and its competition with mineral nutrients for uptake by plants: A review. Pedosphere 2020, 30, 168–180. [Google Scholar] [CrossRef]
  36. Neina, D. The role of soil pH in plant nutrition and soil remediation. Appl. Environ. Soil Sci. 2019, 2019, 5794869. [Google Scholar] [CrossRef]
  37. Boudjabi, S.; Chenchouni, H. On the sustainability of land applications of sewage sludge: How to apply the sewage biosolid in order to improve soil fertility and increase crop yield? Chemosphere 2021, 282, 131122. [Google Scholar] [CrossRef]
  38. Tian, F.; Hou, M.; Qiu, Y.; Zhang, T.; Yuan, Y. Salinity stress effects on transpiration and plant growth under different salinity soil levels based on thermal infrared remote (TIR) technique. Geoderma 2020, 357, 113961. [Google Scholar] [CrossRef]
  39. Arif, Y.; Singh, P.; Siddiqui, H.; Bajguz, A.; Hayat, S. Salinity induced physiological and biochemical changes in plants: An omic approach towards salt stress tolerance. Plant Physiol. Biochem. 2020, 156, 64–77. [Google Scholar] [CrossRef]
  40. Yang, C.; Wang, X.; Miao, F.; Li, Z.; Tang, W.; Sun, J. Assessing the effect of soil salinization on soil microbial respiration and diversities under incubation conditions. Appl. Soil Ecol. 2020, 155, 103671. [Google Scholar] [CrossRef]
  41. Zhao, S.; Liu, J.; Banerjee, S.; Zhou, N.; Zhao, Z.; Zhang, K.; Hu, M.; Tian, C. Biogeographical distribution of bacterial communities in saline agricultural soil. Geoderma 2020, 361, 114095. [Google Scholar] [CrossRef]
  42. Almagro, M.; Ruiz-Navarro, A.; Díaz-Pereira, E.; Albaladejo, J.; Martínez-Mena, M. Plant residue chemical quality modulates the soil microbial response related to decomposition and soil organic carbon and nitrogen stabilization in a rainfed Mediterranean agroecosystem. Soil Biol. Biochem. 2021, 156, 108198. [Google Scholar] [CrossRef]
  43. Ata-Ul-Karim, S.T.; Cang, L.; Wang, Y.; Zhou, D. Interactions between nitrogen application and soil properties and their impacts on the transfer of cadmium from soil to wheat (Triticum aestivum L.) grain. Geoderma 2020, 357, 113923. [Google Scholar] [CrossRef]
  44. Mu, X.; Chen, Y. The physiological response of photosynthesis to nitrogen deficiency. Plant Physiol. Biochem. 2021, 158, 76–82. [Google Scholar] [CrossRef]
  45. Ogbenna, C.V.; Tesfamariam, E.H. Maize yield response to nitrate leaching at early growth stage under crop and site-specific biosolid application. Clean. Eng. Technol. 2023, 17, 100680. [Google Scholar] [CrossRef]
  46. Lin, Z.; Price, G.W.; Liang, C.; Burton, D.L.; Lynch, D.H. Effects on soil carbon storage from municipal biosolids application to agricultural fields. J. Environ. Manag. 2024, 361, 121249. [Google Scholar] [CrossRef]
  47. Villa, Y.B.; Phosalath, E.; Ryals, R. Carbon persistence of soils with long-term biosolids amendments in California agroecosystems. Soil Sci. Soc. Am. J. 2024, 88, 354–370. [Google Scholar] [CrossRef]
  48. Eid, E.M.; Hussain, A.A.; Taher, M.A.; Galal, T.M.; Shaltout, K.H.; Sewelam, N. Sewage sludge application enhances the growth of Corchorus olitorius plants and provides a sustainable practice for nutrient recirculation in agricultural soils. J. Soil Sci. Plant Nutr. 2020, 20, 149–159. [Google Scholar] [CrossRef]
  49. Tian, G.; Oladeji, O.; Morgan, B.; El-Naggar, E.; Cox, A.; Zhang, H.; Podczerwinski, E. Intracellular carbon storage of microorganisms and resulting C sequestration in biosolids-amended agricultural soil. Soil Biol. Biochem. 2025, 207, 109836. [Google Scholar] [CrossRef]
  50. Aryal, N.; Reinhold, D.M. Phytoaccumulation of antimicrobials from biosolids: Impacts on environmental fate and relevance to human exposure. Water Res. 2011, 45, 5545–5552. [Google Scholar] [CrossRef]
  51. Cha, J.; Cupples, A.M. Detection of the antimicrobials triclocarban and triclosan in agricultural soils following land application of municipal biosolids. Water Res. 2009, 43, 2522–2530. [Google Scholar] [CrossRef]
  52. Chen, F.; Ying, G.G.; Ma, Y.B.; Chen, Z.F.; Lai, H.J.; Peng, F.J. Field dissipation and risk assessment of typical personal care products TCC, TCS, AHTN and HHCB in biosolid-amended soils. Sci. Total Environ. 2014, 470, 1078–1086. [Google Scholar] [CrossRef]
  53. Lozano, N.; Rice, C.P.; Ramirez, M.; Torrents, A. Fate of triclosan in agricultural soils after biosolid applications. Chemosphere 2010, 78, 760–766. [Google Scholar] [CrossRef]
  54. Macherius, A.; Lapen, D.R.; Reemtsma, T.; Römbke, J.; Topp, E.; Coors, A. Triclocarban, triclosan and its transformation product methyl triclosan in native earthworm species four years after a commercial-scale biosolids application. Sci. Total Environ. 2014, 472, 235–238. [Google Scholar] [CrossRef]
  55. Chen, S.; Chee-Sanford, J.C.; Yang, W.H.; Sanford, R.A.; Chen, J.; Yan, X.; Shan, J. Effects of triclosan and triclocarban on denitrification and N2O emissions in paddy soil. Sci. Total Environ. 2019, 695, 133782. [Google Scholar] [CrossRef]
  56. Camacho-Arévalo, R.; García-Delgado, C.; Mayans, B.; Antón-Herrero, R.; Cuevas, J.; Segura, M.L.; Eymar, E. Sulfonamides in tomato from commercial greenhouses irrigated with reclaimed wastewater: Uptake, translocation and food safety. Agronomy 2021, 11, 1016. [Google Scholar] [CrossRef]
  57. Kodešová, R.; Klement, A.; Golovko, O.; Fér, M.; Nikodem, A.; Kočárek, M.; Grabic, R. Root uptake of atenolol, sulfamethoxazole and carbamazepine, and their transformation in three soils and four plants. Environ. Sci. Pollut. Res. 2019, 26, 9876–9891. [Google Scholar] [CrossRef]
  58. Wu, X.; Dodgen, L.K.; Conkle, J.L.; Gan, J. Plant uptake of pharmaceutical and personal care products from recycled water and biosolids: A review. Sci. Total Environ. 2015, 536, 655–666. [Google Scholar] [CrossRef]
  59. Demoling, L.A.; Bååth, E.; Greve, G.; Wouterse, M.; Schmitt, H. Effects of sulfamethoxazole on soil microbial communities after adding substrate. Soil Biol. Biochem. 2009, 41, 840–848. [Google Scholar] [CrossRef]
  60. Wu, X.; Ernst, F.; Conkle, J.L.; Gan, J. Comparative uptake and translocation of pharmaceutical and personal care products (PPCPs) by common vegetables. Environ. Int. 2013, 60, 15–22. [Google Scholar] [CrossRef]
  61. Kinney, C.A.; Vanden Heuvel, B. Translocation of pharmaceuticals and personal care products after land application of biosolids. Curr. Opin. Environ. Sci. Health 2020, 14, 23–30. [Google Scholar] [CrossRef]
  62. Li, Y.; Sallach, J.B.; Zhang, W.; Boyd, S.A.; Li, H. Insight into the distribution of pharmaceuticals in soil-water-plant systems. Water Res. 2019, 152, 38–46. [Google Scholar] [CrossRef]
  63. Jachero, L.; Ahumada, I.; Fuentes, E.; Richter, P. New biomimetic approach to determine the bioavailability of triclosan in soils and its validation with the wheat plant uptake bioassay. Chemosphere 2015, 119, 1062–1067. [Google Scholar] [CrossRef]
  64. Verlicchi, P.; Zambello, E. Pharmaceuticals and personal care products in untreated and treated sewage sludge: Occurrence and environmental risk in the case of application on soil—A critical review. Sci. Total Environ. 2015, 538, 750–767. [Google Scholar] [CrossRef]
  65. Liu, X.; Liang, C.; Liu, X.; Zhao, F.; Han, C. Occurrence and human health risk assessment of pharmaceuticals and personal care products in real agricultural systems with long-term reclaimed wastewater irrigation in Beijing, China. Ecotoxicol. Environ. Saf. 2020, 190, 110022. [Google Scholar] [CrossRef]
Figure 1. Effects of biosolid application rates and cropping systems on (a) soil pH, (b) electrical conductivity, (c) total soil nitrogen, and (d) soil organic carbon in the upper 30 cm of soil. Bars sharing similar lowercase letters indicate not significantly different at p ≤ 0.05. Error bars indicate standard deviations. Data represent the mean of 4 replicates.
Sustainability 18 01618 g001
Figure 2. Accumulation of triclosan in maize stem (a), leaves (b), and grain (c), as influenced by cropping system and biosolid application rate. Bars sharing similar lowercase letters indicate not significantly different at p ≤ 0.05. Error bars indicate standard deviations. Data represent the mean of 4 replicates. n.d. means “not detected”.
Sustainability 18 01618 g002
Table 1. Average concentrations of biosolid chemical characteristics applied throughout the 15-year investigation.
Element/ContaminantUnitsAverage ± Standard Deviation
Total nitrogen[%]2.5 ± 0.5
Total carbon[%]20.2 ± 2.1
NO3_N[mg kg−1]87.9 ± 72.2
NH4_N[mg kg−1]3751.5 ± 1785.2
K[mg kg−1]1446.1 ± 942.2
Mg[mg kg−1]2788.4 ± 1719.5
Ca[mg kg−1]21,584.9 ± 7182.7
pH (H2O) 6.1 ± 0.9
EC[mS m−1]1590 ± 670
Zn[mg kg−1]2478.8 ± 2206.6
As[mg kg−1]6.2 ± 5.5
Ni[mg kg−1]83.0 ± 63.9
Cd[mg kg−1]8.2 ± 8.1
Cu[mg kg−1]349.3 ± 270.4
Pb[mg kg−1]55.4 ± 35.7
Cr[mg kg−1]239.2 ± 197.4
Hg[mg kg−1]0.8 ± 0.7
Triclosan[ng g−1]13.7 ± 7.8
Sulfamethoxazole[ng g−1]58.1 ± 41.3
Table 2. Physicochemical properties of the target analytes.
AnalytesMolecular Weight [g mol−1]Water Solubility [mg L−1]Log Kow apKa b
Triclosan289.54104.87.9
Sulfamethoxazole253.286100.891.6; 5.7
a Octanol–water partitioning coefficient. b Acid-dissociation constant.
Table 3. Analysis of variance summary for soil pH, electrical conductivity, total nitrogen, and organic carbon.
Source of VariationDFSSMSF-ValuePr > F
Soil pH
Biosolid treatments411.2302.807544.32<0.0001
Cropping systems12.65232.652341.87<0.0001
Biosolid treatment × cropping system40.64620.16162.550.0596
Soil electrical conductivity
Biosolid treatments4303,028.475,757.111.39<0.0001
Cropping systems17884.97884.91.190.2849
Biosolid treatment × cropping system4105,005.726,251.43.950.0109
Soil total nitrogen
Biosolid treatments40.03010.007532.47<0.0001
Cropping systems10.00320.003213.990.0008
Biosolid treatment × cropping system40.00070.00020.760.5591
Soil organic carbon
Biosolid treatments40.03010.007532.47<0.0001
Cropping systems10.00320.003213.990.0008
Biosolid treatment × cropping system40.00070.00020.760.5591
DF, degrees of freedom; SS, sum of squares; and MS mean of squares.
Table 4. Analysis of variance summary for triclosan concentrations in maize stems, leaves, and grains.
Source of VariationDFSSMSFPr > F
Leaves
Biosolid treatment224.1512.0826.04<0.0001
Cropping system127.7527.7559.85<0.0001
Biosolid treatment × cropping system12.142.144.610.0485
Stems
Biosolid treatment234.44172,183.5234.970.0798
Cropping system153.36533,613.709.320.0081
Biosolid treatment × cropping system17.797.792.080.2617
Grains
Biosolid treatment10.390.390.940.3524
Cropping system12.022.024.810.0487
Biosolid treatment × cropping system10.00.00.00.9815
DF, degrees of freedom; SS, sum of squares; and MS, mean of squares.
Disclaimer/Publisher’s Note: The statements, opinions and data contained in all publications are solely those of the individual author(s) and contributor(s) and not of MDPI and/or the editor(s). MDPI and/or the editor(s) disclaim responsibility for any injury to people or property resulting from any ideas, methods, instructions or products referred to in the content.