2. Digital Twin and Heritage Buildings
Historical buildings are not only physical structures but cultural signifiers that embody the identity, memory, and evolution of societies. Their preservation is therefore essential for the continuity of heritage, identity, and education. Traditional conservation strategies, often reactive and based on periodic visual inspections or time-consuming instrumental measurements, are increasingly regarded as limited for the dynamic and complex challenges of heritage building maintenance [
1]. In response to these limitations, the field has seen a paradigm shift towards preventive and predictive conservation approaches supported by emerging digital technologies and artificial intelligence.
Among these technologies, the concept of the Digital Twin (DT) stands out as particularly promising. A DT is a dynamic, real-time digital replica of a physical object or system, connected through sensors and enriched with analytical capabilities [
5]. In the context of heritage buildings, DTs enable comprehensive monitoring and simulation of physical and environmental parameters such as temperature, humidity, and air quality that significantly influence material degradation [
2]. When combined with artificial intelligence and machine learning, DTs can predict degradation trends and optimise conservation strategies in real time [
3]. However, the literature indicates that the application of DTs in heritage contexts remains limited and underdeveloped [
4].
This section explores the current landscape of DT applications in heritage building conservation, particularly focusing on model-based approaches. It identifies the challenges, limitations, and promising directions for the use of DTs in predictive conservation and indoor climate optimisation.
A systematic review done by Hou et al. [
6] reveals that only 15% of DT-related studies applied to buildings focus specifically on heritage conservation, highlighting the early stage of adoption in this domain. The review emphasises a growing interest in leveraging IoT sensor networks, weather station data, and building management systems to enable real-time performance monitoring and simulation. These technologies are crucial for maintaining critical indoor parameters such as temperature and humidity within acceptable ranges that prevent decay and material fatigue.
Importantly, Hou et al. [
6] distinguish between model-based and data-driven DT approaches. Model-based DTs are particularly relevant for conservation purposes, as they integrate 3D models such as HBIM (Historic Building Information Modelling) with simulation engines and sensor data. However, in most cases, 3D models are treated as peripheral assets used only during the design or documentation phase. As noted by Grieves [
5], the data flow in many implementations is unidirectional, moving from the physical environment to the digital model without full feedback loops or adaptive control.
Several studies exemplify the current applications of model-based DTs in heritage settings. Massafra, Predari and Gulli [
7], for instance, created an HBIM of a modern heritage building and used it to simulate energy demand under various preventive conservation strategies. Although effective in estimating long-term outcomes, their workflow lacked bi-directional data integration, thereby limiting the model’s ability to provide continuous feedback or adaptive recommendations.
Cheng et al. [
8] advanced the field by combining HBIM with Computational Fluid Dynamics (CFD) simulations and real-time sensor data. Their model assessed the effects of various heating systems and configurations on structural deformation. This integration allowed for millimetre-level predictions of movement due to thermal expansion, a key concern in fragile heritage structures. Similar techniques were adopted by Zhang et al. [
9], who used CFD-based DTs to optimise ventilation systems in underground heritage sites. Their approach significantly improved control over relative humidity (RH), a known driver of fungal growth and material decay.
In another example, Zhang, Kwok and Cheng [
10] developed a DT to evaluate the impact of corrosive gases particularly sulphur dioxide (SO
2) on façade degradation. Their simulation predicted the effectiveness of an air curtain wall, which was found to reduce SO
2 concentration by 34%, demonstrating the potential of DTs to inform tangible, actionable conservation measures.
Beyond environmental control, Hosamo et al. [
11] illustrated the utility of DTs for predictive maintenance in heritage buildings. Using a combination of BIM models and real-time data from sensors monitoring temperature, airflow, and pressure, the researchers developed a fault detection framework for HVAC systems. The system not only identified operational anomalies but also proposed maintenance actions, demonstrating the potential of DTs to reduce costs and prolong equipment life in conservation-sensitive contexts.
The integration of machine learning (ML) into Digital Twin (DT) frameworks adds significant value by enabling predictive capabilities, allowing virtual models not only to visualise current conditions but also to anticipate risks before they materialise. DTs enriched with predictive algorithms can forecast temperature spikes or humidity fluctuations that may damage artworks, wooden structures, or delicate architectural finishes. These insights support the transition from reactive interventions to anticipatory maintenance, a core principle of contemporary conservation philosophies.
Although the existing literature demonstrates some convergence between DT technologies and machine learning in building operations, their application in heritage contexts remains comparatively sparse. Hermon et al. [
3] argue that this gap stems from the absence of standardised frameworks and the challenges associated with modelling the complex geometries, heterogeneous materials, and dynamic behaviours characteristic of historical structures. Furthermore, Vuoto, Funari and Lourenço [
4] highlight how institutional resistance and fragmented digital workflows continue to impede the widespread adoption of these approaches. Nonetheless, emerging case studies such as ongoing work at Nottingham Cathedral demonstrate the growing potential of integrating DTs with machine learning models to forecast indoor climate conditions and evaluate the reliability of different predictive algorithms. Such projects suggest a pathway towards holistic, cost-effective, and minimally invasive conservation strategies grounded in real-time data and predictive insight.
Despite this promise, several obstacles remain. The initial cost and specialised expertise required to develop and maintain comprehensive DT systems can be prohibitive for smaller heritage institutions. Additionally, the dynamic and often unstable indoor environments typical of older buildings complicate real-time simulation, necessitating extensive calibration and validation protocols [
2]. Another persistent limitation is the lack of feedback integration, where predictive outputs are not automatically communicated back to building management systems, reducing the responsiveness and overall utility of the DT framework.
Within this evolving landscape, the convergence of DT technologies and ML offers a transformative pathway for preventive conservation. Although still in its formative stages within the heritage sector, current research reflects a growing recognition of the potential for real-time monitoring, predictive modelling, and multi-parameter optimisation to reshape conservation practices. Through model-based DTs, researchers are beginning to redefine how historic environments are monitored and safeguarded, demonstrating that virtual representations enriched with sensor data and predictive intelligence can effectively inform preservation strategies.
Central to this transformation is the application of ML for predictive modelling, which enables a shift from reactive responses to environmental deterioration towards anticipatory, data-driven management strategies. While the integration of ML within fully operational DT frameworks for heritage buildings remains emergent, a growing body of research highlights the potential of advanced algorithms to address the complexities inherent in historic environments. Long Short-Term Memory (LSTM) networks, designed to capture temporal dependencies in environmental sensor data, have demonstrated strong performance in forecasting indoor temperatures and thermal demand in both public and heritage-related buildings [
12]. Similarly, Artificial Neural Networks trained via backpropagation (BPNNs) have been successfully applied to model indoor temperature and relative humidity, reinforcing their suitability for microclimate prediction in sensitive contexts [
13]. For environments characterised by pronounced non-linearity, material heterogeneity, and uncertain boundary conditions typical of historic fabric, Adaptive Neuro-Fuzzy Inference Systems (ANFIS) offer a flexible and interpretable framework and have achieved high predictive accuracy in estimating heating and cooling loads across diverse building typologies [
14]. Complementing these, Nonlinear Autoregressive Exogenous (NARX) neural networks provide a dynamic recurrent architecture capable of capturing feedback-driven thermal behaviour and have been widely validated for short-term load forecasting in complex-built environments [
15]. Despite these advances, comparative evaluations of such models within heritage-specific digital workflows remain limited. Addressing this gap, our study systematically evaluates LSTM, BPNN, ANFIS, and NARX algorithms within an integrated HBIM and real-time sensor environment, enabling a robust appraisal of their reliability for forecasting indoor environmental conditions and informing the conservation strategy for a Grade II-listed cathedral.
To fully realise this potential, further work is required to bridge the gap between digital and physical systems, enhance bi-directional data flows, and embed predictive analytics into routine conservation workflows. Addressing the broader research gap will require the development of fully integrated, bidirectional DT systems capable not only of monitoring but also actively regulating internal environmental conditions in heritage structures. This includes overcoming technical challenges related to data standardisation, sensor calibration, system interoperability, and the replication of DT models across diverse and complex historic typologies. Equally essential is greater interdisciplinary collaboration among heritage professionals, environmental scientists, and digital engineers to ensure that technological interventions are both technically robust and conservation appropriate.
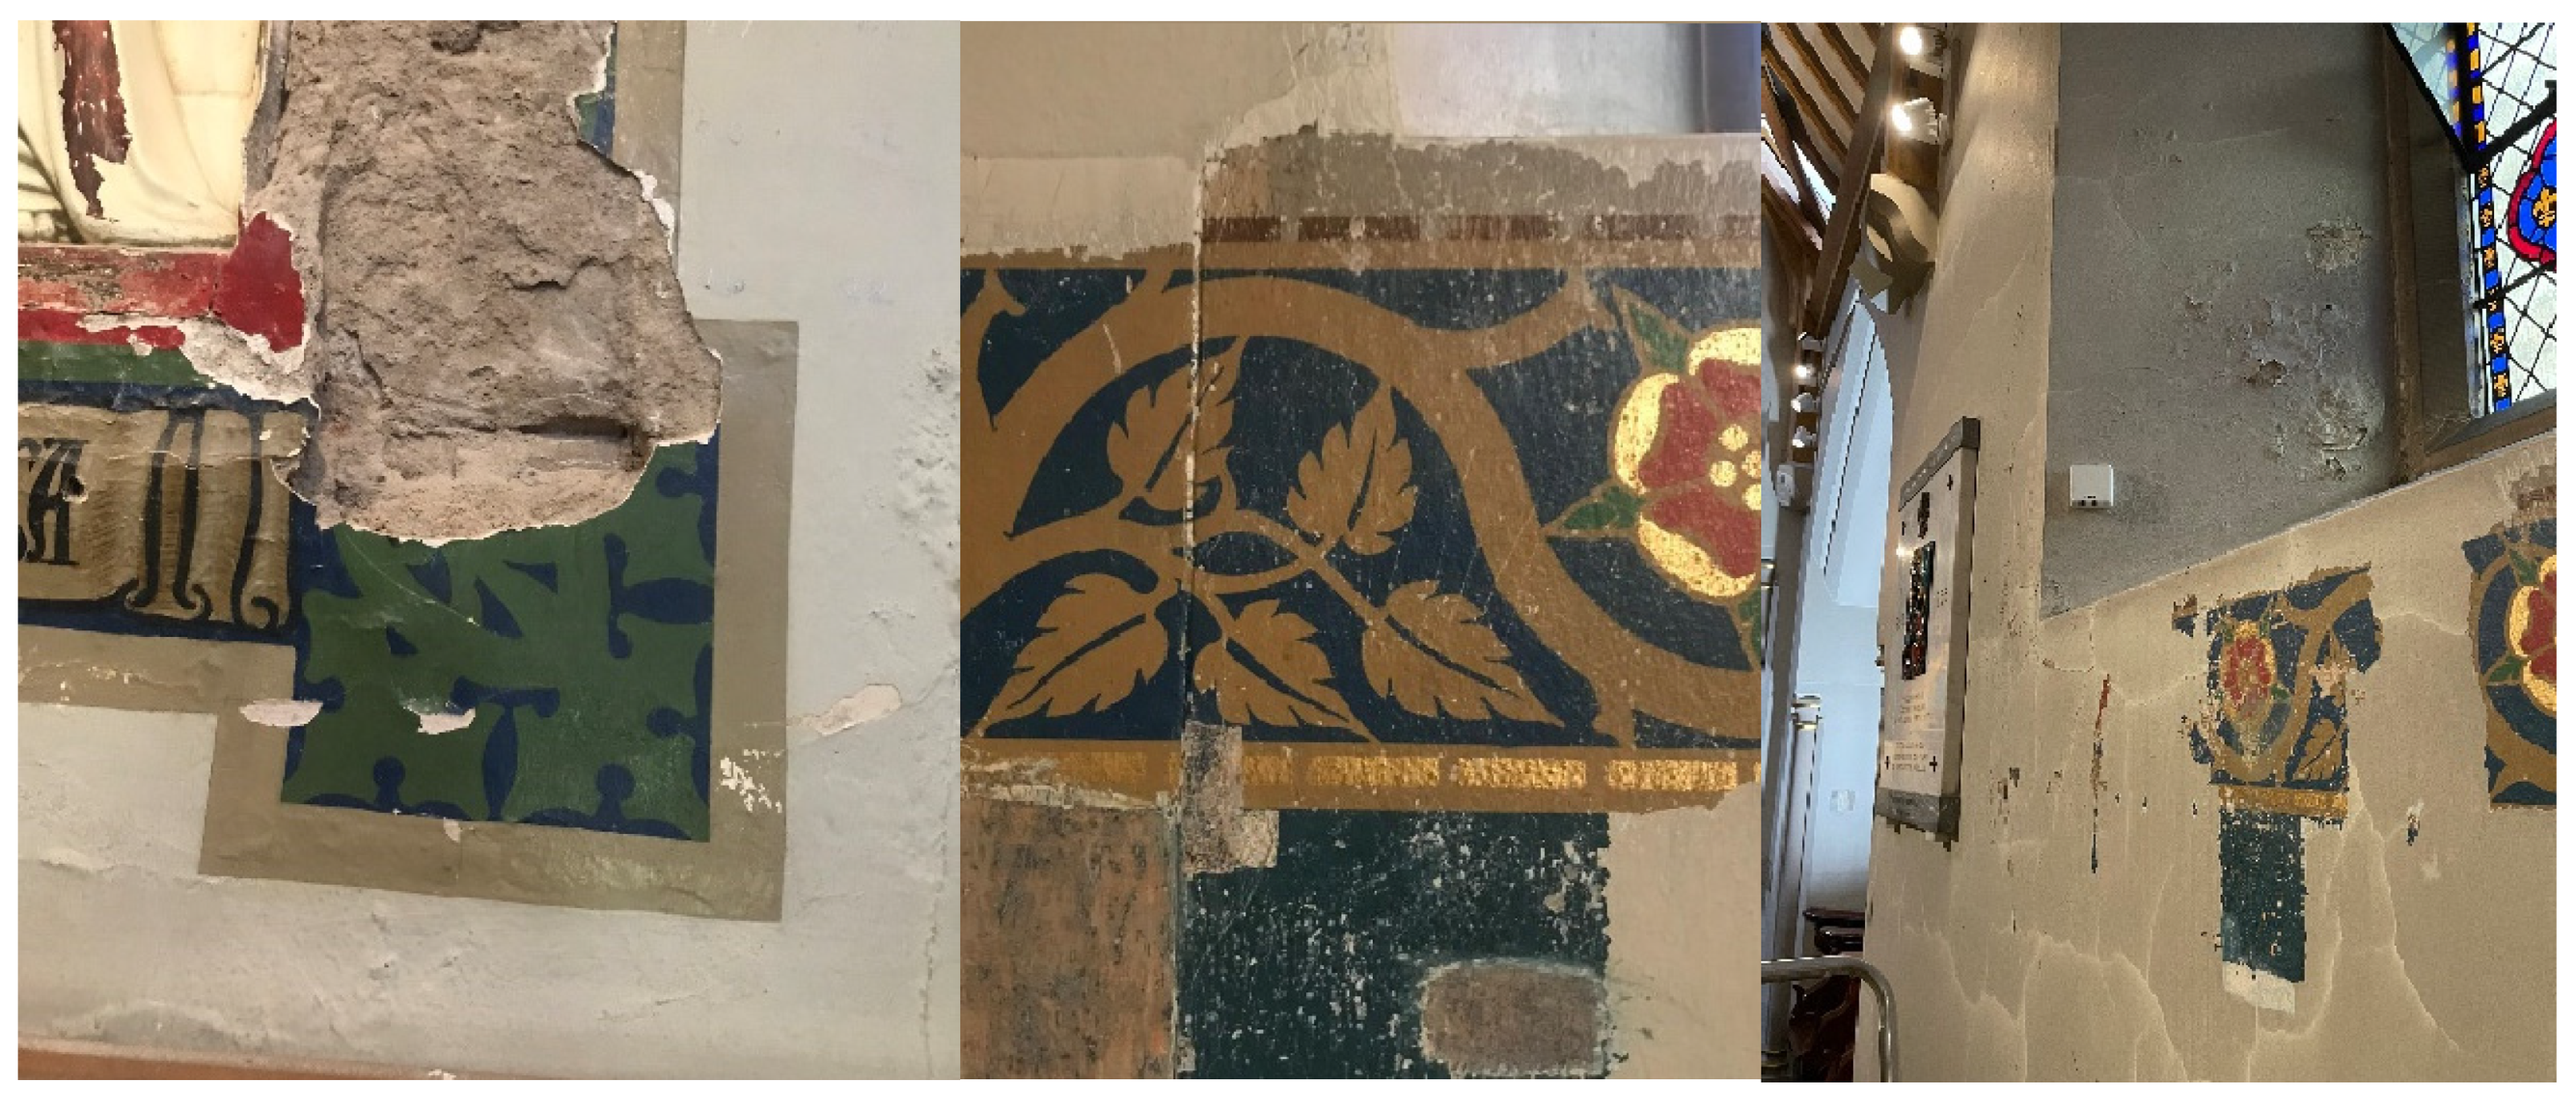
In the context of the Pugin painting at Nottingham Cathedral, this project aims to develop and validate a predictive Digital Twin model integrated with machine learning algorithms to forecast and control key indoor environmental parameters such as temperature and relative humidity, factors known to have contributed to recent deterioration of Pugin’s artwork due to unstable internal conditions. The goal is not only to support the immediate restoration effort but also to inform the future implementation of a sustainable environmental control strategy that ensures the long-term protection of both the painting and the cathedral’s broader heritage fabric. By doing so, the project seeks to serve as a model for future preventive conservation initiatives in similarly vulnerable heritage environments.
3. Methodology
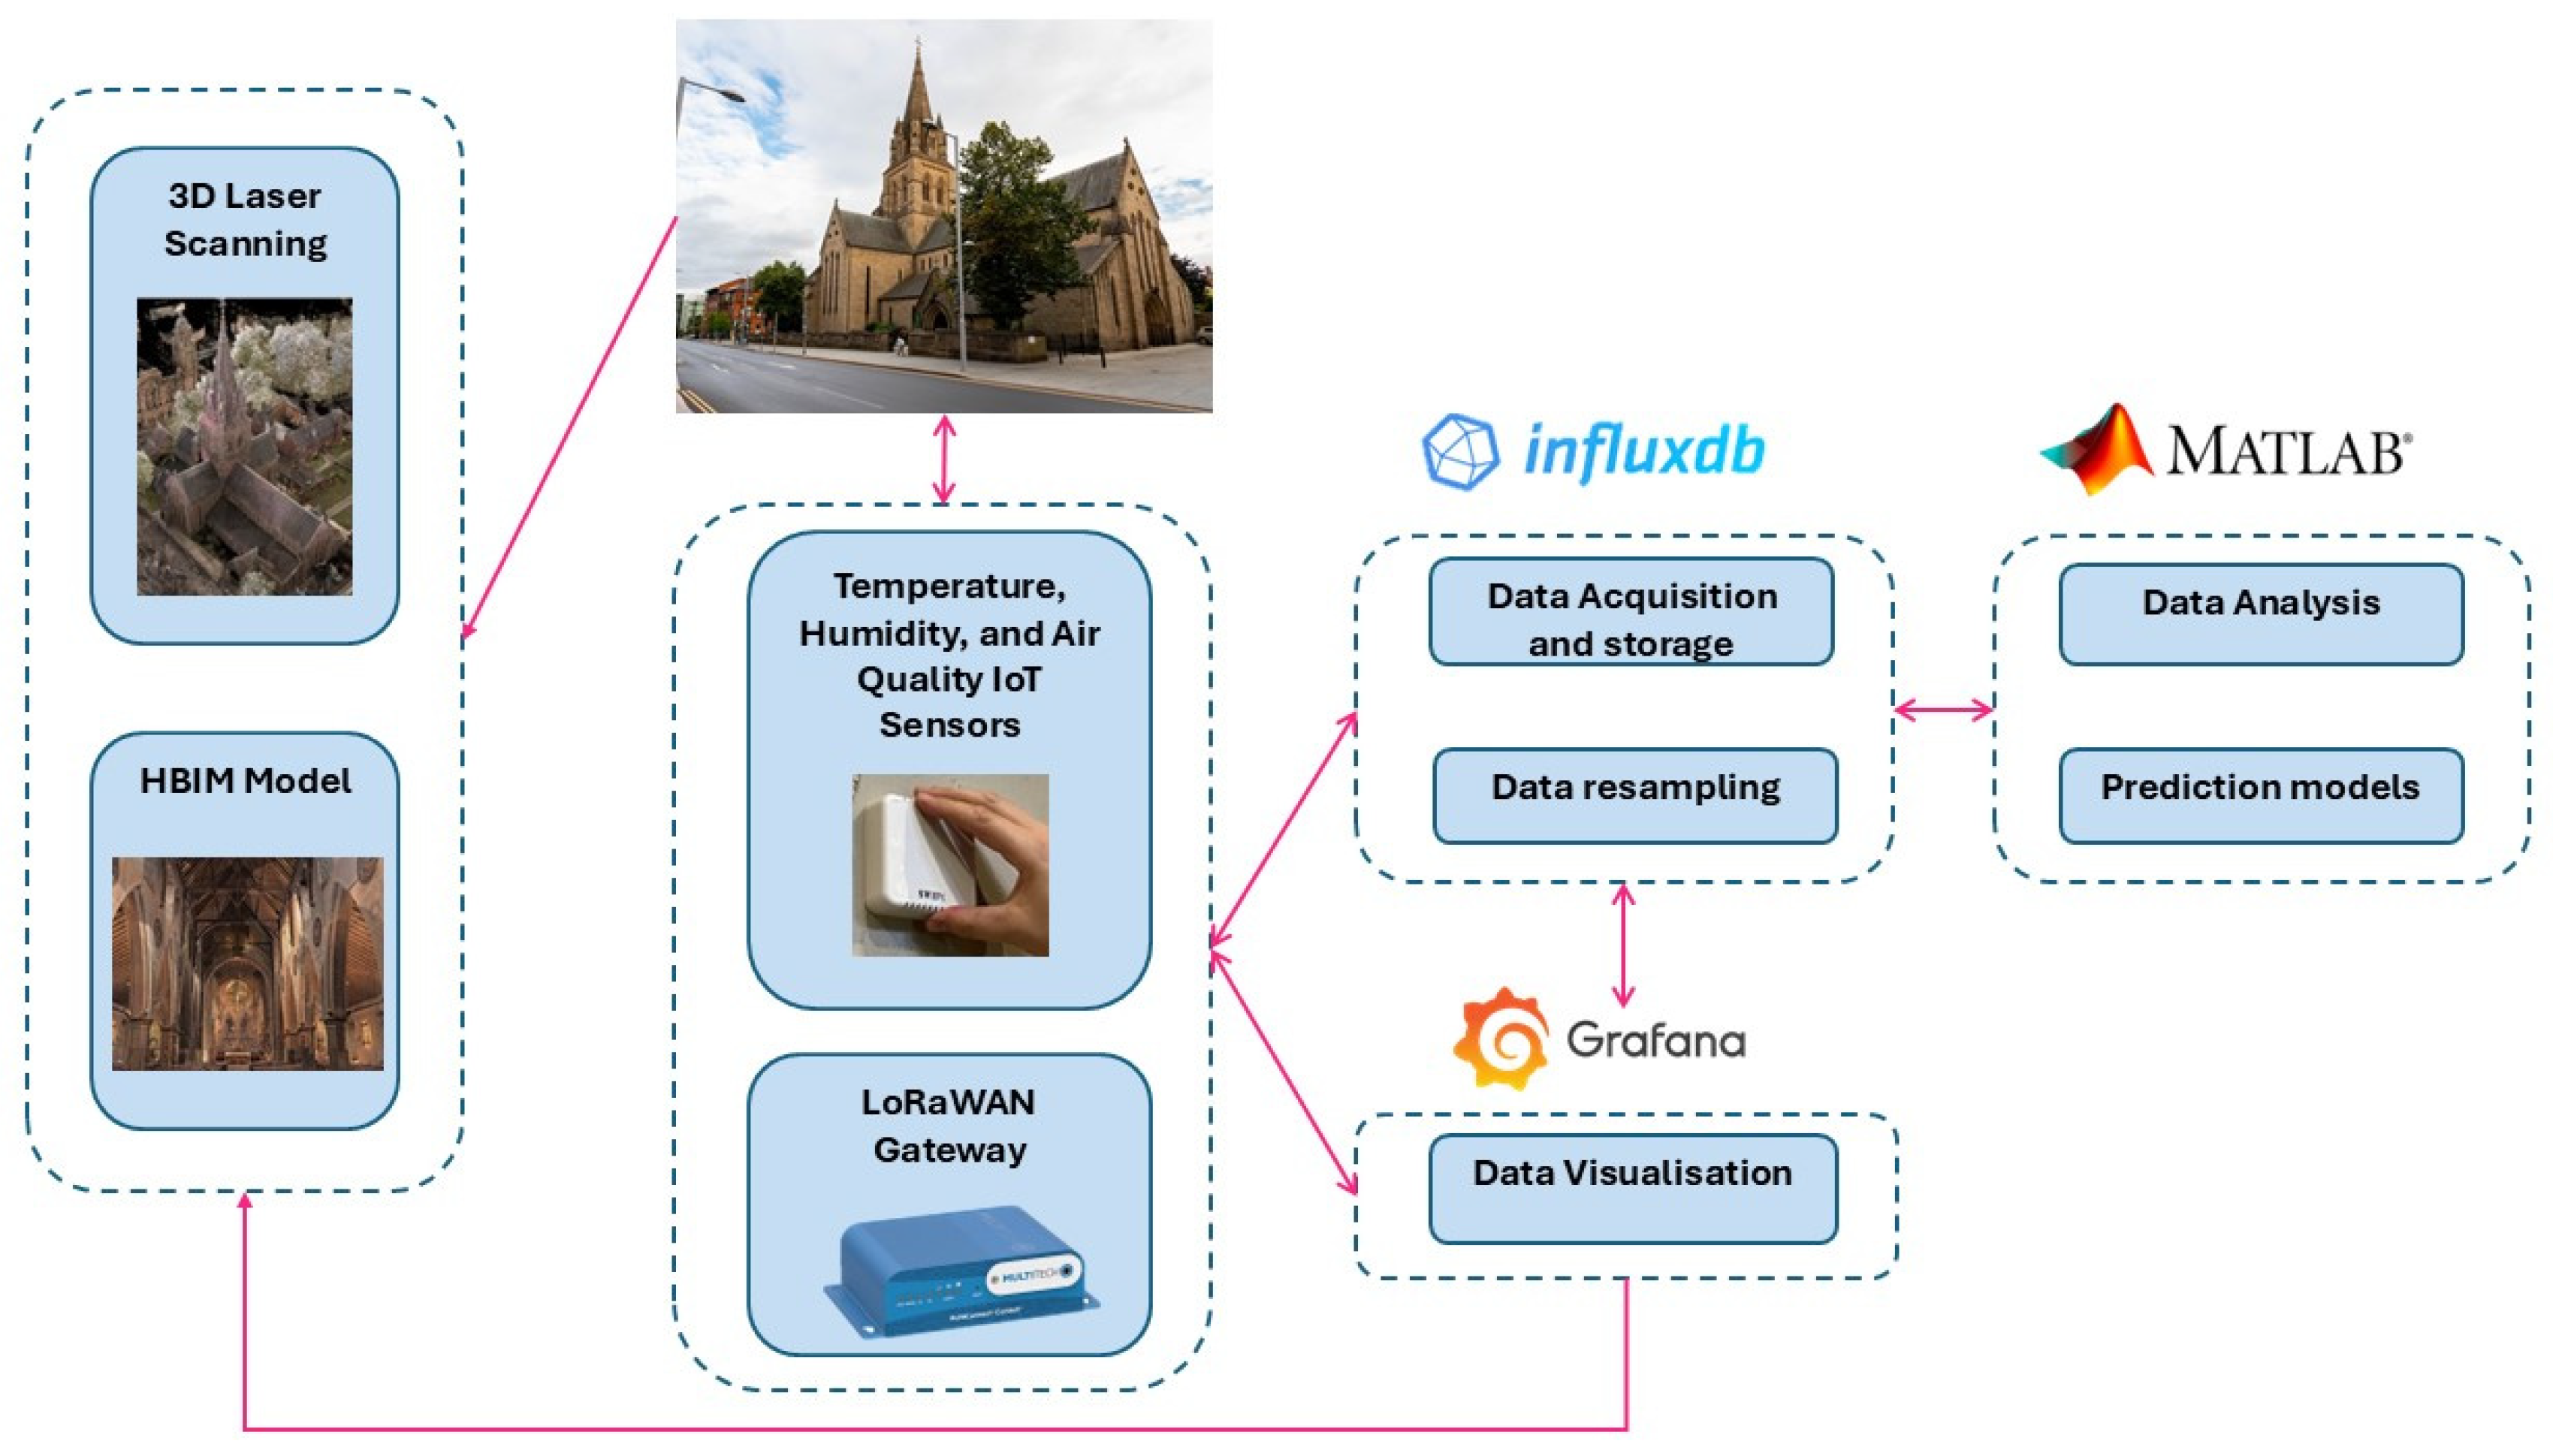
This study applies an experimental case study approach to assess how a Digital Twin (DT) (See
Figure 2) can be used to monitor and optimise the indoor environmental conditions of Nottingham Cathedral. The Cathedral was chosen because it is a Grade II-listed Gothic Revival building that presents typical conservation challenges such as temperature fluctuations and rising damp. The methodology is structured into five stages: (1) prediction model design, (2) Historic Building Information Modelling (HBIM), (3) sensor deployment, (4) data management and interface development, and (5) predictive modelling and validation.
Stage 1: Prediction Model Design
The first step was to design the prediction model for the DT. This model establishes the framework for how real-time data collected from the building will be processed and used to predict environmental conditions. Different machine learning algorithms were considered for this purpose, including Long Short-Term Memory (LSTM), Backpropagation Neural Network (BPNN), Nonlinear Autoregressive Exogenous (NARX), and Adaptive Neuro-Fuzzy Inference System (ANFIS). The accuracy of these models was evaluated using the Root Mean Square Error (RMSE) metric.
Stage 2: Historical Building Information Modelling (HBIM)
The Cathedral was digitally modelled using HBIM. This process began with a terrestrial laser scanning survey to create a precise 3D representation of the building. The HBIM (See
Figure 3) serves as the foundation of the DT by linking geometric information with material, spatial, and environmental data. It allows integration of sensor data into the virtual environment, enabling 3D spatial analysis of monitored variables.
Stage 3: IoT Sensor Deployment
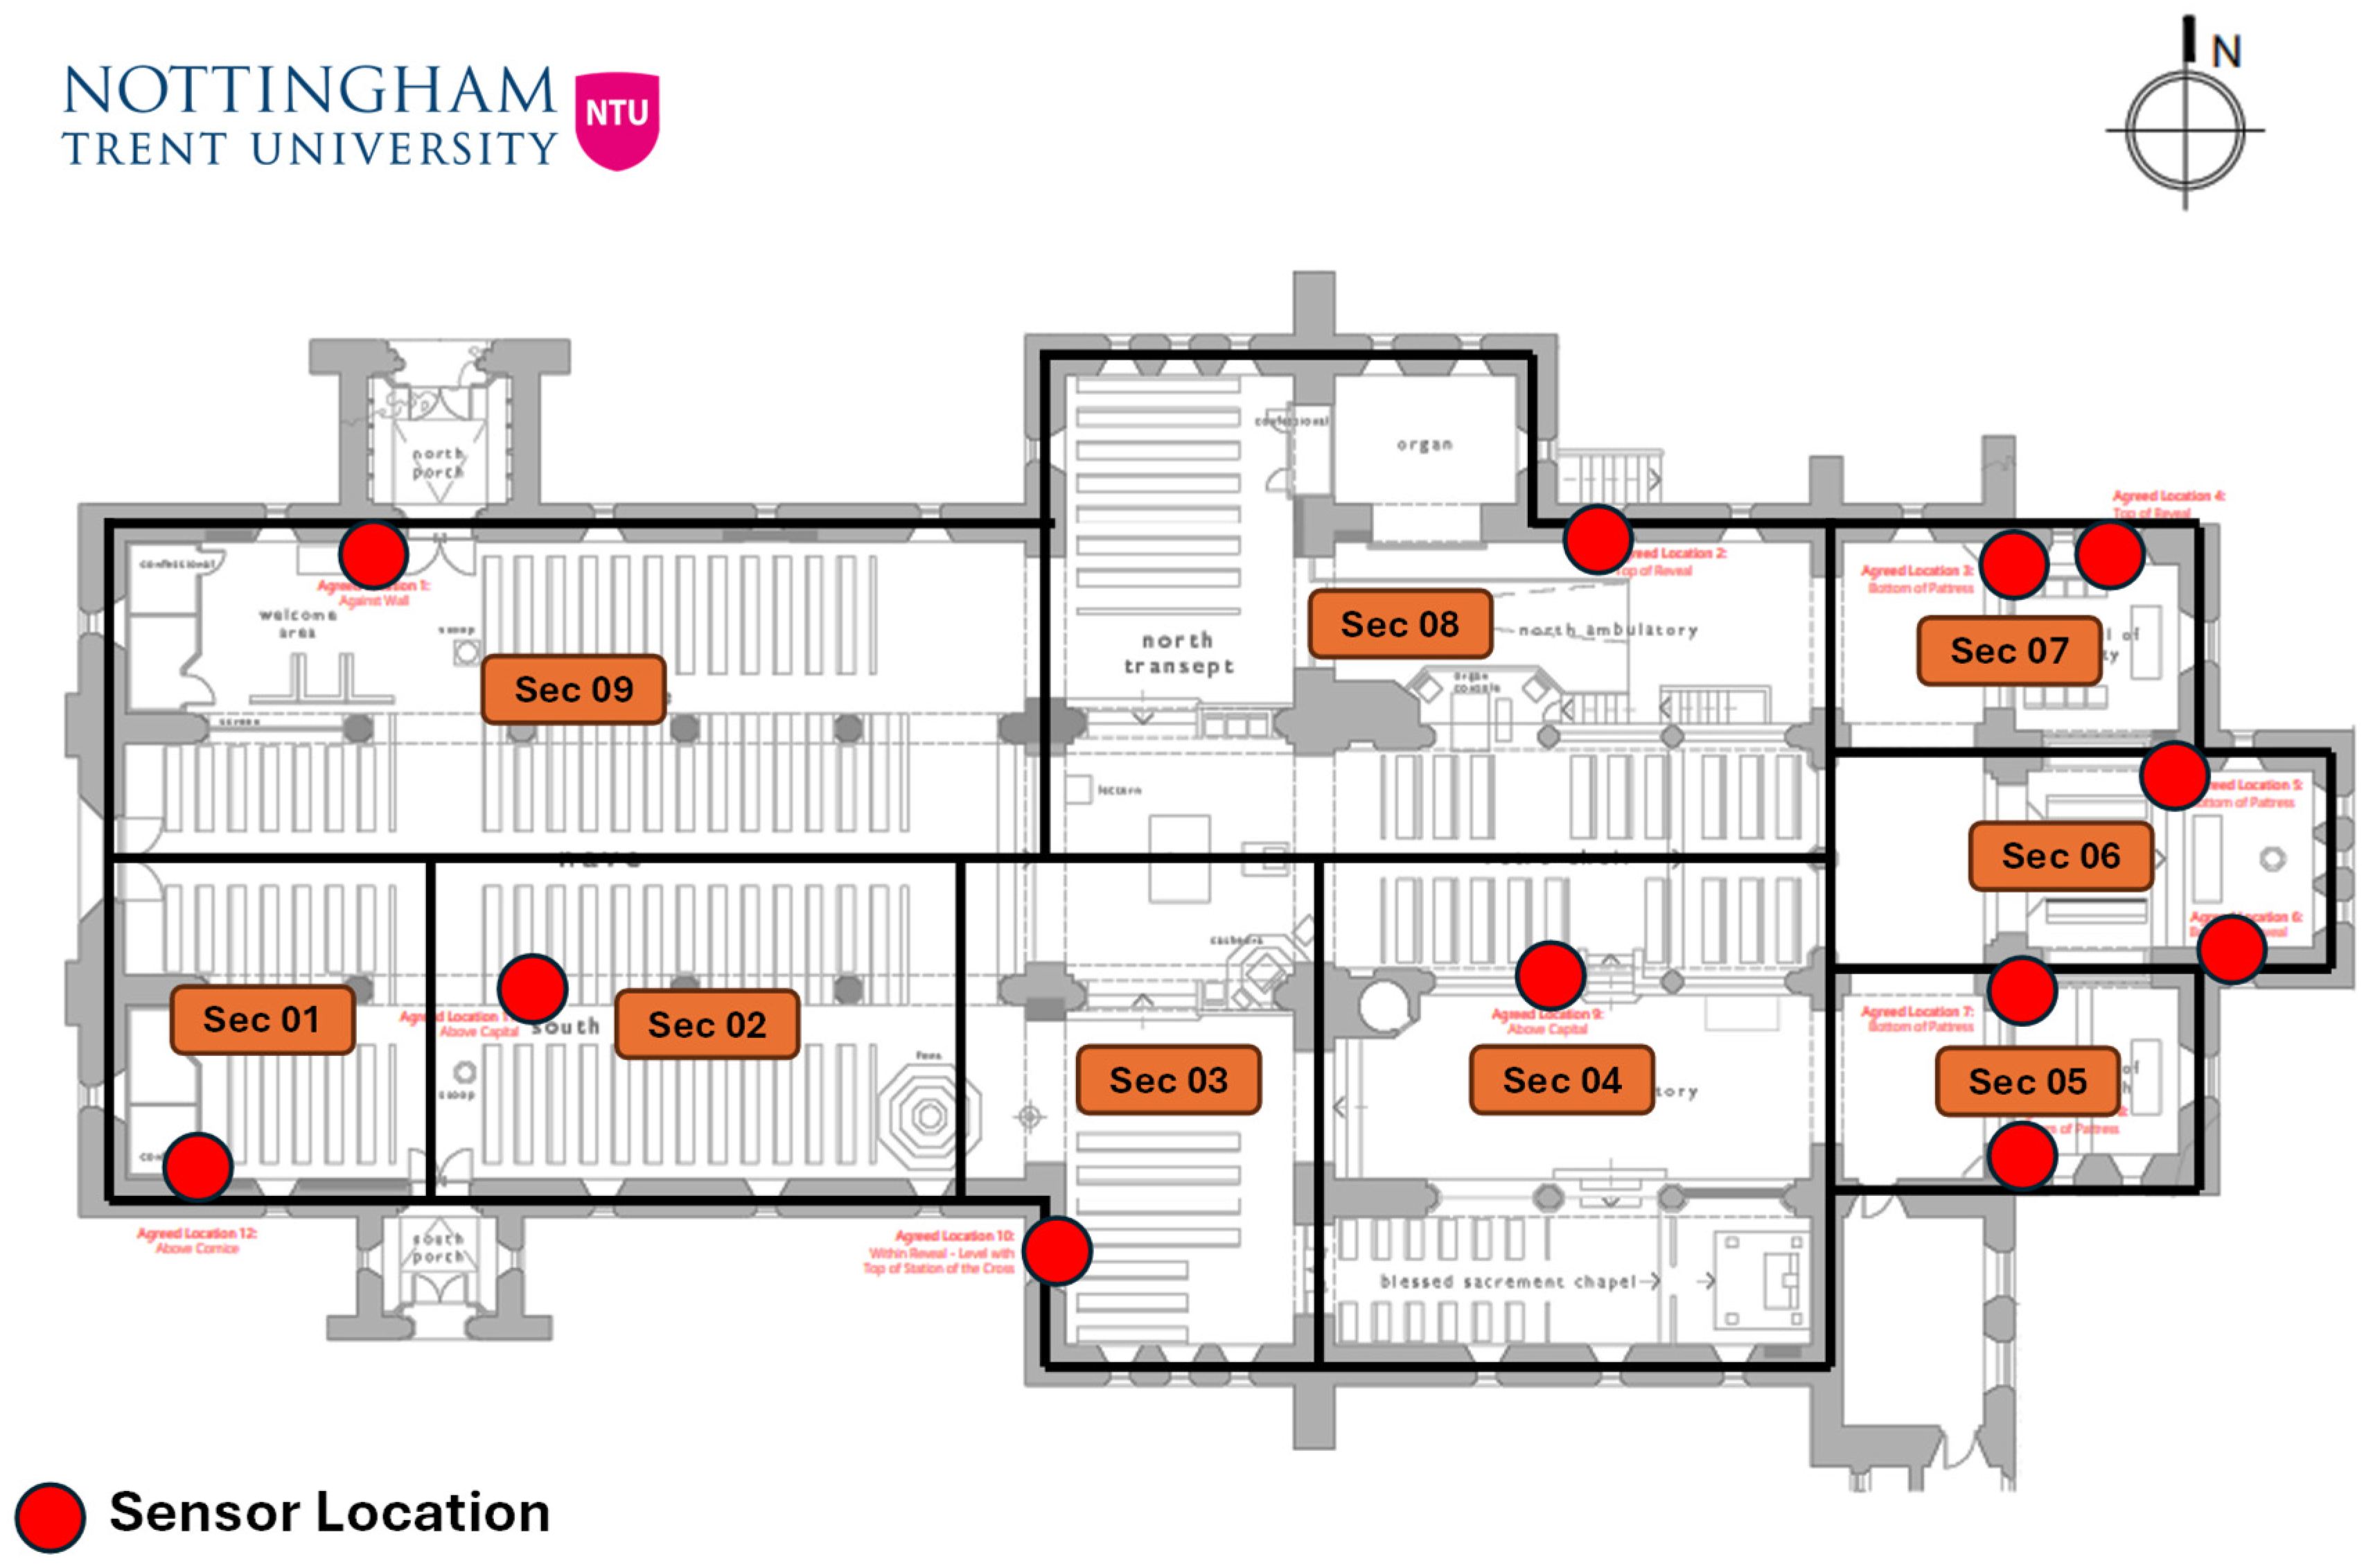
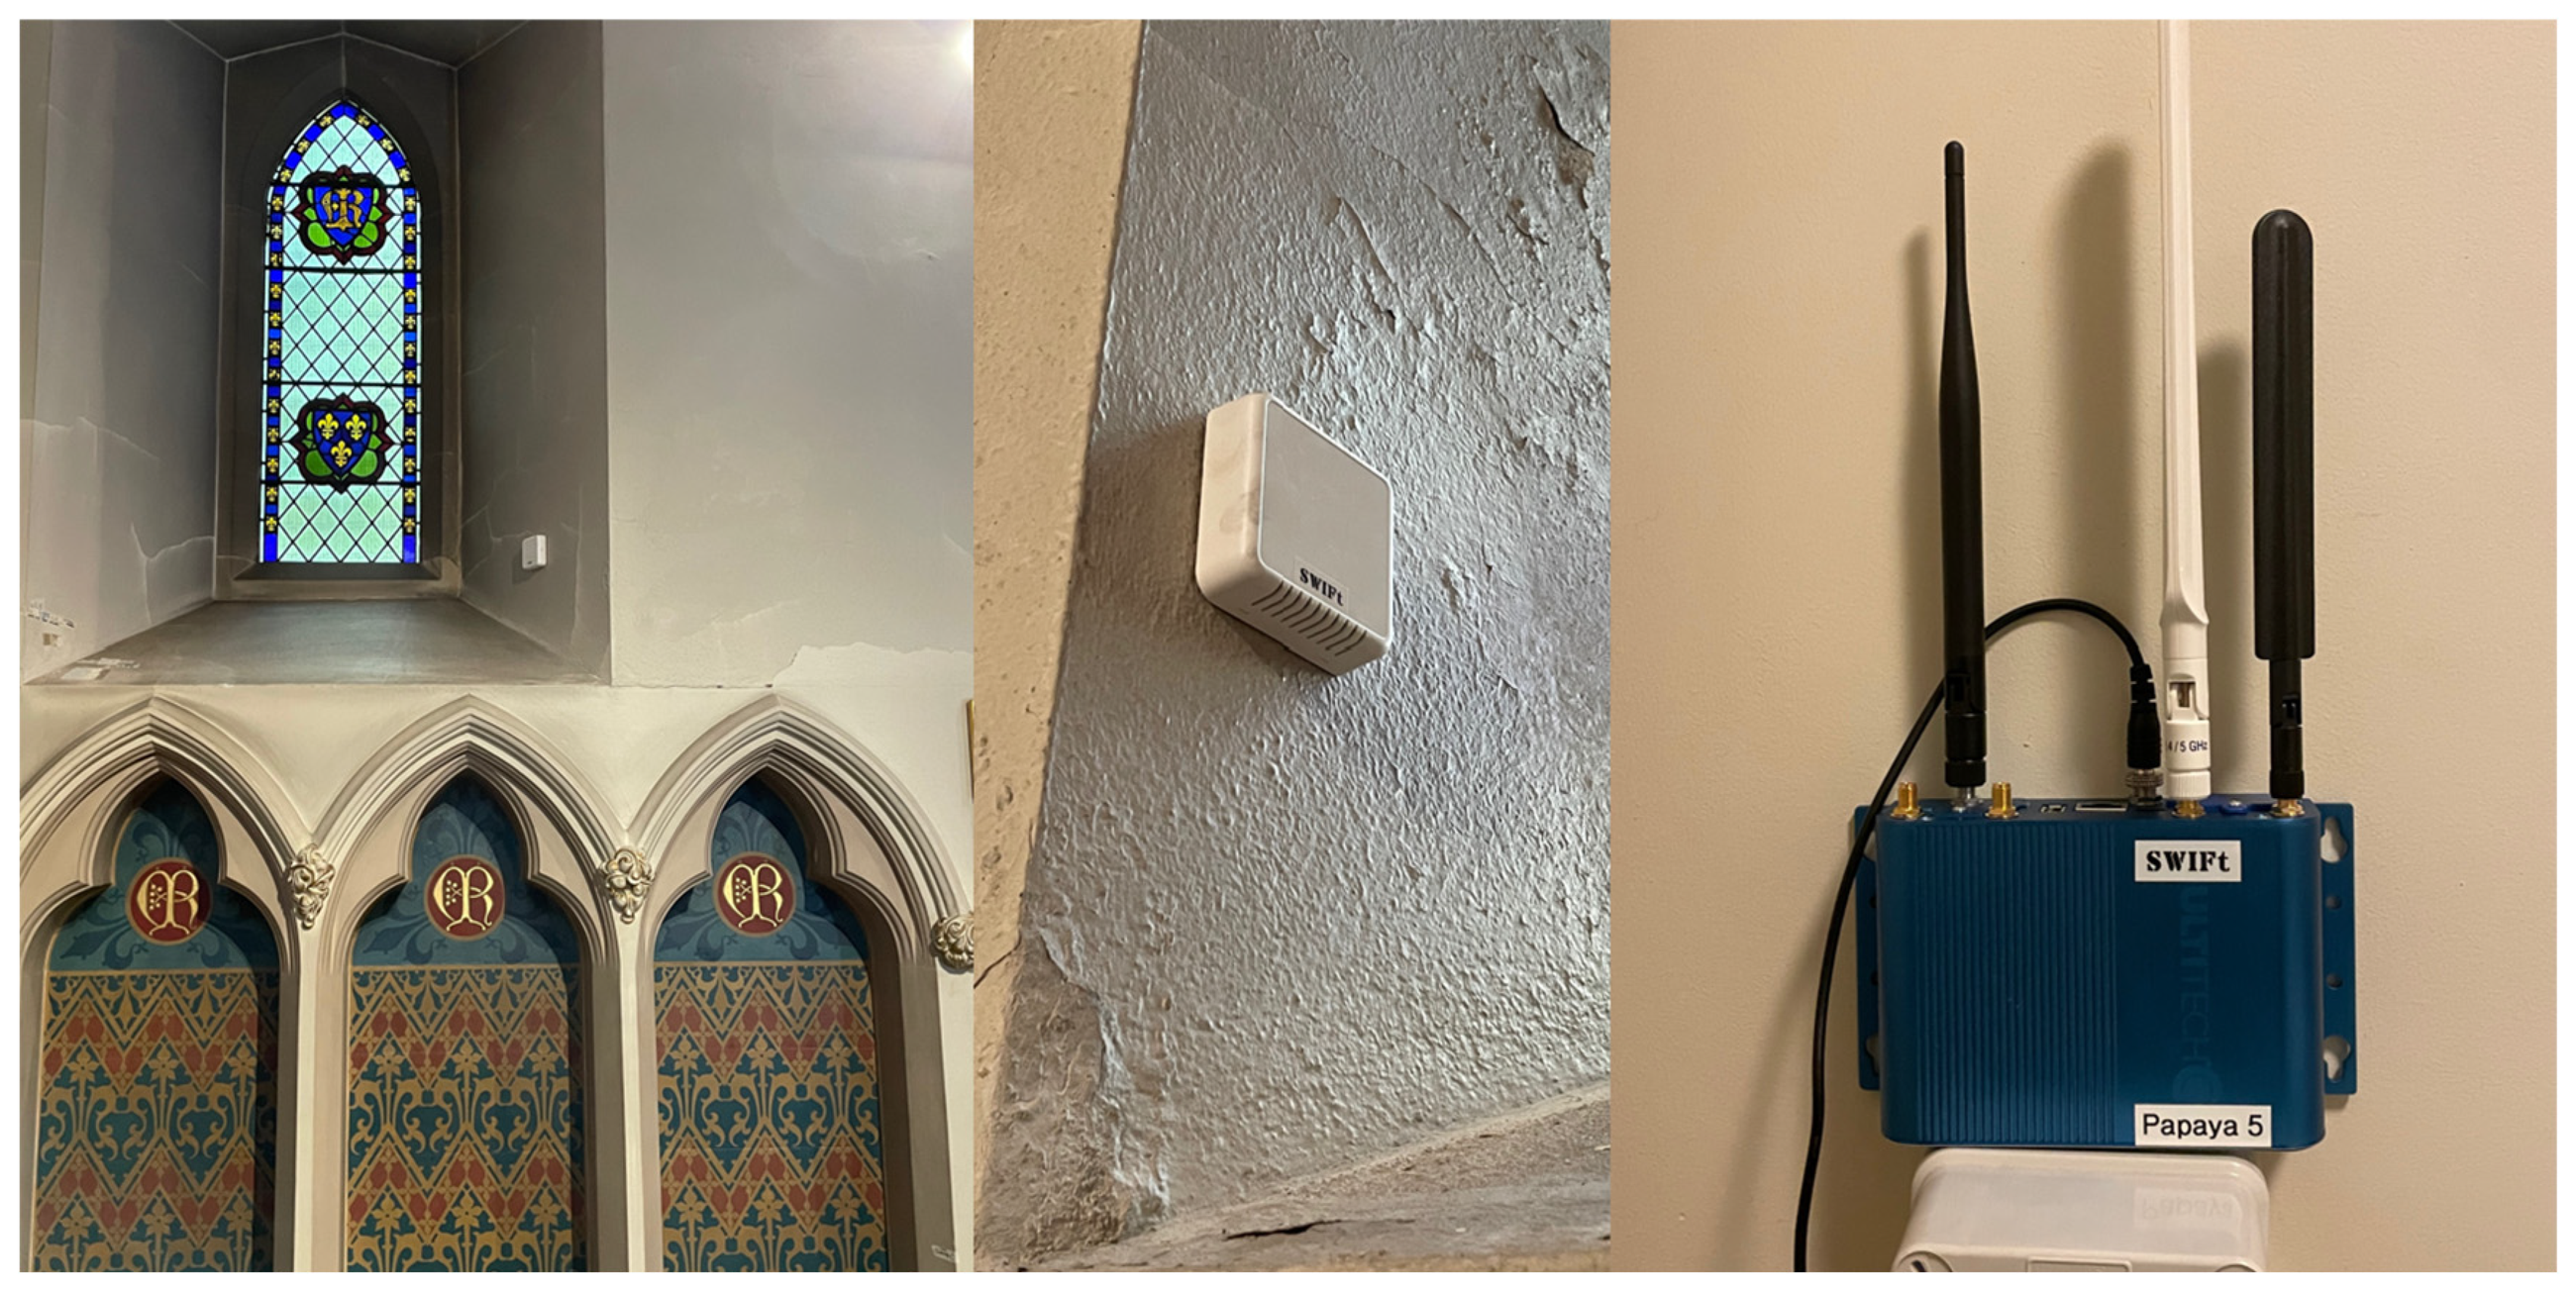
A total of 12 IoT nodes (See
Figure 4), each node including temperature, humidity, and air quality sensors, were deployed across nine distinct zones within the Cathedral, each equipped with Long Range Wide Area Network (LoRaWAN) (See
Figure 5) to capture key environmental parameters. These sensors operate in combination with a MultiTech Conduit gateway, which provides reliable connectivity through Ethernet, USB, LoRa, LTE, and Wi-Fi, ensuring robust data transmission across the Cathedral’s complex structure. The deployment strategy was designed to achieve broad spatial coverage and cross-zone redundancy. The sensor network recorded and transmitted data every 15 min over the course of a full year, thereby covering all four seasons. This continuous stream of real-time information supports both detailed analysis and predictive modelling, enabling early-warning alerts for risks such as moisture increases, while also informing conservation strategies and maintaining occupant comfort.
Stage 4: Data Management and DT interface
Sensor data is transmitted using a LoRaWAN network to a cloud-based database (InfluxDB Version 1.x). This setup allows reliable collection and storage of large volumes of data. The stored data is then visualised through the Grafana platform Version 8.1.1 (See
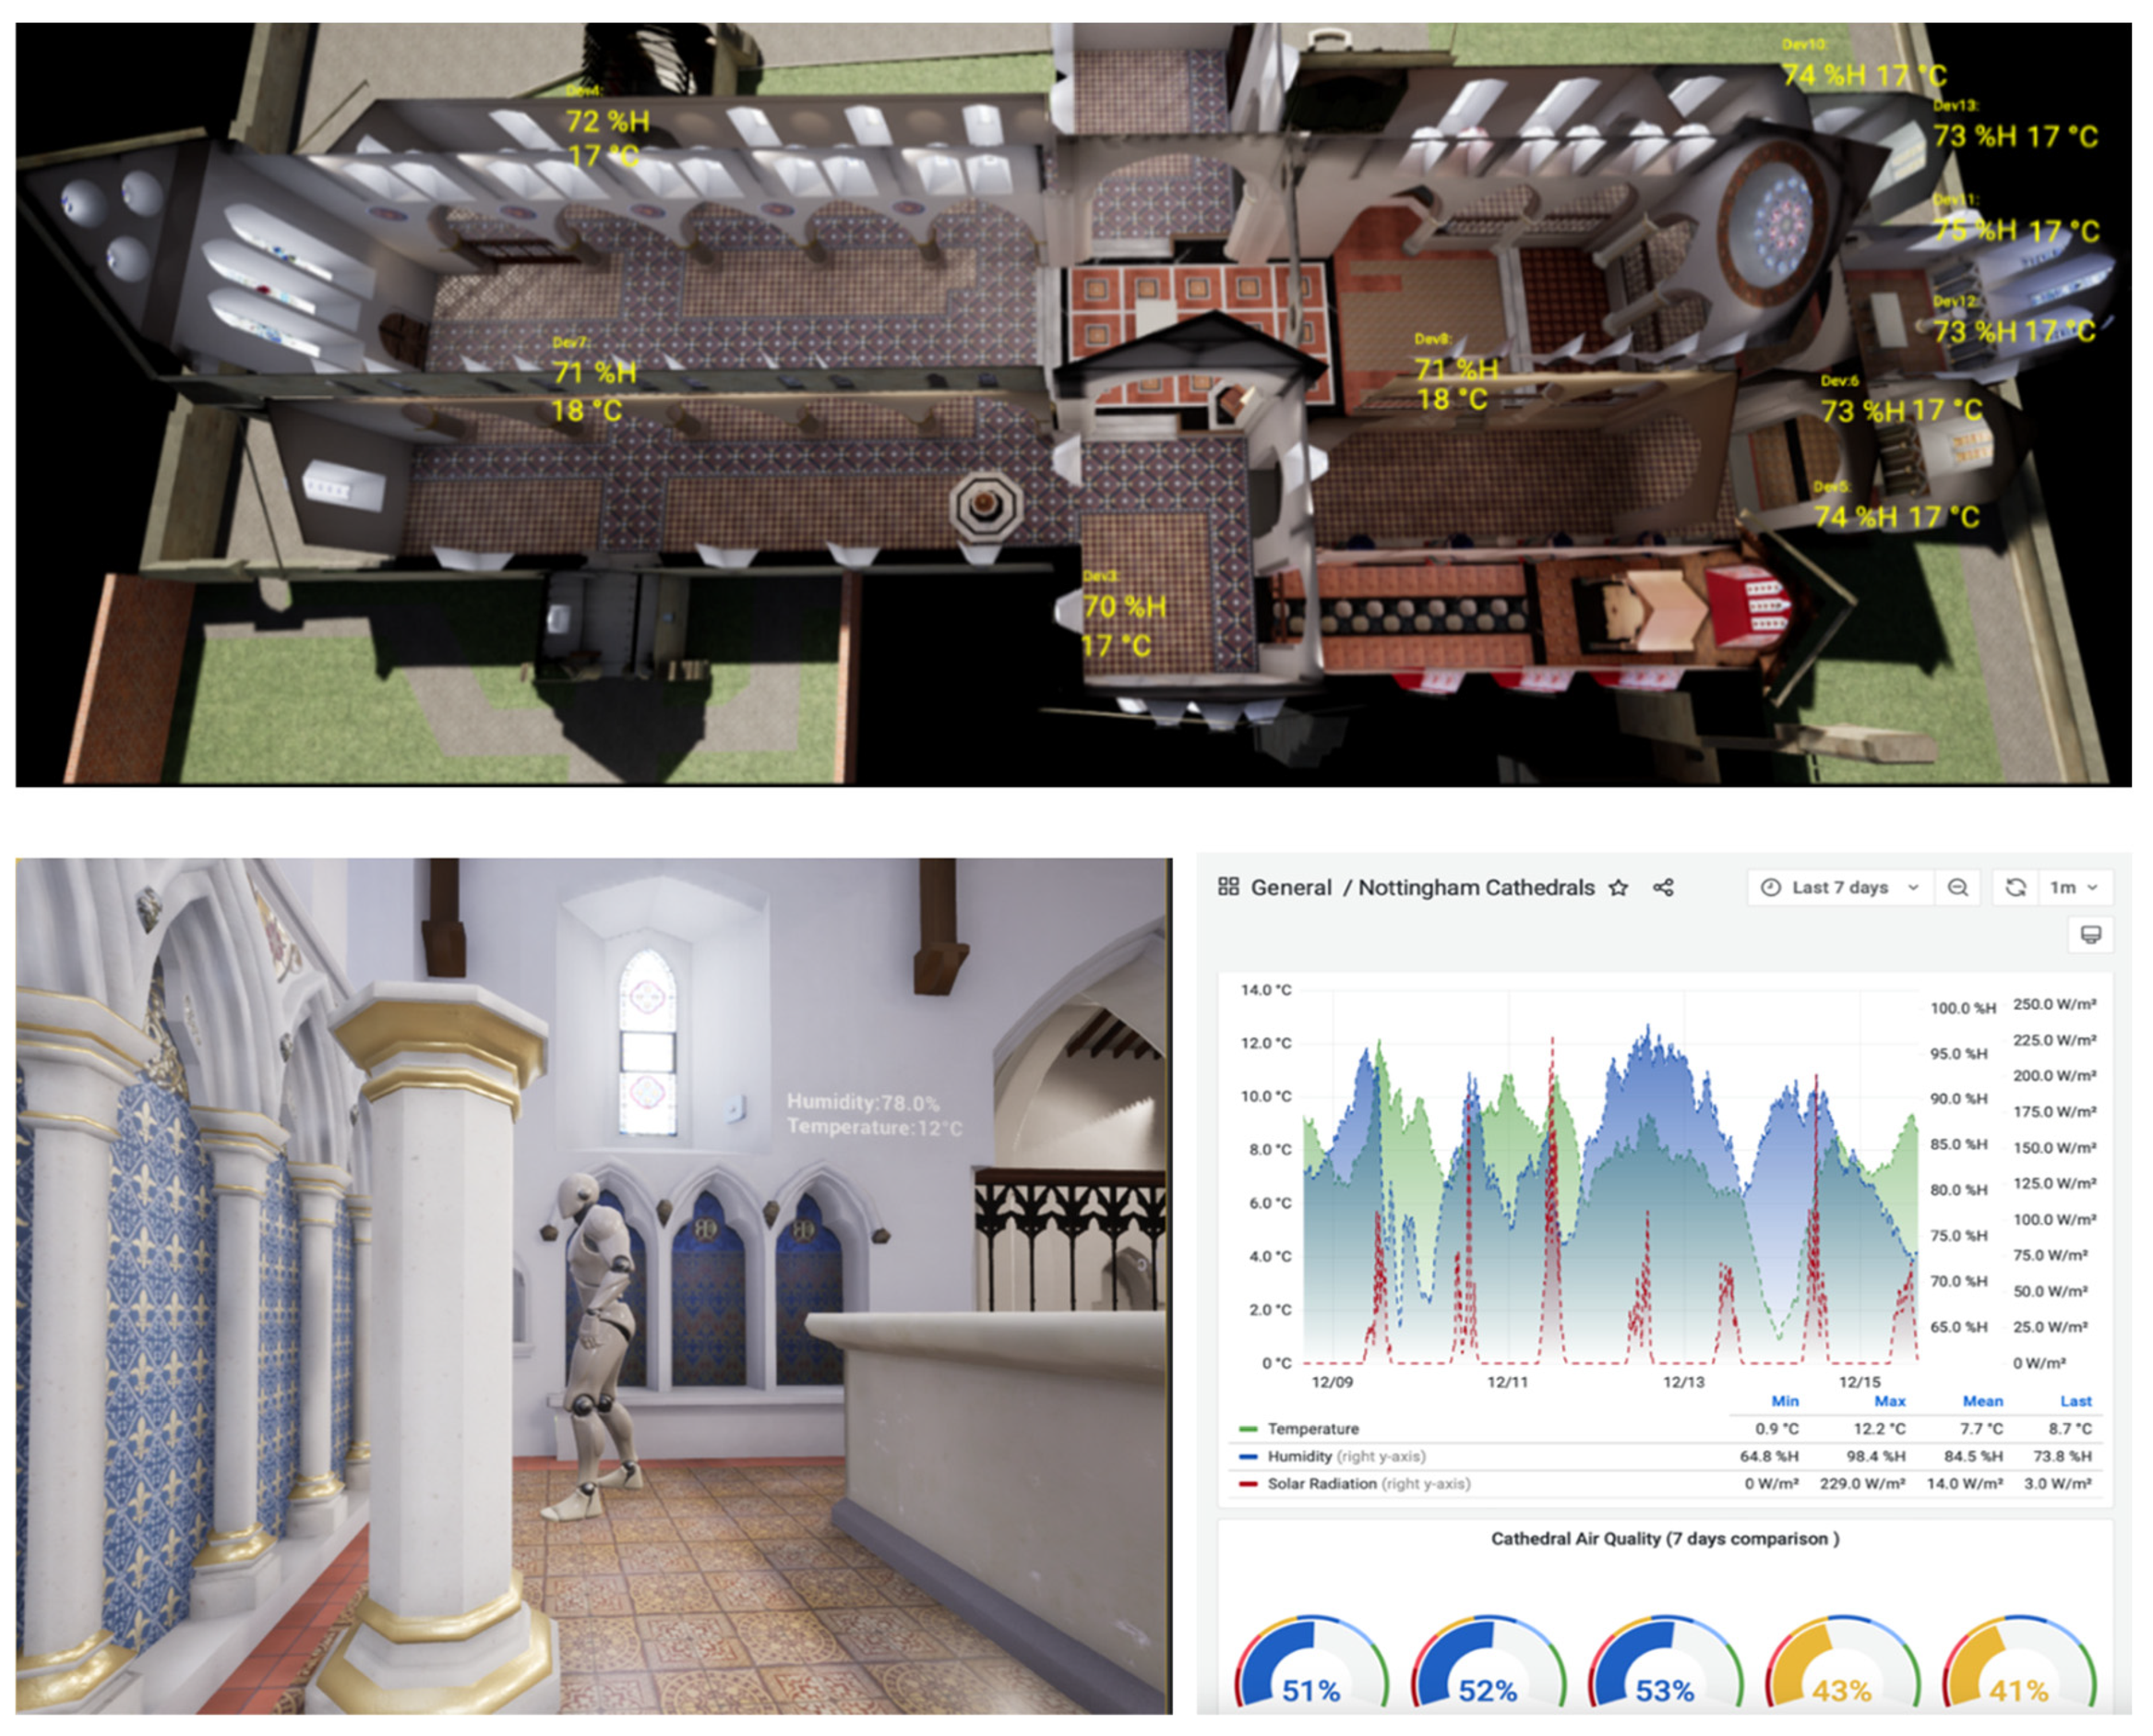
Figure 6), where interactive dashboards provide insights into environmental conditions over time. The DT interface developed in this project integrates the HBIM with real-time 3D geolocated sensor data to offer a visual, accessible representation for both researchers and conservation stakeholders.
This visualisation approach directly addresses a known challenge in HBIM-based DTs: the lack of intuitive, real-time data representation. By integrating geolocated sensor data within the 3D environment, the DT interface enables spatial analysis and enhances decision-making for conservation stakeholders.
Stage 5: Data analysis and predictive modelling
Machine learning algorithms were trained on the collected data to predict indoor conditions. Comparative analysis was carried out to determine the most reliable model. The NARX model demonstrated the lowest RMSE values, indicating strong predictive performance. Validation was achieved using real-time data streams, which confirmed the robustness of the model. Future improvements should focus on expanding sensor networks and introducing adaptive feedback loops for automatic environmental control.
Table 1 summarises the main parameters used in the predictive modelling.
Because our dataset spans a complete year, each of the three splits (training, validation, and testing) contains representative data from all seasons: spring, summer, autumn, and winter. This validation approach ensures that the model is not simply memorising seasonal patterns from the training data but is evaluated on its ability to apply learned relationships to new, unseen years, each with their own unique seasonal characteristics.
4. Data Analysis
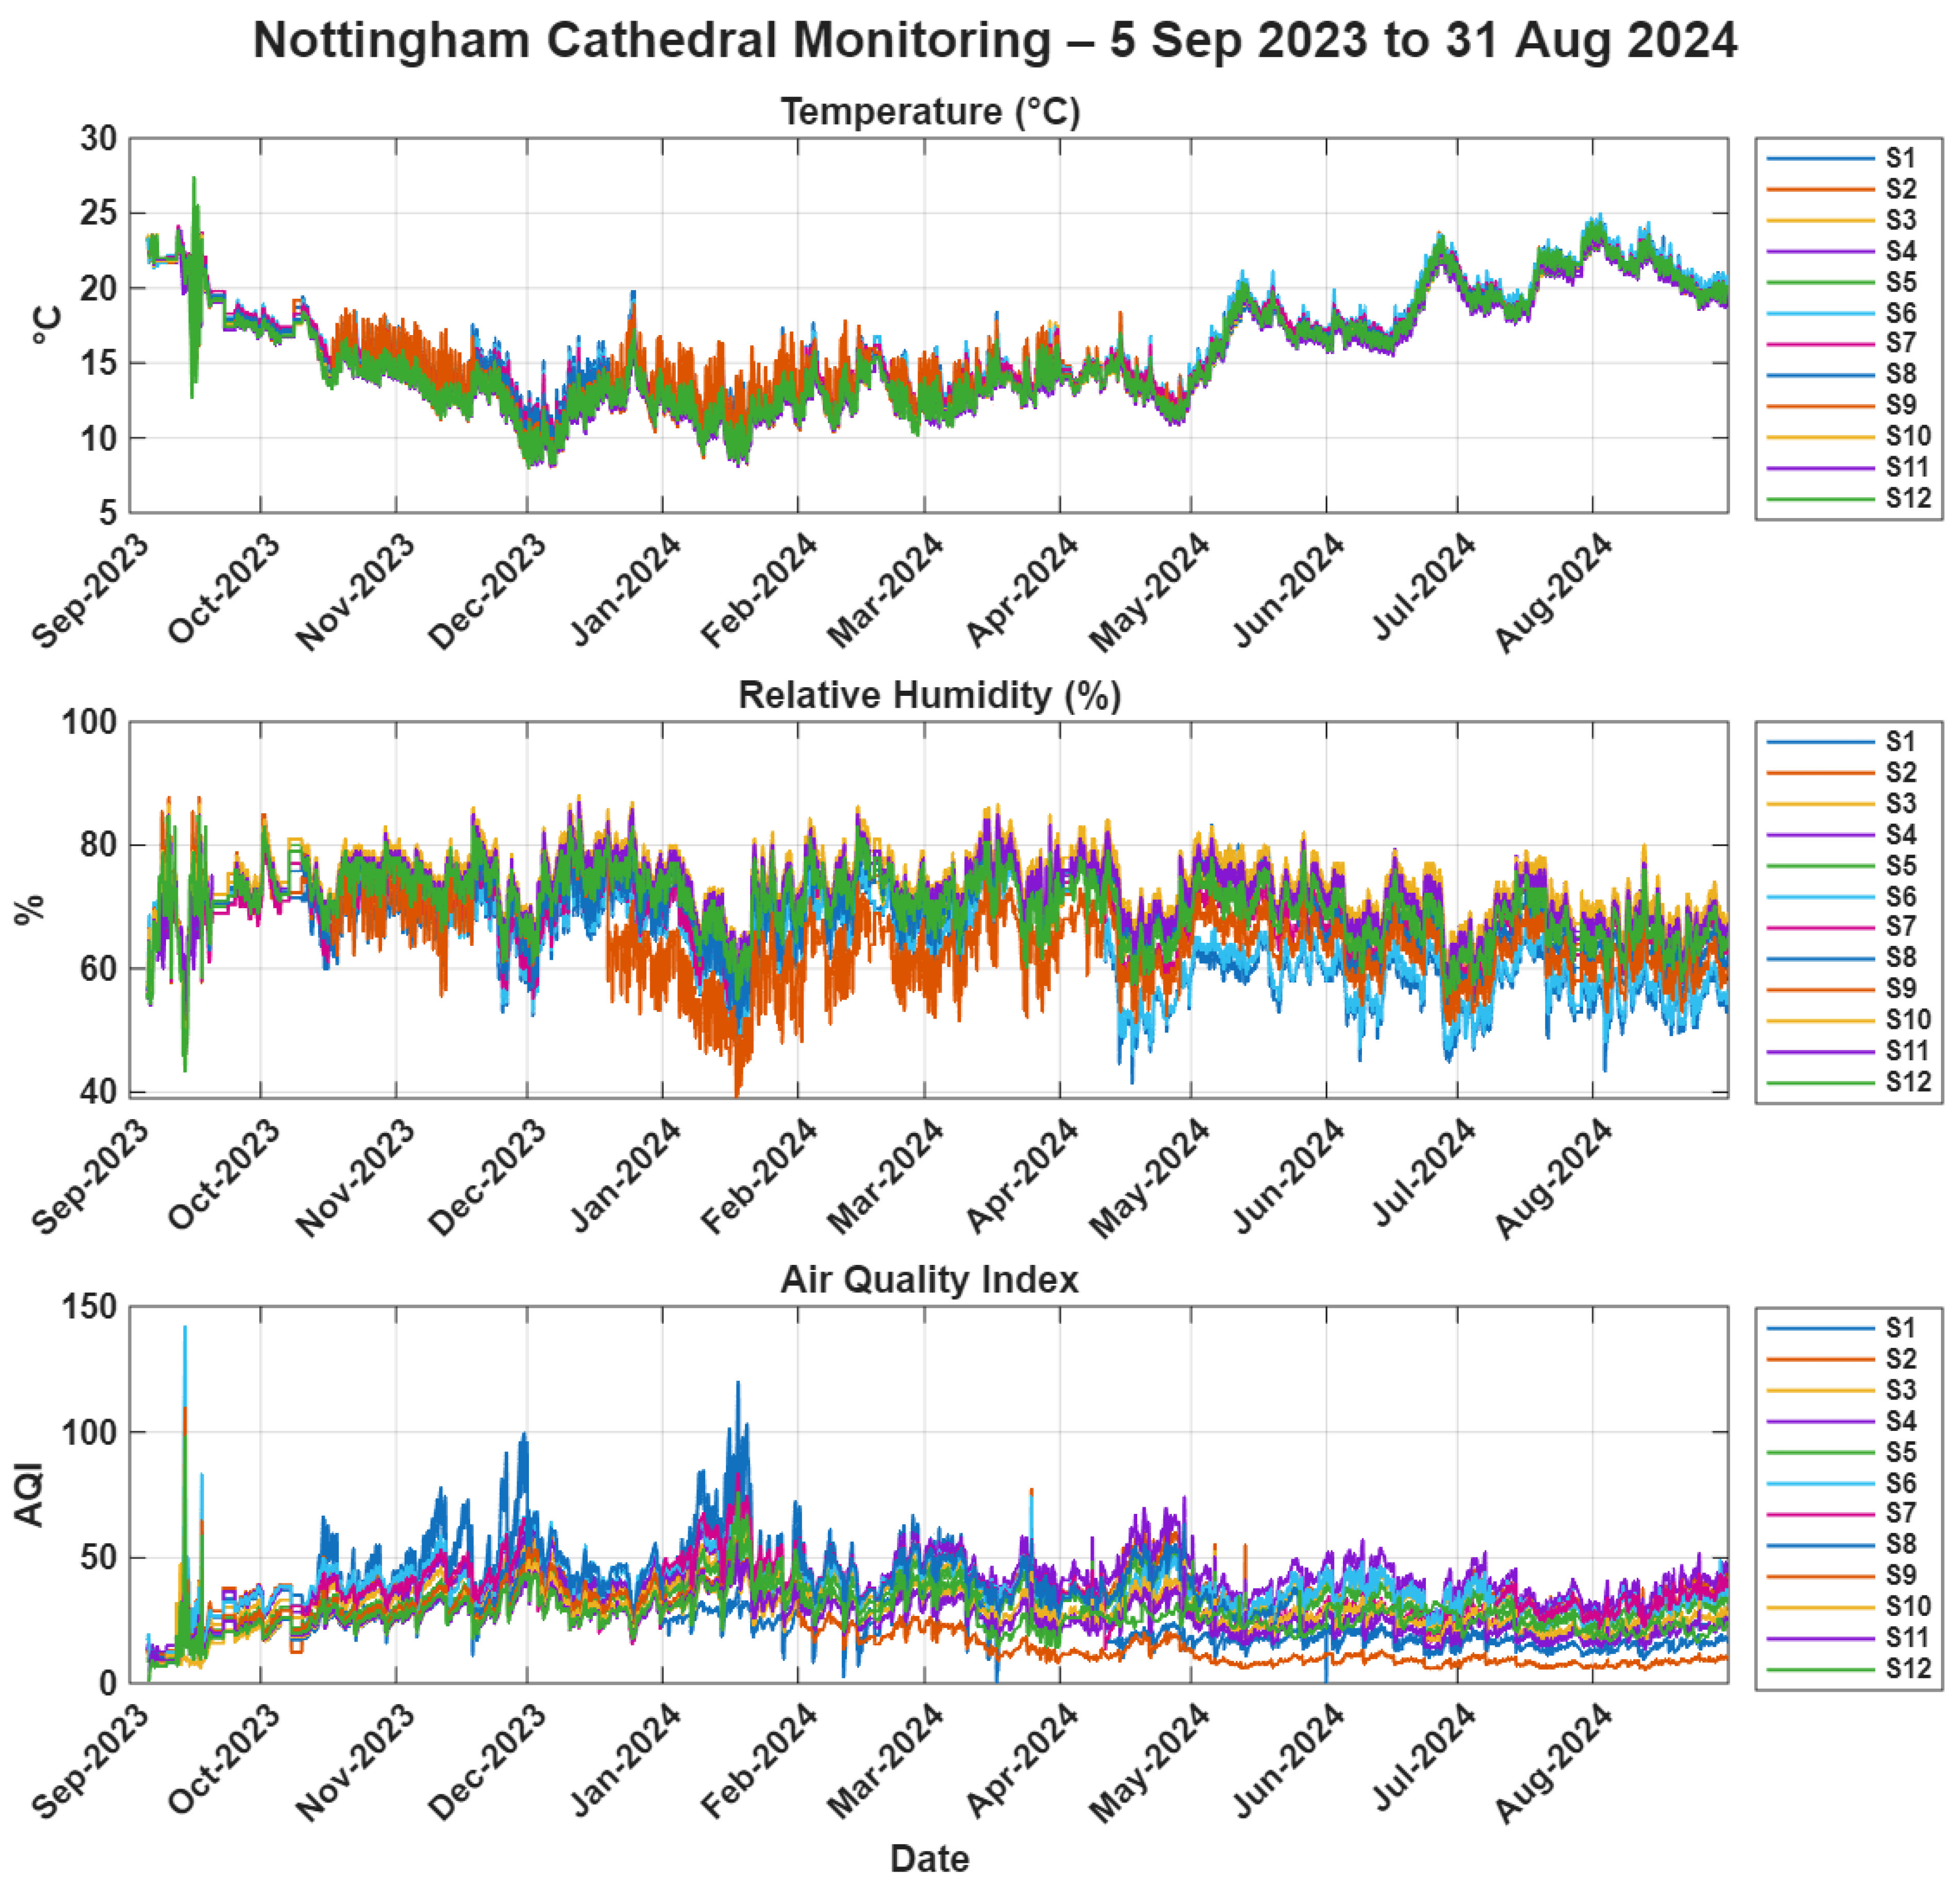
This section presents the data analysis conducted using the real-time monitoring dataset. The analysis focused on handling missing data, cleaning and pre-processing, identifying correlations, and developing predictive models to support the conservation objectives. The results indicate that the primary environmental risks within the Cathedral are linked to low temperatures and high relative humidity. Together, these conditions are conducive to material deterioration. No significant issues related to air pollution were identified. Consequently, the subsequent analysis and predictive modelling place particular emphasis on temperature and humidity as the key variables influencing conservation outcomes.
4.1. Handling Missing Data
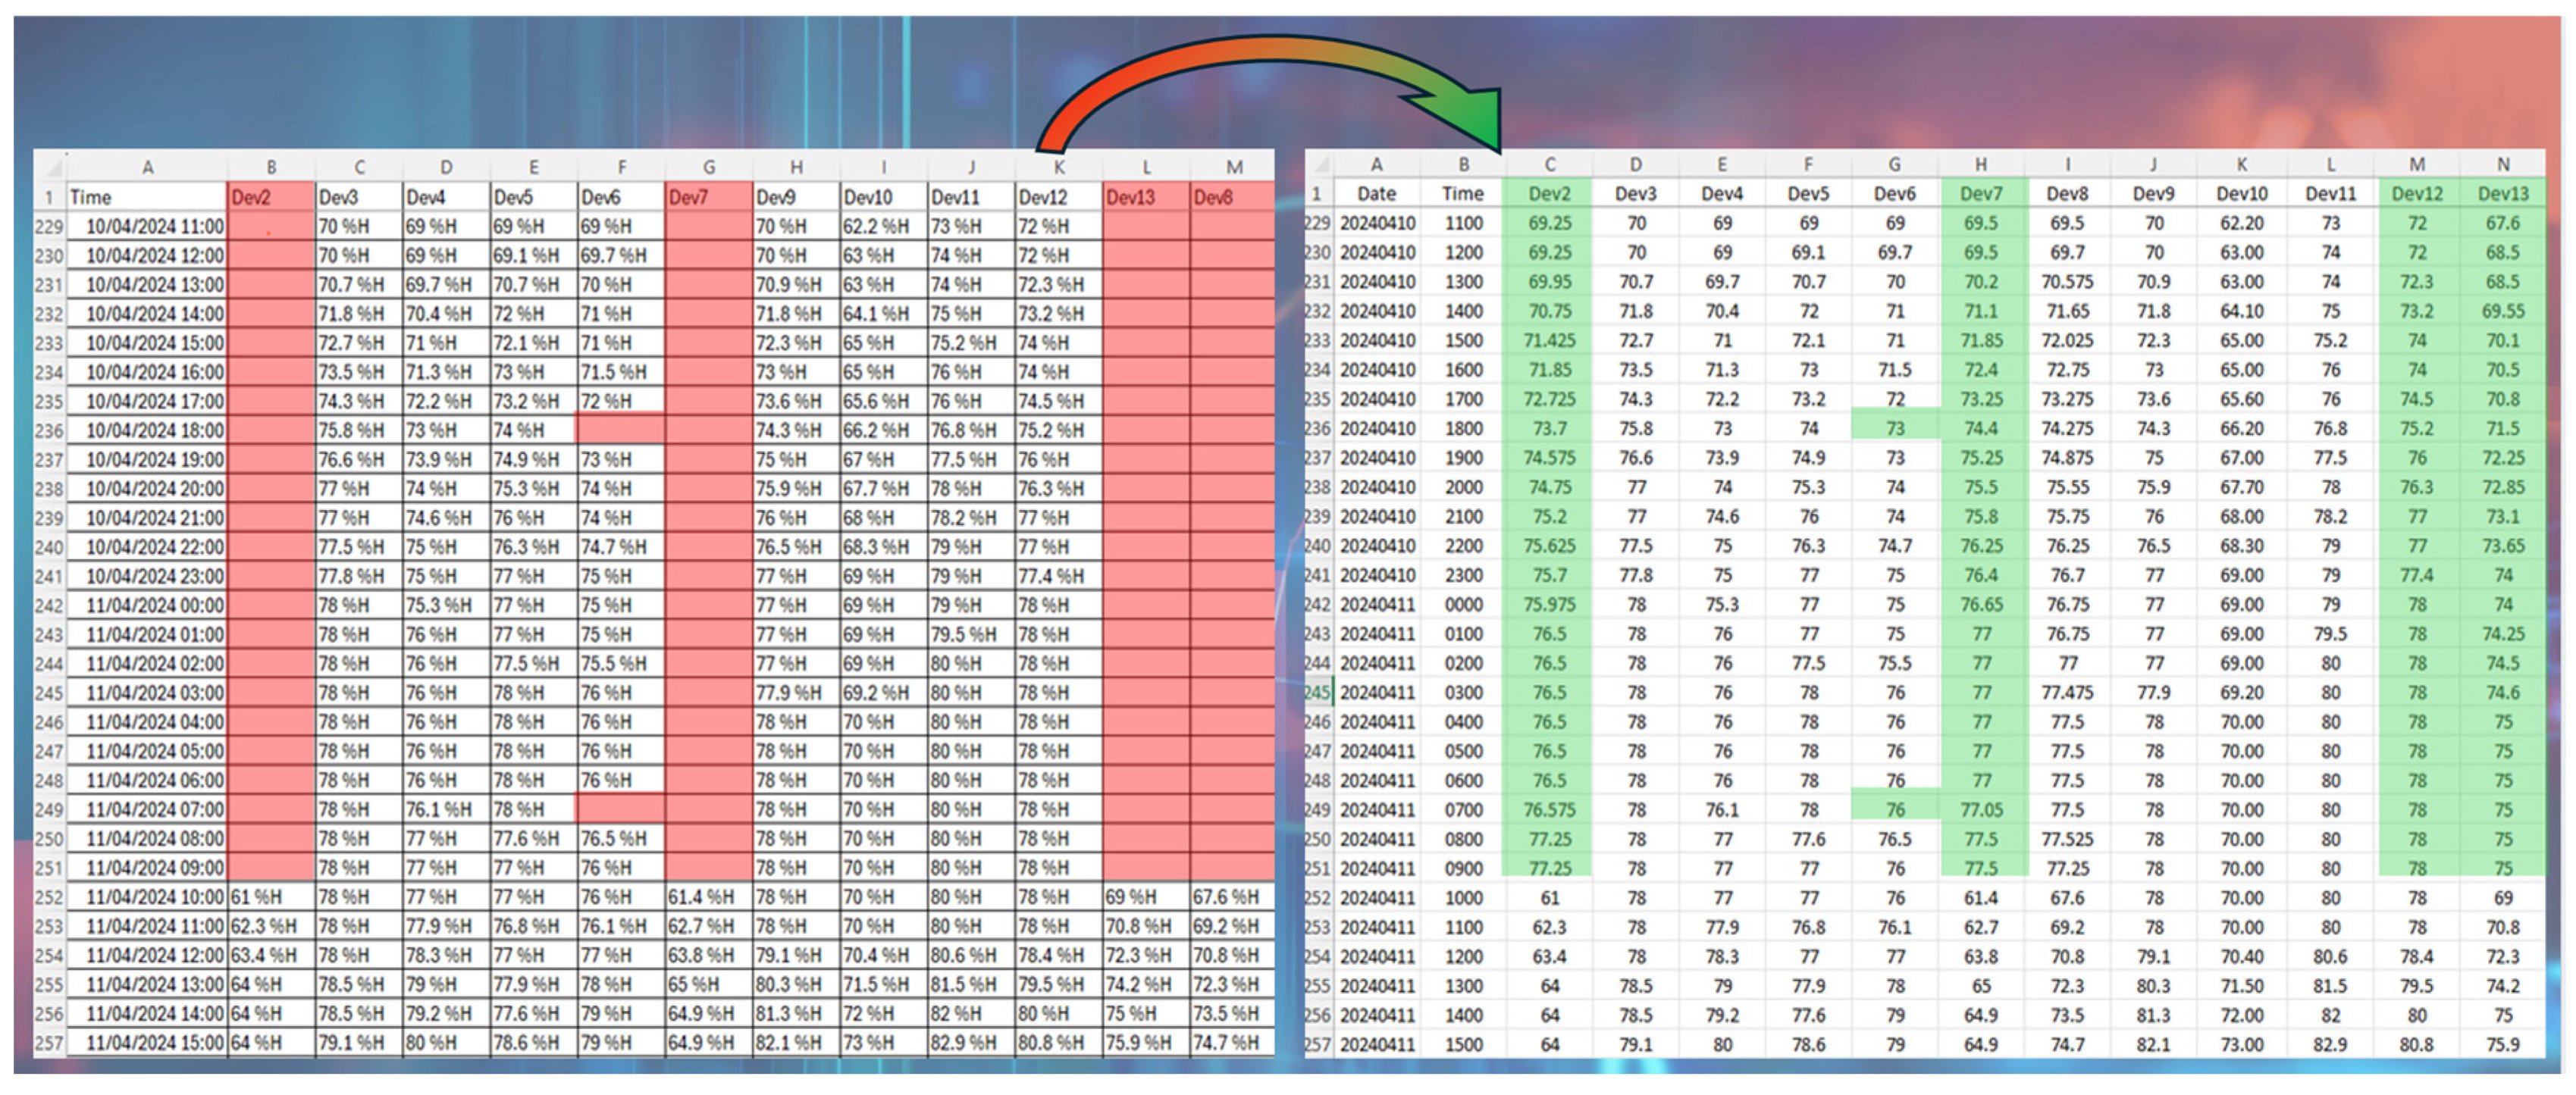
During the monitoring phase, intermittent sensor failures caused missing data points within the dataset. To address this issue, an Artificial Neural Network (ANN) model was implemented to estimate and reconstruct incomplete datasets. The ANN was trained on historical data from the complete sensor array to learn complex, non-linear relationships between variables, which include data recorded every 15 min. It was then applied to estimate values for periods when sensors were non-operational. This ensured data continuity and integrity, producing a complete and reliable time-series dataset for subsequent analysis.
Figure 7 illustrates the ANN-based reconstruction process, comparing sensor readings before and after estimation. This approach significantly enhanced data quality and provided a stable foundation for predictive modelling.
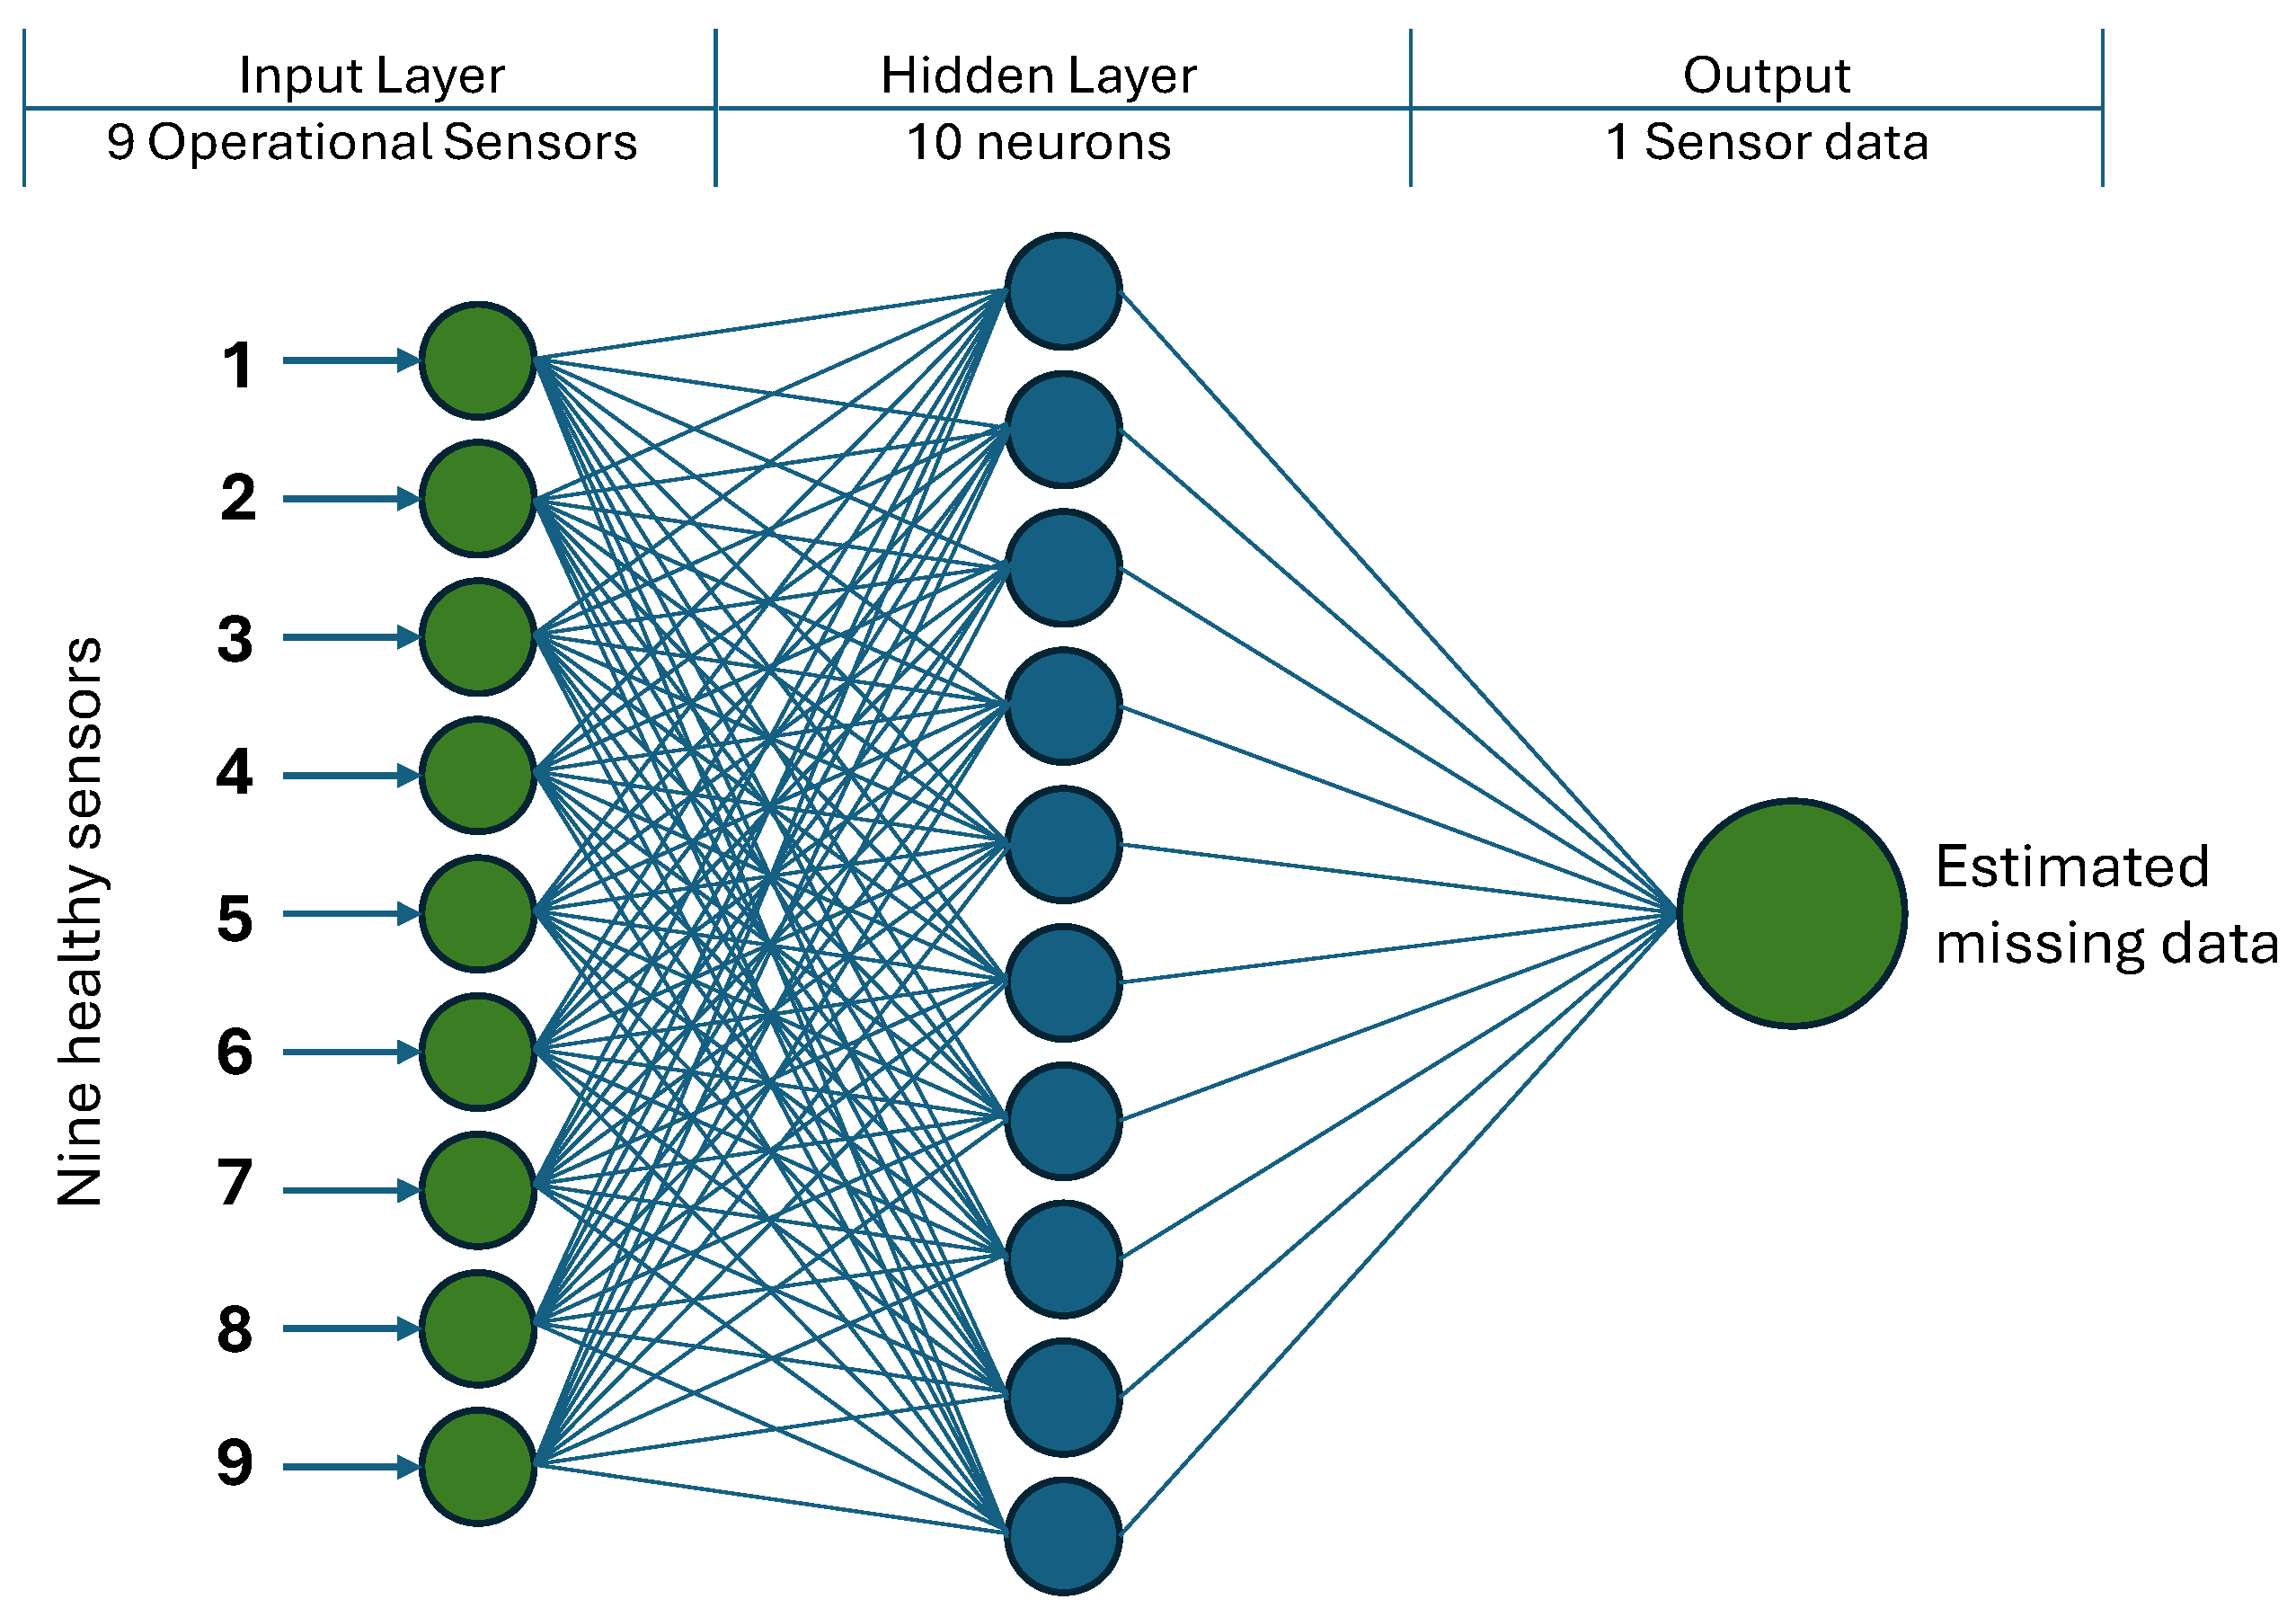
ANN (feedforward neural networks) implemented in MATLAB. For each sensor, a single-hidden-layer neural network with 10 neurons was created using the fitnet function (See
Figure 8). Inputs consisted of data from the nine operational sensors, while targets were the available healthy data from the malfunctioning sensor prior to failure. Approximately 70% of the available healthy data was used for training, with the remaining portion used for testing. The trained network was then applied to the full dataset to estimate missing values.
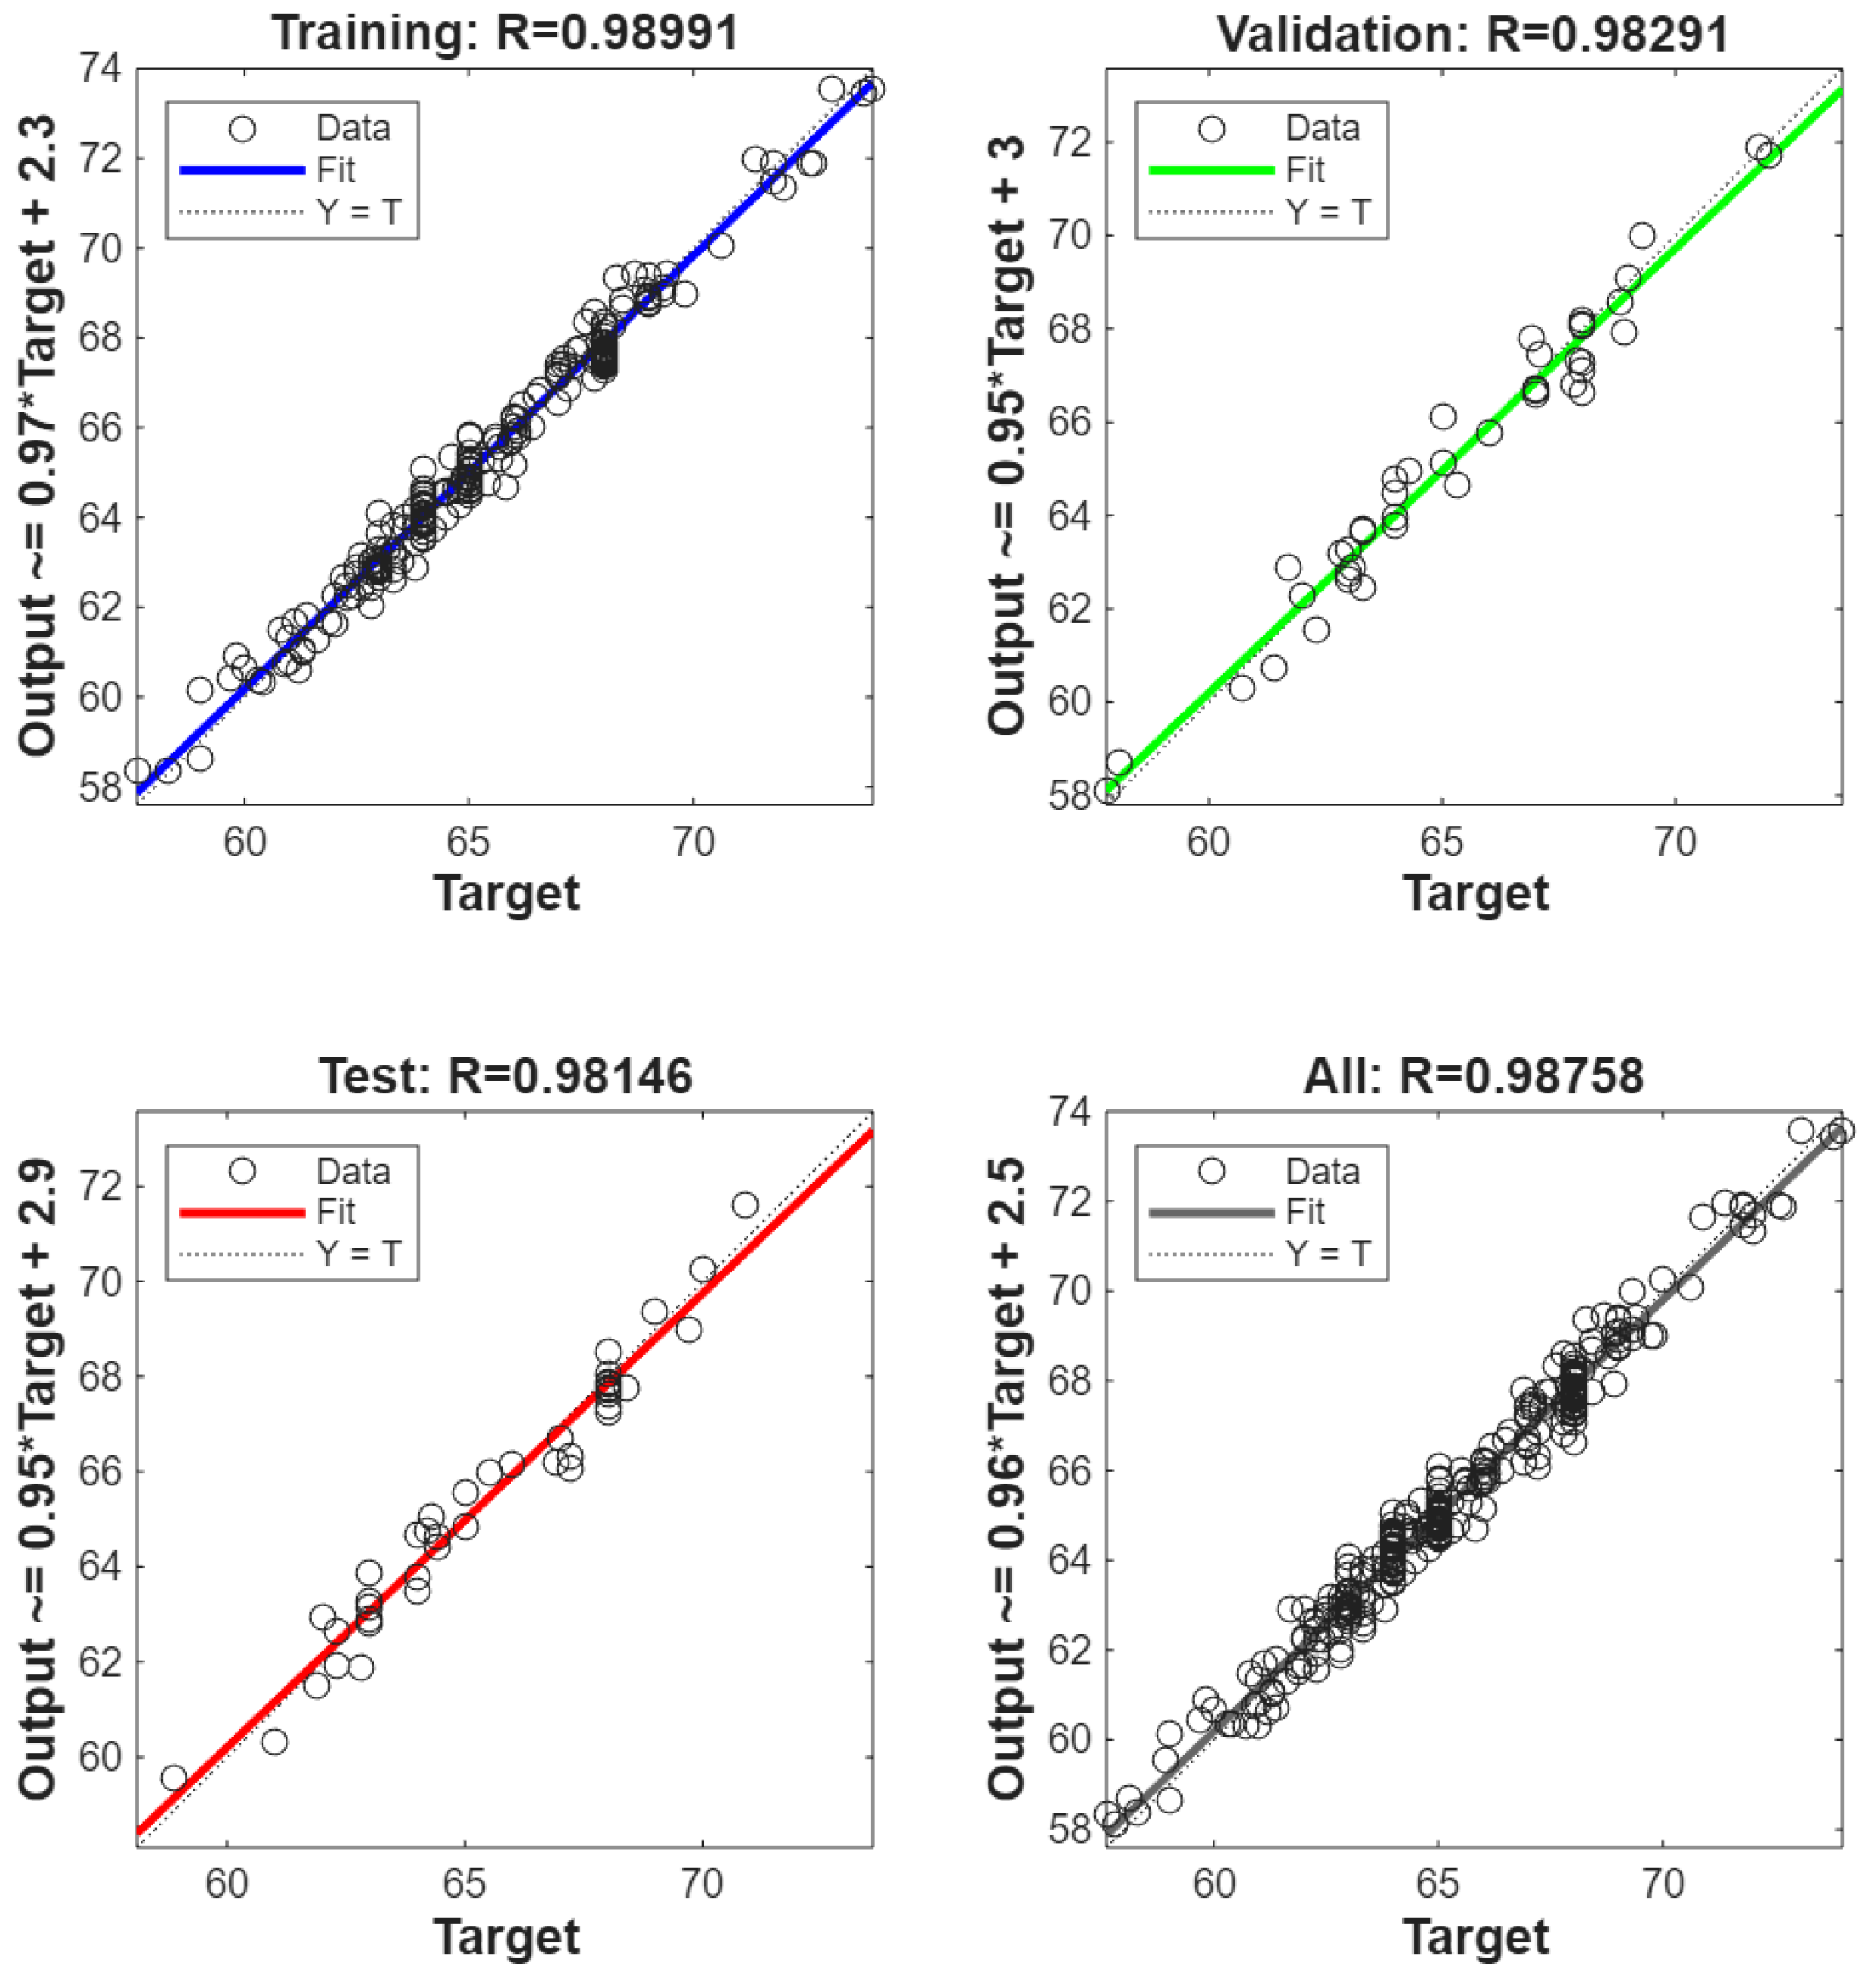
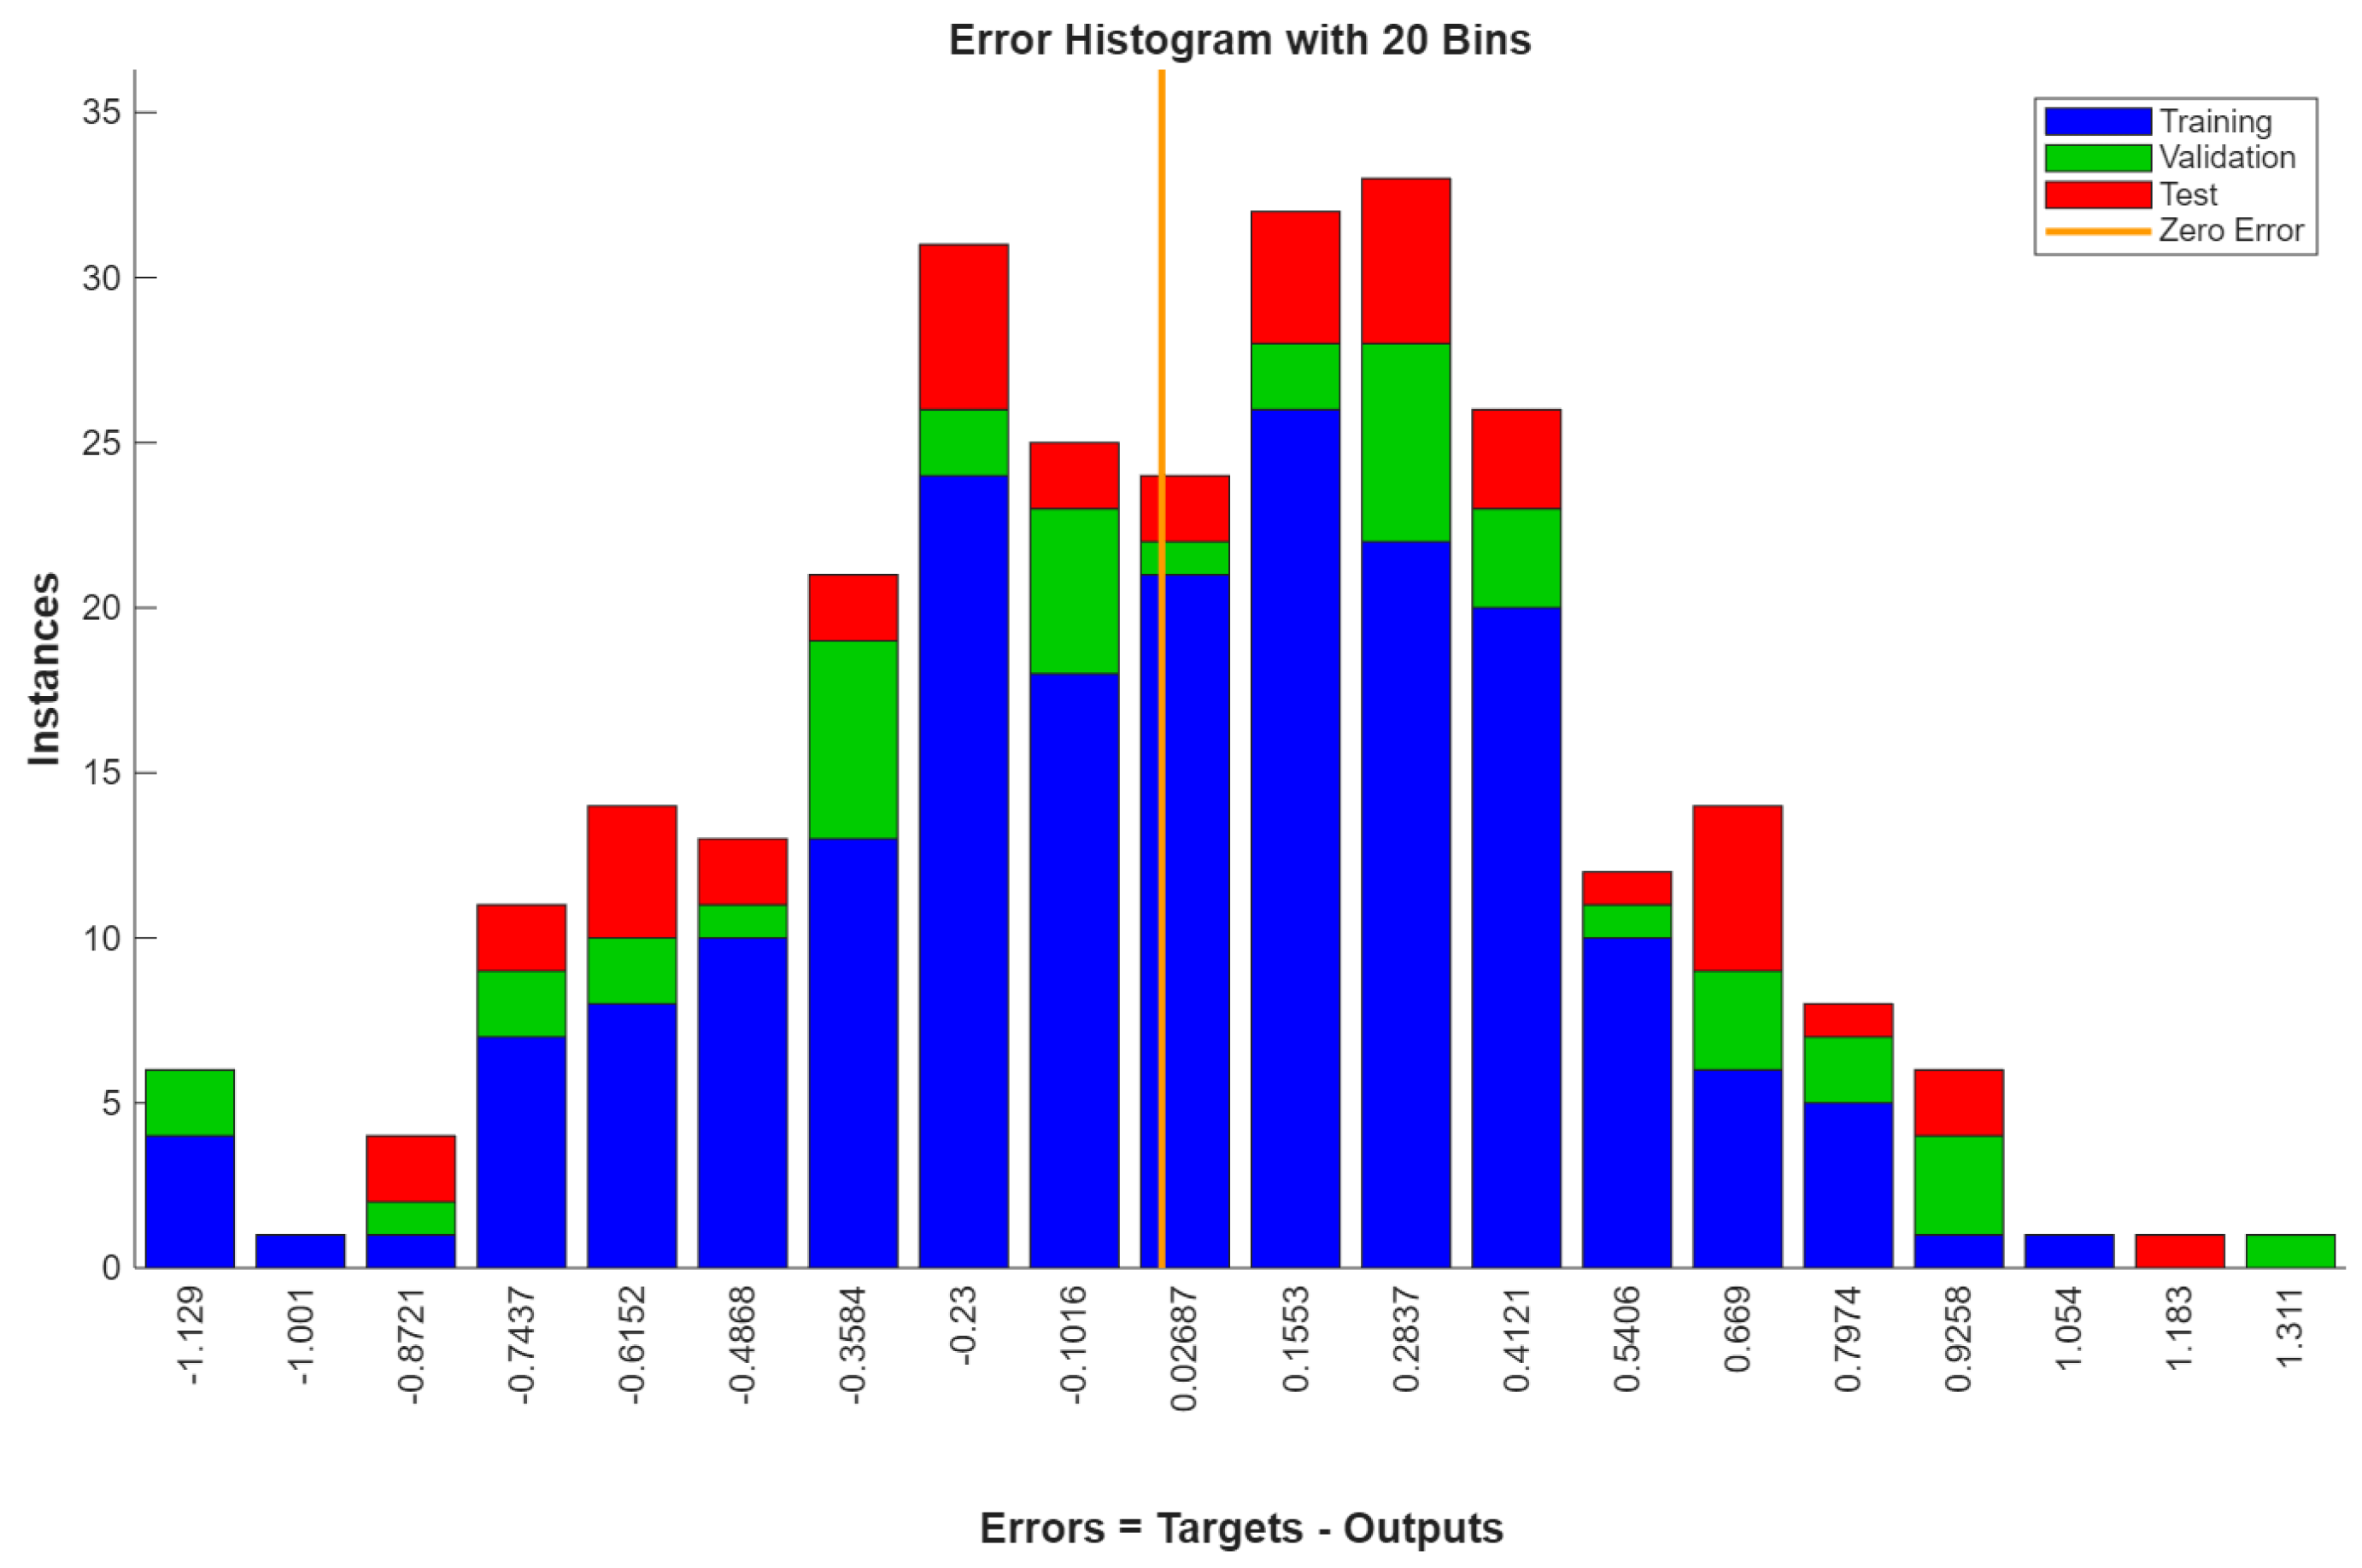
Performance is evaluated qualitatively through regression plots, error histograms, and visual comparisons between measured and estimated values, which demonstrate close agreement. The model achieved a Root Mean Square Error (RMSE) of 0.16 °C and a Mean Absolute Error (MAE) of 0.11 °C, confirming a high degree of accuracy.
Figure 9 presents four regression plots and the accompanying error histogram shown in
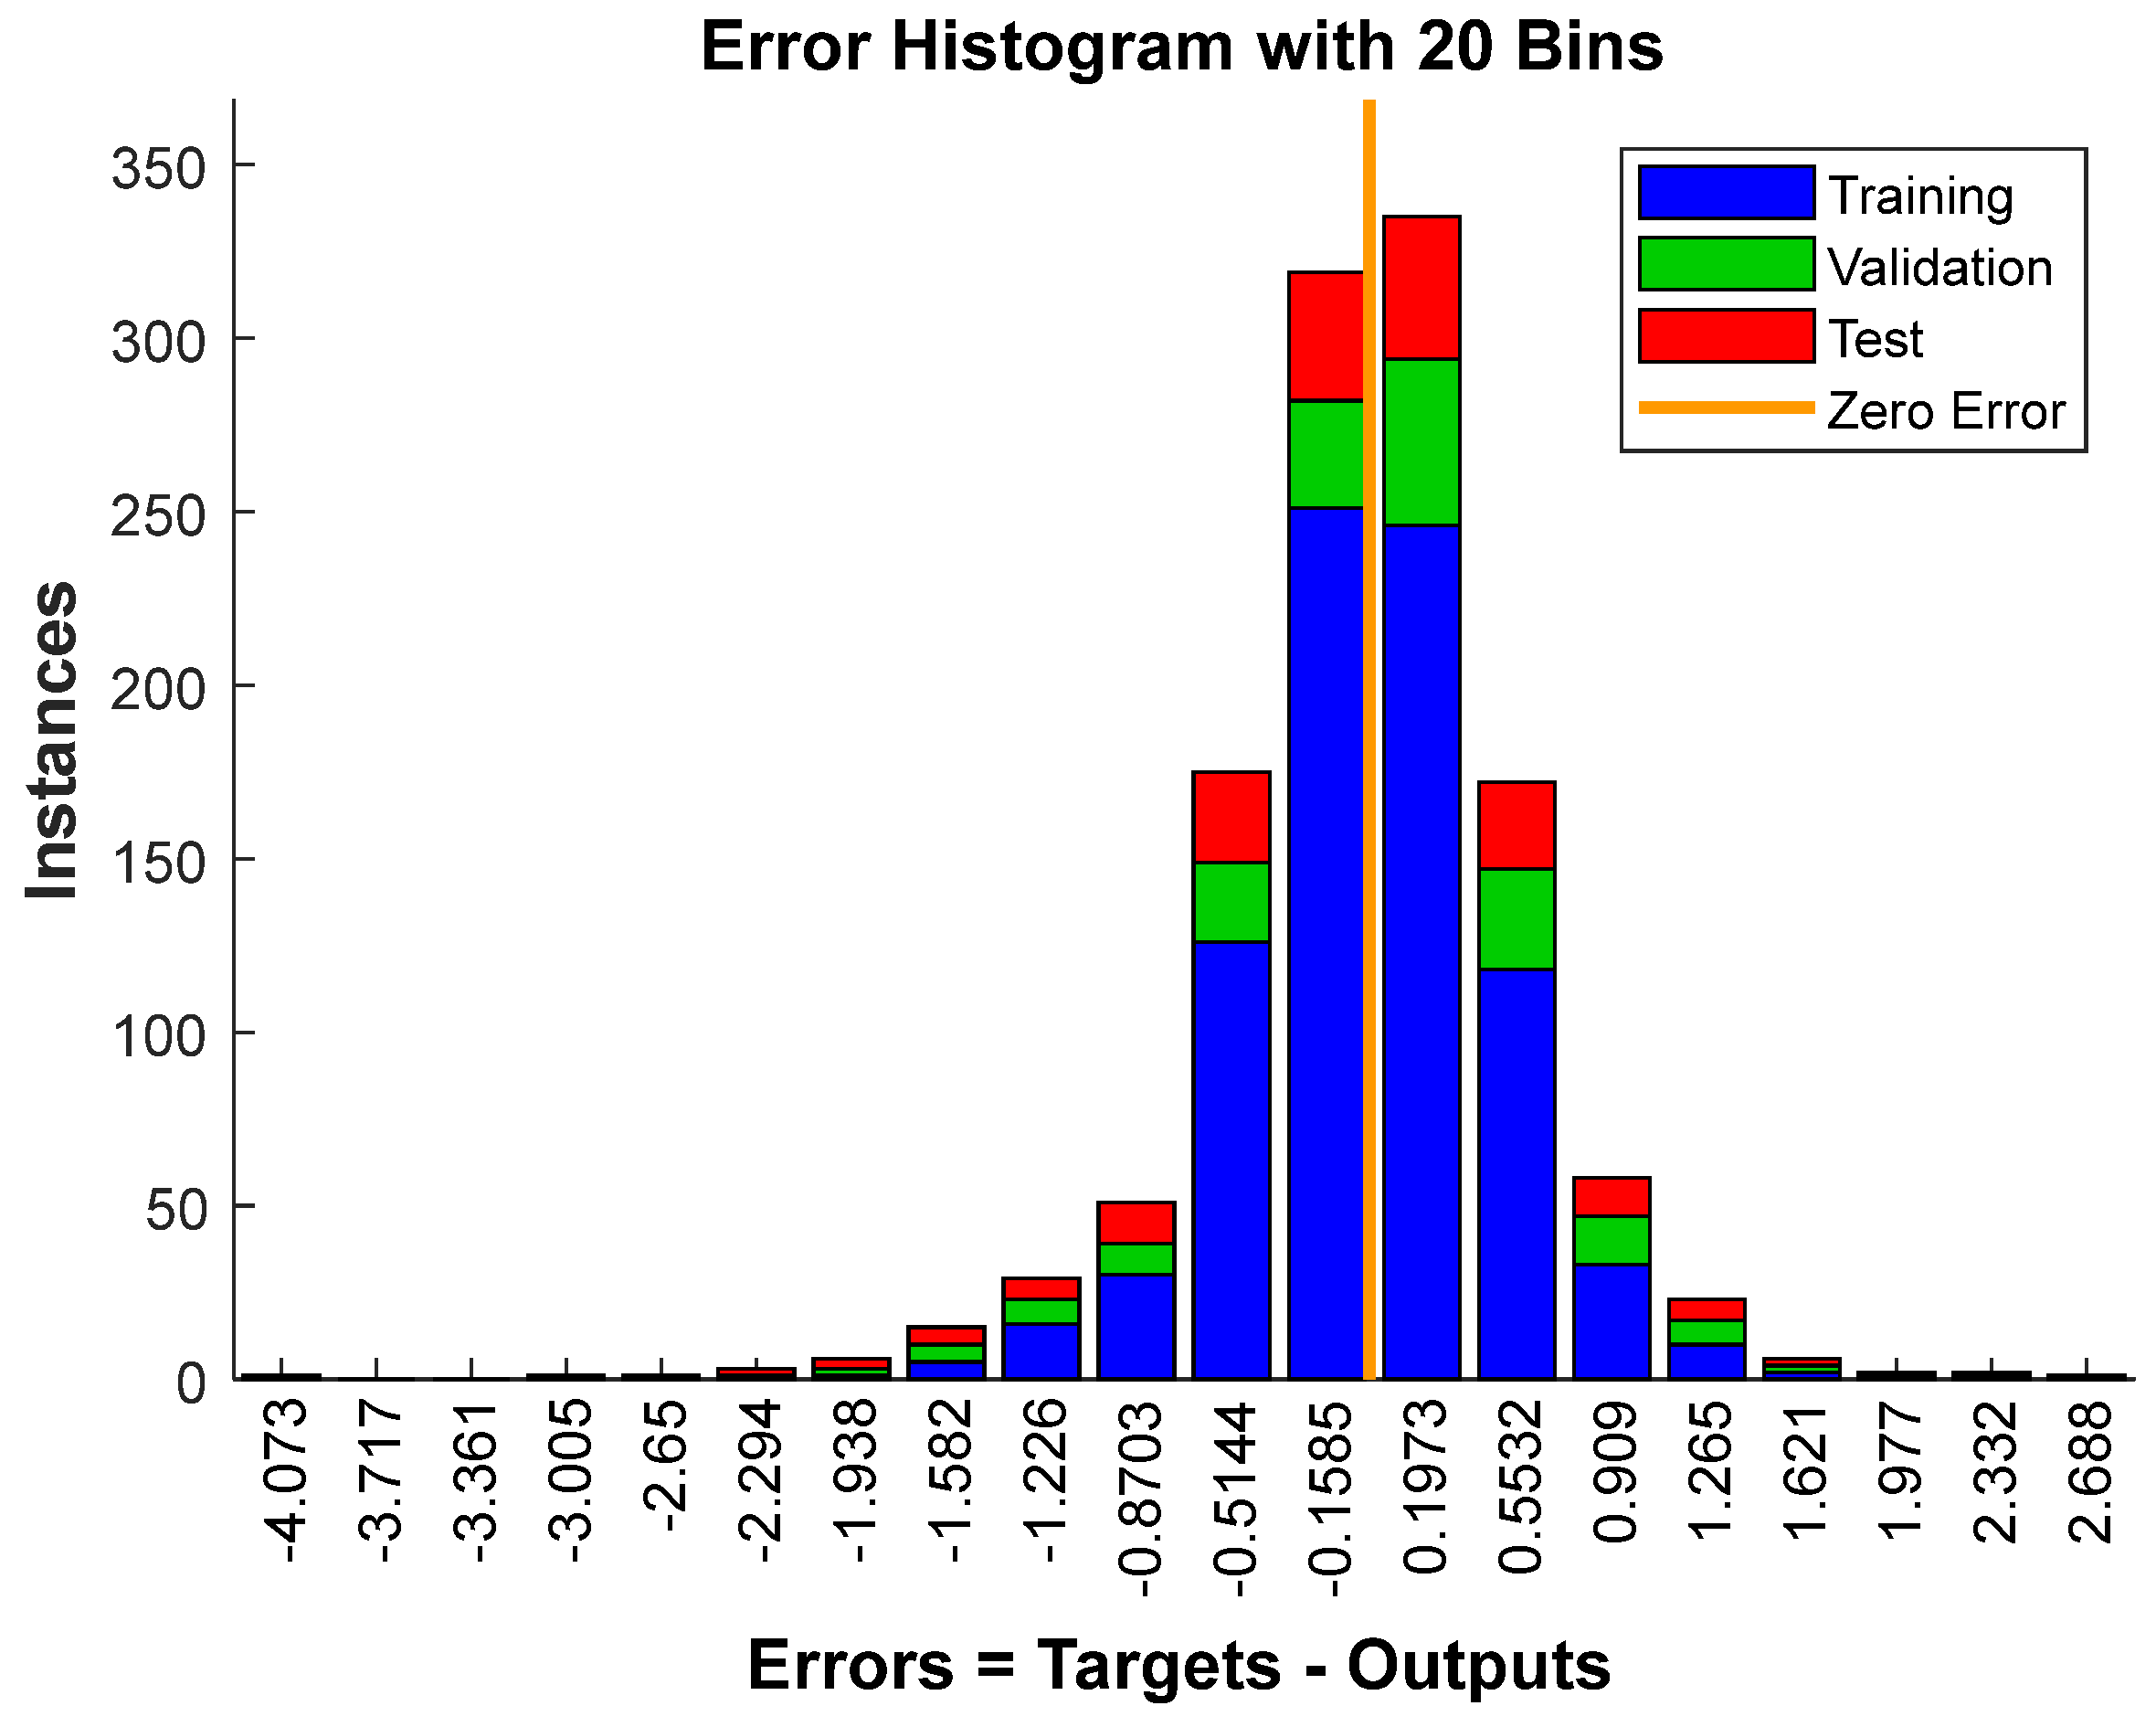
Figure 10 collectively demonstrates the performance of the ANN used for reconstructing missing data. The regression plots compare the network’s output values against the corresponding target values across training (R = 0.98891), validation (R = 0.98291), test (R = 0.98146), and combined datasets (R = 0.98758), with data points in each plot closely aligning with the ideal line of perfect estimation. The figure shows a strong linear relationship between the target values and the network’s outputs. The error histogram supports these results by displaying the distribution of prediction errors, defined as the difference between target values and network outputs, across 20 bins. The error distribution is approximately symmetric around zero, with the majority of errors concentrated in bins between −0.2 and +0.2. This narrow spread of errors, combined with the consistently high correlation coefficients across all data subsets, demonstrates that the ANN effectively captures the relationship between the input data from the nine operational sensors and the target values from the malfunctioning sensor, producing predictions that are closely aligned with the expected values and thereby validating the accuracy and reliability of the reconstructed missing data. While this reconstruction process ensures a complete dataset for subsequent analysis, it is important to acknowledge that it introduces a minor degree of uncertainty. This uncertainty, although small, may propagate to the downstream predictive models. However, given the high accuracy of the reconstruction, its impact on the final temperature prediction is considered minimal, though it remains a factor in the overall error margin of the system.
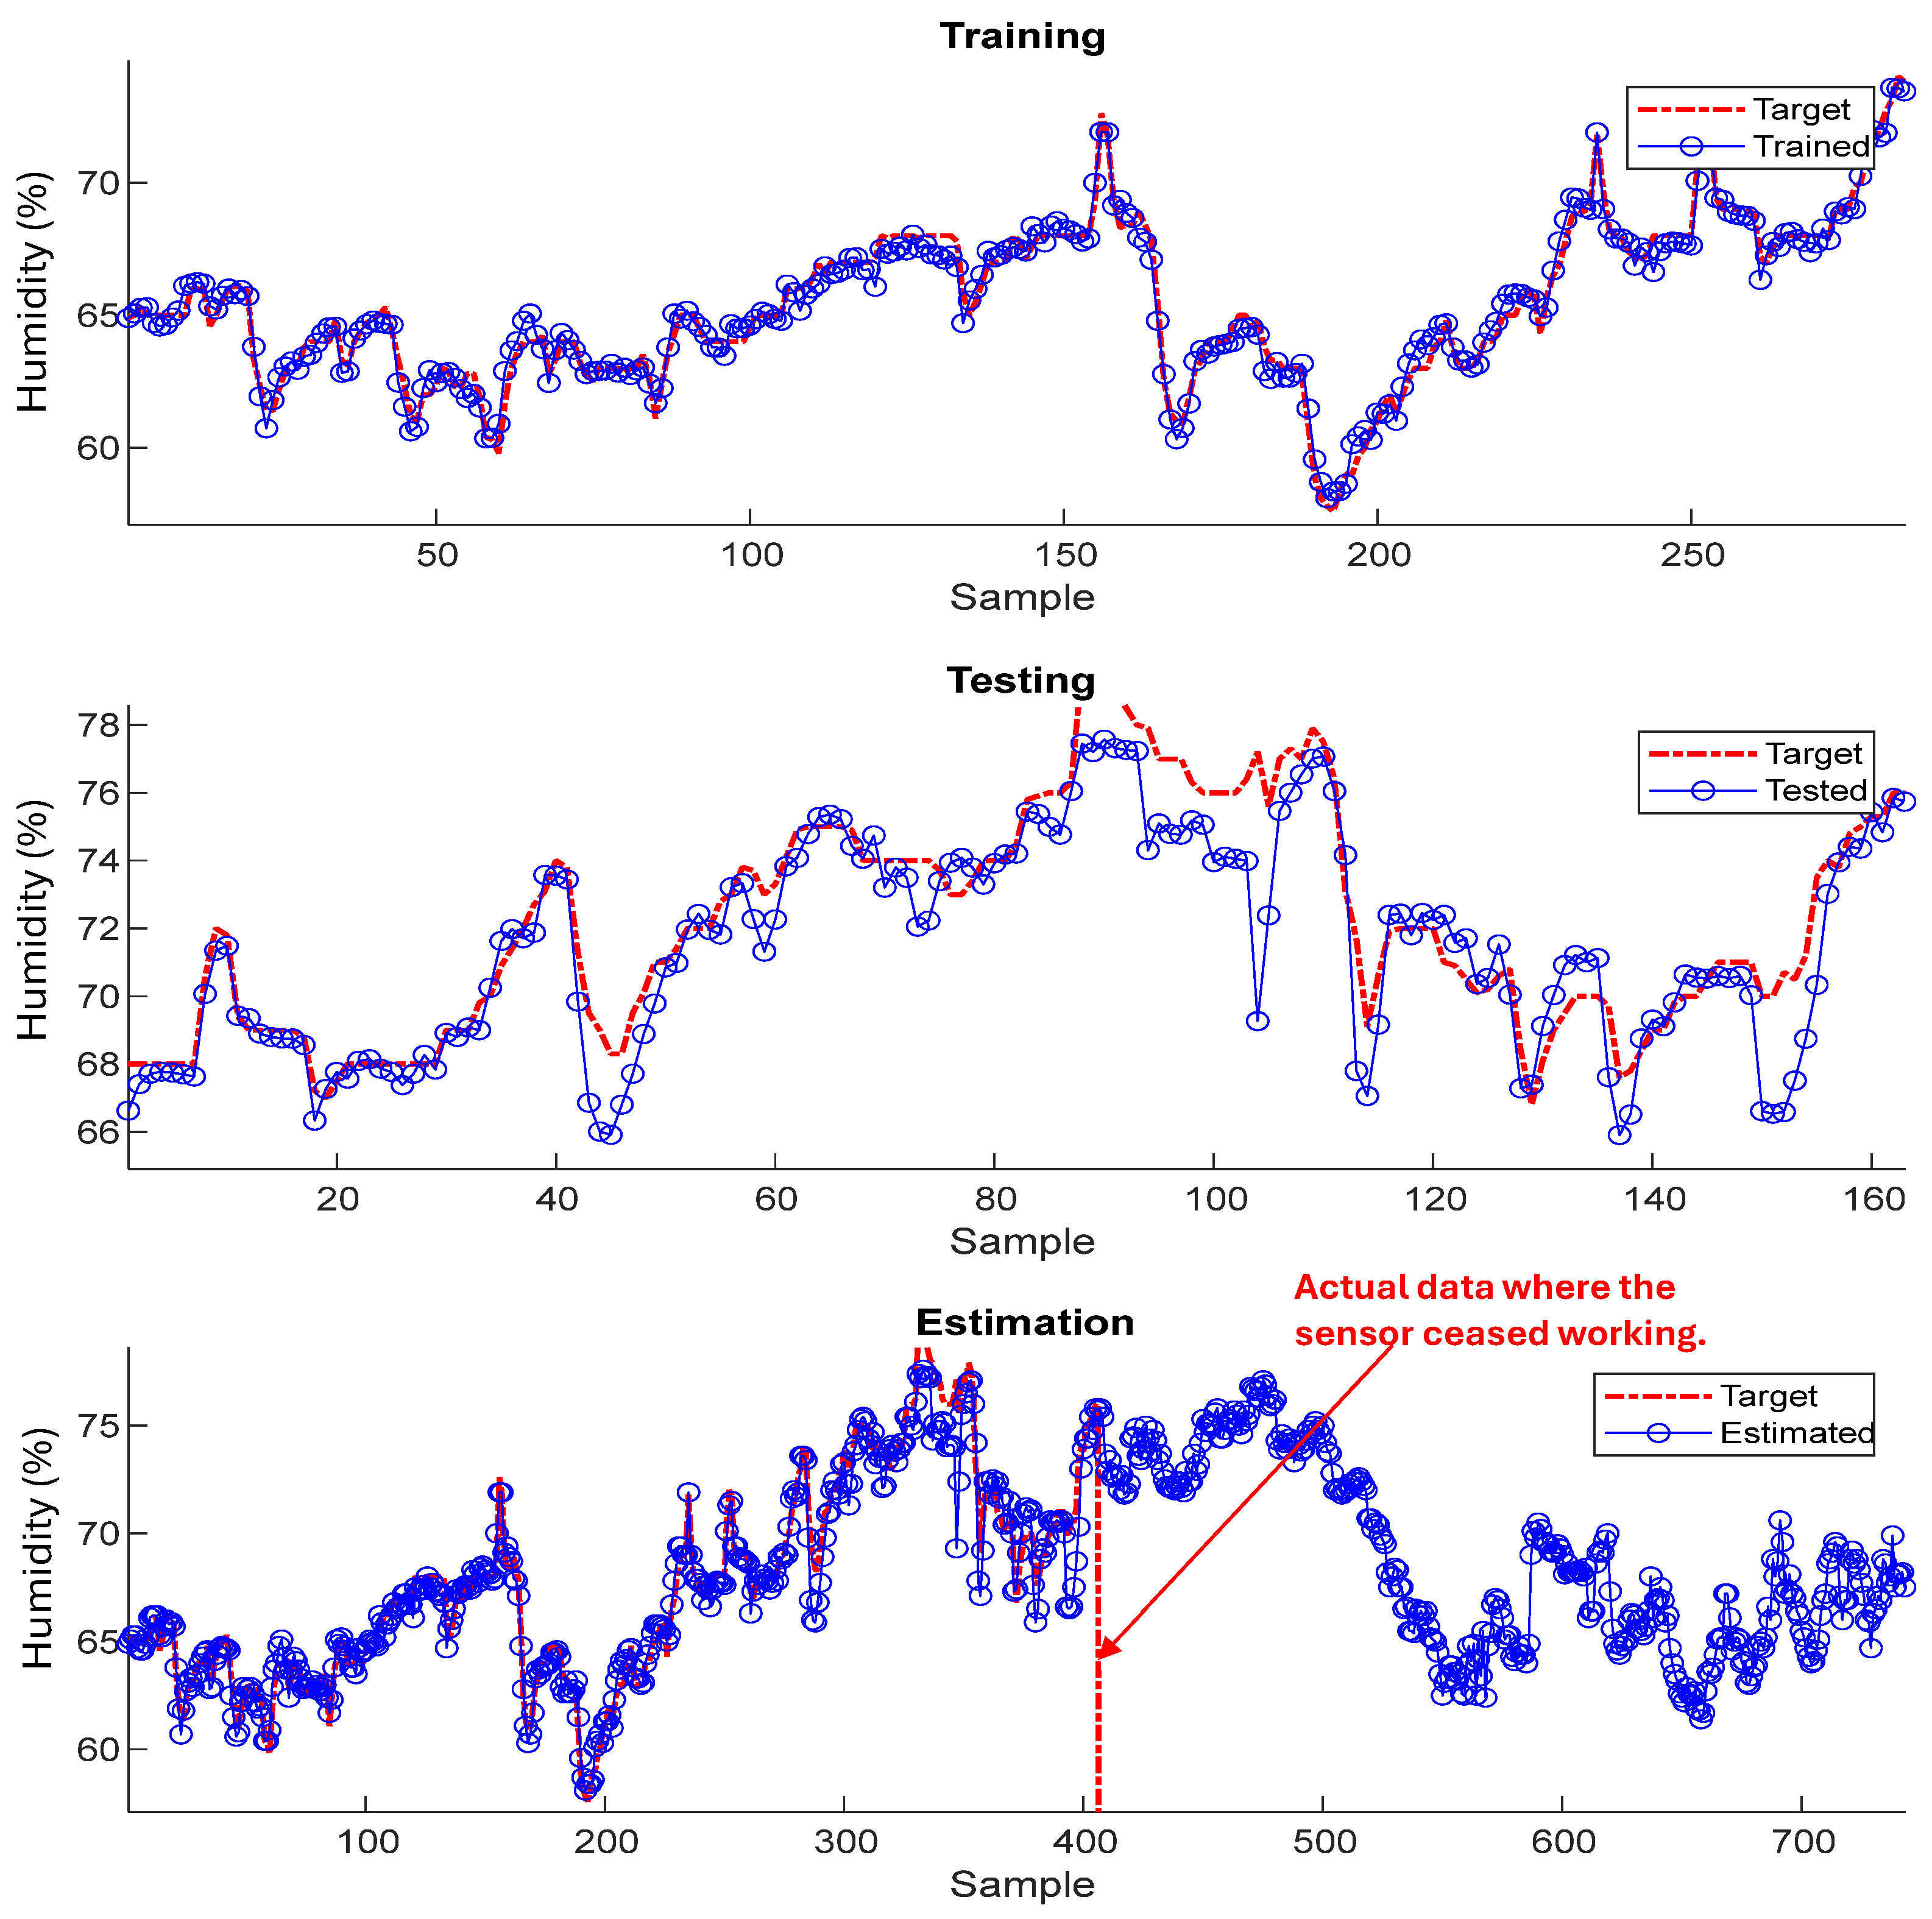
Figure 11 shows the training and testing outcomes of the ANN for a representative sensor, confirming model accuracy and generalisation performance. The third subplot in the figure displays the complete estimation process, showing both the original target (red dotted line) data from the faulty sensor and the estimated values generated by the network. The target data exhibits a prominent gap where measurements ceased, as indicated by the discontinuity in the red line. The estimated values, represented by the blue line, successfully fill this gap, demonstrating a seamless transition between the existing healthy data and the reconstructed portion. The close correspondence between the estimated values and the surrounding healthy data indicates that the neural network effectively captured the relationships between the nine operational sensors and the faulty sensor, enabling the generation of plausible and consistent estimates for the missing measurements.
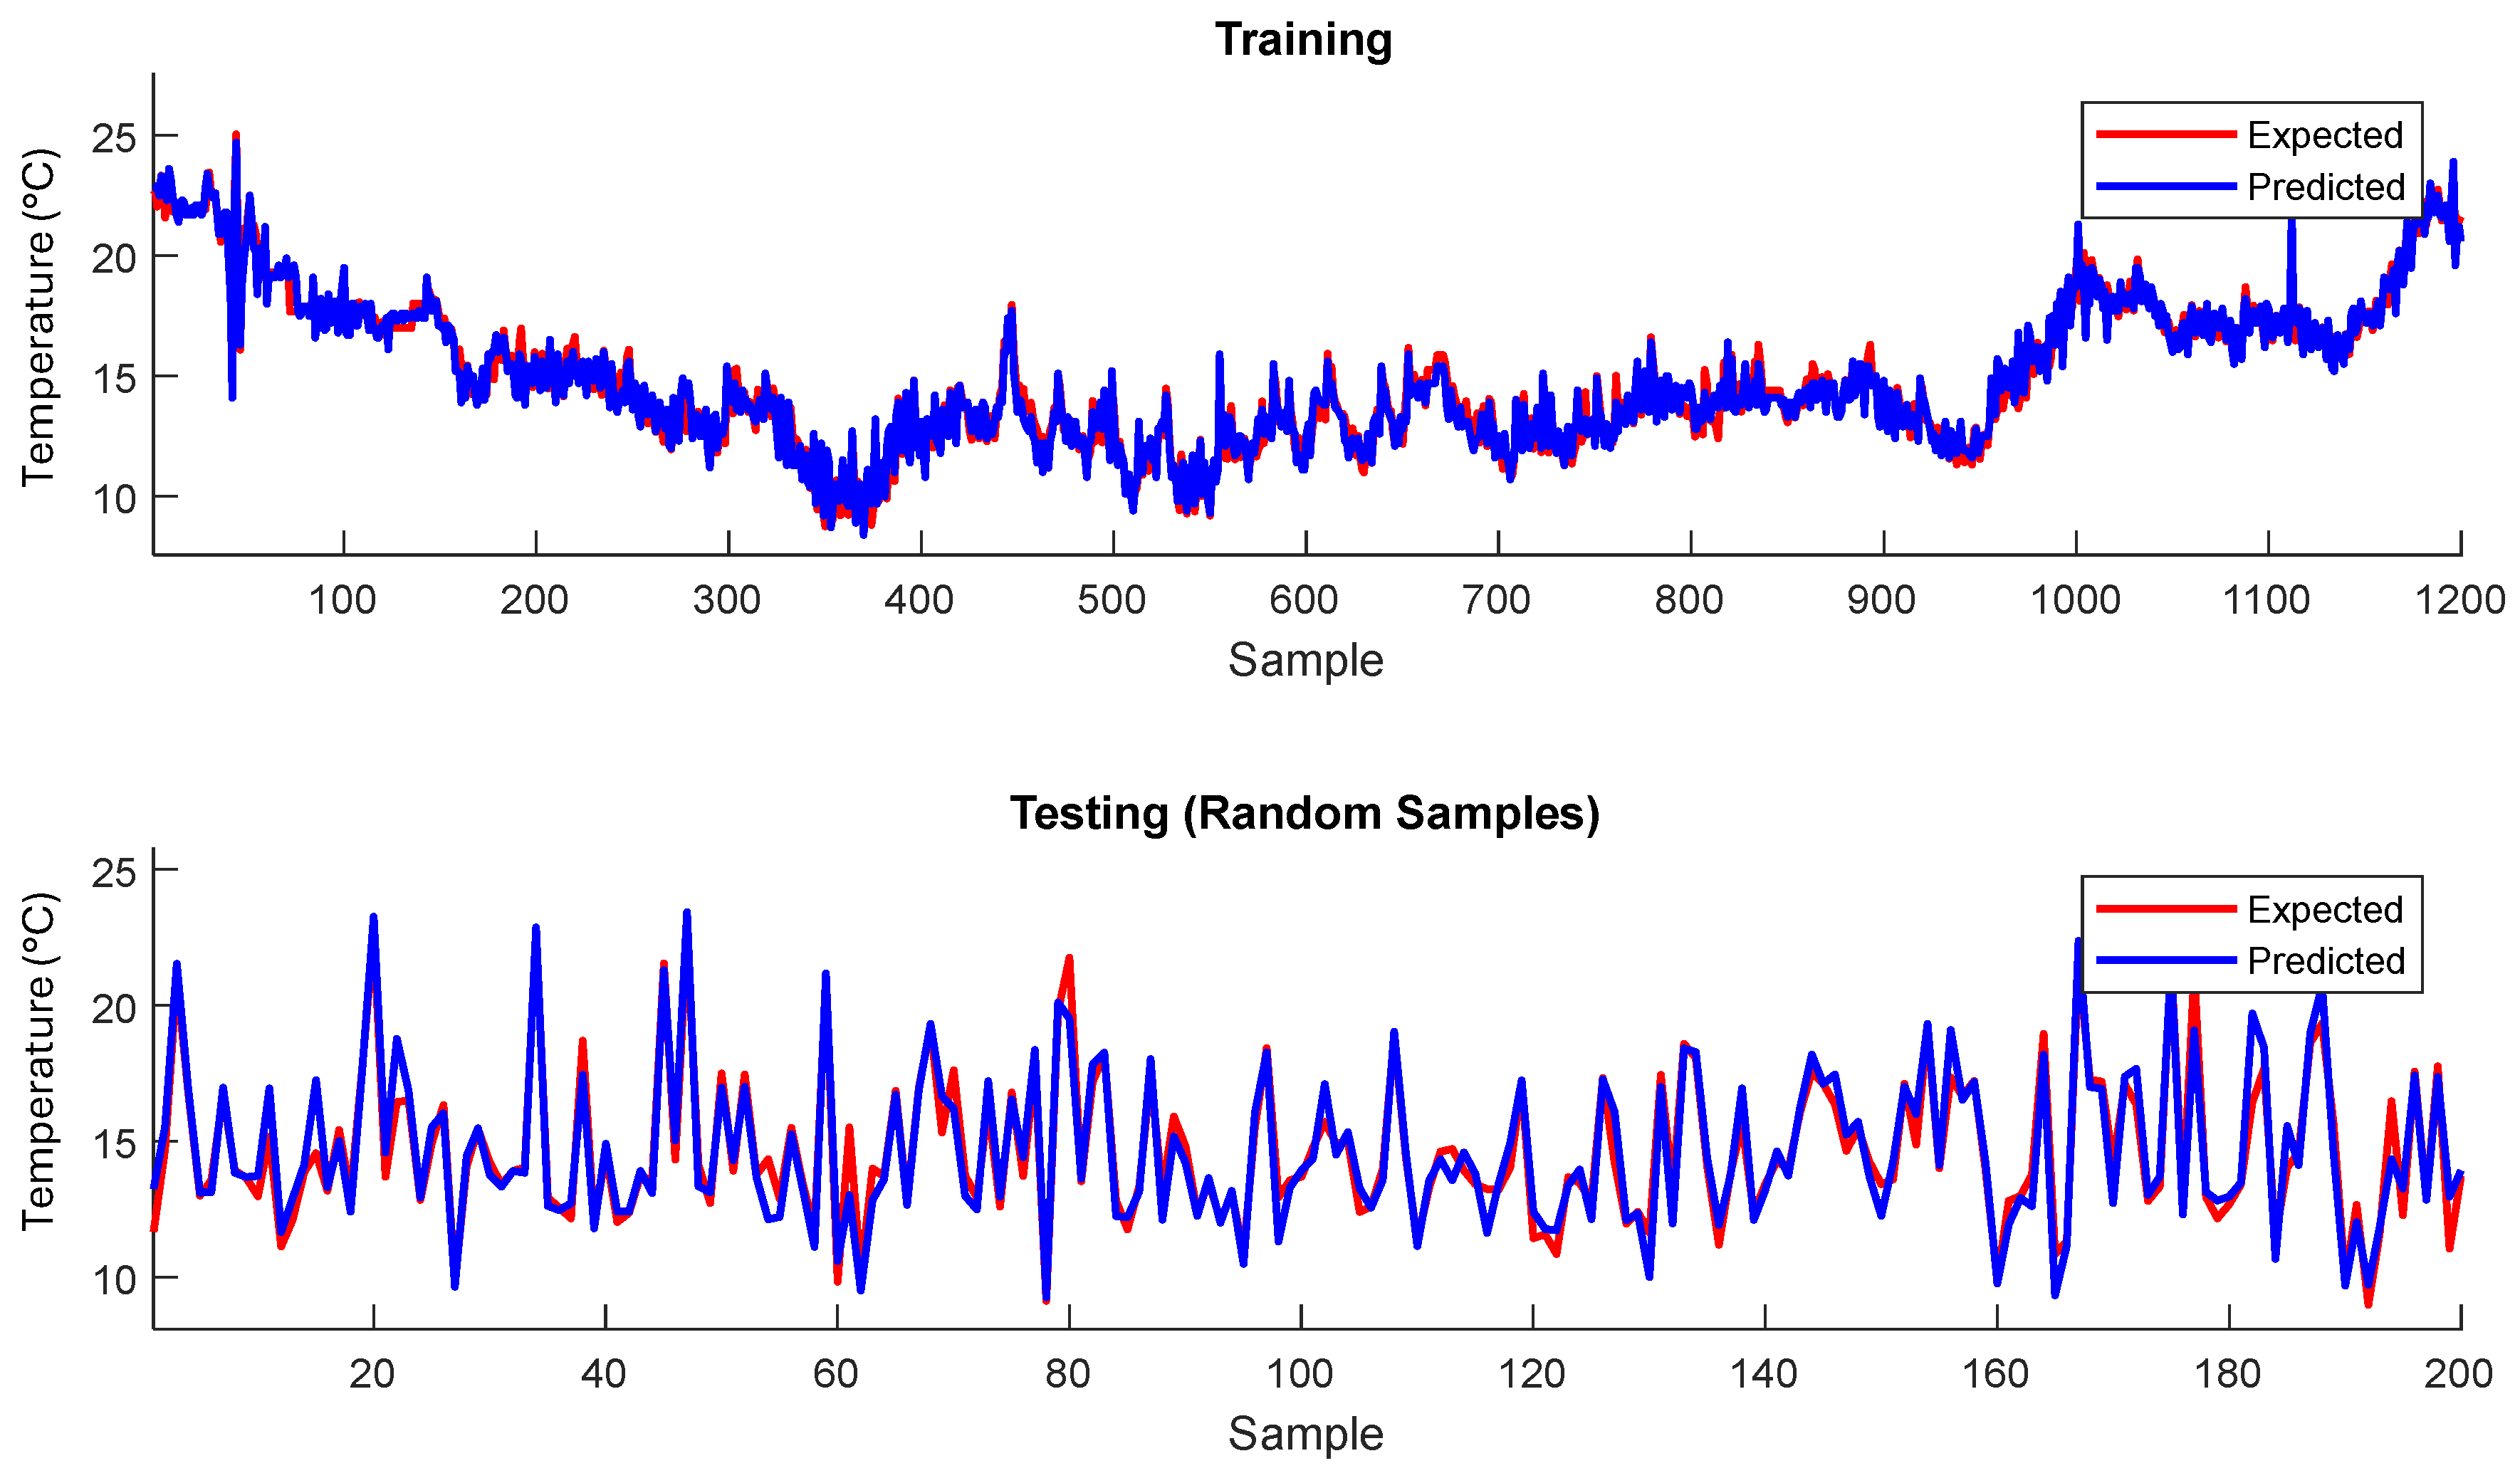
The effectiveness of the neural network in estimating missing data was validated through multiple evaluation procedures, including testing on randomly selected samples as shown in
Figure 12. The results demonstrate that the predicted values closely match the expected values across both sequential test data and randomly selected samples. This close correspondence between predicted and expected values, particularly in the random sample testing, confirms that the neural network has successfully captured the underlying relationships between the operational sensors and the malfunctioning sensors. The consistent performance on randomly selected data indicates that the network’s estimation capability is robust and not dependent on temporal ordering, thereby validating the reliability of the reconstructed data for subsequent analysis and modelling tasks.
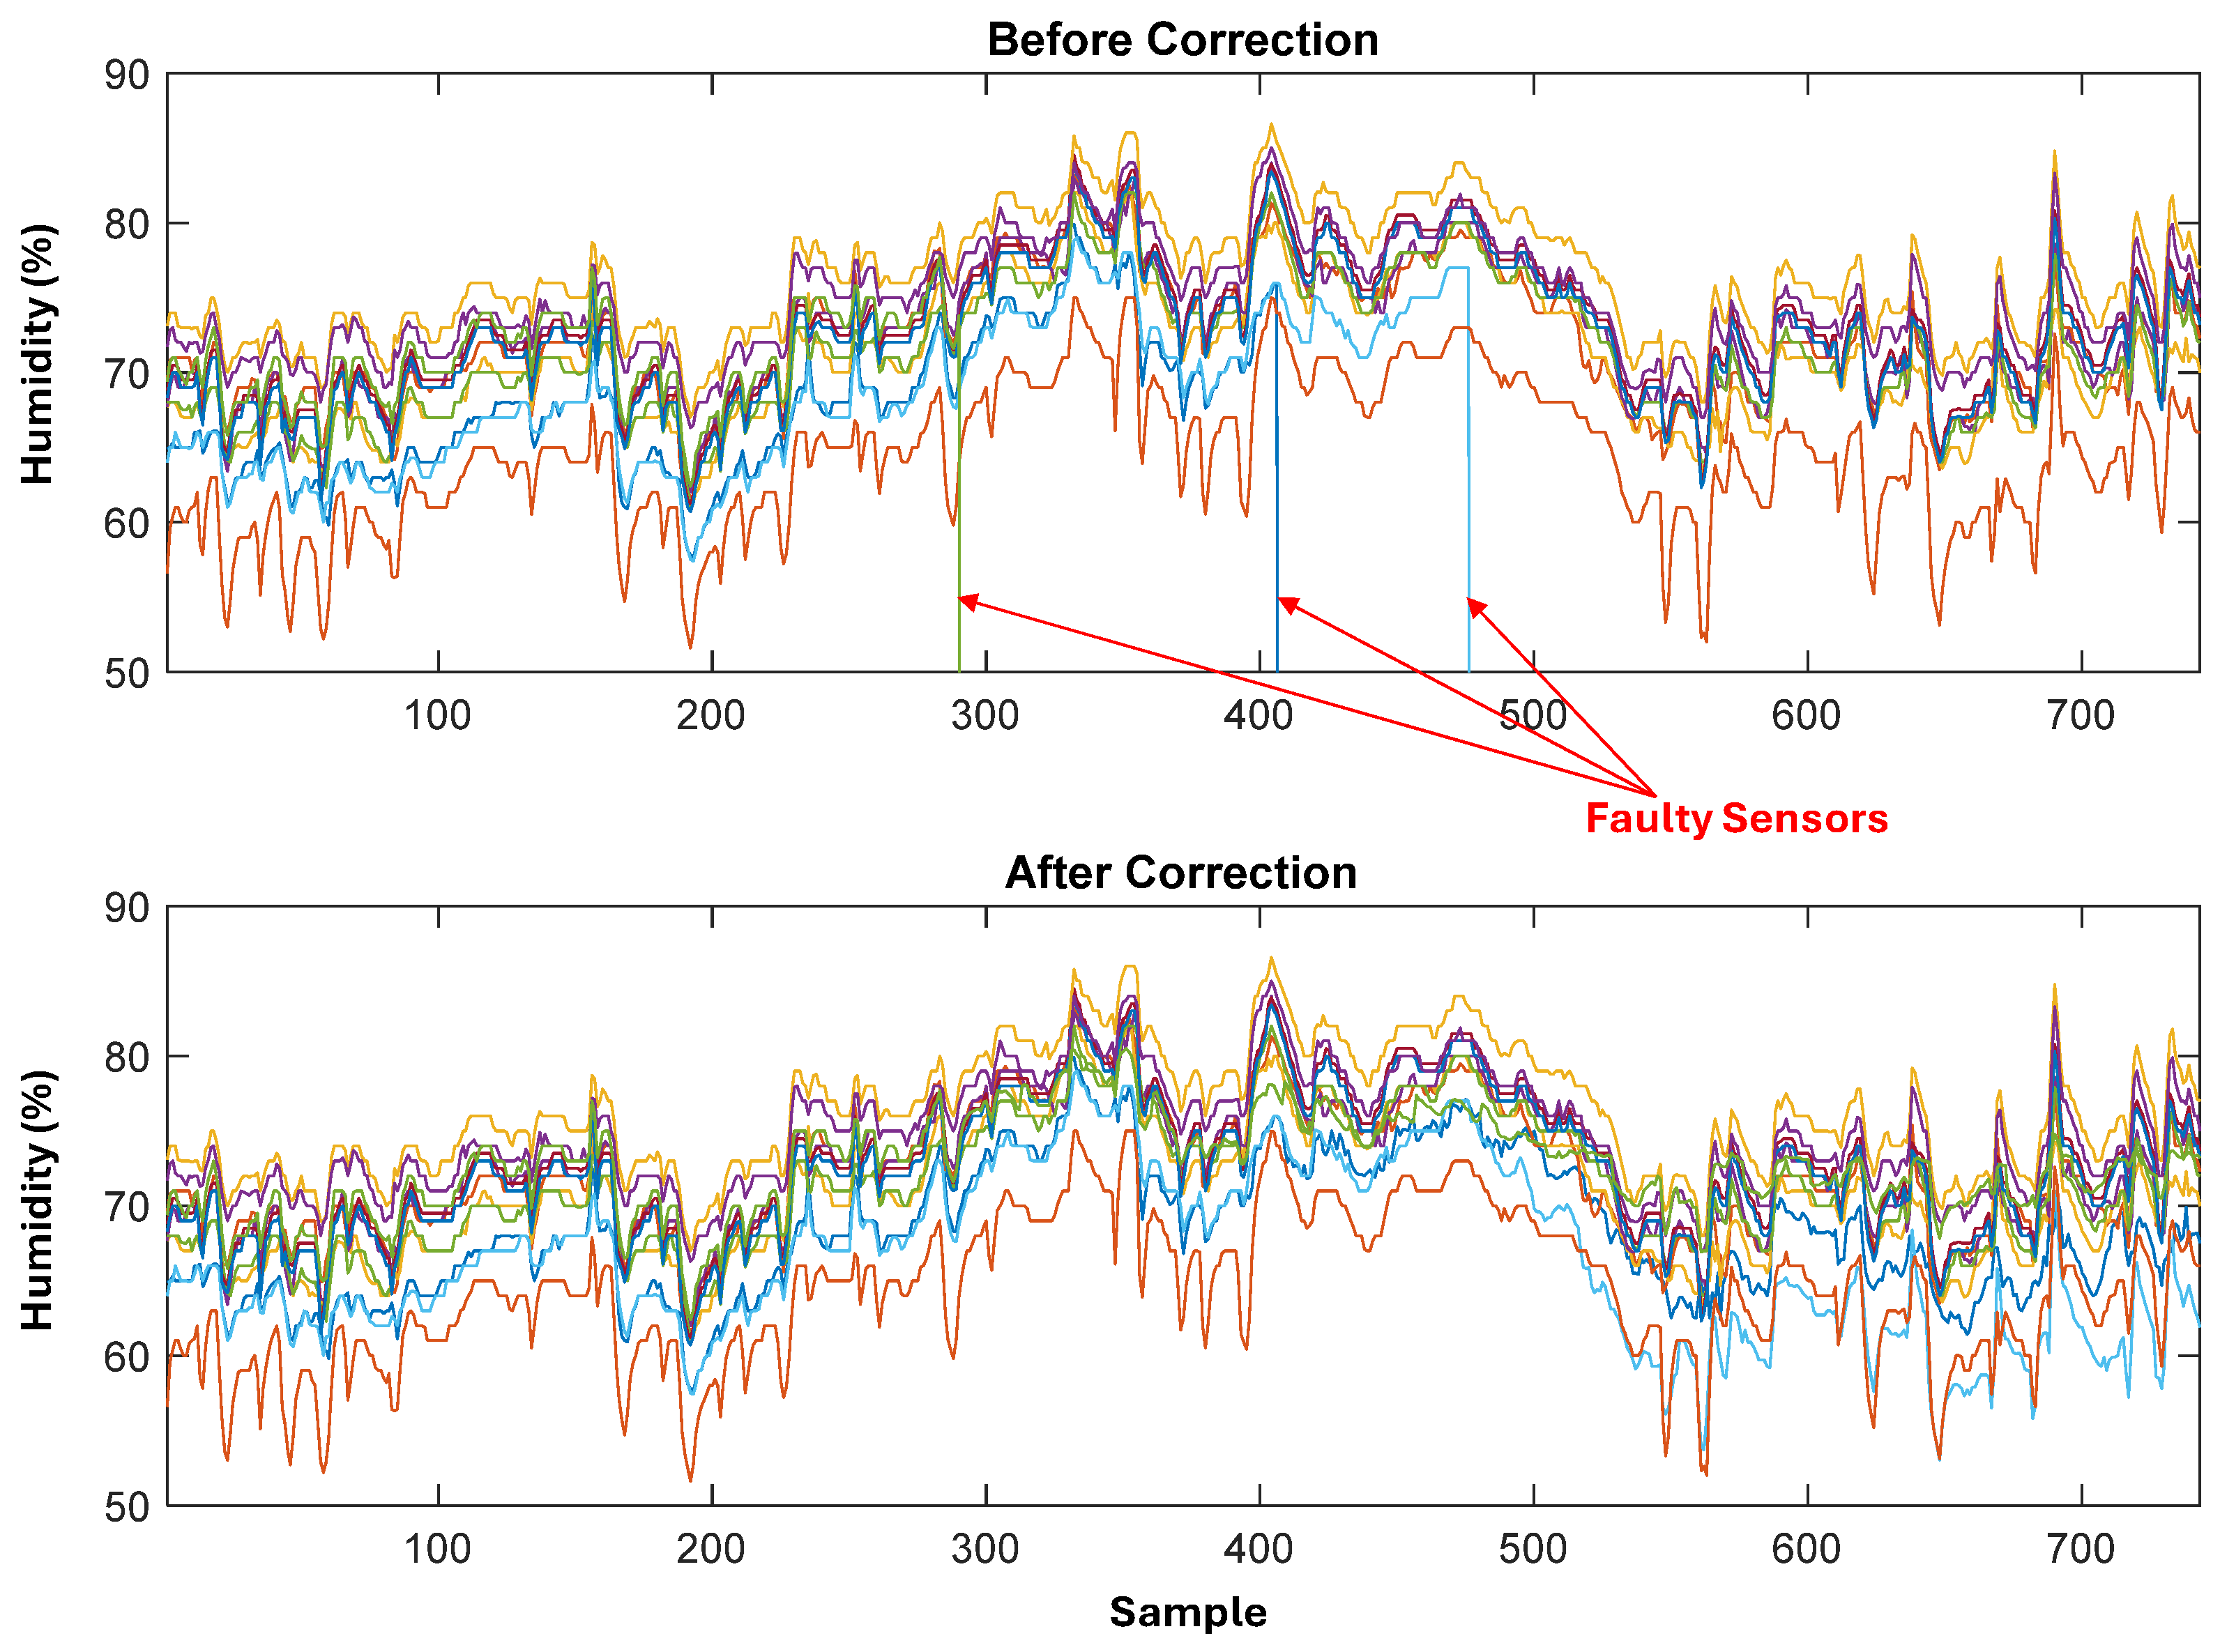
Figure 13 illustrates the effectiveness of the artificial neural network-based data reconstruction process. The upper subplot shows the original dataset with clear gaps in the time series corresponding to three malfunctioning sensors, where data collection ceased, resulting in prominent discontinuities around samples 300–600. The lower subplot displays the dataset after reconstruction, in which these gaps have been filled with estimated values generated by the used neural network trained for each faulty sensor. The estimated values seamlessly integrate with the existing healthy data, producing continuous time series across all twelve sensors without visible discontinuities. This demonstrates that the neural network successfully captured the relationships between the nine operational sensors and the three malfunctioning sensors, enabling the generation of reasonable and consistent estimates that maintain the characteristic patterns and trends of the original data.
After data reconstruction, a systematic cleaning process was applied to remove noise and outliers. Extreme values resulting from sensor drift or environmental interference were filtered using a ±3 standard deviation threshold. The remaining data were normalised and averaged to prepare for predictive analysis.
4.2. Data Correlations and Trends
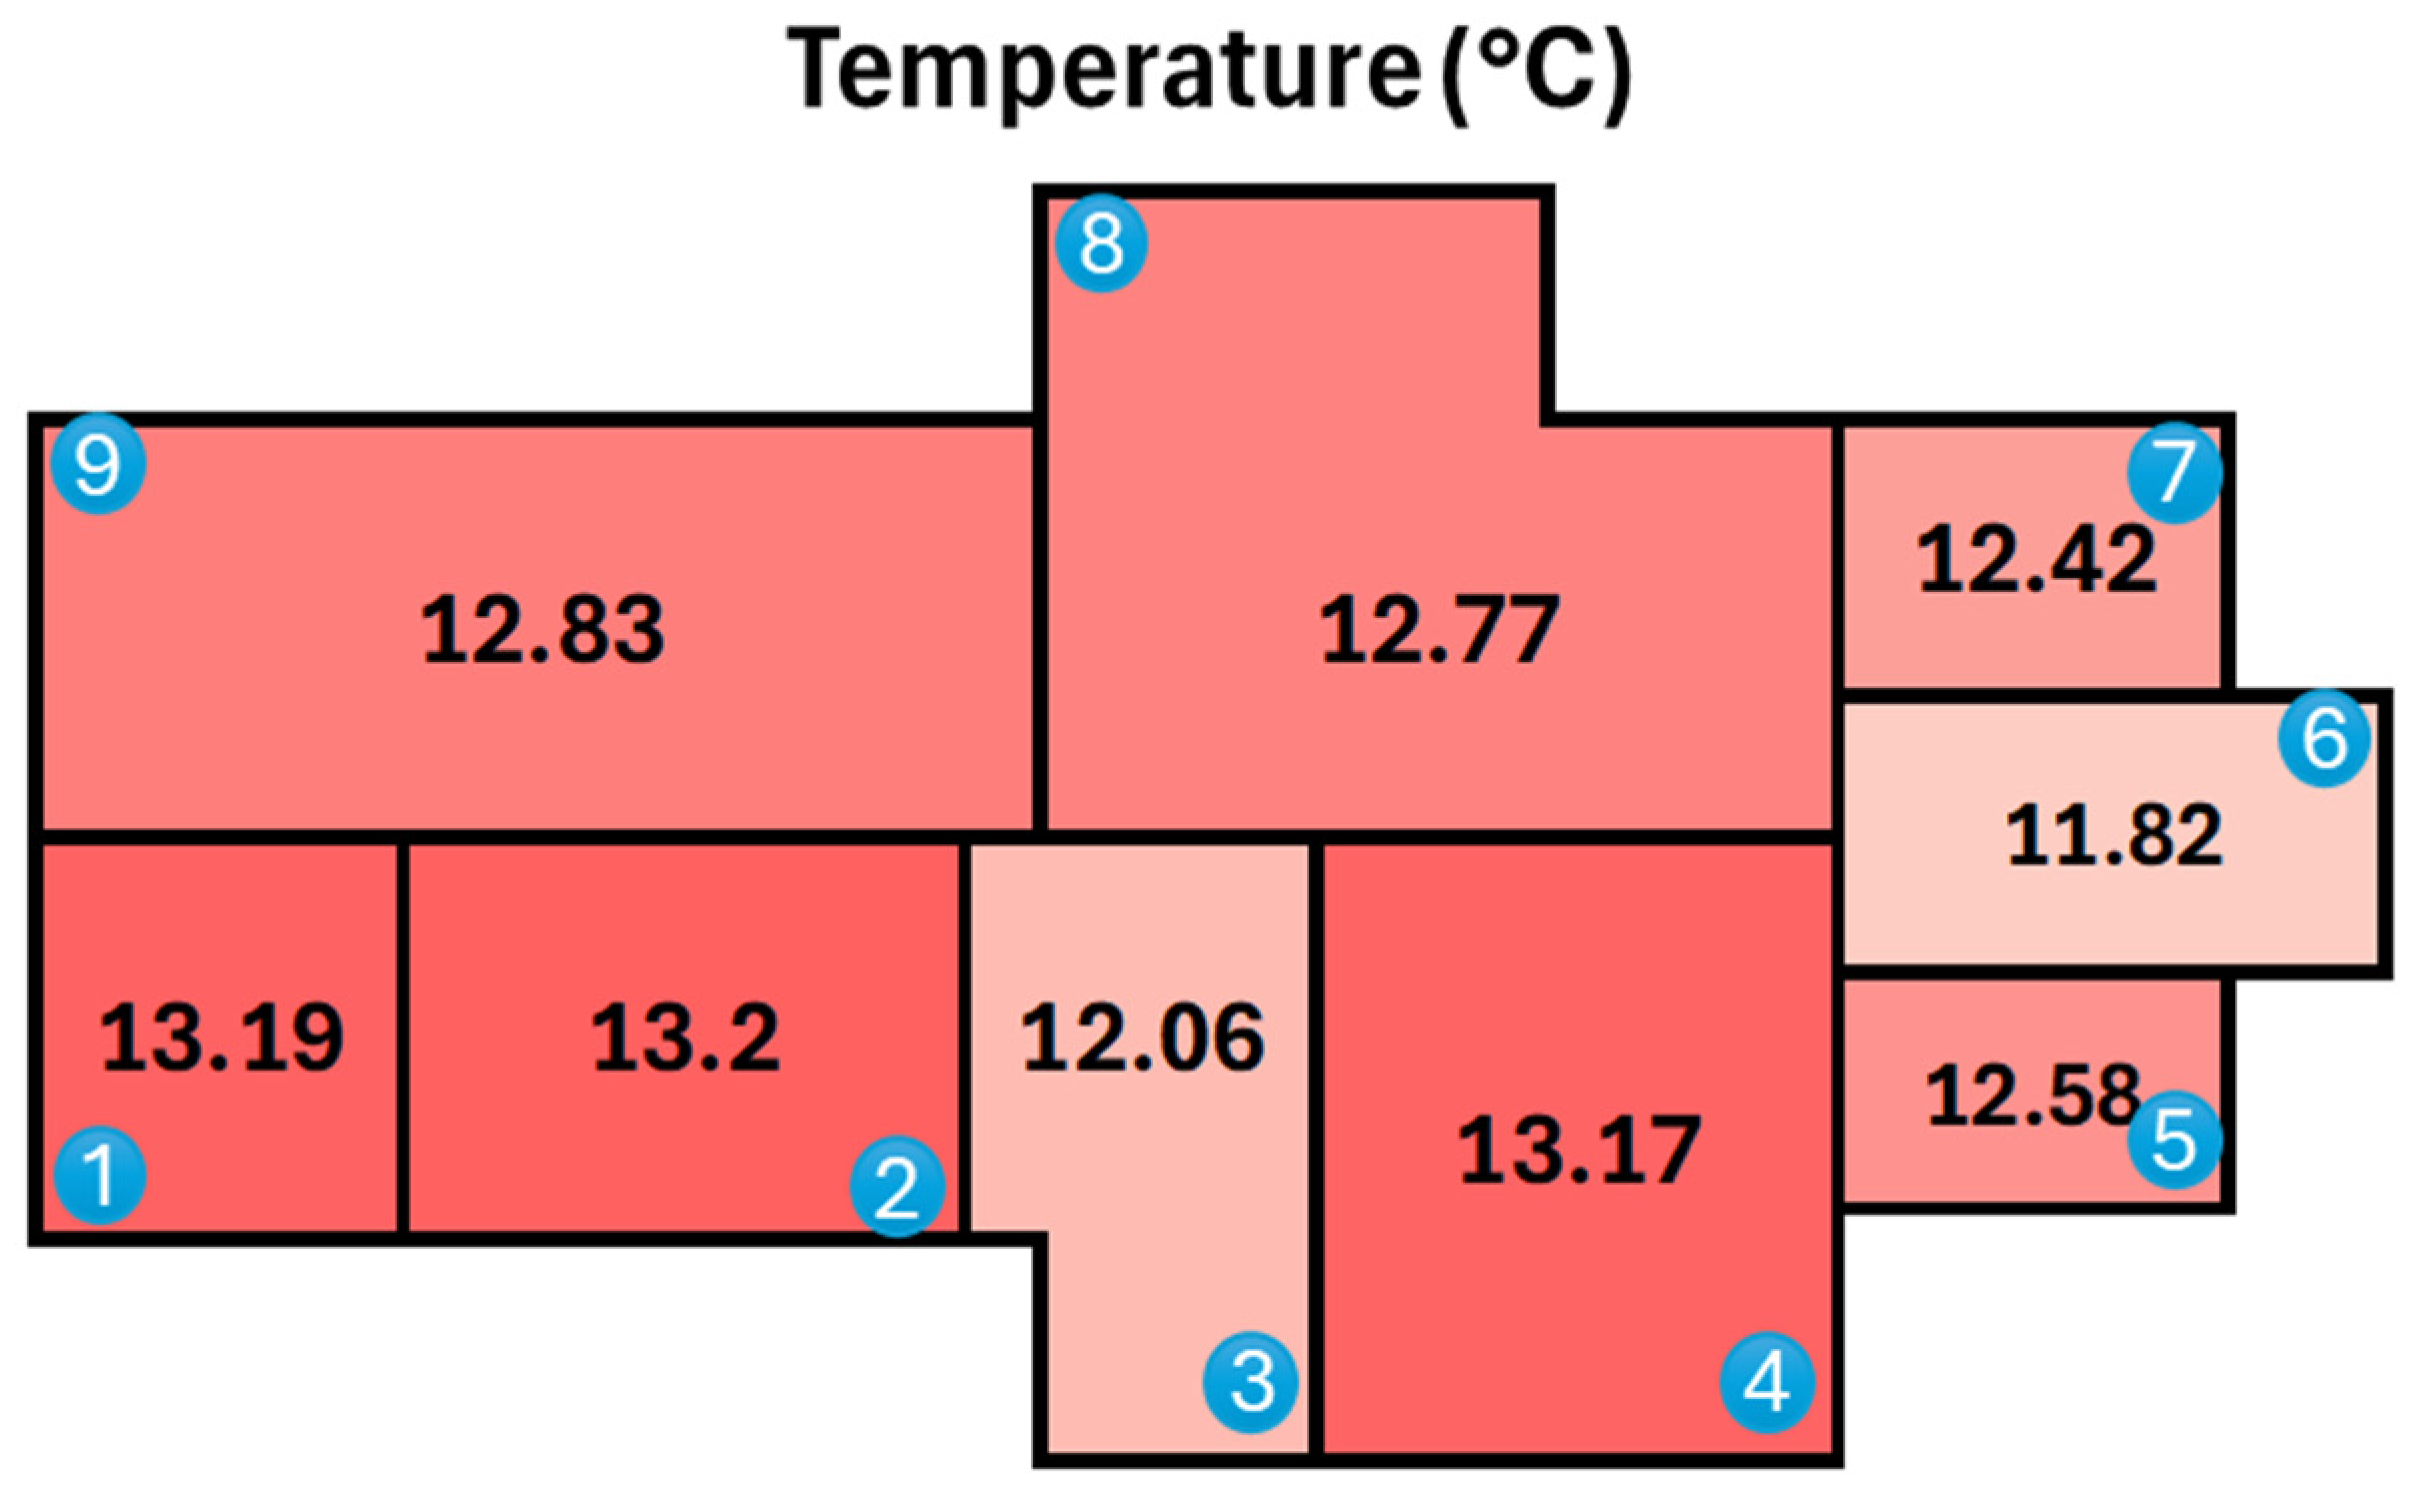
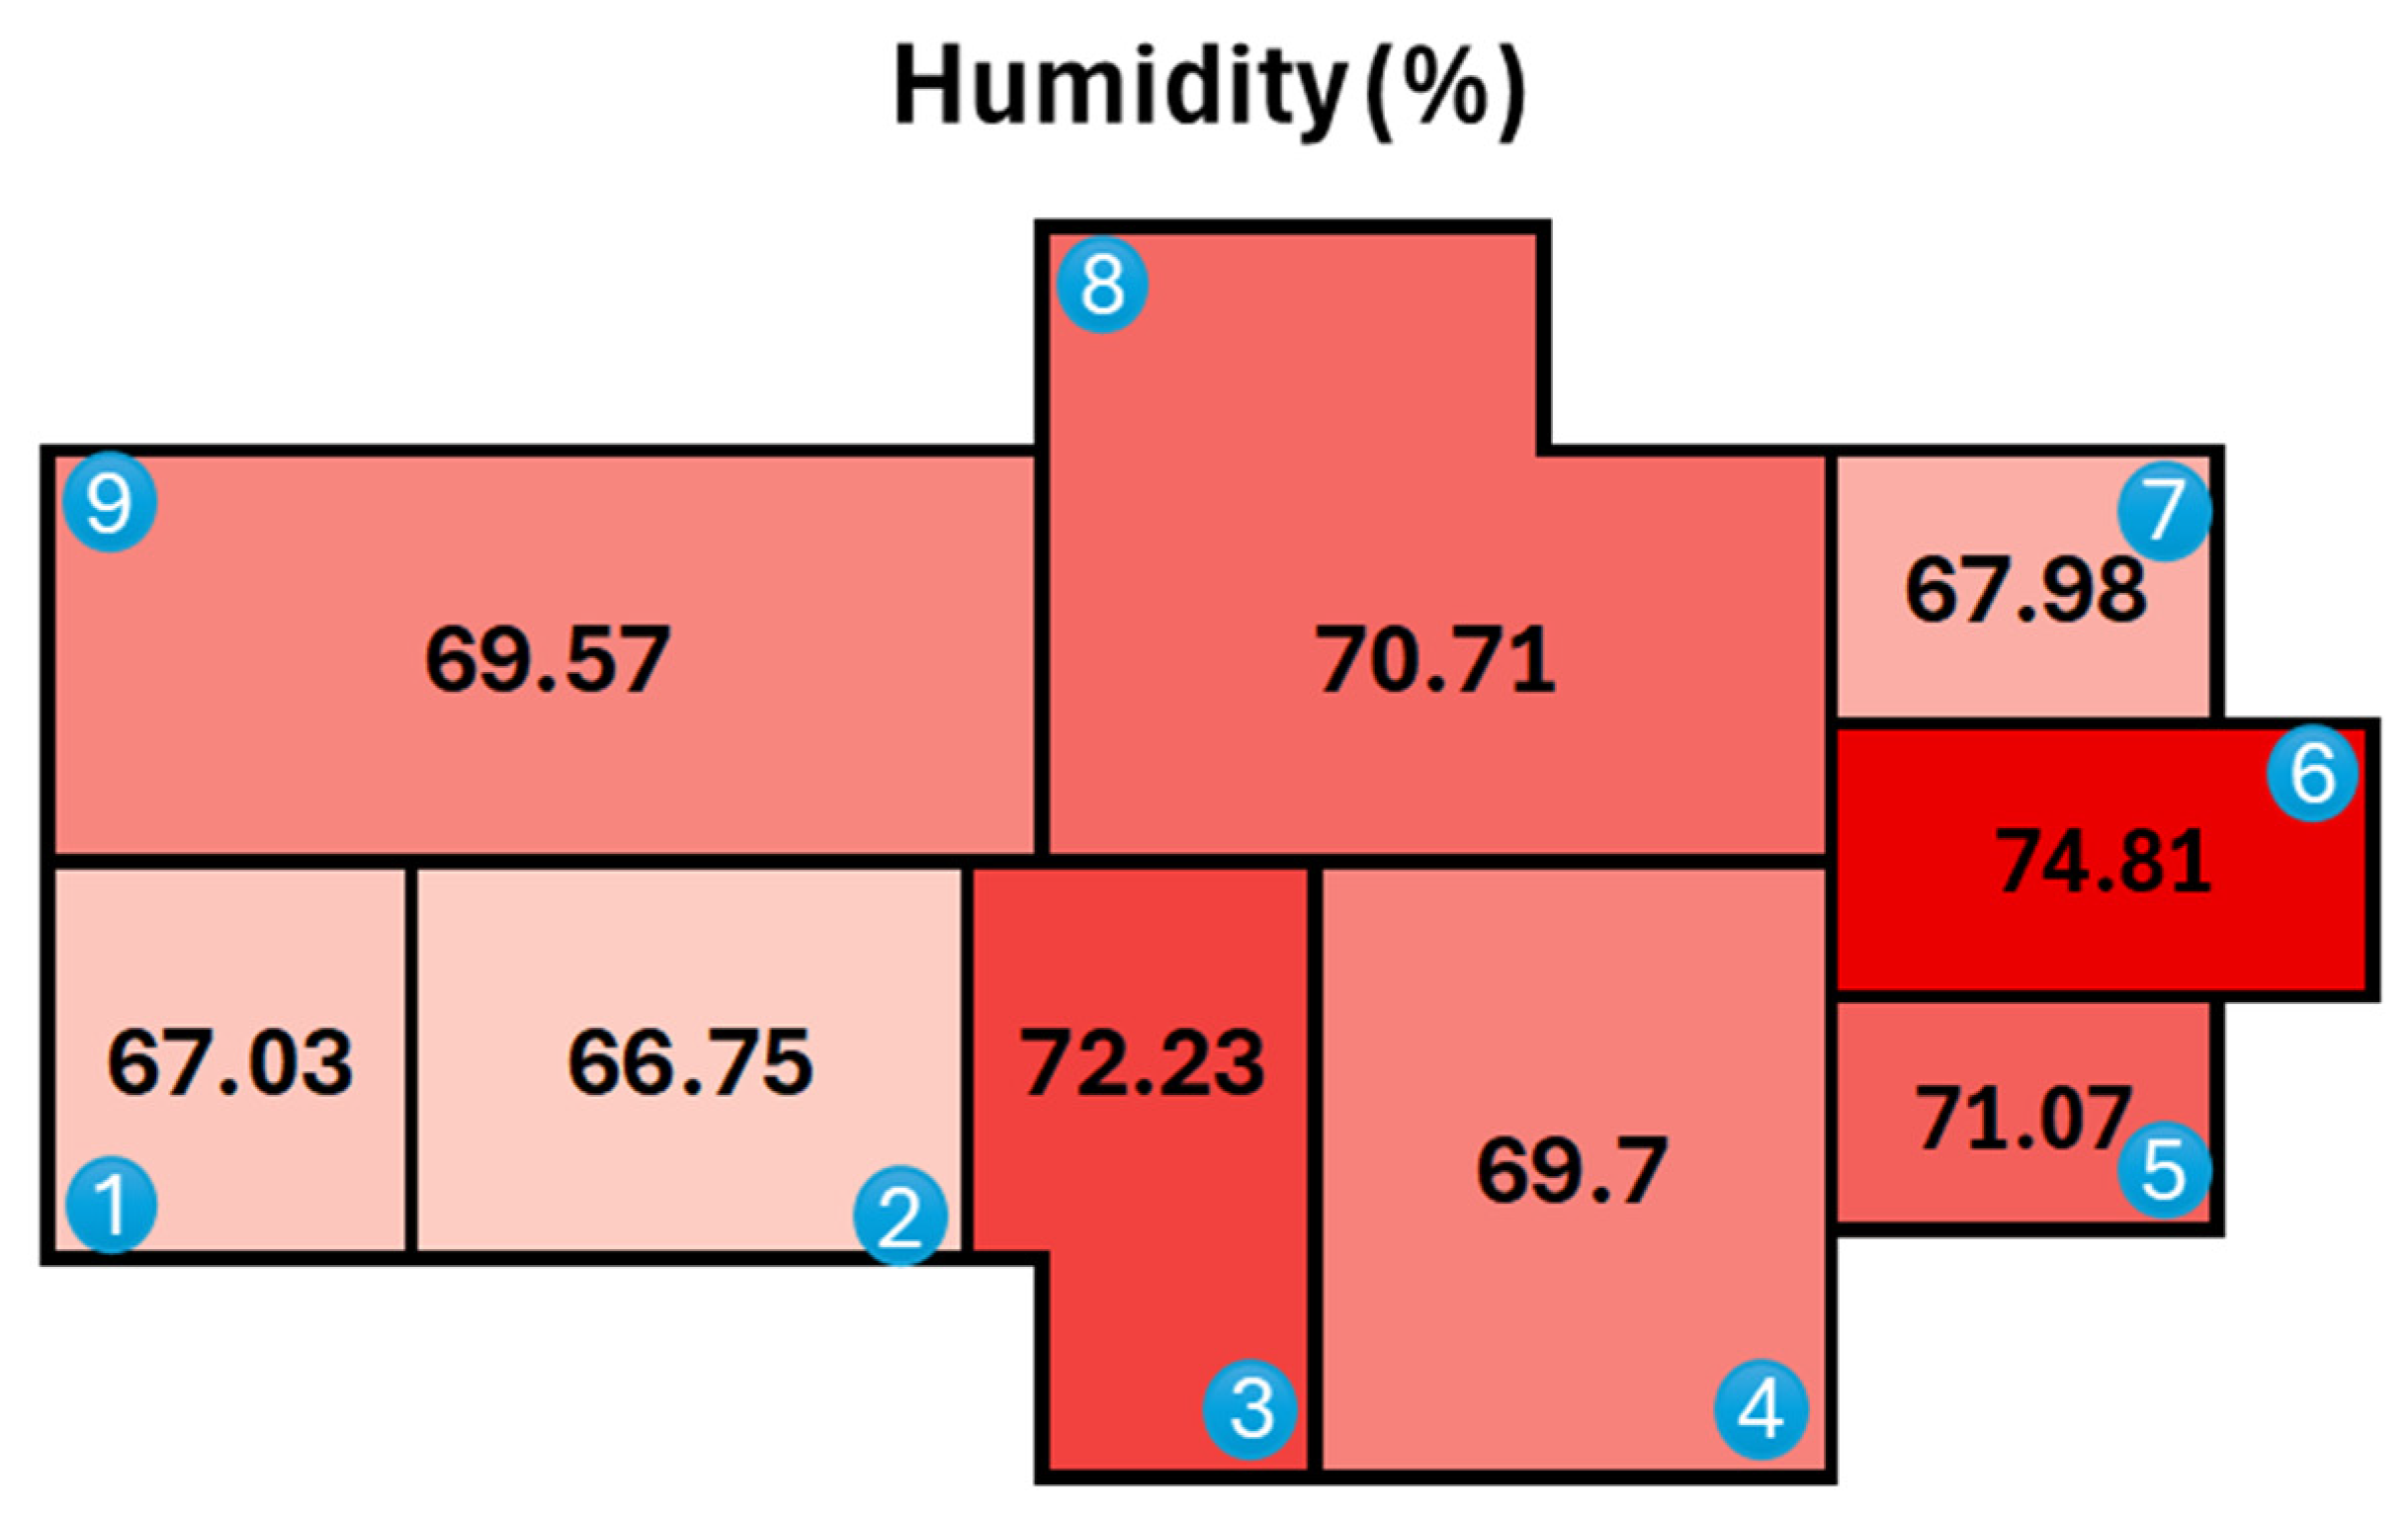
As shown in
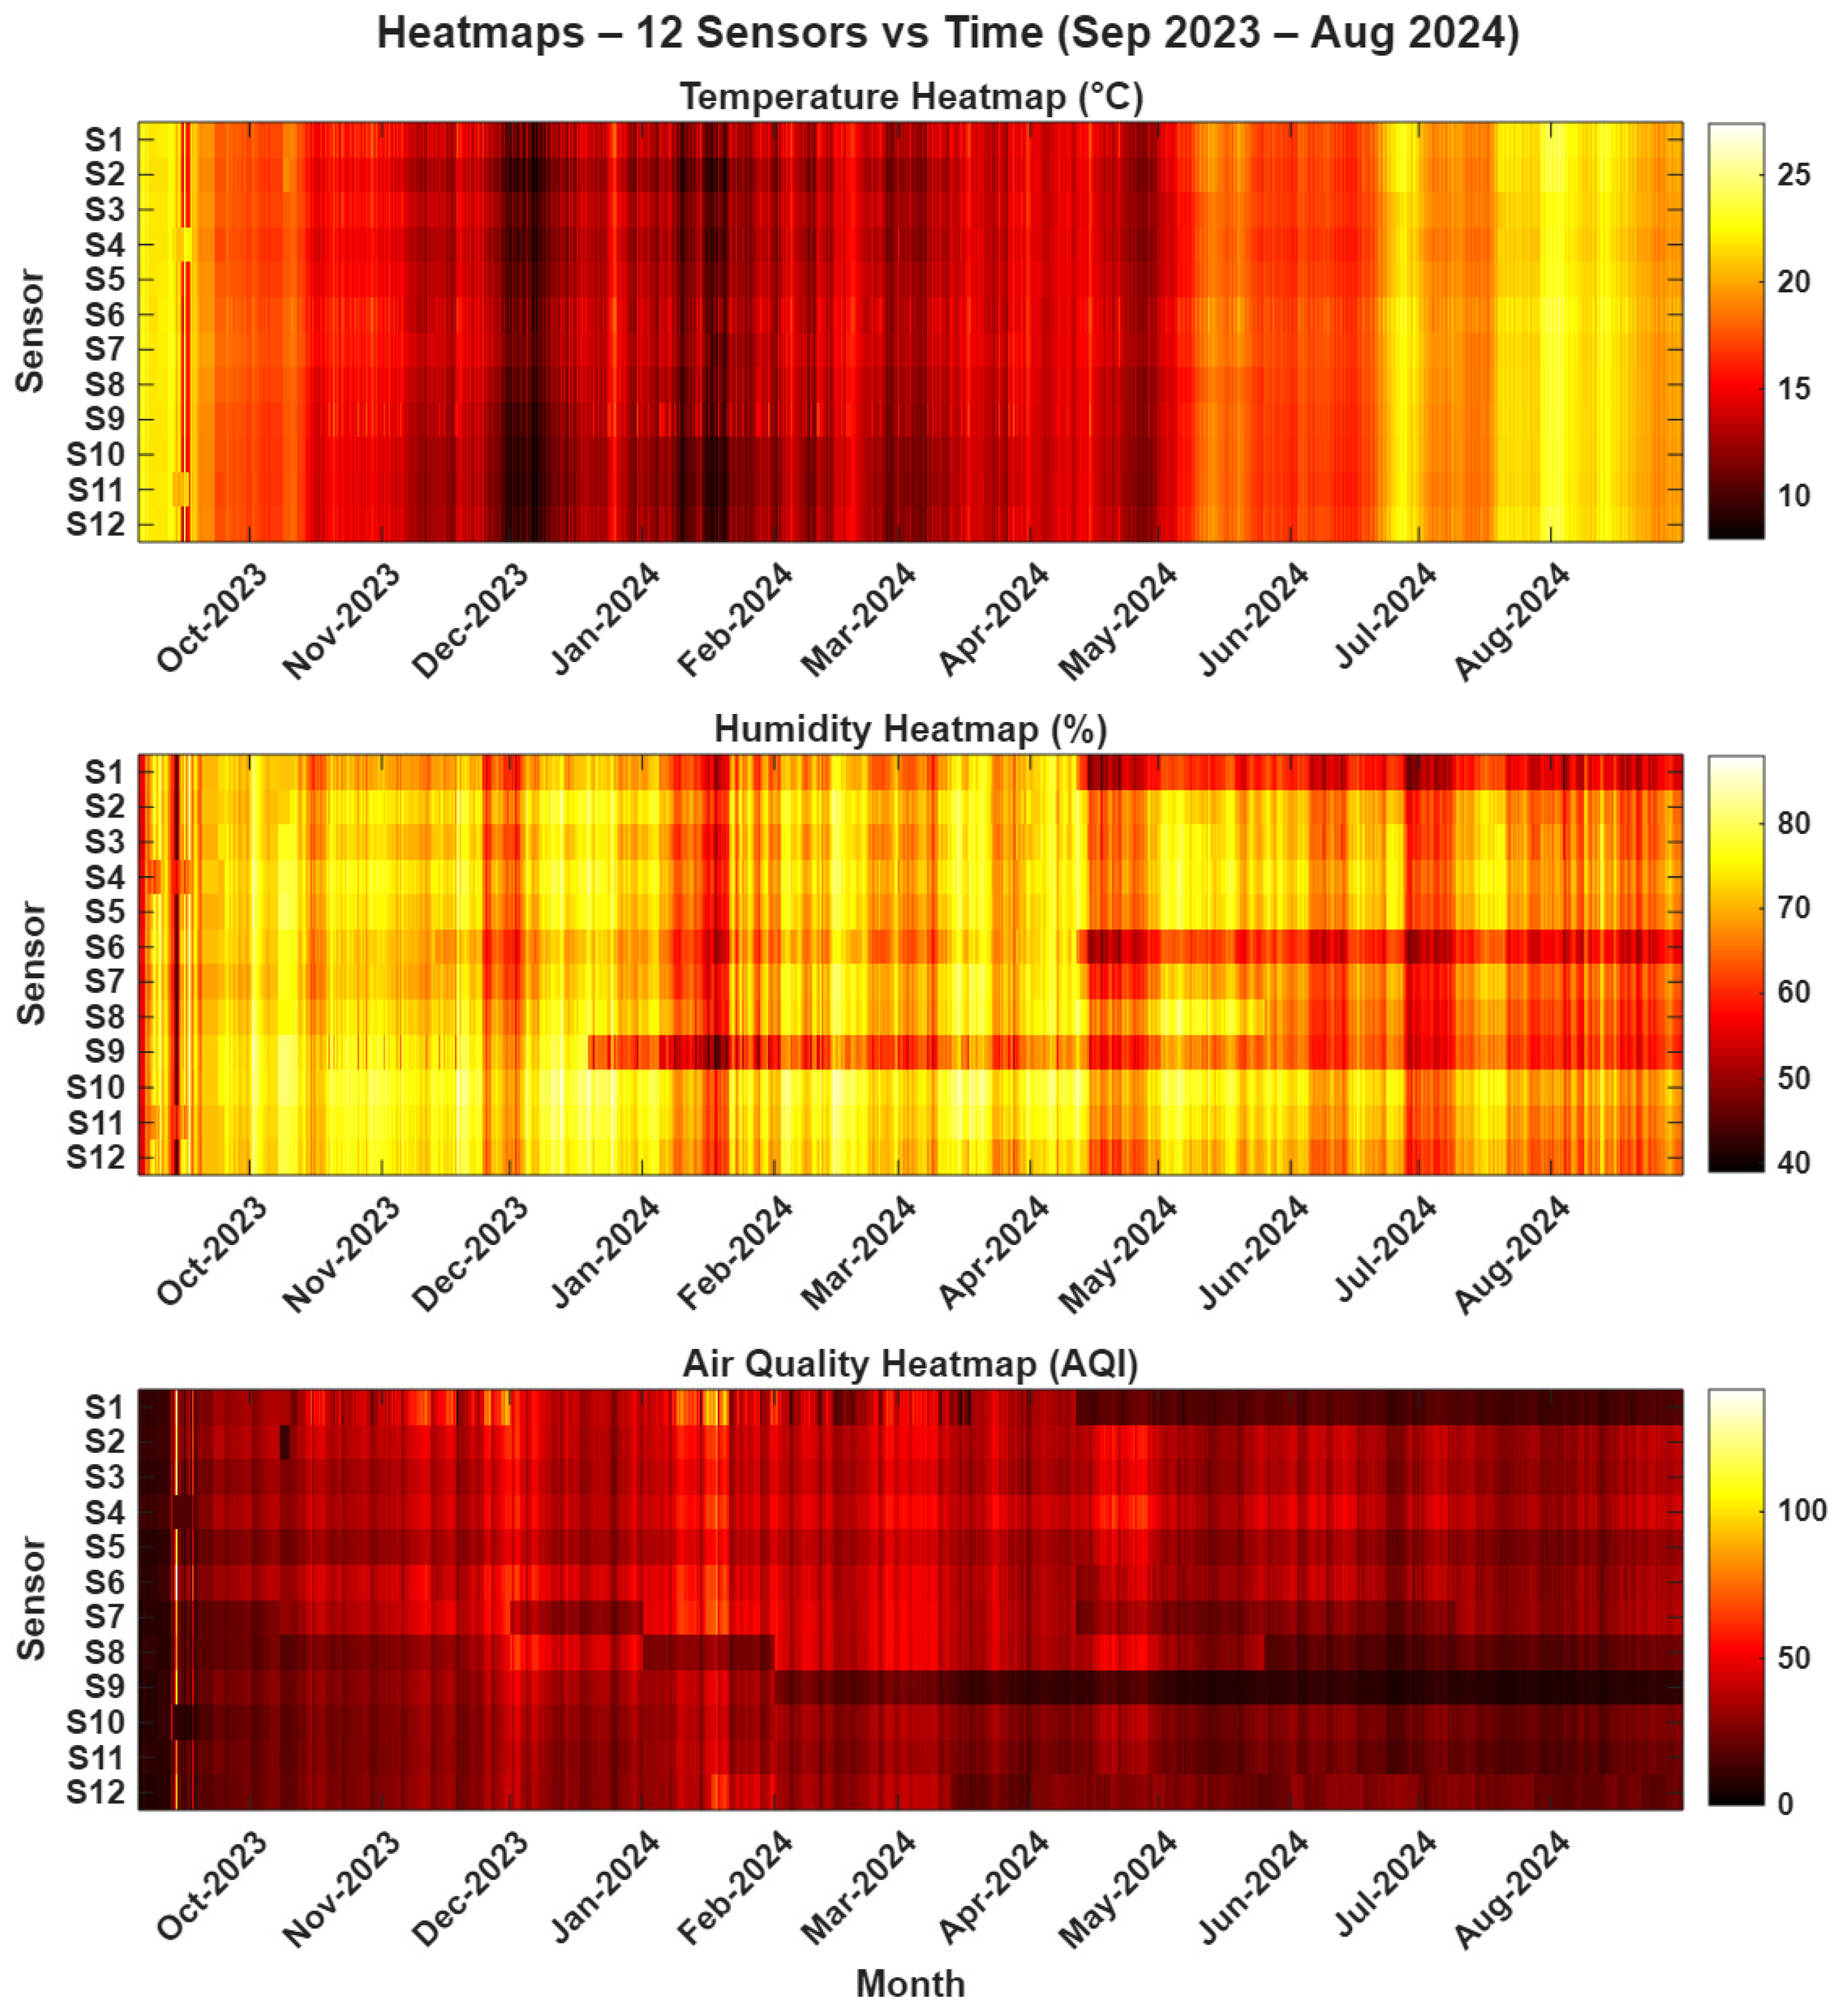
Figure 14, the temperature readings across nine monitored zones were consistent, with zones 3, 6, and 7 showing slightly lower values. Monthly averages for December, January, and February were 12.0 °C, 12.0 °C, and 13.0 °C, respectively, which fall below the comfortable range (18–22 °C). All zones exceeded the optimal 40–60% relative humidity range, with zones 2 and 3 recording the lowest RH levels. Persistent high humidity levels can accelerate material decay and biological growth, emphasising the need for improved ventilation, dehumidification, and insulation strategies.
In general, temperature and humidity were anti-correlated, while air quality degrades when temperature is low and humidity is high as shown in
Figure 15 and
Figure 16.
4.3. Predictive Modelling and Model Performance
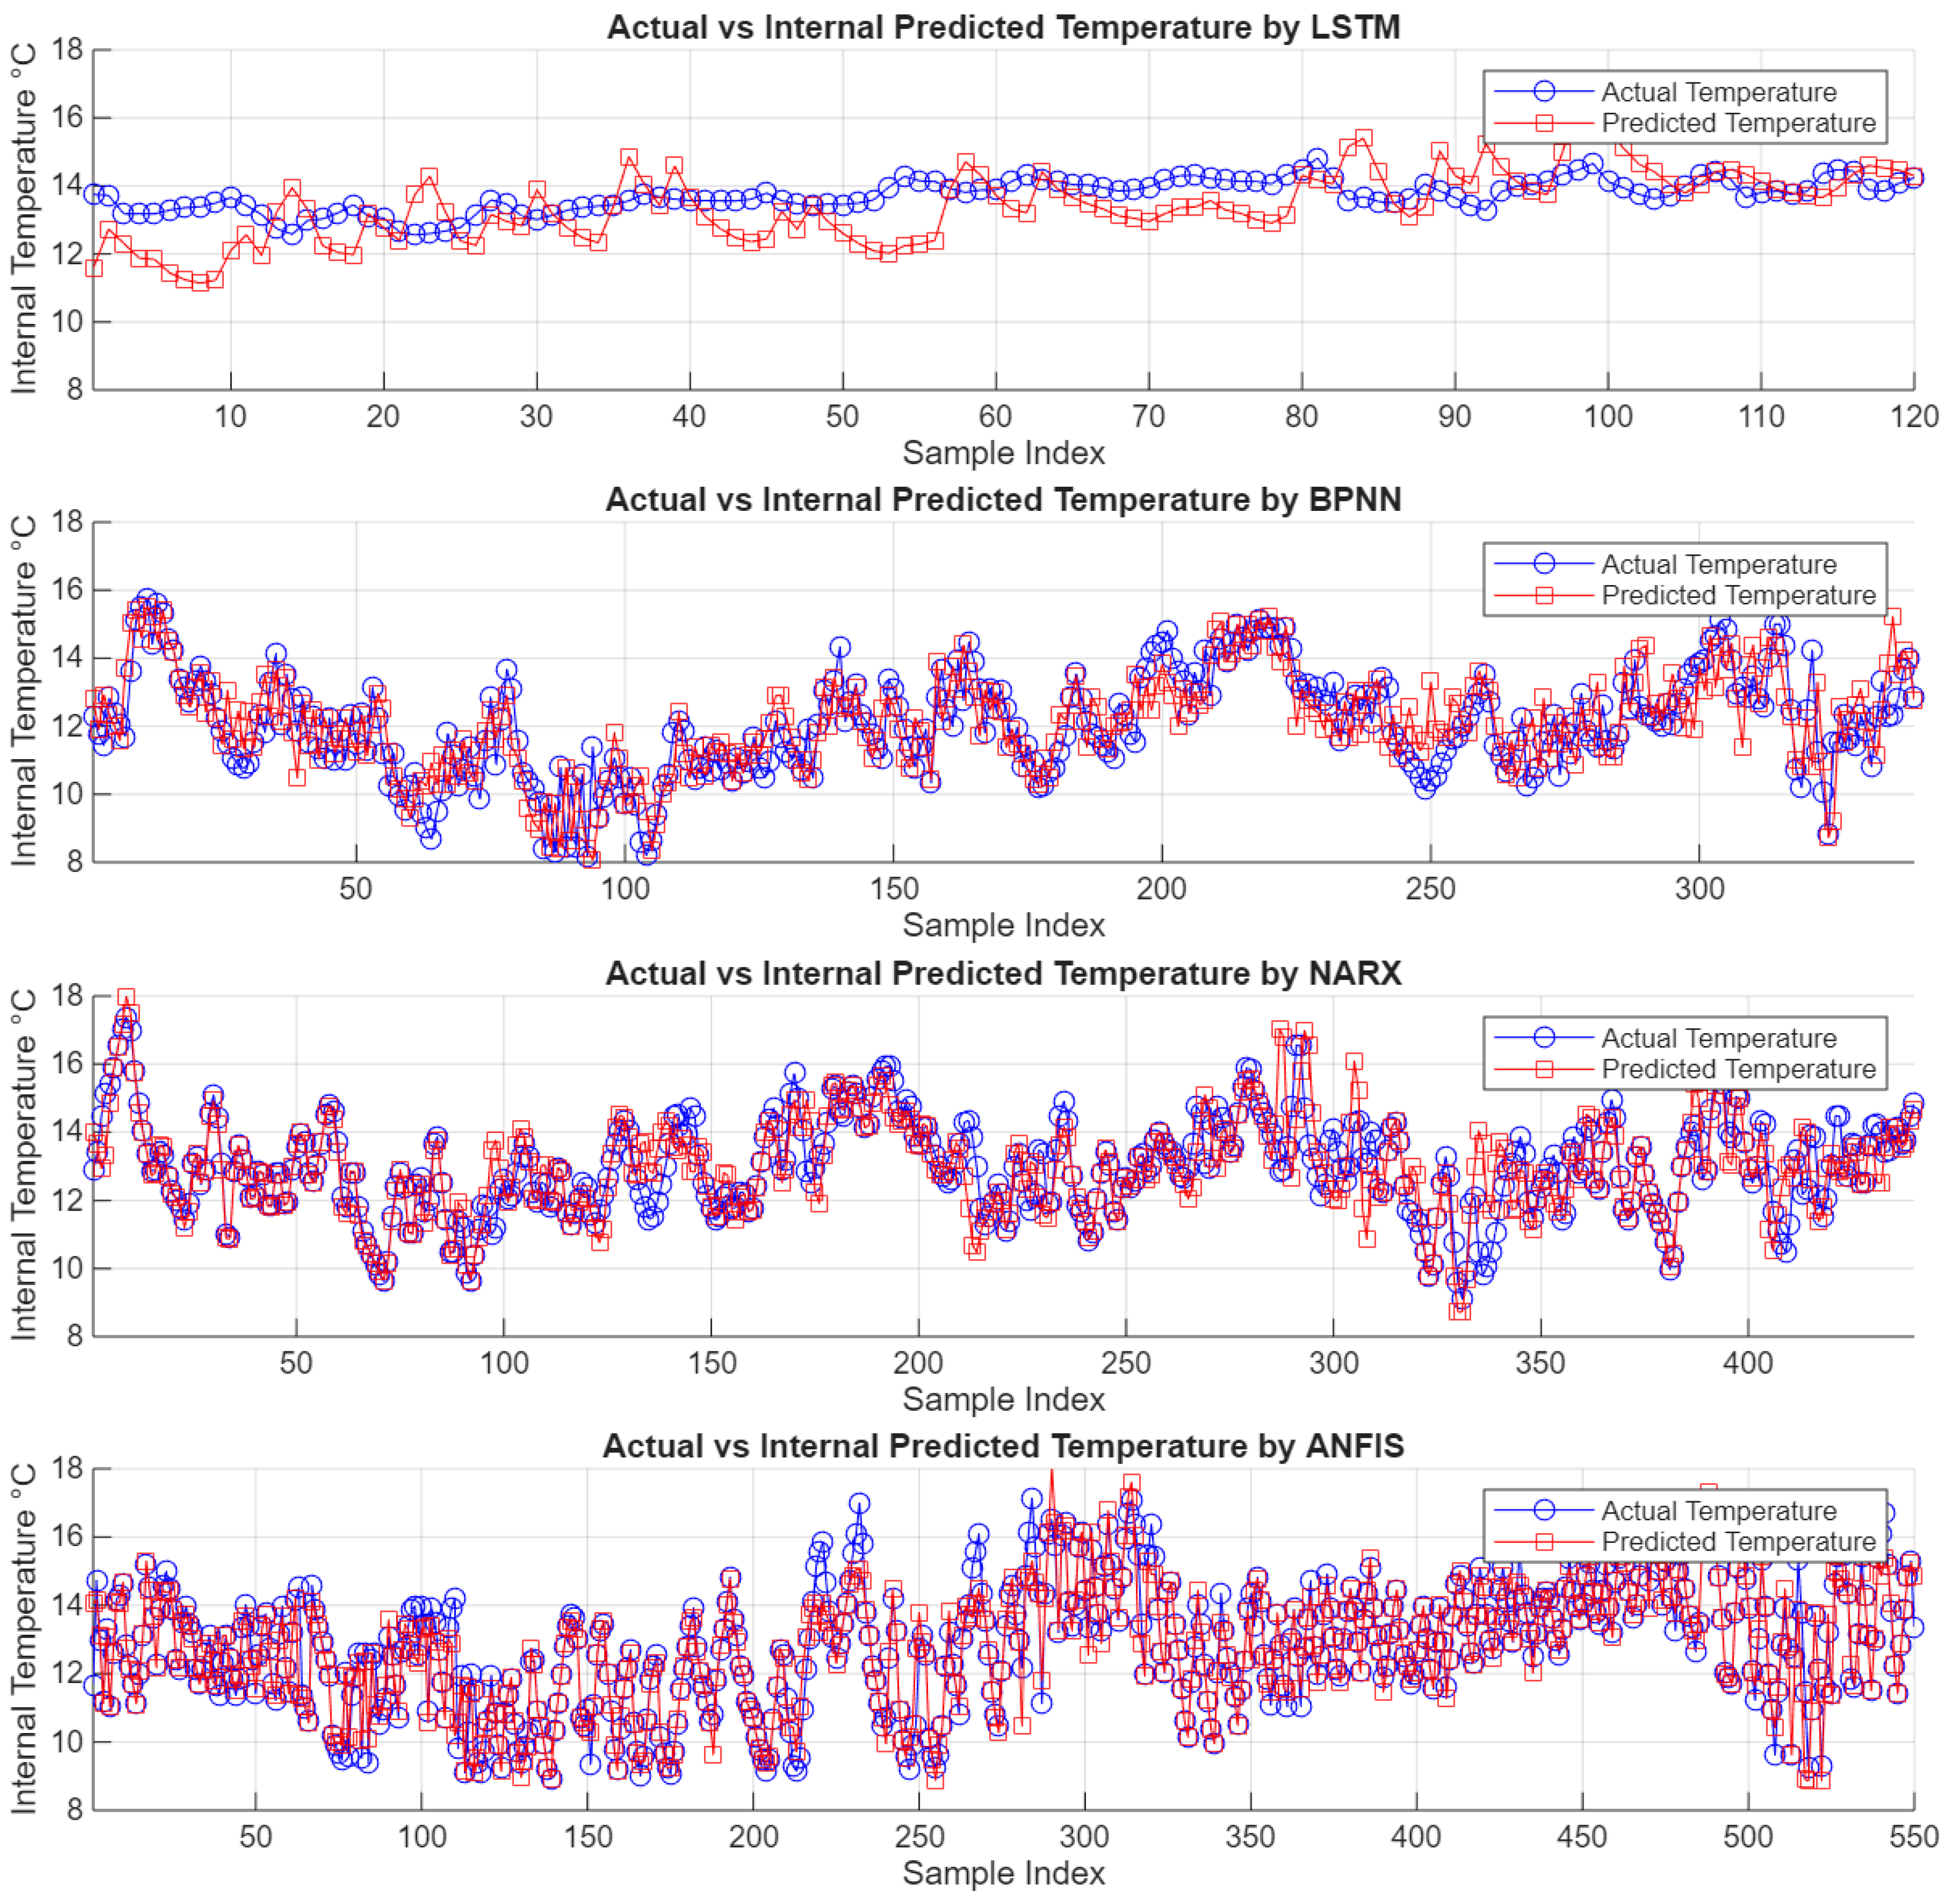
Following the reconstruction of missing data from malfunctioning sensors, the second application focused on predicting the indoor temperature required to maintain relative humidity within the target range of 40–60%. To achieve this, machine learning models were trained using data from twelve sensors, comprising over 34,000 hourly records. Four models were evaluated: Long Short-Term Memory (LSTM), Backpropagation Neural Network (BPNN), Nonlinear Autoregressive Exogenous (NARX), and Adaptive Neuro-Fuzzy Inference System (ANFIS). Among these, the NARX model demonstrated the best performance, achieving the lowest root mean square error of 0.19 °C, followed by the BPNN and LSTM models. The ANFIS model showed slightly lower accuracy but exhibited consistent performance across varying input conditions. Comparisons between predicted and actual temperature values across the models are presented in
Figure 17. The results indicate that maintaining an indoor temperature approximately 4–6 °C higher than observed winter conditions enables relative humidity to be stabilised below 60%, thereby supporting the environmental conditions necessary for the preservation of the building fabric.
The application of these generalised methods demonstrated that, under rescaled humidity conditions, the NARX model identified an optimal average indoor temperature of 18.5 °C for maintaining stable RH. These results highlight the potential of predictive models to inform proactive environmental control strategies. In addition to the generalised methods explained above, a second neural network methodology employed in this research consists of a two-stage application of a single feedforward neural network architecture, rather than two distinct networks.
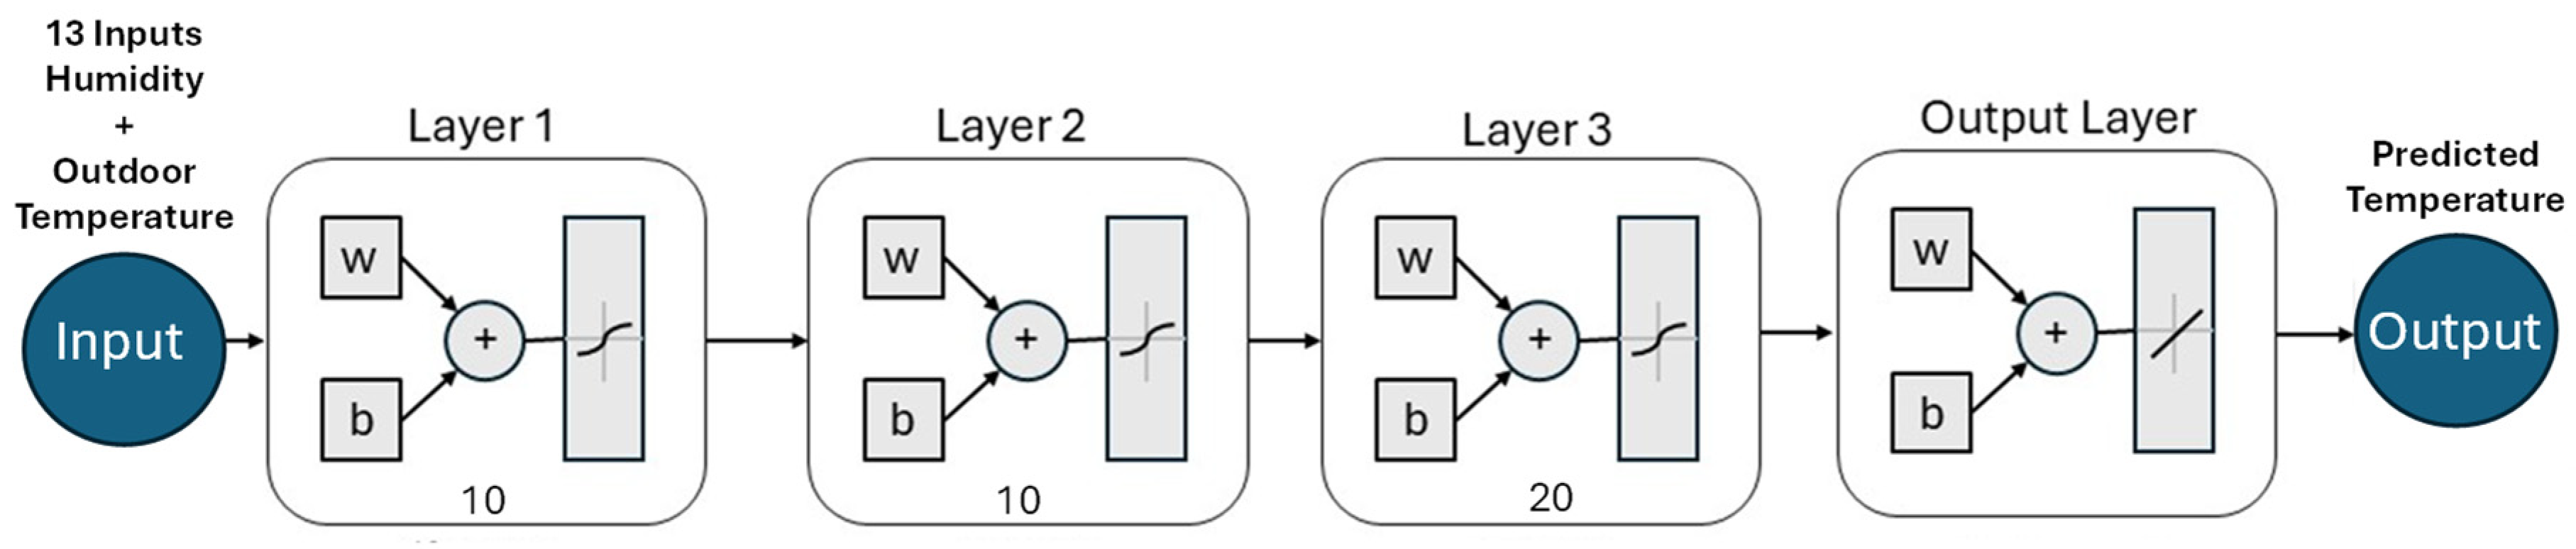
In the first stage, the neural network is trained to learn the relationship between actual measured indoor humidity and the corresponding actual indoor temperatures. The input data comprises 13 variables: humidity measurements from 12 indoor sensors and the associated outdoor temperature which showed strong correlation with the indoor temperature. The target output is the average indoor temperature calculated across the 12 sensors. The network is implemented as a feedforward neural network with three hidden layers, where the number of neurons in each layer is systematically varied between 10 and 50 in increments of 10, resulting in multiple network configurations that are trained and evaluated. A subset of the available data was used for training with the Levenberg–Marquardt backpropagation algorithm. Model performance was assessed using metrics such as the percentage error relative to the mean target value.
Figure 18 presents the optimal network architecture comprising three layers with 10, 10, and 20 neurons which produced the best results.
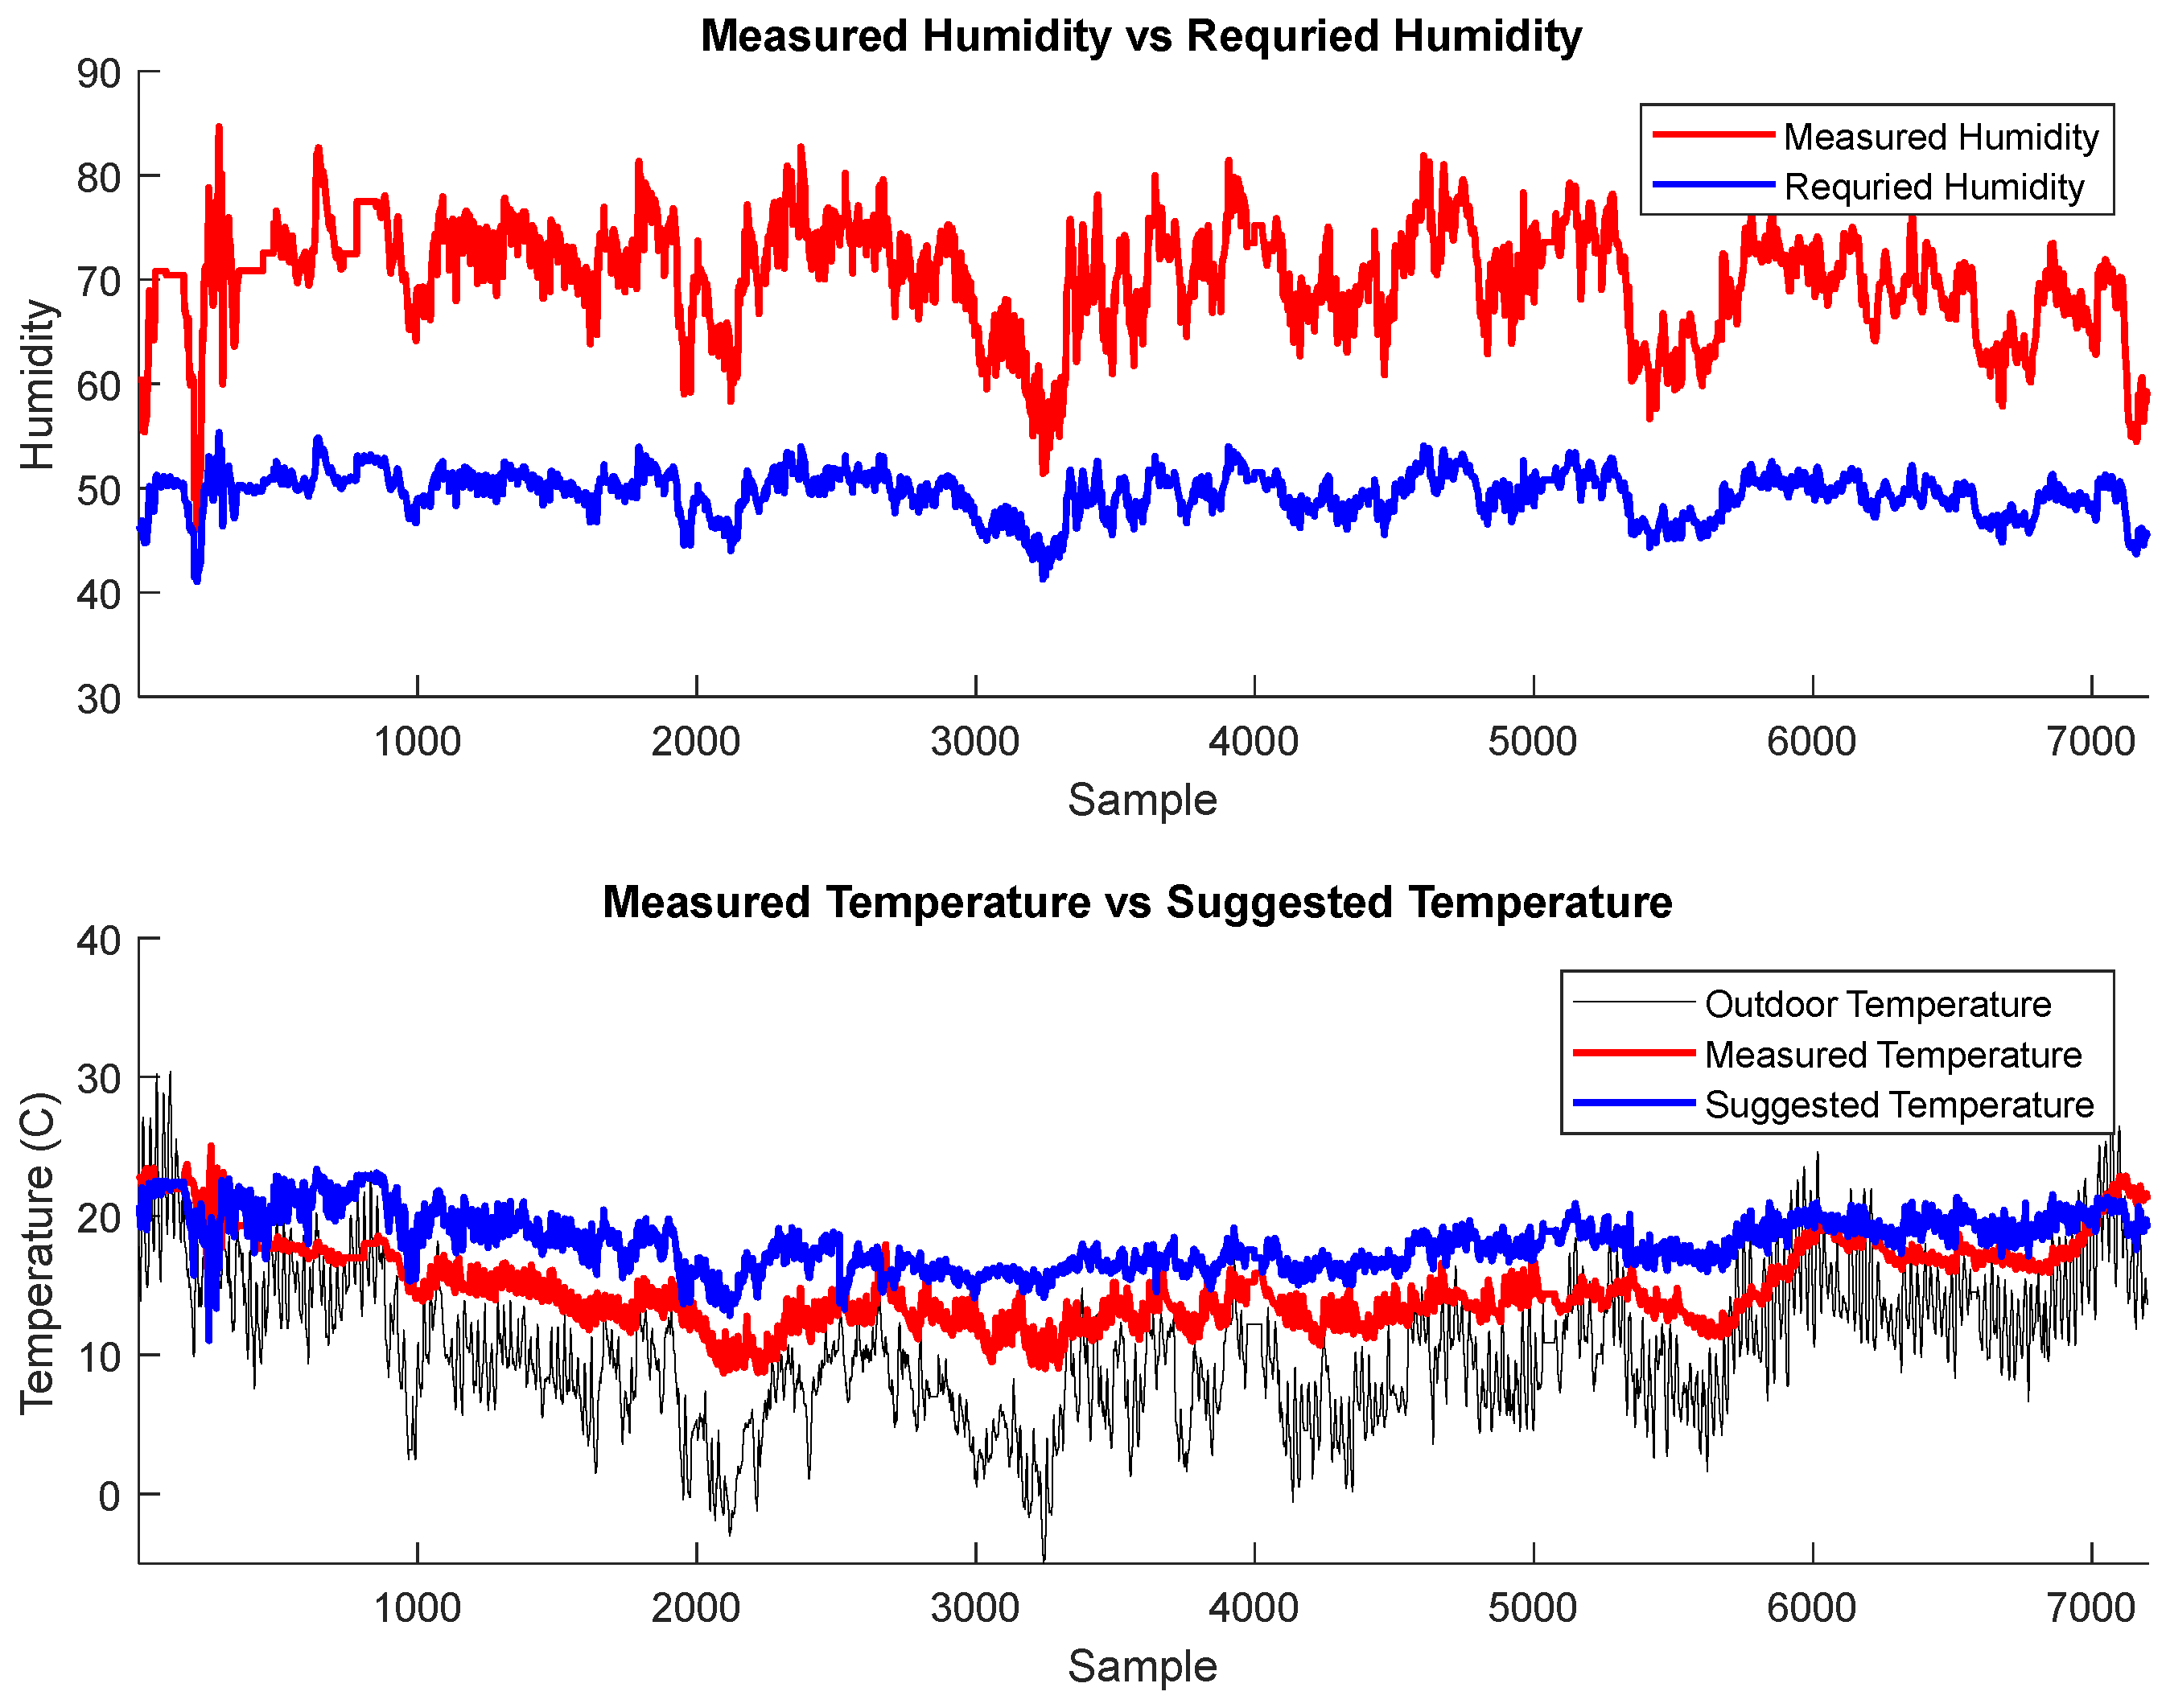
In the second stage, the trained neural network was applied to predict the indoor temperatures required to achieve relative humidity levels within the target range of 40% to 60%. To accomplish this, the original humidity data typically exceeding 60% was rescaled to create a new dataset constrained within the desired 40–60% range. The subplot as shown in
Figure 19 illustrates the measured humidity in red and the required humidity in blue. This rescaled humidity data was combined with the actual outdoor temperature measurements. Together, they were used as input to the trained neural network. The network predicted the indoor temperatures required to maintain humidity within the target range of 40–60%.
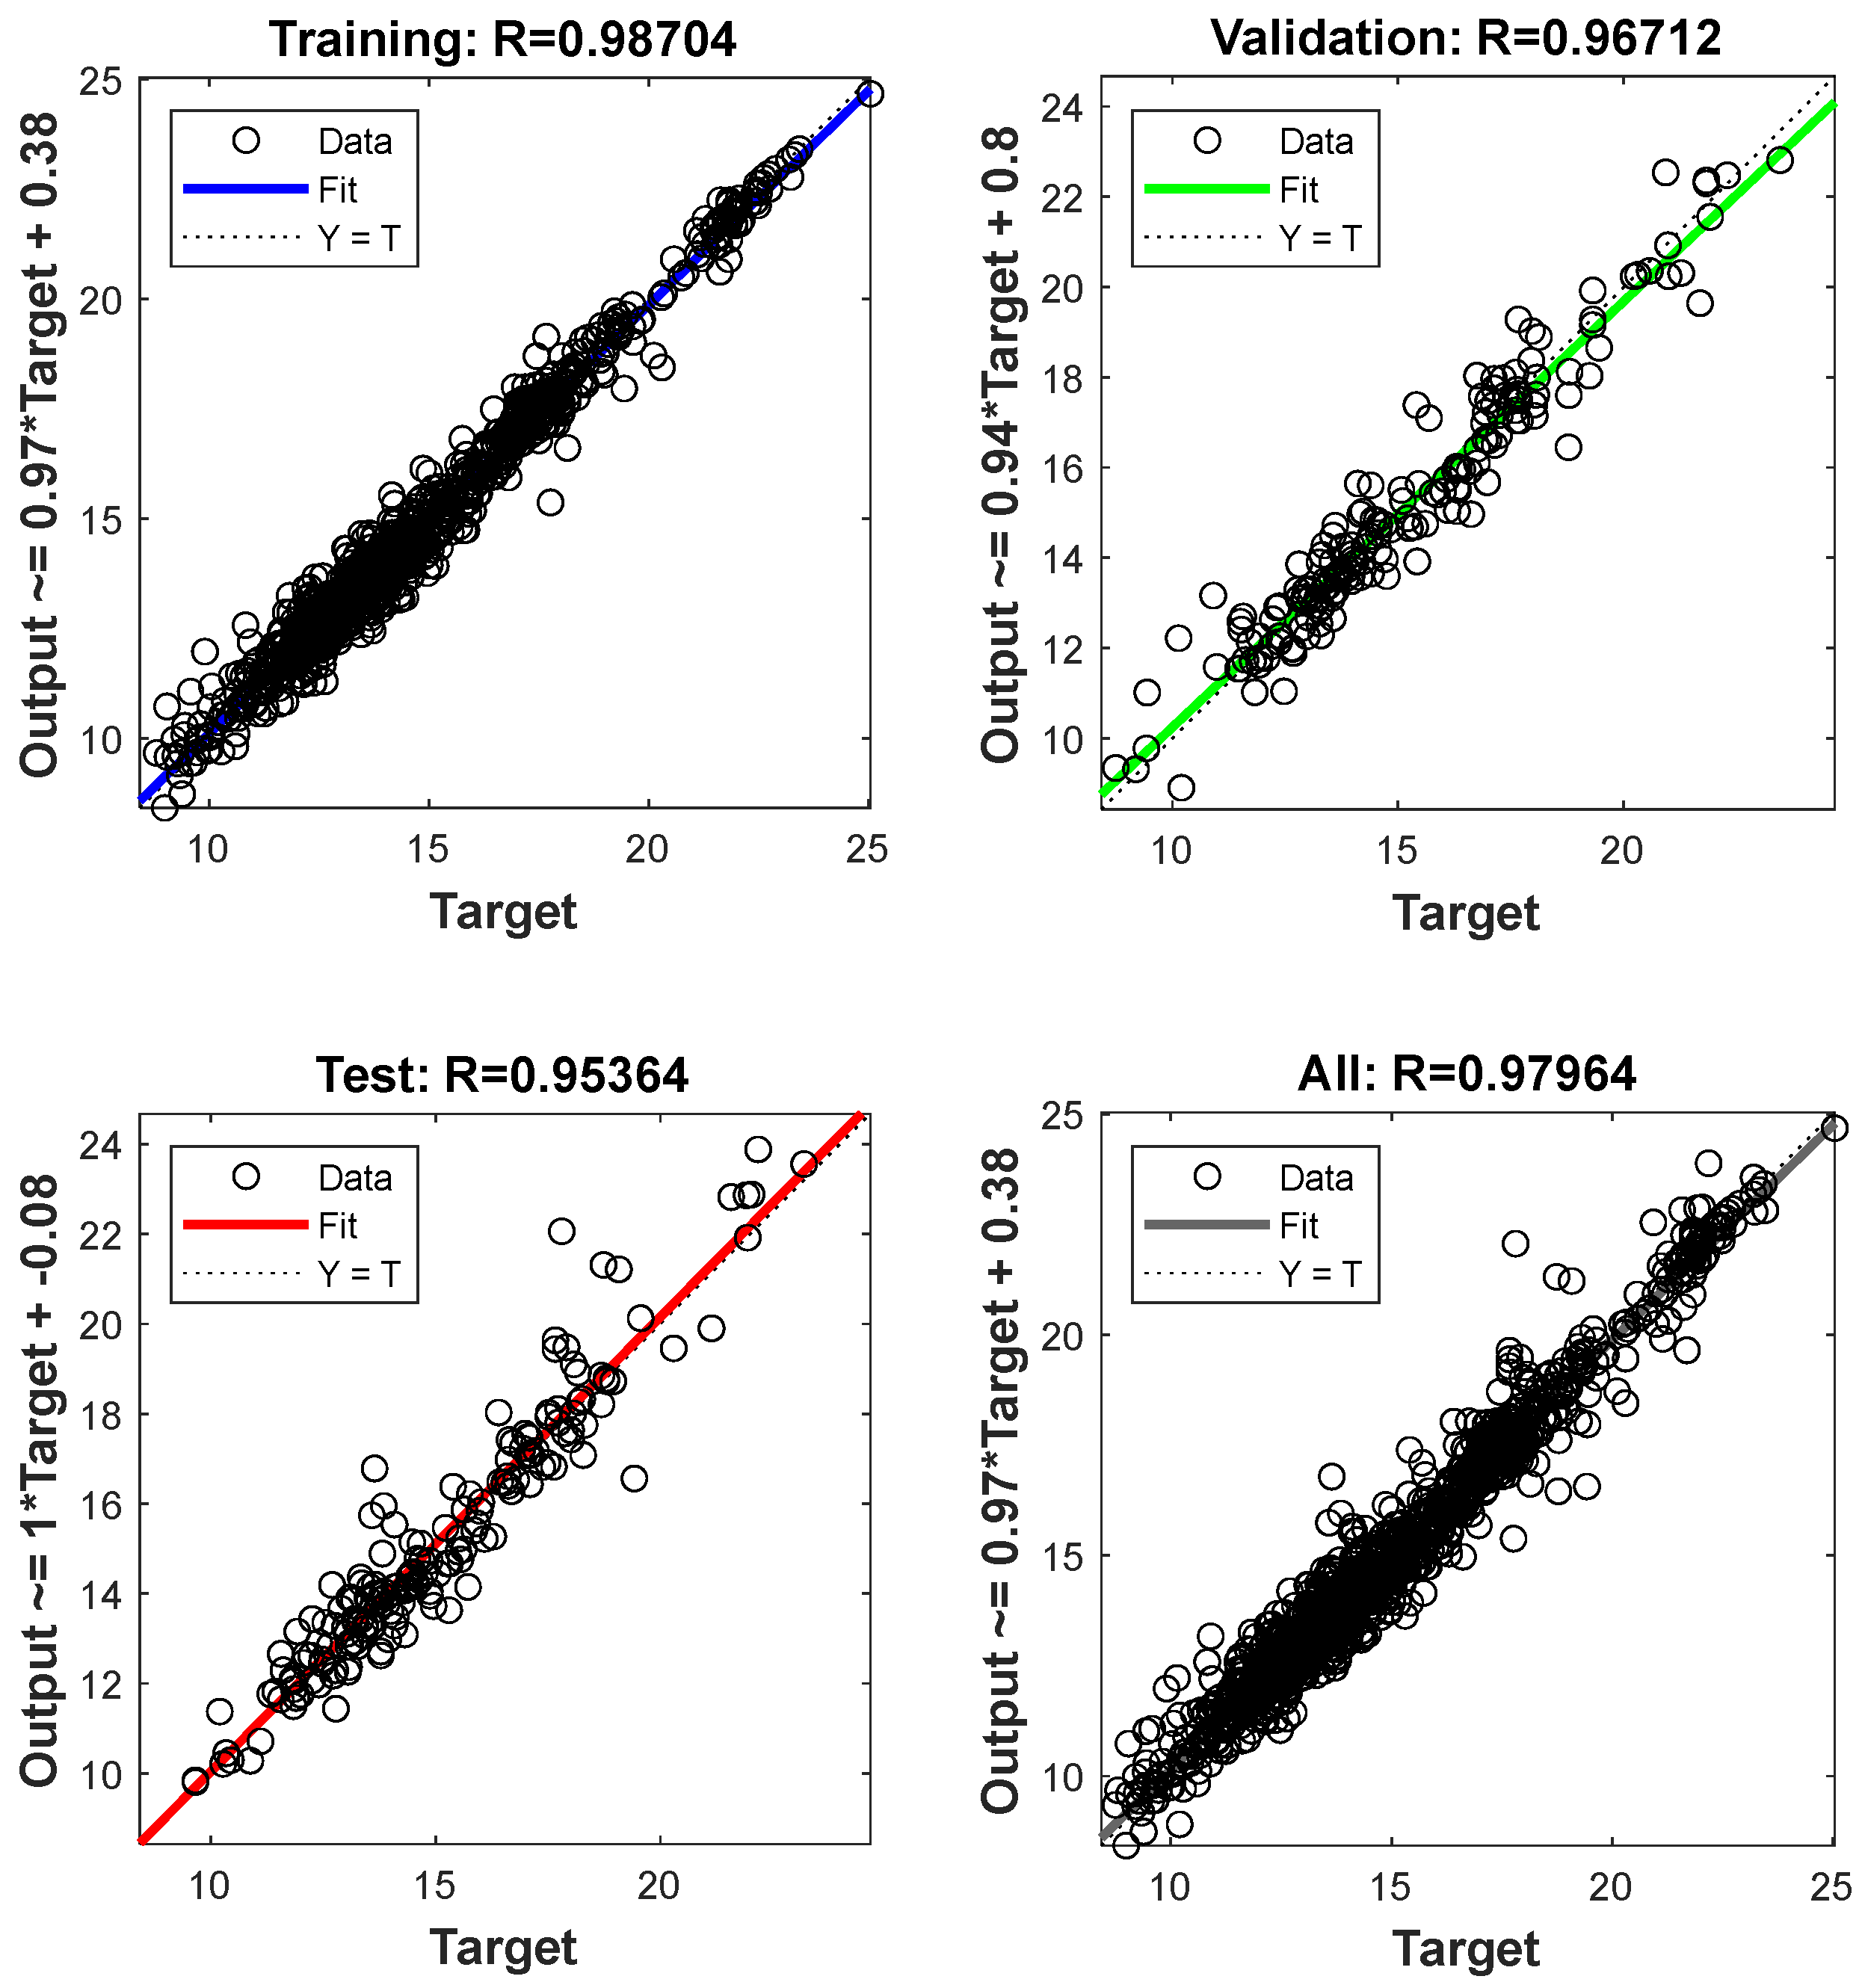
Figure 20 consists of four regression plots. The regression plots compare the network’s predicted output values with the corresponding target values across training, validation, test, and combined datasets. In each subplot, the data points are closely aligned with the line of perfect prediction, indicating a strong linear correlation between the predicted and actual temperatures. This close correspondence demonstrates that the network has effectively learned the relationship between the input variables indoor humidity measurements and outdoor temperature, and the target indoor temperature.
The error histogram (
Figure 21) shows the distribution of prediction errors, defined as the difference between target values and network outputs. The majority of errors are concentrated around zero between −0.1 and 0.1, indicating that a substantial number of predictions achieve exact or near-exact correspondence with the target values. The error distribution is approximately symmetric and relatively narrow, with most errors confined to small magnitudes.
Together, the regression plots and error histogram confirm the neural network’s ability to produce accurate temperature predictions with minimal deviation from the expected values, thereby validating its reliability for determining the indoor temperature setpoints required to maintain the desired environmental conditions.
Figure 19 illustrates the results of applying a trained neural network to determine the indoor temperature required to maintain relative humidity within the optimal preservation range of 40% to 60%. The upper subplot compares the measured humidity levels, which consistently exceed 60% and frequently approach 80%, with the required humidity profile. The required humidity profile, represented by the blue line, consists of the original measured humidity data that has been rescaled to constrain all values within the target range of 40% to 60%. The lower subplot displays the corresponding temperature profiles, showing the measured outdoor temperature in black, the actual measured indoor temperature in red, and the suggested indoor temperature required to achieve the rescaled humidity profile in blue. The suggested temperature values are systematically higher than the actual measured indoor temperatures, demonstrating that increasing the indoor temperature is necessary to reduce relative humidity to the desired 40–60% range. This comparison clearly illustrates the relationship between temperature control and humidity management: maintaining higher indoor temperatures, as indicated by the suggested temperature profile, is required to bring the relative humidity levels down from their naturally occurring elevated values into the optimal preservation range.
The trained model reflects the actual environmental response characteristics of the building under its current conditions, making the resulting temperature recommendations directly relevant to operational environmental control within that specific physical context.
If significant physical modifications are made to the building, such as the addition of insulation materials or substantial changes to the building envelope, the fundamental relationships between humidity and temperature would be altered due to changes in the building’s thermal and moisture transport properties. In such cases, the previously trained neural network would no longer accurately represent the modified environmental dynamics and retraining the model with data collected after the physical modifications would be necessary. This requirement for retraining ensures that the predictive model remains aligned with the building’s current physical behaviour, thereby maintaining the validity of the temperature setpoints needed to achieve the target humidity range.
The predictive models identified that maintaining an indoor temperature approximately 4–6 °C higher than recorded winter averages resulting in a stable setpoint of around 18.5 °C effectively keeps relative humidity (RH) below 60%. This target aligns critically with established material-conservation thresholds. Firstly, an RH consistently below 60% significantly inhibits the germination and growth of mould and fungi, which typically require humidity levels above 70% to thrive, and represents a primary biological threat to both organic and inorganic substrates alike [
16]. Secondly, stabilising RH within a 40–60% range drastically reduces cyclical dissolution and recrystallisation of soluble salts (for example, chlorides and sulphates) within the cathedral’s historic masonry and plaster. Such cycles of salt crystallisation and re-moistening are among the leading causes of sub-florescence, surface spalling, and material loss in porous building materials [
17]. Finally, for composite structures like Pugin’s wall painting composed of paint layers, lime plaster, and stone support minimising RH fluctuations mitigates hygrothermal stress. Differential expansion and contraction between these material layers, driven by rapid moisture exchange, can lead to cracking, delamination, and paint loss. Therefore, the prescribed temperature adjustment is not simply an environmental optimisation but a targeted intervention to suppress specific physicochemical and biological deterioration pathways, thereby directly supporting the long-term preservation of the cathedral’s fabric and artworks.
5. Discussion and Conclusions
The development and deployment of a Digital Twin (DT) for Nottingham Cathedral demonstrates how advanced digital tools can be adapted for sensitive heritage conservation. It also reveals the inherent complexities of applying such technologies within a Grade II-listed building. Due to the cathedral’s protected status, extensive physical interventions were not permissible, requiring the research team to rely on non-invasive IoT sensors and LoRaWAN connectivity. Consequently, the DT was conceptualised not as a tool for physical manipulation, but as a dynamic digital layer for understanding and reflecting environmental performance emphasising the need to balance technological ambition with conservation ethics and legal constraints. This experience underscores that successful digital conservation is not solely a technical challenge but also a procedural and cultural one, requiring flexible methodologies that respect heritage values.
Methodologically, the DT enabled a continuous feedback loop between real-world conditions and digital simulation. Real-time visualisation of temperature, humidity, and air quality across spatial zones revealed microclimatic variations undetectable through conventional monitoring, providing curators and heritage managers with precise insights for targeted interventions. For example, persistent high humidity near Pugin’s wall paintings was linked to specific thermal zones, enabling focused environmental strategies rather than building-wide adjustments. However, occasional data loss highlighted current technological and logistical limitations in implementing fully functional DTs in heritage settings. These gaps, while mitigated through ANN-based reconstruction, point to the need for more resilient sensor networks and hybrid communication protocols in future deployments.
The integration of machine learning (ML) transformed the DT from a descriptive into a predictive decision-support system. Comparative evaluation of algorithms including LSTM, BPNN, ANFIS, and NARX demonstrated that data-driven modelling can significantly enhance the understanding of environmental dynamics in complex heritage spaces. The NARX model proved particularly effective in forecasting temperature variations linked to relative humidity, offering actionable guidance for pre-emptive conservation measures. This underscores a broader cultural shift in heritage conservation from intuition-based, periodic inspections toward continuous, data-informed stewardship. Nevertheless, the interpretability of ML models remains a challenge, pointing to the need for explainable AI frameworks tailored to non-technical conservation professionals.
While the study successfully established a predictive relationship between temperature and humidity key drivers of deterioration in this case the design was necessarily constrained by data accessibility and project scope. This focus, though pragmatic, may have omitted other influential factors. For instance, solar radiation through stained-glass windows or latent moisture within historic masonry were not explicitly modelled, potentially oversimplifying the environmental narrative. Interestingly, monitored occupancy data (visitor counts and movement) showed no significant correlation with short-term fluctuations in temperature or humidity, suggesting that in this well-ventilated, high-volume space, human presence had a negligible microclimatic impact compared to external weather and building physics. Future research should, therefore, prioritise multi-physics sensing such as light exposure, material moisture content, and external pollutant levels over occupancy metrics to develop more comprehensive, building-specific degradation models.
Despite these advances, several limitations must be acknowledged. The DT does not yet implement a full bi-directional feedback loop where predictions automatically adjust environmental controls, largely due to regulatory and physical constraints. Moreover, the predictive models are calibrated to Nottingham Cathedral’s specific thermal and material properties, limiting immediate transferability to other buildings without retraining. While LoRaWAN enabled scalable data collection, it occasionally introduced transmission gaps that required algorithmic reconstruction. Finally, the study’s focus on temperature and humidity, though justified, means other factors such as structural movement or material-specific decay were not integrated suggesting future research should expand sensor networks and degradation models for a more holistic conservation approach.
In conclusion, this study demonstrates that even within the strict constraints of a listed heritage structure, the integration of DT and ML technologies can yield transformative benefits for predictive conservation. The insights gained particularly regarding zonal environmental management, algorithm selection, and the limited role of occupancy in this context provide a replicable framework for similar heritage sites. While challenges remain in achieving full automation and adaptive control, the prototype provides a robust foundation. Future efforts should focus on enhancing digital–physical interoperability, expanding monitored parameters to include structural and material health indicators, and developing standardised, open-source protocols for heritage DTs. Ultimately, this research contributes to redefining conservation practice shifting from reactive restoration toward a more intelligent, preventive, and sustainable paradigm.
The novelty of this work lies in integrating Digital Twin technology with machine learning for real-time environmental monitoring and prescriptive modelling in heritage conservation. Moving beyond prior DT+ML applications focused on forecasting or anomaly detection, this study emphasises actionable temperature setpoints to control relative humidity in a historical context. Validated on Nottingham Cathedral, this scalable framework bridges traditional conservation with data-driven methods, offering optimised environmental conditions (e.g., maintaining 18.5–19.5 °C) to mitigate risks such as mould or salt damage. By enabling a shift from reactive to preventive strategies and fostering interdisciplinary collaboration between heritage and data science fields, the approach holds potential for broader application across diverse building types and climates.






 ,
,