1. Introduction
In recent times, the utilisation of hydrogen is gaining more traction as an alternative energy in the transportation sector [
1,
2,
3]. The combustion process using hydrogen-based fuel does not produce carbon dioxide as a side product, which makes it a powerful alternative as part of decarbonisation efforts in the transportation sector. In Japan, hydrogen-based energy is increasingly seen as a viable option, considering Japan’s concern about balancing energy security with climate change measures.
Meanwhile, hydrogen has a low volumetric energy density, posing significant logistical challenges for its transportation and storage [
4]. The logistical challenges become more apparent in regions where hydrogen infrastructure remains insufficiently developed, leading to inefficiencies such as increased logistics costs and limited service coverage [
5]. However, improving hydrogen transportation efficiency needs more than optimising the transport itself [
6,
7]. Looking at the entire hydrogen supply chain, improving transportation efficiency is closely linked to strategies for deploying hydrogen infrastructure, with particular focus on HRSs that act as connectors between the hydrogen production and distribution links and the end users. The development of a reliable hydrogen refuelling station network is therefore paramount to support the adoption of FCVs on a wider scale and, finally, to support the decarbonisation efforts. In addition, the refuelling stations act not only as hydrogen supply facilities, but also as an important component of broader endeavours in transforming transportation efforts. Therefore, to create sustainable hydrogen utilisation, essential advancements need to be made not only in hydrogen production, but also in transportation, storage, distribution, and refuelling infrastructure, thereby establishing a sustainable and comprehensive hydrogen supply chain. In Japan’s energy policy, decarbonization of the transportation sector is considered a key pillar, and as FCV adoption is gaining more traction recently, the development of hydrogen refuelling infrastructure has become an urgent priority. The Japanese government has set a goal to expand the number of HRSs to 1000 by 2030, but the capital cost to build a single HRS is estimated at 500 million yen per station [
8,
9]. Initial investments for land acquisition, construction of storage and refuelling equipment, and development of a comprehensive safety system for the HRS are some of the issues that may cause the high capital cost, which in turn makes it one of the major hindrances in the development of hydrogen infrastructure in Japan.
As an effort to cut the capital cost, the integration of HRSs into existing petrol stations may potentially serve as a practical solution to support the rapid expansion of the hydrogen network in the future. Existing petrol stations are widely distributed, strategically positioned along transportation routes, and already equipped with basic fuel-related infrastructure, allowing utilisation of the sites currently occupied by the petrol stations for HRSs whilst potentially reducing the need for new land acquisitions and construction of completely independent facilities [
10,
11,
12,
13]. However, one important aspect that needs to be considered is that despite the apparent economic benefits, infrastructure conditions and specific conversion requirements need to be further explored to determine the precise benefits. Therefore, the co-location strategy is regarded as a potential strategy for HRS placement rather than a guaranteed means of reducing costs.
Identifying suitable existing petrol stations for hydrogen facility development needs to factor in the geographical distribution of future demand, potential mobility patterns of end users, and specific functional roles of each station. Industrial-based stations differ from residential-based stations since they support entirely different modes of transportation, mobility patterns, utilisation rates, land uses, etc. Therefore, the way of identifying the spatial centroid of hydrogen demand may influence the selection of suitable petrol stations for hydrogen refuelling. Previous studies on HRSs have considered factors such as construction cost, distance between stations, demand coverage, traffic volume, and network accessibility. However, few studies have analysed how different definitions of spatial representative point affect the selection process of petrol stations and their physical and operational characteristics. The distinction matters since different interpretations of the centroid may reflect different objective priorities for hydrogen infrastructures, such as supply capacity, access to major roads, and residential area proximity.
Hyogo Prefecture is chosen as the area of study due to its diverse regional characteristics, ranging from urban centres, suburban areas, and industrial clusters to sparsely populated municipalities. Such a diversity provides an appropriate condition for analysing whether different spatial demand representations result in different site selection for hydrogen infrastructure. To do so, this study compares three types of spatial representative points for HRS placement: (1) a petrol-station-based centroid derived from the arithmetic mean of existing station coordinates, (2) a population-based centroid derived from official census data, and (3) an industrial-area-based centroid derived from existing industrial areas. The petrol-station-based centroids represent the current spatial structure of the fuel-supply network, population-based centroids represent the concentration of future users, and industrial-area-based centroids represent the spatial structure of industrial and commercial-oriented activities. Estimation for future hydrogen demand is derived from projected figures of FCV adoption and hydrogen consumption for both passenger and commercial vehicles.
The main objective of this study is to observe how different centroid definitions can influence HRS placement and the subsequent geographical and facility characteristics of the selected petrol stations across different wards and municipalities. The study also observes the effect of both passenger and commercial FCVs in determining hydrogen demand and the resulting number of required HRS sites. Through these objectives, the study aims to provide a framework for a phased and geographically adaptable approach for the development of hydrogen refuelling infrastructure.
2. Literature Review and Research Gaps
To solve the HRS placement problem, several mathematical optimisation approaches have been utilised in previous studies, which are based on facility allocation theory. Methods such as the p-median problem [
14,
15,
16], which aims to minimise the distance from the demand point to the facility, and the coverage model, which maximises demand coverage within a certain distance, have been refined into the flow-refuelling location model [
12,
16,
17,
18], which explicitly deals with the filling behaviour along the vehicle’s travel path [
19,
20]. Another method is to utilise the traffic-flow-based allocation model, which emphasises the placement of stations in proximity to the traffic flow on existing routes [
21,
22]. These methods provide established approaches for fuel station placement: spatial-demand-based and vehicle-flow-based proximity [
23].
Recently, newer methods have been implemented for station placement. For instance, several studies focus on case-study-based optimisations by comparing multiple placement models within target areas with consideration of unique and general characteristics of each region. Moreover, some research has taken a bigger step by extending their objective functions not only to urban economies but also to the economic characteristics of rural and urban areas, as well as to the deployment of HRSs in dedicated areas in motorway networks such as parking areas or service areas (PAs/SAs) [
19,
24,
25]. Another approach is through multi-purpose optimisation, which addresses multiple evaluation variables such as distance efficiency as well as construction cost, environmental impact, and social equity, demonstrating that HRS deployment is not merely an efficiency issue but a challenge requiring policy decision-making [
26,
27,
28]. Recent studies include a GIS-based model developed to optimise existing refuelling stations along motorways in Italy, a bi-level model for determining hydrogen costs and range, and a p-median-based framework to integrate multi-objectives for HRSs [
29,
30,
31].
Table 1 summarises the comparison between the existing literature and this study.
While these models can produce mathematically efficient configurations and efficiently evaluate multiple objectives, linking them with practical decision-making processes is still hindered by three main challenges. First, it is necessary to set parameters that influence the outcome, such as objective function weights, constraints, candidate sites, and other assumptions; evaluating their validity requires specialised knowledge. Difficulties in explaining these parameters may complicate decision-making, thus potentially creating different interpretations of results by stakeholders. Second, the high computational load and expanding problem scale due to complex objectives and constraints make it increasingly difficult to obtain solutions within a practical timeframe. Lastly, a highly complex model impedes the interpretability of the results, a common issue in the development of multi-objective optimisation models. As a result, fuel suppliers and municipal governments could not justify the reason behind establishing HRS infrastructure in the particular area chosen by the optimisation model because of the complex reasoning behind the results. Moreover, these challenges make it more difficult for the optimisation results to provide a basis to support investment decisions in HRSs, especially where initial demand is uncertain. In fact, the initial HRS investment is considered to require several hundred million yen [
9], whilst uncertainty about FCV demand has resulted in a significant risk of investment recovery until demand is revived. Therefore, the allocation decision for HRSs requires efficient solutions with a degree of transparency and clear criteria that are acceptable to both operators and the government.
In this context, the proposed co-location concept through petrol–hydrogen combined refuelling stations offers a practical approach in expanding the HRSs to support the hydrogen infrastructure as a whole through transparent candidate-site selection. Utilising existing petrol station sites and infrastructure to establish and, in the future, expand the hydrogen refuelling network, the co-location strategy may reduce the need for new land acquisition whilst simultaneously supporting HRS expansion, whilst maintaining a high degree of accessibility for customers [
32,
33,
34]. However, limited studies have incorporated the effect of alternate centroid definitions on the same existing petrol station candidates for the HRS sites under the same demand estimation and allocation rule. This would serve as a relevant study to capture the effect on HRS site selection for both passenger and commercial FCVs and, subsequently, HRS placement, due to the different spatial characteristics associated with residential and commercial activities in which those types of vehicles are primarily used. In fact, the few studies using such methods are still restricted to municipal-level applications using only publicly available statistical data.
This study utilises a centroid-based method to determine spatial reference points for HRS site selection from existing petrol stations. The sites are selected based on their respective proximity to each reference centroid. Three definitions of centroid are used and compared under similar hydrogen demand, site candidates, and allocation procedure. The greedy algorithm [
35] is applied for allocating the projected demand to its respective selected candidate site whilst maintaining a relatively low computational load to deliver the optimal solutions within a reasonable timeframe. Despite no guarantee that such an approach could produce a globally optimal solution, advantages found in transparent selection criteria, small data requirements, and a relatively straightforward computational process make it suitable for a practical approach to provide the initial framework for preliminary infrastructure planning by both the operators and governments. The method puts priority on handling challenges with practical interpretability and reproducibility over exact optimisation models.
3. Methodology and Data
Hyogo Prefecture is one of the prefectures in Japan that possesses a wide variety of populated areas, ranging from urban areas like Kobe and Himeji to sparsely populated rural and island regions. Such a characteristic provides an ideal case study for analysing alternative HRS deployment strategies. This study combines hydrogen demand with geospatial analysis to identify existing petrol stations as candidate sites for HRSs across 49 municipality- or ward-level areas within Hyogo Prefecture under the co-location concept. Moreover, the study treats existing petrol stations as spatial candidates instead of pre-approved ones for HRS co-location. Candidate selection through HRS-feasibility studies requires multiple data that are not available publicly and needs to comply with related Japanese regulations, which in turn would multiply the required computational time. Therefore, the selected candidates would be treated as priority candidates which require further assessment before actual construction and conversion.
This is achieved through three approaches: petrol-station-based centroids derived from coordinates of existing petrol stations, population-based centroids based on the spatial distribution of residents, and industrial-area-based centroids derived from the existing distribution of industrial sites. The comparison of all approaches examines how each approach to defining centroids may produce different priorities in HRS placement. Hydrogen demand to determine the required number of sites is independently estimated through passenger and commercial vehicle data.
3.1. Demand Assumptions
The hydrogen demand per municipality in the Hyogo Prefecture area used in this study is a proxy obtained by estimating the number of FCVs projected for each prefecture and the average annual hydrogen consumption rate per FCV. Both the estimated number and consumption rate are based on three vehicle categories that encompass both general and commercial purposes: passenger vehicles, heavy-duty trucks, and medium/light-duty trucks. This is to ensure that annual hydrogen consumption for each type can be calculated. Variables used for the calculations can be seen in
Table 2.
The estimation is based on the national target set by the Japanese government of 800,000 FCVs by 2030, which is allocated to each prefecture and municipality based on the proportion of owned vehicles [
3]. The 800,000 FCV target establishes a passenger-equivalent reference level of hydrogen demand rather than evenly distributing FCVs across three vehicle categories. The allocated share of FCVs in Hyogo Prefecture is based on its projected vehicle proportion relative to the national vehicle stock. The assumption used in this study is that the adoption rate for FCVs is uniform and spread proportionally across multiple municipalities. However, it should be noted that this study does not imply that every owned vehicle will be converted into an FCV in the future. Therefore, vehicle ownership acts as a spatial proxy for FCV allocation rather than as a baseline figure for complete FCV replacement. Projected vehicle ownership in 2030 is determined using the FY2020–FY2024 compound annual growth rate [
36]. Commercial vehicles are divided into heavy- and medium/light-duty; from the nationwide commercial vehicle data, heavy-duty vehicles accounted for 42.7% and 57.3% for medium/light-duty ones [
37]. This ratio is used as the baseline uniform ratio across municipalities due to data unavailability at the municipal level. The uniform FCV adoption rate is determined to keep the hydrogen demand for all three FCV types in line with the hydrogen demand reference allocation in Hyogo Prefecture. The figures for vehicle stock used in this study are 83,100,000 and 3,371,134 at the national and Hyogo prefecture level, respectively. The Hyogo figure is projected to be 3,319,364 vehicles in 2030. Based on these data, Equation (1) allocates the national figure of hydrogen demand to Hyogo in proportion to the projected vehicle share, giving the annual hydrogen demand of 3,067,716 kg/year for Hyogo Prefecture. Equation (2a) then sets the common FCV adoption rate, rated at 1.321%, to preserve the total hydrogen demand while accounting for different annual hydrogen consumptions across multiple vehicle types of passengers, heavy-duty, and medium/light-duty FCVs. The number of FCVs for each municipality is then determined using Equation (2b).
The annual hydrogen consumption per FCV is calculated using the assumed fuel consumption rate of 0.8 kg/100 km and an average annual mileage of 12,000 km [
38]. Based on this, the estimated consumption is around 96 kg/year. Meanwhile, for commercial FCVs, the average annual mileage is derived from the five-year average of annual travel data for FY2020–FY2024 [
36]. This brings annual mileages for heavy-duty and medium/light-duty of 19,720 km and 19,541 km, respectively. Based on the commercial vehicle specification, the consumption rate is rated at 7.69 kg/100 km for heavy-duty trucks and 4.03 kg/100 km for medium/light-duty trucks [
39,
40]. Based on these, the estimated consumptions are around 1517 kg/year for a heavy-duty truck and 788 kg/year for a medium/light-duty truck. Using annual consumption and the number of FCVs in each municipality, the annual hydrogen demand for each municipality is calculated with Equation (4). Hence, the overall hydrogen demand in each municipality represents the combined consumption for all FCV types. The total annual hydrogen demand (kg/year) for each of the 49 municipalities and wards in Hyogo Prefecture can be obtained.
The number of required HRSs is determined by the number of annual hydrogen demand per municipality or ward and the predetermined annual supply capacity of 96,000 kg/year per HRS, or approximately 263 kg/day. This figure is obtained through the annual consumption of 1000 passenger FCVs at 96 kg/year per vehicle. It is then used as the baseline reference number for annual hydrogen supply for each HRS for all types of FCVs. Moreover, the caps are equivalent to the full operation of a standard 300 Nm
3/h class station (about 27 kg/h) for about 10 h per day [
41,
42]. The reference figures of 800,000 FCVs and 1000 HRSs national target give an average ratio of 800 FCVs serviced per station. However, because this study includes multiple vehicle types with different consumption rates, HRS capacity is expressed by annual hydrogen supply capacity rather than a fixed number of vehicles. Using Equation (5), the required HRSs in each municipality or ward is obtained by dividing the municipal/ward-level annual hydrogen demand by the annual supply capacity of 96,000 kg/year per HRS. Because detailed commercial-vehicle travel-distance and payload-class data are not available at the municipality level, national average values are used as proxies for the commercial-vehicle component. In addition, the loaded vehicle-kilometre statistics do not include empty-vehicle repositioning. The resulting commercial-vehicle hydrogen-demand estimates should therefore be interpreted as conservative approximations rather than precise forecasts of future freight-related hydrogen consumption.
For the hydrogen demand estimation,
j represents the vehicle type:
Annual hydrogen demand allocated to Hyogo Prefecture (kg/year):
With three vehicle types, we first need one uniform adoption rate:
Using prefecture-level projected vehicle stocks and vehicle-specific annual hydrogen consumption, Equation (2a) gives an adoption rate r of 0.013212 or 1.32%. The rate is applied to the municipal-level projected vehicle stock of each category in Equation (2b). Therefore, r is an internally defined parameter rather than an externally based FCV adoption rate.
Number of fuel cell vehicles (FCVs) by municipality and vehicle type:
Annual hydrogen consumption per FCV by vehicle type (kg/year):
Annual hydrogen demand (kg) in the target municipality:
Number of stations required by each municipality based on demand volume:
Due to the discrete nature of the threshold and rounding rule, the allocations for HRSs that are close to a capacity limit are sensitive to changes in demand; for example, a municipality with an allocation number that is slightly above or below the one-unit threshold (e.g., 1.015 or 0.987). Therefore, any allocation close to the boundary of the number of sites should be interpreted as indicative.
3.2. Hydrogen Refuelling Station Placement Model
To analyse the spatial allocation of HRSs, a centroid-based distance minimisation approach is applied in combination with a greedy-search algorithm for site allocation [
26,
35]. Representative spatial centroids are generated from three different perspectives for each municipality to approximate the hydrogen demand centre. Three alternative centroid formulations are used to define the centroids: petrol-station-based centroids, population-weighted centroids, and industrial-area-based centroids. The allocation results are then compared to assess how each centroid point alternative may influence the selected location and its characteristics under similar variables.
3.2.1. Definition of Centre of Gravity
This study utilises representative spatial centroids of hydrogen demand to evaluate candidate HRSs within each municipality. The spatial centroid is represented by the centre of gravity and provides a basis for distance measurement in hydrogen station placement. To account for differences between existing spatial characteristics across municipalities, three centroid definitions are used. These centroids allow the station allocations to be obtained under multiple reference points, which will then be examined to see how different centroid definitions can influence the HRS placement [
27,
43]. The definitions of variables used in this study are shown in
Table 3 below.
3.2.2. Centre of Gravity for Existing Petrol Station
The mean centroid of petrol stations is calculated as the arithmetic average of the latitude and longitude of all existing petrol stations within each municipality. This centroid indicator reflects the physical distribution of current fuel supply infrastructure and the existing petrol-station network. Regardless of differences in size or fuel throughput, all existing stations are assigned equal weight for the centroid calculation. Therefore, the centroid represents the spatial distribution rather than different station groups based on operational scale. It is defined as follows:
where
CGGS,i is the petrol-station-based centroid in the municipality
i, while each station’s latitude and longitude are represented by
Stationj.
3.2.3. Centre of Gravity by Population Distribution
This centroid definition reflects the spatial distribution of the population and provides an approximation of hydrogen demand based on daily mobility and residential activity due to its representation of the place of residence of the population. Therefore, station placement based on a population-weighted centroid generates HRS sites closer to the concentration of the resident population. However, such placement may not align with the spatial distribution of the existing fuel supply infrastructure.
The population-based centroid
CGPOP,i is obtained from the official government data published by the Statistics Bureau of Japan based on the latest population census of 2020 [
44]. The bureau determines the centroids through residents’ geographic distribution within each municipality, where the locations are weighted in accordance with the population. The generated centroids represent the population-weighted mean spatial balance point for the population of each municipality or ward. These official data are adopted and used in this study.
3.2.4. Centre of Gravity by Industrial Area
The centroid represents the spatial distribution of industrial land in each municipality. Each polygon is weighted according to its area to maintain proportionality of larger industrial areas, which in turn would contribute more proportionally to generating centroids. It is defined as follows:
where
CGcIND,i is the industrial-area-based centroid in municipality
i, centroid of the industrial polygon
k is represented by
Industriali,k, and the area of the polygon is represented by
Ai,k. The industrial site polygons are obtained from the Japanese official statistics data derived from the 2009 survey conducted by the Ministry of Land, Infrastructure, Transport and Tourism [
45]. The Industrial Land dataset was used, covering industrial sites of at least 10 ha. The generated centroids represent the industrial land distribution instead of commercial-FCV hydrogen demand. The eligible industrial areas, which are composed of sets of polygons, are assigned based on their administrative location. The centroids are weighted by the area of the industrial polygon. The HRS allocations in each municipality or ward are done under the industrial-area-based centroid definition containing eligible industrial land.
3.3. Optimisation Steps
A greedy search-based placement algorithm is adopted to determine the hydrogen station allocation. First, geodesic distances are calculated between each municipality’s centre of gravity and its respective petrol station candidates, which are subsequently evaluated in order of closeness. These distances represent spatial separation between the candidate site and centroid rather than real-life road network-based distances. Road network-based validation is outside the scope of this study. Then, the required number of HRSs is determined based on hydrogen demand in each municipality. Whilst the algorithm does not guarantee a globally optimal solution, it offers low computational load, swift implementation, and transparency in the site selection process, making it suitable for this study, which focuses on practical HRS planning at the municipal level. Distance calculation for each centroid is defined separately.
For the petrol-station-based centroid:
For the population-based centroid:
For the industrial-area-based centroid:
The optimisation results are organised into a dataset containing the estimated hydrogen demand for each municipality, the number of allocated hydrogen stations, and the selected candidate petrol station sites. In addition, geospatial visualisations are produced, illustrating the spatial relationship between each municipality’s centroid and its assigned hydrogen stations. Based on the visualisations, a comparison of how different centroid definitions influence the spatial distribution of hydrogen station placements is conducted. The results found that some of the selected sites under the population-based definition also correspond to the petrol-station-based definition. To ensure that the selected sites are matched with the correct centroid definition, the respective results from all centroid definitions are then reverified against their respective centroid before generating the final results.
Table A1 and
Table A2 in the
Appendix Section show the list of centroid coordinates and selected site information used in the analysis.
4. Results
The results of hydrogen demand forecasts for each municipality in 2030 are shown in
Table A1 and
Table A2 in the
Appendix Section. The demand was generated through the allocation model defined in
Section 3.1 (Equations (1)–(4)). Predicted FCVs in each municipality or ward, both passenger and commercial, are obtained through a series of calculations in Equations (1)–(2b) of
Section 3.1. The national target is used as the baseline reference in Equation (1) for total hydrogen demand estimation. The number of FCVs is then calculated by applying the uniform adoption rate obtained from Equation (2a) to the projected 2030 vehicle numbers of each type in each municipality or ward rather than direct proportional allocation of the national FCV target. Using the capacity threshold defined in Equation (5), 22 hydrogen stations were allocated to nine municipalities and wards in Hyogo Prefecture. The areas targeted are Higashinada Ward, Kita Ward, and Nishi Ward of Kobe City, Himeji City, Amagasaki City, Akashi City, Nishinomiya City, Itami City, and Kakogawa City, all of which are regions expected to have relatively high hydrogen demand in the future. These municipalities are densely populated and possess a high number of vehicles, thereby providing a potential priority for future FCV adoption.
The results show variations in predicted FCV vehicles in 2030 across municipalities and wards. This is due to different hydrogen demand, which is influenced by both the current number of conventional vehicles and the hydrogen consumption of different vehicles. As a result, municipalities with higher amounts of both passenger and commercial vehicles tend to have larger hydrogen demand. This affects the number of required HRS sites, with Himeji City as the municipality with the highest hydrogen demand, with four HRSs; Amagasaki City and Nishinomiya City with three HRSs; and the remaining municipalities and wards requiring two HRSs each.
The following subsections compare placement results of three types of centroid definitions: petrol-station-based centroids, population-weighted centroids, and industrial-area-based centroids. Analysis of the characteristics and differences of each placement is done afterwards. The allocated number of HRSs is determined by hydrogen demand; therefore, it is constant throughout the three different centroid definitions. The difference lies in the reference centroids used to select the suitable HRS sites from existing petrol station candidates. This enables the analysis of different centroid definitions in the HRS site selection process under the same initial variables.
4.1. Placement Results Based on Existing Petrol Station Average Centroids
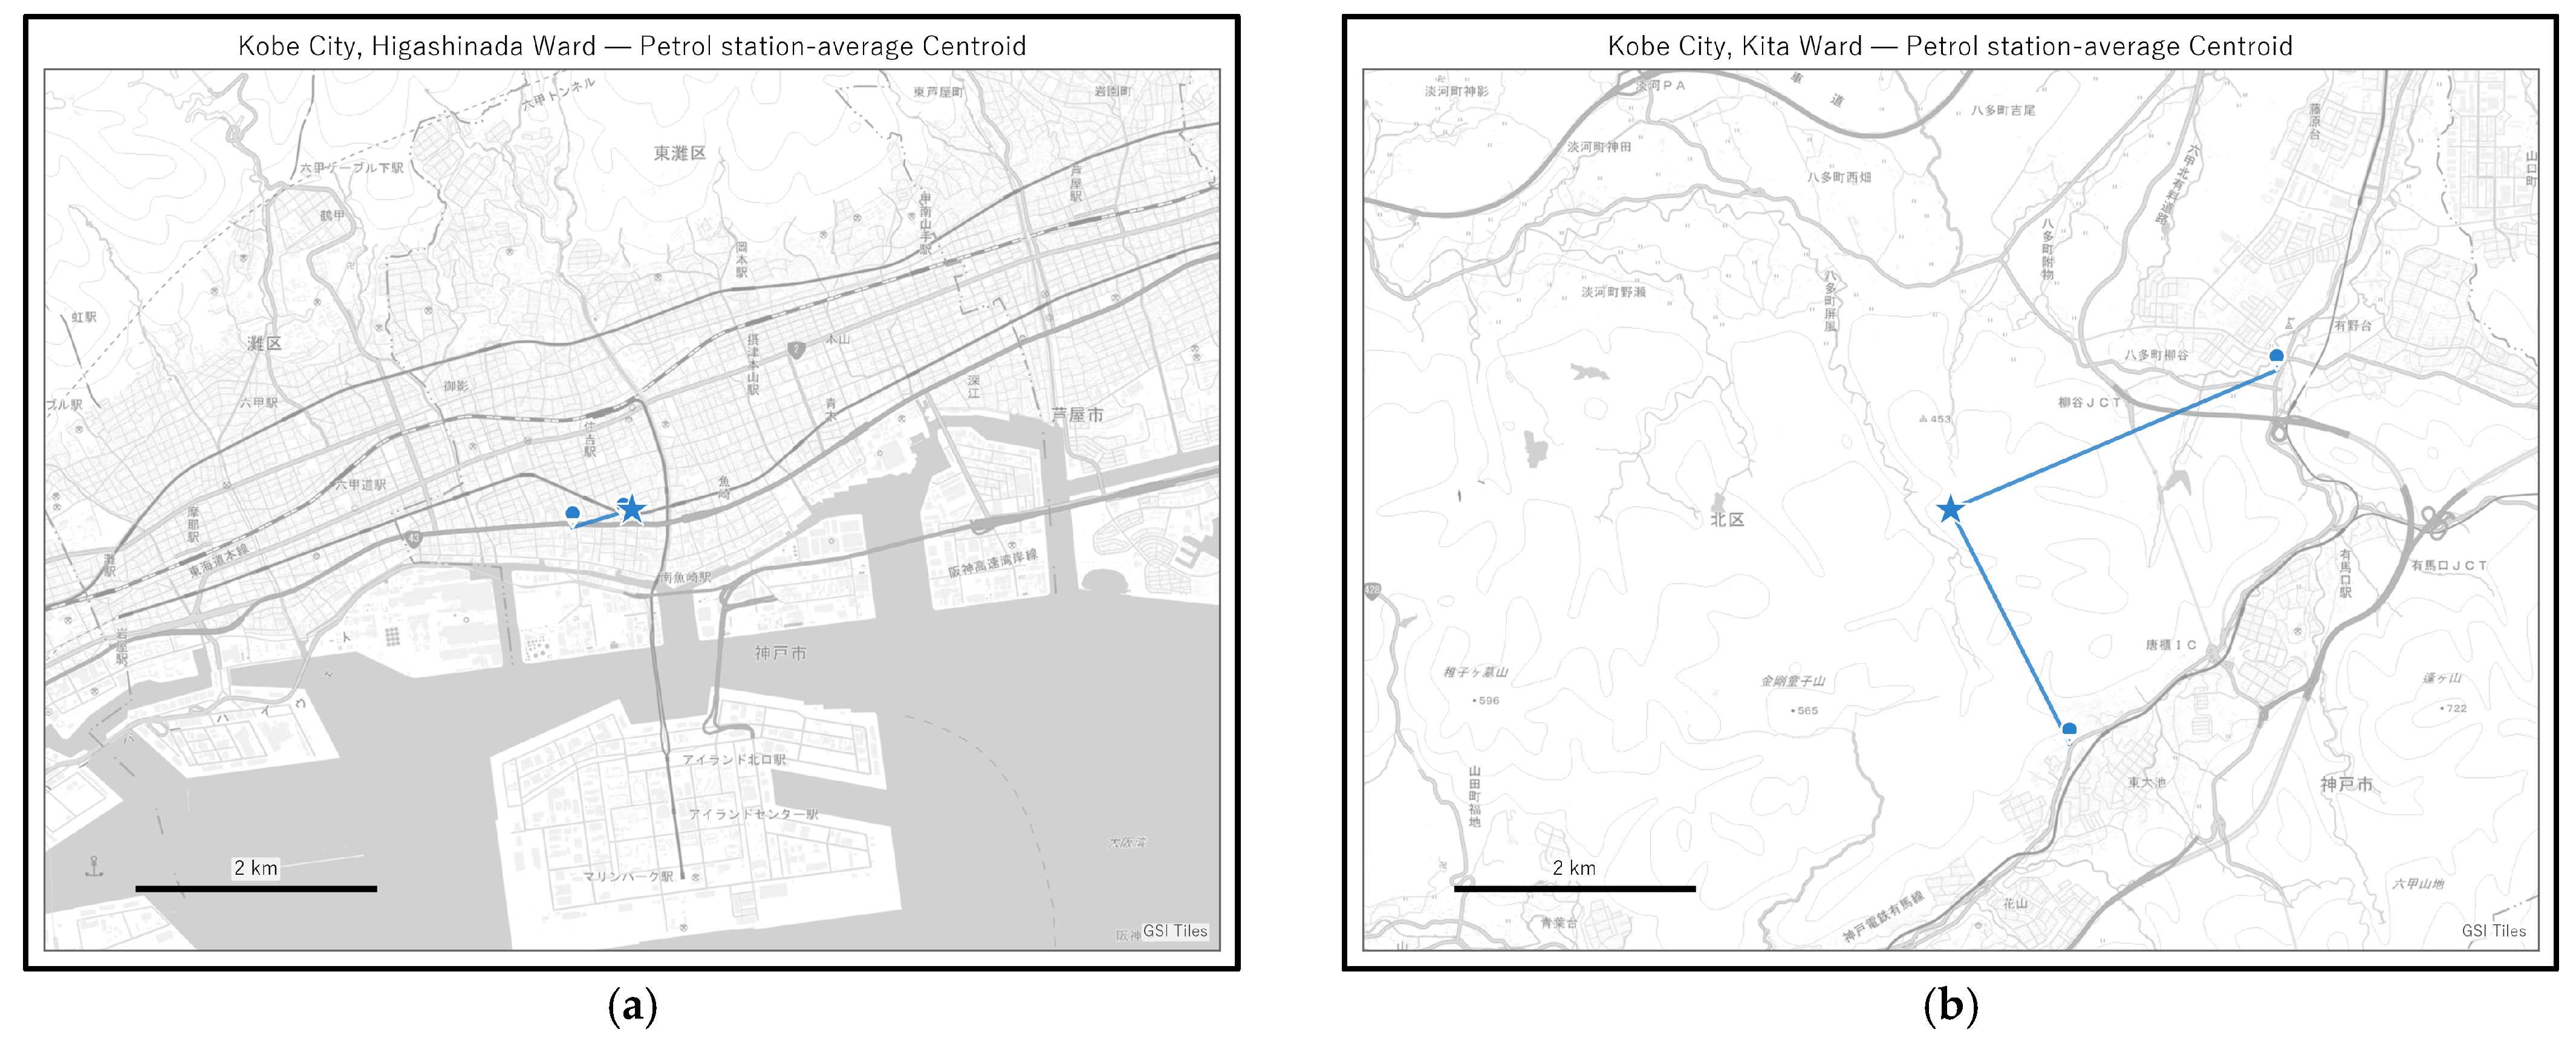
When using the average centre of gravity of petrol stations, HRSs tend to be concentrated in the current spatial distribution of the existing network. As a result, the selected locations mainly represent continuity with the already established network rather than representing hydrogen demand for residential or industrial areas. However, several municipalities/wards show that the selected sites are aligned with the selected sites under population-based centroids. This indicates that the fuel network and spatial residential distribution are aligned in some areas. The average distance of each centroid to its allocated HRS sites is approximately 1.20 km.
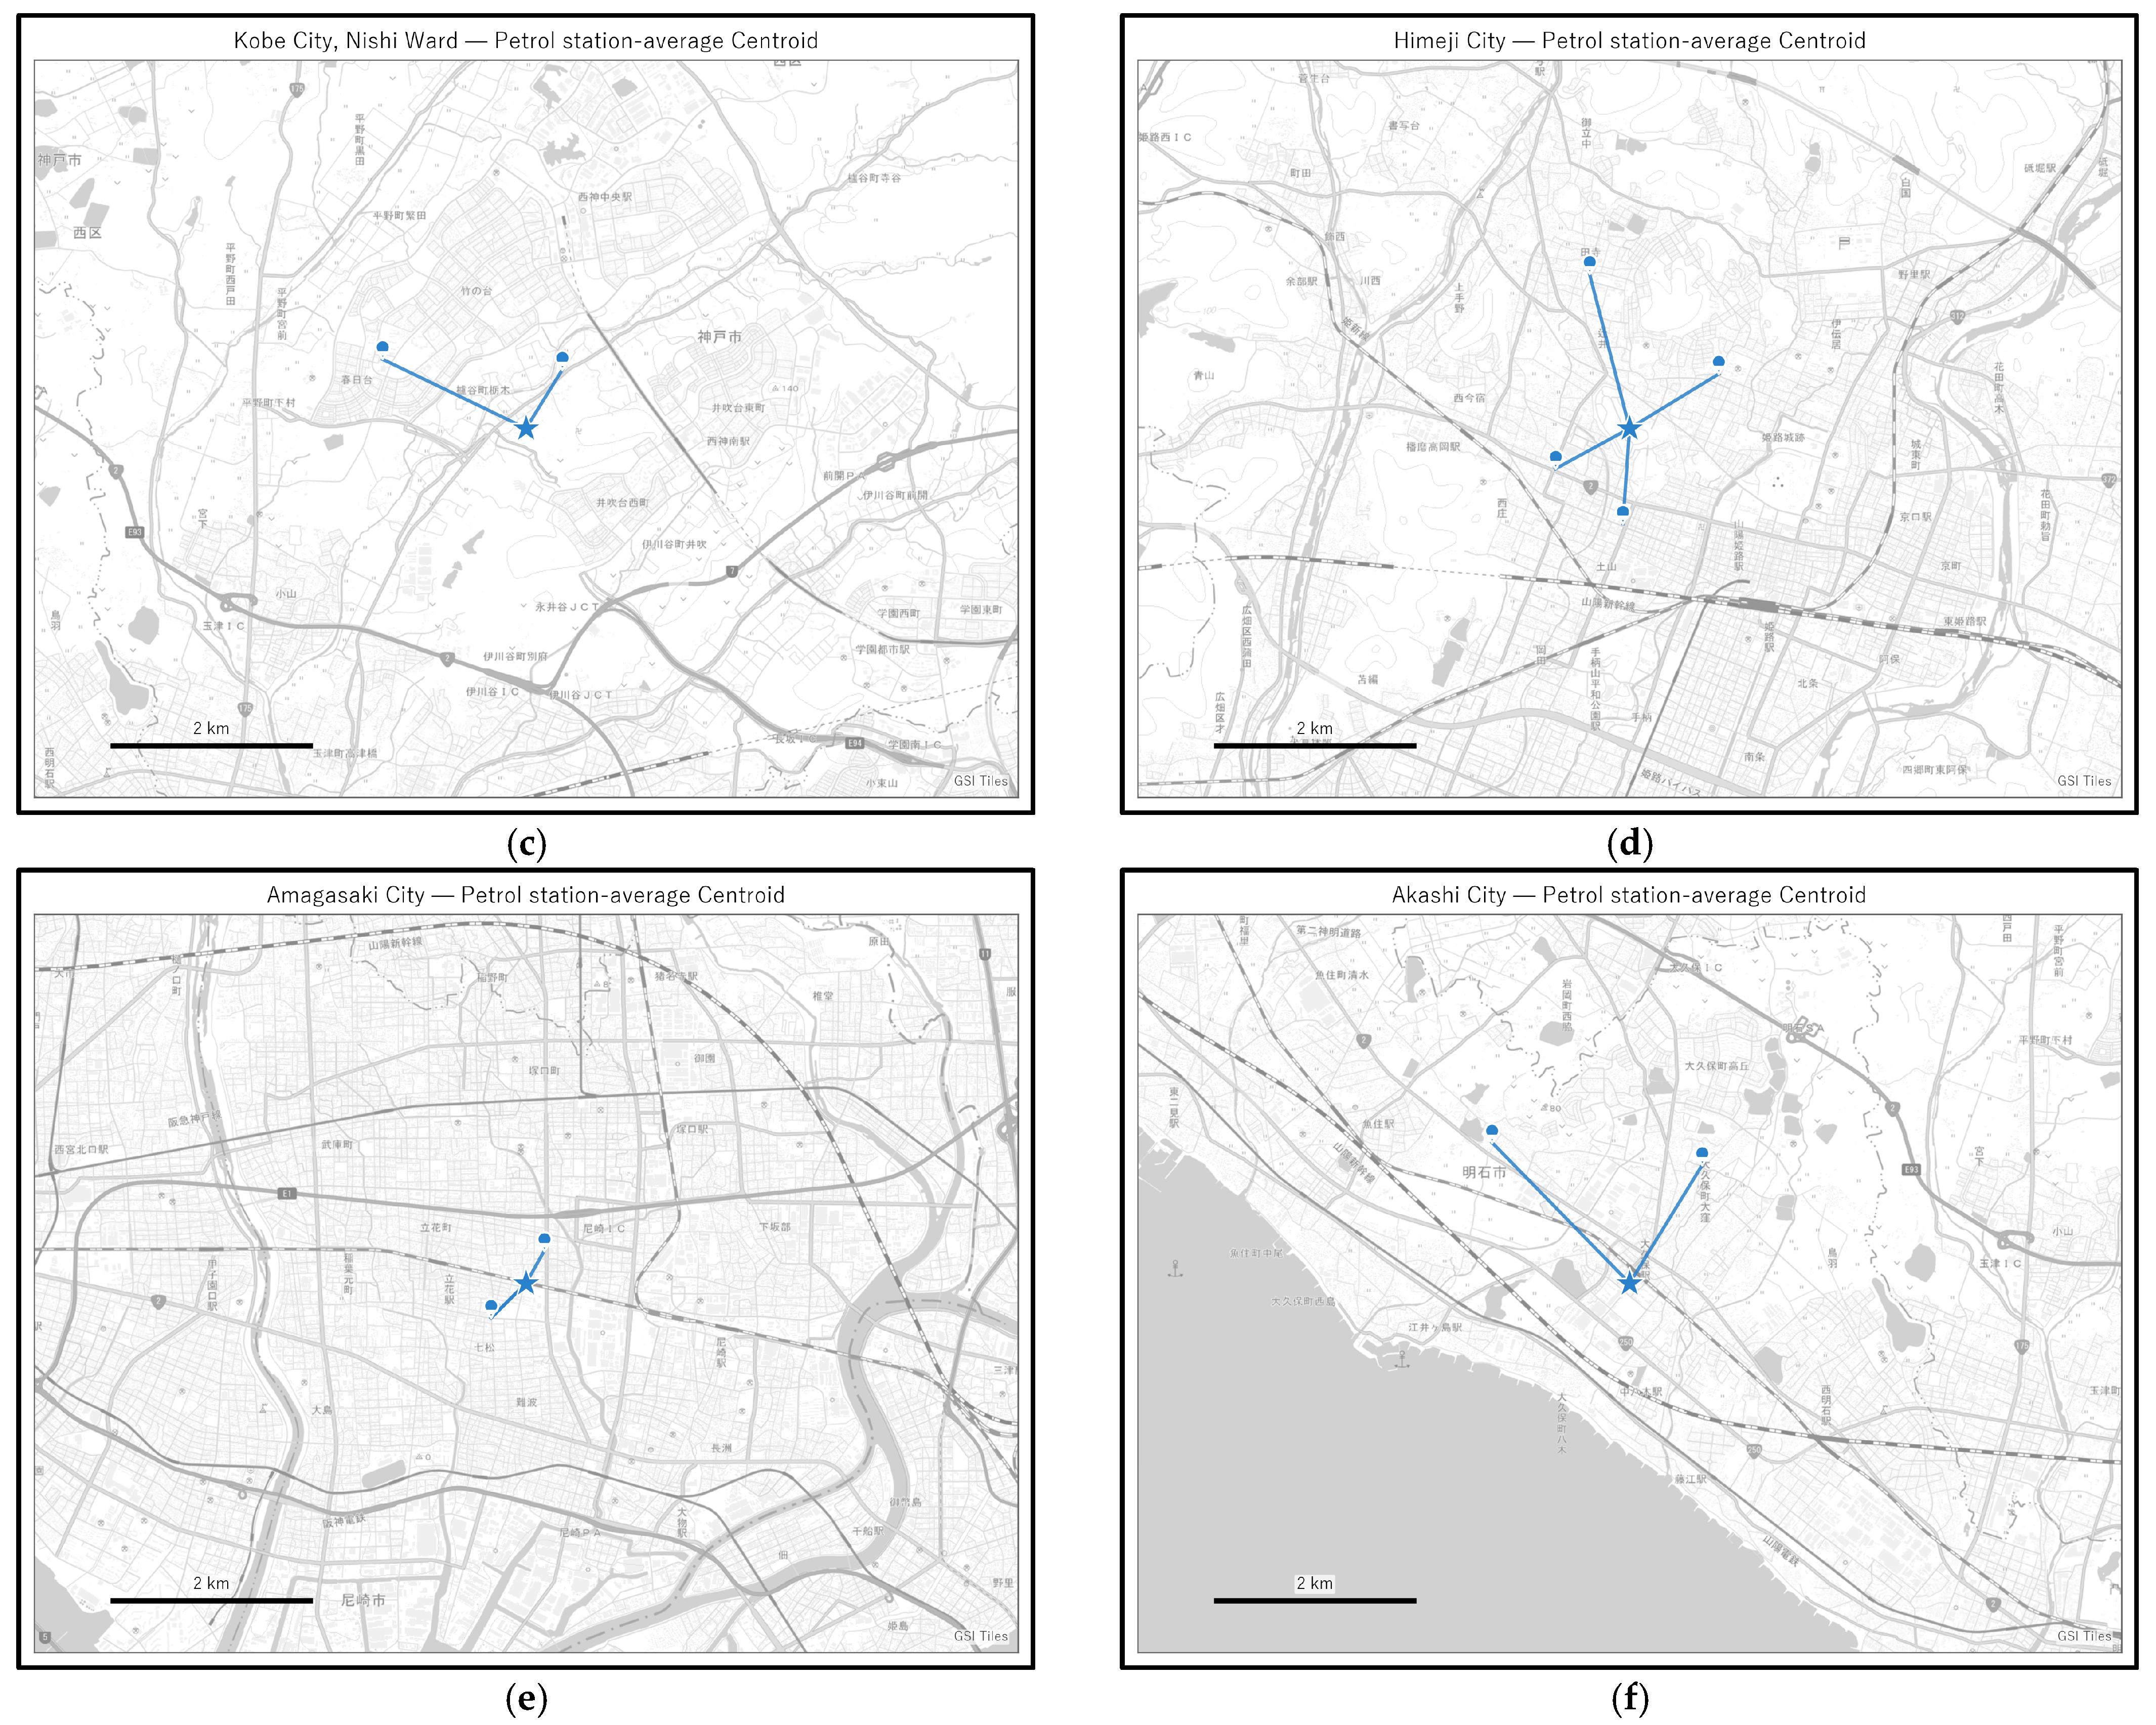
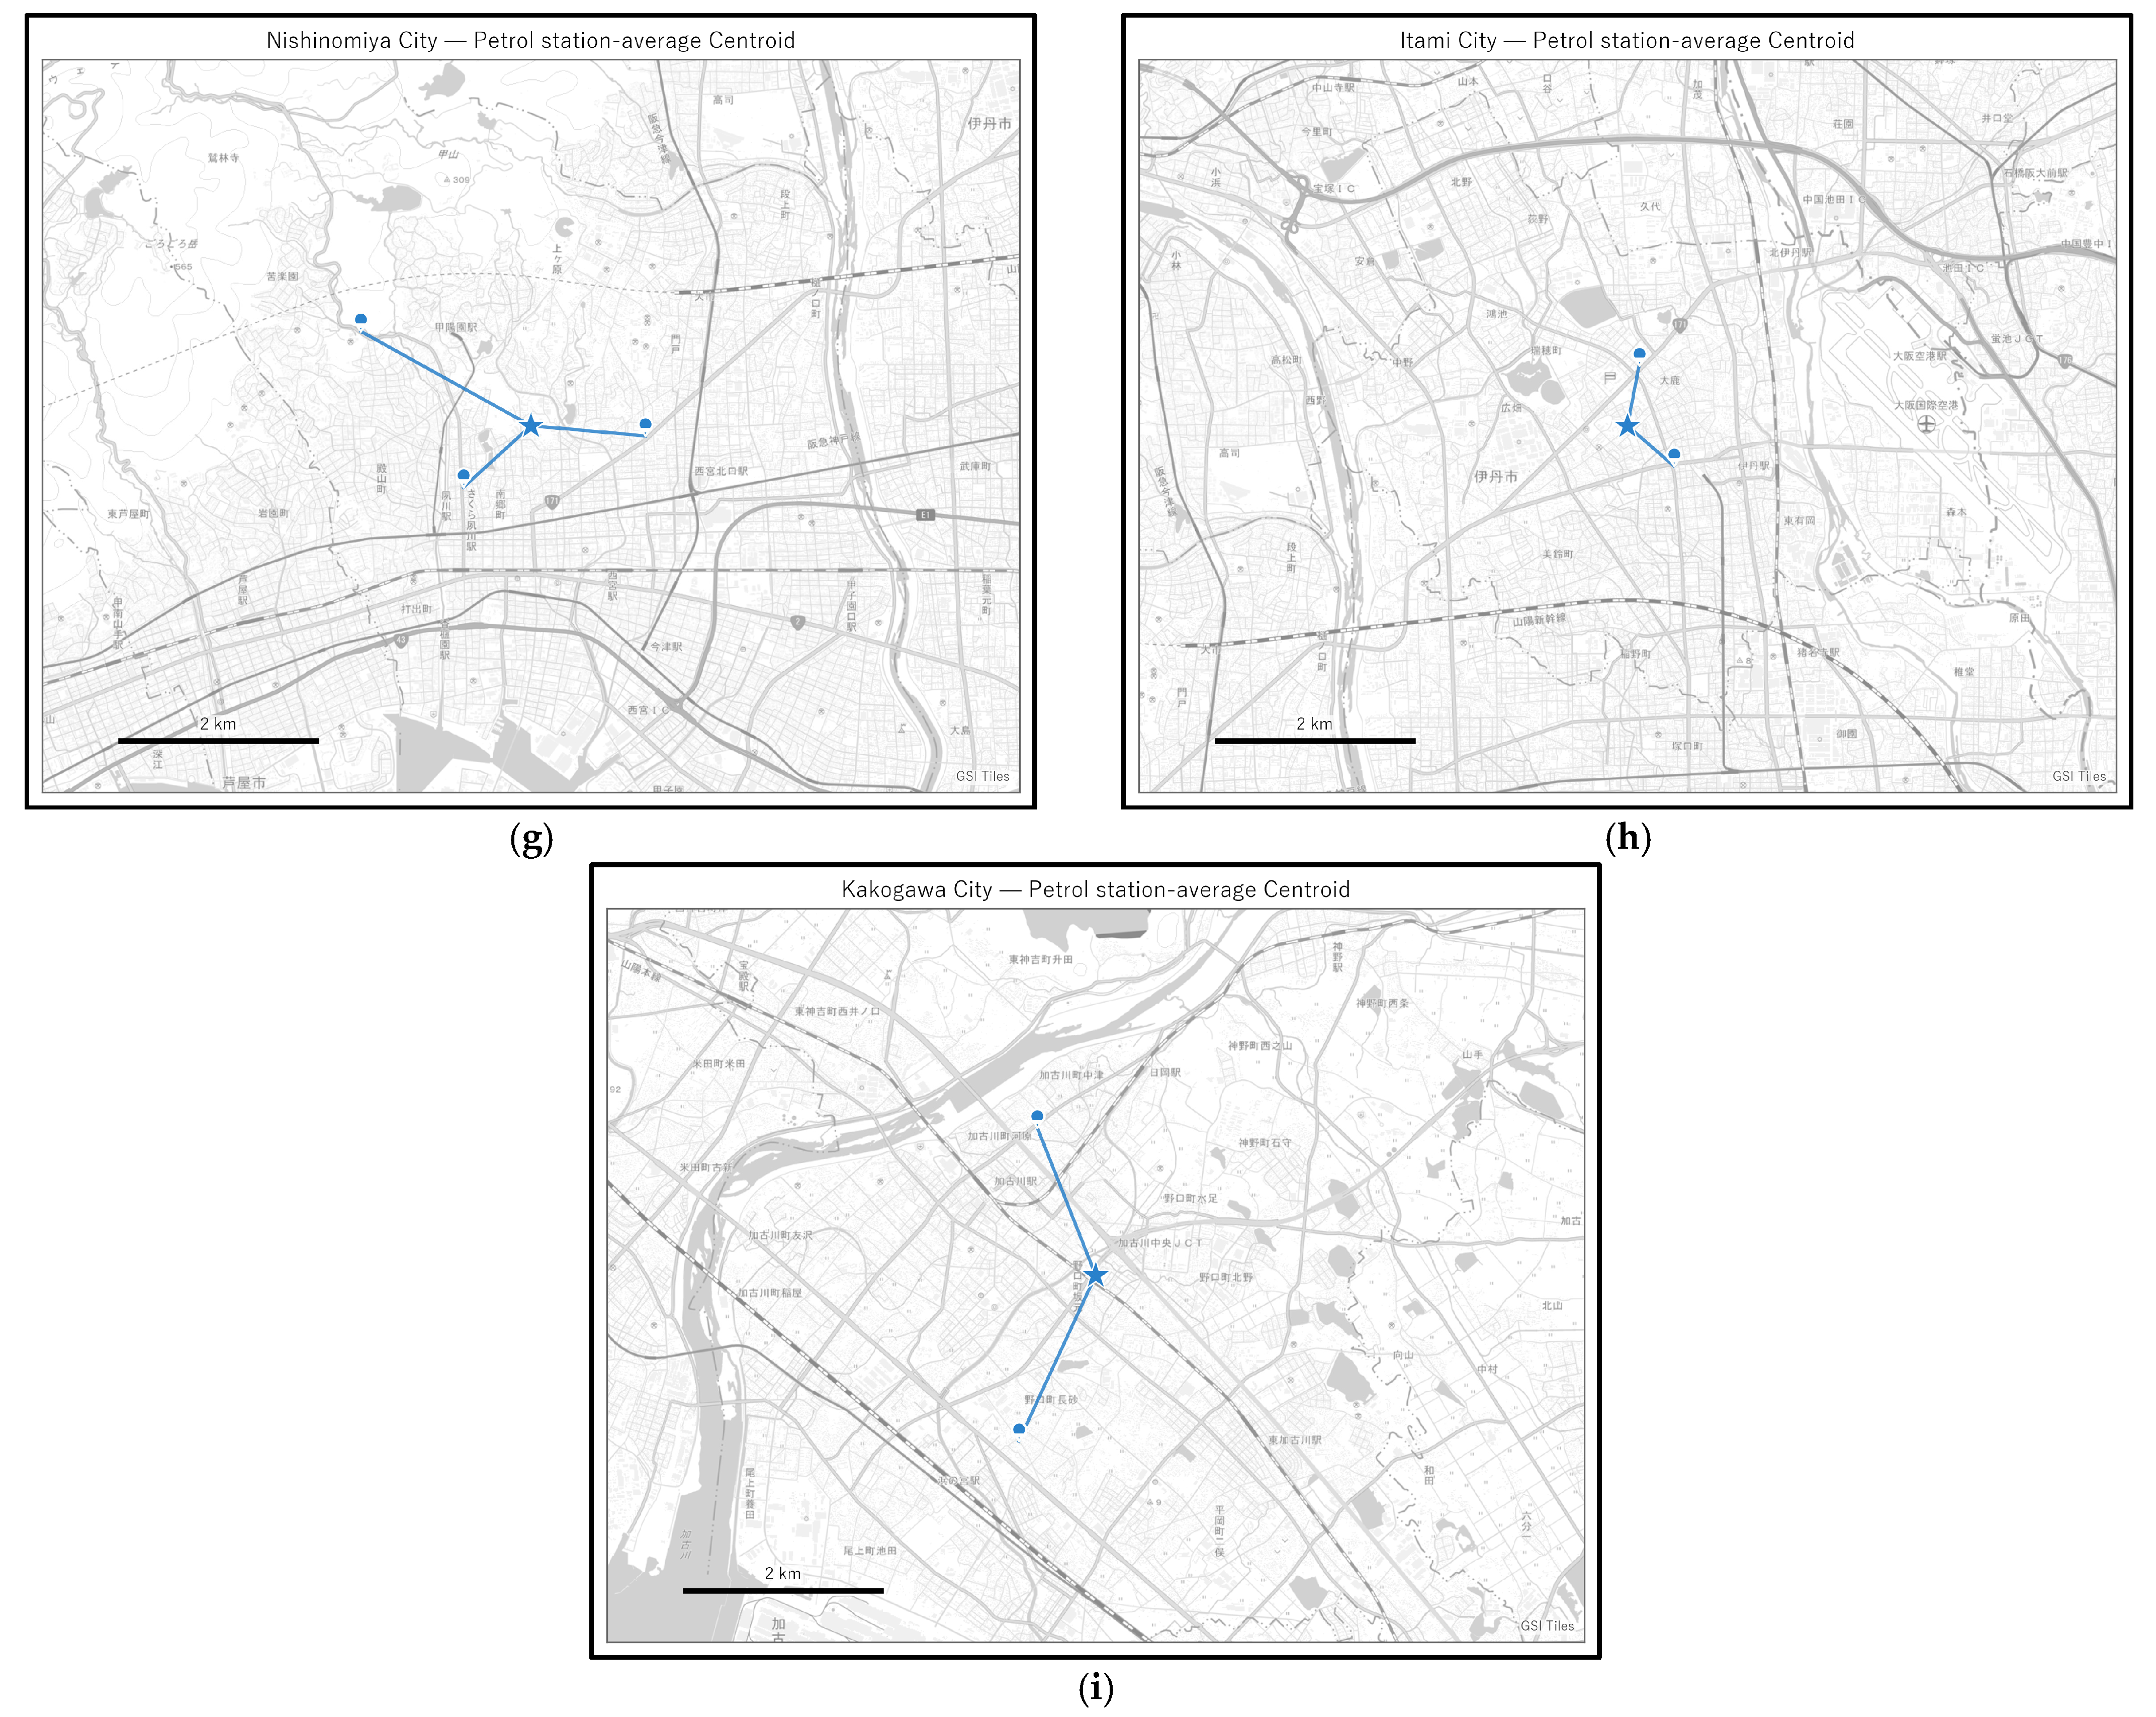
Table 4 and
Figure A1 provide detailed allocation results for Higashinada Ward, Kita Ward, and Nishi Ward of Kobe City, Himeji City, Amagasaki City, Akashi City, Nishinomiya City, Itami City, and Kakogawa City. Blue pins in each figure indicate the hydrogen stations assigned to the respective municipality. Himeji City has the highest demand; therefore, more HRSs are allocated in this municipality in comparison to others.
4.2. Placement Results Based on Population-Weighted Centroids
When using a population-weighted centroid system, hydrogen stations tend to be selected in closer proximity to the residential area. This is due to an emphasis on access to densely populated residential areas, resulting in a shorter overall average distance to demand points. However, it should also be noted that the centroid must be treated as a reference population point that represents probable FCV users in the future. The average distance of each centroid to its allocated HRS sites is approximately 1.06 km, the shortest among all centroid definitions. Overall, 13 out of 22 sites share the same locations with the ones selected under the petrol-station-based definition. This layout method generates HRS site candidates closer to residential areas, indicating a shorter spatial distance under the population-based centroid definition. However, due to the geodesic nature of the measurement process, the result does not necessarily represent shorter road-network travel distance or travel time, as these aspects are not discussed in the present model.
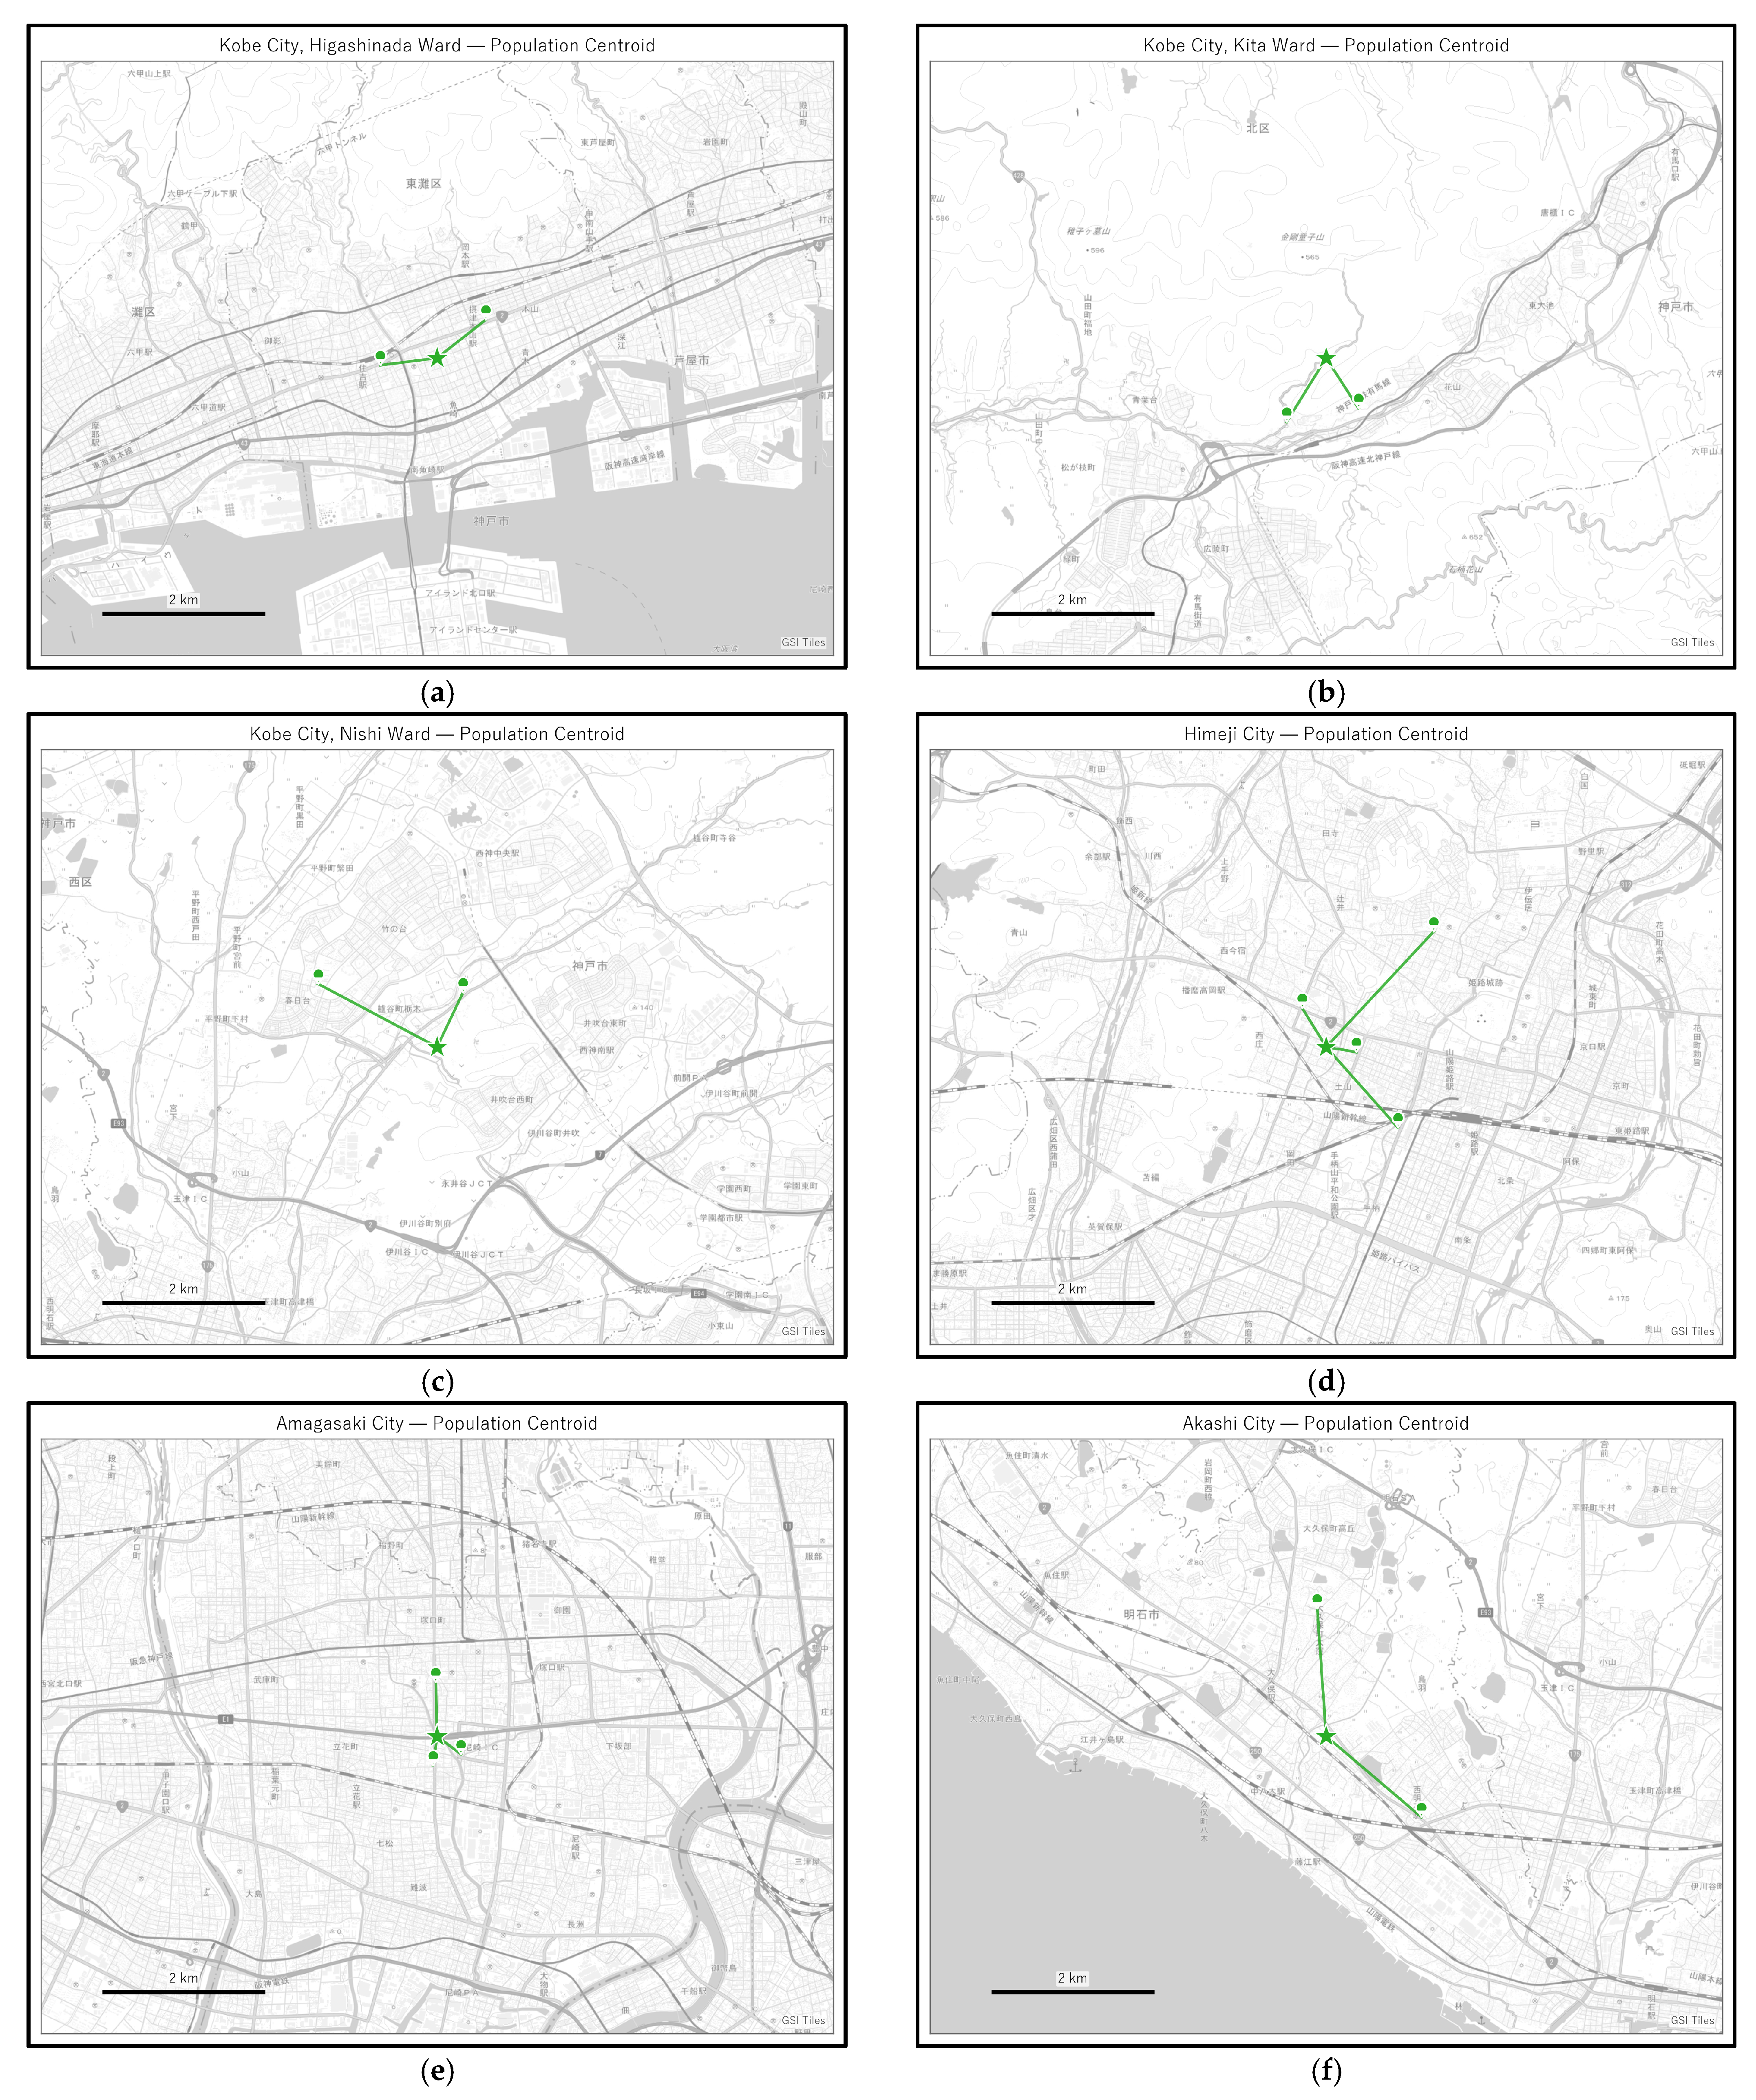
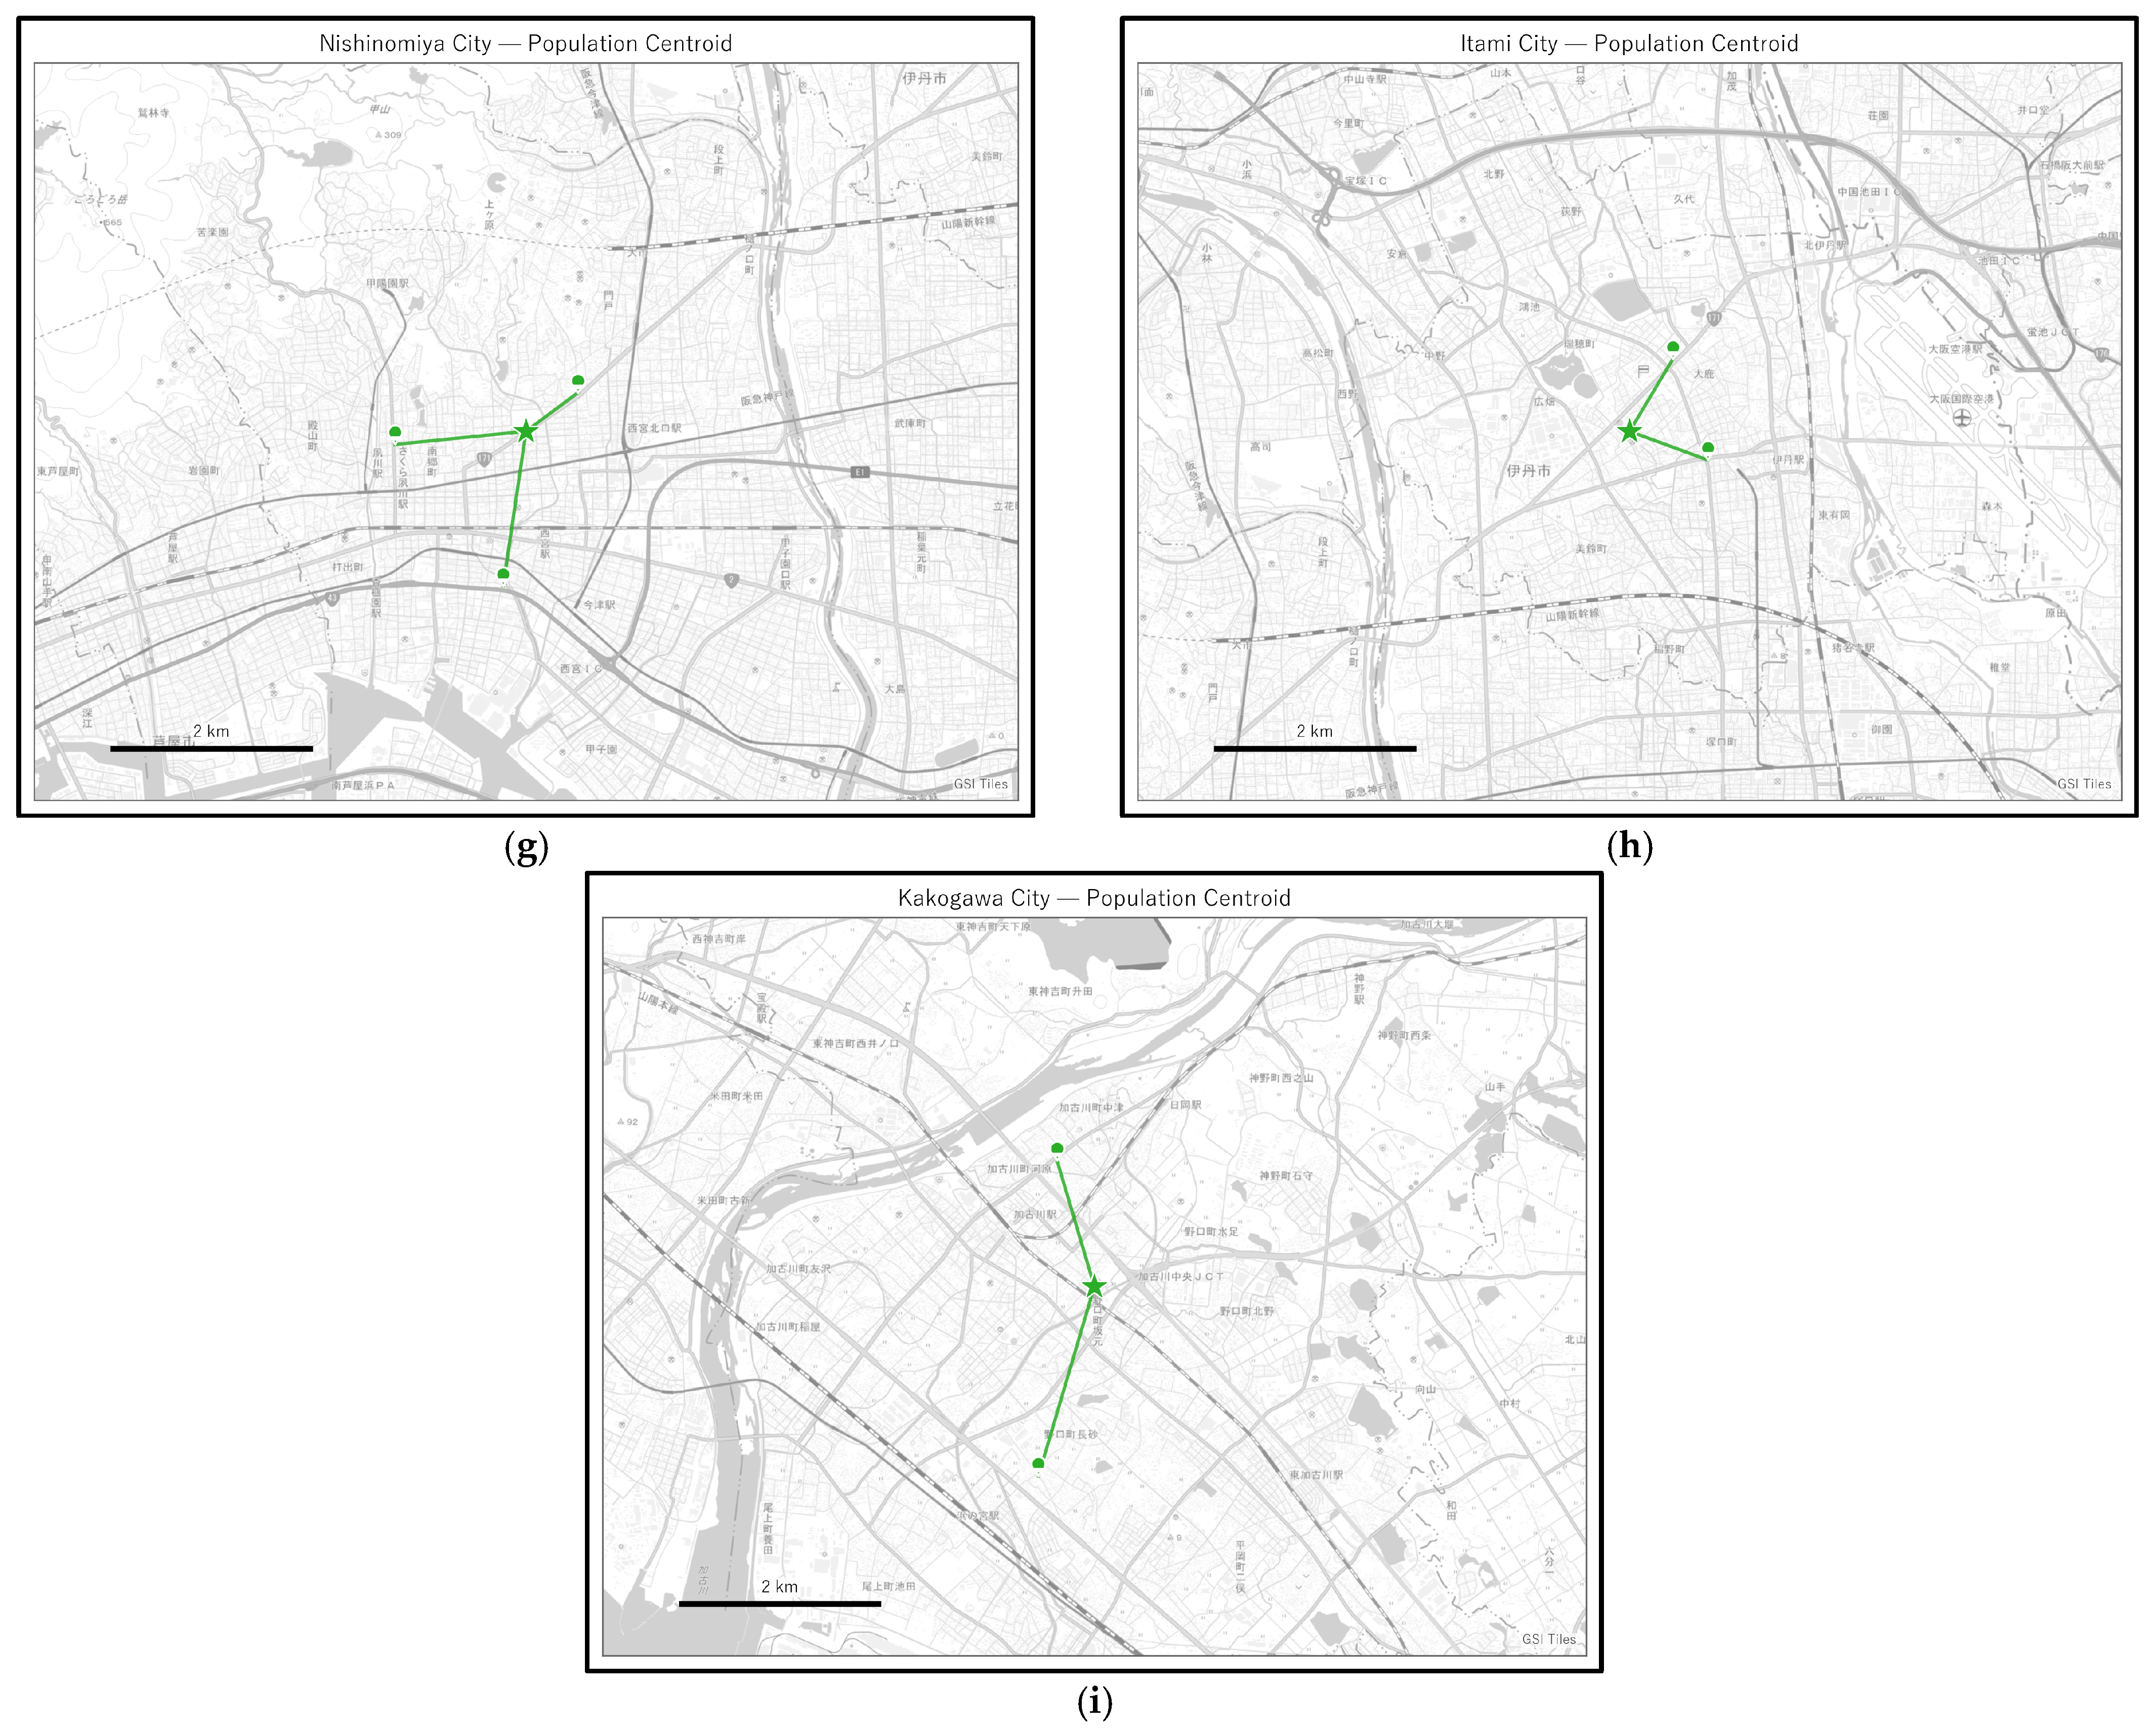
Table 5 and
Figure A2 show detailed placement results using population-weighted centroids. Green pins in each figure indicate the hydrogen stations assigned to the respective municipality, and, as with the average centroid of petrol stations, sites are allocated according to the demand scale.
4.3. Placement Results Based on Industrial-Weighted Centroids
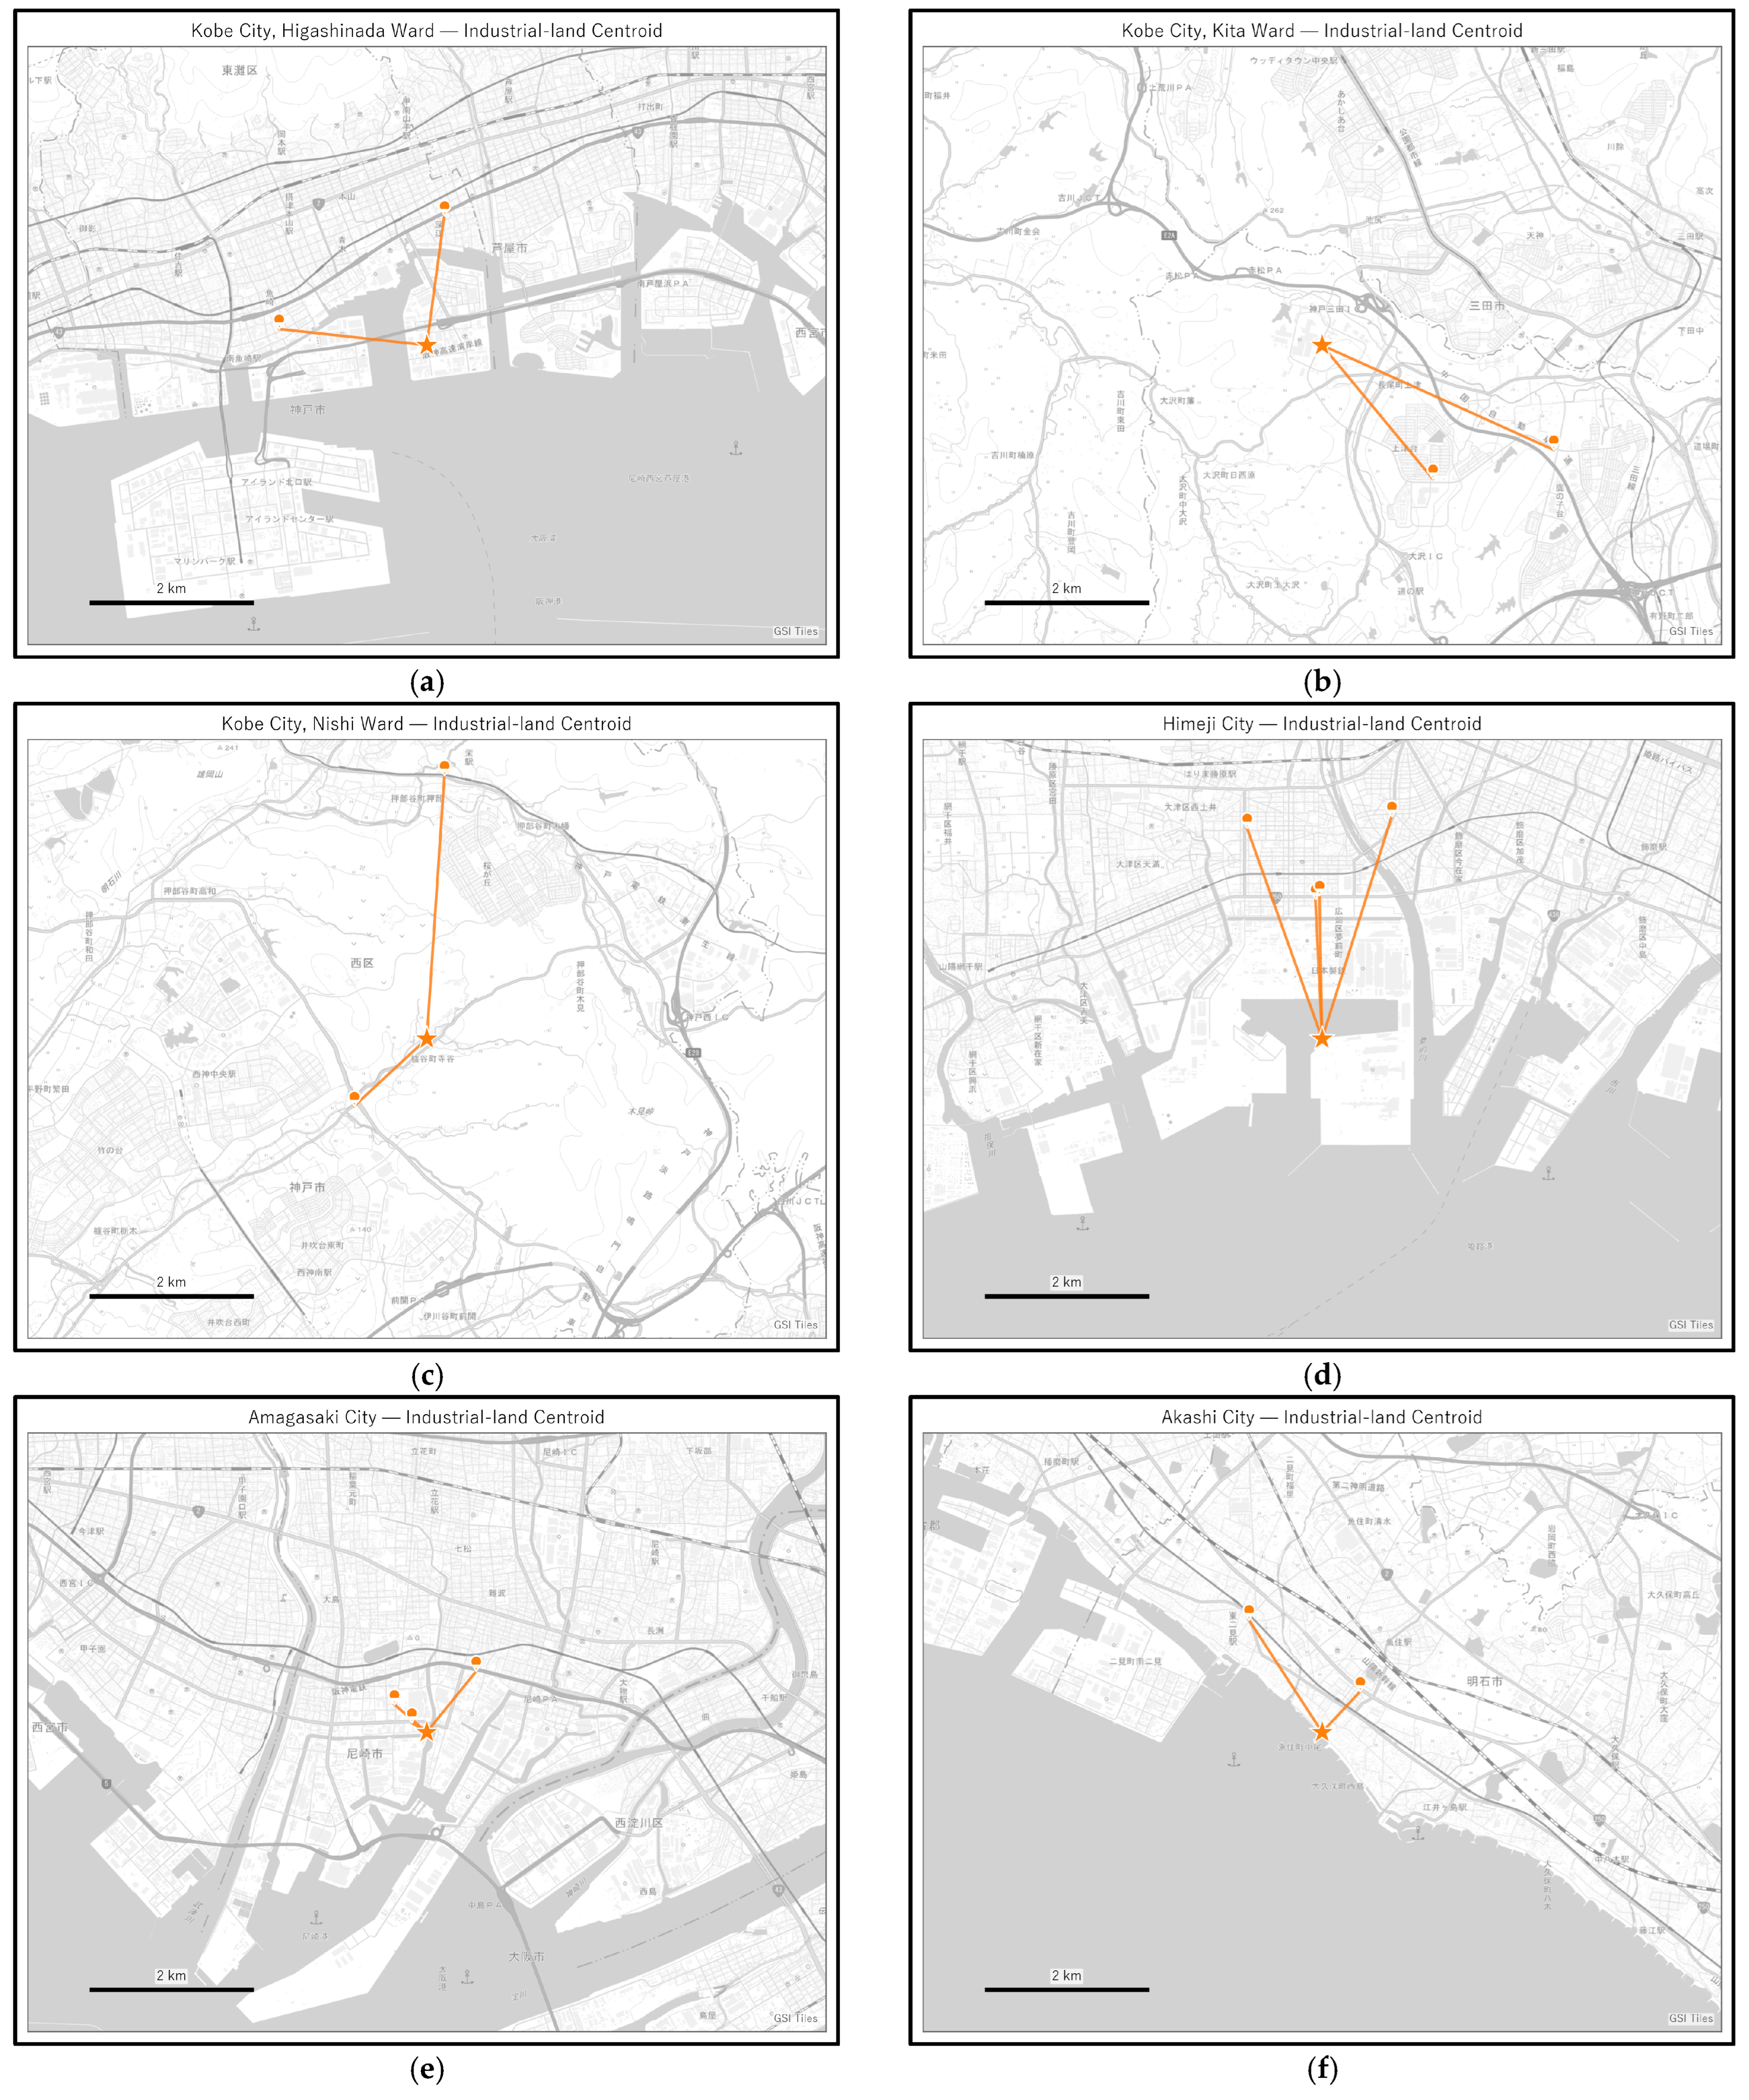
Unlike petrol stations and population centroids, an industrial-area centroid determines the spatial reference point through weighted distribution of industrial areas within a land agglomeration in each ward or municipality. Therefore, the centroid represents the spatial concentration of industrial land, which is relevant to the hydrogen demand of commercial FCV due to high utilisation of such a vehicle type within the area. The distinct noticeable results are observed in this centroid definition compared to the first two centroid definitions. The average distance of selected HRS sites to the industrial-area-based centroid is 1.67 km. Moreover, the separation is also noticeable from the distance between the industrial-area-based centroid and the petrol-station-based centroid, with an average of 4.48 km and from the population centroid, with an average of 4.83 km.
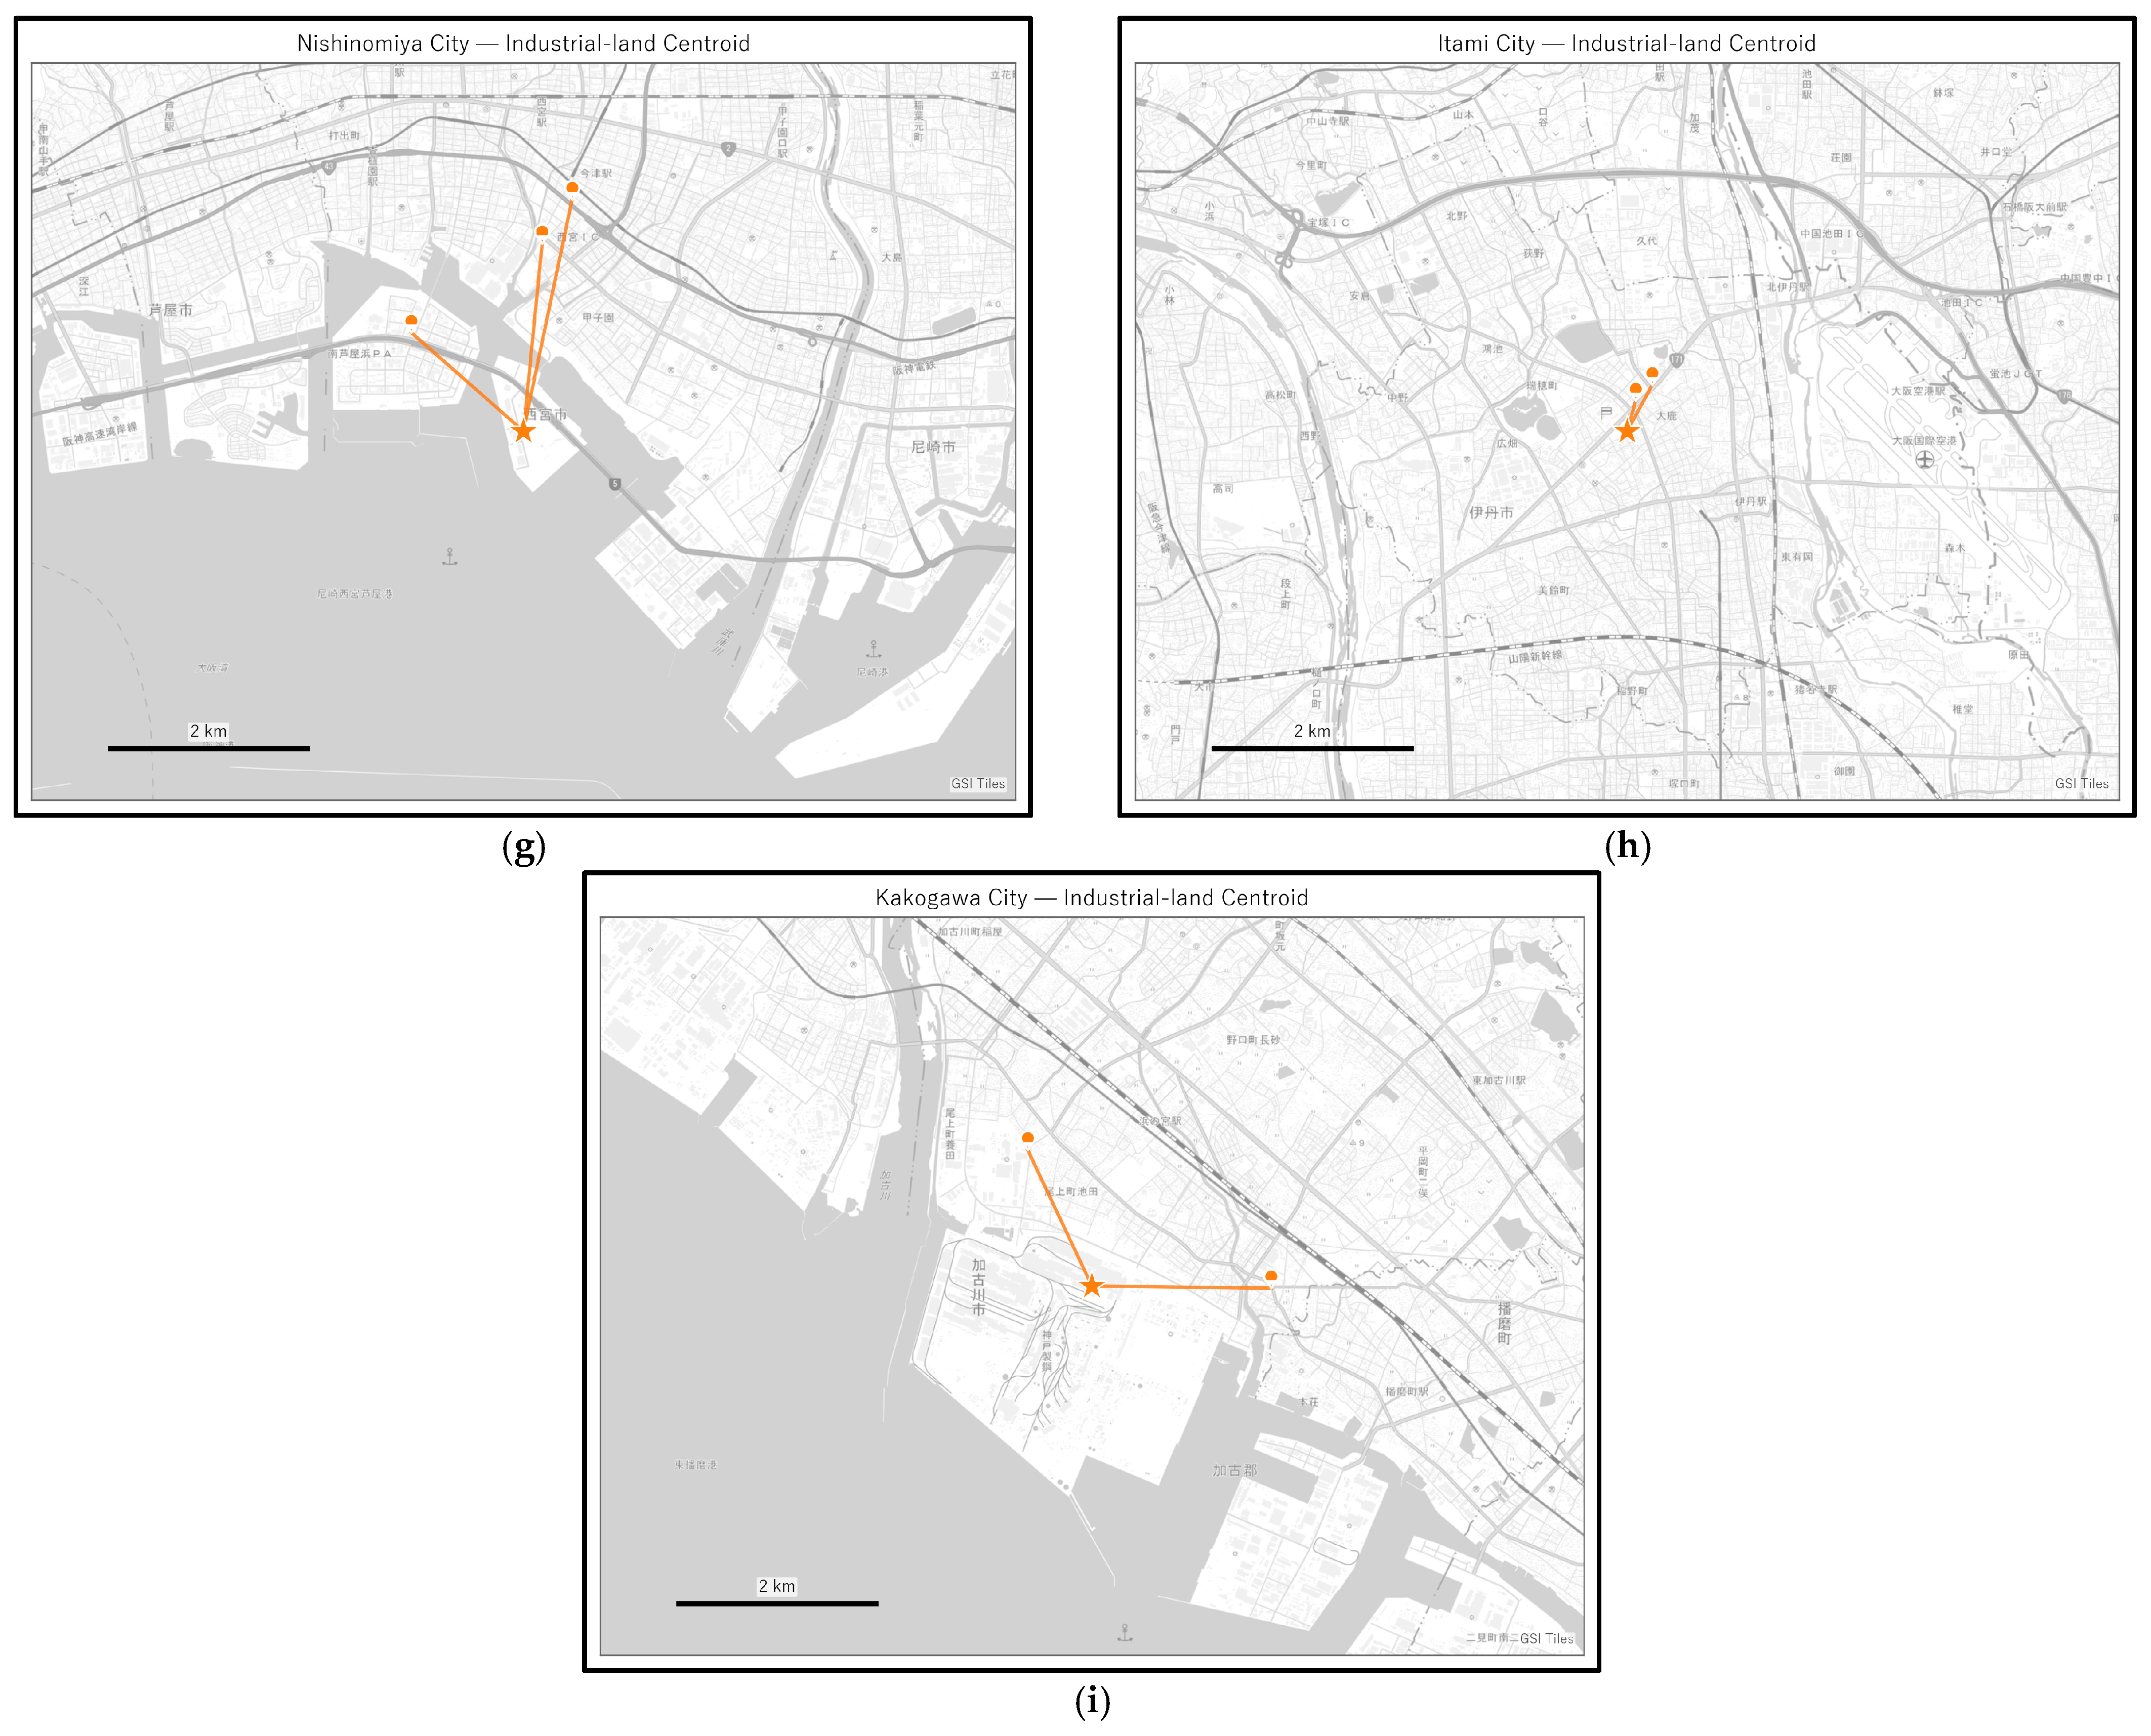
Out of 22 selected HRS sites, only one is shared with the petrol-station-based centroid definition and another one with the population-based centroid. This shows that the separation of industrial land from other areas is pronounced. Therefore, any HRS site built under this definition will represent the commercial-oriented approach in the development of a future hydrogen fuel network.
Table 6 and
Figure A3 show detailed placement results using industrial-area centroids. Orange pins in each figure indicate the hydrogen stations assigned to the respective municipality, and, as with the average centroid of the previous two definitions, sites are allocated according to the demand scale.
4.4. Comparison of Three Centroid Definitions
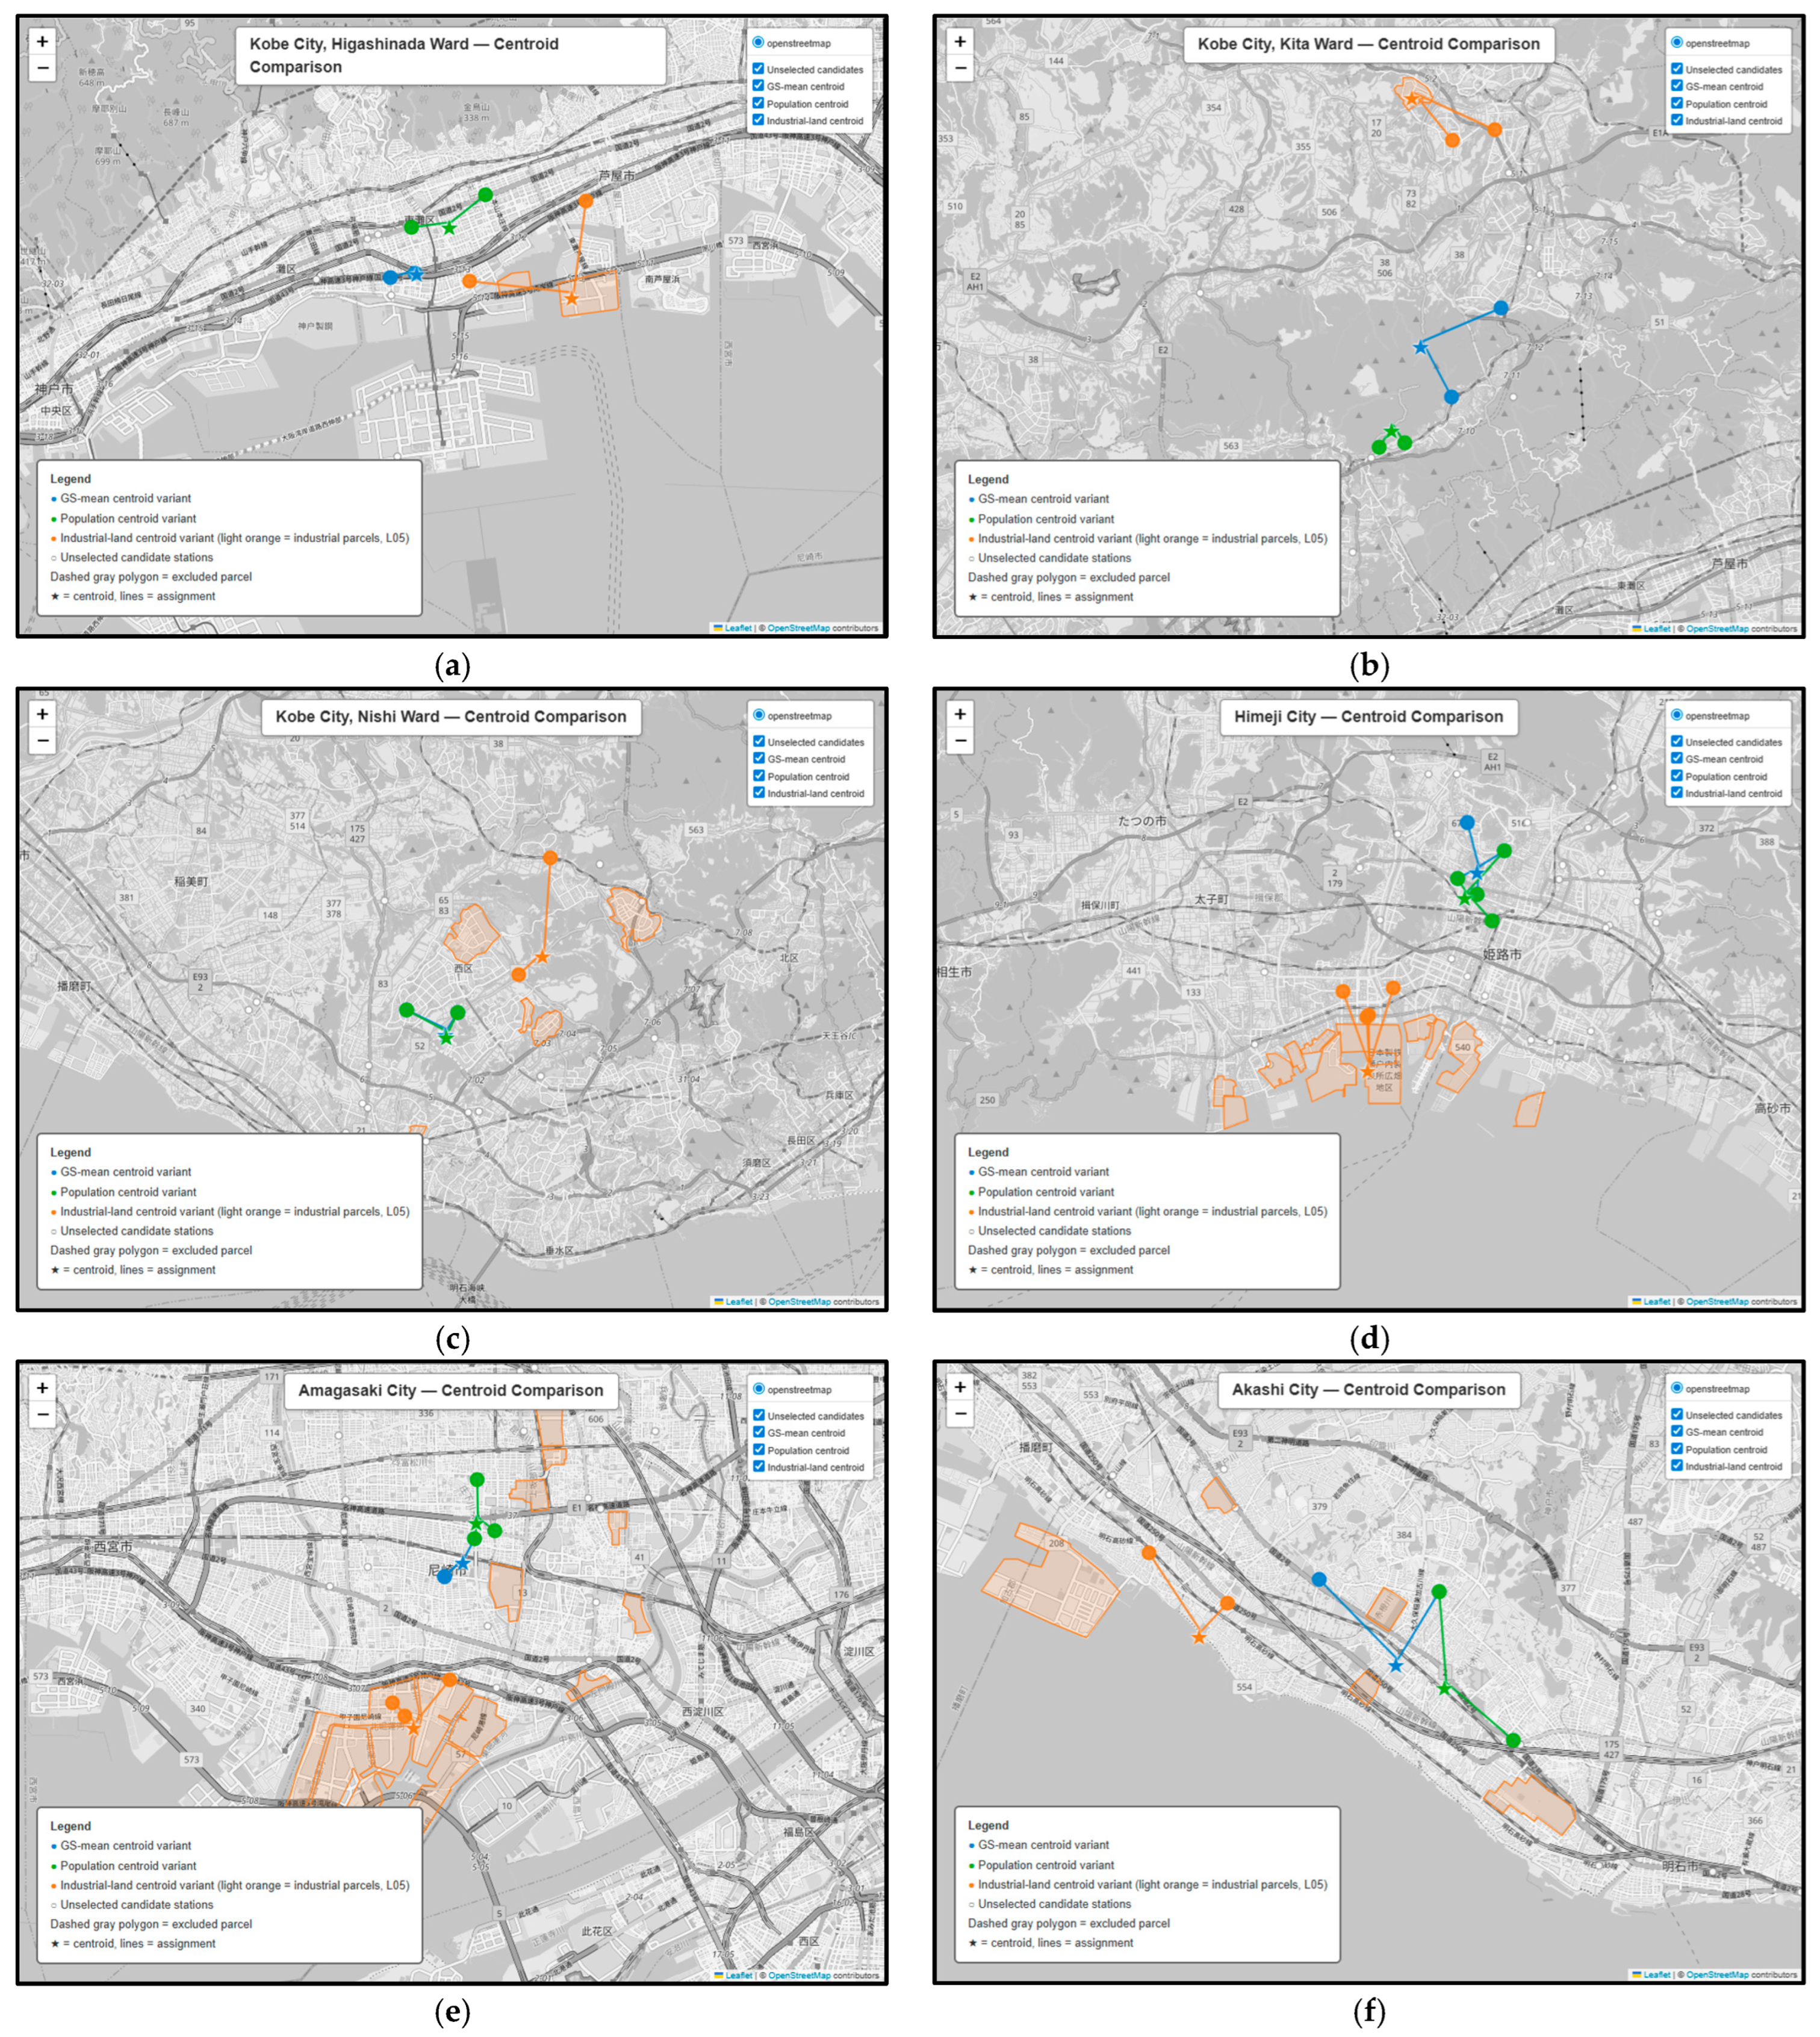
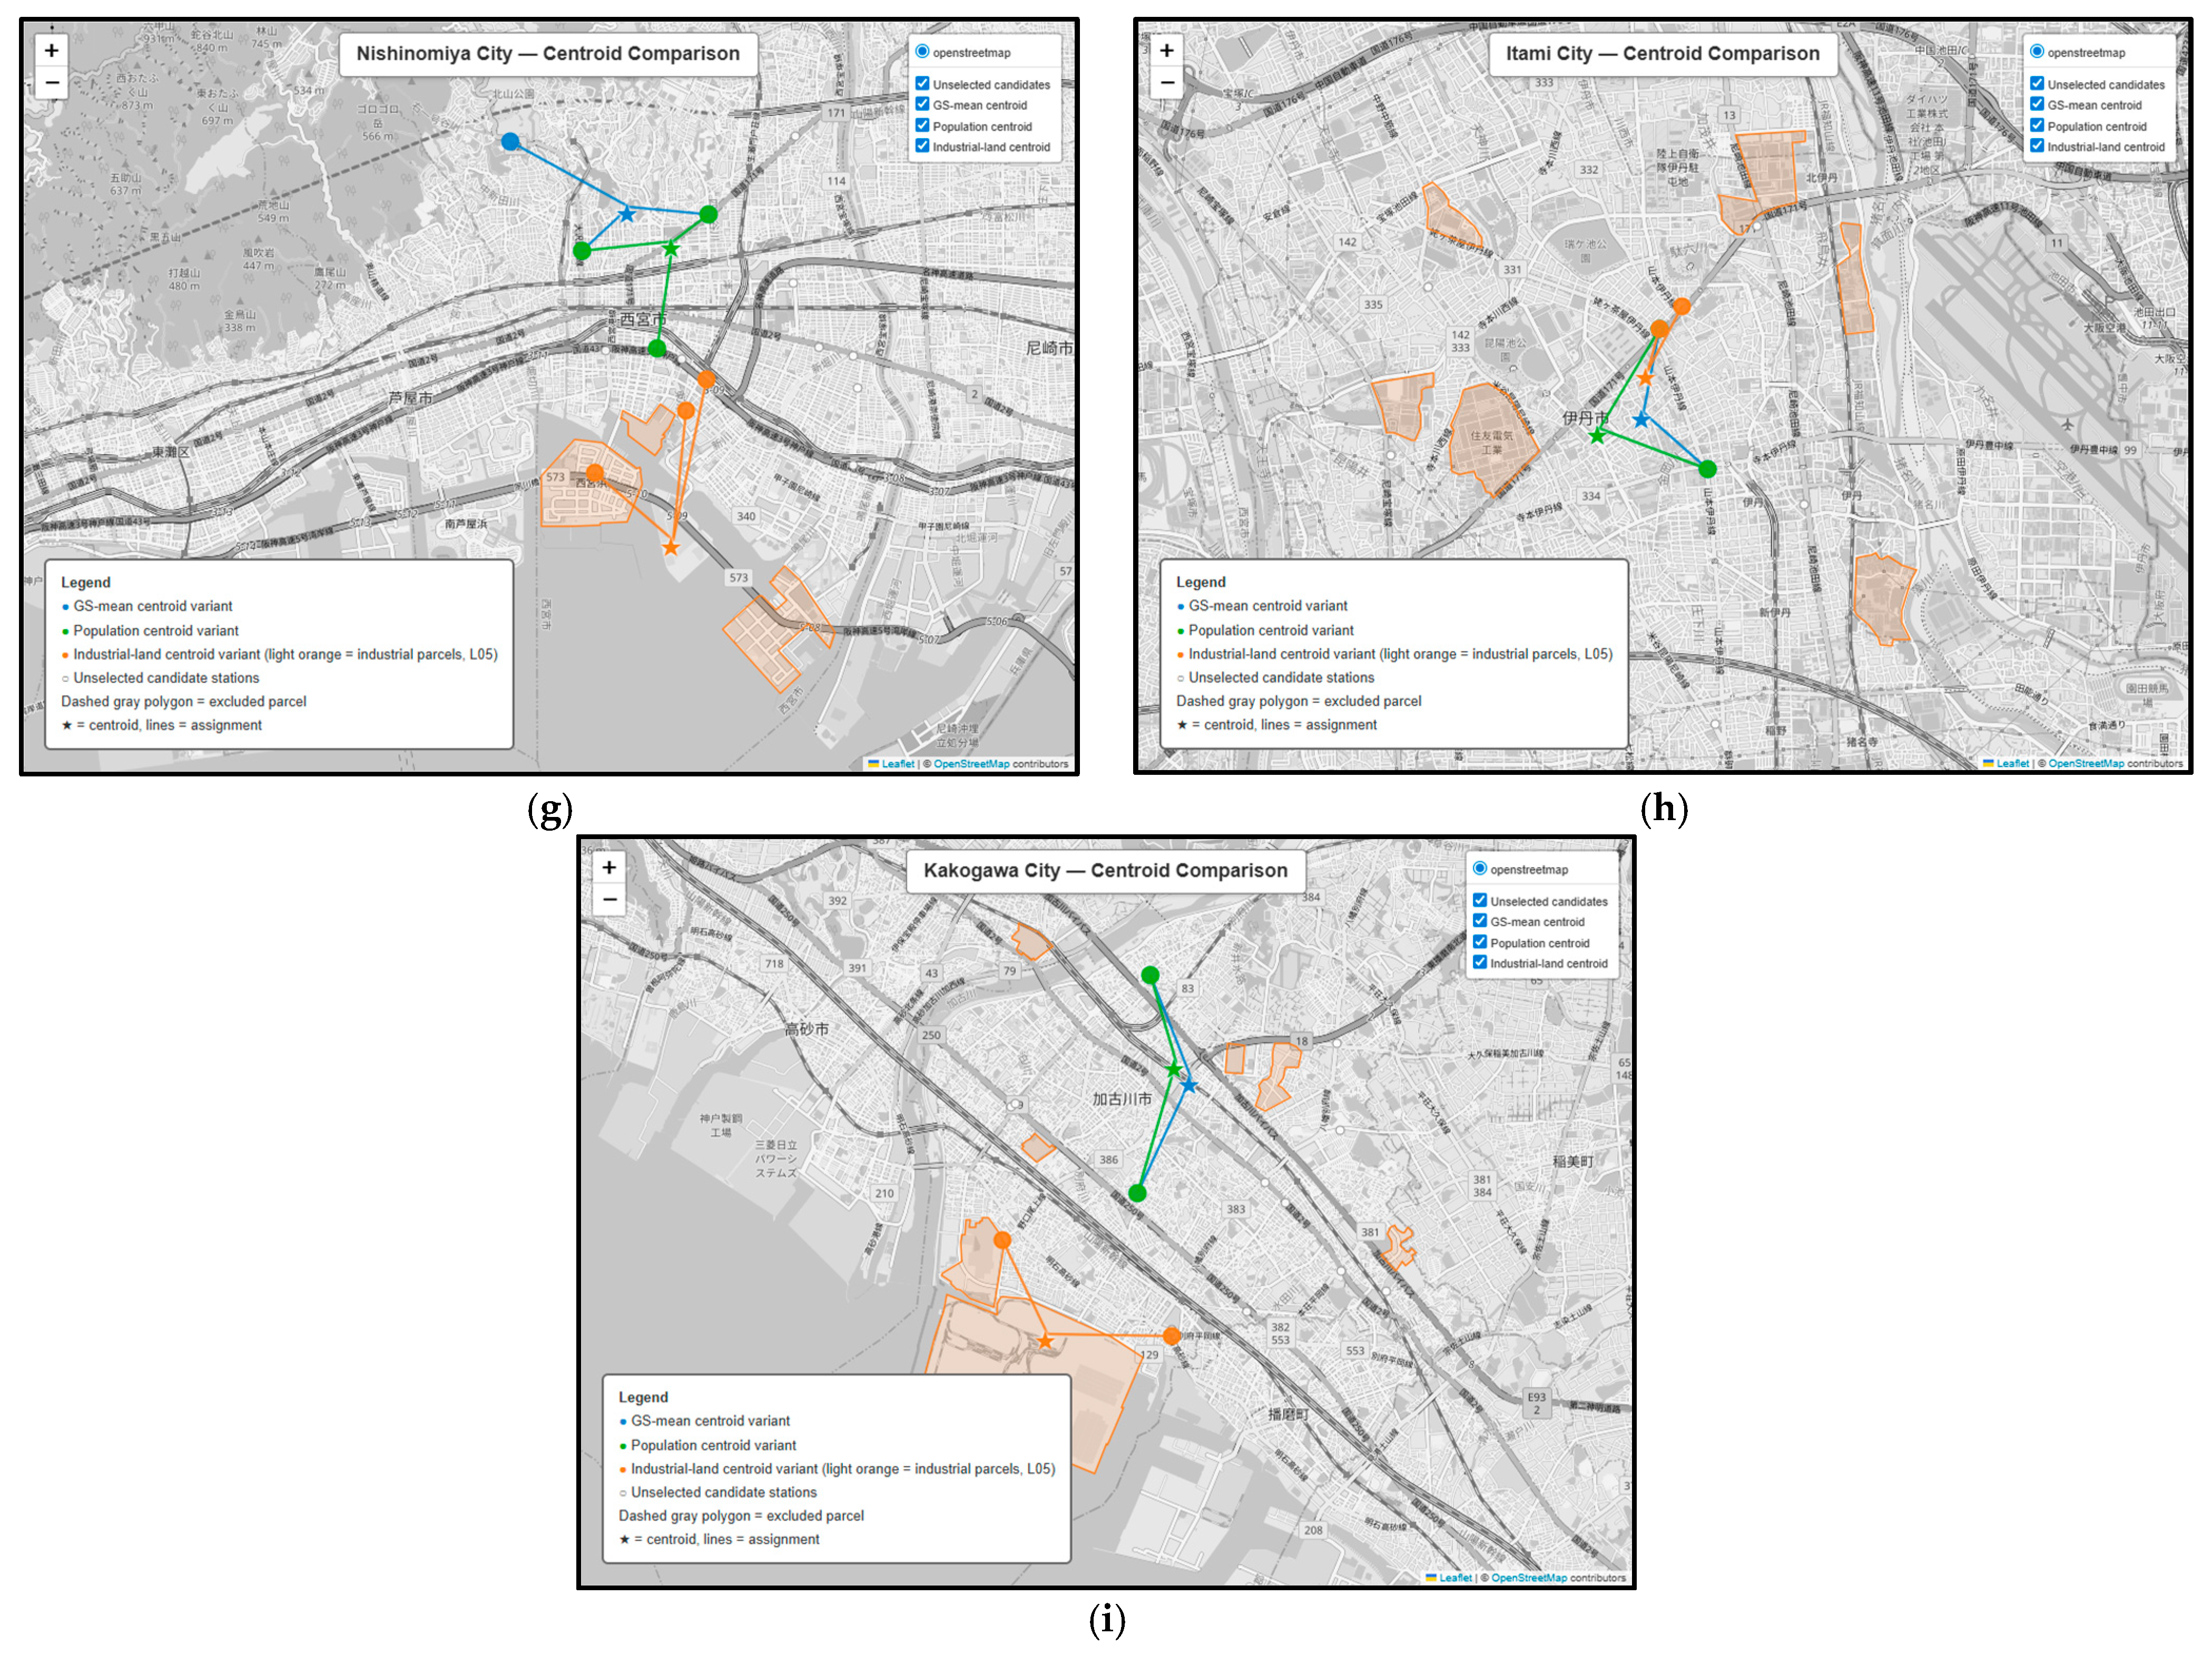
Three different centroid definitions indicate a clear distinction in HRS site selection results. The petrol-station-based and population-based centroids generally resulted in relatively similar spatial representation, whilst industrial-area-based centroids produced distinct spatial representation. This can be seen in the average centroid separation between each centroid definition. For petrol-station-based and population-based centroids, the average is 0.94 km. Meanwhile, the average distance between petrol-station-based and industrial-area-based centroids is 4.48 km. Lastly, population-based and industrial-area-based centroids recorded an average distance of 4.83 km.
This distinction can also be observed in the shared selected HRS sites. Overall, 13 out of 22 selected sites are identical for petrol-station-based and population-based centroids, whereas for the industrial-area-based centroid, it shares only one selected site with each definition. The average distance between the selected HRS sites and their respective centroids under the petrol-station-based centroid is 1.20 km, 1.06 km for the population-based centroid, and 1.67 km for the industrial-area-based centroid. The values obtained under three centroid definitions should not be ranked performatively, as the distance of each result is measured under different spatial reference centroids and under different definitions. The values only represent the proximity of selected HRS sites to their respective centroid and do not indicate real distance or travel time. Such results indicate the effect of centroid definition on the spatial priority in HRS site selection. Detailed results and illustrations can be seen in
Table 7 and
Figure 1, respectively.
5. Discussions
The results from the analysis uncovered that different defining methods in determining the centroid for each municipality influence not only the placement of co-location-based existing sites for future HRSs, but also the spatial characteristics and HRS placement priorities in every centroid definition. Three centroid definitions influence the HRS site selection across nine wards/municipalities in Hyogo Prefecture.
As previously mentioned, the number of FCVs is estimated using proxy data based on vehicle ownership in each selected ward or municipality in Hyogo Prefecture. The hydrogen demand model incorporates the number of projected passenger and commercial FCVs that are determined under a uniform adoption rate. Such an approach enables a reproducible demand estimation, particularly when facing insufficient real-world data on future FCV adoption. However, due to the approximation and uniform nature of FCV adoption across all municipalities, it may not accurately reflect dynamic regional characteristics that may evolve in the future, such as income levels, urban structure, and traffic behaviour. Despite the commercial FCVs representing only approximately 5.3% of the projected future FCVs, they accounted for approximately 38.9% of hydrogen demand, with both percentages derived from prefecture-level demand for three FCV types across all municipalities and wards. This shows the higher annual consumption of such vehicles compared to passenger FCVs. Hence, the vehicle type influences future hydrogen demand estimation, which in turn affects the calculation for required HRS sites.
Moreover, the hydrogen consumption rate is based on a fixed value obtained from external catalogue data [
38]. For commercial FCVs, the consumption rate is estimated using the national average of vehicle mileage due to insufficient data at the municipal level [
36]. Moreover, both vehicle types do not account for fluctuations under actual driving conditions. However, the purpose of this study is not to create a forecast model that precisely estimates the demand but to understand the relative distribution of demand among municipalities. Therefore, these limitations are considered acceptable for this study. In the future, incorporation of other aspects such as actual driving data and adoption rates by income group can expand the existing demand and projection figure models into more advanced and comprehensive ones.
Under the geographic-based existing petrol stations as centroid definer, the selected sites for HRSs are located along the existing fuel-supply network. This is because the site candidates are based on the existing petrol stations, which makes the petrol-based-centroid site selection process an infrastructure-continuity-oriented hydrogen infrastructure development instead of a demand-oriented development.
Meanwhile, under the population-based centroids, the selected sites are in relative proximity to the residential areas, thereby providing general-population-oriented hydrogen infrastructure development. From the general population’s perspective, the selected sites tend to be geographically closer to the population-based centroid despite not necessarily representing shorter road distance or travel time. Despite this, accurate FCV adoption assessment requires not only geographical proximity, but also observed user behaviour, something that can be addressed in future research.
Lastly, the industrial-area-based centroid generated the most distinct site selection pattern. It has low shareability compared to the previous two centroid definitions, with just one shared site with each definition. Moreover, the distance of selected sites under this centroid definition is noticeably farther from other selected sites under the other definitions. This indicates clear separation of industrial and other areas in terms of spatial perspective, which in turn also represents a different priority under commercial-oriented hydrogen infrastructure development. However, it is also worth noting that although industrial areas serve as a proxy for commercial-based HRSs, this does not represent real hydrogen demand for commercial FCVs because such a demand requires numerous additional variables, such as truck traffic, freight generation, or other monetary and technical aspects that may influence future projected adoption numbers for commercial FCVs, something that can be adopted in future research.
From the hydrogen company’s perspective, the results from three centroid definitions can be interpreted as preliminary results under different developmental priorities. If the priority is to maintain continuity with the existing refuelling network, the petrol-based centroid definition can be utilised. The priority to the general population market can be based on the results obtained under the population-based centroid definition. Lastly, if the priority is tailored for the commercial activities, the industrial-area-based centroid definition can be utilised. This is important since the site selection is affected by the planning perspective, shown in the low overlap of sites selected under the industrial-area definition and the other two.
The obtained co-location results serve as the basis for HRS site selection. To proceed with real-life site selection, those results are subjected to certain regulations and laws which cover both technical and safety requirements. The current model does not include factors such as available remaining site area, detailed site layout, safety separation distance regulations between the petrol station and HRS, road access, or safety and regulatory compliance. Therefore, the results from all centroid definitions should be treated as the first step in the HRS site selection process, and further verification is needed for a comprehensive feasibility study in hydrogen refuelling infrastructure development.
Despite the general differences based on the two centroid definitions, the extent to which the definitions affect the site selection and placement varied among the areas. Selected sites in some municipalities and one ward, which are Kakogawa City, Himeji City, Amagasaki City, Akashi City, Nishinomiya City, and Nishi Ward of Kobe City, indicate strong similarity between petrol-based and population-based centroid approaches, shown by the number of similar sites selected under those definitions. Those places also show a clear distinction between the industrial-area-based and the other two centroid definitions, as shown by the dispersion of selected sites. Meanwhile, Kita Ward and Higashinada Ward of Kobe City show a clear distinction in terms of selected sites and average distance between both centroids and sites under three different definitions. Lastly, the greatest convergence of sites under all three centroid definitions can be observed in Itami City, indicated by the close proximity between HRS sites. Overall, different centroid definitions generally influence the site selection for HRSs. However, it is also worth noting that other aspects, such as existing fuel infrastructure and separation of commercial and residential areas, can influence the site selection across different municipalities.
6. Conclusions
Overall, the comparison for all municipalities shows that the various effects of centroid-based selection differed in their scale and primary form. The petrol-station-based and population-based centroid definitions selected similar sites for HRSs in general, as observed in Kakogawa City, Himeji City, Amagasaki City, Akashi City, Nishinomiya City, and Nishi Ward of Kobe City. Conversely, the industrial-area-based centroid definition selected distinct site candidates. Clear separation between all three definitions can be observed in Kita Ward and Higashinada Ward of Kobe City. Meanwhile, Itami City shows a unique spatial pattern in which all selected sites under the three centroid definitions show a high degree of convergence.
The results observed in this study suggest that, in determining HRS sites, the selection of the centroid definition should be based on the development approach priority of hydrogen infrastructure in the area, whether it is infrastructure-continuation-oriented, general-passenger-oriented, or commercial-oriented, in the future. Priority in infrastructure-continuation-oriented development requires the petrol-station-based centroid approach. Meanwhile, priority in general-passenger-oriented development requires the population-based centroid approach. Lastly, priority in commercial-oriented development requires the industrial-area-based centroid approach. Therefore, all three centroid definitions should be treated as HRS site planning alternatives in which their utilisation preference is based on expected demand composition and the orientation of hydrogen infrastructure development in a certain area. This, however, is subject to a comprehensive feasibility assessment that covers technical, spatial, and regulatory aspects for the individual suitability of the selected HRS site.
This paper makes four main contributions. First, it develops a reproducible municipal-scale framework for estimating hydrogen demand and selecting potential sites for HRSs using publicly available data, mainly demographic, vehicle-ownership, and geospatial data. The hydrogen demand model considers both passenger and commercial FCVs in its calculation process, thereby allowing different FCV types and their respective hydrogen consumption rates to be reflected in the estimation, resulting in the municipal-level hydrogen demand and required HRS sites. Second, it applies the co-location concept as part of the practical approach and as a constraint to limit candidate sites to real-life locations based on existing petrol stations rather than selecting entirely new sites for HRSs. These sites are considered as spatial candidates, which provide the basis for site assessment that will be done with follow-up technical and regulatory assessments. Third, it shows that different definitions in determining centroids affect the site selection process through different HRS development approaches: infrastructure-continuity orientation, general-population orientation, and commercial orientation. Lastly, comparative analysis of the three centroid definitions provides a basis for preliminary HRS site selection process, in which a spatial centroid can be selected based on the primary infrastructure development objective and projected composition of hydrogen demand rather than a universal site selection strategy.