Article

The Impact of Artificial Intelligence on Corporate Green Value Co-Creation: Empirical Evidence from China’s Manufacturing Industry

by
Xiaolin Sun
and
Wenxin Pi
*
Business Administration, School of Management, Dalian Polytechnic University, Dalian 116034, China
*
Author to whom correspondence should be addressed.
Sustainability 2026, 18(2), 698; https://doi.org/10.3390/su18020698
Submission received: 25 November 2025 / Revised: 21 December 2025 / Accepted: 5 January 2026 / Published: 9 January 2026

Abstract

Against the dual demands of green transformation and digital integration in the manufacturing industry, green value co-creation has become a core pathway for enterprises to achieve sustainable development. However, the role of artificial intelligence (AI) in driving green value co-creation remains under explored, especially in the context of Chinese manufacturing. To enrich this research, this study aims to investigate the impact of AI development on corporate green value co-creation and its intrinsic mechanism. This study draws on panel data of listed manufacturing enterprises listed on China’s Shanghai and Shenzhen A share markets spanning the period 2015–2024, and employs multiple regression and negative binomial regression as research methodologies to empirically examine the impact of AI development on corporate green value co-creation and its underlying mechanisms. The results demonstrate that: AI development exerts a significantly positive effect on manufacturing enterprises’ green value co-creation, which is achieved by enhancing firms’ technological spillover capacity and total factor productivity (TFP); financing constraints negatively moderate the aforementioned relationship, while corporate influence plays a positive moderating role; heterogeneity analysis reveals that this impact is more pronounced for enterprises under voluntary regulation, state-owned enterprises (SOEs), and high-pollution enterprises. This study elucidates AI’s role and mechanism in corporate green development at the micro level, provides empirical evidence for related research, and offers practical insights to promote enterprise AI advancement and green value co-creation.

1. Introduction

With the intensification of global warming, frequent extreme weather events, and the growing prominence of environmental issues such as ecosystem degradation, green governance has become a global consensus. The United Nations explicitly defined the Sustainable Development Goals (SDGs) through the 2030 Agenda for Sustainable Development, advocating that countries promote green transformation with a multilateral cooperation stance [1]. As the world’s largest developing country and a responsible major power, the Chinese government actively responds to international calls, integrates green governance and green development into the national strategy for high quality development, and advances green economic transformation via policy guidance, technological innovation, and market mechanism reforms [2]. As a responsible major power, China refers to its commitment to global sustainable development goals, active participation in international environmental governance, and unwavering efforts to promote green economic transformation while balancing economic growth and ecological protection. Despite remarkable progress in global sustainable development in recent years, challenges remain including imperfect coordination mechanisms, insufficient technology transfer efficiency, and unbalanced regional development, urging the exploration of systematic solutions [3]. As a core pillar of the national economy, the manufacturing industry is not only a critical carrier of technological innovation but also a major contributor to energy consumption and carbon emissions. Its green development is directly linked to the advancement of China’s “dual carbon” goals and the quality of participation in global environmental governance [4].
For manufacturing enterprises, green development faces technical hurdles such as substantial capital requirements and long cycles for achievement transformation [5], as well as management dilemmas including difficulties in managers’ ideological transition and misalignment between corporate strategies and green development. Derived from sustainable development theory, the Green Value Co-creation (GVC) theory breaks the traditional one-way value chain and emphasizes multi-stakeholder collaboration to synergize environmental, economic, and social values [6]. GVC refers to the collaborative process among multiple stakeholders to integrate resources, jointly develop green technologies, and synergize environmental, economic, and social values in the manufacturing sector. AI in manufacturing is defined as the application of algorithm models, machine learning, and big data analytics to optimize production processes, facilitate resource sharing, and support green decision-making. These definitions provide a clear foundation for subsequent analysis. By sharing resources and conducting collaborative innovation with stakeholders including upstream and downstream enterprises, industry peers, and research institutions, manufacturing enterprises can collectively enhance green innovation capability, improve green technology transfer efficiency, and achieve multi-agent green value co-creation. Currently, academia recognizes green value co-creation as a key link for enterprises to integrate internal green resources and realize green innovation [7], a core bridge to enhance performance [8], and a critical pathway to meet green and sustainable development demands and build a dynamic value chain [9].
Artificial Intelligence (AI) is a comprehensive digital technology relying on algorithm models, data resources, and computing power, which simulates human cognitive logic and decision-making processes, automates task execution, and optimizes the resolution of complex problems [10]. As a core technological engine, AI reshapes social production methods, drives corporate innovation, and addresses environmental challenges [11]. From a societal perspective, AI facilitates the green upgrading of urban governance [12] and public services through technologies such as intelligent monitoring [13] and resource scheduling optimization. For enterprises, AI eliminates the experience dependence of traditional production, enabling cost reduction and efficiency improvement in scenarios like predictive maintenance and process optimization [14]. In green development, AI has become a key tool to achieve carbon emission reduction targets [15]. According to calculations by the China Academy of Information and Communications Technology, full application of AI enabled green manufacturing technologies in core industries can reduce cumulative carbon emissions by over 2 billion tons, demonstrating its significant environmental value potential. Essentially, AI empowers enterprises to establish stakeholder resource sharing platforms, break traditional information barriers, and promote resource sharing, collaborative innovation, and value co-creation. Additionally, AI enables real time monitoring of internal operational data, collection of external environmental data, and integrated analysis providing technical support for corporate green value co-creation. Furthermore, the enabling value of digital technologies is also reflected in the linkage effects across related fields. Du and Lv (2025) verified that digital finance can unleash household consumption potential, and the expansion of green consumption demand will further incentivize manufacturing enterprises to carry out green collaborative innovation, forming a virtuous circle of “consumption-side pull—production-side response” [16]. However, existing research on AI’s impact on green development primarily focuses on the green economic effects of industrial intelligence in developing countries [17], the mediating role of knowledge coupling in AI driven corporate green technological innovation [18], and AI’s influence on sustainable development performance [19]. Notably, the wave of digitalization has not only reshaped the implementation paths of green innovation but also transformed the relevant performance evaluation logic. Potluka et al. (2025) pointed out that digitalization has profoundly transformed the overall landscape of the evaluation field, and traditional evaluation frameworks are no longer sufficient to adapt to the complexity of digitally driven green transformation [20]; furthermore, Pudney et al. (2025) proposed a conceptual framework for evaluating AI enhanced critical infrastructure, providing a methodological reference for quantifying the actual effects of AI in green operations [21]. However, existing studies have not integrated such evaluation logic into the analysis of green value co-creation, and academic exploration into the specific mechanisms and boundary conditions of AI’s impact on green value co-creation remains relatively scarce. Scholarly exploration of AI’s role and underlying mechanisms in corporate green value co-creation remains relatively scarce.
GVC rooted in value co-creation theory and sustainable development theory, refers to a cross-boundary collaborative process wherein multiple stakeholders strive for the win-win of ecological, economic, and social values through resource integration, technological collaboration, and value coordination, centered on environment friendly goals. Existing studies have confirmed that resource integration capability and supply chain collaboration quality at the organizational level, as well as traditional green technological innovation at the technical level, are key drivers of GVC. However, research on the enabling mechanisms and practical effects of digital technologies such as AI in GVC mostly remains at the level of theoretical deduction or case descriptions, lacking systematic empirical validation. Meanwhile, the value of AI in the field of corporate green development has been partially explored: at the macro level, AI facilitates urban green governance through intelligent monitoring and optimized resource scheduling; at the micro level, AI can not only break the “black box” of green technologies, reduce R&D costs, and promote enterprises’ independent green patent output, but also improve TFP and energy use efficiency by optimizing production processes and resource allocation, while driving enterprises’ environmental information disclosure and carbon footprint tracing. Nevertheless, these studies generally focus on the green practices of a single enterprise entity and fail to extend to the GVC scenario featuring “multi-agent collaborative co-creation,” which provides a research gap for this study to systematically reveal the action paths and boundary conditions of AI empowering GVC, taking Chinese manufacturing enterprises as the research sample.
This study aims to address three core research questions: (1) Does AI development have a significant impact on green value co-creation of Chinese manufacturing enterprises? (2) What are the intrinsic mechanisms through which AI exerts its influence? (3) How do financing constraints and corporate influence moderate the relationship between AI and green value co-creation?
While this study focuses on Chinese manufacturing, the research context has broader implications. China’s status as the world’s largest manufacturing hub and its dual emphasis on digital and green transformation align with the global trend of sustainable industrial development. It is also worth noting that while digital technologies promote green transformation, they also bring global challenges in regulatory coordination through a systematic review, Kicova et al. (2025) found that tax regulatory frameworks for digital assets such as cryptocurrencies are difficult to unify globally [22]. This phenomenon reflects the importance of institutional coordination in the application of digital technologies, and AI driven green value co-creation also requires an adaptive policy and regulatory environment as support. The findings can provide reference for other emerging economies facing similar challenges and offer insights for developed economies to optimize AI driven green collaboration models. Notably, compared with Western manufacturing, Chinese enterprises exhibit unique institutional contexts, which enriches the heterogeneity of global research on AI and GVC.
This study makes the following marginal contributions: First, while existing research mostly adopts a theoretical perspective to analyze AI’s impact on green value co-creation, empirical evidence is limited. Using micro-level panel data of Chinese A-share listed manufacturing firms on the Shanghai and Shenzhen Stock Exchanges, this study conducts empirical validation to unveil the impact of AI development on manufacturing enterprises’ green value co-creation, filling the empirical gap in this field. Second, beyond exploring the direct relationship between AI and green value co-creation, this study introduces two mediating variables including technological spillover and total factor productivity (TFP) to clarify the transmission mechanisms through which AI exerts its effects. Third, this study investigates the moderating roles of financing constraints and corporate influence, identifying the contextual conditions that amplify or weaken AI’s impact on green value co-creation. Fourth, integrating institutional contexts, this study performs heterogeneity analysis to explore inter-group differences in the aforementioned relationship, providing empirical support for different types of enterprises to formulate targeted and differentiated green development strategies.

2. Theoretical Analysis and Research Hypotheses

2.1. The Impact of Artificial Intelligence (AI) on Corporate Green Value Co-Creation

The value co-creation theory was first proposed by C.K. Prahalad and Venkatram Ramaswamy, and later further expanded through perspectives such as the service-dominant logic by Vargo and Lusch. Its core is to break the traditional cognition that enterprises unilaterally create value while consumers passively accept it, advocating that value is not solely determined and created by enterprises but jointly constructed through interactive collaboration among multiple stakeholders including enterprises, consumers, suppliers, and partners. This study is conducted based on the value co-creation theory, which abandons the traditional logic of enterprises creating value and customers passively receiving it, and advocates that enterprises and diverse stakeholders such as customers jointly participate in the entire process of value creation through interactive collaboration [23].
With the development of AI, traditional value co-creation centered on “resource integration” has gradually shifted to “intelligent collaboration.” AI is an interdisciplinary frontier field integrating computer science, mathematics, neuroscience, and other disciplines. Its core aim is to simulate, extend, and expand human intelligent behaviors and cognitive abilities through algorithm design, model construction, and system implementation. Based on data, and with the support of key technologies such as machine learning, deep learning, natural language processing, and computer vision, AI enables machines to perceive the environment, understand information, conduct reasoning and decision-making, engage in autonomous learning, and achieve adaptive optimization. Ultimately, it facilitates the construction of intelligent systems capable of completing complex tasks without direct human intervention. The application of AI technology enables value matching among enterprise stakeholders to break free from time and space constraints. Enterprises can achieve real-time connection with scientific research institutions, suppliers, and distributors regarding green technology needs, converting scattered green resources into a synergistic force for co-creation. The impact of AI on green value co-creation of manufacturing enterprises is reflected in: First, breaking the barriers to technological co-creation [24]. Promoting the cross-domain flow of green knowledge is one of the core values of AI. In terms of cross-domain integration, AI can integrate green practical experiences from different enterprises and industries, establish a green knowledge base covering multiple industries, fields, and dimensions. It helps enterprises broaden their horizons, break free from information cocoons, transcend the limitations of a single industry, and jointly develop more innovative green technologies with stakeholders. Second, reducing multi-agent transaction costs [25]. High inter-agent collaboration costs have long been a key challenge in the process of corporate green value co-creation. AI can significantly reduce this cost by restructuring collaboration processes. From the perspective of the supply chain, AI can optimize procurement processes, production plans, and logistics routes, enabling enterprises to form linkages with suppliers and distributors and avoid resource waste caused by information lag. From the perspective of information disclosure, AI can automatically integrate green data and generate reports, reducing the labor costs of corporate information disclosure. Meanwhile, it ensures the efficient circulation of information among entities participating in green value co-creation, and guarantees that the outcomes of green value co-creation meet the standards and requirements of multiple parties. This reduces the opportunity costs incurred by enterprises in routine administrative work, allowing them to focus more efforts on green value co-creation. Third, constructing a full life cycle co-creation system [26]. AI extends green value co-creation from end-of-pipe emission reduction to full life cycle management and control. Existing green value co-creation mainly focuses on end-point greening measures to reduce pollutant emissions through green technologies, green management, or behavioral means at the sales stage of resources. However, with the large-scale deployment of AI in enterprises’ production and management, it can real-time monitor the full-process carbon footprint including production, transportation, and usage, and issue timely warnings when exceeding standards, ensuring that the green value co-creation process always adheres to low-carbon and green goals. Therefore, this study proposes the following hypothesis:
H1. 
Artificial intelligence can promote green value co-creation of manufacturing enterprises.

2.2. Mechanisms Underlying the Impact of Artificial Intelligence on Green Value Co-Creation in Manufacturing Enterprises

2.2.1. The Mediating Role of Technological Spillover

Technological spillover refers to the knowledge spillover effect formed by enterprises through technological R&D and application, and its intensity and scope determine the depth of synergy in green value co-creation [27]. Traditional technological spillover is often difficult for peers to effectively absorb due to its complexity and professional barriers, and this issue is more prominent in the field of green technology. As green technology involves an interdisciplinary knowledge system including energy management optimization and material recycling, and plays a crucial role in enterprise cost control, the phenomenon of patent “black boxes” frequently occurs in traditional technological spillover related to green technology.
However, in the context of AI empowerment, owing to its prominent capabilities in processing unstructured data, reverse-inferring algorithmic logic, and natural language processing [28]. On the one hand, it can realize the structured and semantic analysis of patent texts, accurately identifying the technological features with ambiguous expressions in “black-box” patents. On the other hand, through machine learning models, AI performs simulation and identification on a large volume of operation logs, process data, and environmental indicators. This significantly lowers the threshold for knowledge acquisition in the specific application of green production technologies, externalizing the tacit knowledge that previously required a large number of senior data science talents to access. Therefore, AI can effectively break the “black-box” phenomenon related to green technologies.
In addition, technological spillover is transmitted through multiple channels, directly exerting a systematic enabling effect on corporate green value co-creation, with its impact paths showing distinct characteristics of directness and pervasiveness. Vertical spillover in the supply chain, through the direct transfer of green production technologies between upstream and downstream enterprises, promotes the formation of a green technology collaborative adaptation system across all links of the industrial chain, realizing the connection of co-created value across the production, circulation, and consumption stages; Horizontal industrial spillover, by virtue of the green technology demonstration effect of leading enterprises in the same industry, reduces redundant investment in green technology R&D among enterprises and accelerates the formation of consensus on green technology standards within the industry. It provides a unified technical foundation for multiple subjects to carry out large-scale green value co-creation. AI promotes real-time technological interaction and collaborative innovation among co-creation subjects, ultimately driving the evolution of corporate green value co-creation from decentralized technological cooperation to an ecological model featuring industrial chain collaboration and multi-agent interest symbiosis, thereby realizing the synergistic value-added of green technology value and market value.
H2. 
Artificial intelligence can enhance the technological spillover capacity of manufacturing enterprises, thereby promoting their green value co-creation.

2.2.2. The Mediating Role of Production Efficiency

Total Factor Productivity (TFP), as the core indicator for measuring the comprehensive efficiency of converting factor inputs into outputs, is enhanced through technological progress, efficiency optimization, and innovation-driven growth. AI improves the TFP of manufacturing enterprises by advancing technical efficiency, allocative efficiency, and dynamic innovation efficiency.
From the perspective of the cross-integration of the Resource-Based View, Green Productivity Theory, Collaborative Productivity Theory, and Value Co-Creation Theory, the transmission path of AI development’s impact on GVC can be condensed as follows: As the core enabling engine of digital technologies, AI targetedly drives the improvement of green collaboration oriented TFP through dual pathways, and then deeply empowers multi-agent green value co-creation relying on efficiency and value conversion mechanisms.
In the stage of TFP improvement, leveraging technical characteristics such as big data analytics, machine learning, and collaborative platform construction, AI achieves two key outcomes: On the one hand, based on the Resource. Based View and Green Productivity Theory, it optimizes the allocation of green production factors, reduces the inefficient input of non-green factors, and realizes the synergistic optimization of “green input to high efficiency output”; On the other hand, in accordance with Collaborative Productivity Theory and Information Asymmetry Theory, it breaks down information barriers in cross-agent collaboration, optimizes processes such as green supply chain collaboration, cross-enterprise green R&D, and environmental compliance supervision, and reduces transaction and communication costs of multi-agent collaboration. This endows TFP with contextual attributes of “green goal binding” and “collaboration process dependence”, distinguishing it from general operational efficiency improvement.
In the stage of value conversion, the growth of green collaboration oriented TFP further promotes the deepening of GVC through three mechanisms: Based on Transaction Cost Theory, efficiency dividends reduce the marginal cost of multi-agent participation in green collaboration, activating stakeholders’ willingness to co-create; Relying on Green Innovation Theory and Technology Spillover Theory, the improved efficiency of R&D resource utilization enhances cross-agent joint green technology R&D capabilities, increasing the technical content and ecological value of co-created outputs; Following Supply Chain Collaboration Theory and Sustainable Development Theory, the synergistic optimization of green factor allocation efficiency across the entire chain advances the deepening of green supply chain collaboration, realizing the leap from scattered inter-enterprise cooperation to industrial chain-level green value symbiosis. Essentially, this transmission path reflects the precise alignment between AI technology empowerment, green collaboration-oriented TFP as a mediator, and the core connotation of GVC. Therefore, based on the above theoretical analysis, this study puts forward the following research hypotheses:
H3. 
Artificial intelligence can enhance the Total Factor Productivity of manufacturing enterprises, thereby promoting their green value co-creation.

2.3. Moderating Roles of Financing Constraints and Corporate Influence

2.3.1. The Moderating Role of Financing Constraints

Financing constraints refer to an economic state where microeconomic entities such as enterprises, constrained by multiple factors including information asymmetry, agency conflicts, rigidity of transaction costs, and the external institutional environment during capital intermediation, face a significantly higher cost of external financing than internal financing. Alternatively, they struggle to obtain sufficient funds within a reasonable cost range to support investment projects with positive net present value. Financing constraints stem from financing frictions where the cost of external financing exceeds that of internal financing, which restricts enterprises’ ability to allocate resources to high-investment and long-cycle projects [29]. The moderating role of financing constraints is mainly reflected in the following three aspects: First, the impact of AI on green value co-creation is primarily attributed to its strong technical capabilities. Thus, the adaptability of AI technology to green demands becomes a prerequisite for its development, and the improvement of technical adaptability relies on the continuous innovation of AI technology. However, both the development of AI technology and the construction of a green value co-creation system require sufficient funds as strong support. Financing constraints will limit enterprises’ access to funds, thereby affecting the development of their AI technology and green value co-creation. Second, the realization of green value co-creation mainly depends on multi-agent collaborative cooperation, data sharing, and real-time linkage, and the construction of inter-enterprise AI platforms is indispensable. Nevertheless, enterprises with high financing constraints are constrained by insufficient funds to bear the cost of building AI platforms, and sufficient funds are still needed as an indispensable cost for technology development in the process of achieving green value co-creation. Third, the ultimate goal of green value co-creation is to transform the results of collaborative creation into practical value, that is, to apply green technologies to actual production and management work. This process requires AI to support the large-scale implementation of technologies, and in applying green technologies to production, it is also necessary to adapt production lines to green technologies, which may incur costs related to production line optimization. Therefore, enterprises with high financing constraints are restricted by funds and cannot afford the expenditures required to transform green value co-creation results into practical outcomes. All these will weaken the promoting effect of AI on green value co-creation.
H4. 
Financing constraints play a negative moderating role in the impact of artificial intelligence on green value co-creation in manufacturing enterprises.

2.3.2. The Moderating Role of Corporate Influence

Corporate influence is an important manifestation of enterprises’ market position, industry discourse power, social trustworthiness, and other related aspects [30]. Corporate influence is an important manifestation of an enterprise’s market position, industry discourse power, social trustworthiness, and other relevant aspects. The stronger the corporate influence, the greater its ability to acquire and dominate external resources, and the better it can convey the credibility and reliability of engaging in green value co-creation to stakeholders. In addition, enterprises with strong influence can exert an industry benchmarking effect; conducting green value co-creation can convey the future development direction of the industry to the outside world, attracting more interest subjects to participate in green value co-creation. On the one hand, high-influence enterprises, by virtue of their market position, are more likely to obtain cross-industry and cross-link green data, providing high-quality samples for training AI algorithms. On the other hand, high-influence enterprises have rule-making power in the supply chain, enabling them to promote upstream and downstream enterprises to access AI collaboration platforms and enhance co-creation capabilities. Furthermore, the ultimate goal of green value co-creation is to transform co-created outcomes into economic value and ecological value. The brand trustworthiness of high-influence enterprises can reduce the market promotion costs of green products and shorten their conversion cycle. Therefore, this study proposes the following hypothesis:
H5. 
Corporate influence plays a positive moderating role in the impact of artificial intelligence on green value co-creation in manufacturing enterprises.

2.4. Logical Framework Diagram

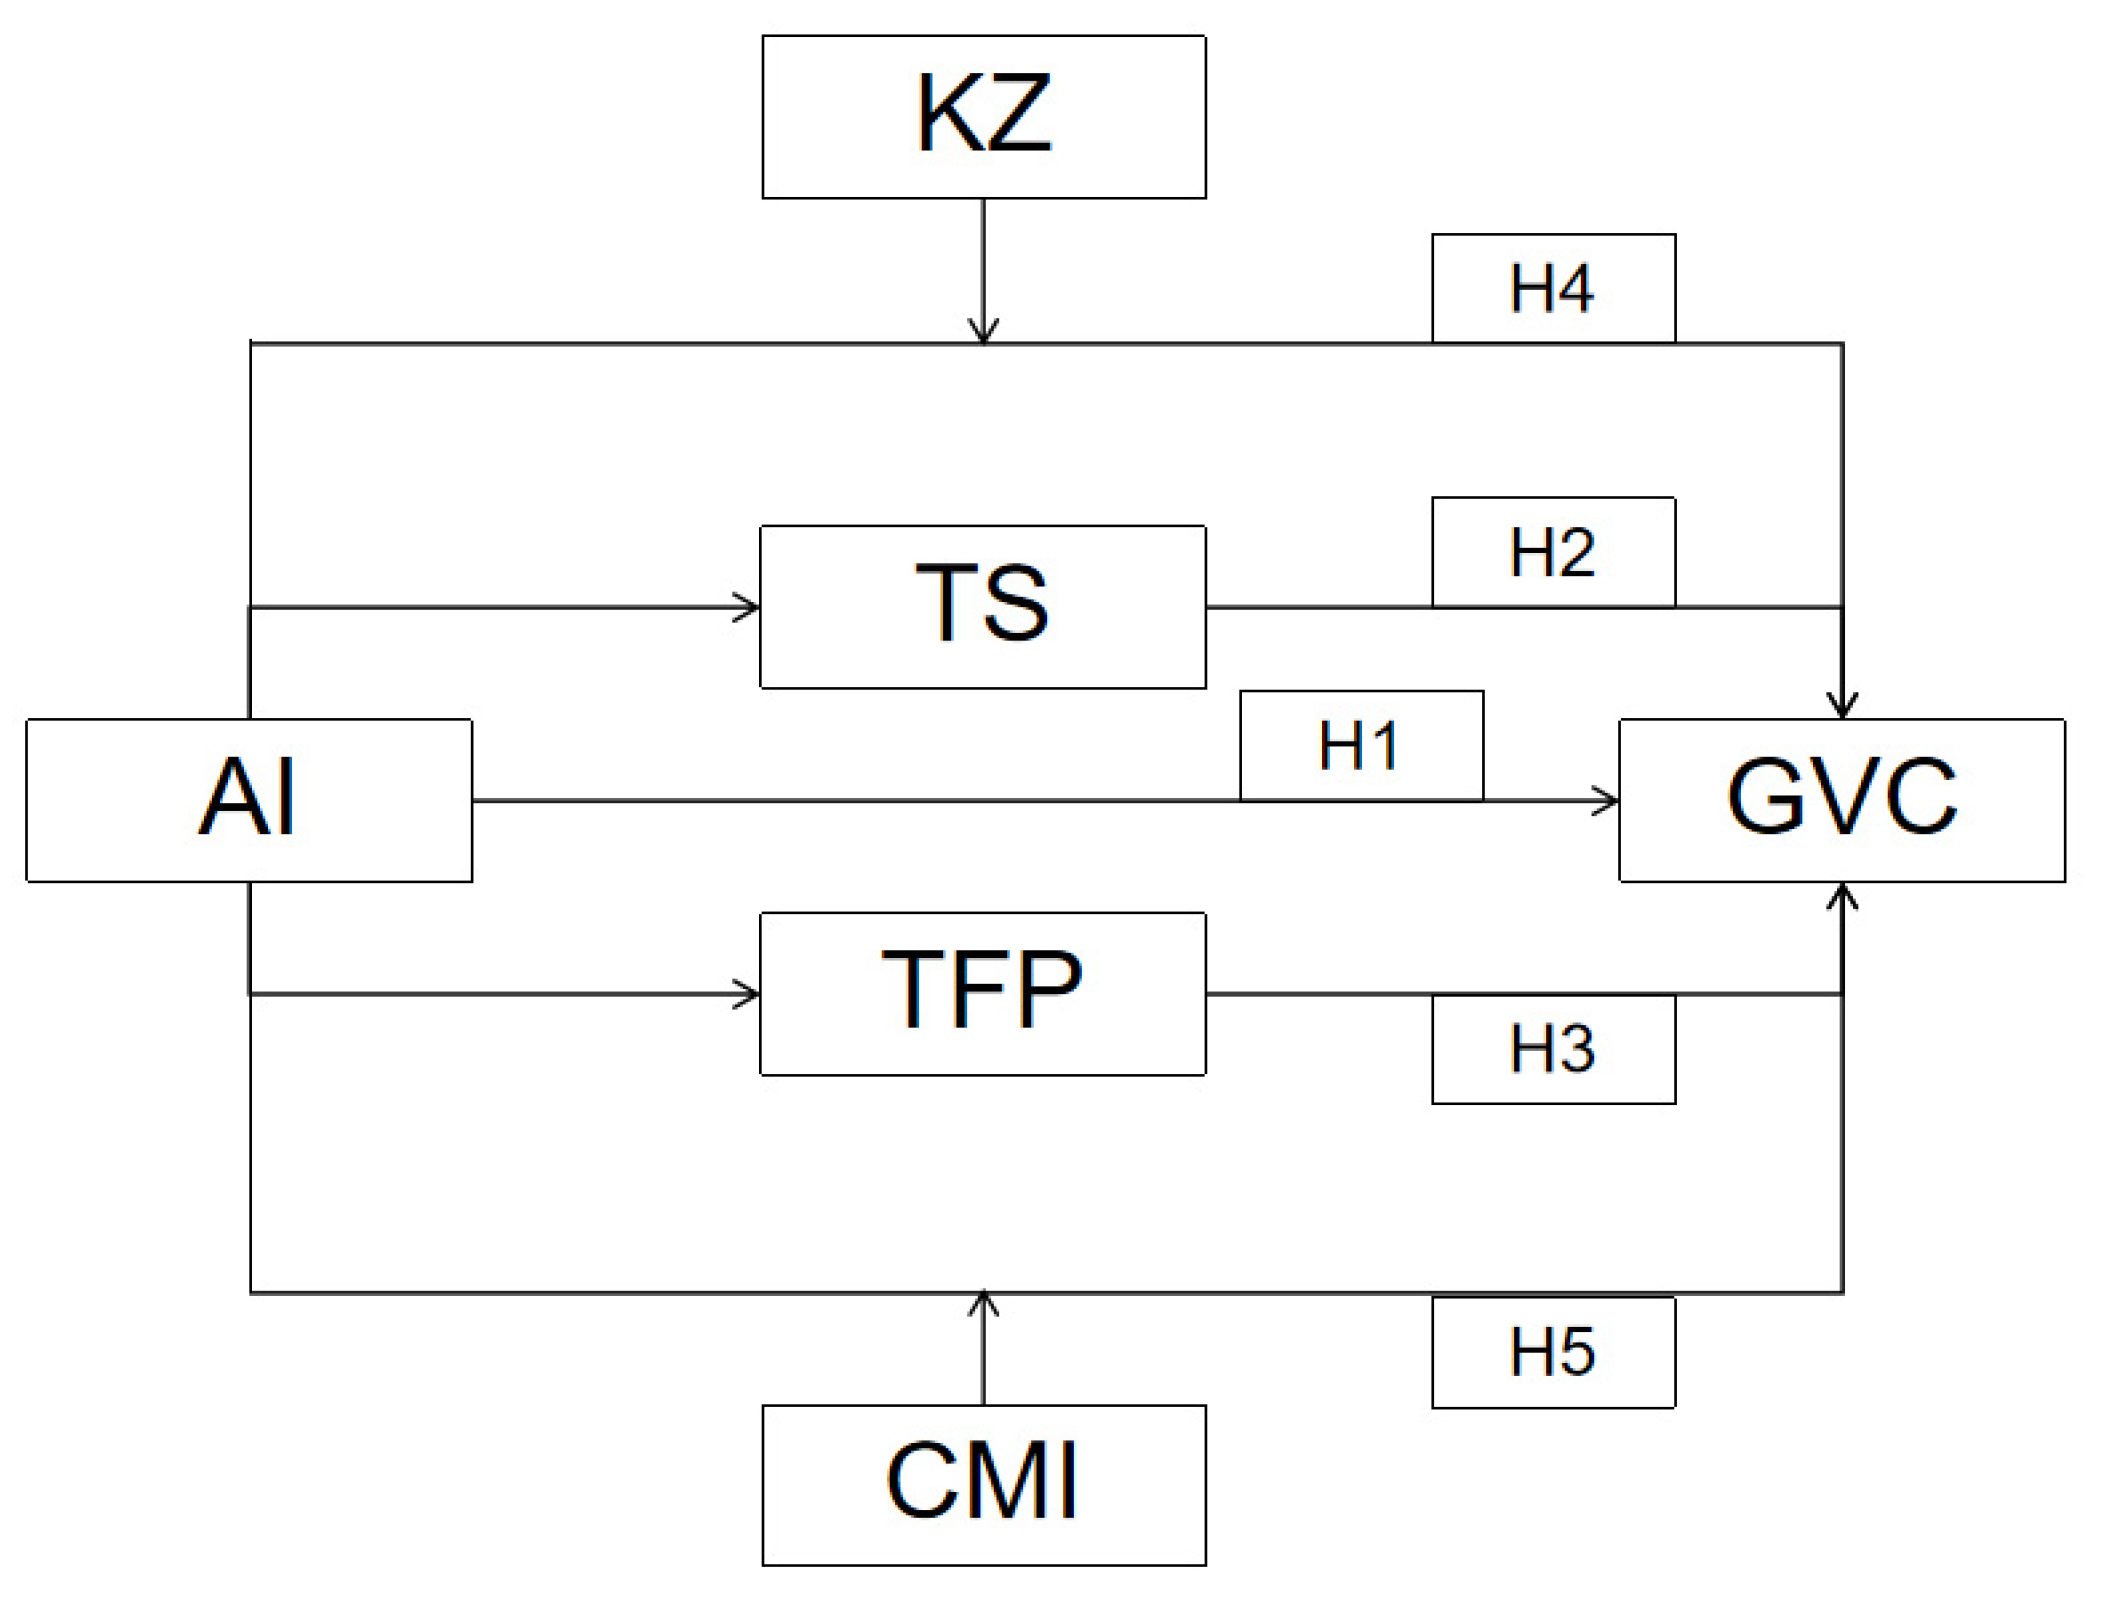
The overall research framework of this study is as shown in Figure 1. This framework systematically integrates core research elements, intrinsic correlations among variables, and logical transmission paths, intuitively presenting the theoretical structure, research hypotheses, and empirical testing approaches of this study. It provides clear logical guidance for subsequent empirical analysis and mechanism verification.

3. Research Design

3.1. Model Construction

To examine the impact of artificial intelligence on enterprises’ green value co-creation and its influencing mechanism, this study constructs the following regression models. Among them, Model 1 is used to test Hypothesis 1, Models 2 and 3 are used to test the mediation effect hypotheses, and Models 4 and 5 are used to test the moderation effect hypotheses.
GVC i , t = ρ 1 + β 1 AI i , t + γ 1 X i , t + year t + δ i + α 1
M i , t = ρ 2 + β 2 AI i , t + γ 2 X i , t + year t + δ i + α 2
GVC i , t = ρ 3 + β 3 AI i , t + θ 1 M i , t + γ 3 X i , t + year t + δ i + α 3
GVC i , t = ρ 4 + β 4 AI i , t + φ 1 KZ i , t + ω 1 AI × KZ i , t + γ 4 X i , t + year t + δ i + α 4
GVC i , t = ρ 5 + β 5 AI i , t + φ 2 KZ i , t + ω 2 AI × KZ i , t + γ 5 X i , t + year t + δ i + α 5
Enterprises are denoted by i and time by t. GVCi,t represents enterprises’ green value co-creation, AIi,t denotes the development level of enterprises’ artificial intelligence, Mi,t stands for mediating variables, and Xi,t represents control variables. Yeart denotes year fixed effects, δi indicates individual fixed effects and α denotes the error term.

3.2. Dependent Variable

The dependent variable in this study is green value co-creation (GVC). The core characteristic of GVC lies in multi-agent collaborative behaviors based on green goals within supply chains or industrial networks, and its essence is a process of resource integration and value coordination across enterprise boundaries, rather than the independent green practices of a single enterprise [31]. Existing studies show that academic measurements of value co-creation mostly focus on the characterization of cooperative relationships from a single dimension, such as using the concentration ratio of the top five customers to reflect the closeness of the connection between enterprises and their core partners [32]. In the field of green development, the number of green patent applications, as the core indicator for measuring enterprises’ green technological innovation capabilities, has been widely used in studies related to enterprise green transformation and environmental performance [33], and its advantage lies in its ability to objectively quantify the actual inputs and outputs of enterprises in green technology R&D and application [34]. However, the number of green patent applications by a single enterprise can only reflect the green development level at the individual enterprise level and cannot embody multi-agent collaborative interaction, which is the key feature distinguishing the independent development of enterprises from value co-creation. Based on this, considering the dual attributes of GVC—multi-agent collaboration and green goal orientation—this study refers to the measurement logic of inter-enterprise collaborative innovation proposed by scholars such as Di et al. (2024) and adopts the number of joint applications of green patents as the proxy variable for GVC [35]. The rationality of this indicator is mainly reflected in two aspects: on the one hand, the number of joint applications of green patents directly reflects the resource sharing, technical collaboration, and goal coordination among at least two enterprises in the process of green technology R&D, which is consistent with the essence of multi-agent collaboration in GVC; on the other hand, the green attribute of green patents compared with other patents ensures that such collaborative behaviors are carried out around environment-friendly goals, accurately corresponding to the core demand of green orientation in GVC.

3.3. Core Explanatory Variable

The core explanatory variable in this study is AI. Currently, the academic community has formed a multi-dimensional measurement system for AI: Some scholars, from the perspective of technological innovation, use the number of enterprise AI-related patent applications to measure the intensity of technological input [36,37]; other studies focus on technology application scenarios and use the density of enterprise industrial robot applications to reflect the implementation level of AI in production links [38]; there are also literatures that, from the perspective of external environmental spillover, depict the impact of the regional AI ecosystem on enterprises through the number of AI-related enterprises in the city where the enterprise is located. However, the aforementioned measurement methods are limited to a single dimension and struggle to accurately capture enterprises’ actual perception and application tendency of AI technology in operational decisions, while the application of AI at the enterprise micro-level is the focus of this study. Based on this, referring to the extraction logic of technical characteristics from enterprise textual information proposed by Yang, Y., An, R. & Song, J. (2025) and Yao, J.Q. et al. (2024) [39,40], this study adopts a hybrid method combining machine learning and text analysis to construct an enterprise-level AI measurement indicator. The specific steps are as follows:
  • Construction of the seed lexicon: Based on authoritative studies in the field of AI, multi-source authoritative lexical sources are integrated to form an initial seed lexicon. At the academic level, core terms defined in AI research by Yang et al. (2025) are referenced [41]; at the industrial practice level, key words for AI technology applications specified in the AI thesaurus provided by the World Intellectual Property Organization are adopted. Finally, 69 representative core seed words of AI are screened out.
  • Text Corpus and Model Training: Annual reports of listed companies during the research sample period are used as the text corpus. After word segmentation and stop-word removal processing via Python 3.12’s Jieba tool, the preprocessed text data is input into the Skip-gram architecture of the Word2Vec model for training. By maximizing the co-occurrence probability of target words and context words, this model can effectively capture the semantic associations of words in specific contexts [42], providing a reliable vector representation foundation for subsequent semantic expansion.
  • Formation of the AI Dictionary: Based on the trained Word2Vec model, the cosine similarity between each initial seed word and other words in the corpus is calculated, and the top 10 extended words with the highest similarity are selected for each seed word. Subsequently, duplicate words and semantically deviant words are eliminated through manual review, ultimately forming a dedicated AI dictionary containing 187 words for this study.
  • Indicator Quantification: Based on the constructed AI dictionary, the word frequency statistics method is adopted to calculate the occurrence frequency of AI-related words in the annual reports of each listed company, which is used as the proxy variable for measuring enterprise AI. The advantages of this measurement method are as follows: on the one hand, as the core text disclosed by enterprises to the outside world, annual reports can truly reflect enterprises’ attention to AI technology and actual application plans; on the other hand, the dictionary construction process through semantic expansion and manual screening effectively avoids the one-sidedness of single keyword retrieval, improving the coverage and matching degree of the indicator to the connotation of AI technology.

3.4. Mediating Variables

The mediating variables in this study are technology spillover and total factor productivity. Referring to the studies of Jaffe, A.B. & de Rassenfosse, G. (2017) and Bloom, N., Schankerman, M. & Van Reenen, J. (2013), TS is measured by the number of citations of enterprises’ patent technologies, processed by adding 1 and taking the logarithm [27,43]. TFP_OP is calculated using the Olley-Pakes method with reference to the study of Coomes et al. (2019) [44].

3.5. Moderating Variables

The moderating variables in this study are financing constraints and corporate influence. Referring to the study of Xu et al. (2020), KZ is measured using the enterprise financing constraint KZ index [45]. Corporate influence is measured by the ratio of the enterprise’s annual main business income to the total main business income of its industry, processed by adding 1 and taking the logarithm.

3.6. Control Variables

Referring to the study of Jiang et al. (2025) [46], this study selects the following control variables: Total Assets (SIZE), Return on Total Assets (ROA), Proportion of Independent Directors (INDEP), Ownership Concentration (TOP), Management Shareholding Ratio (MEOR), Tobin’s Q (TOBINQ), and Enterprise Scale (STAFF). The definition of each variable is shown in Table 1.

3.7. Data Source

This study takes listed manufacturing companies in China’s Shanghai and Shenzhen A-share markets from 2015 to 2024 as the research object, with data sourced from CSMAR, CNRDS, annual reports of listed companies, etc. The data are processed as follows: (1) Exclude ST, *ST, and PT companies; (2) Exclude financial industry companies; (3) Eliminate samples with severe data missing; (4) Perform winsorization at the 1% and 99% levels. Finally, a total of 21,285 samples are obtained.
Given that 2015 marks the official launch of China’s “Made in China 2025” strategy, which emphasizes the integration of digitalization and green transformation, it has provided a policy context for the application of AI in the manufacturing industry. Although AI has experienced rapid development since 2023, its iterative foundation and enterprise-level applications began to take shape around 2015. A 10-year panel dataset can better capture the long-term dynamic impacts of AI on green value co-creation, avoiding biases caused by short-term fluctuations. This period also covers the critical phase of China’s manufacturing sector responding to the “dual carbon” goals, ensuring the timeliness and relevance of the research. Furthermore, to guarantee sample validity, this study selects A-share listed manufacturing firms because they possess standardized financial and environmental information disclosure systems, which can provide reliable data support. Therefore, this study takes A-share listed manufacturing companies in China’s Shanghai and Shenzhen stock exchanges from 2015 to 2024 as the research objects, with data sourced from CSMAR, CNRDS, annual reports of listed companies, and other databases. The data are processed as follows: (1) Exclude ST, *ST, and PT companies to avoid the impact of abnormal operating conditions on the empirical results; (2) Eliminate samples with severe data missing to ensure the completeness of variable measurement.

4. Empirical Results and Analysis

4.1. Descriptive Statistical Analysis

Table 2 reports the descriptive statistical results of each variable in this study. As shown in Table 2, the mean value of AI is 4.999, with a standard deviation of 0.784, a minimum value of 3.258, and a maximum value of 7.052. This indicates that there are significant differences in the level of AI development among sample enterprises, and the AI development level is unbalanced across enterprises. For the dependent variable GVC, the mean value is 0.135, the standard deviation is 0.463, the minimum value is 0, and the maximum value is 2.708. This shows that there are remarkable differences in green value co-creation among enterprises: some enterprises may not have carried out relevant practices yet, while others have achieved prominent results in this field, suggesting that Chinese enterprises have great room for improvement in green value co-creation. Regarding control variables: SIZE reflects the distribution of sample enterprises in terms of total assets; ROA indicates that some sample enterprises are facing certain profitability pressure; TOP shows that the shareholding ratio of the top five shareholders is relatively concentrated in some enterprises; TOBINQ reflects the differences in enterprises’ market value expectations; MEOR illustrates that the intensity of management shareholding incentives varies across enterprises; STAFF reflects the distribution of the total number of employees among sample enterprises.

4.2. Baseline Regression Analysis

Table 3 reports the baseline regression results of the impact of AI development on GVC of manufacturing enterprises. Column (1) presents the results when only the two core variables, AI and GVC are included, with firm and year fixed effects controlled. The results show that the estimated coefficient (0.039) of AI development on GVC of manufacturing enterprises is significantly positive at the 1% level. Column (2) adds control variables without fixing firm and year fixed effects; the estimated coefficient of the core explanatory variable AI is significantly positive at the 1% level, with a coefficient value of 0.074. Column (3) further incorporates firm fixed effects on the basis of Column (2), and the estimated coefficient of AI on GVC of manufacturing enterprises remains significantly positive at the 1% level, with a coefficient of 0.055. Column (4) includes year fixed effects on the basis of Column (3); the estimated coefficient of AI on GVC of manufacturing enterprises is still significantly positive at the 1% level, with a coefficient of 0.024. This indicates that for every 1% increase in the AI development level of manufacturing enterprises, the GVC level increases by 0.024%. The above results all verify Hypothesis 1, indicating that the positive driving effect of AI on the GVC of manufacturing enterprises is stable and reliable. Whether micro-level enterprise control variables are included, or firm-specific heterogeneity and macro-year shocks are controlled, the estimated coefficient of AI remains significantly positive at the 1% level. From the perspective of the mechanism, the core technical characteristics of AI are accurately responding to the key demands of GVC: on the one hand, AI’s big data analysis and intelligent optimization capabilities can solve the information asymmetry among multiple subjects in co-creation, helping co-creation participants quickly reach a consensus on green goals and optimize the efficiency of collaborative resource allocation; on the other hand, AI’s refined management and control of production processes can not only reduce the technical threshold and cost burden for enterprises to participate in green co-creation, but also provide quantifiable and traceable green achievement support for co-creation projects, thereby effectively activating enterprises’ motivation and capability to participate in GVC. Regarding control variables, the larger the total assets of an enterprise, the more concentrated its ownership, the higher the matching degree between the market value and asset replacement cost of manufacturing enterprises, and the higher the management shareholding ratio, the higher the level of GVC of the enterprise. At the level of control variables, the regression results further reveal the impacts of firms’ inherent characteristics on GVC: The larger the total asset size of an enterprise, the more abundant financial, technological, and human resources it possesses. This enables enterprises to better support the R&D and implementation of green projects, thereby achieving a higher level of GVC. The higher the ownership concentration, the relatively higher the enterprise’s decision-making efficiency. The core management team exhibits stronger executive capacity to promote green strategies, making it easier to concentrate resources on green value co-creation activities. The higher the Tobin’s Q ratio an indicator reflecting the matching degree between a manufacturing enterprise’s market value and asset replacement cost—the more aligned the firm’s market valuation is with the actual value of its assets. Such enterprises demonstrate greater operational stability and stronger awareness of sustainable development, and are more inclined to enhance long-term competitiveness through green value co-creation. The higher the management shareholding ratio, the more deeply the personal interests of the management are bound to the enterprise’s long-term development. This significantly boosts their enthusiasm to drive green transformation and participate in green value co-creation, thereby promoting the improvement of the enterprise’s GVC level.
In terms of economic significance, the elasticity coefficient of AI on GVC in Column (4) of Table 3 is 0.024, indicating that a 1% increase in the AI word frequency index leads to a significant 0.024% rise in the level of green value co-creation. Further analysis incorporating sample characteristics reveals that the standard deviation of the AI indicator is 0.784, which implies that a one-standard-deviation increase in the AI level will drive a significant 1.88% growth in GVC. Given that the sample mean of GVC is only 0.135, this growth magnitude is equivalent to 13.9% of the average level of GVC.

4.3. Robustness Tests

4.3.1. Replacing the Core Explanatory Variable

Referring to the study by Cheng et al. (2024) [47], this study uses a text analysis method to measure the level of enterprise digital transformation (DT) as a replacement for the level of enterprise AI development. The regression results are presented in Table 4. Column (1) shows the regression results without including control variables, controlling for firm and year fixed effects; the coefficient of DT is 0.039, which is significantly positive at the 1% significance level. Column (2) reports the regression results after adding control variables to Column (1); the coefficient of DT is 0.029, also significantly positive at the 1% significance level. These results validate Hypothesis 1, indicating that the findings of the baseline regression are robust. This result indicates that after controlling for firm-level characteristic factors, the positive impact of corporate digital transformation on the dependent variable remains valid, which strongly validates Hypothesis 1 of this study. Meanwhile, it demonstrates that the baseline regression results possess good robustness, preliminarily confirming that corporate digital transformation can significantly promote the improvement of the dependent variable.

4.3.2. Lagged Dependent Variable

To effectively mitigate the potential bidirectional causal endogeneity between the dependent variable and the core explanatory variable, this study refers to the mainstream processing paradigm of existing literature and incorporates the lagged one-period and two-period values of the dependent variable (GVC) into the benchmark regression model. This approach aims to more accurately identify the causal effect of the core explanatory variable on the dependent variable and avoid estimation bias caused by the mutual influence between variables. Column (3) reports the regression results with the dependent variable lagged by one period, where the coefficient of AI is 0.044 and significant at the 1% level. Column (4) presents the regression analysis with the dependent variable lagged by two periods, showing that the AI coefficient is 0.026 and also significant at the 1% level. From the perspective of model specification logic, incorporating the lagged terms of the dependent variable into the regression equation can effectively break the reverse causal chain between concurrent variables, isolate the impact of the core explanatory variable on the dependent variable from the bidirectional interactive relationship, and thereby mitigate the interference of bidirectional causal endogeneity on the estimation results. The aforementioned regression results of the first-order and second-order lags consistently indicate that after controlling for the historical levels of the dependent variable, the improvement in the level of AI development can still significantly promote the enhancement of enterprises’ GVC capabilities. This provides a more reliable empirical foundation for the accurate identification of the causal relationship between the core explanatory variable and the dependent variable. Therefore, combining the baseline regression results with the endogeneity treatment results of the lagged dependent variable, Hypothesis 1 of this study is further verified and consolidated—i.e., the improvement in enterprises’ AI development level can significantly promote their GVC. This conclusion is not only statistically significant but also robust in terms of causal identification, laying a solid empirical foundation for the subsequent exploration of the underlying mechanism and heterogeneous impacts between the two variables.

4.3.3. Lagged Core Explanatory Variable

To enhance the robustness of empirical results and the reliability of causal identification, this study addresses the potential endogeneity issue of the core explanatory variable. Meanwhile, considering that the impact of AI development on enterprises’ GVC may exhibit a time lag due to procedural factors such as technology adaptation and multi-agent collaboration: On the one hand, technology adaptation involves procedural links including equipment commissioning, personnel training, and process restructuring, which entails a significant technology implementation cycle. On the other hand, GVC involves multi-agent collaboration among enterprises, suppliers, customers, governments, and other stakeholders. It requires the formation of collaborative mechanisms through long-term interactions, and the release of its effects is inevitably accompanied by a time lag. Therefore, the promoting effect of AI development on enterprises’ GVC may not manifest immediately in the current period, but is more likely to gradually unfold in the first-order or second order lags. Thus, the core explanatory variable is treated with one period and two-period lags. Column (5) reports the results with the core explanatory variable lagged by one period, and Column (6) presents those with a two period lag, further verifying Hypothesis 1 of this study. This approach not only alleviates contemporaneous endogeneity interference through temporal separation to ensure the logical rigor of causal inference but also accurately captures the time lag characteristics of AI development’s impact on corporate green value co-creation. Through the comparative verification of coefficients across multiple lag periods, it provides dual support for the robustness and reliability of the research conclusions.

4.3.4. Instrumental Variable (IV) Method

Given the persistent endogeneity issue arising from mutual causality between corporate AI and GVC, enterprises with better performing GVC are more inclined to develop AI to capture stakeholders’ value demands and reshape the stakeholder value creation network this study further mitigates endogeneity using the IV method. The average level of digitalization at the region-year level is selected as the instrumental variable: the digitalization degree of the region where an enterprise is located in the same year is closely related to the enterprise’s individual digitalization level, but has no direct logical connection with the enterprise’s GVC. Thus, Hypothesis H1 is retested based on the region-year AI data. Columns (7) and (8) of Table 4 report the IV estimation results. Column (7) shows that when individual fixed effects are controlled, the coefficient of AIAV is 0.109, which is statistically significant at the 1% level. Column (8) indicates that when year fixed effects are controlled, the coefficient of AIAV is 0.120, also significant at the 1% level. In summary, corporate AI still exerts a significantly positive impact on enterprises’ GVC performance, and the impact coefficient passes the 1% significance level test. This confirms that Hypothesis H1 remains valid.

4.3.5. Substitution of the Test Model

To further verify the reliability and robustness of the benchmark regression results, this study adopts the model replacement method for robustness testing, replacing the benchmark econometric model with the Poisson regression model and the negative binomial regression model. In the regression analysis of discrete dependent variables, model selection needs to focus on the distribution characteristics of the dependent variable: if the dependent variable exhibits overdispersion, the negative binomial regression model is more applicable than the Poisson regression model, as it can effectively alleviate estimation bias caused by overdispersion. Descriptive statistics of the core dependent variable, GVC participation, indicate that its variance is significantly greater than its mean, showing obvious overdispersion characteristics. Therefore, the estimation results of the negative binomial regression model are more explanatory. Column (1) of Table 5 reports the estimation results of the Poisson regression model, where the estimated coefficient of the core explanatory variable, AI, is 0.593, which is statistically significant at the 1% level. Column (2) presents the results of the negative binomial regression model, with the estimated coefficient of AI being 0.619, also statistically significant at the 1% level. These robustness test results demonstrate that, under the premise of controlling for other variables and differences in model specifications, the direction and significance of the impact of AI on GVC participation have not undergone substantial changes. This further corroborates the robustness and credibility of the benchmark research conclusions of this study.

4.4. Mediating Mechanism

Test To verify the mediating mechanism hypotheses proposed earlier, this study draws on the research methods of Tingley et al. (2014) and Imai et al. (2010) [48,49] to explore the impact mechanism of AI development level on green value co-creation, with a focus on empirically testing the mediating effects of technology spillovers and TFP therein. The results are presented in Table 6. Column (1) shows that the AI development level significantly promotes technology spillovers in manufacturing enterprises at the 1% significance level. This indicates that the widespread application of AI technology has broken the temporal and spatial constraints of traditional technology dissemination. By means of big data sharing, intelligent algorithm collaboration, and other approaches, it has accelerated the diffusion of green production technologies and environmental governance experience among enterprises in the upstream and downstream of the industrial chain, thereby providing efficient implementation pathways for technological spillover. Column (2) reports the analysis of AI development level’s impact on manufacturing enterprises’ green value co-creation after incorporating the mediating variable of technology spillovers. The coefficient of AI decreases from 0.024 in the benchmark test to 0.023, while remaining significant at the 1% level, indicating that technology spillovers play a mediating role in the impact of AI on manufacturing enterprises’ green value co-creation. This verifies Hypothesis H2, suggesting that AI drives spillover effects such as green technology knowledge sharing and green production experience diffusion among enterprises, reduces technical barriers and information costs for cross-agent green collaboration, and thus enables part of the AI dividends to be indirectly converted into green co-creation value through technology spillovers. Additionally, the fact that the coefficient does not drop to zero indicates that AI still exerts a direct promoting effect.
Column (3) indicates that the AI development level can significantly improve the TFP of manufacturing enterprises, with the coefficient of AI being 0.152 and significant at the 1% level. Column (4) presents the study on the impact of AI development level on manufacturing enterprises’ green value co-creation after incorporating TFP as the mediating variable. The coefficient of AI decreases from 0.024 in the benchmark test to 0.023, while remaining significant at the 1% level, demonstrating that TFP plays a mediating role in the influence of AI on manufacturing enterprises’ green value co-creation and verifying Hypothesis H3. This suggests that AI improves TFP by optimizing production processes and enhancing resource utilization efficiency. It not only reduces energy consumption and carbon emissions per unit of output for enterprises but also frees up financial, human, and other resources to support green collaboration projects. This enables part of the efficiency dividends of AI to be converted into green co-creation value, further improving the mechanism chain through which AI affects green value co-creation.

4.5. Moderating Effect Test

Table 7 reports the results of the moderating effect tests for financing constraints and corporate influence. Column (1) presents the regression results without considering control variables under the condition of fixed individual and year effects. Column (2) shows the test results after adding the interaction term AI × KZ (AI and KZ index) and control variables. The coefficient of AI is 0.048, and the coefficient of AI × KZ is −0.046, both of which are significant at the 1% level. This indicates that financing constraints exert a significant negative moderating effect. From an economic logic perspective, both the application of AI technology and the conduct of GVC activities require substantial initial capital investment, including the procurement of intelligent equipment, technological R&D, and the establishment of cross agent collaboration platforms. For enterprises with high financing constraints, tight internal cash flow and high external financing costs make it difficult to ensure sustained resource input for the implementation of AI technology, nor can they fully carry out the preliminary preparation and long term operation of green collaboration projects. This thereby restricts the conversion of AI’s technological advantages into GVC value. Even though AI itself possesses the technological potential to drive GVC, high financing constraints will form a “resource bottleneck,” weakening its positive promoting effect.
To test Hypothesis H5 proposed earlier, Column (3) presents the regression results without considering control variables under the condition of fixed individual and year effects, where the coefficient of AI is 0.036 and significantly positive at the 1% level. Column (4) shows the test results after adding the interaction term AI × CMI (AI and Corporate Influence Index) and control variables. The coefficient of AI is 0.051, and the coefficient of AI × CMI is 0.023, both significant at the 1% level. This indicates that corporate influence exerts a significant positive moderating effect. Its intrinsic mechanism can be elaborated from two dimensions: resource integration and collaboration efficiency. On the one hand, the stronger the corporate influence, the more prominent its discourse power and appeal in the industrial chain. This enables enterprises to more easily attract upstream and downstream partners to participate in green co-creation projects, reducing the negotiation costs and trust barriers associated with cross agent collaboration. On the other hand, enterprises with strong influence often possess more comprehensive industrial resource networks and greater authority in formulating green standards. They can leverage AI technology to promote the unification and diffusion of green production standards, thereby improving the green production efficiency of the entire collaborative network. Therefore, such enterprises can more effectively align AI technology with green co-creation needs, maximize the value conversion efficiency of technology application, and thus strengthen the promoting effect of AI on GVC.

4.6. Heterogeneity Analysis

4.6.1. Voluntary Environmental Regulation

ISO 9001, as an internationally recognized environmental management system standard and a voluntarily adopted management tool by enterprises [50], provides a standardized pathway for enterprises’ green management. Thus, it is reasonable to use it as a criterion to distinguish whether enterprises implement voluntary environmental regulations. The regression results of the heterogeneity analysis are presented in Table 8. Column (1) reports the results for ISO 9001-certified manufacturing enterprises, where the coefficient of AI is 0.031 and significant at the 5% level. Column (2) shows the results for non-ISO 9001-certified manufacturing enterprises, with the AI coefficient being 0.008 and not significant at the 10% level. The heterogeneity test results clearly indicate that the promoting effect of AI development level on GVC of manufacturing enterprises is more pronounced in enterprises adopting voluntary environmental regulation—i.e., enterprises certified with ISO9001 exhibit stronger explanatory power of AI. This finding profoundly confirms the importance of institutional and technological synergy effects: voluntary environmental regulation is not merely a compliance requirement but essentially serves as a standardized institutional foundation for enterprises’ green development. As a carrier of technological innovation, AI can only fully exert its enabling value when complementing the institutional environment. The standardized management system constructed by ISO9001 certification precisely provides institutional guarantees for AI technology to reduce application costs and accurately match green demands. Conversely, enterprises lacking such institutional support face a fragmented state of green management, which restricts the technological spillover and collaborative efficiency of AI, resulting in an insignificant driving effect on GVC.
This conclusion not only enriches the heterogeneous research in the field of AI and corporate green development but also provides dual implications for policy formulation and enterprise practice: From a policy perspective, enterprises should be encouraged to voluntarily participate in the certification of standardized systems such as ISO9001 and ISO14001 [50], and a favorable environment for technology empowerment should be created by strengthening institutional supply. From an enterprise perspective, while promoting AI-enabled GVC, enterprises need to attach importance to the standardized construction of internal management systems, and unlock the maximum potential of technological innovation through institutional innovation.

4.6.2. Nature of Enterprise Ownership

Drawing on the classification of enterprise ownership, this study partitions the sample into state-owned enterprises (SOEs) and non-state-owned enterprises (non-SOEs) to conduct heterogeneity analysis, with results reported in Table 8. Column (3) presents the regression results regarding the impact of AI development level on green value co-creation for SOEs, where the coefficient of AI is 0.076 and statistically significant at the 1% level. Column (4) demonstrates that such a positive relationship is absent in non-SOEs. We conclude that compared with non-SOEs, SOEs exhibit a more pronounced capacity to translate AI development into green value co-creation. Specifically, on one hand, SOEs generally assume greater environmental governance obligations and demonstrate a stronger propensity to deploy AI technologies in key green value co-creation processes, such as green production optimization and carbon footprint tracing. On the other hand, the resource access advantages inherent in SOEs provide contextual support for AI to facilitate corporate green value co-creation, thereby further enhancing the efficiency of technology conversion.

4.6.3. Industry Attributes

To investigate the moderating role of industry attributes in the impact of AI on corporate green value co-creation, this study classifies the sample into high-polluting industries and non-high-polluting industries based on enterprise pollution intensity, and conducts a heterogeneity analysis, with the results presented in Table 8. Column (5) reports the impact of AI development on green value co-creation in high-polluting industries, where the coefficient of AI is 0.032 and statistically significant at the 5% level. Column (6) presents the results for non-high-polluting industries, showing that the AI coefficient is 0.019, also significant at the 5% level. In summary, for high-polluting industries, for every 1% increase in the level of AI development, green value co-creation increases by 0.032%. In contrast, for non-high-polluting industries, a 1% increase in AI development leads to a 0.019% increase in green value co-creation. Evidently, high-polluting industries exhibit stronger explanatory power regarding the role of AI in promoting corporate green value co-creation compared to non-high-polluting industries. Specifically, the coefficient for high-polluting industries (0.032) is approximately 68.4% higher than that for non-high-polluting industries (0.019). The inherent logic behind this difference lies in two aspects: First, as key targets of environmental supervision, high polluting industries are confronted with stricter environmental compliance requirements, higher risks of environmental penalties, and greater pressure for green transformation. Their demand for GVC is more urgent in aspects such as emission reduction optimization in production processes, pollutant emission control, and dynamic management of environmental risks. To meet compliance requirements, reduce environmental costs, and enhance green competitiveness, enterprises in high polluting industries have a stronger inherent demand for innovative approaches that can break through the bottlenecks of traditional environmental protection technologies. Second, AI technology possesses unique technical advantages in scenarios such as real time energy consumption monitoring, precise pollutant source tracing, full chain management of supply chain carbon footprints, and intelligent operation and maintenance of environmental protection equipment, forming a stronger functional adaptability with the green transformation needs of high polluting industries. For example, through the integration of the Internet of Things and AI algorithms, high polluting enterprises can achieve dynamic tracking and intelligent regulation of energy consumption and pollutant emissions during production, significantly improving emission reduction efficiency. Meanwhile, supply chain carbon footprint management systems can help enterprises collaborate with upstream and downstream partners to reduce the environmental impact of the entire industrial chain, promoting the indepth implementation of GVC.
In contrast, non high polluting industries themselves have lower pollution emission intensity, with relatively moderate environmental compliance pressure and green transformation needs. Their demand for AI enabled green development is less urgent, and their green management scenarios are more inclined to shallow level needs such as process optimization and resource conservation. As a result, AI’s technical advantages are difficult to fully exert, leading to a relatively weaker enabling effect. In summary, the heterogeneity test results clearly indicate that the promoting effect of AI development level on GVC of manufacturing enterprises exhibits significant heterogeneity in industry pollution intensity: compared with non high polluting industries, AI demonstrates a stronger green enabling effect and more prominent explanatory power in high polluting industries.

5. Discussion

This study empirically verifies that AI drives GVC in Chinese manufacturing enterprises through dual mediating pathways: the enhancement of technological spillover capacity and TFP. Financing constraints impose contextual restrictions on this relationship, while corporate influence amplifies its effectiveness. These findings align with the global academic discourse on the “twin transition” a cross disciplinary research focus that emphasizes technological diffusion, organizational adaptation, and institutional support as the foundations for synergizing digital technologies with green goals [51]. Staab and Sorg (2025) further point out that digital innovation has gradually formed a “digital eco-technocracy” in addressing ecological crises, and its legitimacy construction relies on the deep coupling of technology and institutions [52]. This provides theoretical echoes for the synergistic logic of “digital technology + institutional support” emphasized in this study. The identification of technological spillover as a key mediating variable in this study embodies this core logic: AI breaks the “black box” phenomenon of green technologies by processing unstructured data and reversing algorithmic logic, thereby accelerating inter-enterprise knowledge sharing and green technology diffusion. This is consistent with practical observations from corporate cases, where digital solutions optimize collaboration among stakeholders to drive sustainable operations. Specifically, the theory of “digital sustainable business models” proposed by Böttcher et al. (2024) emphasizes that digital technologies need to integrate ecological sustainability into the core of business operations. The AI-driven inter-enterprise knowledge sharing and technology diffusion are precisely the core implementation pathways of such business models [53]. Meanwhile, by verifying that knowledge reuse and diversification act as critical drivers of industrial transformation at the micro enterprise level, this study extends research insights at the regional scale. The negative moderating effect of financing constraints reflects a universal challenge faced by enterprises of all sizes. This study observes that capital shortages constitute a “resource bottleneck” for AI enabled GVC, which echoes findings from research on micro, small, and medium sized enterprises (MSMEs) [54] capital scarcity hinders the translation of digital potential into sustainable performance. This consistency across enterprise sizes indicates that financing dilemmas are not unique to small businesses but also constrain listed manufacturing enterprises, particularly non state owned enterprises (non-SOEs) with limited access to resources. Demirel et al. (2025) also confirm that IT-enabled organizational transformation is crucial for green employment growth in microfirms, but financing constraints will significantly weaken this transformation effect. This further verifies the universal constraint of capital scarcity on the release of green value from digital technologies [55]. Global policy research [56] suggests that financial instruments should integrate support for environmental compliance with funding for digital transformation. For China’s manufacturing sector, this implies that green credit and subsidies should prioritize AI applications in green collaboration, targeting enterprises facing tighter capital constraints to foster an inclusive twin transition. Heterogeneity analysis further clarifies the contextual boundaries of AI’s GVC enhancing effect. The stronger impact of AI in high polluting industries stems from the close alignment between AI’s technical advantages and the urgent environmental demands of these sectors. Simultaneously, state-owned enterprises (SOEs) demonstrate more pronounced technological transformation capabilities, reflecting the mediating role of organizational resources and policy obligations in green technology adoption. Cross regional research has long noted that industrial transformation varies with institutional and industry attributes; this study further refines this understanding by emphasizing China’s unique institutional context as a valuable case for exploring how contextual factors shape the twin transition, thereby enriching global insights into heterogeneous transformation pathways. Additionally, the complementary relationship between institutions and technology highlights a key practical implication: voluntary environmental regulation is not merely a compliance formality but an institutional framework that reduces friction in AI applications. This addresses the fragmented green management challenges faced by non-certified enterprises a problem also emphasized in MSME research, which indicates that standardized digital strategies are indispensable for MSMEs. Furthermore, research on Peruvian MSMEs points out that environmental sustainability guides digital transformation and innovation; this study extends this logic to large Chinese manufacturing enterprises, confirming that institutionalization measures serve as a prerequisite for unlocking the environmental value of digital technologies and bridging the gap between policy compliance and technological empowerment. From a theoretical perspective, the mediating role of TFP embodies the core logic of the resource orchestration theory: AI optimizes the allocation of labor, capital, and energy toward green production links, releasing financial and capacity support for GVC. The moderating effect of corporate influence reflects the practical reality that network power and authority in setting industry standards are critical to scaling digital-green synergy. High influence enterprises leverage their market position to integrate cross industry green data, promote upstream and downstream participation in AI collaboration platforms, and reduce the market promotion costs of green products. These theoretical and practical insights further validate international policy recommendations: governments should design integrated policies that combine environmental certification with digital skills training; enterprises, especially those with strong industry influence, should use AI to establish industrial green standards and drive MSME participation in GVC consistent with observations from circular economy hub cases. In summary, this study not only uncovers the micro mechanisms through which AI empowers GVC in Chinese manufacturing enterprises but also integrates these findings into the global academic dialogue on the twin transition. The consistency of the study’s conclusions with cross country and cross scale evidence confirms the generalizability of AI’s role in facilitating green collaboration. Meanwhile, China’s unique institutional heterogeneity enriches the understanding of contextual conditions shaping the twin transition. By linking micro level enterprise behavior to macro-level industrial transformation, this study provides actionable insights for balancing economic growth and environmental sustainability, offering references for emerging economies facing similar development challenges and developed economies seeking to optimize their green-digital collaboration models.
In terms of economic significance, while the direct elasticity coefficient of AI on GVC may appear modest, its economic rationality can be validated from three dimensions when considering the characteristics of green innovation, the multi-dimensional returns of AI investment, and long-term value: First, the attributes of variable measurement shape the elasticity characteristics. In this study, the AI indicator does not directly measure capital investment; instead, it captures enterprises’ strategic attention to AI and their long-term deployment intentions. AI 1% increase in this indicator corresponds to a qualitative upgrade of the AI strategy from “mention in a single operational link” to “full chain layout”. This strategic advancement inherently exhibits a gradual nature, which cannot be reflected by a substantial short-term elasticity, yet it lays the institutional and technological foundation for green collaborative innovation. Second, the multi-dimensional returns of AI investment are not fully captured by the direct elasticity. This study verifies the direct driving effect of AI on GVC, yet AI deployment also indirectly propels enterprises’ green transformation by enhancing technological spillover and TFP. These indirect benefits are not embodied in the direct elasticity of GVC, but they constitute a core component of the overall value brought by AI investment. Third, the implicit value of green transformation cannot be overlooked. The growth of GVC is not only manifested in the increase in the number of joint green patents but also encompasses implicit values: the enhancement of enterprises’ environmental reputation, the establishment of green supply chain barriers, and the reduction in policy compliance costs. Although these values are not directly quantified, they are critical to enterprises’ sustainable competitiveness. For instance, the discourse power in industrial technical standards enabled by joint green patents carries long term economic value that far exceeds the elasticity measurement of short-term patent output. By benchmarking against existing literature, the empowerment of digital technologies on long-term, complex activities generally exhibits the characteristic of “modest incremental progress and long-term accumulation”. For example, Yang et al. (2025) reported an elasticity coefficient of 0.031 when investigating the impact of AI on corporate social responsibility [39]; Cheng et al. (2024) found that the elasticity coefficient of digital transformation on green transformation is 0.029 [47]. Both values fall within the same order of magnitude as the results of this study, which further validates the rationality of our conclusions.

6. Conclusions and Research Prospects

6.1. Conclusions

Compared with previous studies on AI and GVC that focus on e-commerce platform scenarios and emphasize subjective cognitive mechanisms [57], this study shifts its research perspective to the manufacturing sector an area with broader coverage and a core carrier of resource consumption and carbon emissions. It systematically reveals the objective transmission mechanism of AI empowering GVC, accurately addresses the practical pain points faced by manufacturing enterprises in the integration of AI application and GVC, and selects financing constraints and firm influence as moderating variables for empirical analysis in combination with the actual logic of enterprise development.
The research findings are as follows: First, AI development exerts a significantly positive promoting effect on GVC in manufacturing enterprises, and heterogeneity tests further reveal that this promoting effect is more prominent in voluntary regulation contexts, state-owned enterprises, and high-pollution industries. Accordingly, manufacturing enterprises should incorporate AI technology layout into the top-level design of their green development strategies, promoting the in-depth integration of AI with core business links such as production and manufacturing, supply chain collaboration, and green R&D. Meanwhile, enterprises under voluntary regulation can rely on AI technology to enhance the initiative of green innovation; state owned enterprises need to give play to their advantages in resource integration and policy response to construct a mature demonstration model of AI and GVC; high-pollution industries should focus on the precise application of AI in emission reduction and carbon reduction, realizing the dual goals of environmental compliance and GVC through technological empowerment. Second, mechanism analysis confirms that AI can significantly enhance enterprises’ technological spillover capacity and TFP, thereby improving the GVC level of manufacturing enterprises, that is, technological spillover capacity and TFP play a partial mediating role in the relationship between AI and GVC. Manufacturing enterprises should, on the one hand, optimize production processes through AI technology to reduce the resource and environmental costs per unit of output, consolidating the supporting role of TFP in GVC; on the other hand, establish an industrial chain-oriented AI technology sharing platform to promote the cross-enterprise and cross-departmental diffusion of core resources such as green process parameters and intelligent emission reduction schemes, amplifying the overall green collaborative effect of the industrial chain through technological spillover. Third, the results of moderating effect analysis show that financing constraints play a negative moderating role in the path of AI promoting GVC in manufacturing enterprises, while firm influence plays a positive moderating role, the greater the firm influence, the stronger the promoting effect of AI on GVC. Enterprises need to accurately align AI-driven green transformation projects with green financial instruments to enhance their competitiveness in financing channels such as green credit and green bonds. For enterprises with high influence, they should rely on their advantages in brand, channels, and resources, take AI empowered GVC practices as benchmarks, and lead upstream and downstream small and medium sized enterprises to participate in GVC by issuing industrial green standards and leading industrial chain green collaboration projects, forming a development pattern of leading enterprises driving and cluster linkage.

6.2. Research Prospects

Although this study has empirically examined the impact of AI on GVC in manufacturing enterprises, it still has several limitations in certain aspects, which also point out feasible directions for future research.
First, regarding sample selection and data dimensions. This study focuses on listed manufacturing enterprises on China’s Shanghai and Shenzhen A-share markets from 2015 to 2024. Although it takes the manufacturing industry a core domain for green value co-creation as the research object, the sample is limited to Chinese A-share listed enterprises, excluding non-listed enterprises and firms from other countries, which may restrict the generalizability of the research findings. Meanwhile, the AI level in this study is measured by constructing an indicator based on word frequency in annual report texts. While this can reflect the level of enterprises’ AI development and their strategic attention to AI to a certain extent, it fails to distinguish between textual mentions and actual implementation. It also does not consider the heterogeneity of AI technology types and application scenarios, which may lead to the overestimation or underestimation of AI’s actual enabling effect. In addition, green value co-creation is measured by the number of joint green patents, which can only capture the co-created achievements in the technological aspect. However, it lacks effective measurement for aspects such as supply chain emission coordination, joint waste management agreements, or collaborative green marketing strategies, which may result in certain variable measurement bias. Future research can expand the sample scope to include non-listed enterprises and cross-border enterprises, and further improve the measurement system for AI and green value co-creation, so as to enhance the accuracy of the research and the generalizability of the conclusions.
Second, in terms of mechanism exploration. Although this study investigates the mediating effects of technological spillovers and TFP, it fails to disentangle the internal heterogeneity of the mediating variables. For instance, technological spillovers can be further precisely categorized into horizontal technological spillovers and vertical technological spillovers. These two types may exhibit differences in both the strength and pathways of their impacts on the relationship between AI and green value co-creation in manufacturing enterprises, which also constitutes an important direction for future research.


Author Contributions

Conceptualization, X.S. and W.P.; methodology, W.P.; software, W.P.; validation, X.S.; formal analysis, W.P.; investigation, W.P.; resources, X.S.; data curation, W.P.; writing—original draft preparation, W.P.; writing—review and editing, X.S.; visualization, W.P.; supervision, X.S.; project administration, X.S.; funding acquisition, X.S. All authors have read and agreed to the published version of the manuscript.

Funding

This study was supported by the Basic Scientific Research Project of Liaoning Provincial Department of Education (JYTZD2023034) and the Social Science Association Project of Dalian Polytechnic University (GDSKLZD202508).

Institutional Review Board Statement

Not applicable.

Informed Consent Statement

Not applicable.

Data Availability Statement

The data supporting the findings of this study are available from the corresponding author upon reasonable request.

Conflicts of Interest

The authors declare no conflicts of interest.

Abbreviations

The following abbreviations are used in this manuscript:
AIArtificial Intelligence
TFPTotal Factor Productivity
SOEsState-owned Enterprises
GVCGreen Value Co-creation
SDGsSustainable Development Goals
ISO9001International Organization for Standardization 9001

References

  1. Sachs, J.D.; Schmidt-Traub, G.; Mazzucato, M.; Messner, D.; Nakicenovic, N.; Rockström, J. Six Transformations to achieve the Sustainable Development Goals. Nat. Sustain. 2019, 2, 805–814. [Google Scholar] [CrossRef] [Scilit]
  2. Zhang, L.; Mu, R.Y.; Zhan, Y.F.; Yu, J.; Liu, L.; Yu, Y.; Zhang, J. Digital economy, energy efficiency, and carbon emissions: Evidence from provincial panel data in China. Sci. Total Environ. 2022, 852, 158403. [Google Scholar] [CrossRef] [Scilit] [PubMed]
  3. Pástor, L.; Stambaugh, R.F.; Taylor, L.A. Sustainable investing in equilibrium. J. Financ. Econ. 2021, 142, 550–571. [Google Scholar] [CrossRef] [Scilit]
  4. Shi, T.F.; Han, F.X.; Chen, L.; Shi, J.; Xiao, H. Study on value Co-creation and evolution game of low-carbon technological innovation ecosystem. J. Clean. Prod. 2023, 414, 137720. [Google Scholar] [CrossRef] [Scilit]
  5. Li, G.Z.; Shi, X.L.; Yang, Y.F.; Lee, P.K.C. Green Co-Creation Strategies among Supply Chain Partners: A Value Co-Creation Perspective. Sustainability 2020, 12, 4305. [Google Scholar] [CrossRef] [Scilit]
  6. Watson, R.; Wilson, H.N.; Smart, P.; Macdonald, E.K. Harnessing Difference: A Capability-Based Framework for Stakeholder Engagement in Environmental Innovation. J. Product Innov. Manag. 2018, 35, 254–279. [Google Scholar] [CrossRef] [Scilit]
  7. Yahya, S.; Khan, A.; Farooq, M.; Irfan, M. Integrating green business strategies and green competencies to enhance green innovation: Evidence from manufacturing firms of Pakistan. Environ. Sci. Pollut. Res. 2022, 29, 39500–39514. [Google Scholar] [CrossRef] [Scilit]
  8. Tian, H.H.; Huang, S.Z.; Cheablam, O. How green value co-creation mediates the relationship between institutional pressure and firm performance: A moderated mediation model. Bus. Strategy Environ. 2023, 32, 3309–3325. [Google Scholar] [CrossRef] [Scilit]
  9. Hsiung, T.-F.; Cheng, Y.-H.; Han, Z.-X. Sustainable Partnership: Operational Condition Analysis for Brand Value Co-Creation. Sustainability 2021, 13, 6516. [Google Scholar] [CrossRef] [Scilit]
  10. Bo, Q.S.; Liu, H.; Zheng, J.W. Research on the Mechanism of the Green Innovation of Enterprises Empowered by Digital Technology from the Perspective of Value Co-Creation. Sustainability 2024, 16, 9065. [Google Scholar] [CrossRef] [Scilit]
  11. Di Vaio, A.; Palladino, R.; Hassan, R.; Escobar, O. Artificial intelligence and business models in the sustainable development goals perspective: A systematic literature review. J. Bus. Res. 2020, 121, 283–314. [Google Scholar] [CrossRef] [Scilit]
  12. Yigitcanlar, T.; Cugurullo, F. The Sustainability of Artificial Intelligence: An Urbanistic Viewpoint from the Lens of Smart and Sustainable Cities. Sustainability 2020, 12, 8548. [Google Scholar] [CrossRef] [Scilit]
  13. Dai, Y.Y.; Huang, Z.W.; Khan, N.; Labbo, M.S. Smart Water Management: Governance Innovation, Technological Integration, and Policy Pathways Toward Economic and Ecological Sustainability. Water 2025, 17, 1932. [Google Scholar] [CrossRef] [Scilit]
  14. Zhao, X.F.; Li, S.J. Artificial intelligence and public environmental concern: Impacts on green innovation transformation in energy-intensive enterprises. Energy Policy 2025, 198, 114469. [Google Scholar] [CrossRef] [Scilit]
  15. Delanöe, P.; Tchuente, D.; Colin, G. Method and evaluations of the effective gain of artificial intelligence models for reducing CO2 emissions. J. Environ. Manag. 2023, 331, 117261. [Google Scholar] [CrossRef] [Scilit] [PubMed]
  16. Du, Z.; Lv, G. Can Digital Finance Unleash the Potential for Household Consumption? A Comparison Based on the Inconsistency Between Income and Consumption Classes. J. Theor. Appl. Electron. Commer. Res. 2025, 20, 275. [Google Scholar] [CrossRef] [Scilit]
  17. Yang, S.; Liu, F. Impact of industrial intelligence on green total factor productivity: The indispensability of the environmental system. Ecol. Econ. 2024, 216, 108021. [Google Scholar] [CrossRef] [Scilit]
  18. Tian, H.; Zhao, L.; Li, Y.; Wang, W. Can enterprise green technology innovation performance achieve “corner overtaking” by using artificial intelligence?-Evidence from Chinese manufacturing enterprises. Technol. Forecast. Soc. Change 2023, 194, 122732. [Google Scholar] [CrossRef] [Scilit]
  19. Zhou, C. The Impact of Artificial Intelligence on the Sustainable Development Performance of Chinese Manufacturing Enterprises. Systems 2025, 13, 496. [Google Scholar] [CrossRef] [Scilit]
  20. Potluka, O.; Harten, S.; Kocks, A.; Dvorak, J. Digitalization in evaluations and evaluations of digitalization: The changing landscape of evaluations. Evaluation 2025, 31, 289–302. [Google Scholar] [CrossRef] [Scilit]
  21. Pudney, S.; Mills, D.; Alaei, A.R.; Sellers, S.; Dvorak, J.; Potluka, O. Evaluation of artificial intelligence-enhanced critical infrastructure systems: A conceptual framework. Evaluation 2025, 31, 412–443. [Google Scholar] [CrossRef] [Scilit]
  22. Kicova, E.; Fabus, J.; Stalmasekova, N.; Kvasnicova-Galovicova, T. Bitcoin, cryptocurrencies and tax evasion: A systematic literature review on global approaches to cryptocurrency taxation and the challenges for harmonising regulatory frameworks. Data Sci. Financ. Econ. 2025, 5, 234–257. [Google Scholar] [CrossRef] [Scilit]
  23. Wang, T.; Li, H.; Accatino, F. A theoretical framework for value co-creation analysis in carbon sink projects. J. Clean. Prod. 2024, 477, 13. [Google Scholar] [CrossRef] [Scilit]
  24. Ren, X.J.; Wang, F. How does the construction of artificial intelligence pilot zones affect enterprises’ green governance performance? Res. Econ. Manag. 2025, 46, 103–125. [Google Scholar] [CrossRef]
  25. Meng, X.; Gong, X. Digital transformation and innovation output of manufacturing companies-An analysis of the mediating role of internal and external transaction costs. PLoS ONE 2024, 19, 22. [Google Scholar] [CrossRef] [Scilit]
  26. Rizzo, S.A. To be Artificial Intelligence for sustainability or not to be sustainable Artificial Intelligence. Renew. Sustain. Energy Rev. 2025, 223, 116063. [Google Scholar] [CrossRef] [Scilit]
  27. Bloom, N.; Schankerman, M.; Van Reenen, J. Identifying Technology Spillovers and Product Market Rivalry. Econometrica 2013, 81, 1347–1393. [Google Scholar] [CrossRef] [Scilit]
  28. Miric, M.; Jia, N.; Huang, K.G. Using supervised machine learning for large-scale classification in management research: The case for identifying artificial intelligence patents. Strateg. Manag. J. 2023, 44, 491–519. [Google Scholar] [CrossRef] [Scilit]
  29. Zhang, Y.R.; Shou, S.T.; Li, Y.H. Do green investments impact corporate green innovation? Empirical evidence from Chinese-listed companies. Front. Environ. Sci. 2024, 12, 1468843. [Google Scholar] [CrossRef] [Scilit]
  30. Pu, Y.; Li, H.; Hou, W.J.; Pan, X. The analysis of strategic management decisions and corporate competitiveness based on artificial intelligence. Sci. Rep. 2025, 15, 17942. [Google Scholar] [CrossRef] [Scilit]
  31. Borah, P.S.; Dogbe, C.S.K.; Dzandu, M.D.; Pomegbe, W.W.K. Forging organizational resilience through green value co-creation: The role of green technology, green operations, and green transaction capabilities. Bus. Strategy Environ. 2023, 32, 5734–5747. [Google Scholar] [CrossRef] [Scilit]
  32. Irvine, P.J.; Park, S.S.; Yildizhan, Ç. Customer-Base Concentration, Profitability, and the Relationship Life Cycle. Account. Rev. 2016, 91, 883–906. [Google Scholar] [CrossRef] [Scilit]
  33. Johnstone, N.; Hascic, I.; Popp, D. Renewable Energy Policies and Technological Innovation: Evidence Based on Patent Counts. Environ. Resour. Econ. 2010, 45, 133–155. [Google Scholar] [CrossRef] [Scilit]
  34. Bendig, D.; Kleine-Stegemann, L.; Schulz, C.; Eckardt, D. The effect of green startup investments on incumbents? green innovation output. J. Clean. Prod. 2022, 376, 134316. [Google Scholar] [CrossRef] [Scilit]
  35. Di, K.X.; Xu, R.H.; Liu, Z.K.; Liu, R. How do enterprises’ green collaborative innovation network locations affect their green total factor productivity? Empirical analysis based on social network analysis. J. Clean. Prod. 2024, 438, 140766. [Google Scholar] [CrossRef] [Scilit]
  36. Feng, S.; Liu, S. Does AI Application Matter in Promoting Carbon Productivity? Fresh Evidence from 30 Provinces in China. Sustainability 2023, 15, 16261. [Google Scholar] [CrossRef] [Scilit]
  37. Wang, B.; Wang, J.D.; Dong, K.Y.; Nepal, R. How does artificial intelligence affect high-quality energy development? Achieving a clean energy transition society. Energy Policy 2024, 186, 114010. [Google Scholar] [CrossRef] [Scilit]
  38. Biggi, G.; Iori, M.; Mazzei, J.; Mina, A. Green intelligence: The AI content of green technologies. Eurasian Bus. Rev. 2025, 15, 803–840. [Google Scholar] [CrossRef] [Scilit]
  39. Yang, Y.; An, R.; Song, J. Impact of enterprise artificial intelligence on social responsibility: Evidence from text analysis. Financ. Res. Lett. 2025, 75, 106868. [Google Scholar] [CrossRef] [Scilit]
  40. Yao, J.; Zhang, K.; Guo, L.; Feng, X. How does artificial intelligence improve enterprise productivity? A perspective based on labor skill structure adjustment. Manag. World 2024, 40, 101–116+133+117–122. [Google Scholar] [CrossRef]
  41. Yang, G.L.; Yang, G.H.; Yang, W.P. The impact of AI on enterprise energy management: From the perspective of carbon emissions. Sci. Technol. Energy Transit. 2025, 80, 8. [Google Scholar] [CrossRef] [Scilit]
  42. Yilmaz, S.; Toklu, S. A deep learning analysis on question classification task using Word2vec representations. Neural Comput. Appl. 2020, 32, 2909–2928. [Google Scholar] [CrossRef] [Scilit]
  43. Jaffe, A.B.; De Rassenfosse, G. Patent citation data in social science research: Overview and best practices. J. Assoc. Inf. Sci. Technol. 2017, 68, 1360–1374. [Google Scholar] [CrossRef] [Scilit]
  44. Coomes, O.T.; Barham, B.L.; Macdonald, G.K.; Ramankutty, N.; Chavas, J.-P. Leveraging total factor productivity growth for sustainable and resilient farming. Nat. Sustain. 2019, 2, 22–28. [Google Scholar] [CrossRef] [Scilit]
  45. Xu, K.; Geng, C.X.; Wei, X.S.; Jiang, H. Financing Development, Financing Constraint and R&D Investment of Strategic Emerging Industries in China. J. Bus. Econ. Manag. 2020, 21, 1010–1034. [Google Scholar] [CrossRef] [Scilit]
  46. Jiang, Z.E.; Huang, F.; Wu, Q. The Impact of AI on Corporate Green Transformation: Empirical Evidence from China. Sustainability 2025, 17, 7782. [Google Scholar] [CrossRef] [Scilit]
  47. Cheng, H.F.; Li, Y.X.; Pang, Y.L.; Zhao, J.; Fu, K. Can digital transformation change a firm’s green innovation strategy? Evidence from China’s heavily polluting industries. Heliyon 2024, 10, e24676. [Google Scholar] [CrossRef] [Scilit]
  48. Tingley, D.; Yamamoto, T.; Hirose, K.; Keele, L.; Imai, K. Mediation: R Package for Causal Mediation Analysis. J. Stat. Softw. 2014, 59, 1–38. [Google Scholar] [CrossRef] [Scilit]
  49. Imai, K.; Keele, L.; Tingley, D. A General Approach to Causal Mediation Analysis. Psychol. Methods 2010, 15, 309–334. [Google Scholar] [CrossRef] [Scilit]
  50. Poltronieri, C.F.; Ganga, G.M.D.; Gerolamo, M.C. Maturity in management system integration and its relationship with sustainable performance. J. Clean. Prod. 2019, 207, 236–247. [Google Scholar] [CrossRef] [Scilit]
  51. Del Vecchio, P.; Massaro, A.; Garzoni, A. Circular value creation and business process management for twin transition: The case of an energy company. Comput. Ind. Eng. 2025, 201, 110936. [Google Scholar] [CrossRef] [Scilit]
  52. Staab, P.; Sorg, C. The rise of digital eco-technocracy: Ecological crisis, digital innovation and legitimacy in the adaptive society. Eur. J. Soc. Theory 2025, 28, 605–624. [Google Scholar] [CrossRef] [Scilit]
  53. Böttcher, T.P.; Empelmann, S.; Weking, J.; Hein, A.; Krcmar, H. Digital sustainable business models: Using digital technology to integrate ecological sustainability into the core of business models. Inf. Syst. J. 2024, 34, 736–761. [Google Scholar] [CrossRef] [Scilit]
  54. Tomas, G.C.; Jose-Antonio, C.A.; Julennys-Carolina, C.M.; Alejandro, D.P. Linking environmental sustainability, digital transformation, and innovation: Evidence from micro-enterprises and SMEs. J. Innov. Knowl. 2025, 10, 100849. [Google Scholar] [CrossRef] [Scilit]
  55. Demirel, P.; Kesidou, E.; Danisman, G.O. IT-Enabled Organisational Transformation and Green Employment Growth in Microfirms. Bus. Strategy Environ. 2025, 34, 5031–5058. [Google Scholar] [CrossRef] [Scilit]
  56. Margherita, A.; Espindola, A.; Freire, P.D. Digital Transformation and Green Operations: A Successful Entrepreneurial Journey at Portobello Shop. IEEE Trans. Eng. Manag. 2024, 71, 11786–11795. [Google Scholar] [CrossRef] [Scilit]
  57. Sun, Y.; Pongsakornrungsilp, S.; Pongsakornrungsilp, P.; Tonsakunthaweeteam, S.; Wongwaropakorn, W.; Chinchanachokchai, S. Platform AI Resources and Green Value Co-Creation: Paving the Way for Sustainable Firm Performance in the Digital Age. Sustainability 2025, 17, 8058. [Google Scholar] [CrossRef] [Scilit]
Figure 1. Logical Framework Diagram.
Sustainability 18 00698 g001
Table 1. Variable Definitions.
Variable TypeVariable SymbolVariable NameVariable Description
Dependent VariableGVCGreen Value Co-creationLn(number of joint green patent applications + 1)
Explanatory VariableAIArtificial IntelligenceLn(total word frequency + 1)
Mediating VariablesTSTechnology SpilloverNumber of citations of enterprise patents
TFP_OPTotal Factor ProductivityOlley-Pakes (OP) method
Moderating VariablesKZFinancing ConstraintsKZ index
CMICorporate InfluenceLn(Enterprise’s annual main business income/Total main business income of the industry in the same year)
Control VariablesSIZETotal AssetsLn(total assets in the current year)
ROAReturn on Total AssetsNet profit/average balance of total assets
INDEPProportion of Independent DirectorsNumber of independent directors/total number of directors
TOPOwnership ConcentrationShareholding quantity of the top 5
shareholders/total share capital
MEORManagement Shareholding RatioShareholding quantity of directors, supervisors and senior management/total share capital
TOBINQTobin’s Q(Circulating market value + non-circulating shares × net asset per share + book value of liabilities)/total assets
STAFFEnterprise ScaleTotal number of employees
Table 2. Descriptive Statistical Analysis.
VariableObsMeanStd. Dev.MinMax
AI21,2854.9990.7843.2587.052
GVC21,2850.1350.46302.708
SIZE21,28522.1171.15720.0425.726
ROA21,2850.0450.07−0.2430.235
INDEP21,2850.3790.0540.3330.571
TOP21,2850.5330.1480.2030.864
TOBINQ21,2852.1221.3310.8658.632
MEOR21,2850.1790.2100.71
STAFF21,2857.631.1435.1710.792
Table 3. Baseline Regression Tests.
(1)(2)(3)(4)
GVCGVCGVCGVC
AI0.039 ***0.074 ***0.055 ***0.024 ***
(4.802)(18.723)(7.704)(2.919)
SIZE 0.109 ***0.056 ***0.027 ***
(22.196)(5.935)(2.644)
ROA 0.043−0.0260.015
(0.935)(−0.605)(0.338)
INDEP 0.150 ***0.0370.001
(2.645)(0.504)(0.012)
TOP −0.0240.0430.146 ***
(−1.124)(1.019)(3.249)
TOBINQ 0.0030.006 **0.007 ***
(1.087)(2.321)(2.651)
MEOR −0.046 ***0.0340.079 **
(−2.804)(0.992)(2.303)
STAFF −0.008 *−0.0040.016
(−1.677)(−0.400)(1.509)
_cons−0.058−2.635 ***−1.401 ***−0.812 ***
(−1.441)(−30.144)(−8.485)(−4.415)
IDYESNOYESYES
YearYESNONOYES
N21,28521,28521,28521,285
R20.6540.0970.6540.655
F23.063287.11131.8859.007
*** p < 0.01, ** p < 0.05, * p < 0.10.
Table 4. Robustness Tests.
(1)(2)(3)(4)(5)(6)(7)(8)
GVCGVCF.GVCF2.GVCGVCGVCGVCGVC
DT0.039 ***0.029 ***
(5.386)(3.914)
AI 0.044 ***0.026 **
(4.798)(2.431)
L.AI 0.032 ***
(3.429)
L2.AI 0.026 **
(2.482)
AIAV 0.109 ***0.120 ***
(9.708)(7.272)
SIZE 0.027 *** 0.0210.037 ***0.038 ***0.037 ***0.119 ***
(2.699) (1.516)(2.986)(2.652)(3.743)(23.825)
ROA 0.014 0.142 **−0.029−0.064−0.0000.029
(0.332) (2.536)(−0.582)(−1.168)(−0.009)(0.615)
INDEP 0.001 −0.023−0.015−0.0150.0020.154 ***
(0.015) (−0.245)(−0.180)(−0.160)(0.022)(2.694)
TOP 0.147 *** 0.0620.180 ***0.194 ***0.130 ***−0.036 *
(3.279) (1.007)(3.405)(3.171)(2.967)(−1.655)
TOBINQ 0.007 *** 0.010 ***0.006 *0.0050.007 ***0.001
(2.641) (3.219)(1.662)(1.175)(2.729)(0.240)
MEOR 0.076 ** 0.092 *0.0630.0240.076 **−0.021
(2.207) (1.885)(1.511)(0.476)(2.200)(−1.277)
STAFF 0.015 0.0030.0110.0140.014−0.007
(1.471) (0.191)(0.917)(0.956)(1.405)(−1.527)
_cons−0.025−0.814 ***−0.072−0.514 **−1.026 ***−1.034 ***−1.442 ***−3.081 ***
(−0.836)(−4.429)(−1.591)(−2.072)(−4.608)(−3.913)(−8.911)(−25.940)
IDYESYESYESYESYESYESYESNO
YearYESYESYESYESYESYESNOYES
N212,8521,28517,68514,56217,68514,56221,28521,285
R20.6550.6550.6820.7120.6830.7120.6550.085
F29.0049.86023.0205.0468.0605.45936.295242.906
*** p < 0.01, ** p < 0.05, * p < 0.10.
Table 5. Substitution of the test model.
(1)(3)
GVCGVC
AI0.593 ***0.619 ***
(21.001)(20.269)
SIZE0.598 ***0.609 ***
(18.274)(18.017)
ROA0.983 ***1.053 ***
(2.644)(2.645)
INDEP0.4100.551
(1.045)(1.260)
TOP−0.554 ***−0.576 ***
(−3.740)(−3.628)
TOBINQ−0.080 ***−0.065 ***
(−3.503)(−2.844)
MEOR−0.665 ***−0.661 ***
(−4.476)(−4.353)
STAFF−0.074 **−0.071 **
(−2.194)(−1.991)
_cons−17.717 ***−18.206 ***
(−32.380)(−31.654)
lnalpha 0.631 ***
(9.485)
N21,28521,285
*** p < 0.01, ** p < 0.05.
Table 6. Mediating Mechanism Tests.
(1)(2)(3)(4)
TSGVCTFP_OPGVC
AI2.513 ***0.023 ***0.152 ***0.023 ***
(3.888)(2.812)(19.977)(2.793)
TS 0.001 ***
(7.475)
TFP_OP 0.037 ***
(3.758)
SIZE 0.024 ** 0.008
(2.375) (0.655)
ROA 0.019 −0.053
(0.438) (−1.120)
INDEP −0.003 0.000
(−0.047) (0.002)
TOP 0.155 *** 0.147 ***
(3.458) (3.286)
TOBINQ 0.006 ** 0.007 **
(2.251) (2.458)
MEOR 0.076 ** 0.078 **
(2.215) (2.256)
STAFF 0.015 0.023 **
(1.429) (2.206)
_cons10.347 ***−0.756 ***6.005 ***−0.678 ***
(3.198)(−4.115)(158.091)(−3.619)
IDYESYESYESYES
YearYESYESYESYES
N21,28521,28521,28521,285
R20.9000.6560.8870.656
F15.11814.240399.0889.581
*** p < 0.01, ** p < 0.05.
Table 7. Moderating Effect Tests.
(1)(2)(3)(4)
GVCGVCGVCGVC
AI0.039 ***0.048 ***0.030 ***0.051 ***
(4.806)(4.241)(3.670)(5.488)
kz0.0050.238 ***
(0.342)(3.244)
AI × kz −0.046 ***
(−3.116)
CMI 0.026 ***−0.094 ***
(5.346)(−5.482)
AI × CMI 0.023 ***
(6.964)
SIZE 0.029 *** 0.015
(2.811) (1.384)
ROA 0.005 −0.022
(0.114) (−0.498)
INDEP 0.000 −0.006
(0.006) (−0.086)
TOP 0.135 *** 0.111 **
(3.002) (2.469)
TOBINQ 0.007 *** 0.006 **
(2.733) (2.153)
MEOR 0.073 ** 0.056
(2.122) (1.626)
STAFF 0.016 0.012
(1.511) (1.166)
_cons−0.060−0.969 ***0.021−0.590 ***
(−1.479)(−5.079)(0.491)(−2.811)
IDYESYESYESYES
YearYESYESYESYES
N21,28521,28521,28521,285
R20.6540.6560.6550.656
F11.5898.27525.84012.907
*** p < 0.01, ** p < 0.05.
Table 8. Heterogeneity Tests.
(1)(2)(3)(4)(5)(6)
GVCGVCGVCGVCGVCGVC
AI0.031 **0.0080.076 ***0.0140.032 **0.019 **
(1.978)(0.727)(3.220)(1.638)(1.961)(1.978)
SIZE0.0240.036 ***0.0140.030 ***0.0280.030 **
(1.151)(2.852)(0.492)(2.798)(1.392)(2.476)
ROA0.043−0.0350.133−0.027−0.0070.009
(0.521)(−0.649)(1.029)(−0.605)(−0.081)(0.177)
INDEP−0.2020.072−0.1260.096−0.0480.015
(−1.537)(0.764)(−0.733)(1.179)(−0.328)(0.176)
TOP0.0970.127 **−0.1770.148 ***0.156 *0.132 **
(1.130)(2.228)(−1.466)(2.966)(1.929)(2.392)
TOBINQ0.0020.009 ***0.0120.005*0.018 ***0.004
(0.467)(2.638)(1.590)(1.830)(3.039)(1.390)
MEOR0.0040.105 **0.1540.0200.0810.075 *
(0.068)(2.271)(0.504)(0.595)(1.104)(1.905)
STAFF−0.0040.0160.0410.018 *0.0190.014
(−0.191)(1.233)(1.379)(1.669)(0.911)(1.133)
_cons−0.515−0.956 ***−0.714−0.884 ***−0.898 **−0.836 ***
(−1.370)(−4.114)(−1.370)(−4.520)(−2.544)(−3.757)
IDYESYESYESYESYESYES
YearYESYESYESYESYESYES
N764613639470116584569415591
R20.7240.6840.6700.6610.6000.673
F1.6345.5383.0436.3883.7635.366
*** p < 0.01, ** p < 0.05, * p < 0.10.
Disclaimer/Publisher’s Note: The statements, opinions and data contained in all publications are solely those of the individual author(s) and contributor(s) and not of MDPI and/or the editor(s). MDPI and/or the editor(s) disclaim responsibility for any injury to people or property resulting from any ideas, methods, instructions or products referred to in the content.