Article

Green Consumption Orientation and Purchase Intentions Toward Other Ethical Products: The Mediating Roles of Warm Glow and Moral Self-Regulation


by
Xiaolin Gan
,
Xincan Qiu
and
Jing Zhang
*
College of Business Administration, Kookmin University, 77 Jeongneung-ro, Seongbuk-gu, Seoul 02707, Republic of Korea
*
Author to whom correspondence should be addressed.
Sustainability 2026, 18(17), 9161; https://doi.org/10.3390/su18179161
Submission received: 7 August 2026 / Revised: 2 September 2026 / Accepted: 3 September 2026 / Published: 7 September 2026
(This article belongs to the Section Economic and Business Aspects of Sustainability)

Abstract

An important question in sustainable consumption research is whether consumers’ green consumption orientation (GCO) extends beyond environmentally focused choices and relates to their willingness to purchase other types of ethical products, including those associated with fair trade, labor rights, animal welfare, and corporate social responsibility. Drawing on research on cross-domain ethical consumption and moral self-regulation, this study examines a cross-sectional associative model in which GCO is linked to purchase intentions toward other ethical products through three psychological mechanisms: warm glow, compensatory moral licensing (MLP-C), and identity-consistency mechanism (ICM). The moderating role of personal moral identity (PMI) is also considered. Data from 598 consumer questionnaires indicated a positive association between GCO and purchase intentions toward other ethical products. Warm glow and ICM were associated with positive indirect effects, whereas MLP-C was associated with a negative indirect effect. PMI further altered these relationships by weakening the association between GCO and MLP-C while strengthening the association between GCO and ICM. The robustness of the ICM pathway was further examined through an item-deletion sensitivity analysis, which continued to support the indirect association after two intention-like items were removed. In addition, an exploratory latent profile analysis identified four consumer profiles within the sample, which are interpreted as hypothesis-generating rather than confirmatory. Taken together, the results suggest that cross-domain ethical consumption intentions may reflect the joint influence of emotional rewards and competing forms of moral self-regulation. Given the cross-sectional and self-reported nature of the data, the findings should be interpreted as cross-domain associations between consumption orientation and purchase intentions rather than as evidence of behavioral spillover or causal effects across consumption domains.

1. Introduction

In recent years, increasingly visible environmental pressures, ranging from climate change and resource scarcity to extreme weather and plastic pollution, have moved sustainable consumption beyond the realm of public policy and made it an important issue in consumer behavior and marketing research [1,2]. Firms have responded by incorporating sustainability more deeply into branding, product development, and marketing communication, while also relying on practices such as green marketing, eco-labeling, and sustainability-oriented consumption initiatives to influence consumer choices [1,3]. Within this broader shift, green consumption orientation (GCO) has received considerable scholarly attention. Green consumption is commonly understood as the voluntary consideration of environmental consequences when consumers choose, purchase, and use products or services, often reflected in preferences for options such as low-carbon goods, sustainable packaging, organic food, energy-efficient products, and sustainable fashion [4,5]. In the present study, however, GCO does not refer to a specific green purchase observed at a particular point in time. Instead, it captures a self-reported and relatively general tendency to take environmental consequences, resource conservation, and product-related environmental attributes into account in everyday consumption decisions. This view is consistent with prior research that conceptualizes green consumption values as a broader tendency to express environmental protection concerns through purchasing and consumption activities [6]. A substantial body of research has already examined why consumers differ in their level of green consumption, with explanations spanning demographic characteristics, situational conditions, and psychological factors. Gender, age, and education have been linked to variation in environmentally oriented consumption [7,8], while price, eco-labels, government support, and green advertising may shape the decision context in which green choices are made [9,10]. At the psychological level, environmental knowledge and concern, attitudes, personal values, social and moral norms, green trust, and perceived behavioral control have also been identified as relevant factors [1,5,11,12,13,14]. This literature has provided a relatively detailed account of the antecedents of GCO, yet considerably less is known about whether an environmentally oriented consumption tendency is also associated with ethical purchase intentions in domains that are not primarily environmental. The widely discussed attitude–behavior gap shows that favorable environmental attitudes and intentions do not necessarily translate uniformly into corresponding behavior [1,15,16]. The question addressed here, however, is different. Rather than asking whether environmental intentions are converted into environmental behavior, this study examines whether GCO is associated with purchase intentions in other ethical domains and which psychological processes may help explain these cross-domain relationships.
This research question is theoretically important because green consumption and other forms of ethical consumption represent related but non-equivalent domains. Green consumption is primarily concerned with environmental protection, resource conservation, and ecological consequences, whereas other forms of ethical consumption, including fair-trade, labor-rights, animal-welfare, and corporate social responsibility products, involve different moral concerns and may benefit different groups. Their inclusion under the broader category of ethical consumption therefore does not mean that consumers will necessarily show the same preferences across these domains. Nevertheless, some common psychological foundations may connect them. Previous studies have associated green consumption with ethical beliefs, environmental ethics, and perceived moral obligation [17], while ethical values and socially oriented motivations have also been linked to preferences for cruelty-free products [18]. Such evidence points to a possible higher-order basis involving responsibility, moral concern, and consideration for the welfare of others, even when the specific ethical issue differs across consumption contexts. On this basis, the present study does not assume that green consumption and other ethical consumption choices are interchangeable or that preferences automatically carry over from one domain to another. Instead, it examines whether GCO is systematically associated with purchase intentions toward other ethical products and explores the psychological processes through which this cross-domain association may arise.
Behavioral spillover theory provides a useful basis for considering how behavior in one context may be linked to behavior in another [19]. Within the pro-environmental literature, spillover is not assumed to operate in a single direction. Responsible action may strengthen moral self-perceptions and encourage consistency across later choices, but it may also generate a sense of moral progress or fulfilled responsibility that weakens motivation for additional moral action [20,21,22]. Meta-analytic evidence likewise suggests that pro-environmental spillover effects are generally modest and depend on the type of behavior, the surrounding context, and the psychological processes involved [21]. Research on moral self-regulation offers a related explanation for these divergent outcomes. Whether prior moral conduct is followed by consistency or licensing depends in part on how individuals interpret what that conduct means for their moral self-concept and perceived progress [23,24]. If responsible conduct is understood as evidence of a stable identity or an ongoing commitment, subsequent consistency may become more likely. By contrast, if it is interpreted as sufficient moral progress or as having already fulfilled part of one’s moral responsibility, licensing or compensatory responses may become more salient [23,24]. These competing pathways provide a useful basis for considering why GCO may be associated with ethical consumption intentions across domains, without presuming that the relationship is necessarily positive. At the same time, the present study does not test behavioral spillover in its strict temporal sense. Spillover conventionally refers to prior behavior in one domain affecting subsequent behavior in another [19,20,21,22], whereas the empirical analysis relies on cross-sectional self-reported data. GCO reflects a general consumption orientation rather than objectively observed prior green behavior, and the dependent variable captures purchase intentions toward other ethical products rather than later observed purchases. The empirical relationships examined here are therefore described as cross-domain ethical consumption associations rather than as behavioral spillover or causal effects.
Research in moral psychology and consumer behavior suggests that cross-domain ethical consumption may be shaped by several distinct processes, including emotional reward, moral accounting, self-perception, and identity-based motivation [23,24,25,26,27,28,29,30,31]. Building on this literature, the present study distinguishes three pathways through which GCO may be associated with purchase intentions toward other ethical products: warm glow as an emotional-reward pathway, compensatory moral licensing (MLP-C) as a responsibility-completion pathway, and the identity-consistency mechanism (ICM) as an identity-based pathway. Warm glow refers to the positive affective rewards that can accompany responsible or prosocial conduct [25,26,27]. MLP-C and ICM, by contrast, capture two different ways in which consumers may interpret the moral meaning of their responsible consumption orientation. MLP-C reflects a sense that sufficient moral progress has already been made or that part of one’s responsibility has been fulfilled, whereas ICM reflects the extent to which responsible consumption becomes incorporated into the self-concept and motivates choices that remain consistent with that identity [23,24,28,29,30,31]. The three mechanisms therefore should not be viewed as interchangeable expressions of a single underlying process. Rather, they represent emotional reward, perceived responsibility completion, and identity consistency as theoretically distinct routes through which GCO may relate to ethical consumption intentions beyond the environmental domain. They are consequently modeled as parallel mechanisms rather than as stages in a fixed psychological sequence. Although it is conceivable that warm glow may arise before subsequent moral or identity-based interpretations, the cross-sectional design does not allow the temporal ordering of these processes to be established. A sequential mediation model would therefore impose a psychological sequence that cannot be supported by the present data.
Moral self-regulation offers a useful explanation for why these cross-domain associations may unfold in different directions. Moral licensing theory proposes that prior moral conduct can be interpreted as evidence of accumulated moral credentials or sufficient moral progress, which may reduce the perceived need to make additional moral efforts [24,28]. Yet moral behavior does not inevitably lead to licensing. When individuals interpret such behavior as part of who they are, it may instead strengthen the moral self and encourage choices that are consistent with that self-concept [23,24]. In the present context, GCO may therefore be associated with two contrasting forms of self-regulation. Some consumers may view their environmentally responsible consumption orientation as evidence that they have already fulfilled part of their moral responsibility, which corresponds to MLP-C. Others may interpret the same orientation as reflecting the kind of responsible person they believe themselves to be, thereby reinforcing ICM. The key distinction, then, is not whether GCO is intrinsically “positive” or “negative,” but how consumers interpret its moral significance.
Existing studies have typically considered emotional reward, moral licensing, and identity-based consistency within separate theoretical traditions, with comparatively little effort to examine how these mechanisms may operate alongside one another in cross-domain ethical consumption. Keeping these processes conceptually distinct is important because they begin from different psychological conditions and imply different self-regulatory outcomes. MLP-C, for example, should not be conflated with moral cleansing. MLP-C arises when consumers perceive that they have already made sufficient moral progress or fulfilled part of their responsibility, potentially reducing the felt need for further moral effort [24,28,32]. Moral cleansing follows a different logic: it is generally triggered by moral failure or a threat to the moral self and motivates compensatory behavior intended to restore moral self-regard [33,34]. ICM, in turn, is more closely related to moral consistency, self-perception, and identity-based motivation. From these perspectives, individuals draw inferences about who they are from their own responsible tendencies and are motivated to make subsequent choices that fit that self-understanding [23,29,30,31,35,36,37]. ICM also differs from identity signaling and broader identity-based consumer behavior [38,39]. Those approaches are mainly concerned with the identity meanings expressed, communicated, or enacted through consumption, whereas the present analysis focuses on an internal self-regulatory process: consumers may interpret GCO as information about their own identity and, on that basis, show greater consistency across ethical consumption domains. Bringing these distinctions together with warm glow makes it possible to examine emotional reward, perceived responsibility completion, and identity consistency as separate but potentially concurrent pathways, rather than attributing cross-domain ethical consumption to a single underlying mechanism.
Individual values and the surrounding social context may also influence consumers’ intentions to purchase other ethical products. Altruistic value orientation and social norms are therefore included as control variables, given the established role of personal values, social influence, and normative pressure in shaping sustainable consumption [1]. Within this framework, the study pursues three objectives: first, to examine the association between GCO and PIEP; second, to assess whether WG, MLP-C, and ICM operate as parallel pathways underlying this association; and third, to determine whether PMI moderates the GCO–MLP-C and GCO–ICM relationships.
This article makes three main contributions. First, it broadens green consumption research beyond environmentally focused choices by examining whether GCO is associated with purchase intentions toward ethical products that involve different moral concerns, including fair trade, labor rights, animal welfare, and corporate social responsibility [17,18]. Second, it integrates warm glow, compensatory moral licensing, and identity consistency within a single analytical framework, making it possible to compare positive and negative self-regulatory associations rather than examining them in isolation. Third, by distinguishing ICM from compensatory licensing and treating PMI as a boundary condition, the study sharpens an important conceptual distinction in moral self-regulation. Consumers may interpret GCO as evidence that part of their moral responsibility has already been fulfilled, or they may treat it as identity-relevant information that encourages continued consistency across ethical consumption domains [23,24,29,30,31,39]. In addition to these substantive contributions, the item-deletion sensitivity analysis provides a methodological robustness check on the potential overlap between ICM and PIEP. As a supplementary exploratory analysis, the study also uses LPA to examine whether distinct psychological and normative profiles emerge within the sample. The resulting profiles are treated as hypothesis-generating patterns of consumer heterogeneity rather than as a confirmatory typology.

2. Literature Review and Hypotheses Development

2.1. Green Consumption Orientation and Cross-Domain Ethical Consumption

Green consumption is a central component of sustainable consumption and generally refers to the extent to which consumers take environmental consequences into account when making consumption decisions [1,4]. In this study, this broader self-reported tendency is conceptualized as green consumption orientation (GCO), rather than as a specific or objectively observed green purchase. Environmental responsibility, however, captures only one part of the wider ethical consumption landscape. Consumers may also consider issues related to fair trade, labor rights, animal welfare, cruelty-free production, and corporate social responsibility (CSR), each of which involves a different ethical concern or stakeholder group. Green consumption is mainly concerned with environmental protection and resource-related consequences; fair-trade and labor-rights consumption places greater emphasis on the welfare of producers and workers; animal-welfare and cruelty-free consumption centers on the treatment of nonhuman animals; and CSR-related consumption reflects firms’ responsibilities toward a broader set of stakeholders. These categories may all fall within the general domain of ethical consumption, but this shared classification does not mean that they are psychologically interchangeable. A stronger orientation toward environmental responsibility, therefore, cannot simply be assumed to correspond with stronger purchase intentions across other ethical domains.
Although these forms of ethical consumption differ in their specific objects of concern, they may still be connected by broader psychological foundations. Previous research has linked green consumption orientation to ethical beliefs, environmental ethics, and perceived moral obligation [17], while ethical values and socially oriented motivations have also been associated with preferences for animal-welfare and cruelty-free products [18]. At a more general level, concerns about fairness, responsibility, the welfare of others, and adherence to moral standards may extend across individual consumption domains and provide a common basis for otherwise distinct ethical choices. The rationale for expecting a cross-domain association, therefore, is not that green products and other ethical products are interchangeable, but that they may partly reflect shared higher-order ethical orientations [17,18]. Even so, such common foundations do not imply automatic consistency across domains. Ethical choices differ in their focal beneficiaries, perceived costs, prevailing social norms, level of consumer involvement, and other contextual demands. A consumer who places strong emphasis on environmental responsibility may therefore respond quite differently when confronted with issues involving fair trade, labor rights, animal welfare, or CSR. For this reason, whether GCO is associated with purchase intentions toward other ethical products is best treated as an empirical question rather than assumed from their common inclusion within the broader category of ethical consumption.
Research on behavioral spillover provides useful background for considering how responses in one consumption domain may relate to those in another without assuming that such relationships occur automatically. Research on pro-environmental spillover indicates that behavioral tendencies and psychological states developed in one context can be related to responses in another, although both the direction and strength of these relationships vary across behaviors, situational conditions, and underlying psychological mechanisms [19,21,22,40]. Such variability is particularly relevant to the present study because the ethical domains under consideration involve different focal concerns and decision contexts. This literature therefore helps motivate the possibility of cross-domain ethical consumption associations, while the present study specifically examines whether GCO is associated with purchase intentions in other ethical consumption domains. In this study, GCO is treated as a self-reported consumption orientation rather than as an objectively observed behavior occurring at a specific point in time. The measure reflects consumers’ general tendency to consider environmental consequences, resource conservation, and product-related environmental attributes when making consumption decisions, but it does not establish that a particular green purchase preceded later ethical consumption. The relationships examined here are therefore interpreted as cross-domain ethical consumption associations rather than as evidence of temporally ordered or causal behavioral spillover.
Research on pro-environmental self-identity further supports the possibility that consumers may show some degree of consistency across consumption contexts. Individuals with a stronger pro-environmental self-identity tend to behave more consistently across different types of environmentally responsible actions, and prior pro-environmental behavior may also contribute to the development or reinforcement of that identity [35,36,37]. Even so, this evidence largely concerns consistency within the environmental domain. It therefore does not demonstrate that the same pattern will necessarily extend to ethically distinct areas such as fair trade, labor rights, animal welfare, or CSR. These studies are better viewed as establishing the theoretical plausibility of identity-based consistency than as providing direct evidence for the cross-domain association examined in the present study.
Taken together, the existing literature points to two competing considerations regarding the relationship between GCO and purchase intentions toward other ethical products. On the one hand, green consumption and other forms of ethical consumption may be partly rooted in broader psychological orientations involving ethical concern, responsibility, and sensitivity to the wider consequences of consumption [17,18]. Identity-related processes also provide a plausible basis for consistency across different consumption choices [35,36,37]. On the other hand, environmental protection, fair trade, labor rights, animal welfare, and CSR concern different ethical objects and operate under different contextual demands, so consistency across these domains should not be taken for granted. The expected positive relationship between GCO and purchase intentions toward other ethical products is therefore based not on the assumption that these forms of consumption are equivalent, but on the possibility that they are partially connected through shared higher-order ethical orientations and identity-consistency processes. This reasoning leads to the following hypothesis:
H1: 
GCO has a positive association with PIEP.

2.2. Warm Glow: The Emotional-Reward Pathway

Andreoni [25] introduced warm glow to describe the intrinsic emotional reward individuals may derive from contributing to prosocial outcomes. Unlike explanations based solely on the benefits delivered to others, warm glow emphasizes the positive affect associated with perceiving oneself as engaging in a desirable or responsible action. In sustainable consumption contexts, environmentally responsible choices may therefore provide consumers not only with functional or environmental benefits but also with positive emotional experiences such as satisfaction, pride, and a sense of having acted responsibly [26,27,41]. Importantly, such emotional rewards are not necessarily tied to the specific environmental attributes of a particular product; they may arise from consumers’ positive evaluation of the moral meaning of their own responsible choices. This distinction provides a theoretical basis for considering warm glow as a potential cross-domain mechanism: when GCO is associated with positive feelings derived from “doing the right thing,” these emotional rewards may also be associated with greater willingness to make responsible choices in other ethical domains, including fair trade, labor rights, animal welfare, and CSR-related consumption.
Existing research consistently shows that warm glow is associated with environmentally responsible consumption. Across pro-environmental behavior, green consumption, and voluntary sustainability initiatives, warm glow has been identified as a positive affective reward associated with responsible action, consumer satisfaction, and stronger pro-environmental intentions [26,27,42,43]. Taken together, these findings suggest that warm glow reflects not only responses to specific environmental product attributes but also the positive emotional meaning consumers attach to acting responsibly. This distinction matters here because an emotional reward grounded in the perceived moral meaning of responsible consumption may be relevant beyond the environmental domain. However, existing evidence has largely examined warm glow within environmental or sustainability-related contexts and does not establish that this emotional mechanism necessarily extends to distinct ethical domains such as fair trade, labor rights, animal welfare, or CSR-related consumption. Accordingly, whether warm glow constitutes an emotional-reward pathway linking GCO with purchase intentions toward other ethical products remains an empirical question.
Based on the preceding reasoning, consumers with stronger GCO may experience stronger warm glow associated with responsible consumption, and this positive emotional reward may, in turn, be associated with greater purchase intentions toward other ethical products. In the parallel-pathway framework, warm glow serves as an emotional-reward mechanism that is conceptually distinct from the responsibility-completion and identity-consistency mechanisms examined subsequently. Accordingly, the following hypotheses are proposed:
H2a: 
GCO has a positive association with WG.
H2b: 
WG has a positive association with PIEP.
H2c: 
WG exhibits a positive indirect association between GCO and PIEP.

2.3. Compensatory Moral Licensing: The Responsibility-Completion Pathway

Unlike warm glow, which centers on the positive emotional reward associated with responsible conduct, moral licensing concerns the way individuals regulate subsequent moral standards after perceiving that they have already established moral credentials or made sufficient moral progress. Moral licensing theory proposes that prior moral conduct can, under certain conditions, create a sense of moral credit that allows individuals to relax later self-regulation or reduce the effort devoted to further moral choices [28,44]. Experimental and meta-analytic evidence suggests that such licensing can occur across behavioral domains and that activated moral self-perceptions may shape subsequent prosocial decisions [32,33]. This pattern, however, should not be reduced to a simple form of “negative spillover.” More precisely, it reflects a particular self-regulatory interpretation in which individuals view earlier responsible conduct as evidence that they have already accumulated sufficient moral credit or fulfilled part of their moral responsibility [23,24,28,32]. In the present study, this interpretation is conceptualized as Compensatory Moral Licensing (MLP-C). MLP-C therefore captures a responsibility-completion pathway in which consumers may feel that they have already “done enough,” thereby reducing the perceived need to sustain the same level of moral effort across subsequent ethical consumption choices.
MLP-C also needs to be distinguished from moral cleansing, even though both are concerned with regulation of the moral self. The two processes begin from different psychological conditions and lead to opposite regulatory responses. MLP-C emerges when individuals believe that they have already made sufficient moral progress or established adequate moral credentials, which can reduce the perceived need for additional moral effort [24,28,32]. Moral cleansing follows a different pattern. It is typically triggered by moral failure or a threat to one’s moral self-image and motivates compensatory action intended to restore a more positive view of the self [34,45]. In this sense, MLP-C involves a reduction in subsequent moral effort after perceived moral progress, whereas moral cleansing involves greater moral effort in response to perceived moral deficiency. Because the present study is concerned with whether GCO may be associated with a sense that part of one’s moral responsibility has already been fulfilled, rather than with attempts to repair a threatened moral self, MLP-C offers the more appropriate theoretical explanation for the responsibility-completion pathway.
In the context of green consumption, MLP-C should not be understood as implying that GCO is inherently linked to undesirable ethical outcomes. Rather, it captures the possibility that some consumers interpret their environmentally responsible consumption orientation as evidence that they have already made meaningful moral progress, which may reduce the perceived need to uphold equally demanding ethical standards in other consumption domains. Mazar and Zhong [46], for example, showed that green purchasing does not necessarily lead to more moral behavior afterward, suggesting that environmentally responsible consumption cannot be assumed to produce consistent moral conduct across subsequent choices. At the same time, this finding does not mean that green consumption inevitably gives rise to moral licensing. Whether licensing occurs depends on the meaning individuals assign to their prior responsible conduct and, in particular, whether they view it as sufficient evidence of moral progress or fulfilled responsibility [23,24,28,32]. From this perspective, stronger GCO may be associated with stronger MLP-C when consumers interpret their environmentally responsible orientation as indicating that they have already fulfilled part of their moral obligations. Higher MLP-C, in turn, may correspond with weaker purchase intentions toward other ethical products. The proposed pathway therefore concerns a responsibility-completion interpretation associated with GCO, rather than a negative consequence that is intrinsic to green consumption itself.
Accordingly, MLP-C is conceptualized as a potential responsibility-completion pathway through which GCO may be associated with purchase intentions toward other ethical products. Because the data are cross-sectional, however, this indirect pathway should not be interpreted as a temporally ordered causal process. Rather, it represents a theoretically grounded pattern of statistical associations that is consistent with the proposed self-regulatory mechanism. On this basis, the following hypotheses are proposed:
H3a: 
GCO has a positive association with MLP-C.
H3b: 
MLP-C has a negative association with PIEP.
H3c: 
MLP-C exhibits a negative indirect association between green consumption orientation and consumers’ purchase intentions toward other ethical products.

2.4. Identity-Consistency Mechanism: The Identity-Consistency Pathway

Moral self-regulation does not inevitably lead to licensing. The same responsible conduct may instead be associated with greater consistency when individuals interpret it as reflecting a broader and relatively stable moral self [30]. Conway and Peetz [23] showed that subsequent compensatory or consistent responses depend partly on how people construe the meaning of their prior moral behavior. More abstract, higher-level interpretations are more likely to connect that behavior to the self and, in turn, support consistency. Cornelissen et al. [47] similarly found that different ethical mindsets can generate distinct patterns of moral regulation, including both balancing and consistency. These findings suggest that licensing and consistency are better understood not simply as opposite behavioral outcomes, but as competing interpretations of what responsible conduct signifies for the moral self. This distinction provides the theoretical basis for examining an identity-consistency pathway alongside MLP-C.
Within the pro-environmental domain, identity-based research provides further support for the consistency pathway. Pro-environmental self-identity has been associated with greater consistency across different environmentally responsible behaviors, while environmentally responsible conduct can itself contribute to the development or reinforcement of environmental self-identity [35,36,37]. Related research on moral identity, identity-based consumer behavior, and sustainable consumption further suggests that consumers may use responsible consumption choices to express and maintain consistency with values and moral characteristics important to their self-concepts [39,48,49,50]. Taken together, these findings support the possibility that responsible consumption can become identity-relevant and thereby be associated with consistency across choices. However, most of this evidence concerns consistency within environmental or closely related sustainable consumption contexts. It therefore does not establish that an environmentally responsible orientation will automatically extend to ethically distinct domains such as fair trade, labor rights, animal welfare, or CSR-related consumption.
Identity-Consistency Mechanism (ICM) refers to the process through which consumers interpret GCO as identity-relevant evidence of being a responsible person and seek consistency with that self-understanding across other ethical consumption domains. ICM differs from MLP-C in the interpretation attached to GCO: MLP-C reflects responsibility completion (“I have already done enough”), whereas ICM reflects identity consistency (“this reflects who I am”). The two mechanisms are therefore not treated as opposite ends of a single continuum. They capture different interpretations of responsible consumption, and both may be present to some degree within the same consumer. A modest negative association between MLP-C and ICM is therefore theoretically plausible, but the framework does not imply that they should be strongly inversely related. Conceptually, ICM draws on moral consistency, self-perception, and identity-based motivation logic because responsible consumption tendencies may inform individuals’ understanding of their own values and identity, which can support choices consistent with that self-understanding [23,24,29,30,31,35,36,37,39]. This internal process should also be distinguished from identity signaling and identity-based consumer behavior, which emphasize how consumption choices can communicate or enact identity-relevant meanings [38,39]. Whereas identity signaling focuses primarily on the outward communicative function of consumption, ICM concerns consumers’ internal interpretation of GCO as evidence about their own responsible self. Thus, ICM is conceptualized as an internal identity-consistency process rather than a form of moral licensing or an externally oriented identity-signaling process.
To avoid this conceptual ambiguity, the term ICM is used rather than the original licensing label. The construct is referred to as ICM throughout the theoretical interpretation and empirical analyses because its theoretical meaning reflects identity consistency rather than moral licensing. Based on this reasoning, the following hypotheses are proposed:
H4a: 
GCO has a positive association with ICM.
H4b: 
ICM has a positive association with PIEP.
H4c: 
ICM exhibits a positive indirect association between GCO and PIEP.

2.5. The Moderating Role of Personal Moral Identity

Personal moral identity (PMI) represents the extent to which moral traits, values, and principles are central to an individual’s self-concept [51]. Individuals with stronger moral identities are generally more motivated to maintain consistency between their moral self-concepts and their choices, and prior research has shown that moral identity can shape whether individuals act in accordance with moral standards across situations [48,52,53]. Research on green and sustainable consumption likewise suggests that consumers for whom morality is more central to the self are more likely to incorporate moral considerations into their consumption decisions [49,50]. Here, PMI is treated as a relatively stable individual difference rather than a psychological outcome of GCO. Its theoretical role is to shape how consumers interpret their GCO—whether it is understood primarily as evidence that some responsibility has already been fulfilled or as an expression of a responsible moral self.
Although PMI and ICM both involve the moral self, they play conceptually distinct roles in the current framework. PMI captures the relatively stable centrality of moral traits and principles within an individual’s self-concept [28,52,53], whereas ICM captures a specific identity-consistency interpretation associated with GCO [23,24,35,36,37]. Thus, PMI functions as an individual-level boundary condition, whereas ICM represents a psychological pathway through which GCO may be associated with purchase intentions toward other ethical products. A consumer may therefore place substantial importance on morality as part of the self without necessarily interpreting every responsible consumption tendency as identity-relevant evidence that supports consistency across ethical consumption domains.
Within the context of green consumption, PMI may shape how consumers interpret their GCO. Consumers with stronger PMI may be more likely to regard GCO as consistent with an enduring moral self-concept rather than as evidence that a discrete moral responsibility has already been sufficiently fulfilled. In this sense, PMI may shift the interpretation associated with GCO away from responsibility completion (“I have already done enough”) and toward identity consistency (“this reflects who I am”). Accordingly, the same level of GCO may be associated with different moral self-regulatory interpretations depending on the centrality of morality to the consumer’s self-concept, providing a theoretical basis for PMI to differentially moderate the associations of GCO with MLP-C and ICM.
Previous research provides support for the role of moral identity in moral self-regulation. Conway and Peetz [23] showed that moral conduct can be associated with either compensatory responses or behavioral consistency depending on how individuals interpret its meaning. Fan et al. [54] further found that stronger moral identity can inhibit moral licensing, supporting the expectation that the centrality of morality to the self may constrain responsibility-completion interpretations. In addition, Goering et al.’s [55] meta-analysis documented systematic associations of moral identity with moral emotions and moral behavior. Taken together, these findings suggest that moral identity is relevant to how moral conduct is interpreted and regulated, providing a basis for expecting PMI to shape the associations of GCO with the two contrasting moral self-regulatory pathways.
Taken together, these arguments suggest that PMI differentially moderates the associations of GCO with the two contrasting moral self-regulatory pathways. First, higher PMI is expected to weaken the positive association between GCO and MLP-C because consumers for whom morality is more central to the self may be less inclined to interpret their GCO primarily in terms of responsibility completion. Second, higher PMI is expected to strengthen the positive association between GCO and ICM because these consumers may be more inclined to interpret their GCO as identity-relevant information that supports consistency with their moral self-concept. Accordingly, the following hypotheses are proposed:
H5a: 
PMI negatively moderates the positive association between GCO and MLP-C, such that this association is weaker at higher levels of PMI.
H5b: 
PMI positively moderates the positive association between GCO and ICM, such that this association is stronger at higher levels of PMI.
Purchase intentions toward other ethical products may also vary with consumers’ personal values and the social influences surrounding their decisions. The model therefore includes altruistic value orientation and social norms as theoretically relevant control variables. Altruistic value orientation captures the extent to which consumers are concerned with the welfare of others and the broader social consequences of their choices, whereas social norms reflect perceived expectations and approval from important others or social groups. Prior research has consistently linked personal values, subjective norms, and other forms of normative influence to sustainable consumption [1,13,56,57,58]. To account for additional sources of individual heterogeneity, the analysis also controls for gender, age, monthly income, education level, and previous ethical product purchase experience, all of which may be associated with differences in GCO or purchase intentions toward other ethical products.

3. Research Design

3.1. Research Method and Data Collection

Data were collected through an online questionnaire administered via Wenjuanxing (Questionnaire Star), a widely used survey and data-collection platform in China. The platform supports questionnaire design and distribution, online response collection, and respondent recruitment and is commonly used in academic, institutional, and market research. Adult consumers were recruited online from a range of demographic backgrounds, including different gender, age, income, education, and occupational groups, to increase sample heterogeneity. Participation was limited to general adult consumers with routine purchasing experience.
The questionnaire measured GCO, WG, MLP-C, ICM, PMI, and PIEP, together with the specified control variables. The empirical model examined whether GCO was associated with PIEP through three parallel psychological pathways—WG, MLP-C, and ICM—and whether PMI moderated the associations between GCO and the two moral self-regulatory mechanisms. Because GCO was assessed as a self-reported consumption orientation rather than as objectively observed prior green behavior, these relationships are treated as cross-sectional associations between consumption orientation and purchase intentions, rather than as temporally ordered behavioral spillover processes.
To capture respondents’ prior consumption experience, the questionnaire asked whether they had purchased any environmentally friendly or ethically oriented products during the previous six months. Examples included energy-efficient appliances, biodegradable products, organic food, environmentally friendly cleaning products, fair-trade products, cruelty-free cosmetics, and products carrying social responsibility certifications. Previous ethical product purchase experience was coded as 1 = Yes and 2 = No. The variable was included as a control in the main analyses and was also entered as a covariate in the subsequent latent profile analysis.
Because respondents were recruited through online survey distribution and no fixed sampling frame was available to determine the total number of individuals who received or viewed the survey invitation, a conventional response rate could not be calculated. The ratio of the 598 valid questionnaires to the 620 initially submitted questionnaires is therefore reported as a sample retention rate rather than as a survey response rate.
The study was conducted in accordance with the principles of voluntary participation, anonymity, and informed consent. Before beginning the questionnaire, respondents were provided with information about the purpose of the research, the intended use of the data, the procedures used to ensure anonymous data processing, and their right to participate voluntarily. Only those who provided informed consent were allowed to continue to the survey. All respondents retained in the final sample were at least 18 years old, and no personally identifiable information was collected.

3.2. Variable Measurement and Questionnaire Design

The questionnaire consisted of measures of GCO, WG, MLP-C, ICM, PMI, PIEP, AVO, and SN, together with demographic characteristics and previous ethical product purchase experience. Except for demographic and purchasing-experience items, all constructs were measured using seven-point Likert scales ranging from 1 (strongly disagree) to 7 (strongly agree). Previous ethical product purchase experience was coded as 1 = yes and 2 = no. The measurement items were adapted from established scales and adjusted to fit the context of green and ethical consumption. The complete measurement items and their sources are reported in Appendix A.
GCO captured the extent to which respondents tended to incorporate environmental considerations into their everyday consumption decisions, including efforts to reduce resource waste and preferences for environmentally friendly products. WG, by contrast, reflected the positive emotional rewards associated with environmentally responsible consumption, such as feelings of pleasure, satisfaction, meaningfulness, and fulfillment.
MLP-C captured a responsibility-completion interpretation in which consumers viewed environmentally responsible consumption as evidence that they had already fulfilled part of their moral responsibility, thereby potentially reducing the perceived need to maintain equally demanding ethical standards in other consumption contexts. ICM, by contrast, reflected an identity-consistency interpretation in which environmentally responsible consumption strengthened consumers’ perceptions of themselves as responsible individuals and encouraged choices that remained consistent with this self-understanding across different consumption contexts.
PMI reflected the extent to which moral characteristics were central to consumers’ self-concept, whereas PIEP captured their intentions to purchase other types of ethical products. AVO and SN were included as control variables, representing altruistic value orientation and perceived social expectations surrounding responsible consumption, respectively.

3.3. Model Specification

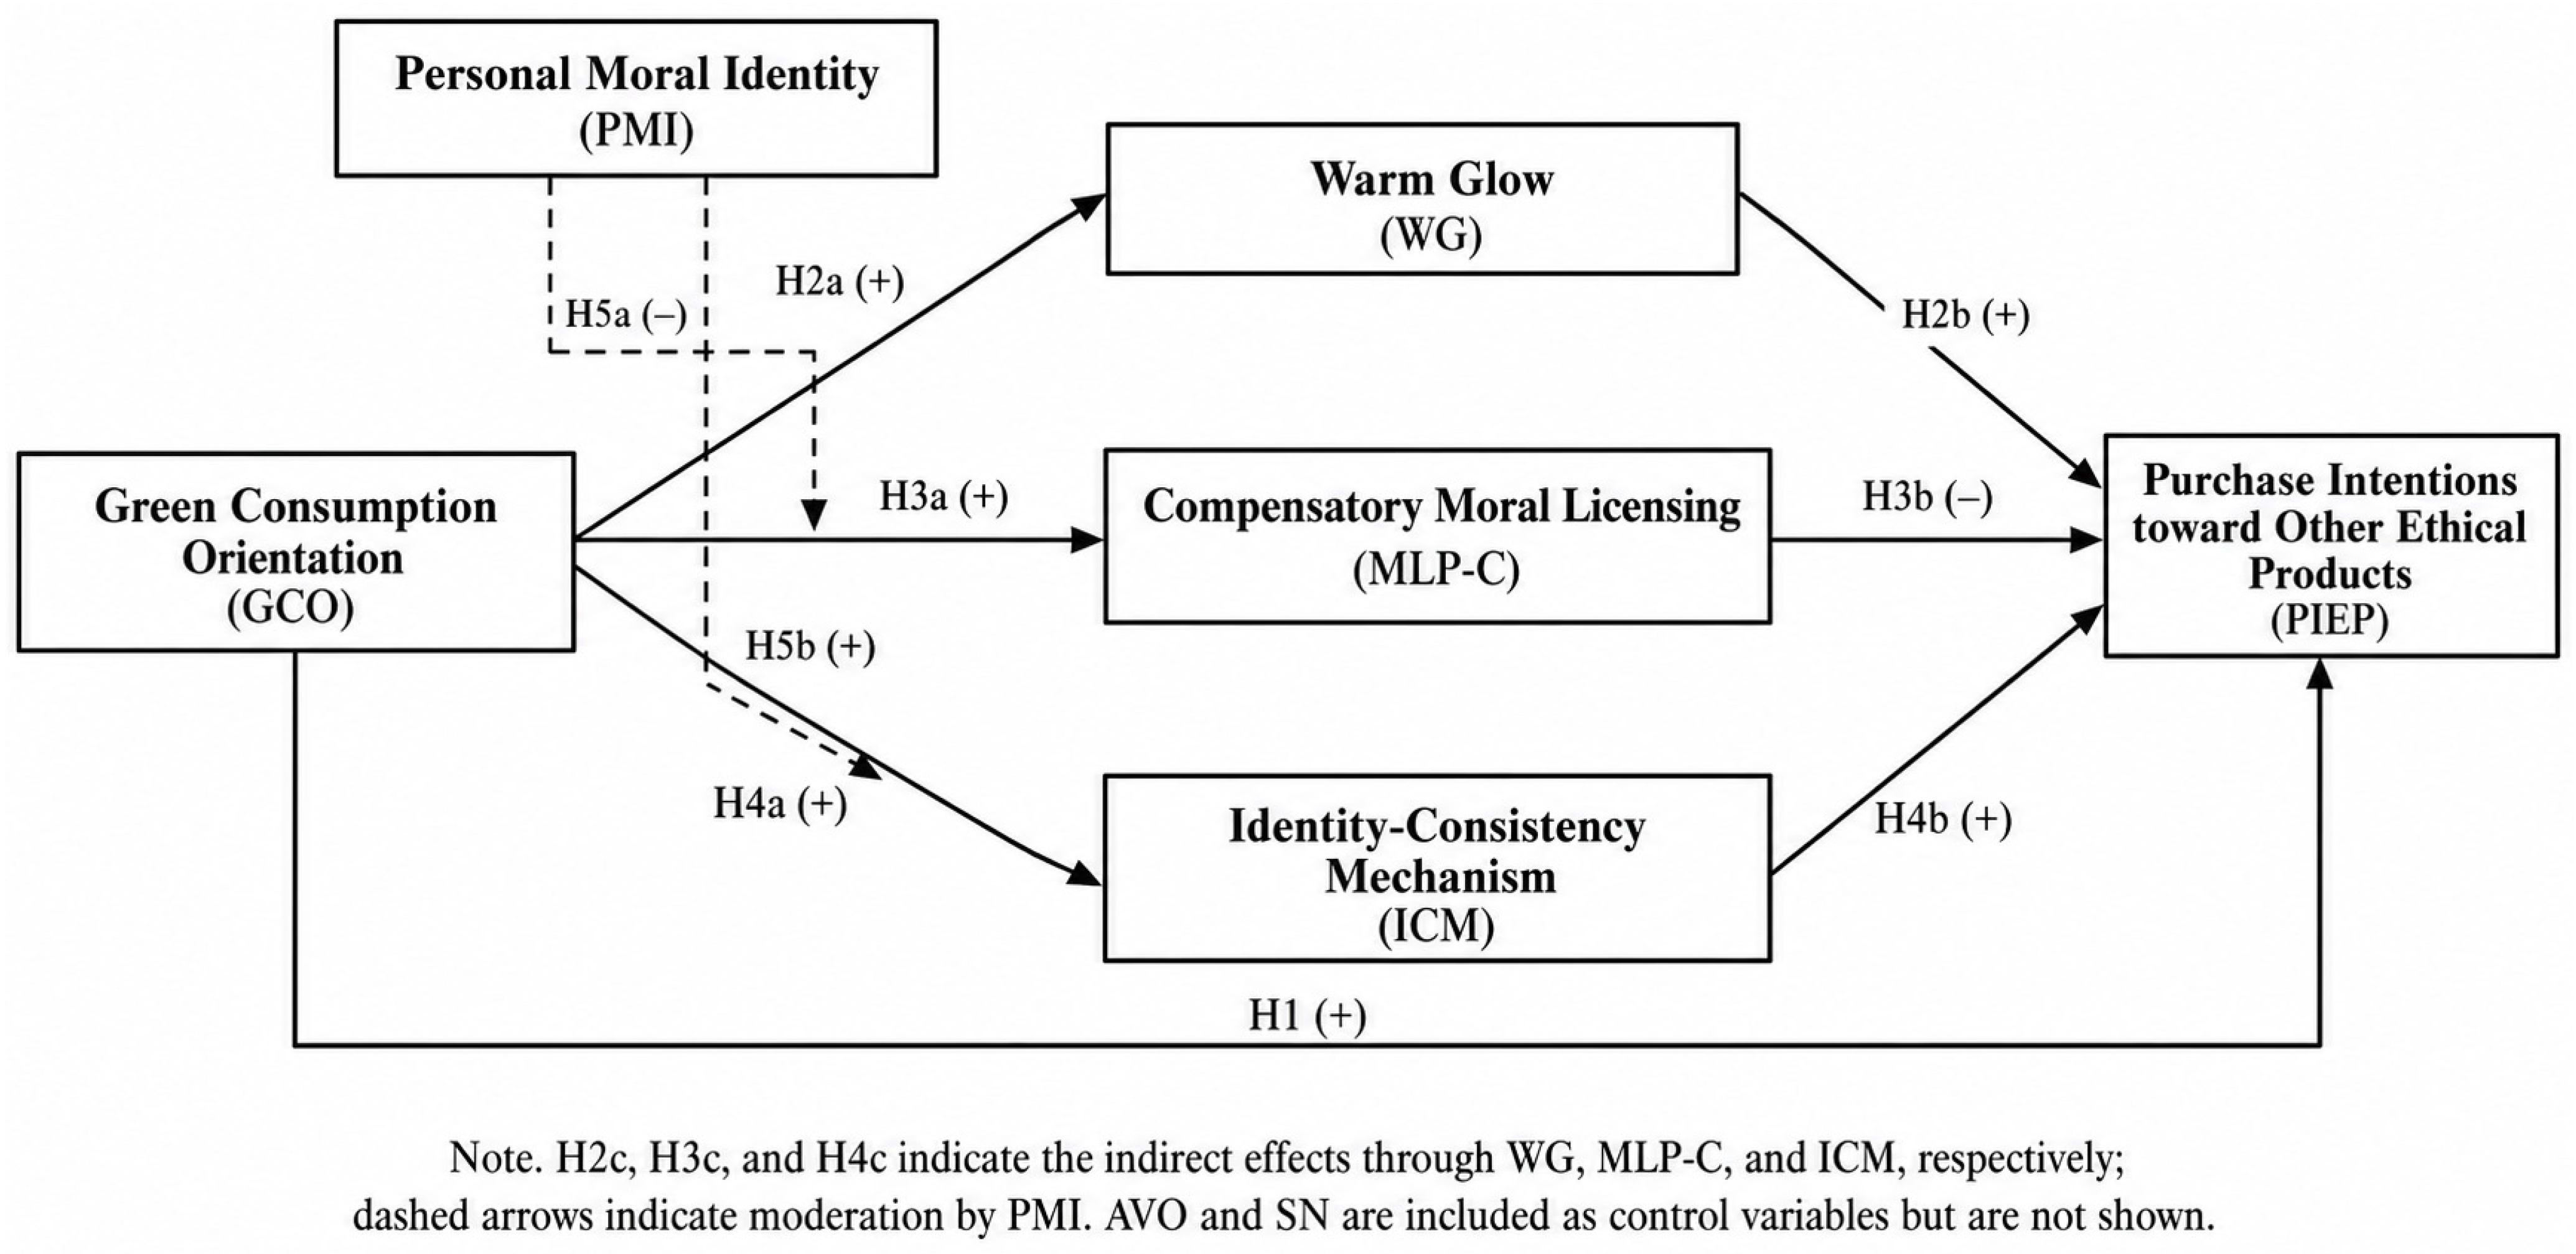
Based on the preceding hypotheses, the study specified a parallel-pathway model in which GCO was associated with PIEP through WG, MLP-C, and ICM. PMI was further incorporated as a moderator of the relationships between GCO and the two moral self-regulatory pathways. More specifically, higher PMI was expected to attenuate the positive association between GCO and MLP-C while strengthening the positive association between GCO and ICM.
AVO, SN, gender, age, monthly income, education level, and previous ethical product purchase experience were included as covariates in the main analyses. The proposed model is presented in Figure 1.

3.4. Data Analysis Methods

This study employed IBM SPSS Statistics 27, the Hayes PROCESS macro, and Mplus 8.3 for data analysis. First, descriptive statistics, Pearson correlations, and multicollinearity diagnostics were conducted. Scale reliability was assessed using Cronbach’s α, corrected item-total correlations, and Cronbach’s α if item deleted. Exploratory factor analysis (EFA) was then performed using principal axis factoring (PAF) with Direct Oblimin oblique rotation and Kaiser normalization. Confirmatory factor analysis (CFA) was subsequently conducted in Mplus 8.3 using maximum likelihood (ML) estimation to evaluate the eight-factor measurement structure. Measurement quality was further assessed using composite reliability (CR), average variance extracted (AVE), the Fornell-Larcker criterion, and the heterotrait–monotrait ratio (HTMT), following established discriminant-validity guidance [59].
The proposed associations were tested using regression analysis and Hayes’ PROCESS macro. Model 4 was applied to estimate the three parallel indirect pathways through WG, MLP-C, and ICM, while Model 7 was used to assess whether PMI moderated the GCO–MLP-C and GCO–ICM associations. Indirect effects, conditional indirect effects, and the corresponding indices of moderated mediation were estimated using 5000 bootstrap resamples [60]. Statistical significance was assessed using 95% confidence intervals, with effects considered significant when the interval did not include zero. AVO, SN, gender, age, monthly income, education level, and previous ethical product purchase experience were entered as covariates. To evaluate robustness, the models were re-estimated without covariates, examined separately across gender subgroups, and tested again using SEM. Because ICM3 and ICM4 contained wording that could overlap with intention-oriented outcome items, an additional sensitivity analysis was conducted using a reduced ICM measure based only on ICM1 and ICM2. The ICM → PIEP relationship and the GCO → ICM → PIEP indirect association were then re-estimated, and HTMT values were recalculated for the reduced ICM specification.
Given the number of theoretically specified hypotheses, the potential inflation of Type I error from multiple testing was addressed using the Benjamini–Hochberg false discovery rate (FDR) procedure. The correction was applied to the nine primary coefficient-based hypothesis tests, including H1, H2a, H2b, H3a, H3b, H4a, H4b, H5a, and H5b. Indirect effects and indices of moderated mediation were evaluated separately using 5000-resample bootstrap confidence intervals because these inferences were based on interval estimation rather than conventional p-value testing. The no-covariate models, gender-based subgroup analyses, and SEM estimations were treated as robustness checks, with emphasis placed on the consistency of the findings across alternative specifications rather than on the significance of any single additional test.
Finally, an exploratory latent profile analysis (LPA) was conducted in Mplus 8.3 using standardized scores for WG, MLP-C, ICM, PMI, AVO, and SN. These indicators were used to characterize consumers’ psychological and normative profiles, while GCO remained the focal predictor in the main analyses and PIEP was treated as a distal outcome for profile comparisons. Solutions with two to five profiles were evaluated using AIC, BIC, sample-size-adjusted BIC (aBIC), entropy, the Lo–Mendell–Rubin likelihood ratio test (LMR), the bootstrap likelihood ratio test (BLRT), profile size, parsimony, and substantive interpretability. Once the preferred profile solution had been selected, the robust three-step procedure (R3STEP) was used to examine whether demographic covariates were associated with profile membership. The BCH procedure was then applied to compare PIEP across the identified profiles while accounting for classification uncertainty. The LPA and its associated BCH pairwise comparisons were treated as exploratory and hypothesis-generating rather than as confirmatory hypothesis tests.

4. Empirical Analysis

4.1. Data Cleaning and Variable Description

4.1.1. Data Cleaning

A total of 620 responses were initially collected through the online survey administered via Wenjuanxing. Before the formal analyses, the data were screened using predefined quality-control criteria. Questionnaires showing clear straight-lining patterns, defined as identical responses across the core Likert-scale items, were first removed. Responses with completion times outside the range of the mean ± three standard deviations were also excluded. Additional screening identified questionnaires containing evident logical inconsistencies in demographic information or related survey items, as well as cases involving missing data, outliers, or other patterned response behaviors. Univariate outliers with absolute standardized scores greater than 3.29 (|Z| > 3.29) were likewise removed. After applying these screening procedures, 598 valid questionnaires remained, corresponding to a sample retention rate of 96.45% relative to the 620 initially submitted responses. The demographic characteristics and consumption-related information of the retained sample are reported in Table 1.

4.1.2. Descriptive Statistics and Correlation Analysis

Table 2 presents the means, standard deviations, and correlation coefficients among the study variables. Regarding the correlations among the focal study variables, GCO was significantly and positively correlated with WG (r = 0.603, p < 0.01), MLP-C (r = 0.173, p < 0.01), ICM (r = 0.552, p < 0.01), and PIEP (r = 0.487, p < 0.01). WG was also significantly and positively correlated with ICM (r = 0.609, p < 0.01) and PIEP (r = 0.597, p < 0.01). In contrast, MLP-C was significantly and negatively correlated with WG (r = −0.088, p < 0.05), ICM (r = −0.110, p < 0.01), and PIEP (r = −0.260, p < 0.01), whereas its correlations with PMI (r = −0.071, p > 0.05) and AVO (r = −0.055, p > 0.05) were not significant. In addition, ICM was significantly and positively correlated with PIEP (r = 0.623, p < 0.01).
Overall, the bivariate correlations among the focal study variables were generally consistent with the theoretically expected directions and provided preliminary evidence for the relationships examined in the subsequent multivariate analyses. Of particular relevance to the distinction between the two moral self-regulatory mechanisms, MLP-C and ICM showed only a weak negative correlation (r = −0.110, p < 0.01), consistent with their conceptualization as distinct rather than simply opposite processes.

4.1.3. Multicollinearity Assessment

To assess potential multicollinearity, tolerance and variance inflation factor (VIF) values were calculated for the variables used in the regression analyses. As shown in Table 3, the tolerance values ranged from 0.414 to 0.989, while the VIF values ranged from 1.011 to 2.417, with a maximum VIF of 2.417. All values were within commonly accepted thresholds, indicating that serious multicollinearity was unlikely to be a concern in the subsequent regression analyses.

4.2. Reliability and Validity Assessment

4.2.1. Reliability Analysis

Cronbach’s α was used to assess the internal consistency reliability of the measurement scales. As shown in Table 4, the Cronbach’s α coefficients for all constructs exceeded 0.80, ranging from 0.872 to 0.938. In addition, all corrected item-total correlation (CITC) values exceeded 0.40, and the Cronbach’s α if item deleted (CAID) values were lower than the corresponding overall α coefficients. These results indicate satisfactory internal consistency across the measurement scales, and all items were therefore retained for subsequent analyses.

4.2.2. Exploratory Factor Analysis

Exploratory factor analysis (EFA) was conducted to assess the latent structure underlying the 32 measurement items. Principal axis factoring (PAF) was selected because the analysis aimed to identify common latent factors rather than simply summarize the total variance of the observed items. Since the constructs were theoretically expected to correlate with one another, Direct Oblimin oblique rotation with Kaiser normalization was applied, allowing correlations among the extracted factors.
Before factor extraction, the suitability of the data for EFA was assessed. As shown in Table 5, the Kaiser–Meyer–Olkin (KMO) measure of sampling adequacy was 0.953, exceeding the recommended threshold of 0.70. Bartlett’s test of sphericity was statistically significant (χ2 = 15,082.972, df = 496, p < 0.001), indicating that the correlation matrix was suitable for factor analysis.
The factor extraction results are presented in Table 6. Eight factors had initial eigenvalues greater than 1, with the eigenvalue decreasing markedly from 1.004 for the eighth factor to 0.493 for the ninth factor. Using PAF, the eight retained factors jointly accounted for 71.555% of the variance in the common-factor solution. These results supported the retention of an eight-factor structure for subsequent rotation and interpretation.
The pattern matrix results are presented in Table 7. Factor loadings with absolute values below 0.30 were suppressed in the factor-analysis output. Each item showed its highest loading on its corresponding factor. Overall, the pattern matrix indicated a clearly differentiated eight-factor structure. CFA was subsequently conducted to further evaluate the proposed measurement structure.

4.2.3. Confirmatory Factor Analysis

Following the EFA, confirmatory factor analysis (CFA) was conducted using Mplus 8.3 to evaluate the proposed eight-factor measurement structure. Maximum likelihood (ML) estimation was used for parameter estimation. Multivariate normality was examined using Mardia’s coefficients. Mardia’s multivariate skewness was 63.935 (χ2 = 6372.211, df = 5984, p < 0.001), indicating some departure from multivariate normality, whereas the standardized multivariate kurtosis value was −1.866. At the item level, skewness ranged from −0.401 to 0.459 and kurtosis from −1.232 to −0.296, suggesting no substantial univariate non-normality. Given the modest item-level departures from normality and the sample size of 598, ML estimation was retained for the CFA.
Model fit was evaluated using χ2/df, CFI, TLI, RMSEA, and SRMR. The following criteria were adopted: χ2/df < 3.00, CFI and TLI ≥ 0.90, and RMSEA and SRMR ≤ 0.08.
As shown in Table 8, the ML eight-factor model fit the data well (chi-square/df = 1.229, CFI = 0.993, TLI = 0.992, RMSEA = 0.020, and SRMR = 0.020). Standardized factor loadings ranged from 0.766 to 0.902 and were all statistically significant (p < 0.001). Moreover, the eight-factor model fit substantially better than the alternative seven-factor, six-factor, and one-factor models. Together with Harman’s single-factor diagnostic, in which the first factor accounted for 42.59% of the variance [61], these results provide no indication that a single common factor dominated the covariance structure. However, common method variance cannot be ruled out given the use of same-source survey data.
Convergent validity was assessed using composite reliability (CR) and average variance extracted (AVE). As shown in Table 9, the AVE values for all eight constructs exceeded 0.50, and all CR values exceeded 0.80, indicating satisfactory convergent validity.
Discriminant validity was first assessed using the Fornell–Larcker criterion. As shown in Table 10, the square root of the AVE for each construct exceeded its correlations with the other constructs, supporting satisfactory discriminant validity.
Discriminant validity was further assessed using the heterotrait–monotrait ratio (HTMT). As shown in Table 11, all HTMT values were below the conservative threshold of 0.85 recommended for discriminant-validity assessment [59]. The largest values were observed for ICM-PMI (0.683) and ICM-PIEP (0.679), supporting the empirical distinction between ICM, personal moral identity, and purchase intentions toward other ethical products.

4.3. Regression Analysis and Hypothesis Testing

4.3.1. Direct and Indirect Associations

PROCESS Model 4 was used to examine the association between GCO and PIEP together with the three parallel indirect pathways, controlling for AVO, SN, gender, age, monthly income, education level, and previous ethical product purchase experience. As reported in Table 12, GCO showed a positive association with PIEP in the model estimated without the mediators (b = 0.247, p < 0.001), providing support for H1. GCO was also positively associated with WG (b = 0.427, p < 0.001), MLP-C (b = 0.275, p < 0.001), and ICM (b = 0.279, p < 0.001), supporting H2a, H3a, and H4a. In the outcome model that included all three mediators simultaneously, WG remained positively associated with PIEP (b = 0.187, p < 0.001), MLP-C was negatively associated with PIEP (b = −0.241, p < 0.001), and ICM was positively associated with PIEP (b = 0.258, p < 0.001), supporting H2b, H3b, and H4b, respectively. The direct association between GCO and PIEP also remained positive and statistically significant after the mediators were entered (b = 0.161, p < 0.001). The three indirect associations were then evaluated using bootstrap confidence intervals.
Indirect associations were examined using 5000 bootstrap resamples with bias-corrected 95% confidence intervals. As shown in Table 13, the indirect association through WG was positive (b = 0.080, 95% CI [0.049, 0.112]), whereas the indirect association through MLP-C was negative (b = −0.066, 95% CI [−0.096, −0.041]). The indirect association through ICM was also positive (b = 0.072, 95% CI [0.048, 0.101]). To address possible item overlap between ICM and PIEP, an additional sensitivity analysis deleted ICM3 and ICM4 and recomputed ICM using ICM1 and ICM2 only. The reduced two-item ICM scale remained reliable (Cronbach’s alpha = 0.838), the ICM → PIEP association remained positive in the outcome model (b = 0.198, SE = 0.033, t = 5.979), and the GCO → ICM → PIEP indirect association remained significant (b = 0.058, 95% bootstrap CI [0.036, 0.083]). The reduced ICM-PIEP HTMT value was 0.666, and the largest HTMT value in the reduced measurement matrix was 0.689, below the conservative 0.85 threshold.

4.3.2. Moderation Analysis

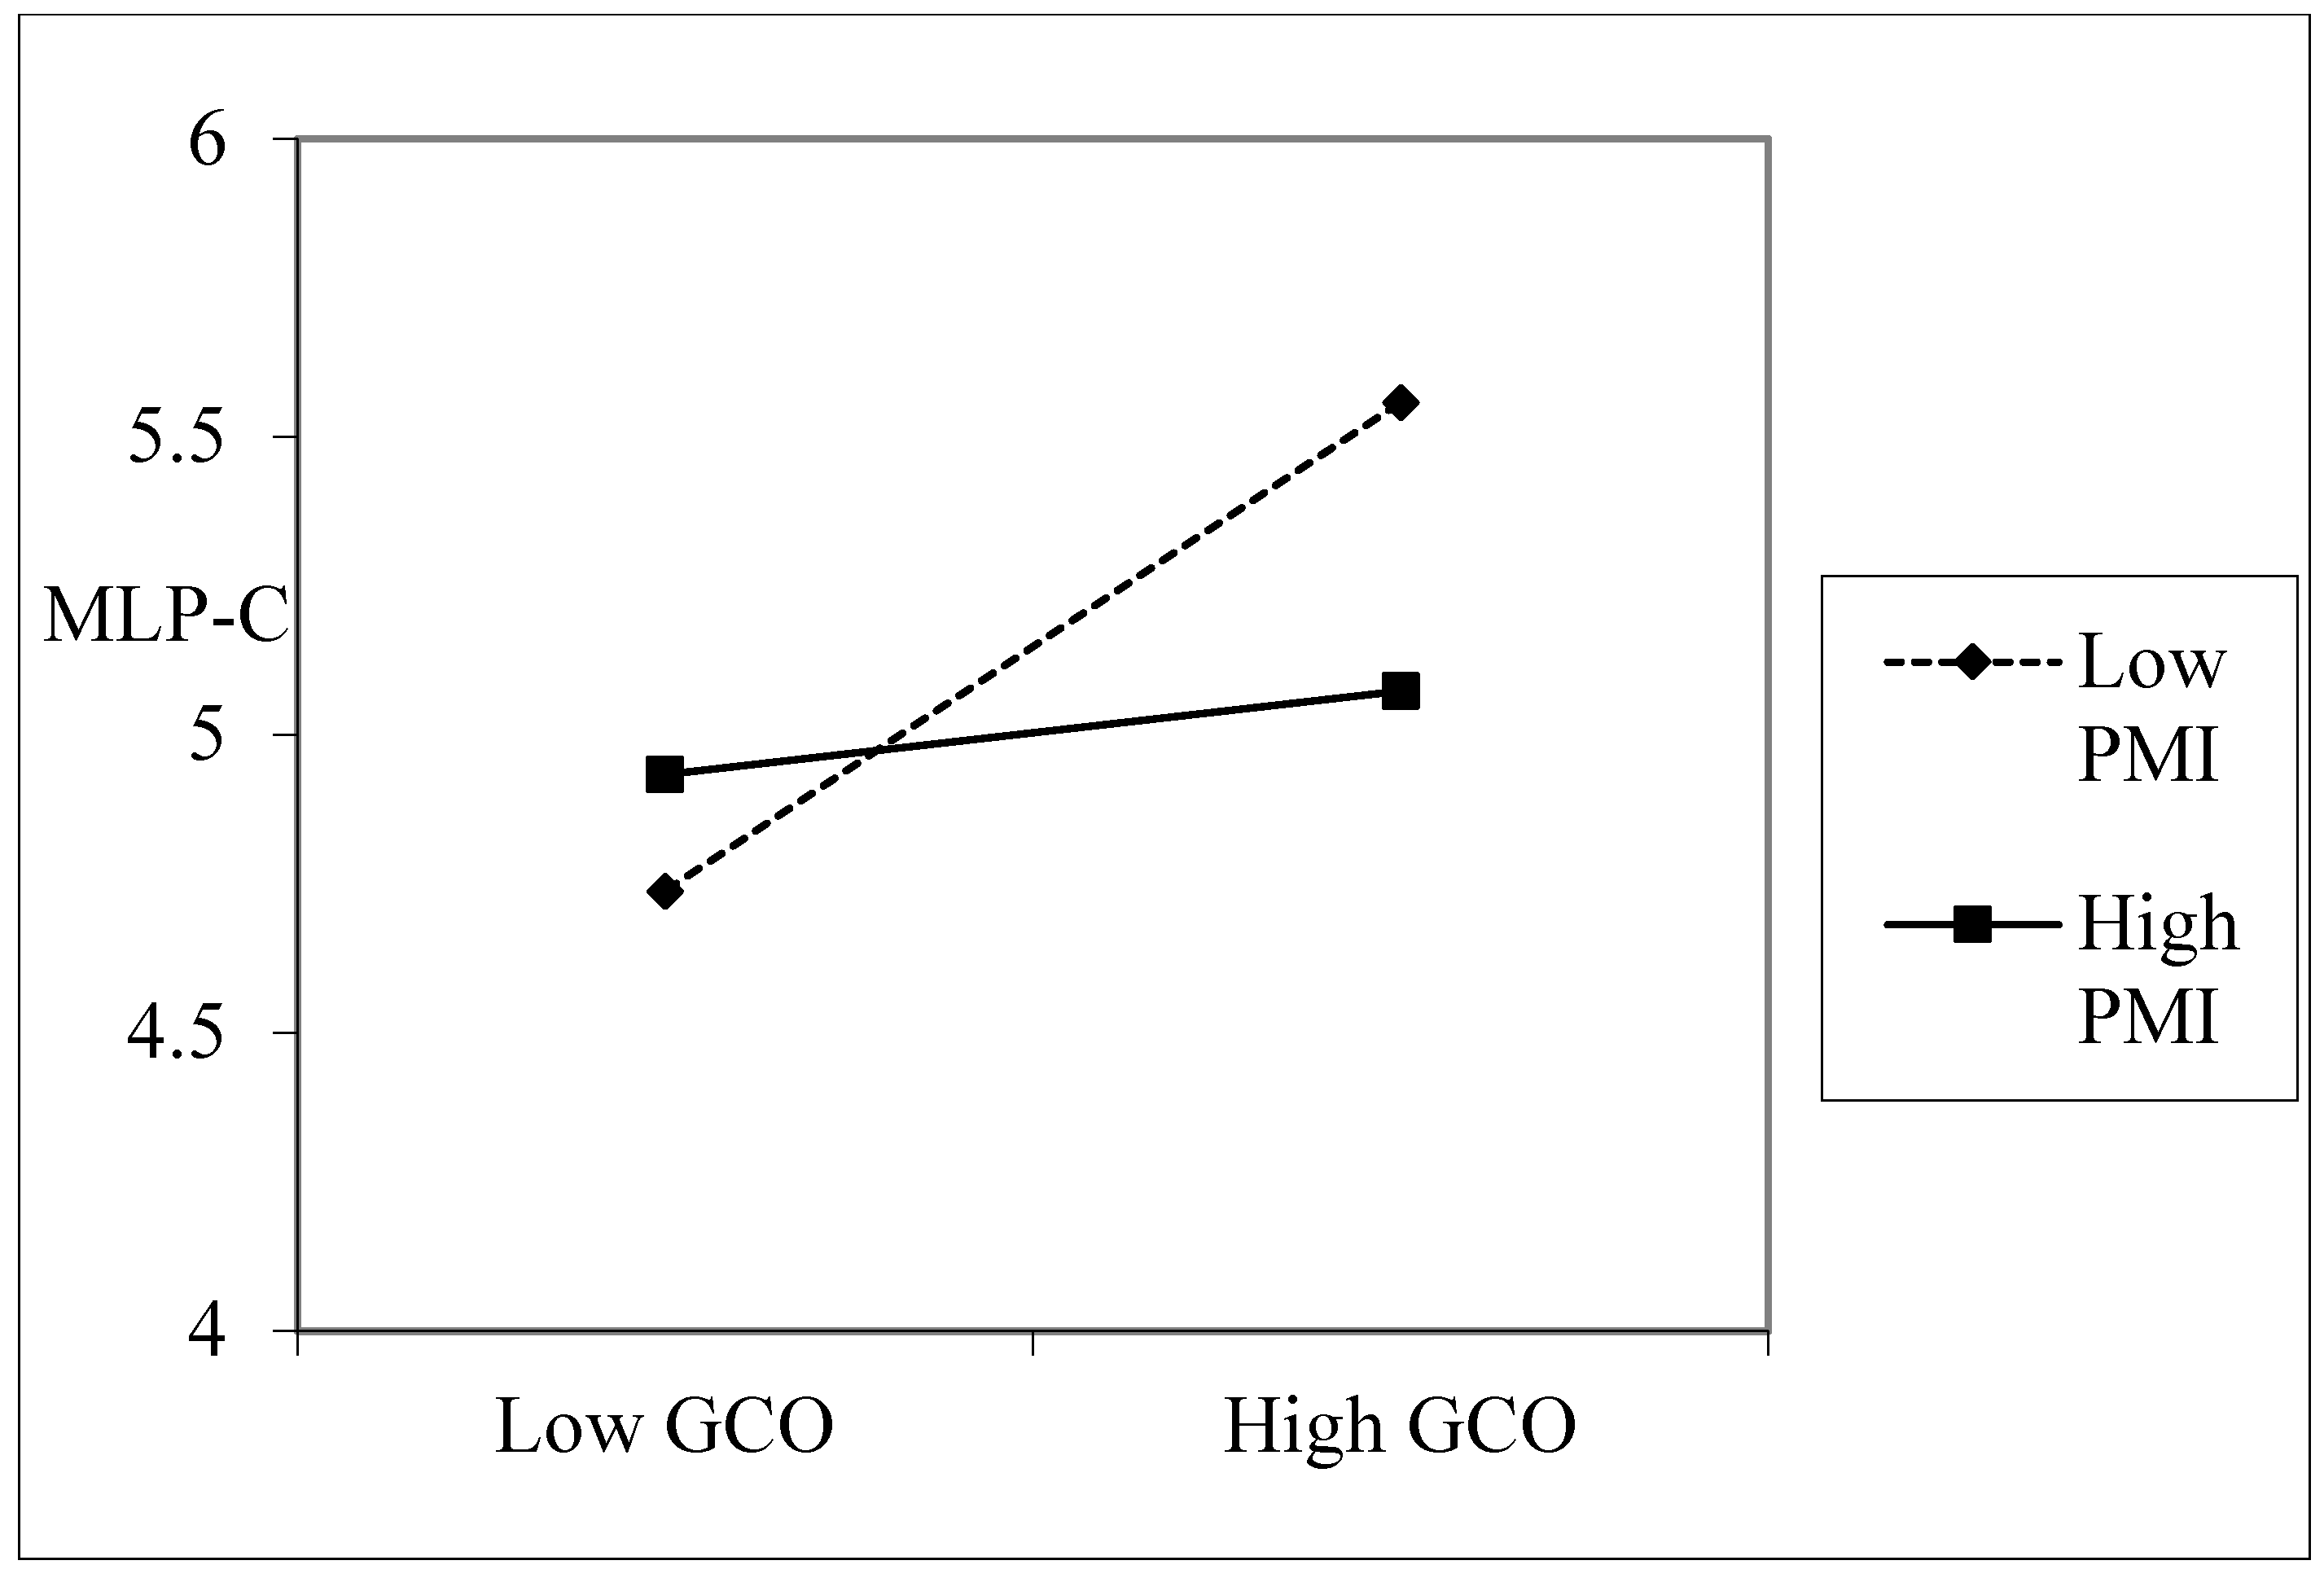
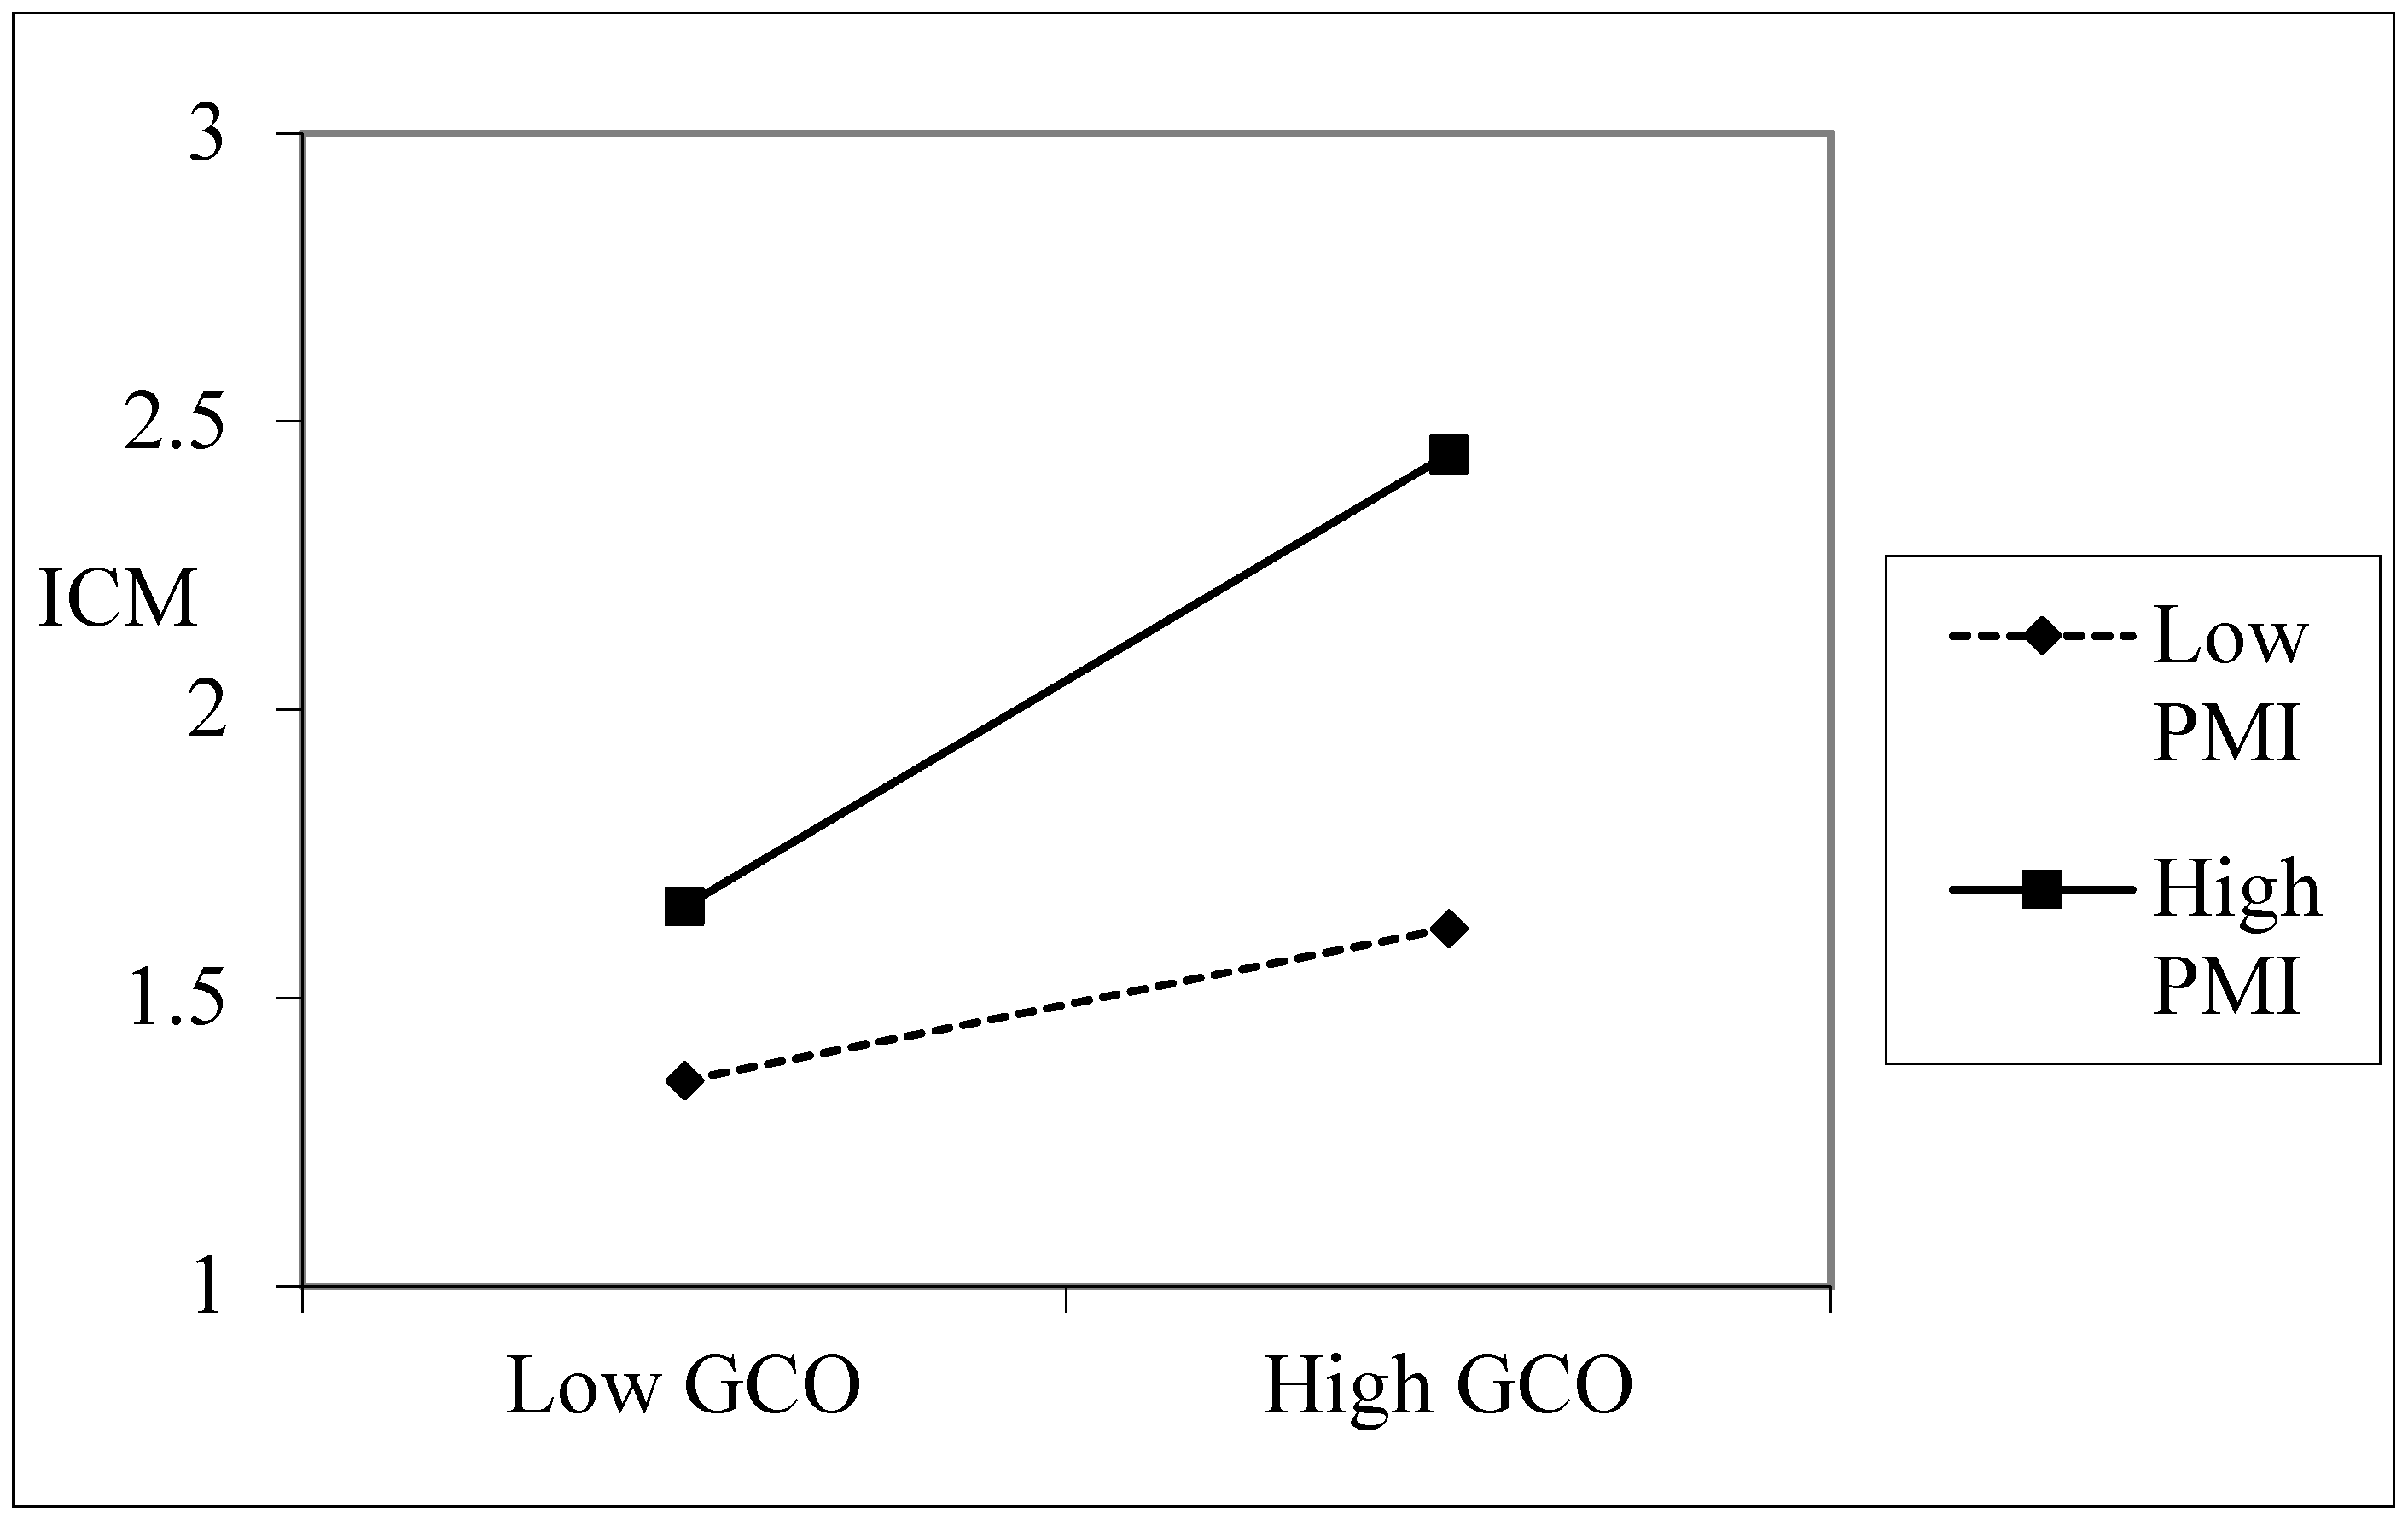
PMI was then examined as a moderator of the associations between GCO and the two moral self-regulatory pathways, MLP-C and ICM. As shown in Table 14, the GCO × PMI interaction was negatively associated with MLP-C (b = −0.170, p < 0.001), indicating that the positive relationship between GCO and MLP-C weakened as PMI increased. This result supported H5a. By contrast, the GCO × PMI interaction was positively associated with ICM (b = 0.130, p < 0.001), showing that the positive relationship between GCO and ICM became stronger at higher levels of PMI. H5b was therefore supported.
Simple slope analyses were conducted to further interpret the significant interactions. As shown in Table 15 and Figure 2 and Figure 3, the positive association between GCO and MLP-C weakened as PMI increased, whereas the positive association between GCO and ICM strengthened as PMI increased. These patterns provided further support for H5a and H5b.
To address multiple testing across the primary coefficient-based hypothesis tests, the Benjamini–Hochberg false discovery rate correction was applied to H1, H2a, H2b, H3a, H3b, H4a, H4b, H5a, and H5b. As shown in Table 16, all nine tests remained statistically significant after adjustment, and the substantive conclusions were unchanged.

4.3.3. Moderated Mediation Analysis

As shown in Table 17, moderated indirect associations were further examined using bootstrapping. The negative indirect association between GCO and PIEP through MLP-C weakened as PMI increased, whereas the positive indirect association through ICM strengthened as PMI increased. The index of moderated mediation was significant for the MLP-C pathway (index = 0.052, 95% bootstrap CI [0.034, 0.073]) and for the ICM pathway (index = 0.045, 95% bootstrap CI [0.028, 0.064]), supporting the proposed conditional indirect associations.

4.3.4. Effect Size Analysis

To complement the significance tests, Cohen’s f2 was calculated to assess the local effect sizes of the focal predictors. As shown in Table 18, the effect sizes varied across the proposed associations, with the largest focal effect observed for the GCO–WG association (f2 = 0.183).

4.4. Robustness Checks

To assess the robustness of the main findings, several additional analyses were conducted, including re-estimating the models without the control variables, conducting gender-based subgroup analyses, and re-estimating the proposed relationships using structural equation modeling (SEM). The results are reported below.

4.4.1. Re-Estimation Without Control Variables

First, the main models were re-estimated without the control variables. As reported in Table 19, the direction and statistical significance of the key associations were unchanged from the primary analysis. GCO remained positively associated with WG (b = 0.715, p < 0.001), MLP-C (b = 0.157, p < 0.001), ICM (b = 0.604, p < 0.001), and PIEP (b = 0.464, p < 0.001). When WG, MLP-C, and ICM were entered simultaneously, WG continued to show a positive association with PIEP (b = 0.209, p < 0.001), MLP-C remained negatively associated with PIEP (b = −0.245, p < 0.001), and ICM remained positively associated with PIEP (b = 0.293, p < 0.001). The direct association between GCO and PIEP also remained positive and statistically significant (b = 0.175, p < 0.001). The close correspondence between these estimates and those from the primary models indicates that the main findings were not driven by the inclusion of the control variables.
The moderation findings were also unchanged when the control variables were removed. As reported in Table 20, the GCO × PMI interaction remained negatively associated with MLP-C (b = −0.172, p < 0.001) and positively associated with ICM (b = 0.136, p < 0.001). Both interaction effects retained the same direction and level of statistical significance as in the primary models, further supporting the stability of the moderating relationships proposed in H5a and H5b.

4.4.2. Gender-Based Subgroup Analysis

To further assess robustness, the proposed relationships were re-estimated separately for male and female respondents. As reported in Table 21 and Table 22, the overall pattern of results was broadly similar across the two subgroups. The total association between GCO and PIEP, as well as the indirect associations through WG, MLP-C, and ICM, remained statistically significant for both men and women. Some differences emerged, however, once the three mediators were entered simultaneously. The residual GCO–PIEP association remained significant among male respondents (b = 0.185, p < 0.001), whereas it was not statistically significant among female respondents (b = 0.113, p > 0.05), suggesting some variation in the mediation pattern across gender. The GCO × PMI interaction terms for both MLP-C and ICM also remained significant in each subgroup. Because the analysis did not include formal tests of between-group coefficient differences, these subgroup patterns should be interpreted descriptively and not as evidence that gender itself moderates the proposed relationships.

4.4.3. SEM-Based Robustness Check

As an additional robustness check, the proposed relationships were re-estimated using SEM. As shown in Table 23 and Table 24, the directions and statistical significance of the direct, indirect, and moderating associations were consistent with the PROCESS-based findings, providing additional support for the robustness of the main results.
The SEM-based indirect association results showed that all three indirect associations were statistically significant, as none of the corresponding 95% confidence intervals included zero. Specifically, the indirect association through WG was positive (effect = 0.092, 95% CI [0.047, 0.136]), the indirect association through MLP-C was negative (effect = −0.075, 95% CI [−0.113, −0.038]), and the indirect association through ICM was positive (effect = 0.088, 95% CI [0.052, 0.124]). These results were consistent with the PROCESS-based findings and provided additional robustness support for H2c, H3c, and H4c.

4.5. Exploratory Latent Profile Analysis

4.5.1. Model Selection

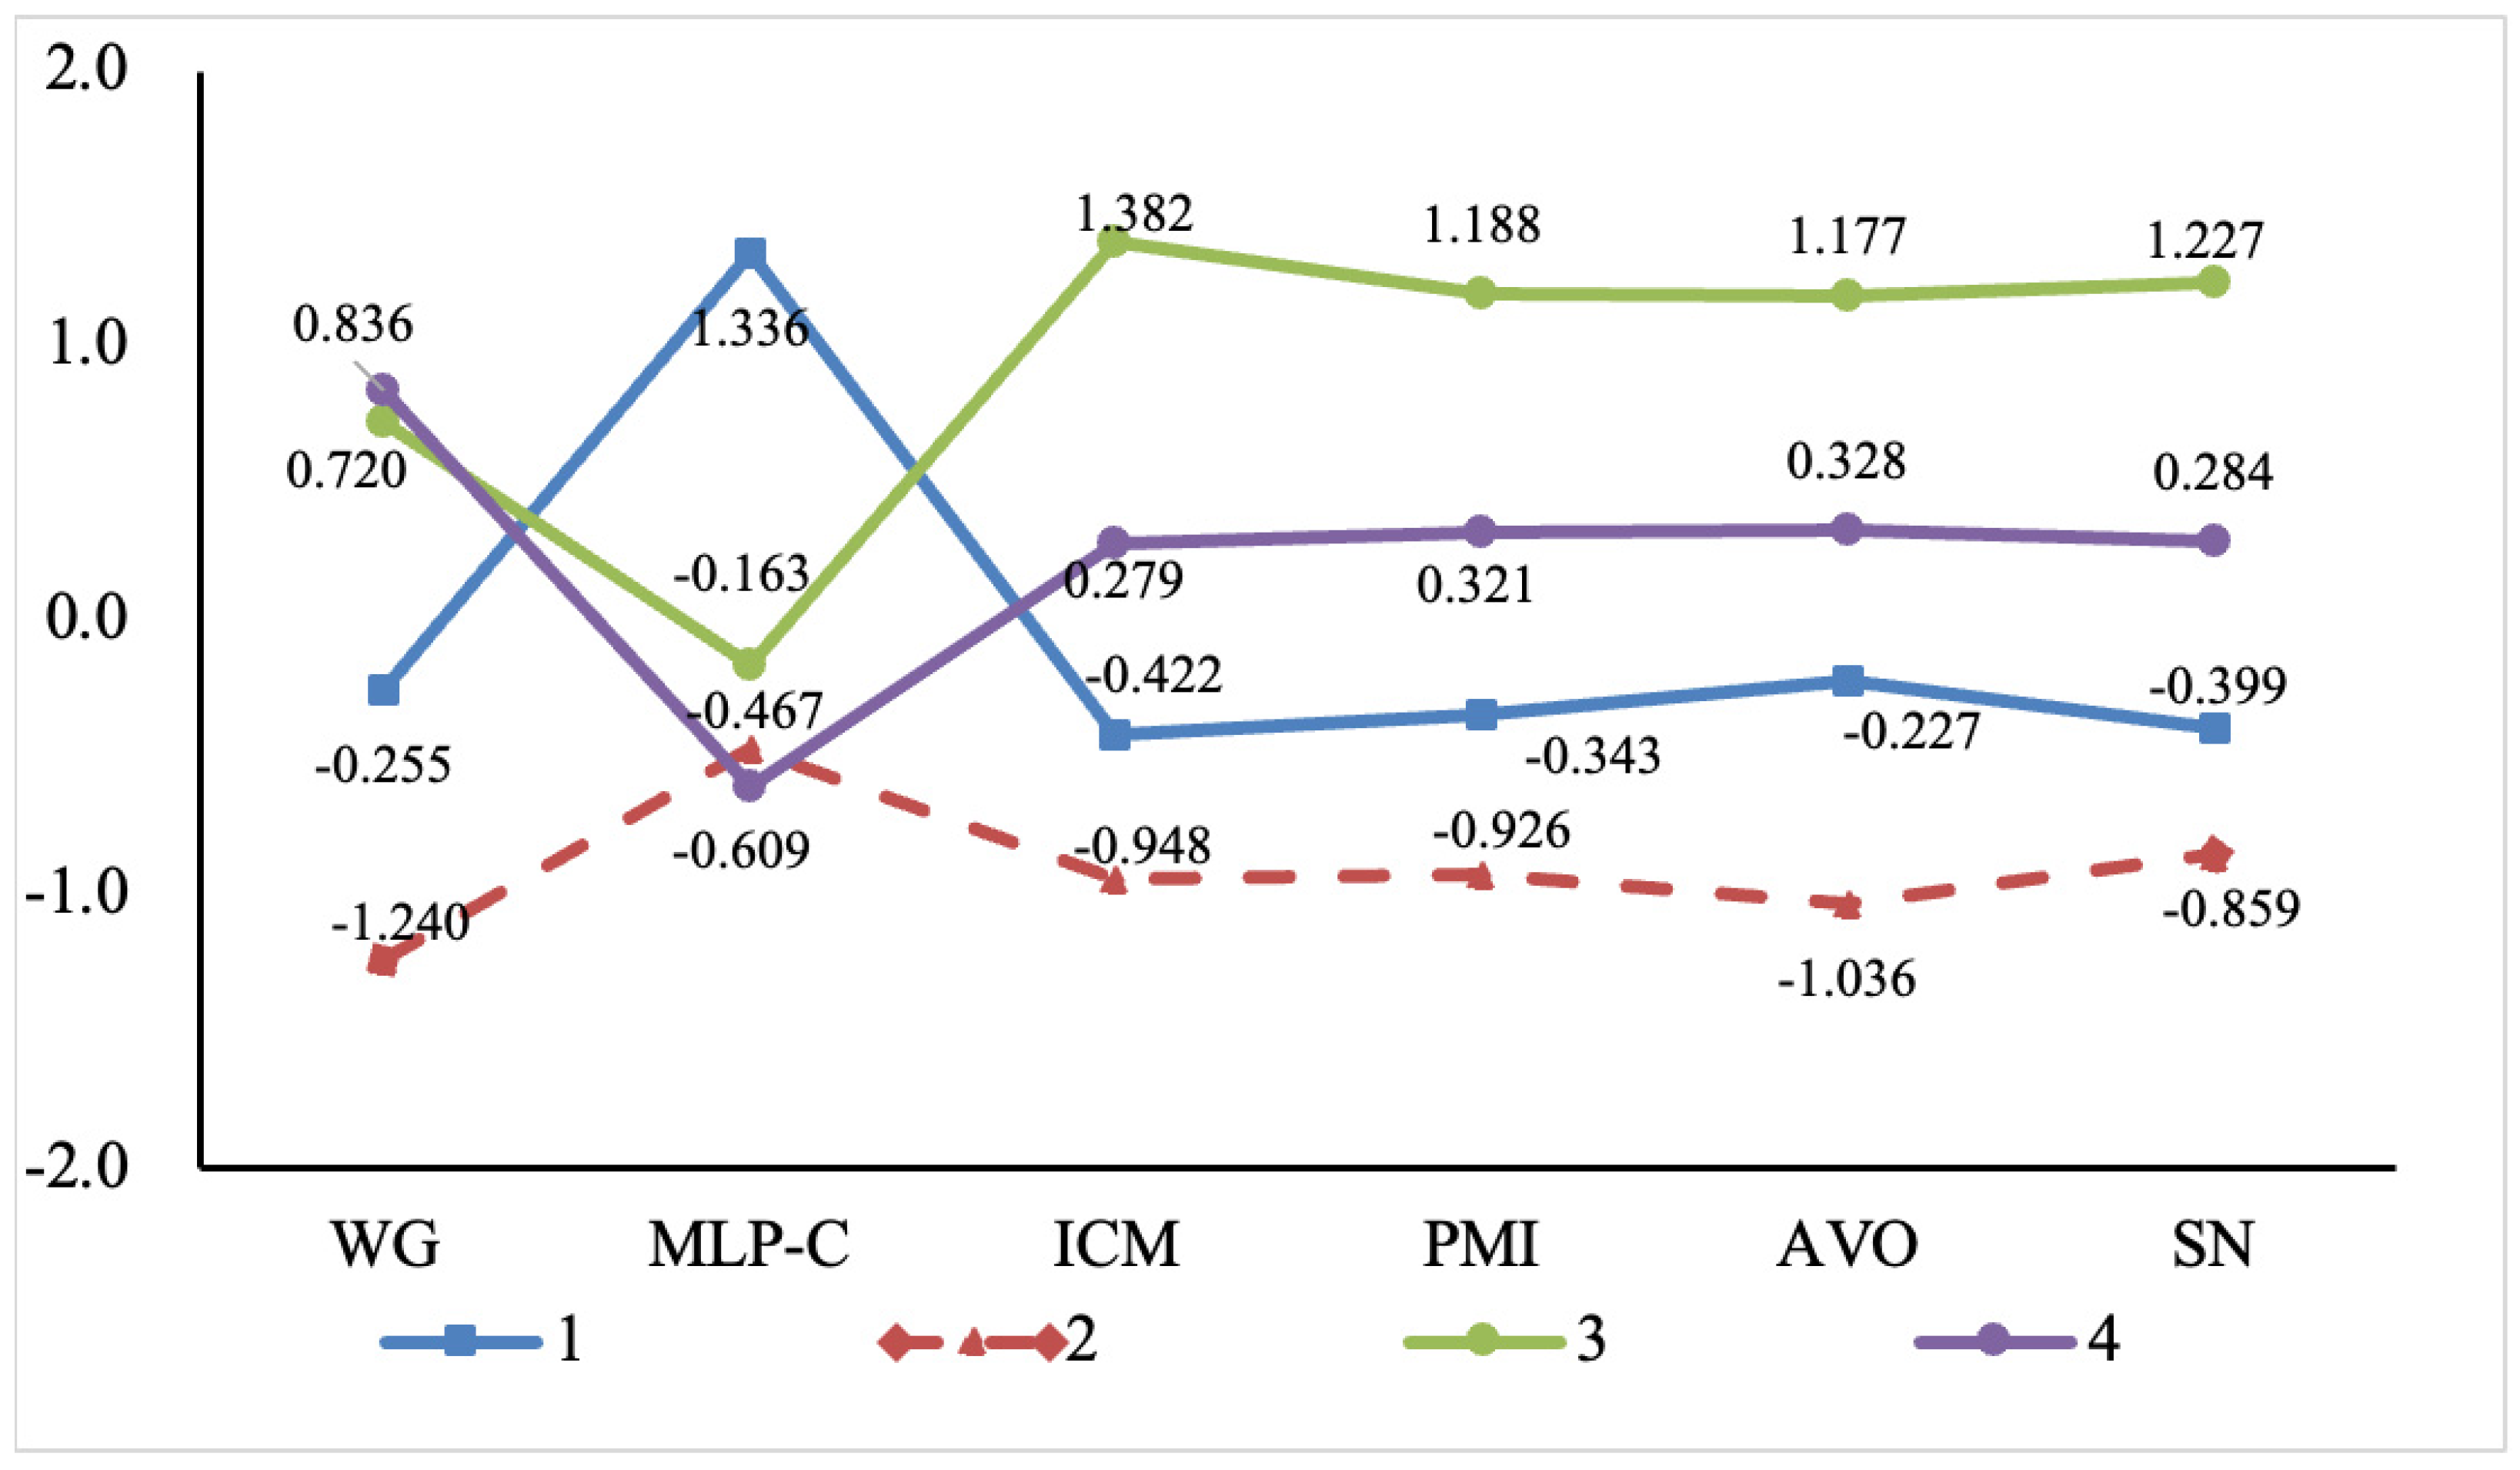
As shown in Table 25 and Figure 4, considering overall model fit, classification quality, profile size, parsimony, and substantive interpretability, the four-profile solution was retained instead of the five-profile alternative. Although the five-profile model produced slightly lower AIC, BIC, and aBIC values and a significant LMR test (p = 0.026), its entropy was lower than that of the four-profile solution (0.876 vs. 0.887). The average posterior classification probabilities were 0.947, 0.960, 0.926, and 0.922 for the four-profile model, compared with 0.889, 0.946, 0.921, 0.928, and 0.910 for the five-profile model. These results, together with the lower entropy, indicate that adding a fifth profile did not clearly improve classification quality. The fifth profile also represented only 5.5% of the sample, whereas each profile in the four-profile solution contained approximately 20% or more of respondents. Given the limited size of the additional profile, the absence of a clear gain in classification quality, and the greater parsimony of the four-profile solution, the four-profile model was selected for the subsequent analyses.

4.5.2. Demographic Predictors of Latent Profile Membership

After identifying the four latent consumer profiles, this study further examined whether demographic characteristics were associated with latent profile membership. Specifically, gender, age, monthly income, education level, and previous ethical product purchase experience were included as predictors. The robust three-step approach (R3STEP) in Mplus was employed to estimate these associations while accounting for classification uncertainty, with the low-involvement profile serving as the reference category.
As shown in Table 26, none of the demographic variables significantly distinguished the compensatory licensing-oriented or positive consistency-oriented profiles from the low-involvement profile. For the emotion-driven profile, previous ethical product purchase experience showed a nominal association (b = 0.573, p = 0.030, OR = 1.774). Given the coding of the purchase experience variable, respondents without previous ethical product purchase experience had 77.4% higher odds of being classified into the emotion-driven profile rather than the low-involvement profile than those with such experience. The remaining demographic variables were not statistically significant.

4.5.3. Differences in PIEP Across Latent Profiles

The BCH approach was used to examine differences in purchase intentions toward other ethical products (PIEP) across the four latent profiles while accounting for classification uncertainty. The omnibus test indicated significant differences in PIEP across the four profiles (χ2 = 485.588, p < 0.001). As shown in Table 27 and Table 28, the positive consistency-oriented consumers exhibited the highest standardized PIEP score (M = 0.987, SE = 0.071), followed by the emotion-driven profile (M = 0.428, SE = 0.058). In contrast, the compensatory licensing-oriented profile (M = −0.472, SE = 0.070) and the low-involvement profile (M = −0.780, SE = 0.064) exhibited below-average PIEP scores, with the low-involvement profile showing the lowest level.
Because the six BCH pairwise comparisons constituted a separate exploratory family, their p-values were additionally adjusted using the Benjamini–Hochberg false discovery rate procedure. All six pairwise differences remained statistically significant after adjustment (all BH-adjusted p ≤ 0.002), indicating that the pattern of between-profile differences was unchanged.

5. Discussion

Based on data from 598 adult consumers, the study identified a positive association between GCO and PIEP. The indirect results pointed to different psychological pathways: WG and ICM were positively associated with PIEP, whereas MLP-C showed a negative indirect association. PMI also shaped the two moral self-regulatory pathways, weakening the positive relationship between GCO and MLP-C while strengthening the relationship between GCO and ICM. The exploratory LPA provided a complementary person-centered perspective by identifying four consumer profiles that differed significantly in their levels of PIEP.
The overall pattern was mixed rather than uniformly positive across ethical domains. WG represented an emotional-reward pathway, MLP-C captured a responsibility-completion interpretation, and ICM reflected identity-based consistency. The negative indirect association through MLP-C should therefore not be interpreted as evidence that stronger GCO causes consumers to relax their moral standards. Rather, it suggests that compensatory interpretations may coexist with an otherwise positive association between GCO and PIEP. The weak negative correlation between MLP-C and ICM further suggests that these mechanisms are not simply opposite poles of the same process. They appear to capture different interpretations of responsible consumption that can coexist to some extent. The ICM pathway showed the opposite indirect pattern: stronger GCO was associated with stronger PIEP when responsible consumption was interpreted as part of an ongoing and identity-relevant self-understanding rather than as evidence that one’s moral obligations had already been sufficiently fulfilled.
The LPA offered a complementary person-centered view of this heterogeneity. Positive consistency-oriented consumers reported the highest levels of PIEP, followed by emotion-driven consumers, whereas compensatory licensing-oriented and low-involvement consumers showed comparatively lower levels. This pattern suggests that ethical consumption intentions are associated with distinct combinations of emotional, moral, and identity-related characteristics rather than with a single uniform psychological profile.

5.1. Theoretical Contributions and Methodological Robustness

The study makes three main theoretical contributions. First, it treats green consumption orientation and purchase intentions toward other ethical products as related but conceptually distinct domains, avoiding the assumption that ethical consumption is psychologically uniform across contexts. Second, by examining WG, MLP-C, and ICM within the same model, the findings show that the positive GCO–PIEP association can coexist with both reinforcing and compensatory psychological pathways. WG and ICM were associated with positive indirect effects, whereas MLP-C was associated with a negative indirect effect. Third, the analysis further clarifies the distinction between ICM and moral licensing. MLP-C and ICM were only weakly negatively related, suggesting that responsibility completion and identity consistency are better understood as distinct rather than opposite forms of moral self-regulation. Their contrasting moderation patterns further show that PMI weakens the GCO–MLP-C association while strengthening the GCO–ICM association.
In addition to these substantive contributions, the study provides a methodological robustness check for the potential overlap between ICM and PIEP. Because two ICM items contained intention-like wording, the main analysis was repeated after removing those items. The ICM–PIEP association and the indirect GCO–ICM–PIEP association remained significant, while the reduced ICM–PIEP HTMT value also remained below the conventional threshold. This sensitivity analysis does not constitute a new measurement method or a validated alternative ICM scale, but it provides additional evidence that the observed ICM pathway is not solely attributable to the two potentially overlapping items.
The exploratory LPA adds a hypothesis-generating, person-centered perspective to the variable-centered analysis by identifying distinct psychological configurations associated with different levels of PIEP. Because these profiles were derived from the present sample, however, they should not yet be treated as stable consumer types. Replication in independent samples is needed to determine whether similar configurations emerge consistently across populations and settings.

5.2. Managerial and Policy Implications

For practice, the most immediate implication concerns how sustainability messages are framed. Communications that present a single green purchase as evidence that consumers have already fulfilled their moral responsibility may inadvertently encourage a sense of completion. A more appropriate approach is to portray responsible consumption as an ongoing commitment, reinforced by credible information about its environmental or social consequences and by identity-consistent cues that encourage continuity across ethical domains. Because the present evidence is based on purchase intentions measured in a cross-sectional survey, however, these implications should be viewed as directions for future message design and experimental testing rather than as evidence that such interventions will necessarily change actual purchasing behavior.
The exploratory profile results also point to the possible value of psychologically informed consumer segmentation, although administering lengthy psychological scales would rarely be feasible in routine practice. Organizations could instead draw on less intrusive behavioral or engagement-based indicators, such as reactions to different message frames, participation in sustainability initiatives, or patterns of involvement across responsible product categories, to support broader segmentation efforts. These indicators should not be regarded as direct proxies for the latent profiles identified in this study, particularly because those profiles still require validation in independent samples. They may nevertheless provide useful practical cues for developing and testing more differentiated sustainability communication strategies.
The identity-based implications also raise an important ethical consideration. Communication designed to encourage consistency with a responsible self-concept should preserve consumer autonomy rather than rely on guilt, moral pressure, or claims that purchasing particular products reflects a person’s moral worth. More transparent and non-coercive approaches, which provide credible information while leaving consumers free to make their own choices, are preferable to manipulative forms of moral framing. Before such strategies are adopted on a wider scale, future field and experimental research should assess not only their behavioral effectiveness but also their ethical acceptability.

5.3. Limitations and Future Research

Several limitations should be considered. First, the cross-sectional, self-reported design does not establish temporal ordering or causality. GCO reflects a general self-reported orientation rather than objectively observed prior behavior, while PIEP captures purchase intention rather than subsequent purchase behavior. Accordingly, the findings should be interpreted as statistical associations rather than evidence of actual behavioral spillover. Future research should employ longitudinal, experimental, field, or transaction-based designs to examine whether these associations translate into actual behavior.
Second, all core constructs were measured within the same survey. Although the CFA model comparison and Harman’s single-factor diagnostic reduce concern that one general factor dominated the results, same-source survey data cannot rule out common method variance [61]. The models also did not capture every individual difference that may be relevant to ethical consumption. Broader moral values, environmental identity, ethical consumption involvement, or domain-specific literacy may account for additional variation in GCO and PIEP. Although AVO, SN, demographic characteristics, and previous ethical product purchase experience were included as controls, residual confounding cannot be ruled out. Future research could combine self-reported psychological measures with behavioral observations, temporally separated measurements, or marker-variable designs [62] and include a wider set of theoretically relevant covariates. Because several related hypotheses were examined within the same study, the primary coefficient-based tests were additionally subjected to the Benjamini–Hochberg false discovery rate correction. All primary conclusions remained unchanged after adjustment. The indirect and moderated indirect effects were evaluated separately using bootstrap confidence intervals. The six BCH pairwise comparisons from the exploratory LPA were treated as a separate exploratory family and were also subjected to Benjamini–Hochberg adjustment.
Third, data were collected through Wenjuanxing, a single online survey platform in China. Information on individuals who did not participate in or complete the survey was unavailable, so potential nonresponse bias could not be assessed directly. Because there was no fixed sampling frame and the number of individuals exposed to the survey invitation was unknown, a conventional response rate could not be calculated. Future studies could address these limitations by using alternative recruitment channels, multiple survey platforms, or probability-based sampling. The income distribution also limits generalizability across economic strata. Respondents with monthly incomes below RMB 3000 accounted for only 3.0% of the sample (n = 18), making it difficult to determine whether the observed associations extend to lower-income consumers who may face greater affordability constraints when considering ethical products. This may be especially relevant to the identity-consistency pathway. Consumers may view responsible consumption as part of who they are, yet stronger financial constraints could make it more difficult for that identity-based motivation to translate into purchase intentions toward ethical products, particularly when such products involve price premiums. Although monthly income was controlled for in the main analyses, future studies should recruit more balanced samples across income groups and examine whether income and purchasing capacity condition the strength of the observed associations, especially the GCO–ICM–PIEP pathway.
Fourth, the operationalization of ICM requires further refinement. In particular, ICM3 and ICM4 refer to maintaining responsible choices and ethical standards in future consumption contexts and may therefore overlap semantically with PIEP. The item-deletion sensitivity test partially addressed this concern: after deleting ICM3 and ICM4, the reduced two-item ICM scale remained reliable (Cronbach’s alpha = 0.838), although reliability estimates based on only two items are generally less stable and should be interpreted with caution. The ICM → PIEP association remained positive (b = 0.198, SE = 0.033, t = 5.979), the indirect association remained significant (b = 0.058, 95% bootstrap CI [0.036, 0.083]), and the reduced ICM-PIEP HTMT value remained below 0.85 (0.666). This evidence does not replace a full validation of a dedicated ICM scale, but it reduces the concern that the positive indirect association is driven only by the two potentially overlapping items. Future studies should develop and validate ICM measures that more clearly separate identity-consistency processes from behavioral intention.
Finally, the LPA was exploratory and based on the present sample. Although the four-profile solution provided a parsimonious and interpretable representation of consumer heterogeneity, these profiles should not be regarded as universal consumer types. Future research should examine their replicability and stability using independent, longitudinal, and cross-cultural samples.

Author Contributions

Conceptualization, X.G. and J.Z.; methodology, X.G. and X.Q.; software, X.G.; validation, X.G., X.Q. and J.Z.; formal analysis, X.G.; investigation, X.G.; data curation, X.G.; writing—original draft preparation, X.G.; writing—review and editing, X.Q. and J.Z.; visualization, X.G.; supervision, J.Z.; project administration, J.Z. All authors have read and agreed to the published version of the manuscript.

Funding

This research received no external funding.

Institutional Review Board Statement

This study involved an anonymous online survey with voluntary participation and did not collect any personally identifiable information. Therefore, formal ethical review and approval were not required according to institutional guidelines.

Informed Consent Statement

Informed consent was obtained from all subjects involved in the study.

Data Availability Statement

The dataset analyzed in this study is available from the corresponding author upon reasonable request.

Acknowledgments

The authors would like to thank all participants who voluntarily participated in this survey.

Conflicts of Interest

The authors declare no conflicts of interest.

Appendix A. Survey Instrument and Variable Measurement

Table A1. Definitions and descriptions of variables.
Variable TypeVariableDefinition
Independent variableGreen consumption orientation (GCO)Consumers’ self-reported tendency to incorporate environmental considerations into consumption decisions and to prefer environmentally responsible products and practices.
Dependent variablePurchase intentions toward other ethical products (PIEP)Refers to consumers’ intentions to purchase ethically oriented products beyond the environmental domain, including fair-trade products, labor-rights-related products, animal-welfare products, and products associated with corporate social responsibility. This variable captures consumers’ purchase intentions across ethical consumption domains beyond green consumption.
Mediating variableWarm glow (WG)Refers to the positive emotional rewards associated with green consumption, including pleasure, satisfaction, meaningfulness, and fulfillment. This variable captures the intrinsic emotional benefits associated with environmentally responsible consumption.
Compensatory moral licensing (MLP-C)Refers to a responsibility-completion perception whereby consumers perceive that environmentally responsible consumption has already fulfilled part of their moral responsibility, potentially reducing the perceived need to maintain similarly demanding ethical standards in other consumption contexts.
Identity-Consistency Mechanism (ICM) Refers to an identity-consistency perception in which environmentally responsible consumption is associated with a stronger self-understanding as a responsible individual and with a tendency to maintain consistency with that identity across other ethical consumption contexts.
Moderating variablePersonal moral identity (PMI)Refers to the extent to which moral traits are integrated into consumers’ self-concept. Individuals with higher PMI place greater importance on moral characteristics such as honesty, responsibility, care, and fairness and tend to place greater emphasis on consistency with their moral self-concept.
Control variableAltruistic value orientation (AVO)Refers to the extent to which individuals value others’ well-being, social justice, future generations, and public interests. As a prosocial value orientation, AVO is included as a covariate in the main analyses.
Social norms (SN)Refers to consumers’ perceived expectations regarding sustainable and responsible consumption from significant others, social environments, or social groups.
GenderRefers to respondents’ gender category.
AgeRefers to respondents’ age group.
Monthly incomeRefers to respondents’ monthly income level.
Education levelRefers to respondents’ highest completed or current education level.
Previous ethical product purchase experienceRefers to whether respondents have previously purchased green products or related ethical products within the previous six months.
Table A2. Questionnaire design and measurement items.
VariableIndicatorItemReference
Green Consumption Orientation (GCO)GCO1When purchasing products, I consider the potential environmental impacts of the products.[6]
GCO2My concern about environmental issues influences my purchase decisions.
GCO3I pay attention to whether my consumption causes resource waste.
GCO4Even when environmentally friendly products involve higher prices, less convenience, or fewer choices, I am willing to prioritize them.
Warm Glow
(WG)
WG1Purchasing environmentally friendly products makes me feel happy.[26,27,43]
WG2Purchasing environmentally friendly products gives me a sense of inner satisfaction.
WG3Purchasing environmentally friendly products makes me feel that my choice is meaningful and valuable.
WG4Purchasing environmentally friendly products makes me satisfied with my consumption choices.
Compensatory Moral Licensing (MLP-C)MLP-C1After purchasing environmentally friendly products, I feel that I have already made some contribution, so I can relax my standards in subsequent consumption.[23,28,32]
MLP-C2After purchasing environmentally friendly products, I feel that I do not need to choose environmentally or ethically responsible products every time in the future.
MLP-C3After purchasing environmentally friendly products, I would not feel much psychological burden if I later choose ordinary products.
MLP-C4After purchasing environmentally friendly products, I feel that I have already fulfilled part of my responsibility and therefore do not need to consider environmental or ethical factors in every subsequent purchase.
Identity-Consistency Mechanism (ICM)ICM1After purchasing environmentally friendly products, I feel that this choice reflects that I am a responsible consumer.
ICM2Purchasing environmentally friendly products strengthens my perception of myself as a moral and responsible person.
ICM3After purchasing environmentally friendly products, I am more willing to maintain responsible choices in future consumption.
ICM4After purchasing environmentally friendly products, I hope to maintain consistent ethical standards in other consumption contexts.
Personal Moral Identity (PMI)PMI1I believe that I should be a responsible and moral person.[49,50,51]
PMI2Acting according to my moral principles is an important criterion for evaluating myself.
PMI3I feel uncomfortable when my behaviors conflict with my internal moral standards.
PMI4When making consumption or life decisions, I usually consider my moral principles.
Altruistic Value Orientation (AVO)AVO1I believe that decisions should consider the interests of others.[49]
AVO2I believe that social fairness is important.
AVO3I believe that we should care about the living environment of future generations.
AVO4I believe that individuals should minimize the negative impacts of their actions on society and the environment.
Social Norms (SN)SN1People who are important to me generally expect me to purchase environmentally friendly products.[1,13,58]
SN2People around me usually approve when I choose environmentally friendly products.
SN3In my social circle, purchasing environmentally friendly products is generally considered positive behavior.
SN4The opinions of people around me make me more willing to engage in environmentally friendly consumption.
Purchase Intentions toward Other Ethical Products (PIEP)PIEP1I intend to purchase fair-trade products in the future.[49]
PIEP2I intend to purchase products that emphasize labor rights or employee welfare in the future.
PIEP3I intend to purchase products that consider animal welfare or social welfare values in the future.
PIEP4Even if the price is slightly higher, I would consider purchasing products with social responsibility attributes.
Note: The items originally developed under a licensing label are reported here under the construct label Identity-Consistency Mechanism (ICM) to reflect the revised theoretical interpretation of the construct.

References

  1. White, K.; Habib, R.; Hardisty, D.J. How to SHIFT consumer behaviors to be more sustainable: A literature review and guiding framework. J. Mark. 2019, 83, 22–49. [Google Scholar] [CrossRef] [Scilit]
  2. Syed, S.; Acquaye, A.; Khalfan, M.M.; Obuobisa-Darko, T.; Yamoah, F.A. Decoding sustainable consumption behavior: A systematic review of theories and models and provision of a guidance framework. Resour. Conserv. Recycl. Adv. 2024, 23, 200232. [Google Scholar] [CrossRef] [Scilit]
  3. Bergianti, F. Sustainable consumption promotion: A comprehensive literature review. J. Consum. Behav. 2025, 24, 2692–2710. [Google Scholar] [CrossRef] [Scilit]
  4. Joshi, Y.; Rahman, Z. Factors affecting green purchase behaviour and future research directions. Int. Strateg. Manag. Rev. 2015, 3, 128–143. [Google Scholar] [CrossRef] [Scilit]
  5. Zhao, X.; Fan, L.; Xu, Y. An investigation of determinants of green consumption behavior: An extended theory of planned behavior. Innov. Green Dev. 2025, 4, 100198. [Google Scholar] [CrossRef] [Scilit]
  6. Haws, K.L.; Winterich, K.P.; Naylor, R.W. Seeing the world through green-tinted glasses: Green consumption values and responses to environmentally friendly products. J. Consum. Psychol. 2014, 24, 336–354. [Google Scholar] [CrossRef] [Scilit]
  7. Diamantopoulos, A.; Schlegelmilch, B.B.; Sinkovics, R.R.; Bohlen, G.M. Can socio-demographics still play a role in profiling green consumers? A review of the evidence and an empirical investigation. J. Bus. Res. 2003, 56, 465–480. [Google Scholar] [CrossRef] [Scilit]
  8. Chekima, B.; Syed Khalid Wafa, S.A.W.; Igau, O.A.; Chekima, S.; Sondoh, S.L. Examining green consumerism motivational drivers: Does premium price and demographics matter to green purchasing? J. Clean. Prod. 2016, 112, 3436–3450. [Google Scholar] [CrossRef] [Scilit]
  9. Hu, X.; Meng, H. Digital literacy and green consumption behavior: Exploring dual psychological mechanisms. J. Consum. Behav. 2023, 22, 272–287. [Google Scholar] [CrossRef] [Scilit]
  10. Lu, J.; Li, H. The impact of environmental corruption on green consumption: A quantitative analysis based on China’s Judicial Document Network and Baidu Index. Socio-Econ. Plan. Sci. 2023, 86, 101451. [Google Scholar] [CrossRef] [Scilit]
  11. Meinhold, J.L.; Malkus, A.J. Adolescent environmental behaviors: Can knowledge, attitudes, and self-efficacy make a difference? Environ. Behav. 2005, 37, 511–532. [Google Scholar] [CrossRef] [Scilit]
  12. Pagiaslis, A.; Krontalis, A.K. Green Consumption Behavior Antecedents: Environmental Concern, Knowledge, and Beliefs. Psychol. Mark. 2014, 31, 335–348. [Google Scholar] [CrossRef] [Scilit]
  13. Ajzen, I. The theory of planned behavior. Organ. Behav. Hum. Decis. Processes 1991, 50, 179–211. [Google Scholar] [CrossRef] [Scilit]
  14. Testa, F.; Iraldo, F.; Vaccari, A.; Ferrari, E. Why eco-labels can be effective marketing tools: Evidence from a study on Italian consumers. Bus. Strategy Environ. 2015, 24, 252–265. [Google Scholar] [CrossRef] [Scilit]
  15. Auger, P.; Devinney, T.M. Do what consumers say matter? The misalignment of preferences with unconstrained ethical intentions. J. Bus. Ethics 2007, 76, 361–383. [Google Scholar] [CrossRef] [Scilit]
  16. Johnstone, M.-L.; Tan, L. Exploring the gap between consumers’ green rhetoric and purchasing behaviour. J. Bus. Ethics 2015, 132, 311–328. [Google Scholar] [CrossRef] [Scilit]
  17. Ogiemwonyi, O.; Jan, M.T. The correlative influence of consumer ethical beliefs, environmental ethics, and moral obligation on green consumption behavior. Resour. Conserv. Recycl. Adv. 2023, 19, 200171. [Google Scholar] [CrossRef] [Scilit]
  18. Enginkaya, E.; Sağlam, M.H. Exploring the ethical values and social drivers behind consumer preferences for cruelty-free products. Front. Psychol. 2026, 16, 1660619. [Google Scholar] [CrossRef] [Scilit] [PubMed]
  19. Truelove, H.B.; Carrico, A.R.; Weber, E.U.; Raimi, K.T.; Vandenbergh, M.P. Positive and negative spillover of pro-environmental behavior: An integrative review and theoretical framework. Glob. Environ. Change 2014, 29, 127–138. [Google Scholar] [CrossRef] [Scilit]
  20. Behn, O.; Wichmann, J.; Leyer, M.; Schilling, A. Spillover effects in environmental behaviors: A scoping review about its antecedents, behaviors, and consequences. Curr. Psychol. 2025, 44, 3665–3689. [Google Scholar] [CrossRef] [Scilit]
  21. Maki, A.; Carrico, A.R.; Raimi, K.T.; Truelove, H.B.; Araujo, B.; Yeung, K.L. Meta-analysis of pro-environmental behaviour spillover. Nat. Sustain. 2019, 2, 307–315. [Google Scholar] [CrossRef] [Scilit]
  22. Geiger, S.J.; Brick, C.; Nalborczyk, L.; Bosshard, A.; Jostmann, N.B. More green than gray? Toward a sustainable overview of environmental spillover effects: A Bayesian meta-analysis. J. Environ. Psychol. 2021, 78, 101694. [Google Scholar] [CrossRef] [Scilit]
  23. Conway, P.; Peetz, J. When does feeling moral actually make you a better person? Conceptual abstraction moderates whether past moral deeds motivate consistency or compensatory behavior. Personal. Soc. Psychol. Bull. 2012, 38, 907–919. [Google Scholar] [CrossRef] [Scilit] [PubMed]
  24. Mullen, E.; Monin, B. Consistency versus licensing effects of past moral behavior. Annu. Rev. Psychol. 2016, 67, 363–385. [Google Scholar] [CrossRef] [Scilit] [PubMed]
  25. Andreoni, J. Impure altruism and donations to public goods: A theory of warm-glow giving. Econ. J. 1990, 100, 464–477. [Google Scholar] [CrossRef] [Scilit]
  26. Taufik, D.; Bolderdijk, J.W.; Steg, L. Acting green elicits a literal warm glow. Nat. Clim. Change 2015, 5, 37–40. [Google Scholar] [CrossRef] [Scilit]
  27. Hartmann, P.; Eisend, M.; Apaolaza, V.; D’Souza, C. Warm glow vs. altruistic values: How important is intrinsic emotional reward in proenvironmental behavior? J. Environ. Psychol. 2017, 52, 43–55. [Google Scholar] [CrossRef] [Scilit]
  28. Merritt, A.C.; Effron, D.A.; Monin, B. Moral self-licensing: When being good frees us to be bad. Soc. Personal. Psychol. Compass 2010, 4, 344–357. [Google Scholar] [CrossRef] [Scilit]
  29. Bem, D.J. Self-perception theory. In Advances in Experimental Social Psychology; Academic Press: Cambridge, MA, USA, 1972; Volume 6, pp. 1–62. [Google Scholar] [CrossRef] [Scilit]
  30. Blasi, A. Moral cognition and moral action: A theoretical perspective. Dev. Rev. 1983, 3, 178–210. [Google Scholar] [CrossRef] [Scilit]
  31. Oyserman, D. Identity-based motivation: Implications for action-readiness, procedural-readiness, and consumer behavior. J. Consum. Psychol. 2009, 19, 250–260. [Google Scholar] [CrossRef] [Scilit]
  32. Blanken, I.; van de Ven, N.; Zeelenberg, M. A meta-analytic review of moral licensing. Personal. Soc. Psychol. Bull. 2015, 41, 540–558. [Google Scholar] [CrossRef] [Scilit] [PubMed]
  33. Sachdeva, S.; Iliev, R.; Medin, D.L. Sinning saints and saintly sinners: The paradox of moral self-regulation. Psychol. Sci. 2009, 20, 523–528. [Google Scholar] [PubMed]
  34. Zhong, C.-B.; Liljenquist, K. Washing away your sins: Threatened morality and physical cleansing. Science 2006, 313, 1451–1452. [Google Scholar] [CrossRef] [Scilit] [PubMed]
  35. Whitmarsh, L.; O’Neill, S. Green identity, green living? The role of pro-environmental self-identity in determining consistency across diverse pro-environmental behaviours. J. Environ. Psychol. 2010, 30, 305–314. [Google Scholar] [CrossRef] [Scilit]
  36. van der Werff, E.; Steg, L.; Keizer, K. It is a moral issue: The relationship between environmental self-identity, obligation-based intrinsic motivation and pro-environmental behaviour. Glob. Environ. Change 2013, 23, 1258–1265. [Google Scholar] [CrossRef] [Scilit]
  37. van der Werff, E.; Steg, L.; Keizer, K. I am what I am, by looking past the present: The influence of biospheric values and past behavior on environmental self-identity. Environ. Behav. 2014, 46, 626–657. [Google Scholar] [CrossRef] [Scilit]
  38. Berger, J.; Heath, C. Where consumers diverge from others: Identity signaling and product domains. J. Consum. Res. 2007, 34, 121–134. [Google Scholar] [CrossRef] [Scilit]
  39. Reed, A., II; Forehand, M.R.; Puntoni, S.; Warlop, L. Identity-based consumer behavior. Int. J. Res. Mark. 2012, 29, 310–321. [Google Scholar] [CrossRef] [Scilit]
  40. Thøgersen, J.; Crompton, T. Simple and painless? The limitations of spillover in environmental campaigning. J. Consum. Policy 2009, 32, 141–163. [Google Scholar] [CrossRef] [Scilit]
  41. Venhoeven, L.A.; Bolderdijk, J.W.; Steg, L. Why acting environmentally-friendly feels good: Exploring the role of self-image. Front. Psychol. 2020, 11, 1618. [Google Scholar]
  42. Giebelhausen, M.; Chun, H.H.; Cronin, J.J., Jr.; Hult, G.T.M. Adjusting the warm-glow thermostat: How incentivizing participation in voluntary green programs moderates their impact on service satisfaction. J. Mark. 2016, 80, 56–71. [Google Scholar] [CrossRef] [Scilit]
  43. Jerit, J.; Shin, H.; Barabas, J. Warm glow feelings can promote green behavior. PNAS Nexus 2024, 3, 509. [Google Scholar] [CrossRef] [Scilit] [PubMed]
  44. Monin, B.; Miller, D.T. Moral credentials and the expression of prejudice. J. Personal. Soc. Psychol. 2001, 81, 33–43. [Google Scholar] [CrossRef] [Scilit]
  45. Jordan, J.; Mullen, E.; Murnighan, J.K. Striving for the moral self: The effects of recalling past moral actions on future moral behavior. Personal. Soc. Psychol. Bull. 2011, 37, 701–713. [Google Scholar] [CrossRef] [Scilit] [PubMed]
  46. Mazar, N.; Zhong, C.-B. Do green products make us better people? Psychol. Sci. 2010, 21, 494–498. [Google Scholar] [CrossRef] [Scilit] [PubMed]
  47. Cornelissen, G.; Bashshur, M.R.; Rode, J.; Le Menestrel, M. Rules or consequences? The role of ethical mind-sets in moral dynamics. Psychol. Sci. 2013, 24, 482–488. [Google Scholar] [CrossRef] [Scilit] [PubMed]
  48. Reed, A., II; Aquino, K.; Levy, E. Moral identity and judgments of charitable behaviors. J. Mark. 2007, 71, 178–193. [Google Scholar] [CrossRef] [Scilit]
  49. Li, D.; Cheng, G.; Wang, C. The influence of moral identity on green consumption. Front. Psychol. 2022, 13, 1020333. [Google Scholar] [CrossRef] [Scilit] [PubMed]
  50. Salciuviene, L.; Banytė, J.; Vilkas, M.; Dovalienė, A.; Gravelines, Ž. Moral identity and engagement in sustainable consumption. J. Consum. Mark. 2022, 39, 445–459. [Google Scholar] [CrossRef] [Scilit]
  51. Aquino, K.; Reed, A., II. The self-importance of moral identity. J. Personal. Soc. Psychol. 2002, 83, 1423–1440. [Google Scholar] [CrossRef] [PubMed]
  52. Aquino, K.; Freeman, D.; Reed, A., II; Lim, V.K.G.; Felps, W. Testing a social-cognitive model of moral behavior: The interactive influence of situations and moral identity centrality. J. Personal. Soc. Psychol. 2009, 97, 123–141. [Google Scholar] [CrossRef] [Scilit] [PubMed]
  53. Hardy, S.A.; Carlo, G. Moral identity: What is it, how does it develop, and is it linked to moral action? Child Dev. Perspect. 2011, 5, 212–218. [Google Scholar] [CrossRef] [Scilit]
  54. Fan, L.; Zhou, Y.; Lin, S.; Sun, B. Stay hungry for morality: The inhibitory effect of high moral identity and moral elevation on moral licensing. J. Soc. Psychol. 2025, 165, 896–910. [Google Scholar] [CrossRef] [Scilit] [PubMed]
  55. Goering, M.; Espinoza, C.N.; Mercier, A.; Eason, E.K.; Johnson, C.W.; Richter, C.G. Moral identity in relation to emotional well-being: A meta-analysis. Front. Psychol. 2024, 15, 1346732. [Google Scholar] [CrossRef] [Scilit] [PubMed]
  56. Stern, P.C. Toward a coherent theory of environmentally significant behavior. J. Soc. Issues 2000, 56, 407–424. [Google Scholar] [CrossRef] [Scilit]
  57. Farrow, K.; Grolleau, G.; Ibanez, L. Social norms and pro-environmental behavior: A review of the evidence. Ecol. Econ. 2017, 140, 1–13. [Google Scholar] [CrossRef] [Scilit]
  58. Schlegelmilch, B.B.; Teerakapibal, S. Social norms and sustainable behavior: A conceptual model integrating culture, self-construal, and awareness. Sustainability 2025, 17, 10239. [Google Scholar] [CrossRef] [Scilit]
  59. Henseler, J.; Ringle, C.M.; Sarstedt, M. A new criterion for assessing discriminant validity in variance-based structural equation modeling. J. Acad. Mark. Sci. 2015, 43, 115–135. [Google Scholar] [CrossRef] [Scilit]
  60. Hayes, A.F. An index and test of linear moderated mediation. Multivar. Behav. Res. 2015, 50, 1–22. [Google Scholar] [CrossRef] [Scilit] [PubMed]
  61. Podsakoff, P.M.; MacKenzie, S.B.; Lee, J.-Y.; Podsakoff, N.P. Common method biases in behavioral research: A critical review of the literature and recommended remedies. J. Appl. Psychol. 2003, 88, 879–903. [Google Scholar] [CrossRef] [Scilit] [PubMed]
  62. Lindell, M.K.; Whitney, D.J. Accounting for common method variance in cross-sectional research designs. J. Appl. Psychol. 2001, 86, 114–121. [Google Scholar] [CrossRef] [Scilit] [PubMed]
Figure 1. Research model.
Sustainability 18 09161 g001
Figure 2. Moderating Role of PMI in the Association between GCO and MLP-C.
Sustainability 18 09161 g002
Figure 3. Moderating Role of PMI in the Association between GCO and ICM.
Sustainability 18 09161 g003
Figure 4. Standardized indicator scores across the four latent profiles.
Sustainability 18 09161 g004
Table 1. Sample characteristics.
VariableCategoryFrequencyPercentage (%)
GenderMale32354.0
Female27546.0
Age18–25 years old13522.5
26–35 years old23439.1
36–45 years old19432.4
46 years old and above355.9
Monthly incomeBelow RMB 3000183.0
RMB 3000–49998414.0
RMB 5000–999925542.6
RMB 10,000–14,99920734.6
RMB 15,000 and above345.7
Education levelHigh school or below7312.2
Junior college12220.4
Bachelor’s degree32354.0
Master’s degree or above8013.4
Occupation typeGovernment/public institution or corporate employees34157.0
Students386.4
Teachers559.2
Commercial and service employees10116.9
Self-employed/freelance workers315.2
Other occupations325.4
Previous ethical product purchase experienceYes41469.2
No18430.8
Consumption consideration factorsWhether the price is appropriate36260.5
Whether the quality is reliable36661.2
Whether the brand is trustworthy29148.7
Whether the product is convenient to use18530.9
Whether the product has environmentally friendly, energy-saving, or low-carbon features19332.3
Whether the packaging or materials are biodegradable or recyclable17929.9
Whether the product involves fair trade, labor rights, animal welfare, or social responsibility considerations7813.0
Whether people around them recognize the product16527.6
Whether purchasing the product provides a sense of reassurance or satisfaction17829.8
Other factors589.7
Note: n = 598. The “consideration factors” item allowed multiple responses. Percentages for each option were calculated based on the total valid sample; therefore, the percentages do not sum to 100%.
Table 2. Means, standard deviations, and correlations among the study variables.
Variables(1)(2)(3)(4)(5)(6)(7)(8)(9)(10)(11)(12)(13)
(1) Gender1
(2) Age−0.0011
(3) Monthly income−0.0320.167 **1
(4) Education level−0.0300.226 **0.187 **1
(5) Previous ethical product purchase experience−0.0410.007−0.007−0.0131
(6) GCO−0.0310.0230.0130.0200.0371
(7) WG0.0130.0240.094 *−0.0020.0770.603 **1
(8) MLP-C−0.062−0.031−0.030−0.008−0.0320.173 **−0.088 *1
(9) ICM−0.008−0.0020.0470.0220.0700.552 **0.609 **−0.110 **1
(10) PMI−0.0180.0110.0200.0040.0350.466 **0.531 **−0.0710.629 **1
(11) PIEP−0.0150.0660.0360.0550.115 **0.487 **0.597 **−0.260 **0.623 **0.540 **1
(12) AVO−0.0110.0170.089 *0.0170.0780.487 **0.593 **−0.0550.619 **0.557 **0.510 **1
(13) SN0.026−0.0040.050−0.0590.099 *0.463 **0.551 **−0.091 *0.590 **0.532 **0.472 **0.553 **1
Mean1.4603.2003.2602.6901.3104.2174.7083.6823.9133.8754.1553.8954.039
SD0.4990.8950.8770.8540.4621.3381.5861.2071.4641.4361.2721.3951.308
Note: GCO = green consumption orientation; WG = warm glow; MLP-C = compensatory moral licensing; ICM = identity-consistency mechanism; PMI = personal moral identity; PIEP = purchase intentions toward other ethical products; AVO = altruistic value orientation; SN = social norms. ** p < 0.01, * p < 0.05.
Table 3. Tolerance and variance inflation factor (VIF) values for variables included in the regression analyses.
VariableToleranceVIF
Gender0.9891.011
Age0.9301.075
Monthly income0.9301.075
Education level0.9151.093
AVO0.4972.011
SN0.5391.855
Previous ethical product purchase experience0.9841.016
GCO0.5071.971
WG0.4502.220
MLP-C0.8781.139
ICM0.4142.417
PMI0.5251.905
Note: VIF = variance inflation factor.
Table 4. Reliability analysis of the measurement scales.
VariablesItemCITCCAIDCronbach’s α
GCOGCO10.7420.8510.883
GCO20.7480.848
GCO30.7260.856
GCO40.7670.842
WGWG10.8400.9220.938
WG20.8670.913
WG30.8680.913
WG40.8320.925
MLP-CMLP-C10.8180.8550.900
MLP-C20.7340.887
MLP-C30.7680.873
MLP-C40.7860.867
ICMICM10.7910.9090.922
ICM20.8210.898
ICM30.8380.892
ICM40.8310.895
PMIPMI10.7780.9050.918
PMI20.8310.887
PMI30.8350.886
PMI40.8030.897
PIEPPIEP10.8480.8710.913
PIEP20.7640.900
PIEP30.7970.889
PIEP40.7980.889
AVOAVO10.7990.8710.905
AVO20.7890.875
AVO30.7810.878
AVO40.7720.881
SNSN10.7460.8280.872
SN20.7610.822
SN30.6950.848
SN40.7040.845
Note: CITC = corrected item–total correlation; CAID = Cronbach’s α if item deleted.
Table 5. KMO and Bartlett’s test.
KMO0.953
Bartlett’s test of sphericityApproximate Chi-square (χ2)15,082.972
Degrees of freedom (df)496
Significance (p-value)<0.001
Note: n = 598.
Table 6. Total variance explained by exploratory factor analysis.
FactorInitial EigenvaluesExtraction Sums of Squared LoadingsRotation Sum of Squared Loadings
TotalVariance (%)Cumulative (%)TotalVariance (%)Cumulative (%)Total
113.62942.59042.59013.35541.73341.73310.021
23.51810.99453.5833.21610.05251.7853.238
31.8075.64659.2291.5264.76956.5548.456
41.5614.88064.1091.2844.01160.5658.653
51.3544.23068.3391.0333.22963.7948.015
61.2043.76172.1000.9653.01766.8149.461
71.0783.36875.4680.7892.46569.2768.597
81.0043.13678.6040.7292.27971.5558.017
90.4931.54180.145
100.4321.35181.496
110.4181.30782.803
120.4011.25584.057
130.3671.14885.206
140.3491.09286.298
150.3341.04587.343
160.3201.00088.343
170.3030.94689.288
180.2970.92890.216
190.2850.89091.106
200.2750.85991.965
210.2600.81392.778
220.2560.79993.577
230.2470.77294.349
240.2440.76195.110
250.2290.71595.825
260.2210.69096.515
270.2130.66697.181
280.2100.65597.837
290.1970.61698.452
300.1880.58699.038
310.1640.51299.550
320.1440.450100.000
Note: n = 598. Principal axis factoring (PAF) was used as the common-factor extraction method. Eight factors with initial eigenvalues greater than 1 were retained, accounting for 71.555% of the variance in the common-factor solution.
Table 7. Pattern matrix of the exploratory factor analysis.
ItemsFactor
12345678
GCO1 −0.801
GCO2 −0.740
GCO3 −0.736
GCO4 −0.846
WG1 −0.792
WG2 −0.903
WG3 −0.909
WG4 −0.791
MLP-C1 0.868
MLP-C2 0.777
MLP-C3 0.824
MLP-C4 0.850
ICM10.774
ICM20.850
ICM30.847
ICM40.802
PMI1 0.753
PMI2 0.837
PMI3 0.856
PMI4 0.822
PIEP1 0.897
PIEP2 0.729
PIEP3 0.824
PIEP4 0.763
AVO1 −0.833
AVO2 −0.787
AVO3 −0.775
AVO4 −0.765
SN1 0.809
SN2 0.787
SN3 0.696
SN4 0.717
Note: Factor loadings are based on the pattern matrix obtained using principal axis factoring (PAF) with Direct Oblimin oblique rotation and Kaiser normalization. Factor loadings with absolute values below 0.30 were suppressed.
Table 8. Model fit results of confirmatory factor analysis.
Modelχ2/dfRMSEASRMRCFITLI
Eight-factor model1.2290.0200.0200.9930.992
Seven-factor model6.4330.0950.2090.8390.819
Six-factor model7.2120.1020.0900.8130.793
One-factor model14.3060.1490.1120.5860.557
Note: χ2/df = chi-square to degrees-of-freedom ratio; RMSEA = root mean square error of approximation; SRMR = standardized root mean square residual; CFI = comparative fit index; TLI = Tucker–Lewis index.
Table 9. Convergent validity assessment.
VariablesItemStandardized LoadingSEtpCRAVE
GCOGCO10.8050.01845.914<0.0010.8840.655
GCO20.8160.01748.240<0.001
GCO30.7890.01842.671<0.001
GCO40.8270.01650.785<0.001
WGWG10.8800.01180.708<0.0010.9380.790
WG20.9020.00995.290<0.001
WG30.9020.00995.380<0.001
WG40.8720.01176.294<0.001
MLP-CMLP-C10.8810.01367.453<0.0010.9010.694
MLP-C20.7860.01842.945<0.001
MLP-C30.8220.01650.426<0.001
MLP-C40.8410.01555.312<0.001
ICMICM10.8300.01557.247<0.0010.9230.750
ICM20.8630.01269.447<0.001
ICM30.8870.01181.916<0.001
ICM40.8820.01178.535<0.001
PMIPMI10.8220.01553.767<0.0010.9190.739
PMI20.8820.01276.136<0.001
PMI30.8820.01275.951<0.001
PMI40.8500.01462.774<0.001
PIEPPIEP10.8990.01184.667<0.0010.9140.727
PIEP20.8120.01651.026<0.001
PIEP30.8440.01460.455<0.001
PIEP40.8530.01363.491<0.001
AVOAVO10.8510.01460.547<0.0010.9050.704
AVO20.8430.01558.041<0.001
AVO30.8370.01556.270<0.001
AVO40.8250.01652.720<0.001
SNSN10.8050.01844.373<0.0010.8730.632
SN20.8360.01650.971<0.001
SN30.7660.02037.887<0.001
SN40.7720.02038.688<0.001
Note: n = 598. GCO = green consumption orientation; WG = warm glow; MLP-C = compensatory moral licensing; ICM = identity-consistency mechanism; PMI = personal moral identity; PIEP = purchase intentions toward other ethical products; AVO = altruistic value orientation; SN = social norms. CR = composite reliability; AVE = average variance extracted. All standardized factor loadings were statistically significant at p < 0.001.
Table 10. Discriminant validity assessment using the Fornell–Larcker criterion.
VariableGCOWGMLP-CICMPMIPIEPAVOSN
GCO0.809
WG0.603 **0.889
MLP-C0.173 **−0.088 *0.833
ICM0.552 **0.609 **−0.110 **0.866
PMI0.466 **0.531 **−0.0710.629 **0.859
PIEP0.487 **0.597 **−0.260 **0.623 **0.540 **0.853
AVO0.487 **0.593 **−0.0550.619 **0.557 **0.510 **0.839
SN0.463 **0.551 **−0.091 *0.590 **0.532 **0.472 **0.553 **0.795
Note: Diagonal values in bold represent the square roots of the AVE; off-diagonal values represent inter-construct correlations based on composite scores. * p < 0.05; ** p < 0.01.
Table 11. Heterotrait–Monotrait Ratio (HTMT).
VariableGCOWGMLP-CICMPMIPIEPAVOSN
GCO
WG0.662
MLP-C0.1940.096
ICM0.6120.6550.121
PMI0.5190.5730.0780.683
PIEP0.5420.6460.2870.6790.589
AVO0.5450.6440.0630.6780.6110.561
SN0.5280.6100.1030.6580.5950.5290.623
Note: Values below 0.85 indicate satisfactory discriminant validity.
Table 12. Regression results for the direct associations.
VariablesWGMLP-CICMPIEP (Total)PIEP (Direct)
Constant0.061
(0.344)
4.001 ***
(0.361)
0.016
(0.317)
0.827 **
(0.315)
1.776 ***
(0.302)
GCO0.427 ***
(0.041)
0.275 ***
(0.043)
0.279 ***
(0.037)
0.247 ***
(0.037)
0.161 ***
(0.038)
WG 0.187 ***
(0.034)
MLP-C −0.241 ***
(0.032)
ICM 0.258 ***
(0.037)
AVO0.331 ***
(0.041)
−0.092 *
(0.043)
0.352 ***
(0.038)
0.243 ***
(0.038)
0.069
(0.036)
SN0.264 ***
(0.044)
−0.157 ***
(0.046)
0.322 ***
(0.040)
0.197 ***
(0.040)
0.027
(0.037)
Gender0.075
(0.091)
−0.123
(0.096)
−0.010
(0.084)
−0.015
(0.084)
−0.056
(0.073)
Age0.008
(0.053)
−0.043
(0.055)
−0.031
(0.048)
0.068
(0.048)
0.064
(0.042)
Monthly income0.100
(0.054)
−0.013
(0.056)
−0.005
(0.049)
−0.027
(0.049)
−0.047
(0.043)
Education level−0.022
(0.056)
−0.021
(0.058)
0.058
(0.051)
0.076
(0.051)
0.060
(0.044)
Previous ethical product purchase experience0.070
(0.099)
−0.052
(0.104)
0.021
(0.091)
0.178
(0.091)
0.147
(0.079)
R20.5160.0800.5190.3710.528
F78.6336.35479.47243.36759.569
p<0.001<0.001<0.001<0.001<0.001
Note: Unstandardized regression coefficients are reported, with standard errors in parentheses. * p < 0.05; ** p < 0.01; *** p < 0.001.
Table 13. Bootstrap results for direct and indirect associations.
Effect TypePathEffectSELLCIULCI
TotalGCO → PIEP0.2470.0370.1740.319
Direct effectGCO → PIEP0.1610.0380.0870.235
Indirect effectGCO → WG → PIEP0.0800.0160.0490.112
GCO → MLP-C → PIEP−0.0660.014−0.096−0.041
GCO → ICM → PIEP0.0720.0140.0480.101
Note: LLCI = lower limit of the 95% confidence interval; ULCI = upper limit of the 95% confidence interval. Indirect associations were estimated using 5000 bias-corrected bootstrap resamples.
Table 14. Moderating effects of PMI.
VariablesMLP-CPIEPICMPIEP
Constant5.076 ***
(0.363)
3.457 ***
(0.344)
1.770 ***
(0.304)
1.455 ***
(0.301)
GCO0.240 ***
(0.042)
0.331 ***
(0.036)
0.262 ***
(0.036)
0.150 ***
(0.036)
PMI−0.072
(0.042)
0.281 ***
(0.035)
GCO × PMI−0.170 ***
(0.025)
0.130 ***
(0.021)
MLP-C −0.308 ***
(0.034)
ICM 0.345 ***
(0.039)
AVO−0.057
(0.044)
0.215 ***
(0.036)
0.250 ***
(0.037)
0.122 **
(0.038)
SN−0.123 **
(0.046)
0.148 ***
(0.038)
0.228 ***
(0.038)
0.086 *
(0.040)
Gender−0.103
(0.092)
−0.053
(0.078)
−0.014
(0.078)
−0.011
(0.079)
Age−0.039
(0.053)
0.055
(0.045)
−0.036
(0.045)
0.079
(0.045)
Monthly income−0.034
(0.054)
−0.031
(0.046)
0.022
(0.045)
−0.025
(0.046)
Education level−0.009
(0.056)
0.069
(0.048)
0.043
(0.047)
0.056
(0.048)
Previous ethical product purchase experience−0.085
(0.100)
0.162
(0.085)
0.064
(0.084)
0.171 *
(0.085)
R20.1520.4490.5950.446
F10.49153.31786.04352.689
p<0.001<0.001<0.001<0.001
Note: Unstandardized regression coefficients are reported, with standard errors in parentheses. * p < 0.05; ** p < 0.01; *** p < 0.001.
Table 15. Simple slope analysis of the moderating effects of PMI.
PathLevel of PMIbSELLCIULCI
GCO → MLP-CLow PMI0.4830.0500.3840.582
High PMI−0.0040.061−0.1230.115
GCO → ICMLow PMI0.0750.042−0.0080.158
High PMI0.4490.0510.3490.548
Note: Low and high PMI represent values one standard deviation below and above the mean, respectively. LLCI = lower limit of the 95% confidence interval; ULCI = upper limit of the 95% confidence interval.
Table 16. Benjamini–Hochberg correction for the primary coefficient-based hypothesis tests.
HypothesisAssociationUnadjusted pBH-Adjusted pDecision
H1GCO → PIEP6.55 × 10−119.82 × 10⁻¹¹Supported
H2aGCO → WG6.21 × 10−245.59 × 10⁻²³Supported
H2bWG → PIEP4.79 × 10−84.79 × 10⁻⁸Supported
H3aGCO → MLP-C2.08 × 10−102.68 × 10⁻¹⁰Supported
H3bMLP-C → PIEP1.62 × 10−137.28 × 10⁻¹³Supported
H4aGCO → ICM2.49 × 10−137.46 × 10⁻¹³Supported
H4bICM → PIEP5.36 × 10−121.21 × 10⁻¹¹Supported
H5aGCO × PMI → MLP-C3.84 × 10−116.91 × 10⁻¹¹Supported
H5bGCO × PMI → ICM1.30 × 10−91.46 × 10⁻⁹Supported
Note: BH-adjusted p values were obtained using the Benjamini–Hochberg false discovery rate procedure applied to the nine primary coefficient-based hypothesis tests. Indirect effects (H2c, H3c, and H4c) and indices of moderated mediation were evaluated separately using 5000-resample bootstrap confidence intervals.
Table 17. Conditional Indirect Associations and Indices of Moderated Mediation.
Indirect PathPMI LevelEffectSEBootLLCIBootULCI
GCO → MLP-C → PIEPLow PMI−0.1490.024−0.196−0.104
High PMI0.0010.019−0.0350.039
Difference between high and low PMI0.1500.0280.0990.209
Index of moderated mediation0.0520.0100.0340.073
GCO → ICM → PIEPLow PMI0.0260.014−0.0010.053
High PMI0.1550.0250.1110.207
Difference between high and low PMI0.1290.0270.0810.185
Index of moderated mediation0.0450.0090.0280.064
Note: Low and high PMI represent values one standard deviation below and above the mean, respectively. BootLLCI and BootULCI represent the lower and upper limits of the bootstrap 95% confidence interval, respectively. Conditional indirect associations were estimated using 5000 bootstrap resamples.
Table 18. Cohen’s f2 Effect Sizes.
Relationshipf2
GCO → WG0.183
GCO → MLP-C0.056
GCO → ICM0.091
GCO → PIEP0.032
WG → PIEP0.051
MLP-C → PIEP0.098
ICM → PIEP0.086
PMI → MLP-C0.005
PMI → ICM0.109
GCO × PMI → MLP-C0.077
GCO × PMI → ICM0.064
AVO → WG0.113
AVO → MLP-C0.003
AVO → ICM0.082
AVO → PIEP0.006
SN → WG0.066
SN → MLP-C0.013
SN → ICM0.061
SN → PIEP0.001
Note: f2 = Cohen’s local effect size. Values of 0.02, 0.15, and 0.35 are commonly interpreted as small, medium, and large effects, respectively.
Table 19. Robustness check: re-estimation results without control variables.
VariablesWGMLP-CICMPIEP (Total)PIEP (Direct)
Constant1.694 ***
(0.171)
3.022 ***
(0.161)
1.365 ***
(0.165)
2.200 ***
(0.151)
2.187 ***
(0.174)
GCO0.715 ***
(0.039)
0.157 ***
(0.036)
0.604 ***
(0.037)
0.464 ***
(0.034)
0.175 ***
(0.038)
WG 0.209 ***
(0.032)
MLP-C −0.245 ***
(0.032)
ICM 0.293 ***
(0.033)
R20.3640.0300.3050.2380.516
F340.55418.480261.447185.620158.031
p<0.001<0.001<0.001<0.001<0.001
Note: Unstandardized regression coefficients are reported, with standard errors in parentheses. *** p < 0.001.
Table 20. Robustness check of the models without control variables.
VariablesMLP-CPIEP (via MLP-C)ICMPIEP (via ICM)
Constant3.836 ***
(0.052)
5.535 ***
(0.136)
3.792 ***
(0.047)
2.422 ***
(0.134)
GCO0.188 ***
(0.040)
0.522 ***
(0.032)
0.401 ***
(0.036)
0.196 ***
(0.036)
PMI−0.141 ***
(0.037)
0.467 ***
(0.033)
GCO × PMI−0.172 ***
(0.025)
0.136 ***
(0.023)
MLP-C −0.375 ***
(0.035)
ICM 0.443 ***
(0.033)
R20.1280.3600.5110.418
F28.959167.419206.477213.534
p<0.001<0.001<0.001<0.001
Note: Unstandardized regression coefficients are reported, with standard errors in parentheses. *** p < 0.001.
Table 21. Gender-based subgroup robustness analysis.
VariableWGMLP-CICMPIEPPIEP
MaleFemaleMaleFemaleMaleFemaleMaleFemaleMaleFemale
Constant2.382 ***
(0.425)
2.666 ***
(0.500)
2.934 ***
(0.466)
2.752 ***
(0.501)
2.863 ***
(0.386)
2.441 ***
(0.465)
2.453 ***
(0.399)
2.735 ***
(0.446)
1.948 ***
(0.417)
2.281 ***
(0.452)
GCO0.427 ***
(0.052)
0.426 ***
(0.066)
0.311 ***
(0.056)
0.234 ***
(0.066)
0.280 ***
(0.047)
0.276 ***
(0.061)
0.268 ***
(0.048)
0.204 **
(0.059)
0.185 ***
(0.051)
0.113
(0.058)
WG 0.209 ***
(0.047)
0.167 **
(0.050)
MLP-C −0.248 ***
(0.043)
−0.239 ***
(0.049)
ICM 0.257 ***
(0.052)
0.274 ***
(0.053)
AVO0.511 ***
(0.075)
0.399 ***
(0.091)
−0.076
(0.082)
−0.194 *
(0.092)
0.465 ***
(0.068)
0.529 ***
(0.085)
0.323 ***
(0.070)
0.366 ***
(0.082)
0.078
(0.068)
0.109
(0.076)
SN0.371 ***
(0.077)
0.338 ***
(0.086)
−0.293 **
(0.084)
−0.102
(0.086)
0.506 ***
(0.070)
0.336 ***
(0.080)
0.227 **
(0.072)
0.302 ***
(0.077)
−0.053
(0.069)
0.130
(0.070)
Age0.065
(0.070)
−0.052
(0.080)
−0.045
(0.077)
−0.041
(0.080)
0.017
(0.064)
−0.084
(0.074)
0.024
(0.066)
0.126
(0.071)
−0.005
(0.057)
0.147 *
(0.062)
Monthly income0.084
(0.069)
0.121
(0.085)
−0.003
(0.075)
−0.031
(0.085)
−0.052
(0.062)
0.060
(0.079)
−0.024
(0.064)
−0.029
(0.076)
−0.029
(0.056)
−0.073
(0.066)
Education level−0.068
(0.074)
0.029
(0.085)
−0.084
(0.081)
0.057
(0.085)
−0.016
(0.067)
0.132
(0.079)
0.074
(0.069)
0.085
(0.076)
0.072
(0.060)
0.058
(0.066)
Previous ethical product purchase experience0.144
(0.130)
−0.015
(0.156)
−0.101
(0.142)
−0.032
(0.156)
0.028
(0.117)
0.022
(0.145)
0.287 *
(0.121)
0.007
(0.139)
0.224 *
(0.106)
−0.004
(0.120)
R20.5420.4950.1030.0560.5410.5080.3550.3970.5170.556
F53.27437.3635.1732.26353.14239.33224.80825.09033.40633.046
p<0.001<0.001<0.0010.030<0.001<0.001<0.001<0.001<0.001<0.001
Note: Unstandardized regression coefficients are reported, with standard errors in parentheses. * p < 0.05; ** p < 0.01; *** p < 0.001.
Table 22. Gender-based robustness check of the moderation models.
VariablesMLP-CICM
MaleFemaleMaleFemale
Constant4.420 ***
(0.387)
3.982 ***
(0.403)
3.986 ***
(0.305)
3.212 ***
(0.357)
GCO0.381 ***
(0.074)
0.248 **
(0.090)
0.336 ***
(0.058)
0.365 ***
(0.080)
PMI−0.125
(0.080)
−0.057
(0.093)
0.423 ***
(0.063)
0.414 ***
(0.082)
GCO × PMI−0.365 ***
(0.065)
−0.277 ***
(0.073)
0.236 ***
(0.051)
0.271 ***
(0.065)
AVO−0.024
(0.081)
−0.153
(0.095)
0.326 ***
(0.064)
0.370 ***
(0.084)
SN−0.237 **
(0.083)
−0.075
(0.089)
0.380 ***
(0.065)
0.208 **
(0.078)
Age−0.049
(0.073)
−0.030
(0.078)
0.017
(0.057)
−0.095
(0.069)
Monthly income−0.013
(0.072)
−0.062
(0.084)
−0.047
(0.056)
0.117
(0.074)
Education level−0.060
(0.077)
0.060
(0.083)
−0.057
(0.061)
0.147 *
(0.073)
Previous ethical product purchase experience−0.128
(0.135)
−0.071
(0.153)
0.062
(0.106)
0.078
(0.135)
R20.1960.1050.6300.576
F8.4863.47259.17839.961
p<0.001<0.001<0.001<0.001
Note: Unstandardized regression coefficients are reported, with standard errors in parentheses. * p < 0.05; ** p < 0.01; *** p < 0.001.
Table 23. SEM-based robustness analysis.
RelationshipβSEtpHypothesis
GCO → PIEP0.1860.0543.4670.001H1
GCO → WG0.3880.0438.962<0.001H2a
WG → PIEP0.2420.0574.259<0.001H2b
GCO → MLP-C0.2990.0595.063<0.001H3a
MLP-C → PIEP−0.2580.035−7.392<0.001H3b
GCO → ICM0.2620.0357.445<0.001H4a
ICM → PIEP0.3450.0536.462<0.001H4b
PMI → MLP-C−0.0870.063−1.3780.168
GCO × PMI → MLP-C−0.3170.038−8.283<0.001H5a
PMI → ICM0.2540.0435.857<0.001
GCO × PMI → ICM0.2020.0336.178<0.001H5b
AVO → PIEP0.0590.0491.1920.233
SN → PIEP−0.0080.053−0.1430.886
Gender → PIEP−0.0260.030−0.8660.387
Age → PIEP0.0520.0301.7210.085
Monthly income → PIEP−0.0410.029−1.4050.160
Education level → PIEP0.0430.0321.3680.171
Previous ethical product purchase experience → PIEP0.0500.0311.6310.103
AVO → WG0.2940.0466.325<0.001
SN → WG0.2300.0504.575<0.001
Gender → WG0.0250.0290.8460.398
Age → WG0.0060.0310.1910.848
Monthly income → WG0.0570.0311.8490.064
Education level → WG−0.0120.033−0.3720.710
Previous ethical product purchase experience → WG0.0180.0300.6020.547
AVO → MLP-C−0.0840.066−1.2840.199
SN → MLP-C−0.1720.064−2.6990.007
Gender → MLP-C−0.0420.039−1.0740.283
Age → MLP-C−0.0270.039−0.6850.493
Monthly income → MLP-C−0.0250.039−0.6360.525
Education level → MLP-C−0.0080.042−0.2000.841
Previous ethical product purchase experience → MLP-C−0.0350.039−0.9030.366
AVO → ICM0.2450.0455.454<0.001
SN → ICM0.2170.0444.970<0.001
Gender → ICM−0.0050.027−0.1820.855
Age → ICM−0.0200.028−0.7140.476
Monthly income → ICM0.0120.0260.4800.632
Education level → ICM0.0250.0270.9040.366
Previous ethical product purchase experience → ICM0.0210.0280.7590.448
Note: β represents the standardized path coefficient; SE = standard error.
Table 24. SEM-based indirect association results.
Indirect PathEffectSELLCIULCIHypothesis
GCO → WG → PIEP0.0920.0230.0470.136H2c
GCO → MLP-C → PIEP−0.0750.019−0.113−0.038H3c
GCO → ICM → PIEP0.0880.0180.0520.124H4c
Note: LLCI = lower limit of the 95% confidence interval; ULCI = upper limit of the 95% confidence interval; SE = standard error.
Table 25. Fit indices for latent profile solutions.
ProfileAICBICaBICEntropyLMRpLMRBLRTpBLRTProportionAverage Posterior Probabilities
2 Class8869.9658953.4438893.1230.9211314.931<0.0011344.312<0.0010.498/0.502
3 Class8499.6398613.8728531.3290.922375.926<0.001384.326<0.0010.258/0.262/0.480
4 Class8270.5778415.5658310.8000.887237.749<0.001243.062<0.0010.249/0.261/0.200/0.2890.947/0.960/0.926/0.922
5 Class8228.2988404.0418277.0530.87655.0490.02656.279<0.0010.211/0.243/0.200/0.290/0.0550.889/0.946/0.921/0.928/0.910
Note: AIC = Akaike information criterion; BIC = Bayesian information criterion; aBIC = sample-size-adjusted Bayesian information criterion; LMR = Lo–Mendell–Rubin likelihood ratio test; BLRT = bootstrap likelihood ratio test. Lower AIC, BIC, and aBIC values indicate better relative model fit, whereas entropy values closer to 1 indicate greater overall classification precision. Significant LMR and BLRT results indicate that a k-profile solution provides improved fit relative to the corresponding k − 1-profile solution. Estimated profile proportions represent the model-estimated proportions of respondents in each latent profile. Average posterior probabilities are the diagonal probabilities of membership in the assigned latent profile, with values closer to 1 indicating clearer classification. Posterior probabilities are reported for the four- and five-profile solutions to facilitate sensitivity comparison between the two candidate solutions.
Table 26. R3STEP Results for Demographic Predictors of Latent Profile Membership.
Profile ComparisonPredictorbSEtpOR
Compensatory licensing-oriented consumers vs. Low-involvement consumersGender−0.2590.255−1.0180.3080.771
Age−0.1210.143−0.8460.3970.886
Monthly income0.0140.1510.0930.9261.014
Education level−0.0970.155−0.6250.5320.908
Previous purchase experience0.2000.2880.6950.4871.222
Positive consistency-oriented consumers vs. Low-involvement consumersGender0.0010.2640.0050.9961.001
Age−0.0880.162−0.5410.5880.916
Monthly income0.2110.1481.4270.1531.235
Education level−0.0040.160−0.0240.9810.996
Previous ethical product purchase experience0.5290.2921.8100.0701.697
Emotion-driven consumers vs. Low-involvement consumersGender0.0340.2380.1410.8881.034
Age−0.0650.135−0.4790.6320.937
Monthly income0.2130.1441.4800.1391.238
Education level−0.1580.147−1.0800.2800.854
Previous purchase experience0.5730.2642.1660.0301.774
Note: The low-involvement profile was used as the reference category. Results were estimated using the robust three-step approach (R3STEP) in Mplus. OR = odds ratio. An OR greater than 1 indicates higher odds of membership in the focal profile relative to the low-involvement profile, whereas an OR below 1 indicates lower odds. The interpretation of previous purchase experience follows the coding scheme described in the Methods Section.
Table 27. Standardized PIEP scores across latent profiles.
Latent Consumer ProfileMSE
Compensatory licensing-oriented consumers−0.4720.070
Low-involvement consumers−0.7800.064
Positive consistency-oriented consumers0.9870.071
Emotion-driven consumers0.4280.058
Note: PIEP scores are presented as standardized scores. M = profile-specific mean; SE = standard error. Profile-specific means were estimated using the BCH approach while accounting for classification uncertainty.
Table 28. Differences in PIEP across latent consumer profiles.
Profile Comparisonχ2pBH-Adjusted p
Overall difference485.588<0.001N/A
Compensatory licensing-oriented vs. Low-involvement9.8410.0020.002
Compensatory licensing-oriented vs. Positive consistency-oriented214.246<0.001<0.001
Compensatory licensing-oriented vs. Emotion-driven95.736<0.001<0.001
Low-involvement vs. Positive consistency-oriented343.782<0.001<0.001
Low-involvement vs. Emotion-driven196.092<0.001<0.001
Positive consistency-oriented vs. Emotion-driven32.559<0.001<0.001
Note: The Benjamini–Hochberg correction was applied only to the six BCH pairwise comparisons, which were treated as a separate exploratory family. The omnibus test was not included in the correction; therefore, its BH-adjusted p value is not applicable.
Disclaimer/Publisher’s Note: The statements, opinions and data contained in all publications are solely those of the individual author(s) and contributor(s) and not of MDPI and/or the editor(s). MDPI and/or the editor(s) disclaim responsibility for any injury to people or property resulting from any ideas, methods, instructions or products referred to in the content.