1. Introduction
Urban mobility has become one of the most pressing challenges for sustainable urban development, driven by rapid urbanisation, rising travel demand, traffic congestion, environmental degradation, and greenhouse gas emissions. These challenges have intensified the need for transport systems that improve accessibility, reduce dependence on private motor vehicles, and support environmentally sustainable travel behaviour [
1,
2]. Among sustainable transport modes, cycling has emerged as one of the most effective forms of active mobility because it combines environmental sustainability, economic efficiency, and public health benefits while requiring relatively modest infrastructure investment [
3,
4]. However, encouraging cycling requires more than simply constructing bicycle facilities. Continuous, well-connected, and safe cycling networks that provide efficient access to major urban destinations are equally important for increasing bicycle use and supporting sustainable urban mobility [
5,
6]. Accordingly, promoting cycling has become a key component of sustainable urban mobility policies aimed at reducing transport-related environmental impacts while improving urban accessibility and quality of life.
Cycling accessibility has therefore become a central topic in transport planning because it depends not only on the availability of cycling infrastructure but also on network connectivity, route continuity, travel impedance, and the spatial distribution of urban activities. Previous studies have consistently demonstrated that fragmented cycling networks, discontinuous infrastructure, and poor connectivity reduce route attractiveness and discourage everyday cycling [
5,
6,
7]. Consequently, recent research has increasingly shifted from simple distance-based accessibility measures towards network-based approaches that better represent cyclist route preferences and realistic travel conditions [
8,
9].
Recent advances in Geographic Information Systems (GIS) have substantially improved the ability to evaluate cycling accessibility through network-based analytical techniques. GIS-based network analysis and Origin–Destination (OD) Cost Matrix analysis enable researchers to model cyclist route choice, quantify accessibility, evaluate network performance, and identify infrastructure deficiencies through objective and reproducible analytical procedures [
10,
11]. These approaches also provide evidence-based support for prioritising cycling infrastructure investments that contribute to more sustainable urban transport systems. Furthermore, recent studies have demonstrated that incorporating cyclist-oriented network characteristics, rather than relying solely on geometric distance, provides a more realistic representation of cycling accessibility and route selection [
12,
13].
Despite these methodological advances, an important research gap remains. Existing studies have generally examined cycling accessibility assessment, route optimisation, infrastructure evaluation, or decision-support systems separately. Relatively few studies have integrated impedance-based route optimisation, neighbourhood-level accessibility assessment, and strategic cycling corridor prioritisation within a unified GIS-based decision-support framework. Furthermore, limited attention has been given to integrating accessibility assessment, priority corridor identification, and robustness evaluation within a single framework that directly supports sustainable urban mobility planning. Consequently, there remains a need for transferable GIS-based methodologies that can simultaneously evaluate cycling accessibility and identify strategic infrastructure investment priorities, particularly in medium-sized cities.
Burdur, a medium-sized city located in southwestern Türkiye, provides an appropriate case study for addressing this research gap. Although the city has a relatively compact urban structure that is generally favourable to cycling, its existing bicycle infrastructure remains fragmented, discontinuous, and poorly connected, limiting the network’s overall effectiveness. These characteristics make Burdur representative of many medium-sized cities where cycling has considerable potential but planning decisions require objective analytical support, thereby providing a suitable context for demonstrating how GIS-based accessibility analysis can support strategic cycling infrastructure planning.
In response to this research gap, this study proposes a GIS-based decision-support framework to evaluate urban cycling accessibility and identify priority cycling corridors. The proposed methodology integrates a relative Bike Cost impedance model, GIS-based network analysis, and Origin–Destination (OD) Cost Matrix analysis to generate least-cost cycling routes, evaluate neighbourhood-level accessibility, prioritise cycling corridors based on the frequency with which they are traversed by least-cost routes, and support evidence-based sustainable transport planning.
The main contributions of this study are as follows:
A transferable and reproducible GIS-based analytical framework for evaluating cycling accessibility in medium-sized cities;
An integrated analytical workflow that combines a relative Bike Cost impedance model, GIS-based network analysis, and Origin–Destination (OD) Cost Matrix analysis for cycling accessibility assessment;
A frequency-based approach for identifying and prioritising strategic cycling corridors; and
An evidence-based planning framework to support sustainable cycling infrastructure investments, enhance urban network connectivity, and facilitate decision-making in medium-sized cities.
2. Literature Review
2.1. Sustainable Urban Mobility and Cycling Accessibility
Cycling accessibility is widely recognised as a fundamental component of sustainable urban mobility, as it determines the extent to which cycling can serve as a practical and competitive mode of daily transportation. Rather than focusing solely on the environmental and health benefits of cycling, recent studies increasingly examine the spatial, infrastructural, and operational conditions that determine whether cycling can provide sustainable, efficient, and equitable access to urban destinations [
3,
4].
The literature indicates that cycling accessibility is determined by multiple interrelated factors extending beyond the provision of dedicated bicycle facilities. These factors collectively influence route choice, travel efficiency, and the attractiveness of cycling as a mode of transport. Connected and continuous cycling networks have consistently been associated with higher cycling levels and improved access to urban opportunities. In contrast, fragmented networks, unsafe intersections, and poor infrastructure quality remain important barriers to everyday cycling [
5,
6,
7].
Recent research has also shifted away from evaluating cycling accessibility using simple distance-based measures towards more comprehensive approaches that incorporate network characteristics, travel impedance, and spatial equity considerations. This transition reflects a broader understanding that cycling accessibility depends not only on the physical availability of infrastructure but also on the quality and efficiency of the routes connecting origins and destinations. Consequently, contemporary cycling accessibility research increasingly advocates integrated and evidence-based planning approaches that improve network performance, enhance equitable access to urban opportunities, and support more sustainable urban transport systems.
2.2. GIS-Based Cycling Accessibility and Decision-Support Approaches
Geographic Information Systems (GIS) have become an essential analytical platform for evaluating cycling accessibility by integrating transport networks, spatial datasets, and accessibility indicators into a unified analytical environment [
10,
11]. In cycling research, GIS-based methods are widely used to evaluate network performance, identify accessibility disparities, analyse route choice, and support evidence-based infrastructure planning through objective and reproducible spatial analyses.
Among GIS-based techniques, network analysis and Origin–Destination (OD) Cost Matrix analysis are particularly effective for representing accessibility within urban transport systems. Network analysis identifies optimal routes by minimising a specified impedance value, whereas the OD Cost Matrix quantifies accessibility relationships between origins and destinations using cumulative travel costs [
8,
9]. Compared with traditional distance-based approaches, these methods provide a more realistic representation of cycling accessibility by explicitly incorporating transport network characteristics into route optimisation and accessibility assessment.
Recent studies have further improved GIS-based accessibility assessment by integrating cyclist-oriented variables such as infrastructure quality, traffic conditions, and perceived cycling comfort. For example, van der Meer et al. [
12] demonstrated that different definitions of cycling network quality substantially influence accessibility estimates, while Vierø et al. [
13] highlighted the importance of high-quality bicycle infrastructure datasets for reliable accessibility assessment. Together, these developments indicate a clear transition from geometric distance-based analyses towards impedance-based approaches that better represent cyclist route preferences and overall network performance.
At the same time, GIS has become an important component of decision-support systems for cycling infrastructure planning. Early studies combined GIS with multi-criteria decision analysis (MCDA) to identify suitable locations for bicycle facilities by considering accessibility, travel demand, and spatial characteristics simultaneously [
14]. More recent research has expanded these approaches by incorporating optimisation techniques, accessibility indicators, and automated analytical workflows. For example, Davidson et al. [
15] proposed a socio-spatial GIS framework for identifying priority areas for cycling infrastructure. Bonsma-Fisher et al. [
16] demonstrated how different optimisation objectives influence network expansion priorities, Santos et al. [
17] developed an automated GIS-based tool for evaluating road suitability for active mobility, and Malandri et al. [
18] integrated accessibility analysis with multi-criteria evaluation to support bike-sharing system planning.
Collectively, these studies demonstrate that GIS has evolved from a mapping and accessibility analysis tool into a comprehensive decision-support environment for evidence-based and sustainable transport planning. Nevertheless, most existing applications focus on individual analytical tasks, such as route optimisation, accessibility assessment, or infrastructure evaluation. Relatively few studies integrate cyclist-oriented impedance modelling, network-based accessibility assessment, and infrastructure prioritisation into a single, transferable framework specifically designed for medium-sized cities. Addressing this methodological gap provides the conceptual foundation for the integrated GIS-based decision-support framework proposed in the present study.
2.3. Research Gap and Conceptual Framework
The literature demonstrates substantial progress in cycling accessibility assessment, GIS-based network analysis, and decision-support methodologies for cycling infrastructure planning. However, these research streams have largely evolved independently, with limited integration between accessibility assessment, network optimisation, and infrastructure prioritisation. Accessibility studies have primarily focused on evaluating spatial relationships between origins and destinations, while GIS-based analyses have concentrated on route optimisation and network performance. Decision-support approaches, in contrast, have generally emphasised the prioritisation of infrastructure based on specific planning criteria and optimisation objectives. Consequently, relatively few studies integrate these complementary analytical components within a unified framework capable of simultaneously modelling cyclist route preferences, evaluating accessibility, and identifying strategic cycling corridors.
This limitation is particularly relevant for medium-sized cities, where compact urban form often provides favourable conditions for cycling. However, fragmented infrastructure and limited planning resources require efficient and transferable analytical tools. Recent reviews likewise emphasise the need for integrated methodologies that combine accessibility assessment, network evaluation, infrastructure prioritisation, and spatial equity within evidence-based planning frameworks, particularly for cities with limited planning resources [
19].
To address this methodological gap, the present study develops a GIS-based decision-support framework that integrates four complementary analytical components: (i) a relative Bike Cost impedance model based on functional road hierarchy, (ii) GIS-based network analysis for identifying least-cost cycling routes, (iii) Origin–Destination (OD) Cost Matrix analysis for evaluating neighbourhood-level accessibility, and (iv) frequency-based identification of priority cycling corridors. By integrating these four analytical components into a single workflow, the proposed framework provides a transferable and reproducible methodology for evidence-based cycling infrastructure planning, strategic investment prioritisation, and sustainable urban mobility planning in medium-sized cities. Furthermore, the proposed framework can be readily adapted to other medium-sized cities with comparable urban characteristics and transport networks, thereby supporting transferable and evidence-based cycling infrastructure planning.
3. Materials and Methods
3.1. Study Area
The study was conducted in the central district of Burdur, located in southwestern Türkiye. As a medium-sized city with a relatively compact urban form, Burdur provides a suitable case study for evaluating cycling accessibility because it combines favourable spatial conditions for cycling with a fragmented and discontinuous cycling network. These characteristics make the city representative of many medium-sized urban areas where cycling has considerable potential, but infrastructure planning requires objective spatial analysis.
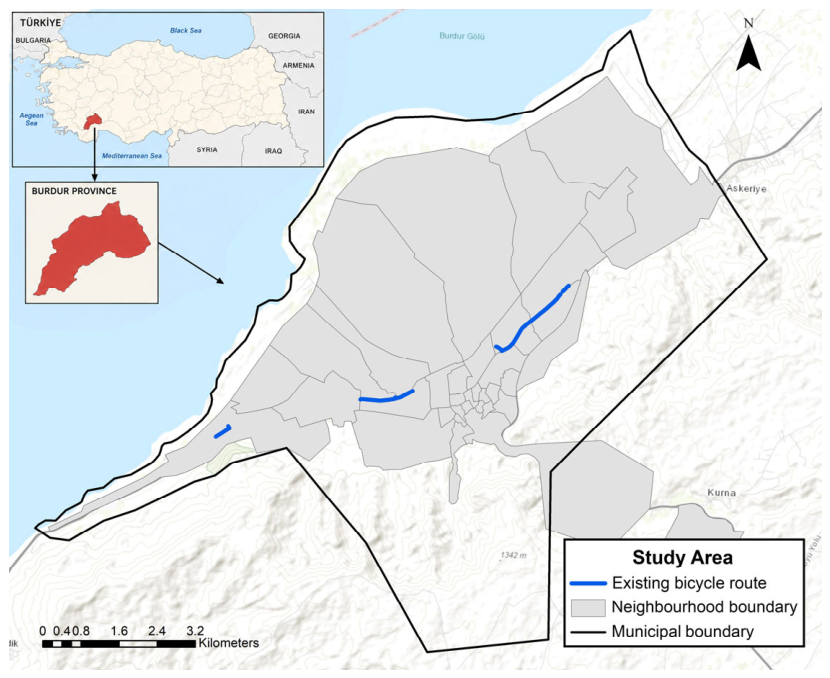
The study area comprises 36 neighbourhoods (
Figure 1). However, only 34 neighbourhoods located within the Burdur Municipality administrative boundary were included in the analyses. The remaining two neighbourhoods were excluded because they lie outside the municipal administrative boundary. These 34 neighbourhoods encompass the principal residential areas and the urban activity destinations considered in this study. Their neighbourhood centres were defined as origin locations. In contrast, primary schools, middle schools, high schools, the university, parks, and tourism destinations were defined as six destination categories for the accessibility analyses. Consequently, all network, accessibility, sensitivity, and statistical analyses were conducted using these 34 neighbourhood centres.
The existing cycling infrastructure consists of three principal corridors: (i) Armağan İlci Boulevard–Trafo Street, (ii) Yunus Emre Street–Şeker Square, and (iii) Nuri Artok Street–Bahçeşehir College (
Figure 1).
3.2. Data Collection and Methodological Framework
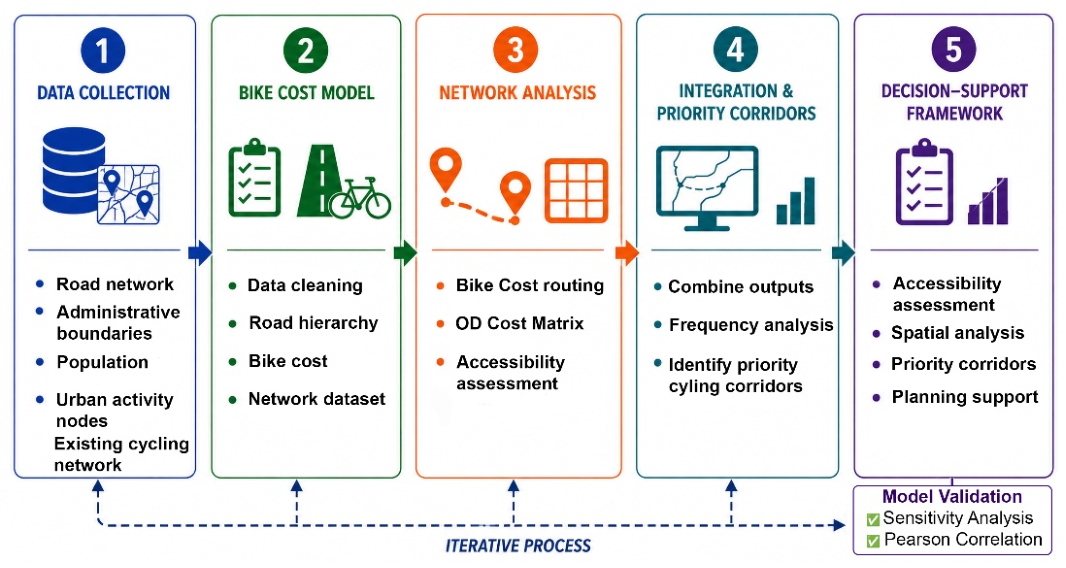
The proposed methodology was designed as a sequential GIS-based analytical workflow consisting of five interrelated stages (
Figure 2). The workflow integrates spatial data preparation, cycling impedance modelling, network and accessibility analysis, and decision-support procedures into a unified framework for evaluating cycling accessibility and supporting evidence-based planning of cycling infrastructure. The methodological framework was developed based on established GIS-based accessibility assessment and network analysis approaches widely applied in transportation planning [
10,
11].
The analysis was based on spatial and demographic data obtained from multiple institutional and open-access sources. The road network was derived from OpenStreetMap (OSM) [
20], administrative boundaries were obtained from HGM-Küre [
21], and neighbourhood-level population data were acquired from the Burdur Provincial Directorate of Population and Citizenship Affairs [
22]. The locations of primary schools, middle schools, high schools, the university, parks, and tourism destinations were obtained from the HGM-Küre spatial data platform [
21]. Google Earth imagery [
23] was subsequently used to verify the locations and spatial consistency of these data visually. Together, these datasets formed the GIS database used throughout the study.
Before analysis, all spatial data were converted into a common GIS format and projected to the WGS 84/UTM Zone 36N coordinate reference system. The data were subsequently examined for positional consistency, attribute consistency, and topological integrity. Disconnected road segments, duplicate features, overshoots, and undershoots were identified and corrected to ensure continuous network connectivity prior to constructing the network dataset. Establishing a topologically connected network is a fundamental prerequisite for reliable GIS-based network analysis [
10,
24]. All spatial and network analyses were performed using ArcGIS Desktop 10.8.1 (Esri, Redlands, CA, USA) with the Network Analyst extension [
24].
After data preparation, road segments were classified by functional hierarchy and assigned relative Bike Cost values reflecting their suitability for cycling. These impedance values were incorporated into the network dataset and consistently used as the impedance attribute in the subsequent routing and OD Cost Matrix analyses. Using impedance rather than geometric distance enables route optimisation to better represent cyclists’ route preferences and perceived travel conditions [
8,
9].
The centres of the 34 neighbourhoods were defined as origin locations, while primary schools, middle schools, high schools, the university, parks, and tourism destinations were represented as six destination categories. GIS-based network analysis was first applied to identify the least-cost cycling routes based on cumulative Bike Cost values. Subsequently, Origin–Destination (OD) Cost Matrix analysis was performed to quantify neighbourhood-level accessibility by calculating cumulative cycling impedance between origins and destinations, a widely adopted approach in accessibility assessment and transport planning [
10,
11].
Finally, the outputs of the Bike Cost model, network analysis, and OD Cost Matrix analysis were integrated to identify priority cycling corridors and support evidence-based cycling infrastructure planning. The complete methodological workflow is illustrated in
Figure 2, while the spatial datasets used in the analysis are summarised in
Table 1.
To evaluate the robustness of the proposed Bike Cost weighting scheme, a sensitivity analysis was conducted across three alternative impedance-weighting scenarios. In addition to the base weighting scheme (1–2–3–5–10), two alternative scenarios representing lower (1–2–3–4–6) and higher (1–2–4–7–15) impedance contrasts were implemented. The complete analytical workflow was repeated for each scenario, and the resulting route frequencies and priority cycling corridors were compared to assess the stability of the proposed Bike Cost model.
3.3. Development of the Cycling Impedance Model
The cycling impedance model constitutes the core analytical component of the proposed framework. Unlike conventional shortest-path approaches that optimise routes solely according to geometric distance, the proposed model evaluates cycling suitability by incorporating the functional characteristics of the road network. This approach recognises that cyclists generally prefer routes offering safer, lower-stress, and more comfortable travel conditions rather than simply minimising travel distance [
8,
9].
Road segments were classified by functional hierarchy and assigned relative Bike Cost values reflecting their suitability for cycling. The classification was based on three complementary criteria: (i) functional road hierarchy, (ii) typical traffic conditions, and (iii) relative cycling suitability. These factors have consistently been identified as major determinants of cyclist route choice and perceived travel quality in previous studies [
5,
8,
9].
Rather than representing absolute travel time or physical distance, the assigned Bike Cost values express the relative impedance of cycling across different road classes. Residential streets were assigned the lowest impedance values because they generally provide lower traffic volumes, lower vehicle speeds, and safer operating environments. Conversely, primary and trunk roads had the highest impedance values owing to higher traffic intensity, higher vehicle speeds, and lower perceived cycling comfort. Intermediate road classes were assigned progressively higher impedance values according to their relative suitability for bicycle travel.
The selected impedance values (1, 2, 3, 5, and 10) were intentionally defined as relative ordinal weights rather than mathematically calibrated parameters. The objective was not to reproduce actual travel times but to distinguish road classes by their relative attractiveness for cycling, thereby guiding the network optimisation process towards safer, more suitable routes. Similar relative-weighting approaches have been widely adopted in impedance-based cycling accessibility studies, in which road hierarchy and traffic characteristics are incorporated into route selection [
8,
9].
For a route consisting of n road segments, the cumulative Bike Cost was calculated as:
where
Cr denotes the cumulative Bike Cost of the route,
wi represents the relative Bike Cost assigned to road segment
i according to its functional road class, and
n is the number of road segments traversed. Segment length was not included as a multiplicative term in this calculation; thus, cumulative Bike Cost represents the sum of the relative impedance weights of the road segments traversed rather than a distance-weighted cost.
The resulting Bike Cost values were implemented as the network impedance attribute within the ArcGIS network dataset and applied consistently throughout both the GIS-based network analysis and the Origin–Destination (OD) Cost Matrix analysis. Consequently, all route optimisation procedures minimised the cumulative Bike Cost rather than the geometric distance, enabling the identification of least-cost cycling routes that better reflect realistic cyclist route preferences. The assigned Bike Cost values are presented in
Table 2.
3.4. GIS-Based Network and Accessibility Analysis
Following the development of the Bike Cost model, the road network was implemented as a network dataset in ArcGIS Network Analyst, with Bike Cost as the network impedance attribute. Establishing a topologically connected network is essential for reliable network-based accessibility analysis because routing algorithms require uninterrupted connectivity throughout the transport network [
10,
24].
The Bike Cost attribute was defined as the network impedance and used consistently throughout all routing procedures. Consequently, route optimisation minimised the cumulative Bike Cost rather than the geometric distance, thereby enabling the identification of least-cost cycling routes that better represent cyclists’ preferences across different road conditions [
8,
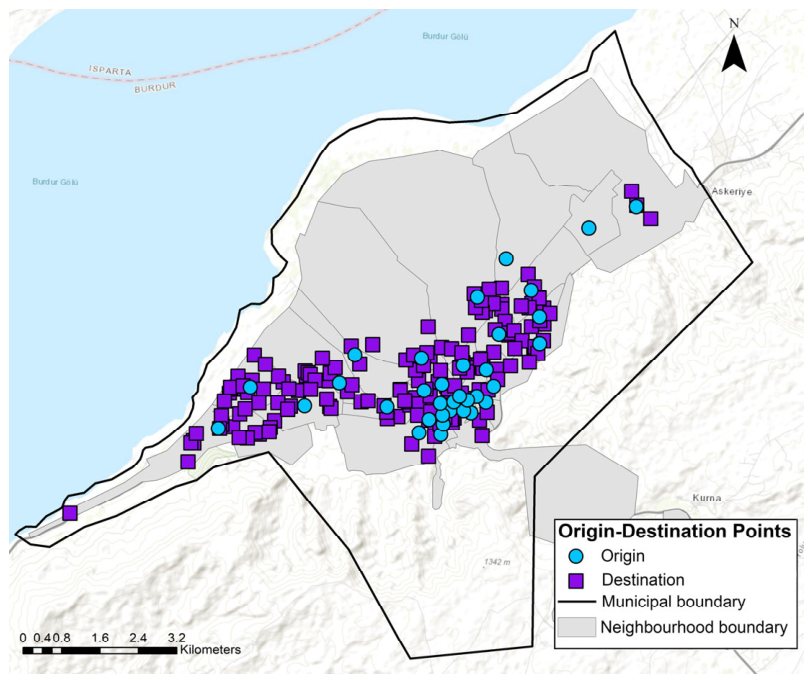
9]. The centres of the 34 neighbourhoods were defined as origin locations, while primary schools, middle schools, high schools, the university, parks, and tourism destinations were represented as six destination categories.
Figure 3 illustrates the spatial distribution of the origin and destination locations used in the Origin–Destination (OD) Cost Matrix analysis.
GIS-based network analysis was first applied to identify the least-cost cycling routes connecting each neighbourhood with the selected urban activity nodes. The resulting routes provided a network-wide representation of potential cyclist movements under the proposed impedance model, enabling the identification of road segments repeatedly selected across multiple origin–destination pairs.
Subsequently, an Origin–Destination (OD) Cost Matrix analysis was performed using the same network dataset and Bike Cost impedance attribute. Unlike route analysis, which determines the optimal path between individual origins and destinations, the OD Cost Matrix quantifies cumulative impedance for all origin–destination relationships. The analysis included 34 neighbourhood centres as origins and 169 individual destination points, comprising 57 educational destinations (17 primary schools, 14 middle schools, 23 high schools, and 3 university locations), 101 parks, and 11 tourism destinations, resulting in 5746 origin–destination connections (34 × 169). For each neighbourhood, the mean Bike Cost was calculated directly across all 169 destination connections to represent overall neighbourhood-level cycling accessibility; separate category-level means were not calculated before aggregation. Lower mean Bike Cost values indicate higher cycling accessibility, whereas higher values indicate lower accessibility. This provides a comprehensive assessment of neighbourhood-level cycling accessibility [
10,
11].
Finally, the outputs of the network analysis and the OD Cost Matrix analysis were integrated to evaluate spatial accessibility patterns and identify priority cycling corridors. Road segments that appeared repeatedly within the least-cost route network were interpreted as strategically important links because they provide connectivity for multiple origin–destination pairs. The analytical outputs generated in this stage served as the primary inputs to the GIS-based decision-support framework described in
Section 3.5.
3.5. GIS-Based Decision-Support Framework
The Closest Facility analysis was performed separately for each of the six destination categories. For each category, least-cost routes were generated from the 34 neighbourhood centres, resulting in a total of 204 routes (34 origins × 6 destination categories). The resulting least-cost routes were subsequently merged into a single route dataset (n = 204), after which all traversed road segments were extracted. A frequency analysis was then applied to quantify how often each road segment was used across all least-cost routes. Road segments with higher traversal frequencies were interpreted as priority cycling corridors because they provided connectivity for a larger number of origin–destination pairs.
To assess the spatial correspondence between the identified priority corridors and the existing cycling infrastructure, an additional spatial overlap analysis was conducted. Road segments were classified into five frequency classes using the Jenks natural breaks classification method in ArcGIS: Very Low (0–1), Low (2–4), Moderate (5–11), High (12–22), and Very High (23–35). The existing cycling infrastructure was buffered by 10 m to account for minor positional differences between the independently derived spatial datasets. The frequency-classified road segments were intersected with this buffer, and the length of the intersecting segments was calculated for each frequency class. Particular attention was given to the High- and Very High-frequency corridors (FREQUENCY ≥ 12), corresponding to the two highest classes identified by the Jenks classification, which were considered the principal priority corridors for infrastructure investment. As a robustness check, the spatial overlap analysis for these priority corridors was repeated using a 20 m buffer to assess whether the results were sensitive to the selected proximity tolerance.
The accessibility patterns obtained from the OD Cost Matrix analysis were subsequently evaluated together with the priority corridor analysis to identify neighbourhoods characterised by relatively limited cycling accessibility and weaker network connectivity. Integrating these complementary analytical outputs enables interpretation of accessibility deficiencies within the context of the overall network structure, thereby supporting more targeted infrastructure planning decisions.
The resulting decision-support framework provides a transparent, reproducible, and transferable methodology for prioritising cycling infrastructure investments using objective spatial criteria. Because the framework relies on widely available GIS datasets and standard network analysis procedures, it is readily applicable to other medium-sized cities with comparable urban characteristics. Similar GIS-based decision-support approaches have been recognised as valuable tools for supporting evidence-based transport planning and infrastructure prioritisation [
10,
14,
15,
17].
To further examine whether neighbourhood-level cycling accessibility was associated with population size, a Pearson correlation analysis was performed using IBM SPSS Statistics, version 26.0 (IBM Corp., Armonk, NY, USA). The analysis evaluated the relationship between neighbourhood population and mean Bike Cost values derived from the Origin–Destination (OD) Cost Matrix analysis. Statistical significance was assessed at the 95% confidence level (p < 0.05). Together, the GIS-based analyses, sensitivity analysis, and statistical evaluation constitute an integrated decision-support framework for assessing cycling accessibility and prioritising cycling infrastructure investments.
4. Results
The proposed GIS-based decision-support framework produced five complementary analytical outputs describing cycling accessibility, network performance, and infrastructure priorities within the study area. These comprise the cycling impedance model, GIS-based network analysis, Origin–Destination (OD) Cost Matrix analysis, spatial accessibility assessment, and priority cycling corridor identification. Together, these results demonstrate the applicability of the proposed framework for evaluating cycling accessibility and supporting evidence-based cycling infrastructure planning.
4.1. Results of the Cycling Impedance Model
The proposed cycling impedance model classified the urban road network into five functional road classes according to their relative suitability for bicycle travel (
Table 2). Relative Bike Cost values, ranging from 1 (Residential roads) to 10 (Primary/Trunk roads), were assigned to represent the comparative impedance of cycling on different road types. Rather than representing absolute travel time or travel distance, these values express the relative attractiveness of road segments for bicycle travel under typical urban traffic conditions.
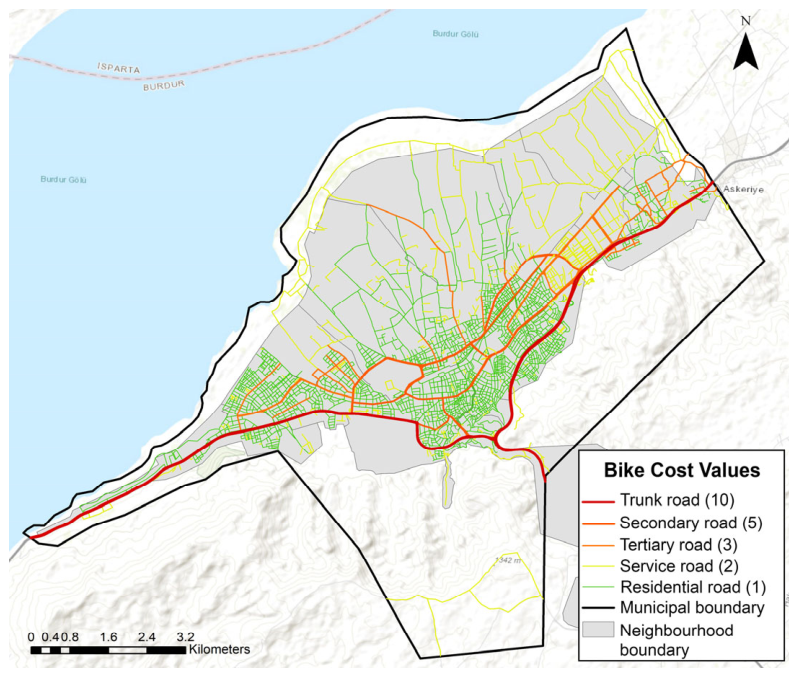
The spatial distribution of the assigned Bike Cost values is presented in
Figure 4. Low-impedance road segments (Bike Cost = 1–3) are predominantly concentrated in the central urban area, where residential, service, and tertiary roads form a dense, well-connected street network. In contrast, high-impedance segments (Bike Cost = 5–10) are mainly associated with secondary, primary, and trunk roads that serve as the principal vehicular transport corridors linking the city centre to peripheral neighbourhoods.
The resulting spatial pattern reveals a clear differentiation in cycling suitability across the urban road network. The concentration of low-impedance streets within the urban core provides multiple alternative routing options for cyclists, whereas higher-order roads surrounding the city centre function as relatively high-impedance barriers to bicycle travel. Consequently, the proposed Bike Cost model effectively distinguishes roads by their relative suitability for cycling and provides a realistic basis for subsequent network-based accessibility analyses by directing route optimisation towards safer, more suitable cycling corridors [
8,
9].
4.2. Origin–Destination (OD) Cost Matrix Analysis
The Origin–Destination (OD) Cost Matrix analysis was conducted using the Bike Cost impedance attribute to evaluate neighbourhood-level cycling accessibility across the study area. By calculating the cumulative Bike Cost between each neighbourhood centre and the selected urban activity nodes, the analysis provided a comprehensive assessment of relative cycling accessibility throughout the urban network. The analysis generated 5746 origin–destination connections with cumulative Bike Cost values ranging from 0.06 to 119.16 (mean = 41.55, SD = 22.78), indicating substantial variation in cycling accessibility across the urban network.
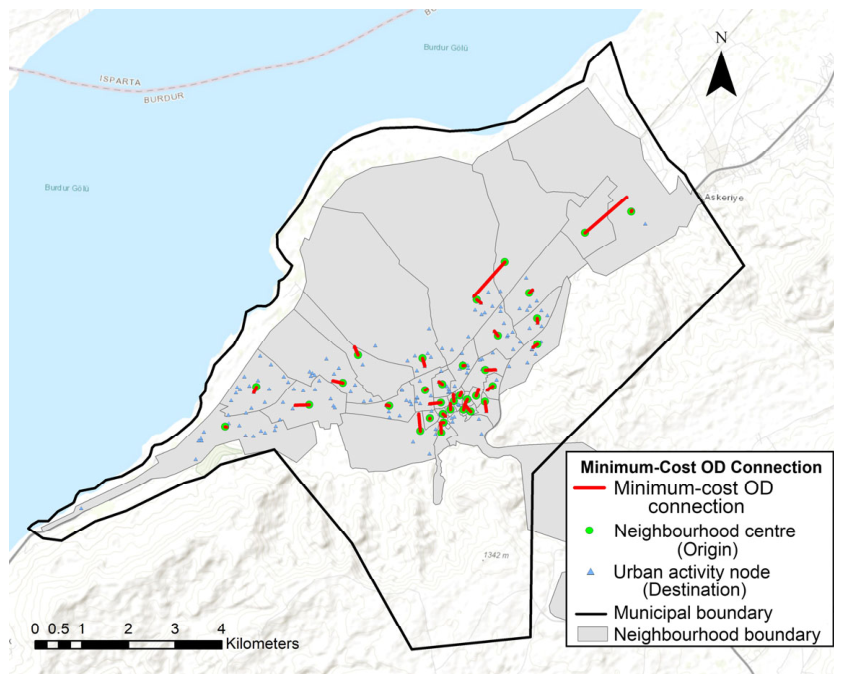
The complete OD Cost Matrix analysis generated 5746 origin–destination connections. For visual clarity,
Figure 5 presents only the minimum-cost connection identified for each neighbourhood centre. Neighbourhoods located within and around the city centre generally exhibited lower cumulative Bike Cost values, indicating higher levels of cycling accessibility. These neighbourhoods benefit from a dense and well-connected street network composed primarily of low-impedance residential, service, and tertiary roads, which provide multiple efficient cycling connections to key urban destinations.
In contrast, neighbourhoods situated along the urban fringe recorded comparatively higher cumulative Bike Cost values. Their accessibility is constrained by lower network connectivity and greater reliance on secondary, primary, and trunk roads, which are associated with higher cycling impedance. Consequently, cyclists travelling from peripheral neighbourhoods must traverse road segments with less favourable cycling conditions, thereby reducing overall accessibility.
The OD Cost Matrix analysis quantified neighbourhood-level cycling accessibility and provided the quantitative basis for the spatial accessibility assessment presented in the following section.
4.3. Spatial Cycling Accessibility Assessment
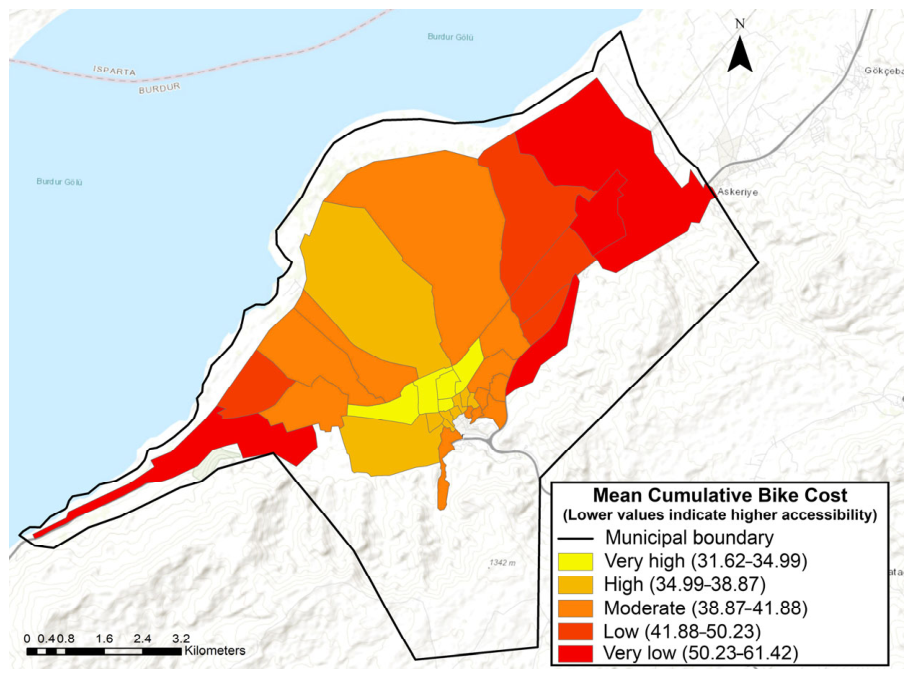
The neighbourhood-level accessibility map was produced by aggregating the cumulative Bike Cost values obtained from the Origin–Destination (OD) Cost Matrix analysis (
Figure 6). Accessibility levels varied considerably among neighbourhoods, reflecting differences in network connectivity, road hierarchy, and the spatial distribution of urban activity nodes.
Neighbourhoods located within the central urban area exhibited the highest levels of cycling accessibility. Their favourable accessibility is primarily attributable to the dense, interconnected street network, which offers multiple low-impedance route options and efficient access to primary schools, middle schools, high schools, the university, parks, and tourism destinations. The concentration of these urban activity destinations within the city centre further enhances accessibility by reducing cumulative Bike Cost values.
For neighbourhood-level accessibility assessment, the mean Bike Cost for each of the 34 analysed neighbourhoods was calculated directly across its 169 destination connections. The resulting mean Bike Cost values ranged from 31.62 to 61.42 (mean = 41.55, SD = 7.38), demonstrating considerable spatial variation in cycling accessibility across the study area.
In contrast, peripheral neighbourhoods generally demonstrated lower levels of cycling accessibility. Although several of these neighbourhoods are geographically close to the urban core, their accessibility is constrained by limited network connectivity and greater reliance on higher-order roads, which are characterised by relatively high Bike Cost values. These conditions reduce the availability of efficient cycling routes and increase cumulative cycling impedance.
The observed accessibility pattern demonstrates that cycling accessibility is determined not solely by destination proximity but by the combined influence of network structure and route quality. The concentration of highly accessible neighbourhoods within the urban core and comparatively lower accessibility at the urban fringe highlights the importance of network continuity in supporting efficient bicycle travel. Consequently, strengthening connections between existing low-impedance road segments is likely to produce greater accessibility improvements than simply expanding the overall length of the cycling network, particularly in medium-sized cities characterised by fragmented cycling infrastructure.
To further examine whether neighbourhood-level cycling accessibility was associated with population size, a Pearson correlation analysis was performed between neighbourhood population and the mean Bike Cost values derived from the Origin–Destination (OD) Cost Matrix analysis. The results indicated no statistically significant relationship between the two variables (r = 0.19, p = 0.288). This finding suggests that cycling accessibility within the study area is influenced primarily by network structure and connectivity rather than neighbourhood population size.
4.4. Identification of Priority Cycling Corridors
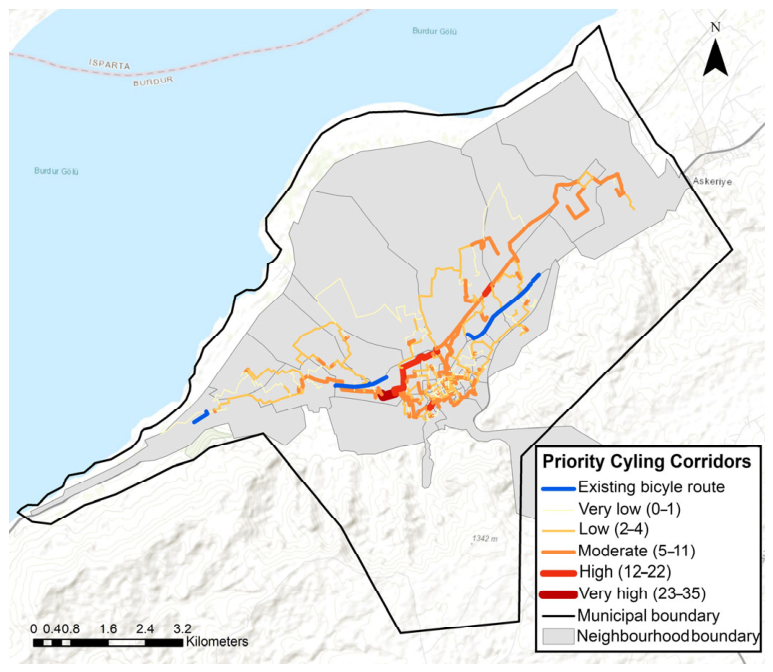
The priority cycling corridors were identified by analysing the frequency with which individual road segments were traversed by the least-cost routes generated through the GIS-based network analysis. Road segments repeatedly selected across multiple origin–destination pairs were interpreted as strategically important links because they provide connectivity for a larger number of neighbourhoods and urban activity nodes. The spatial distribution of the resulting priority cycling corridors is presented in
Figure 7. The analysis included 831 road segments with traversal frequencies ranging from 1 to 35 (mean = 3.410, SD = 3.482). Most road segments were traversed by relatively few least-cost routes, whereas a limited number of corridors accommodated a substantially larger share of origin–destination connections.
The analysis revealed a clear concentration of high-frequency corridors within the central urban area. These corridors form the structural backbone of the cycling network, connecting major activity centres via road segments characterised by relatively low cycling impedance and high network connectivity. In contrast, road segments located in peripheral neighbourhoods generally exhibited lower traversal frequencies, indicating weaker connectivity and fewer alternative cycling routes.
Comparison with the existing cycling infrastructure revealed a pronounced spatial mismatch between the current network and the corridors identified as strategically important by the analysis. Using a 10 m spatial tolerance, a total of 336.99 m of analysed road segments showed spatial correspondence with the existing cycling infrastructure. Of this overlapping length, 214.34 m (63.6%) was classified as Low frequency and 102.64 m (30.5%) as Very Low frequency, while only 20.02 m (5.9%) corresponded to the Moderate-frequency class. No spatial overlap was identified with either the High- or Very High-frequency priority corridors. The High- and Very High-frequency classes comprised 19 road segments with a combined length of 2.417 km, yet none fell within the 10 m tolerance of the existing cycling infrastructure. This absence of overlap remained unchanged when the spatial tolerance was increased to 20 m, confirming that the result was not sensitive to the selected proximity threshold. These findings indicate that the existing cycling infrastructure is predominantly associated with lower-frequency segments rather than the corridors identified by the model as having the greatest strategic importance. Accordingly, the High- and Very High-frequency corridors represent priority candidates for future cycling infrastructure investment.
The frequency-based corridor analysis demonstrates that infrastructure prioritisation should be guided not only by the existing distribution of cycling facilities or geometric route characteristics but also by the strategic role of individual road segments within the overall cycling network. By integrating network connectivity, relative cycling impedance, and route frequency, the proposed framework identifies strategic corridors where infrastructure improvements are expected to produce the greatest network-wide accessibility benefits, thereby providing an objective and spatially explicit basis for cycling infrastructure planning in medium-sized cities.
4.5. Sensitivity Analysis
To evaluate the robustness of the proposed Bike Cost weighting scheme, a sensitivity analysis was performed using three alternative impedance scenarios representing different levels of weighting contrast: the base scenario (1–2–3–5–10), a low-contrast scenario (1–2–3–4–6), and a high-contrast scenario (1–2–4–7–15). These scenarios were designed to represent reasonable decreases and increases in impedance contrast while preserving the ordinal ranking of functional road classes. The objective was to assess whether moderate variations in the assigned Bike Cost values would substantially influence the identified priority cycling corridors. For each scenario, the Closest Facility analysis generated 204 least-cost routes (34 neighbourhood centres × 6 destination categories). The resulting routes traversed between 831 and 832 unique road segments, with mean traversal frequencies ranging from 3.396 to 3.450 and maximum frequencies between 34 and 35 (
Table 3).
The sensitivity analysis demonstrated a high level of robustness. Across all three weighting schemes, the number of generated routes (204) and the number of traversed road segments (831–832) remained virtually unchanged, indicating that the overall network structure was highly stable. Spearman’s rank correlation coefficients between route frequencies ranged from 0.905 to 0.986, demonstrating that the relative importance of road segments remained highly consistent despite variations in the assigned impedance values. Furthermore, the overlap of the priority cycling corridors (defined as road segments with FREQUENCY ≥ 12) reached 100% between the base and low-contrast scenarios and 94.7% for comparisons involving the high-contrast scenario. Overall, the sensitivity analysis confirms that the proposed Bike Cost weighting scheme is robust and that the identified priority cycling corridors remain largely unchanged under reasonable variations in the assigned impedance values. This supports the suitability of the selected weighting scheme for network-based cycling accessibility assessment in medium-sized cities.
To provide an integrated overview of the principal findings, the main quantitative results obtained from the OD Cost Matrix, neighbourhood-level accessibility assessment, priority corridor analysis, spatial overlap analysis, and sensitivity analysis are summarised in
Table 4. This synthesis highlights the key accessibility patterns, the strategic importance of the identified priority corridors, and the robustness of the proposed framework across alternative Bike Cost weighting scenarios.
5. Discussion
The findings demonstrate that cycling accessibility in medium-sized cities is shaped not only by the availability of cycling infrastructure but also by the interaction between network connectivity, road hierarchy, and the spatial distribution of urban activity nodes. These findings highlight the importance of evaluating cycling networks as integrated transport systems rather than collections of individual infrastructure elements. By integrating a relative Bike Cost model with GIS-based network analysis, Origin–Destination (OD) Cost Matrix analysis, and frequency-based corridor identification, the proposed framework provides a comprehensive basis for evidence-based cycling infrastructure planning and sustainable urban mobility decision-making.
The observed accessibility pattern, characterised by higher accessibility within the urban core and comparatively lower accessibility in peripheral neighbourhoods, is consistent with previous studies that emphasise the importance of network connectivity in determining cyclists’ route choice. Hood et al. [
8] and Broach et al. [
9] demonstrated that cyclists frequently prefer routes that minimise perceived travel impedance rather than geometric distance alone. Similarly, Wang [
10] highlighted that network-based accessibility analyses provide more realistic representations of urban accessibility than Euclidean distance approaches. The present results corroborate these findings by showing that neighbourhoods connected through dense, low-impedance street networks exhibit substantially higher accessibility than areas relying primarily on higher-order roads. The Pearson correlation analysis further supports these findings by indicating that neighbourhood population was not significantly associated with cycling accessibility (r = 0.19,
p = 0.288). This suggests that neighbourhood population size alone does not explain the observed variation in cycling accessibility, highlighting the importance of network structure and connectivity. Together, the Pearson correlation and sensitivity analyses strengthen this interpretation by demonstrating that the observed accessibility patterns are robust to moderate changes in the assigned impedance values and are primarily governed by network characteristics rather than demographic variation.
The results further suggest that improvements in cycling accessibility depend not only on expanding the total length of the cycling network but also on strengthening network continuity and connectivity. Several high-frequency corridors identified in this study are currently not supported by dedicated cycling infrastructure, indicating that strategically targeted investments along these links could improve accessibility more effectively than dispersed infrastructure expansion. This finding is consistent with recent studies advocating network-oriented cycling planning based on connectivity and route quality rather than infrastructure length alone, particularly in medium-sized cities where financial and spatial resources for cycling infrastructure are often limited [
12,
13,
15].
A principal contribution of the proposed framework lies in integrating route optimisation, neighbourhood-level accessibility assessment, and frequency-based corridor prioritisation within a single GIS-based analytical workflow. While previous studies have generally focused on individual analytical techniques such as least-cost routing or accessibility assessment, the present framework combines these complementary approaches to support infrastructure prioritisation using objective spatial criteria. Consequently, the methodology extends beyond conventional accessibility mapping by providing a practical decision-support tool for evidence-based and sustainable cycling infrastructure planning that can assist local authorities in identifying corridors where cycling investments are likely to yield the greatest network-wide accessibility benefits.
Despite these contributions, several limitations should be acknowledged. The Bike Cost values represent relative impedance weights derived from the functional road hierarchy and typical traffic conditions, rather than from empirically calibrated cyclist behaviour. In addition, segment length was not incorporated as a multiplicative component of the Bike Cost; therefore, the resulting impedance should be interpreted as a relative road-class-based measure rather than a distance- or time-based generalised cycling cost. Moreover, the accessibility assessment was based on static network conditions and therefore does not account for temporal variations in traffic conditions or travel demand throughout the day. In addition, the analysis assumes uniform cyclist preferences and does not explicitly consider variations associated with age, gender, cycling experience, topography, traffic volume, pavement quality, or seasonal weather conditions. Electrically assisted bicycles (e-bikes) were not explicitly considered in the present framework. Electric assistance may alter cyclists’ sensitivity to route impedance, particularly with respect to gradients, travel effort, and potentially longer routes; therefore, the Bike Cost weighting scheme developed for conventional cycling may not fully represent e-bike route preferences. Additionally, destinations were treated equally within each category, and differences in destination size, capacity, or potential demand, such as school enrolment, were not incorporated into the accessibility assessment. Furthermore, the proposed framework evaluates potential cycling accessibility under existing network conditions and therefore does not simulate behavioural responses following future infrastructure improvements. Accordingly, the reported accessibility values should be interpreted as relative planning indicators rather than direct predictions of actual cyclist behaviour.
Future research could improve the proposed framework by calibrating impedance values using GPS trajectory data, stated-preference surveys, or observed cyclist route choices, including separate impedance specifications for conventional bicycles and e-bikes. Integrating additional variables such as traffic safety, intersection delays, terrain characteristics, bicycle level of service, and real-time traffic information may further enhance the model’s behavioural realism. The methodology could also be extended to evaluate alternative cycling infrastructure scenarios and support comparative assessments of investment strategies across different urban contexts. Future applications of the proposed framework may also facilitate multicriteria decision-making for cycling infrastructure planning by integrating environmental, economic, and social sustainability indicators. Such developments would further enhance the applicability of the proposed framework for supporting sustainable urban mobility policies, evidence-based cycling infrastructure planning, and resilient transport systems in medium-sized cities.
6. Conclusions
This study developed and applied a GIS-based decision-support framework to evaluate cycling accessibility and identify priority cycling corridors in the medium-sized city of Burdur, Türkiye. By integrating a relative Bike Cost model with GIS-based network analysis, Origin–Destination (OD) Cost Matrix analysis, and frequency-based corridor identification, the proposed methodology provides a comprehensive assessment of cycling accessibility that extends beyond conventional distance-based approaches while supporting evidence-based and sustainable urban transport planning.
The findings demonstrate that the interaction between network connectivity, road hierarchy, and the spatial distribution of urban activity nodes strongly influences cycling accessibility. Neighbourhoods within the urban core generally exhibited higher accessibility owing to their dense, interconnected street networks. In contrast, peripheral neighbourhoods experienced lower accessibility due to weaker network connectivity and greater reliance on higher-order roads. The priority corridor analysis further revealed that several strategically important road segments lack dedicated cycling infrastructure, highlighting locations where targeted investments could yield the greatest network-wide accessibility benefits.
The principal contribution of this study lies in integrating cycling impedance modelling, network-based accessibility assessment, and frequency-based corridor prioritisation within a single GIS-based analytical framework. Unlike approaches that rely primarily on geometric distance or isolated accessibility indicators, the proposed methodology provides a transparent, transferable, and evidence-based decision-support tool for identifying priority cycling investments based on network structure and cyclist-oriented route suitability. Consequently, the framework offers practical guidance for evidence-based cycling infrastructure and sustainable urban mobility planning in medium-sized cities. It may assist local authorities in prioritising investments that maximise network-wide accessibility.
Although the proposed methodology was developed using Burdur as a case study, its analytical framework can be readily adapted to other cities with comparable road networks and spatial datasets. Future research should incorporate empirically calibrated cyclist behaviour, traffic safety indicators, topographic characteristics, and real-world GPS trajectory data to improve the behavioural realism of the impedance model. Evaluating alternative infrastructure scenarios and assessing accessibility changes before and after network improvements would further enhance the practical applicability of the proposed framework. The sensitivity analysis further demonstrated that the proposed Bike Cost weighting scheme produces consistent priority cycling corridors under reasonable variations in impedance values, supporting the robustness of the proposed methodology. Overall, the proposed framework provides a practical, transferable, and evidence-based methodology for supporting sustainable cycling infrastructure planning and contributing to the development of more connected, accessible, and resilient urban transport systems in medium-sized cities.