Article

From Resource Dependence to Sustainable Development: The Role of Institutions and Technology in Reducing CO2 Emissions in GCC Countries


by
Ebrahim Abbas Abdullah Abbas Amer
* and
Xiuwu Zhang
Institute of Quantitative Economics and Statistics, Huaqiao University, Xiamen 361000, China
*
Author to whom correspondence should be addressed.
Sustainability 2026, 18(17), 8930; https://doi.org/10.3390/su18178930
Submission received: 26 May 2026 / Revised: 3 July 2026 / Accepted: 3 July 2026 / Published: 1 September 2026
(This article belongs to the Section Development Goals towards Sustainability)

Abstract

Extending the stochastic STIRPAT framework, this study investigates the impacts of institutional quality, technological progress, and natural resource dependency on CO2 emissions across the Gulf Cooperation Council (GCC) from 1995 to 2021. Econometrically, the framework integrates a multi-estimator matrix comprising FMOLS, PCSE, and Panel GMM techniques to control for endogeneity, parameter heterogeneity, and cross-sectional dependence. The empirical parameters reveal that institutional quality and renewable energy consumption exert a highly robust, universally consistent carbon-mitigating effect across all models (FMOLS: −0.2997; PCSE: −0.3044). Conversely, economic growth, non-renewable energy utilization, and urbanization act as the primary structural drivers of degradation. Crucially, the effects of technological innovation and resource dependence are model-dependent; they show statistical significance strictly within long-run FMOLS parameters (−0.0287 and +0.1339, respectively) but turn insignificant under cross-sectional corrections (PCSE/GMM), highlighting that resource wealth is highly conditional. Furthermore, the analysis uncovers a unique demographic paradox in the GCC, where transient foreign labor inflows cause aggregate population growth to exhibit a stable carbon-mitigating response (−0.0207). Policy implications demonstrate that unilateral interventions are insufficient due to cross-sectional dependencies. Instead, mitigating emissions demands an inter-country correlated framework through mechanisms like the Gulf Cooperation Council Interconnection Authority (GCCIA). Finally, the study bridges the macroeconomic–engineering nexus, arguing that regional innovation must transition toward active carbon utilization clusters, specifically electro-, thermo-, and photocatalytic CO2 conversion systems using porous crystalline metal–organic frameworks (MOFs) to support the 2030 Sustainable Development Goals (SDGs 7, 12, and 13).

1. Introduction

Environmental sustainability has become a central global policy priority, particularly under the 2030 Agenda for Sustainable Development [1]. Resource-dependent economies face structural challenges in reconciling economic growth with environmental protection, especially in achieving Sustainable Development Goals (SDGs) such as SDG 7 (Affordable and Clean Energy), SDG 12 (Responsible Consumption and Production), and SDG 13 (Climate Action) [2]. In this context, institutional quality and technological progress play decisive roles in shaping environmental outcomes. Institutional quality influences environmental governance through regulatory effectiveness, transparency, and enforcement capacity [3,4], while technological progress fosters innovation in energy efficiency, renewable energy deployment, and cleaner production systems [5]. However, in hydrocarbon-based economies, technological advancements without sufficient institutional oversight may inadvertently accelerate resource extraction and environmental degradation [6]. From a technical perspective, mitigating global warming requires transitioning beyond passive carbon reductions toward active carbon utilization. Recent breakthroughs emphasize the roles of electro-, thermo-, and photocatalytic technologies capable of converting atmospheric CO2 into value-added chemicals and renewable fuels to drive carbon neutrality. Despite the high thermodynamic stability of CO2, modern material engineering—such as the deployment of porous crystalline metal–organic frameworks (MOFs) with high surface areas and adjustable active sites—offers promising integrated avenues like photo electrocatalytic and electrothermal CO2 reduction [7].
Therefore, evaluating the macroeconomic capacity of an economy to absorb and scale up such technical innovations is paramount. The originality of this study lies in its integrated examination of institutional quality, technological progress, and natural resource dependency within a unified empirical framework, offering a comprehensive, direct-effects assessment of sustainability pathways in the Cooperation Council for the Arab States of the Gulf (GCC) region [8]. The originality of this study lies in its integrated examination of institutional quality, technological progress, and natural resource dependency within a unified empirical framework, offering a comprehensive, direct-effects assessment of sustainability pathways in the Cooperation Council for the Arab States of the Gulf (GCC) region [9].
Despite the increasing recognition of institutional and technological factors in environmental sustainability, existing research has produced mixed findings regarding the relationship between natural resource dependency and environmental quality [9,10]. Some studies suggest that resource wealth leads to environmental degradation, a phenomenon often referred to as the “resource curse” [11], whereas others argue that natural resources can be harnessed to support environmental improvements through strategic investments in cleaner technologies [12]. In regions like China and parts of Europe, resource abundance has been utilized to drive energy-saving initiatives [13,14], whereas excessive resource exploitation in economies such as South Africa and the BRICS nations has intensified environmental degradation [15,16]. However, the specific impact of resource dependency on environmental outcomes in the GCC remains underexplored. Given the region’s heavy reliance on fossil fuels and its status as one of the world’s largest contributors to per capita CO2 emissions [17], there is a pressing need to understand the individual and direct roles that institutional quality, technological progress, and natural resource dependency play in shaping environmental sustainability [18].
The GCC countries represent a distinctive development model characterized by heavy hydrocarbon dependence, high per capita energy consumption, and carbon-intensive growth patterns [19]. Despite ongoing diversification initiatives—such as Saudi Vision 2030 and the UAE Net Zero Strategy 2050—fossil fuels remain central to fiscal revenues and export structures. Recent policy frameworks, including Saudi Arabia’s Green Initiative and Oman’s Net Zero 2050 target, further illustrate the region’s increasing commitment to energy transition while still grappling with a structural reliance on hydrocarbons. The region controls nearly 19.8% of global natural gas reserves and has experienced a substantial rise in CO2 emissions—approximately 978.4 million metric tons between 1971 and 2016 [20]. High energy consumption levels, coupled with rapid urbanization and industrial expansion, place significant pressure on environmental systems. At the same time, GCC countries have committed to climate agreements and SDG implementation frameworks, creating a structural tension between economic reliance on hydrocarbons and sustainability objectives [21]. This dual challenge—maintaining growth while transitioning toward low-carbon development—makes the GCC an analytically important case for examining how institutional quality and technological progress can directly mitigate the environmental risks of natural resource dependency.
The GCC countries present a unique and compelling case for studying the interplay between natural resources, institutional quality, technological progress, and environmental sustainability. What makes the GCC analytically distinctive is its extreme combination of hydrocarbon-dependent economies, ambitious diversification agendas, and stark variation in institutional capacity within a geographically contiguous and politically integrated bloc. Despite accounting for only 0.6% of the global population, they contribute 2.4% of global greenhouse gas emissions, driven by fossil fuel dependency, rapid urbanization, and industrial expansion [20]. Their economies remain heavily reliant on resource rents, with Kuwait (45.6%), Saudi Arabia (38.1%), and Oman (37.1%) among the highest [21]. While some nations, like the UAE and Saudi Arabia, demonstrate strong technological progress through rising patent registrations, others lag, reflecting disparities in innovation capacity [2]. Institutional quality also varies significantly, with the UAE and Qatar showing strong corruption control, whereas Kuwait and Bahrain face distinct governance challenges [2]. This complex landscape of economic growth, governance, and environmental impact makes the GCC an ideal setting for analyzing sustainable development strategies and policy interventions.
Although a growing body of literature examines the environmental effects of institutional quality, technological progress, and natural resource dependency, most studies analyze these factors in isolation or focus on broad multi-country panels [22]. Very limited empirical research simultaneously investigates their direct partial associations within a unified framework tailored to hydrocarbon-dependent economies such as the GCC. Moreover, previous studies often overlook cross-sectional dependence and endogeneity concerns that may bias long-run estimates [23,24]. Consequently, there remains a clear research gap regarding how governance quality and technological advancement directly condition the environmental consequences of resource dependency in the GCC context. Guided by this gap, this study addresses the following research questions: (1) How does institutional quality affect CO2 emissions in GCC countries? (2) What is the role of technological progress in mitigating environmental degradation? (3) Does natural resource dependency exacerbate carbon emissions in resource-rich economies? (4) What are the individual long-run effects of institutional quality, technological progress, and natural resource dependency on environmental sustainability when evaluated within a unified framework?
This study systematically differentiates its empirical and theoretical footprint from the existing literature on the GCC and resource-curse dynamics through four distinct contributions. First, from a structural regional perspective, unlike previous literature that often aggregates the GCC with wider MENA datasets or assumes a uniform environmental path, this study provides updated, focused empirical evidence isolating the GCC bloc. It explicitly contextualizes how their unique macroeconomic realities—namely, absolute hydrocarbon dependence paired with some of the world’s highest per capita carbon footprints—interact with shifting development paradigms. Second, from a theoretical model standpoint, this paper expands the boundaries of the classical STIRPAT identity. Rather than merely assessing standard affluence and population metrics, it introduces a rigorous structural extension by integrating institutional quality (corruption control) and natural resource dependency alongside a highly disaggregated energy mix within a single, cohesive framework. This layout allows for a comprehensive assessment of the independent paths of these variables in resource-rich economies without relying on flawed universal generalizations.
Third, from a demographic conceptual lens, this study uncovers and contextualizes a highly unique empirical phenomenon: the demographic paradox of the GCC, where aggregate population expansion exhibits a stable carbon-mitigated footprint. By decomposing this finding through the lens of transient, highly regularized expatriate labor dynamics and decoupled upstream extraction baselines, this paper offers a novel, country-specific departure from conventional STIRPAT-based literature that mechanically treats population growth as an environmental inhibitor. Fourth, from an empirical–methodological stance, the study executes a comprehensive multi-estimator matrix. By evaluating long-run and dynamic vectors through Fully Modified Ordinary Least Squares (FMOLS), Panel Corrected Standard Errors (PCSE), and Panel GMM frameworks, the analysis simultaneously controls for endogeneity, cross-sectional dependence, and parameter heterogeneity. This multi-layered estimation ensures that our policy implications strictly distinguish between universally robust structural drivers (such as urbanization and energy mix) and model-dependent indicators (such as technology and resource rents), presenting a highly disciplined framework for regional sustainability transitions.
The second section of the paper offers a full overview of the most critical literature, while the third part describes the methodologies and data variables employed. The results and arguments are presented in the fourth segment. Finally, the fifth section outlines the study’s conclusions, implications, and suggestions for policymakers in these nations.

2. Literature Review

The relationship between institutional quality, technological progress, natural resource dependency, and environmental outcomes has received increasing attention in environmental economics. Drawing on endogenous growth theory [25], ecological modernization theory (EMT), and the Environmental Kuznets Curve (EKC) framework, these dimensions collectively shape a nation’s carbon trajectory. While natural resource extraction provides the economic baseline, institutional frameworks and technological innovations directly determine the efficiency and governance of environmental outcomes. This section reviews the empirical evidence regarding the direct impacts of these three pillars on CO2 emissions to ground the study’s empirical framework (See Table 1).

2.1. Institutional Quality and CO2 Emissions

Institutional quality fundamentally determines a country’s capacity to balance economic growth with environmental protection. According to EMT, strong institutions enhance regulatory capacity, ensure policy transparency, and enforce environmental standards, thereby mitigating the negative externalities of industrialization. Efficient governance frameworks can internalize environmental costs via taxation, reduce rent-seeking behavior in resource extraction sectors, and ensure that resource revenues are channeled into sustainable public investments [22].
Empirical evidence largely validates this perspective across various regional contexts. In a comprehensive study of Asian economies, Khan & Rana found that improvements in institutional quality consistently reduced emissions across different development stages [38]. Similar mitigation effects have been documented in Turkey [39], where corruption control demonstrated strong environmental benefits, and across Africa [3], where institutional development emerged as a prerequisite for effective policy implementation. Within the MENA and South Asian regions, studies confirm that political stability, regulatory quality, and governance integrity significantly lower emissions trajectories [36,37,40,41].
Conversely, weaker institutional capacity or high path dependency in heavily resource-reliant nations can impede environmental policy implementation [17]. When evaluated within a unified framework, institutional quality is expected to exert a direct, separate association with lower emissions by establishing robust environmental oversight.
Hypothesis 1 (H1).
Institutional quality has a significant direct negative effect on CO2 emissions in GCC countries.

2.2. Technological Progress and CO2 Emissions

Technological progress affects environmental quality through two competing dynamics. On one hand, innovation enhances production efficiency and enables emission reductions through cleaner production systems, aligned with EMT’s emphasis on technology-driven ecological transition. On the other hand, technological expansion can initially trigger a rebound effect, escalating energy consumption and industrial output during early adoption phases—a pattern reflecting the ascending portion of the EKC.
Empirical investigations capture this duality. Research from China [42] and Bangladesh [32] demonstrates that sector-specific technological developments can either increase or decrease emissions depending on the nature of the innovation and the underlying industrial mix. However, when innovation is oriented toward green applications—such as eco-patents and energy-efficiency advancements—the literature indicates a robust carbon-mitigating effect, as observed in OECD countries [43,44], Pakistan [34], and China [30,45].
While literature underscores that the environmental utility of technology is maximized within strong governance structures [22], this study models technological progress as a distinct structural driver to capture its direct, independent contribution to GCC’s carbon dynamics.
Hypothesis 2 (H2).
Technological progress has a significant direct negative effect on CO2 emissions in GCC countries.

2.3. Natural Resource Dependency and CO2 Emissions

The relationship between natural resource dependency and environmental degradation is central to the “environmental resource curse” paradox, where resource abundance often exacerbates environmental degradation. The underlying mechanisms are multi-faceted: heavy reliance on hydrocarbon extraction directly drives territorial emissions, fosters economic structures resistant to low-carbon diversification, and delays the adoption of stringent environmental regulations [46].
A substantial body of empirical literature supports this hypothesis, finding that natural resource dependency increases carbon emissions across both developing and industrialized panels [33,47]. This positive resource-emissions nexus has been extensively documented in regional studies, including northwestern China [10], Belt and Road Initiative countries [26], and the BRICS nations [16,38].
In contrast, some literature suggests that resource wealth does not inherently degrade the environment; rather, resource rents can be strategically leveraged to finance green transitions and renewable infrastructure when managed alongside advanced technological and institutional capacities [13,27,48,49]. In the context of the GCC, given its profound and historic structural reliance on fossil fuels, resource dependency is hypothesized to be a primary contributor to territorial emissions.
Hypothesis 3 (H3).
Natural resource dependency has a significant direct positive effect on CO2 emissions in GCC countries.

2.4. Synthesis and Research Gap

While the independent impacts of institutional quality, technological progress, and natural resource dependency are widely debated, existing empirical literature exhibits two major limitations. First, previous studies often analyze these factors in isolation or rely on broad, highly heterogeneous multi-country panels [22]. Consequently, there is a clear scarcity of empirical research that simultaneously examines these three pillars within a unified, direct-effects framework tailored specifically to hyper-dependent hydrocarbon economies like the GCC. Second, many prior regional studies overlook methodological vulnerabilities, such as cross-sectional dependence and endogeneity, which can heavily bias long-run panel estimates [23,24].
The present study addresses these gaps by evaluating the direct partial associations of institutions, technology, and resource dependency within an integrated STIRPAT framework for the GCC bloc. This approach avoids overstating the model’s capabilities via unestimated interaction terms, ensuring total alignment between theoretical framing and econometric specification. This serves the region’s current policy needs—such as Saudi Vision 2030 and the UAE Net Zero Strategy 2050—by identifying how institutional strength and technological growth independently contribute to mitigating the environmental costs of resource dependency.

3. An Overview of GCC Countries

The Gulf Cooperation Council (GCC) countries present a compelling context for examining the empirical relationships between natural resource dependency, institutional quality, technological progress, and environmental outcomes. The region holds substantial hydrocarbon wealth, accounting for approximately 19.8% of global natural gas reserves [50], which have fundamentally shaped its economic structures and environmental trajectories. Despite comprising merely 0.6% of the global population, GCC countries contribute 2.4% of global greenhouse gas emissions [51]. This disproportionate environmental footprint is driven by rapid population growth, accelerating urbanization, and escalating energy demands within the transport and infrastructure sectors [52]. Since 1971, CO2 emissions from fuel combustion in the region have surged by 978.4 million tons, with electricity generation representing a primary driver of environmental pressure [53]. Furthermore, GCC countries have historically led global rankings in per capita energy consumption; for instance, Qatar’s consumption reached 18,562.7 kg of oil equivalent per person in 2019 [54]. This heavy reliance on fossil fuels, coupled with rapid industrialization and intensive resource exploitation, has profoundly intensified environmental degradation across the region [55,56].
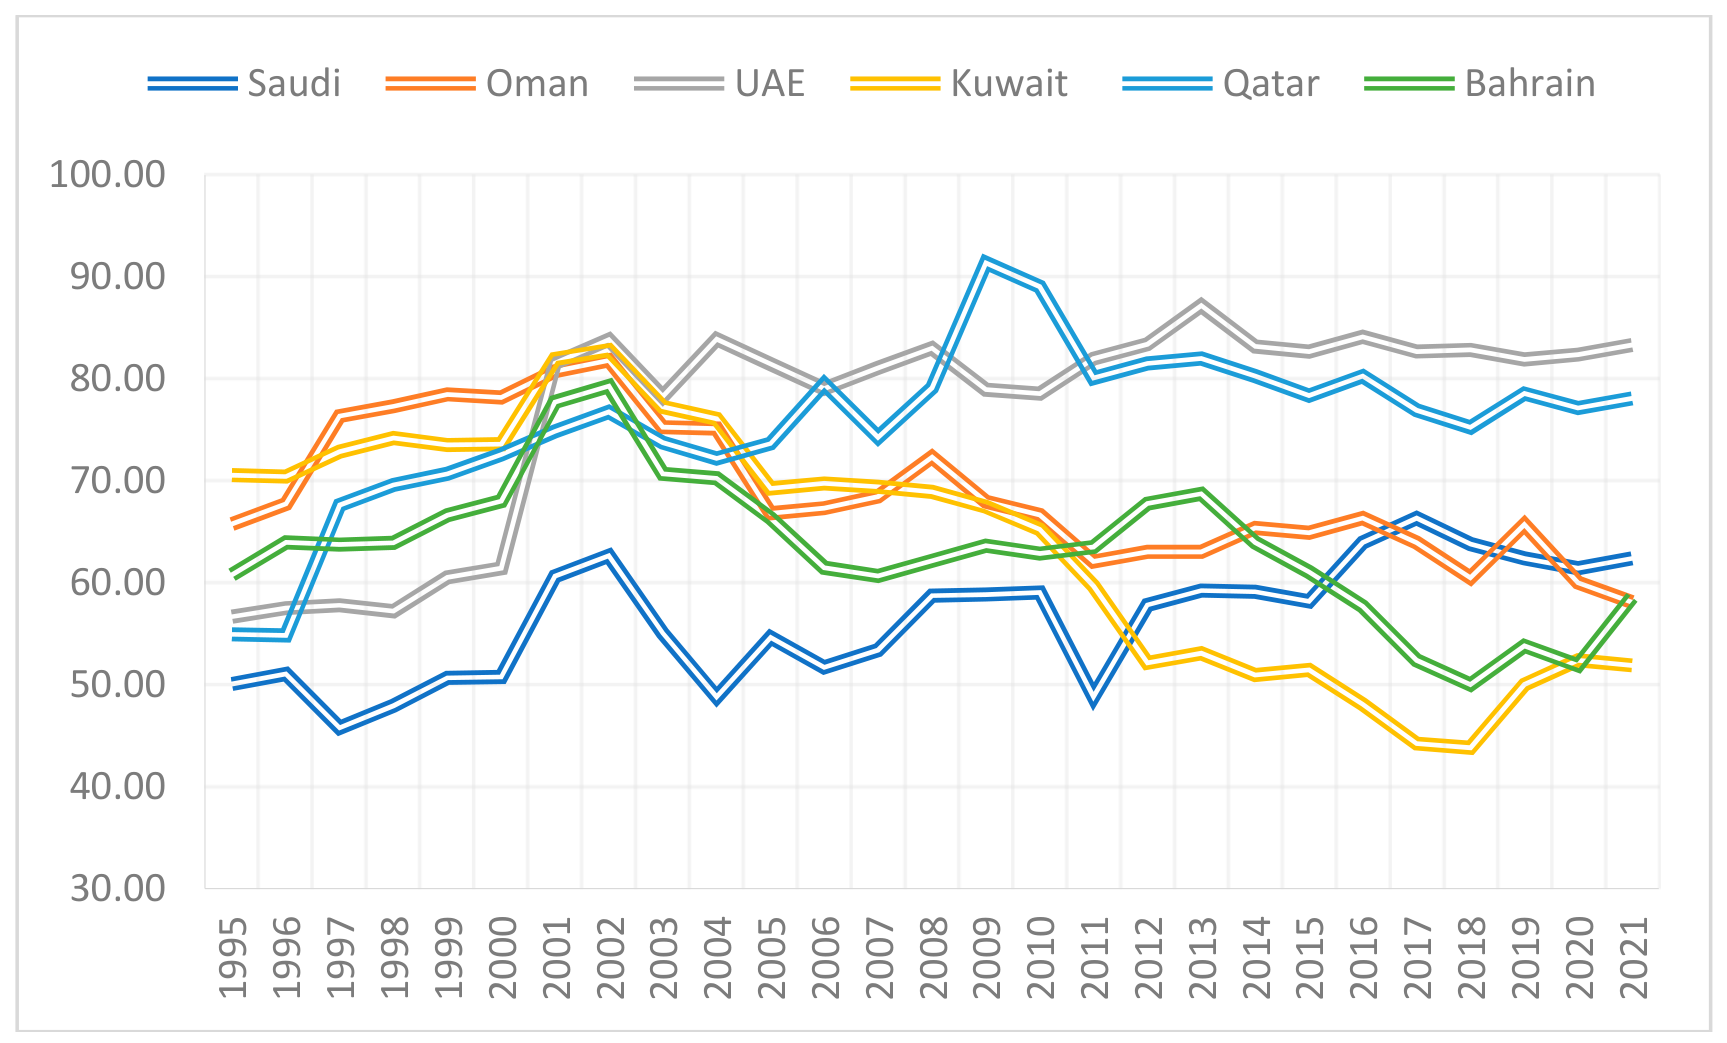
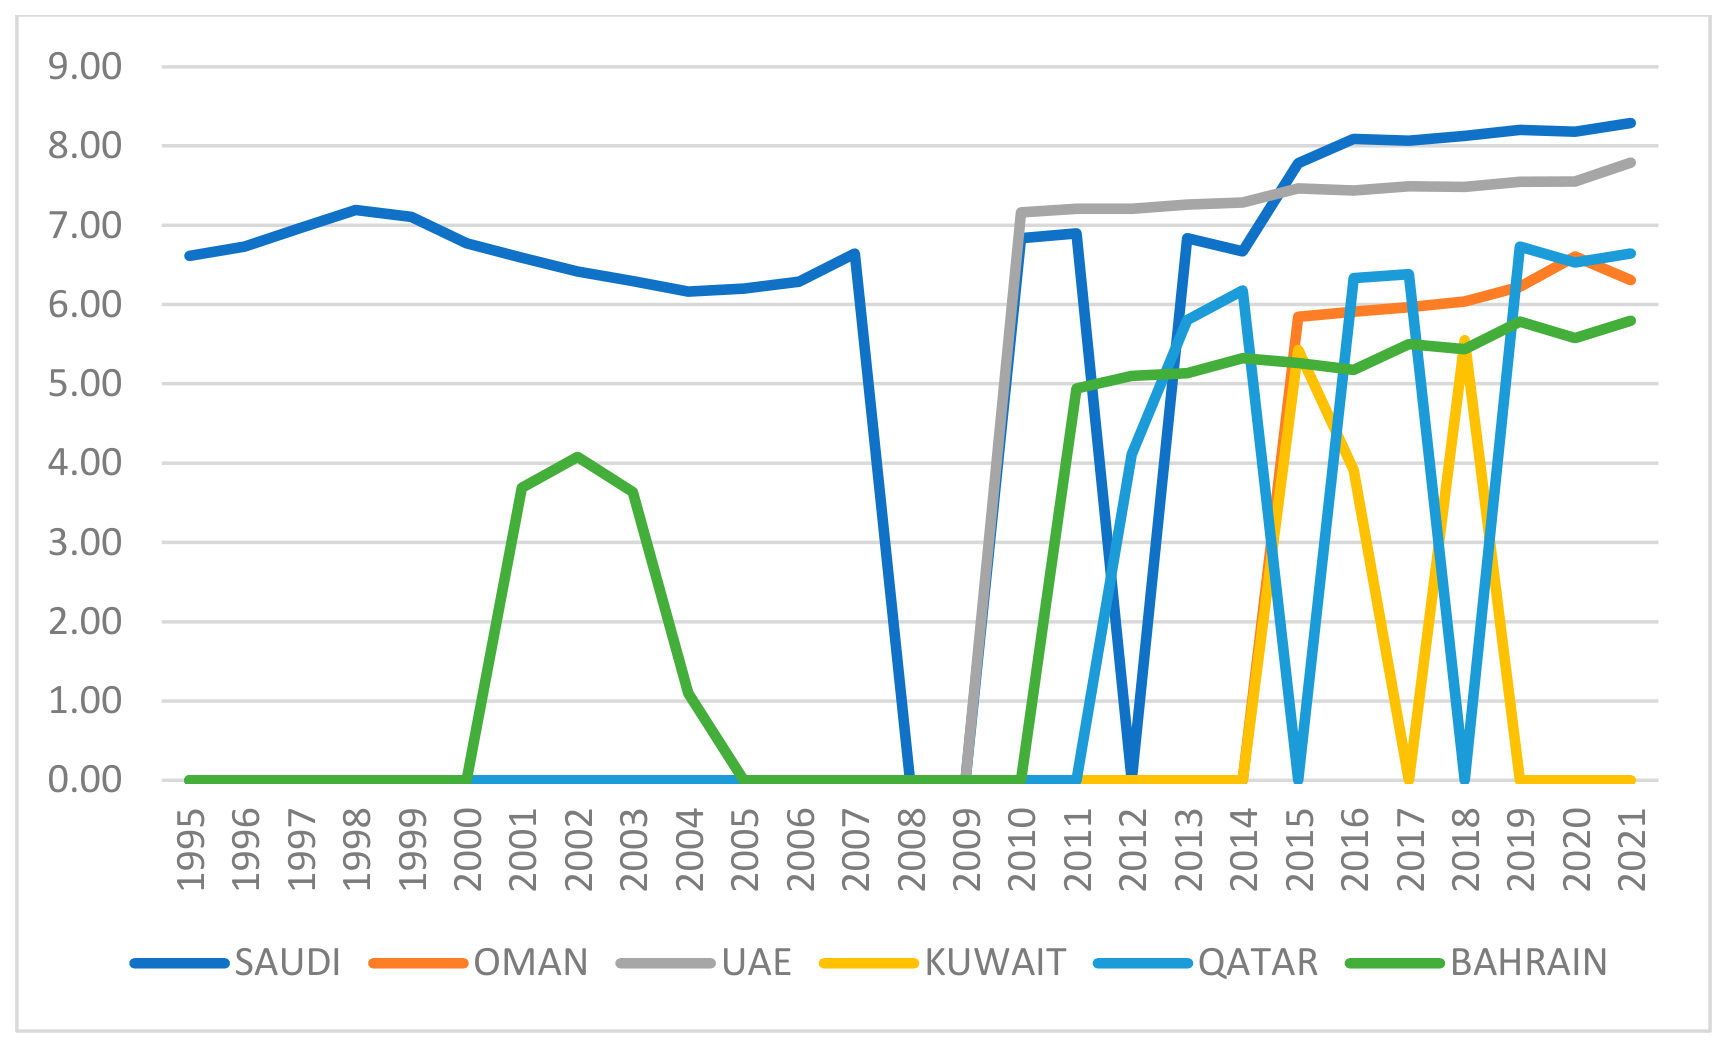
However, the environmental implications of resource wealth are not uniform across the GCC bloc, as institutional quality and technological capacity vary considerably among member states. Control of Corruption indicators from 1995 to 2021 reveal divergent institutional trajectories. The UAE has consistently maintained strong governance scores exceeding 80% since 2001, while Qatar’s score peaked at 91.39% in 2009 before experiencing a slight decline. Conversely, Kuwait and Bahrain exhibit fluctuating institutional performance; notably, Kuwait’s rank dropped to 43.81% in 2018, signaling persistent governance and regulatory challenges. Meanwhile, Saudi Arabia and Oman demonstrate moderate corruption control, though both have experienced marginal declines in recent years (See Figure 1). Technological progress, measured by patent registrations, shows equally heterogeneous patterns across the region. Saudi Arabia leads the bloc, with patent counts surging from 787 to 3979 between 2015 and 2021. The UAE follows this upward trend, increasing from minimal historical registrations to over 2400 patents by 2021. In contrast, Oman, Bahrain, and Qatar exhibit lower but gradually increasing patent activity, while Kuwait’s technological output remains comparatively limited (See Figure 2).
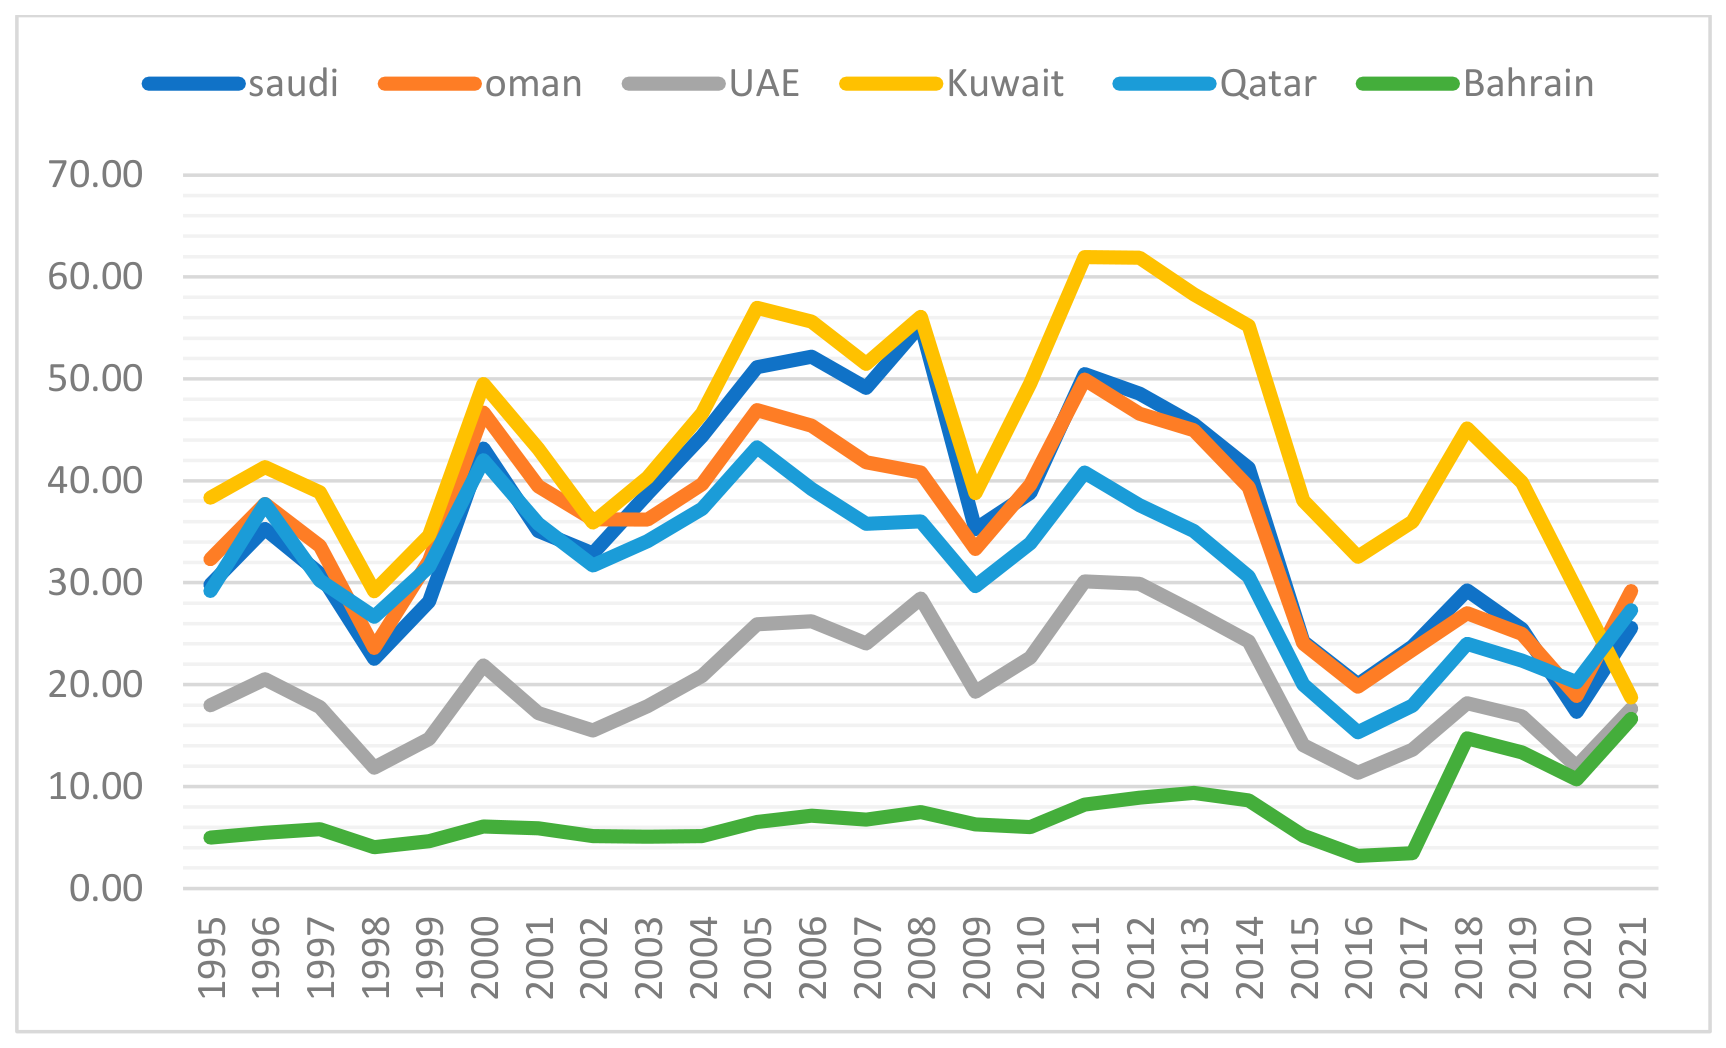
These institutional and technological disparities unfold against a complex backdrop of high developmental achievements alongside persistent environmental challenges. GCC countries have successfully leveraged natural resource revenues to achieve high Human Development Index (HDI) scores above 0.8, positioning them on par with several European Union nations [21] while establishing advanced infrastructure and pursuing economic diversification. Yet, individual environmental performance varies markedly: Qatar accounts for the largest share of regional CO2 emissions at 51.9%, followed by Kuwait (28.6%) and the UAE (25.0%). Macroeconomic dependence on natural resources also differs substantially; Kuwait derives 45.6% of its GDP from resource rents, compared to Saudi Arabia at 38.1% and Oman at 37.1% [19]. These variations highlight the diverse pathways of resource reliance and environmental pressures within the region (See Figure 3).

4. Data and Methodology

4.1. Data

This study investigates the impact of institutional quality, technological advancements, and natural resource abundance on environmental degradation in GCC countries over the period 1995–2021. The selection of this time frame is justified by the increasing environmental concerns in the region, particularly in response to rapid economic growth, urbanization, and resource extraction during these years. Additionally, data availability for key variables is consistent throughout this period, ensuring comprehensive and reliable analysis.
CO2 emissions (CO2), serving as a widely recognized measure of environmental degradation, are used as the dependent variable. This choice aligns with prior research [16,17,28,57] and reflects CO2’s dominant contribution to greenhouse gas emissions and climate change, as well as its data availability across GCC countries.
The dataset is compiled from reputable sources, ensuring data reliability. Specifically, data on CO2 emissions, GDP, energy consumption (renewable and non-renewable), population, and urbanization are obtained from the World Bank’s World Development Indicators (WDI). Institutional quality variables, such as control of corruption (CC), are sourced from the Worldwide Governance Indicators (WGI), while Technological progress (T) data comes from the GCC Statistical Center. Natural resource rents (NR) are extracted from the World Bank database, reflecting the percentage of GDP derived from oil, gas, and mineral extraction. Table 2 provides a summary of the variables and their sources.

4.2. Model Setup

The theoretical foundation of this study is primarily anchored in the STIRPAT (Stochastic Impacts by Regression on Population, Affluence, and Technology) framework, originally formulated by Dietz and Rosa (1997) as a stochastic extension of the classical IPAT identity [58]. The STIRPAT framework is exceptionally suited for panel data analysis as it explicitly accounts for stochastic error terms and accommodates the non-proportional, distinct environmental impacts exerted by multi-dimensional socio-economic factors [59]. While the Environmental Kuznets Curve (EKC) hypothesis provides a valuable theoretical backdrop regarding the potential for transitioning toward cleaner developmental trajectories, this study intentionally utilizes a linear specification of income. Thus, the EKC logic serves as a baseline economic motivation for analyzing the scale effects of growth rather than a direct empirical test of an inverted U-shaped turning point.
To expand the analytical boundaries of the standard STIRPAT formulation within highly resource-dependent contexts, this study proposes a structural extension by incorporating institutional quality and natural resource dependency as supplementary indicators [60]. The operational conceptualization of our empirical framework systematically maps each examined variable onto the core STIRPAT dimensions as follows:
ln CO 2 , i t = α 0 + ϕ 1 ln CC i t + ϕ 2 ln T i t + ϕ 3 ln NR i t + ϕ 4 ln GDP i t + ϕ 5 ln RE i t + ϕ 6 ln NRE i t + ϕ 7 ln POP i t + ϕ 8 ln URB i t + ε i t
where the structural mapping strictly operates under the following classifications:
Population (P): Represented by total population size (LPOP) to capture demographic scale effects and complemented by the urbanization rate (LURB) as a proxy for spatial shifts and urban agglomeration dynamics [61].
Affluence (A): Proxied by per capita gross domestic product (LGDP), which reflects the overarching economic activity and production scale of the GCC economies [60].
Technology (T): Disaggregated into three distinct operational vectors to capture the complex nature of energy and innovation layout: total patent registrations (LT) to capture aggregate innovative and technological absorption capacities; non-renewable energy consumption (LNRE) to capture carbon-intensive technological pathways; and renewable energy consumption (LRE) to represent clean energy technology deployment [59].
The Structural Extension: Natural resource dependency (LNR) and institutional quality (LCC) are integrated into the system as structural extensions to evaluate how resource abundance and corruption control directly govern the baseline environmental footprint alongside traditional STIRPAT drivers [20].
To ensure functional uniformity and reduce problems associated with heteroscedasticity and scale differences across the panel, the natural logarithm (ln) is applied to all variables, enabling the direct interpretation of the estimated coefficients as elasticities. The subscript i denotes the six cross-sectional units belonging to the GCC bloc, t signifies the time frame spanning from 1995 to 2021, α 0 represents the unobserved panel intercept, and ε i t stands for the idiosyncratic error term.
Each independent and control variable is structurally justified based on its established theoretical link to carbon dynamics. Institutional quality (LCC) is proxied by corruption control, reflecting its direct role in ensuring regulatory compliance and environmental oversight. Under Ecological Modernization Theory, corruption control indicates institutional transparency and enforcement capacity—mechanisms that govern whether public resource rents are directed toward sustainable developments. In the GCC context, robust corruption control is hypothesized to lower emissions by preventing the evasion of environmental standards, whereas institutional weaknesses can lead to regulatory laxity.
Similarly, natural resource dependency (LNR) represents a critical structural extension for resource-rich panels. Theoretically, extensive resource reliance can cause a structural lock-in within carbon-intensive sectors, intensifying fossil fuel extraction and industrial emissions, thus prompting a positive relationship with degradation. In terms of affluence, economic growth (LGDP) captures the persistent carbon intensity of regional expanding production, where higher income tiers traditionally accelerate demand for infrastructure and transport.
Finally, the energy mix components—renewable (LRE) and non-renewable energy (LNRE)—directly assess the technology–emission nexus, where clean energy alternatives are expected to provide clear environmental dividends, while fossil fuels remain the dominant driver of carbon accumulation. By explicitly structuring these variables as explicit extensions within the stochastic STIRPAT framework, this formulation offers a highly integrated and balanced design to evaluate the environmental path of the GCC bloc.

4.3. Econometric Methodology

4.3.1. Panel Cross-Section Dependence (CD) Tests

In globally and regionally integrated blocs like the GCC, cross-section dependence (CD) frequently arise due to shared economic shocks, historical ties, and common policy frameworks. Ignoring these issues can lead to size distortions and biased parameter estimates. Therefore, this study first implements the Breusch–Pagan (1980) LM test and the Pesaran (2004) CD test to assess the presence of cross-sectional dependence [59]. Furthermore, because economic structures vary across the individual GCC countries, heteroskedasticity, Autocorrelation, and homogenous are evaluated to ensure the suitability of the subsequent estimators [59].

4.3.2. Second-Generation Unit Root Testing

Given the confirmation of cross-sectional dependence and heterogeneity in the panel, conventional first-generation unit root tests (e.g., LLC or IPS) can yield contaminated and misleading integration orders. To resolve this, we employ the second-generation Pesaran (2007) Cross-Sectionally Augmented Dickey–Fuller (CADF) unit root test [62]. The CADF framework explicitly accounts for cross-sectional dependence by augmenting the standard Dickey–Fuller regression with cross-section averages of lagged levels and first-differences in the individual series. This ensures a robust assessment of stationarity and confirms that the variables are strictly integrated at either I(0) or I(1), thereby justifying the subsequent panel cointegration testing.

4.3.3. Cointegration Analysis

Following the determination of the integration properties, we evaluate the existence of a stable long-run equilibrium relationship among the variables. To ensure comprehensive coverage, this study utilizes both first-generation panel cointegration tests [26] and second-generation tests, such as the Westerlund (2007) error-correction-based panel cointegration test [60,61]. The Westerlund test incorporates bootstrap critical values to accommodate cross-sectional dependence, eliminating potential size distortions and providing reliable inference on long-run cointegrated trajectories.

4.3.4. Long-Run Estimates: FMOLS and PCSE Estimators

Once cointegration is established, the long-run baseline specification is estimated. To capture consistent and asymptotically efficient long-run coefficients, we apply the Fully Modified Ordinary Least Squares (FMOLS) estimator. The primary advantage of FMOLS lies in its capacity to correct for endogeneity bias and serial correlation using semi-parametric corrections, making it highly reliable for non-stationary, cointegrated panel environments [35].
However, since our empirical context exhibits heteroskedasticity, autocorrelation, and cross-sectional dependence within a panel characterized by a small cross-sectional dimension (N = 6) and a larger time dimension (T = 27), we introduce the Panel Corrected Standard Errors (PCSE) estimator. The PCSE method is precisely designed for macro-panels where T > N. Unlike feasible generalized least squares (FGLS) which can perform poorly in small samples, PCSE preserves the OLS parameter estimates while correcting the standard errors for contemporaneous correlation (cross-sectional dependence), heteroskedasticity across panels, and first-order serial correlation [60]. The baseline long-run empirical model is formulated as follows:
ln CO 2 , i t = α i + β 1 ln CC i t + β 2 ln T i t + β 3 ln NR i t + β 4 ln GDPPC i t + β 5 ln LRE i t + β 6 ln NRE i t + β 7 ln POPU i t + β 8 ln URB i t + ε i t
where i and t denote country and time dimensions, respectively; CO2 represents carbon emissions, CC institutional quality, T technological progress, NR natural resources, and the remaining variables correspond to economic and demographic control factors.
It is crucial to acknowledge that while advanced second-generation estimators—such as Common Correlated Effects Mean Group (CCE-MG), Augmented Mean Group (AMG), or Cross-Sectionally Augmented ARDL (CS-ARDL)—are structurally designed to fully endogenize unobserved common factors and slope heterogeneity, their asymptotic properties heavily rely on a large cross-sectional dimension (N). In our empirical layout, which features a very small cross-sectional dimension (N = 6) paired with a longer time horizon (T = 27), relying on these group-mean or cross-sectionally augmented options would cause a severe loss of degrees of freedom, parameters inflation, and small-sample bias [63]. Under small-N macroeconomic panels, individual country-specific estimations face extreme volatility. Therefore, the strategic combination of FMOLS and PCSE is highly sufficient and statistically optimal for this specific data structure. The FMOLS framework effectively eliminates endogeneity and serial correlation through semi-parametric corrections in non-stationary panels, while the PCSE framework stabilizes parameter estimations by directly correcting the standard error matrix against contemporaneous cross-sectional correlations and panel-scale heteroskedasticity without exhausting the limited degrees of freedom [31,64].

4.3.5. Robustness Check: Panel GMM Estimation

To further validate our long-run findings and safeguard the empirical model against unobserved endogeneity and diagnostic violations, we employ the Panel Generalized Method of Moments (Panel GMM) estimator as a robust diagnostic tool. It is critical to distinguish this static Panel GMM approach from dynamic System GMM (such as Arellano-Bond), which is intended for large-N and small-T panels and is unsuitable for our small-N GCC context (N = 6) [61].
The static Panel GMM handles the structural variables within a unified framework by utilizing a 2SLS instrument weighting matrix based on internal instruments. By setting the instrument specification to include the exogenous regressors and lagged structures (C, LCC, LT, LNR, LGDPPC, LRE, LNRE, LPOPU, LURB), this estimator corrects for potential synchronization and simultaneity biases. Because this is a level-specified static GMM model rather than a dynamic diff-GMM, standard dynamic diagnostics such as AR (1) AR (2) auto-correlation functions or Hansen difference tests are not applicable. Instead, the model validity is verified via the overall J-statistic and instrument rank, ensuring a well-specified instrument set that provides a distribution-free check on the robustness of our baseline FMOLS and PCSE estimates. Finally, Generalized Linear Models (GLMs) and Robust Least Squares (RLS) are evaluated to reinforce empirical consistency.

5. Results

5.1. Descriptive Statistics and Correlation Matrix Results

It provides an overview of descriptive statistics conducted on an aggregated dataset of six countries (See Table 3). About the correlation analysis between all the variables, it is clear from Table 4 that all the variables are interrelated with each other in different ways and with varying strengths. The significance, however, lies in the absence of the multicollinearity between independent variables.

5.2. Panel Cross-Section Dependence and Heteroskedasticity Results

The findings from the CD analysis, shown in Table 5, indicate the presence of CD among the variables. This result implies that the null hypothesis of no CD is rejected due to the statistical significance of the test results. The outcome confirms that the economies of most GCC countries are connected, indicating that a shock in any one’s economy’s factor would spread to other economies in a globalized world.
Furthermore, Table 6 presents a test result of 3.97, which is statistically significant (p < 0.0462) at the 5% level. This leads us to reject the null hypothesis and accept the alternative hypothesis, confirming the existence of heteroskedasticity in the variables analyzed.

5.3. Autocorrelation and Homogenous Results

As shown in Table 7, the results of the autocorrelation test indicate the presence of first-order autocorrelation, as the null hypothesis of no first-order autocorrelation is rejected at a 1% significance level (Prob > F = 0.0011). This suggests that the error terms in the model are correlated over time, which can lead to inefficient and biased estimators in traditional panel estimation techniques. Additionally, the results of the Pesaran–Yamagata slope heterogeneity test reveal significant heterogeneity in the slope coefficients, with both the unadjusted (Δ = 7.080, p = 0.000) and adjusted (Δadj = 8.671, p = 0.000) statistics strongly rejecting the null hypothesis of homogeneous slopes. These findings confirm that the relationship between the variables varies across cross-sections, further supporting the need for an estimation method that accounts for both autocorrelation and heterogeneity. Given these econometric challenges, the Generalized Method of Moments (GMM) is the appropriate choice, as it effectively addresses endogeneity, autocorrelation, and heteroskedasticity while providing robust and efficient parameter estimates in dynamic panel settings.

5.4. Second-Generation Unit Root Results

To accommodate the presence of cross-sectional dependence and slope heterogeneity across the GCC panel, this study employs the second-generation Pesaran (2007) Cross-Sectionally Augmented Dickey–Fuller (CADF) unit root test. Unlike first-generation tests, the CADF approach accounts for unobserved common factors by incorporating cross-sectional averages of lagged levels and first differences. The empirical findings, summarized in Table 8, reveal a mixed integration profile among the examined series.
Specifically, the null hypothesis of a unit root cannot be rejected at conventional significance levels for LCO2, LCC, LNR, and LGDPpc when evaluated in their level forms I(0). However, upon transforming these variables into their first differences I(1), the null hypothesis is strongly rejected at the 1% and 10% significance levels, confirming that these series are stationary in first differences. Conversely, the structural and control variables—namely, technological progress (LT), renewable energy consumption (LRE), non-renewable energy consumption (LNRE), total population (LPOPU), and urbanization (LURB)—are found to be statistically significant and stationary at their initial levels, I(0).
Crucially, these diagnostic outcomes explicitly demonstrate that none of the macroeconomic or institutional series exhibits I(2) integration properties. Since all analyzed variables are strictly integrated at either I(0) or I(1), the validity of the panel empirical design is preserved, establishing a robust foundation for the subsequent second-generation panel cointegration analysis and long-run estimations.

5.5. Cointegration Analysis Results

To establish whether a long-run equilibrium relationship exists among CO2 emissions, institutional quality, technological progress, natural resource dependency, and the designated control variables, multiple panel cointegration tests were executed. As documented in Table 9, the first-generation Kao (1999) test—evaluated across the full model specification—unanimously rejects the null hypothesis of no cointegration across all five analytical statistics at the 1% and 5% significance levels. This strong rejection verifies that the integrated variables do not drift apart arbitrarily and share a cohesive long-run trajectory.
To reinforce these findings, Pedroni (2004) and second-generation Westerlund (2007) robustness checks were performed. In accordance with operational software dimensions, these alternative frameworks evaluated the core baseline structure. The Pedroni test outputs solidify the Kao findings, rejecting the null hypothesis via the Modified Phillips–Perron t (significant at 5%) and the Augmented Dickey–Fuller t (significant at 10%) statistics. However, reflecting the complexities introduced by cross-sectional dependence, the second-generation Westerlund variance ratio test exhibits a statistically insignificant pattern, failing to reject the null hypothesis of no cointegration. This divergence between first-generation structural rejections and second-generation factor-adjusted results suggests that while a long-run equilibrium trajectory is strongly indicated by standard residual-based frameworks, the evidence becomes more nuanced when accounting for unobserved common factors. Given the structural tension in these diagnostic outputs, we refrain from claiming absolute or definitive cointegration. Instead, relying on the statistical consensus provided by most of the parametric formulations (Kao and Pedroni) alongside the small-sample properties of our GCC dataset, estimating the long-run coefficients via the FMOLS and PCSE frameworks remains cautiously justified as an empirical baseline.

5.6. Long-Run Estimation Results

The long-run empirical parameters estimated via the Fully Modified Ordinary Least Squares (FMOLS) and the Panel Corrected Standard Errors (PCSE) approaches are detailed in Table 10. The diagnostic performance indicates highly robust explanatory capacities, with R-squared values hovering at 0.8878 (FMOLS) and 0.8283 (PCSE), complemented by a highly significant Wald χ 2 statistic (310.33, p < 0.01).
Across both econometric models, institutional quality (LCC) demonstrates a highly robust carbon-mitigating effect. The coefficients are consistently negative and statistically significant at the 1% level (−0.2997 in FMOLS and −0.3044 in PCSE), establishing that institutional strengthening directly lowers environmental degradation in GCC countries. Similarly, the control metrics validate expectations: economic growth (LGDPpc), non-renewable energy consumption (LNRE), and urbanization (LURB) display positive, highly significant coefficients at the 1% level, identifying them as principal structural drivers of expanding carbon footprints. Conversely, renewable energy consumption (LRE) and population dimensions exhibit stable negative coefficients across both models, operating as vital tools for direct emissions abatement.
Regarding the remaining independent variables, minor variations occur due to the different weighting matrices of the estimators. Technological progress (LT) exerts a statistically significant negative influence under the FMOLS framework (−0.0287, p < 0.01), although it loses statistical significance within the PCSE specification. Furthermore, natural resource dependency (LNR) reveals a positive and highly significant long-run association with emissions under the baseline FMOLS estimator (0.1339, p < 0.01), aligning with the environmental resource curse hypothesis, while displaying an insignificant pattern under the cross-sectionally corrected PCSE baseline.

5.7. Robustness Check Results

To verify the structural integrity and stability of the long-run baseline estimates, alternative estimation techniques including Panel Generalized Method of Moments (Panel GMM), Generalized Linear Models (GLMs), and Robust Least Squares (RLS) were performed. As presented in Table 11, the alternative estimators confirm the stability of the baseline models, exhibiting a high degree of consistency in terms of both sign direction and statistical significance.
Specifically, institutional quality (LCC) maintains its stable negative and statistically significant association with CO2 emissions across the Panel GMM and GLM frameworks at the 5% significance level, reinforcing its direct carbon-mitigating capacity. For the static level Panel GMM estimation, a 2SLS instrument weighting matrix is utilized with an instrument specification including the baseline exogenous and predetermined level parameters alongside the constant vector (C, LCC, LT, LNR, LGDPPC, LRE, LNRE, LPOPU, LURB). The diagnostic framework reveals an instrument rank of 9. Because the number of instruments strictly equals the number of estimated coefficients, the specification is exactly identified (just identified) with zero degrees of freedom for overidentification testing. Consequently, the J-statistic approaches zero (2.63 × 10⁻¹⁵) and a conventional overidentification p-value is omitted by construction. Similarly, economic growth (LGDPPC), non-renewable energy consumption (LNRE), and urbanization (LURB) consistently display positive and highly significant coefficients across all three robustness formulations, validating their roles as the primary structural drivers of emissions acceleration in the GCC region.
Furthermore, renewable energy consumption (LRE) and total population (LPOPU) robustly preserve their negative, highly significant coefficients across all estimated methods. Lastly, the independent indicators for technological progress (LT) and natural resources (LNR) align closely with the patterns observed in the baseline PCSE model, showing statistically localized responses across the different robustness techniques. The near identity in the estimated coefficient magnitudes across PCSE, static Panel GMM, and GLMs stems from their shared reliance on linear level optimization platforms within a balanced, macro-panel configuration. Because the level GMM is precisely just-identified and the GLM utilizes a linear link function, the point estimates naturally converge toward the baseline OLS trajectory. Crucially, these estimators function as genuinely independent robustness checks because their independent utility lies not in altering the conditional mean coefficients, but in applying fundamentally distinct structural corrections to the variance-covariance weighting matrices to control for heteroskedasticity, cross-sectional dependence, and non-linear distribution fields independently. Overall, these findings verify that the empirical baseline analysis is not sensitive to the choice of estimator or diagnostic alterations, proving highly stable for policy inferences.

6. Discussion

The empirical findings obtained across the primary estimators (FMOLS and PCSE) and robust checks (Panel GMM, GLM, and RLS) offer a nuanced, multi-faceted understanding of the structural drivers of CO2 emissions in the GCC region. By evaluating these parameters, this section contextualizes regional economic dynamics within prevailing environmental economic theories while cautiously navigating the structural variations observed across different estimation techniques. Our baseline finding indicates that institutional quality yields a significant carbon-mitigating effect across almost all foundational configurations (FMOLS: −0.2997; PCSE: −0.3044; GMM: −0.3044), aligning with a substantial body of international evidence. Studies across emerging Asia [65], Turkey [39], and OECD economies [22] similarly demonstrate that governance quality acts as an effective moderator of environmental degradation. However, this mitigation effect is conditional on the choice of estimator, as it loses its statistical significance within the Robust Least Squares (RLS) framework, indicating that the baseline institutional dividend may be sensitive to extreme outliers or structural breaks within the panel layout.
Furthermore, within the GCC bloc, this institutional mechanism operates directly rather than as an interactive moderator, since our empirical model is explicitly a direct-effects framework. Stronger governance directly channels massive hydrocarbon revenues away from traditional, highly polluting public projects and redirects them toward green infrastructure. For instance, the UAE’s historically high corruption control scores correspond with its pioneering execution of mega-projects like the Mohammed balance Rashid Al Maktoum Solar Park [66]. Furthermore, robust institutions directly enforce rigorous emission standards during upstream oil and gas extraction, which substantially reduces venting and flaring. Conversely, fluctuating or lower institutional indicators, as seen historically in parts of the bloc, explain delays in executing comprehensive energy-diversification strategies despite abundant fiscal wealth [67].
The impact of technological progress displays a striking divergence across estimators, demanding extreme caution in its interpretation. While technological advancement significantly abates carbon emissions under the long-run baseline FMOLS model (−0.0287), it turns statistically insignificant under the cross-sectionally corrected PCSE, Panel GMM, GLM, and RLS frameworks. The negative long-run coefficient provides localized support for Ecological Modernization Theory, suggesting that sustained investments in innovation eventually introduce cleaner production methods, mirroring findings in China [45] and OECD states [43]. However, because our proxy utilizes total patent applications rather than dedicated green patents or environmental innovations, this long-run mitigation effect cannot be interpreted as direct evidence of eco-innovation effectiveness. Moreover, the widespread statistical insignificance across the alternative estimators indicates that general technological progress does not consistently mitigate emissions in the GCC. This underscores a technological locking-in effect, where parallel technological breakthroughs are continuously deployed to optimize and expand fossil fuel extraction capacities, meaning that generalized technological scaling has not yet achieved the critical structural threshold required to offset the emissions generated by highly advanced, technology-driven hydrocarbon production.
The natural resource variable presents a highly complex, divergent outcome across estimators that prevents any simplified conclusion regarding a robust resource curse. Under the long-run baseline FMOLS framework, resource dependency exerts a significant positive impact on emissions (0.1339), supporting the Environmental Resource Curse hypothesis and aligning with long-run structural studies in BRICS [16] and China [29]. This specific parameter suggests that a long-term macroeconomic architecture heavily anchored in resource rents tends to lock the economy into fossil fuel reliance. Crucially, however, this positive association is entirely non-robust to alternative estimation procedures; it becomes statistically insignificant within the PCSE and GMM frameworks and completely reverses into a negative and statistically significant coefficient under the RLS technique. This empirical divergence indicates that the resource–emissions nexus is highly sensitive to model specifications and cross-sectional corrections. Rather than an absolute curse, resource abundance appears highly conditional [13]. When GCC states leverage strong sovereign wealth funds during specific periods to aggressively sponsor decarbonization, such as Saudi Arabia’s NEOM hydrogen initiatives, the contemporaneous coupling between resource wealth and emissions can be structurally altered or neutralized.
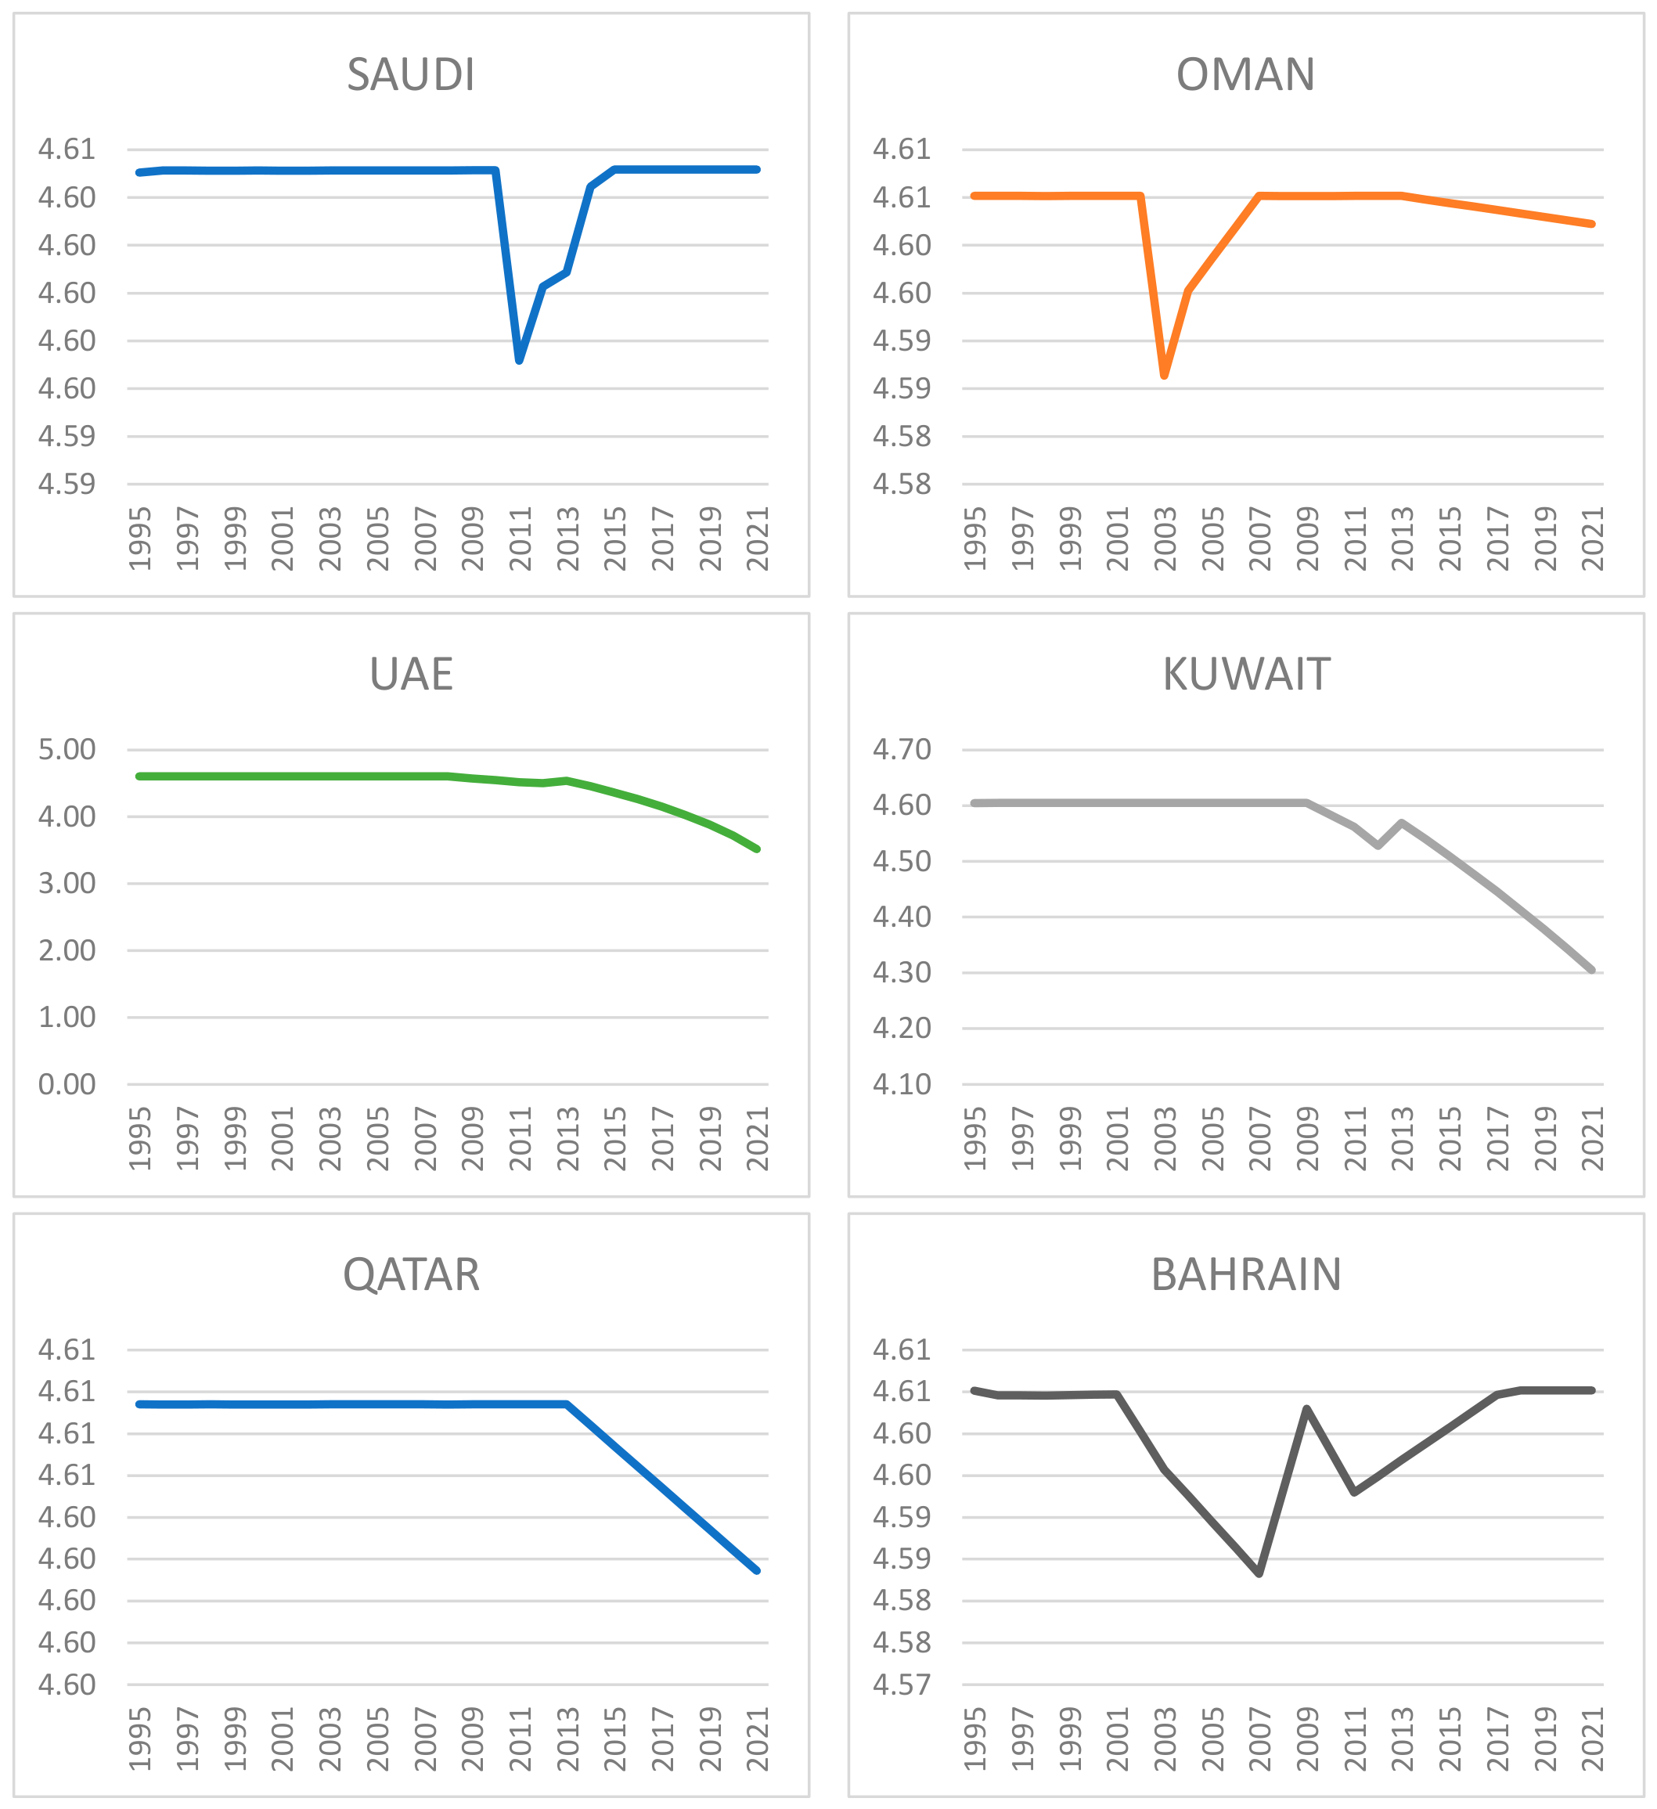
The parameters for economic growth (FMOLS: 0.2592; PCSE: 0.6310) demonstrate that economic expansion in the GCC remains deeply carbon intensive. This aligns with region-specific literature [18] while contrasting with decoupled trajectories observed in post-industrial diversified economies. Higher income tiers in the GCC drive carbon emissions through highly subsidized domestic electricity consumption, intensive infrastructure expansions, and heavy transport networks. This structural reality is further illuminated by the sharp contrast of elasticity within the energy mix across all models. Non-renewable energy consumption exerts a massive, highly significant positive impact (FMOLS: 0.1577; PCSE: 0.2652), acting as the primary driver of pollution due to the historical dependency on natural gas and oil for domestic power generation (See Figure 4). Conversely, renewable energy consumption demonstrates a highly stable, significant carbon-mitigating effect (FMOLS: −0.0408; PCSE: −0.0512). While statistically robust and aligning with global literature [68], its small coefficient magnitude compared to non-renewables emphasizes that current clean energy penetration has not yet reached the scale required to completely displace fossil fuel dominance.
Crucially, the mitigation of CO2 emissions within the GCC cannot be achieved effectively through isolated national policies, given the deep economic integration and shared environmental vulnerabilities of the region. A core contribution of our empirical analysis is highlighting the necessity of an inter-country correlation framework for emission control [69]. The cross-sectional dependence confirmed in our diagnostic tests mathematically underscores that environmental shocks and policy shifts in one GCC nation generate significant spillover effects across its neighbors [70]. Therefore, aligning regional carbon reduction efforts—such as establishing unified regional carbon accounting protocols, cross-border carbon trading frameworks, and synchronized environmental regulations—is essential to prevent carbon leakage and maximize the regional elasticity of renewable energy deployment.
Furthermore, this inter-country correlation is practically demonstrated through the expansion of shared energy infrastructure and technological collaboration. The Gulf Cooperation Council Interconnection Authority (GCCIA) represents a prime structural mechanism to operationalize this cross-border emission control, enabling the optimization of solar and clean energy transmission across different time zones and peaking periods [70]. By correlating emission control strategies, leading nations like the UAE and Saudi Arabia can deploy joint regional technological ventures, focusing on scalable carbon capture, utilization, and storage (CCUS) clusters and green hydrogen frameworks [64]. This coordinated approach transforms emission control from an individual domestic burden into a cooperative regional framework, drastically increasing the collective capacity of the GCC bloc to reduce resource-dependent growth from environmental degradation.
Our finding of a significant negative coefficient on population size under the primary estimators (FMOLS: −0.0207; PCSE: −0.0314) runs counter to conventional STIRPAT-based literature, which traditionally posits that population size mechanically drives aggregate environmental degradation [29,31]. However, because our dependent variable is specified as CO2 emissions per capita, the presence of total population on the right-hand side introduces inherent mathematical complexities that necessitate extreme caution, and this finding should be interpreted purely as an exploratory empirical pattern rather than a definitive causal effect. Structurally, this negative coefficient may reflect a potential demographic layout unique to the GCC, where population growth is heavily driven by temporary, transient foreign labor inflows rather than organic domestic expansions. In states like Qatar and the UAE, expatriates constitute a significant majority of the population, often residing in collective, highly regularized urban living arrangements or working in low-emission service and construction sectors, meaning their marginal per capita carbon footprint may be substantially lower than that of nationals [70]. Additionally, the region’s dominant emission engine—the upstream hydrocarbon extraction sector—operates independently of local demographic size, guided instead by global demand and sovereign quotas [28]. Rapid population growth has also coincided with the structural deployment of highly efficient public infrastructure and modern building codes [69]. Nonetheless, given the mathematical interaction within the per capita specification, these substantive claims regarding expatriate labor and collective housing remain hypotheses that require future verification using aggregate emissions models or dedicated micro-demographic data.
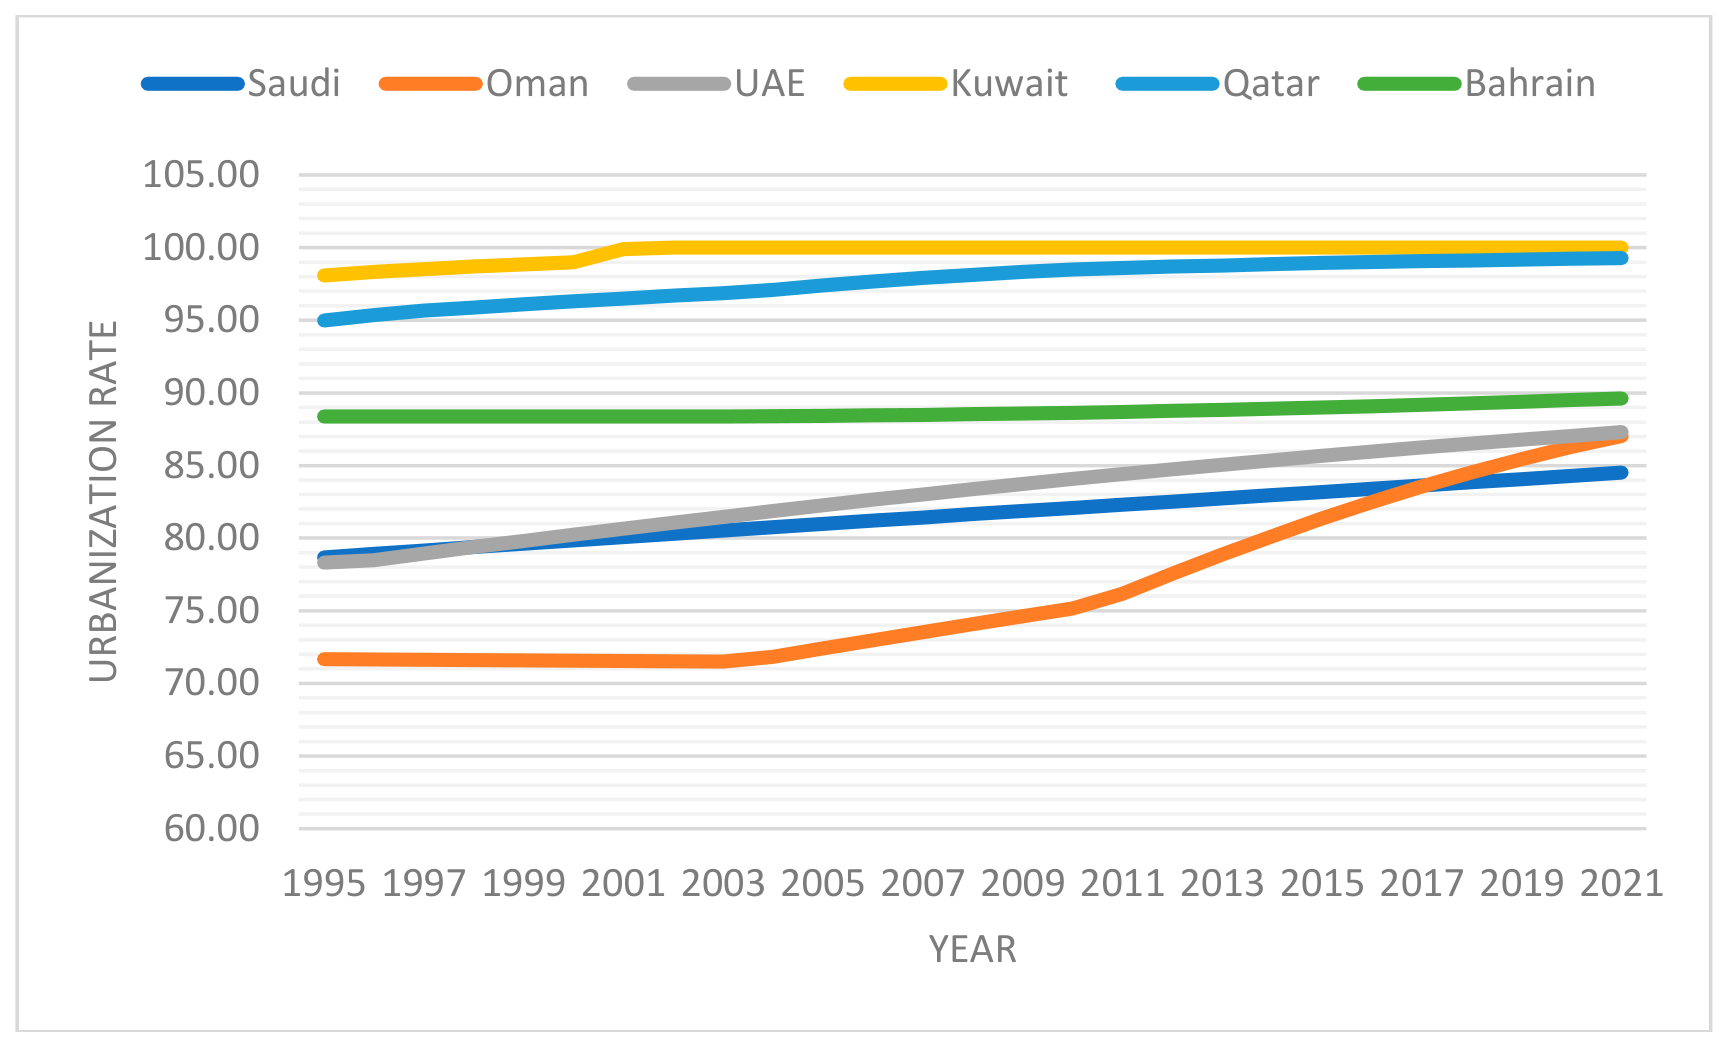
In sharp contrast to the population metric, urbanization yields the largest positive coefficient across all evaluated models (FMOLS: 3.6712; PCSE: 2.0823). This strongly supports findings by Hanif (2018) and Majeed et al. (2021) [42,53]. The massive magnitude of this urban coefficient is uniquely tied to the hyper-urbanized, car-dependent urban layout of GCC cities (See Figure 5). Urban development in the Gulf is characterized by extreme horizontal expansion, low-density zoning, absolute reliance on private vehicles, and climate-driven, permanent dependency on high-load HVAC systems. Consequently, while the expanding numbers of residents do not inherently boost carbon emissions due to labor tracking and structural efficiencies, the physical process of urban concentration acts as the single most critical structural driver of environmental degradation in the region.

7. Conclusions and Policy Implications

7.1. Conclusions

This study investigates the structural and individual relationships between institutional quality, technological progress, natural resource dependency, and CO2 emissions in the GCC countries over the period 1995–2021. By expanding the stochastic STIRPAT framework, the empirical design captures baseline long-term equilibrium vectors and contemporaneous dynamics through the combined execution of Fully Modified Ordinary Least Squares (FMOLS) and Panel Corrected Standard Errors (PCSE) estimators, alongside robust checks via Panel Generalized Method of Moments (GMM), GLM, and RLS methods. The diagnostics confirm that the underlying macro-panels are strictly integrated at I(0) or I(1), entirely ruling out any I(2) specification issues, while successfully neutralizing heteroscedasticity, serial correlation, and cross-sectional dependence.
The empirical outcomes reveal a solid consensus across the majority of estimated models regarding the primary structural drivers of the GCC’s carbon footprint. Specifically, economic growth, non-renewable energy consumption, and urbanization act as the principal contributors to environmental degradation, with the spatial process of urbanization yielding the largest positive elasticity coefficient across specifications. Conversely, institutional quality (proxied by corruption control) and renewable energy consumption demonstrate a statistically significant carbon-mitigating association. However, the analysis also uncovers critical model-dependent divergences; technological progress and natural resource dependency display statistical significance strictly within the long-run FMOLS specification but lose their significance under contemporaneous cross-sectional corrections (PCSE and GMM). This divergence demonstrates that resource reliance and general innovation operate through highly conditional, localized structural path-dependencies rather than deterministic linear trajectories.

7.2. Policy Implications

Drawing cautiously from the empirical parameters, this section translates the estimated associations into disciplined policy measures tailored to the GCC context, carefully separating universally robust drivers from model-dependent indicators and avoiding deterministic causal language.

7.2.1. Recommendations for National Governments

Our finding that economic growth, non-renewable energy consumption, and urbanization are consistently associated with higher emissions across all models suggests that accelerating structural decoupling may be vital for the region. National governments may consider introducing tailored carbon pricing mechanisms, such as phased carbon taxes or cap-and-trade systems, ensuring that potential fiscal revenues are directed toward supporting public renewable energy investments. Because the expansionary impact of urbanization represents the largest and most consistent coefficient across all specifications, targeted urban planning interventions are strongly suggested. Clear policy frameworks that encourage green building certifications, district cooling in high-density developments, and expanded public transit infrastructure may help mitigate the carbon footprint associated with the car-dependent urban layout of Gulf cities. Additionally, the robust mitigating role of renewable energy consumption supports the relevance of implementing renewable portfolio standards to encourage clean-energy penetration.
By contrast, policy actions addressing institutional quality, natural resources, and general technology must be framed with heightened caution. While governance quality shows a mitigating association in FMOLS, PCSE, GMM, and GLM, this effect is not universally significant across all models, as demonstrated by its insignificance in the RLS specification. This structural variance suggests that while anti-corruption and institutional transparency frameworks remain relevant to environmental oversight, their effectiveness may be sensitive to localized data fluctuations or outliers. Furthermore, because the positive resource–emissions relationship is unique to the FMOLS specification and turns insignificant or reverses across alternative estimators, resource wealth cannot be treated as an absolute driver of degradation. Rather than concluding that resource dependency automatically drives emissions, the estimated associations suggest that resource wealth is conditional; therefore, strategic management of sovereign wealth funds during periods of resource abundance may help buffer the long-run environmental liabilities of hydrocarbon reliance.

7.2.2. Recommendations for Regional Bodies

The diagnostic confirmation of cross-sectional dependence among the GCC macro-panels reasonably supports a general argument for coordinated regional policy, as environmental dynamics in one nation generate potential spillover effects across neighbors. However, since specific regional mechanisms are not directly tested within our empirical design, proposed institutional instruments should be viewed as forward-looking policy extensions rather than direct empirical conclusions.
The verified cross-sectional dependence suggests that general regional coordination through the GCC Secretariat could maximize the collective capacity of the bloc to address shared environmental challenges. Within this cooperative framework, expanding the operational integration of the Gulf Cooperation Council Interconnection Authority (GCCIA) represents a plausible mechanism to facilitate a harmonized renewable energy grid, potentially allowing states with advanced solar infrastructure to optimize clean power distribution during localized peak periods. Similarly, a coordinated regional approach could support the synchronized adoption of building energy efficiency standards to address the shared challenge of rapid urbanization.
Furthermore, because the empirical model relies on a general technological proxy (total patent applications) and does not directly measure green patents, carbon-capture technologies, or advanced chemical frameworks, specific industrial recommendations must be interpreted as broader, forward-looking policy extensions rather than direct outcomes of the regression. While the empirical model does not test these technologies, general long-run technological trends suggest that regional bodies could consider establishing collaborative innovation frameworks. Such frameworks might conceptually support future research into specialized emission-reducing avenues, such as utility-scale carbon capture, utilization, and storage (CCUS) clusters, green hydrogen systems, or advanced porous materials like crystalline metal–organic frameworks (MOFs) for electro-, thermo-, and photocatalytic CO2 conversion.

7.2.3. Recommendations for the Private Sector

The estimated associations offer useful insights for private firms and industrial conglomerates operating within the GCC bloc. Because non-renewable energy consumption is consistently linked with increased emissions, large-scale industrial consumers and commercial developers face potential long-term transition risks, which is consistent with the logic of expanding private clean energy procurement through corporate power purchase agreements (PPAs). Private sector entities may benefit from aligning their corporate research and development with national sustainability targets, focusing on operational energy efficiency to reduce marginal carbon intensity.
Furthermore, given the model-dependent nature of the resource and technology parameters, private and state-backed hydrocarbon firms should approach technology adoption cautiously, focusing on localized efficiency improvements. Financial institutions across the GCC could support these structural adjustments by designing green financing instruments, such as sustainability-linked bonds and transition loans. The terms of these instruments could be structured to reflect the borrower’s verified reductions in emissions intensity, thereby steering private capital flows to mirror the energy-diversification trajectories suggested by the empirical evidence.

7.3. Limitations and Future Research

Although this study provides valuable insights into the determinants of CO2 emissions in GCC countries, certain data limitations should be noted. First, technological progress was proxied using the total number of patents, which does not explicitly distinguish between green and non-green innovations. This measure was selected for its data consistency across the study period and its frequent use in prior literature. Future studies could extend this work by employing more targeted indicators of clean or environmental technologies. Considering the updated data to post-2021 for all variables.
Second, institutional quality was represented solely by the Control of Corruption index, which captures an important but partial dimension of institutional effectiveness. Future research could benefit from integrating additional institutional dimensions such as WGI dimensions, rule of law, government effectiveness, or regulatory quality to provide a more comprehensive institutional assessment. Considering the updating of data to post-2021 for all variables. Third, Future research may address potential country-level heterogeneity within GCC economies that could be masked in panel estimations by employing country-specific time-series analyses or utilizing more disaggregated indicators of green technological development.

Author Contributions

Conceptualization, X.Z.; Methodology, E.A.A.A.A.; Formal analysis, E.A.A.A.A.; Data curation, E.A.A.A.A.; Writing—original draft, E.A.A.A.A.; Writing—review & editing, E.A.A.A.A.; Supervision, X.Z. All authors have read and agreed to the published version of the manuscript.

Funding

This research was funded by Fujian Province Humanities and Social Sciences Research Base-Quantitative Economics Research Center, Huaqiao University, Xiamen City (Project No. 20242XD102).

Institutional Review Board Statement

Not applicable.

Informed Consent Statement

Not applicable.

Data Availability Statement

Data will be made available on request.

Conflicts of Interest

The authors declare no conflicts of interest.

References

  1. Bekhet, H.A.; Matar, A.; Yasmin, T. CO2 emissions, energy consumption, economic growth, and financial development in GCC countries: Dynamic simultaneous equation models. Renew. Sustain. Energy Rev. 2017, 70, 117–132. [Google Scholar] [CrossRef] [Scilit]
  2. World Bank. Available online: https://databank.worldbank.org/source/world-development-indicators (accessed on 3 April 2026).
  3. Abdullah Abbas Amer, E.A.; Ali Meyad, E.M.; Meyad, A.M.; Mohsin, A.K.M. Impacts of renewable and disaggregated non-renewable energy consumption on CO2 emissions in GCC countries: A STIRPAT model analysis. Heliyon 2024, 10, e30154. [Google Scholar] [CrossRef] [Scilit]
  4. Ahmad, F.; Draz, M.U.; Chang, W.Y.; Yang, S.C.; Su, L. More than the resource curse: Exploring the nexus of natural resource abundance and environmental quality in northwestern China. Resour. Policy 2021, 70, 101902. [Google Scholar] [CrossRef] [Scilit]
  5. Ahmad, F.; Xu, H.; Draz, M.U.; Ozturkc, I.; Chandio, A.A.; Wang, Y.; Zhang, D. The case of China’s fiscal decentralization and eco-efficiency: Is it worthwhile or just a bootless errand? Sustain. Prod. Consum. 2021, 26, 89–100. [Google Scholar] [CrossRef] [Scilit]
  6. Ahmed, S.; Khan, M.K.; Kim, J. Revolutionary advancements in carbon dioxide valorization via metal-organic framework-based strategies. Carbon Capture Sci. Technol. 2025, 15, 100405. [Google Scholar] [CrossRef] [Scilit]
  7. Ahmed, Z.; Ahmad, M.; Rjoub, H.; Kalugina, O.A.; Hussain, N. Economic growth, renewable energy consumption, and ecological footprint: Exploring the role of environmental regulations and democracy in sustainable development. Sustain. Dev. 2021, 30, 595–605. [Google Scholar] [CrossRef] [Scilit]
  8. Al-Mulali, U.; Saboori, B.; Ozturk, I. Investigating the environmental Kuznets curve hypothesis in Vietnam. Energy Policy 2015, 76, 123–131. [Google Scholar] [CrossRef] [Scilit]
  9. Alqahtani, A.; Bouri, E.; Vo, X.V. Predictability of GCC stock returns: The role of geopolitical risk and crude oil returns. Econ. Anal. Policy 2020, 68, 239–249. [Google Scholar] [CrossRef] [Scilit]
  10. Amer, E.A.A.A.; Meyad, E.M.A.; Gao, Y.; Niu, X.; Chen, N.; Xu, H.; Zhang, D. Exploring the link between natural resources, urbanization, human capital, and ecological footprint: A case of GCC countries. Ecol. Indic. 2022, 144, 109556. [Google Scholar] [CrossRef] [Scilit]
  11. Amer, E.A.A.A.; Zhang, X.; Huang, L.; Huang, L.; Cao, H.; Meyad, E.M.A.; Abdelwahed, A. When coal meets growth: Exploring the interactive impact of energy use and economic expansion on China’s carbon emissions. Results Eng. 2026, 31, 111486. [Google Scholar] [CrossRef] [Scilit]
  12. Amer, E.A.A.A.; Xiuwu, Z.; Meyad, E.M.A.; Alareqi, M.M.; Bather, S.M.H.; Abdelwahed, A. Decoupling or dependency? Investigating the joint effects of natural gas consumption and economic growth on carbon dioxide emissions in gulf cooperation council countries. J. Clean. Prod. 2025, 522, 146285. [Google Scholar] [CrossRef] [Scilit]
  13. Amer, E.A.A.A.; Zhang, X.; Meyad, E.M.A.; Alareqi, M.M.; Bather, S.M.H.; Abdelwahed, A. Nexus between renewable-disaggregated non-renewable energy consumption and economic growth in GCC countries: A Cobb-Douglas production function analysis. Humanit. Soc. Sci. Commun. 2025, 12, 1097. [Google Scholar] [CrossRef] [Scilit]
  14. Amer, E.A.A.A.; Zhang, X.; Meyad, E.M.A.; Alareqi, M.M.; Bather, S.M.H.; Abdelwahed, A. Urbanization, growth, and carbon footprints: A GCC perspective on sustainable development. Sustain. Futures 2025, 9, 100631. [Google Scholar] [CrossRef] [Scilit]
  15. Amer, E.A.A.A.; Zhang, X.; Meyad, E.M.A.; Alariqi, M.; Abdelwahed, A.; Alareqi, M.M.; Bather, S.M.H. Balancing progress and sustainability: Exploring the joint influences of oil consumption and economic growth on CO2 emissions: An empirical study of GCC countries. J. Environ. Manag. 2025, 394, 127340. [Google Scholar] [CrossRef] [Scilit]
  16. Ansari, M.A.; Ahmad, M.R.; Siddique, S.; Mansoor, K. An environment Kuznets curve for ecological footprint: Evidence from GCC countries. Carbon Manag. 2020, 11, 355–368. [Google Scholar] [CrossRef] [Scilit]
  17. Ashraf, J. Does political risk undermine environment and economic development in Pakistan? Empirical evidence from China–Pakistan economic corridor. Econ. Change Restruct. 2023, 56, 581–608. [Google Scholar] [CrossRef] [Scilit]
  18. Assi, A.F.; Zhakanova Isiksal, A.; Tursoy, T. Renewable energy consumption, financial development, environmental pollution, and innovations in the ASEAN + 3 group: Evidence from (P-ARDL) model. Renew. Energy 2021, 165, 689–700. [Google Scholar] [CrossRef] [Scilit]
  19. Azam, A.; Rafiq, M.; Shafique, M.; Yuan, J. Mitigating Carbon Emissions in China: The Role of Clean Energy, Technological Innovation, and Political-Institutional Quality. Front. Environ. Sci. 2022, 10, 814439. [Google Scholar] [CrossRef] [Scilit]
  20. Badeeb, R.A.; Lean, H.H.; Shahbaz, M. Are too many natural resources to blame for the shape of the Environmental Kuznets Curve in resource-based economies? Resour. Policy 2020, 68, 101694. [Google Scholar] [CrossRef] [Scilit]
  21. Balsalobre-Lorente, D.; Shahbaz, M.; Roubaud, D.; Farhani, S. How economic growth, renewable electricity and natural resources contribute to CO2 emissions? Energy Policy 2018, 113, 356–367. [Google Scholar] [CrossRef] [Scilit]
  22. Bekun, F.V.; Alola, A.A.; Sarkodie, S.A. Toward a sustainable environment: Nexus between CO2 emissions, resource rent, renewable and nonrenewable energy in 16-EU countries. Sci. Total Environ. 2019, 657, 1023–1029. [Google Scholar] [CrossRef] [Scilit]
  23. Boujedra, F.; Ben Jebli, M. Unraveling the interaction effect between the educated labor force and patent applications on environmental quality in OECD countries: Investigation of N-shaped EKC hypothesis. Clim. Change 2025, 178, 4. [Google Scholar] [CrossRef] [Scilit]
  24. BP. BP Statistical Review of World Energy 2019: An Unsustainable Path; BP: London, UK, 2019; Available online: https://www.bp.com/ (accessed on 3 April 2026).
  25. Danish Baloch, M.A.; Mahmood, N.; Zhang, J.W. Effect of natural resources, renewable energy and economic development on CO2 emissions in BRICS countries. Sci. Total Environ. 2019, 678, 632–638. [Google Scholar] [CrossRef] [Scilit]
  26. Khan, M.K.; Khan, M.I.; Rehan, M. The relationship between energy consumption, economic growth and carbon dioxide emissions in Pakistan. Financ. Innov. 2020, 6, 1. [Google Scholar] [CrossRef] [Scilit]
  27. Kirikkaleli, D.; Osmanlı, A. The Impact of Political Stability on Environmental Quality in the Long Run: The Case of Turkey. Sustainability 2023, 15, 9056. [Google Scholar] [CrossRef] [Scilit]
  28. Obobisa, E.S.; Chen, H.; Mensah, I.A. The impact of green technological innovation and institutional quality on CO2 emissions in African countries. Technol. Forecast. Soc. Change 2022, 180, 121670. [Google Scholar] [CrossRef] [Scilit]
  29. Xu, D.; Hussain, J. Globalization, institutions, and environmental quality in Middle East and North African countries. Environ. Sci. Pollut. Res. 2023, 30, 68951–68968. [Google Scholar] [CrossRef] [Scilit]
  30. Du, J.; Ali, K.; Alnori, F.; Ullah, S. The nexus of financial development, technological innovation, institutional quality, and environmental quality: Evidence from OECD economies. Environ. Sci. Pollut. Res. 2022, 29, 58179–58200. [Google Scholar] [CrossRef] [Scilit]
  31. Wang, S.; Zeng, J.; Liu, X. Examining the multiple impacts of technological progress on CO2 emissions in China: A panel quantile regression approach. Renew. Sustain. Energy Rev. 2019, 103, 140–150. [Google Scholar] [CrossRef] [Scilit]
  32. Hashmi, R.; Alam, K. Dynamic relationship among environmental regulation, innovation, CO2 emissions, population, and economic growth in OECD countries: A panel investigation. J. Clean. Prod. 2019, 231, 1100–1109. [Google Scholar] [CrossRef] [Scilit]
  33. Khan, A.; Chenggang, Y.; Hussain, J.; Bano, S.; Nawaz, A. Natural resources, tourism development, and energy-growth-CO2 emission nexus: A simultaneity modeling analysis of BRI countries. Resour. Policy 2020, 68, 101751. [Google Scholar] [CrossRef] [Scilit]
  34. Huang, J.; Chen, X.; Yu, K.; Cai, X. Effect of technological progress on carbon emissions: New evidence from a decomposition and spatiotemporal perspective in China. J. Environ. Manag. 2020, 274, 110953. [Google Scholar] [CrossRef] [Scilit]
  35. Shen, Y.; Su, Z.W.; Malik, M.Y.; Umar, M.; Khan, Z.; Khan, M. Does green investment, financial development and natural resources rent limit carbon emissions? A provincial panel analysis of China. Sci. Total Environ. 2021, 755, 142538. [Google Scholar] [CrossRef] [Scilit]
  36. Erdoğan, S.; Çakar, N.D.; Ulucak, R.; Danish; Kassouri, Y. The role of natural resources abundance and dependence in achieving environmental sustainability: Evidence from resource-based economies. Sustain. Dev. 2021, 29, 143–154. [Google Scholar] [CrossRef] [Scilit]
  37. Faheem, M.; Chaudhry, I.S.; Hussain, S. Natural Resources, Institutional Quality and Financial Development in GCC Member Countries: Visiting ‘Resource Curse Hypothesis’ by DCCE Estimation. Rev. Econ. Dev. Stud. 2021, 7, 131–145. [Google Scholar] [CrossRef] [Scilit]
  38. Khan, M.; Rana, A.T. Institutional quality and CO2 emission–output relations: The case of Asian countries. J. Environ. Manag. 2021, 279, 111569. [Google Scholar] [CrossRef] [Scilit]
  39. Dong, K.; Sun, R.; Hochman, G. Do natural gas and renewable energy consumption lead to less CO2 emission? Empirical evidence from a panel of BRICS countries. Energy 2017, 141, 1466–1478. [Google Scholar] [CrossRef] [Scilit]
  40. El-Agouz, N. The Impact of Economic Growth on CO2 Emissions and Energy Consumption (In the Gulf Cooperation Council Countries); Springer International Publishing: Cham, Switzerland, 2017; Volume 3. [Google Scholar]
  41. Gerelmaa, L.; Kotani, K. Further investigation of natural resources and economic growth: Do natural resources depress economic growth? Resour. Policy 2016, 50, 312–321. [Google Scholar] [CrossRef] [Scilit]
  42. Hanif, I. Impact of fossil fuels energy consumption, energy policies, and urban sprawl on carbon emissions in East Asia and the Pacific: A panel investigation. Energy Strategy Rev. 2018, 21, 16–24. [Google Scholar] [CrossRef] [Scilit]
  43. Havranek, T.; Horvath, R.; Zeynalov, A. Natural Resources and Economic Growth: A Meta-Analysis. World Dev. 2016, 88, 134–151. [Google Scholar] [CrossRef] [Scilit]
  44. Howitt, P. Endogenous Growth Theory. In The New Palgrave Dictionary of Economics, 3rd ed.; Palgrave Macmillan: London, UK, 2018. [Google Scholar] [CrossRef] [Scilit]
  45. Hunjra, A.I.; Tayachi, T.; Chani, M.I.; Verhoeven, P.; Mehmood, A. The moderating effect of institutional quality on the financial development and environmental quality nexus. Sustainability 2020, 12, 3805. [Google Scholar] [CrossRef] [Scilit]
  46. Kabbani, N.; Ben Mimoune, N. Economic Diversification in the Gulf: Time to Redouble Efforts; Brookings: Washington, DC, USA, 2021; Available online: https://www.brookings.edu/research/economic-diversification-in-the-gulf-time-to-redouble-efforts/ (accessed on 3 March 2026).
  47. Khan, I.; Hou, F.; Le, H.P. The impact of natural resources, energy consumption, and population growth on environmental quality: Fresh evidence from the United States of America. Sci. Total Environ. 2021, 754, 142222. [Google Scholar] [CrossRef] [Scilit]
  48. Khanday, I.N.; Wani, I.U.; Tarique, M. Do financial development and institutional quality matter for ecological sustainability in the long run? Evidence from India. Manag. Environ. Qual. Int. J. 2023, 34, 1668–1689. [Google Scholar] [CrossRef] [Scilit]
  49. Leiwakabessy, E.; Payapo, R.W. The Dynamic Link of Energy Consumption, Economic Growth and Poverty in Eastern Indonesia: Panel VECM and FMOLS Approach. Int. J. Energy Econ. Policy 2022, 12, 83–90. [Google Scholar] [CrossRef] [Scilit]
  50. Li, Z.; Shao, S.; Shi, X.; Sun, Y.; Zhang, X. Structural transformation of manufacturing, natural resource dependence, and carbon emissions reduction: Evidence of a threshold effect from China. J. Clean. Prod. 2019, 206, 920–927. [Google Scholar] [CrossRef] [Scilit]
  51. Mahmood, H. The effects of natural gas and oil consumption on CO2 emissions in GCC countries: Asymmetry analysis. Environ. Sci. Pollut. Res. 2022, 29, 57980–57996. [Google Scholar] [CrossRef] [Scilit]
  52. Mahmood, H.; Tanveer, M.; Mohamad Almurad, H.; Abdel Hameed Hasnin, E.; Houaneb, A. The impact of financial market development and foreign direct investment on carbon intensity from oil, gas, gas flaring, and cement emissions in GCC Countries: A spatial analysis. Energy Strategy Rev. 2026, 63, 102011. [Google Scholar] [CrossRef] [Scilit]
  53. Majeed, A.; Wang, L.; Zhang, X.; Muniba; Kirikkaleli, D. Modeling the dynamic links among natural resources, economic globalization, disaggregated energy consumption, and environmental quality: Fresh evidence from GCC economies. Resour. Policy 2021, 73, 102204. [Google Scholar] [CrossRef] [Scilit]
  54. Mehmood, U. Natural resources and CO2 emissions nexus: Sustainable development path for South Asian countries. Kuwait J. Sci. 2022, 49, 3. [Google Scholar] [CrossRef] [Scilit]
  55. Murshed, M.; Dao, N.T.T. Revisiting the CO2 emission-induced EKC hypothesis in South Asia: The role of Export Quality Improvement. GeoJournal 2022, 87, 535–563. [Google Scholar] [CrossRef] [Scilit]
  56. Nathaniel, S.P.; Barua, S.; Ahmed, Z. What drives ecological footprint in top ten tourist destinations? Evidence from advanced panel techniques. Environ. Sci. Pollut. Res. 2021, 28, 38322–38331. [Google Scholar] [CrossRef] [Scilit]
  57. Omri, A.; Daly, S.; Rault, C.; Chaibi, A. Financial development, environmental quality, trade and economic growth: What causes what in MENA countries. Energy Econ. 2015, 48, 242–252. [Google Scholar] [CrossRef] [Scilit]
  58. Dietz, T.; Rosa, E.A. Effects of Population and Affluence on CO2 Emissions. Proc. Natl. Acad. Sci. USA 1997, 94, 175–179. [Google Scholar] [CrossRef] [Scilit]
  59. Rahman, M.M.; Alam, K. Effects of corruption, technological innovation, globalisation, and renewable energy on carbon emissions in asian countries. Util. Policy 2022, 79, 101448. [Google Scholar] [CrossRef] [Scilit]
  60. Rahman, M.M.; Alam, K.; Velayutham, E. Reduction of CO2 emissions: The role of renewable energy, technological innovation and export quality. Energy Rep. 2022, 8, 2793–2805. [Google Scholar] [CrossRef] [Scilit]
  61. Raza, M.Y.; Hasan, M.M. Estimating the multiple impacts of technical progress on Bangladesh’s manufacturing and industrial sector’s CO2 emissions: A quantile regression approach. Energy Rep. 2022, 8, 2288–2301. [Google Scholar] [CrossRef] [Scilit]
  62. Saqib, N.; Usman, M.; Mahmood, H.; Abbas, S.; Ahmad, F.; Mihai, D.; Mallek, R.S. The moderating role of technological innovation and renewable energy on CO2 emission in O.E.C.D. countries: Evidence from panel quantile regression approach. Econ. Res.-Ekon. Istraz. 2023, 36, 2168720. [Google Scholar] [CrossRef] [Scilit]
  63. Tauseef Hassan, S.; Xia, E.; Lee, C.C. Mitigation pathways impact of climate change and improving sustainable development: The roles of natural resources, income, and CO2 emission. Energy Environ. 2021, 32, 338–363. [Google Scholar] [CrossRef] [Scilit]
  64. Ulucak, R.; Danish; Ozcan, B. Relationship between energy consumption and environmental sustainability in OECD countries: The role of natural resources rents. Resour. Policy 2020, 69, 101803. [Google Scholar] [CrossRef] [Scilit]
  65. Danish; Hassan, S.T.; Baloch, M.A.; Mahmood, N.; Zhang, J.W. Linking economic growth and ecological footprint through human capital and biocapacity. Sustain. Cities Soc. 2019, 47, 101516. [Google Scholar] [CrossRef] [Scilit]
  66. Wang, Z.; Bui, Q.; Zhang, B.; Pham, T.L.H. Biomass energy production and its impacts on the ecological footprint: An investigation of the G7 countries. Sci. Total Environ. 2020, 743, 140741. [Google Scholar] [CrossRef] [Scilit]
  67. Wu, R.; Geng, Y.; Liu, W. Trends of natural resource footprints in the BRIC (Brazil, Russia, India and China) countries. J. Clean. Prod. 2017, 142, 775–782. [Google Scholar] [CrossRef] [Scilit]
  68. Yas, Z.; Jaafer, K. Factors influencing the spread of green building projects in the UAE. J. Build. Eng. 2020, 27, 100894. [Google Scholar] [CrossRef] [Scilit]
  69. Yilanci, V.; Bozoklu, S.; Gorus, M.S. Are BRICS countries pollution havens? Evidence from a bootstrap ARDL bounds testing approach with a Fourier function. Sustain. Cities Soc. 2020, 55, 102035. [Google Scholar] [CrossRef] [Scilit]
  70. Zmami, M.; Ben-Salha, O. An empirical analysis of the determinants of CO2 emissions in GCC countries. Int. J. Sustain. Dev. World Ecol. 2020, 27, 469–480. [Google Scholar] [CrossRef] [Scilit]
Figure 1. Control of Corruption: Percentile Rank in GCC countries (1995–2021). Source: World Bank data from https://databank.worldbank.org/source/world-development-indicators (accessed on 3 April 2026).
Sustainability 18 08930 g001
Figure 2. Patents total for GCC countries (1995–2021). Source: World Bank data from https://databank.worldbank.org/source/world-development-indicators (accessed on 3 April 2026).
Sustainability 18 08930 g002
Figure 3. Total Natural resource rents (% of GDP) in GCC countries (1995–2021). Source: World Bank data from https://databank.worldbank.org/source/world-development-indicators (accessed on 3 April 2026).
Sustainability 18 08930 g003
Figure 4. Fossil fuel energy consumption as a percent of total energy consumption by GCC countries (1995–2021). Source: World Bank data https://databank.worldbank.org/source/world-development-indicators (accessed on 3 April 2026).
Sustainability 18 08930 g004
Figure 5. Urbanization rate by GCC countries (1995–2021). Source: World Bank data https://databank.worldbank.org/source/world-development-indicators (accessed on 3 April 2026).
Sustainability 18 08930 g005
Table 1. Summary of Key Empirical Studies on Determinants of CO2 Emissions.
Author(s)YearRegion/CountryPeriodMethodologyKey Findings Related to This Study
Institutional Quality and CO2 Emissions
Khan & Rana [26]2021Asia1996–2017Panel GMMInstitutional quality reduces emissions; effect varies by income level
Kirikkaleli & Osmanlı [27]2023Turkey1980–2018Time seriesCorruption control significantly reduces CO2 emissions
Obobisa et al. [28]2022Africa2000–2018Panel CS-ARDLInstitutional development enhances environmental policy effectiveness
Xu and Hussain [29]2023MENA1996–2019Panel FMOLSPolitical stability and regulatory quality influence emissions trajectories
Du et al. [30]2022OECD2000–2018Panel methodsInstitutional quality and technology jointly strengthen environmental performance
Technological Progress and CO2 Emissions
Wang et al. [31]2019China1990–2016Provincial analysisTechnology effects vary by sector and innovation type
Hashmi & Alam [32]2019OECD1999–2014Dynamic panelGreen innovation patents reduce emissions with policy support
Khan et al. [33]2020Pakistan1975–2017ARDLEnergy efficiency improvements critical for emission reductions
Huang et al. [34]2020China2000–2016ProvincialCleaner production technologies enable industrial transformation
Natural Resources and CO2 Emissions (Resource Curse Evidence)
Shen et al. [35]2021Global1990–2015Meta-analysisResource dependency generally increases emissions
2020aNW China1995–2017ProvincialNatural resources contribute to higher emissions
Khan et al. [33]2020BRI countries1990–2016PanelPositive resource–emissions relationship
Danish et al. [25]2019BRICS1990–2015PanelResource dependency raises emissions
Natural Resources and CO2 Emissions (Conditional/Moderating Evidence)
Balsalobre-Lorente et al. [21]2018cEU-51985–2016PanelResource abundance can reduce emissions with appropriate policies
Bekun et al. [22]2019EU-161996–2014PMGNatural resources reduce degradation with renewable energy
Erdoğan et al. [36]2021Emerging economies1990–2018PanelGovernance determines resource–emissions relationship
Badeeb et al. [20]2020bResource-dependentVariesReviewInstitutional quality conditions resource effects
2016China provinces2007–2015ProvincialRenewable resource utilization reduces emissions
GCC-Focused Studies
Faheem et al. [37]2018GCC1990–2015PanelFocus on economic diversification, not emissions
2021GCC1980–2018PanelExamines financial development, not environmental outcomes
2016GCC1980–2013PanelStudies FDI, overlooks environmental dimensions
Note: GMM, CS-ARDL, FMOLS, and PMG indicate Generalized Method of Moments, Cross-Sectionally Augmented Autoregressive Distributed Lag, Panel Fully Modified Ordinary Least Squares, and Pooled Mean Group. Source: Author’s own elaboration.
Table 2. Data description and sources.
VariablesSymbolSourcesThe Description
Carbon dioxideCO2World BankThis variable represents the amount of carbon dioxide emissions (metric tons per capita).
Control of CorruptionCCWorldwide Governance IndicatorsThis variable represents institutional quality (Control of Corruption: Percentile Rank).
Technological progressTGCC statistical centerThe total number of patents for each country has been used as an indicator of its technological progress.
Natural resourceNRWorld BankThis variable represents total natural resource rents (% of GDP).
Economic growthGDPWorld BankThis variable represents gross domestic product per capita (constant 2015 US$).
Renewable energy consumptionREWorld BankThis variable represents the percentage of renewable energy consumption (% of total final energy consumption).
Non-renewable energy consumptionNREWorld BankConcerning this variable, fossil fuel energy consumption is a percent of total energy consumption.
PopulationPOPWorld BankThis variable represents the total population in each country of the Gulf Cooperation Council during this period.
Source: Author’s own elaboration using the data from https://databank.worldbank.org/source/world-development-indicators (accessed on 3 April 2026).
Table 3. Descriptive statistics Results.
VariablesCO2CCTNr GDPRENREPOPUURB
Statistics
Mean25.5659367.50149421.08628.949033,481.60.0699196.77146,889,48387.8746
maximum70.0422391.38756397961.949273,493.2711003.6007100
Minimum6.71540343.8095303.2068515,671.73033.7226563.69771.509
Std.Dev13.0399911.08179802.75114.637516,691.780.1168510.05629,407,7448.89691
Observations162162162162162162162162162
Table 4. Correlation matrix Results.
VariableslnCo2LCCLTLNRLGDPLRELNRELPOPULURB
Statistics
LCO21.0000
LCC0.2301 ***
(0.0032)
1.0000
LT−0.2980 ***
(0.0001)
−0.1650 **
(0.0359)
1.0000
LNR−0.0385
(0.6269)
−0.0374
(0.6365)
−0.1268
(0.1077)
1.0000
LGDP0.7478 ***
(0.0000)
0.5228 ***
(0.0000)
−0.2438 ***
(0.0018)
0.0887
(0.2615)
1.0000
LRE0.1235
(0.1174)
0.2559 ***
(0.0010)
0.0810
(0.3057)
−0.2146 ***
(0.0061)
0.2964 ***
(0.0001)
1.0000
LNRE0.0515
(0.5149)
0.1483 *
(0.0596)
−0.2763 ***
(0.0004)
0.0968
(0.2203)
−0.1345 *
(0.0880)
−0.3467 ***
(0.0000)
1.0000
LPOPU−0.2714 ***
(0.0005)
−0.1358 *
(0.0850)
0.3842 ***
(0.0000)
0.6051 ***
(0.0000)
0.0028
(0.9713)
−0.0940
(0.2344)
−0.1371 *
(0.0820)
1.0000
LURBN0.7593 ***
(0.0000)
0.0625
(0.4296)
−0.0998
(0.2064)
0.0164
(0.8355)
0.5012 ***
(0.0000)
0.2131 ***
(0.0065)
−0.0681
(0.3895)
−0.1890 **
(0.0160)
1.0000
Note: Results in parentheses and *, **, *** indicate significance values at the 1%, 5%, and 10% levels, respectively.
Table 5. Cross-section dependence tests results.
VariablesBreusch–Pagan LMPesaran Scaled LMPesaran CD
LCO2126.8445 ***20.4199 ***−0.3008
LCC114.2600 ***18.1223 ***1.7260 *
LT110.1877 ***17.3788 ***9.4489 ***
LNR197.1497 ***33.2558 ***12.2658 ***
LGDP101.6365 ***15.8176 ***−1.0058
LRE234.3062 ***40.0397 ***15.1220 ***
LNRE99.02996 ***15.3417 ***2.3394 **
LPOP361.4157 ***63.2466 ***18.9927 ***
LURB291.9902 ***50.5713 ***16.7604 ***
Note: ***, **, and * show significance at the 1%, 5%, and 10% levels, respectively.
Table 6. Heteroskedasticity test result.
B-P/C-W Test
Ho: No Heteroskedasticity (Constant variance)
Chi 2(1) Statisticsp-value
3.97 **0.0462
Note: ** denote the significance levels at 5%. Source: Author’s calculations using Stata software (17 version).
Table 7. Autocorrelation and homogenous tests results.
Wooldridge Test for AutocorrelationPesaran–Yamagata Test for Slope Heterogeneity
Statisticsp-value7.080 ***0.000
44.980 ***0.00118.671 ***0.000
Note: *** denote the significance levels at 1%.
Table 8. Second-Generation Unit Root Test Results.
VariableAt Level I(0)At First Difference I(1)Status
t-barZ[t-bar]p-Valuet-barZ[t-bar]p-Value
LCO2−1.846−0.2170.414−4.093−5.8900.000 ***I(1)
LCC−1.4510.7790.782−3.562−4.5510.000 ***I(1)
LT−2.644−2.2310.013 **I(0)
LNR−0.7532.5430.995−2.302−1.3700.085 *I(1)
LGDP−1.902−0.3590.360−2.691−2.3520.009 ***I(1)
LRE−3.035−3.2200.001 ***I(0)
LNRE−2.632−2.2010.014 **I(0)
LPOPU−2.475−1.8040.036 **I(0)
LURB−3.128−3.4560.000 ***I(0)
Note: ***, **, and * denote statistical significance at the 1%, 5%, and 10% levels, respectively.
Table 9. Panel Cointegration Test Results.
Kao Test (Full Model)
Test StatisticStatistic Valuep-valueDecision
Modified Dickey–Fuller t−1.85770.0316 **Reject H0
Dickey–Fuller t−2.21560.0134 **Reject H0
Augmented Dickey–Fuller t−2.58970.0048 ***Reject H0
Unadjusted modified Dickey–Fuller t−3.63470.0001 ***Reject H0
Unadjusted Dickey–Fuller t−2.92060.0017 ***Reject H0
Pedroni & Westerlund Tests (Sensitivity Check)
Test FrameworkStatistic BasisStatistic Valuep-value
PedroniModified Phillips–Perron t2.20200.0138 **
Phillips–Perron t−1.20320.1145
Augmented Dickey–Fuller t−1.47320.0704 *
WesterlundVariance ratio−0.69210.2444
Note: ***, **, and * denote statistical significance at the 1%, 5%, and 10% levels, respectively.
Table 10. Baseline FMOLS and PCSE Long-Run Estimation Results.
Independent VariableFMOLS Model PCSE Model
Coefficientp-valueCoefficientp-value
LCC−0.2997 ***0.0000−0.3044 ***0.0000
LT−0.0287 ***0.0000−0.00400.4740
LNR0.1339 ***0.0000−0.02850.2670
LGDPpc0.2592 ***0.00000.6310 ***0.0000
LRE−0.0408 ***0.0000−0.0512 ***0.0000
LNRE0.1577 ***0.00460.2652 ***0.0040
LPOPU−0.0207 ***0.0000−0.0314 ***0.0000
LURB3.6712 ***0.00002.0823 ***0.0000
Constant −12.1981 ***0.0000
R-squared0.8878 0.8283
Adjusted R0.8775
Wald chi2 (8) 310.33 ***0.0000
Note: *** denote statistical significance at the 1%. Dependent variable is LCO2.
Table 11. Robustness Estimation Results (Panel GMM, GLM, and RLS).
Independent VariablePanel GMM Model GLM RLS Model
Coefficientp-ValueCoefficientp-ValueCoefficientp-Value
LCC−0.3044 **0.0119−0.3044 **0.0109−0.15190.1334
LT−0.00400.5374−0.00400.5365−0.00760.1714
LNR−0.02850.4069−0.02860.4056−0.0580 **0.0462
LGDP0.6310 ***0.00000.6310 ***0.00000.5266 ***0.0000
LRE−0.0512 ***0.0015−0.0513 ***0.0013−0.0415 ***0.0021
LNRE0.2652 **0.03470.2652 **0.03310.2555 **0.0153
LPOPU−0.0314 ***0.0040−0.0315 ***0.0034−0.0191 **0.0357
LURB2.0823 ***0.00002.0823 ***0.00001.8346 ***0.0000
C−12.1981 ***0.0000−12.198 ***0.0000−10.674 ***0.0000
R-squared0.8282
J-statistic2.63 × 10−15
Note: ***, ** denote statistical significance at the 1%, 5% levels, respectively. Dependent variable is LCO2.
Disclaimer/Publisher’s Note: The statements, opinions and data contained in all publications are solely those of the individual author(s) and contributor(s) and not of MDPI and/or the editor(s). MDPI and/or the editor(s) disclaim responsibility for any injury to people or property resulting from any ideas, methods, instructions or products referred to in the content.