Article

Upfront Carbon Footprint of Deep Microtunneling Vertical Nodes in Hualien Gravel Strata


by
Wen-Sheng Ou
1,* and
Yu-Sheng Chang
2
1
Department of Landscape Architecture, National Chin-Yi University of Technology, Taichung 411030, Taiwan
2
Department of Environmental Information and Engineering, Chung Cheng Institute of Technology, National Defense University, Taoyuan City 335009, Taiwan
*
Author to whom correspondence should be addressed.
Sustainability 2026, 18(17), 8911; https://doi.org/10.3390/su18178911
Submission received: 13 May 2026 / Revised: 25 August 2026 / Accepted: 26 August 2026 / Published: 31 August 2026

Abstract

Trenchless technologies are essential for urban sewerage infrastructure; however, standard Life Cycle Assessment (LCA) boundaries often overlook the upfront carbon footprint of vertical nodes (working shafts and precast manholes), particularly under deep excavation and difficult geological conditions. To bridge this research gap, this study establishes a comprehensive upfront carbon (Stages A1–A5) assessment model based on the EN 15804 standard, calibrated against empirical microtunneling inventory data from Hualien, Taiwan, characterized by deep excavations (10–12 m) and hard gravel strata (SPT N > 50). The empirical results reveal a dual carbon challenge: a geologically induced energy surge during construction (Stage A5, contributing 42.5% of total assessed upfront emissions) and an embodied carbon lock-in within high-strength permanent structures (Stages A1–A3, contributing 51.1%). To isolate these effects, a progressive four-scenario matrix was evaluated. Scenario simulations demonstrate that adopting high-volume supplementary cementitious materials (SCM) concrete manholes (50% cement replacement: 37.5% GGBS and 12.5% fly ash) achieves a material reduction factor (Rmat) of 15.0% in Stages A1–A3, fully offsetting the isolated 3539 kgCO2e construction-energy increment imposed by the hard gravel strata, although total upfront emissions in Scenario IV remain slightly higher than the baseline Scenario I when evaluated across the complete A1–A5 boundary. This study provides an expanded LCA framework and empirical evidence for integrating geological constraints and low-carbon material specifications into underground infrastructure procurement and engineering design.

1. Introduction

Global climate change necessitates urgent infrastructure decarbonization. While governments are accelerating the development of sewerage and underground pipeline networks to foster climate-resilient cities, this sector faces significant challenges regarding long-term sustainability and rising upfront carbon costs. A paradigm shift is emerging in the construction industry’s emission profile; as operational energy efficiency improves, the proportion of embodied carbon—stemming from material production (Stages A1–A3) and construction processes (Stage A5)—has steadily increased [1]. Defined as the assessed A1–A5 upfront carbon footprint of infrastructure prior to commissioning, these embodied emissions represent a largely irreversible “climate debt” that is difficult to offset through subsequent operational-stage efficiencies. Consequently, enhancing carbon efficiency in sewerage projects, particularly through the optimization of trenchless technologies, is now a critical priority for achieving net-zero infrastructure goals.
Despite the strategic importance of trenchless technologies, current Life Cycle Assessment (LCA) models suffer from a critical research gap: a “spatial imbalance” that over-relies on horizontal pipe segments while neglecting the substantial impacts of vertical nodes. Existing standards, such as the Japanese JSWA guidelines, focus predominantly on primary pipe materials and horizontal jacking energy. While Reinforced Concrete Pipe (RCP) materials represent approximately 23.5% of the total carbon footprint [2], this “lines-over-points” convention limits the effectiveness of broader decarbonization strategies. Empirical evidence from this study demonstrates that in deep-buried projects (10–12 m), the upfront carbon of vertical nodes—comprising working shafts and precast manholes—can reach 53% of that of horizontal jacking pipes. These nodes are not merely connectors but “carbon hyper-hotspots” due to the geometric complexity of shoring, groundwater control, and intensive excavation requirements. Furthermore, current benchmarks are largely based on standard soil assumptions (SPT N < 20) and shallow excavations [3,4], failing to account for the geological premium—the nonlinear escalation in material and energy consumption required for deep excavations in challenging strata (e.g., hard gravel, SPT N > 50). Consequently, there remains a critical scarcity of quantitative models coupling the embodied carbon of high-strength structural materials with the intensive energy demands of extreme construction processes. This intersection creates a forced carbon lock-in effect. In extreme strata, traditional shoring (e.g., steel sheet piles) often fails, forcing the adoption of carbon-intensive permanent structures like diaphragm walls [5] or heavy-duty tubular steel casings.
Addressing this gap requires shifting the analytical focus from horizontal “lines” to vertical “points.” This study integrates ISO 21931-2 [6] with EN 15804/EN 15978 standards [7,8] to establish a high-resolution carbon assessment framework for vertical nodes. By evaluating a deep-buried microtunneling case study in Hualien, Taiwan, characterized by hard gravel strata, we investigate the dual challenge of geologically induced energy surges and the forced carbon lock-in effect associated with high-strength structural requirements [5]. Specifically, this research aims to: (1) define a comprehensive LCA boundary for upfront carbon (A1–A5) that includes shaft excavation and shoring; (2) quantify the geological energy penalty incurred in hard gravel strata (SPT N > 50); and (3) evaluate the decarbonization potential of utilizing high-volume Supplementary Cementitious Materials (SCM) concrete as a sustainable alternative to traditional precast manholes. Following this introduction, the remainder of this paper is structured as follows: Section 2 outlines the methodological framework and Life Cycle Inventory (LCI) data collection; Section 3 details the factorial scenario design used to isolate geological and construction variables; Section 4 presents the empirical results; Section 5 discusses the carbon mitigation implications and study limitations; and finally, Section 6 provides concluding remarks.

2. Literature Review and Case Study

2.1. Performance of SCMs and Underground Durability

Supplementary Cementitious Materials (SCMs) offer substantial decarbonization and durability advantages in structural concrete applications [9]. Unlike Ordinary Portland Cement (OPC), which relies on energy-intensive clinker calcination, SCMs utilize industrial by-products such as fly ash and Ground Granulated Blast-furnace Slag (GGBS), significantly reducing embodied carbon during the product stage (A1–A3) [9]. Substituting OPC with SCMs in structural components can lower Global Warming Potential (GWP) by 10% to 35%, with the net decarbonization rate strongly regulated by regional inventory access and transport logistics [9].
Empirical LCA studies on binary and ternary blended concrete further demonstrate that a 20% to 40% OPC replacement with fly ash yields an emission reduction of 9.1% to 40.0%, whereas a 40% GGBS substitution achieves a 31.8% carbon reduction [10]. Notably, a ternary mix combining 20% fly ash and 20% GGBS offers an optimal balance, achieving a 32.2% carbon reduction while retaining a high structural compressive strength of approximately 50 MPa [10].
Incorporating such ternary SCM blends provides a vital material-level compensation mechanism to offset construction-phase energy impacts in underground infrastructure, ensuring long-term structural performance alongside significant embodied carbon mitigation [9,10].
Furthermore, sewerage environments subject vertical nodes to severe biogenic sulfuric acid attack, where hydrogen sulfide (H2S) oxidizes into sulfuric acid (H2SO4) and degrades OPC matrices [11]. The incorporation of SCMs refines concrete pore structures through micro-filler effects and forms secondary Calcium–Silicate–Hydrate (C-S-H) gels, dramatically enhancing resistance to acid and sulfate corrosion [11,12]. From a broader life cycle perspective (e.g., EN 15804 Module B), this enhanced durability can help mitigate recurring carbon impacts associated with frequent maintenance or premature structural replacement [11,12].

2.2. Spatial Boundary Discrepancies and Underground Depth Challenges

The accuracy of LCA inventories for trenchless engineering depends heavily on system boundary definitions. Mainstream international frameworks exhibit marked spatial discrepancies regarding “vertical nodes.” For example, the Japan Sewage Works Association (JSWA) guidelines adopt a restrictive boundary focused primarily on horizontal jacking machinery energy (Stage A5), omitting working shafts, shoring, and backfilling [4]. Conversely, the UK Pipe Jacking Association (PJA) carbon calculator incorporates vertical manholes and shafts within EN 15804 boundaries [3]. However, the PJA model is calibrated against shallow excavations in standard soft soils (N < 20) [2]. Although trenchless methods generally reduce GHG emissions by 78% to 88% compared to traditional open-cut methods by minimizing surface disruption [13], applying shallow soft-soil benchmarks to deep urban environments may lead to a significant underestimation of their carbon footprints.
In high-density Asian metropolitan areas such as Taiwan, sewer mains are frequently forced into deep strata (10–12 m). This depth multiplication is driven by urban chronology and flood mitigation requirements: shallow underground zones (0–5 m) are already saturated with legacy lifelines [14], while massive stormwater box culverts force sanitary sewers to pass beneath them via grade-separated crossings [15]. When excavation depths exceed 10 m into hard gravel formations, recyclable temporary shoring (e.g., steel sheet piles [16]) becomes structurally unfeasible. Engineering units are forced to adopt permanent, heavy-duty shoring structures or full-casing methods, triggering a forced carbon lock-in effect [3] and substantial energy surges during construction [2].

2.3. Site Characteristics and Empirical Inventory of the Hualien Case Study

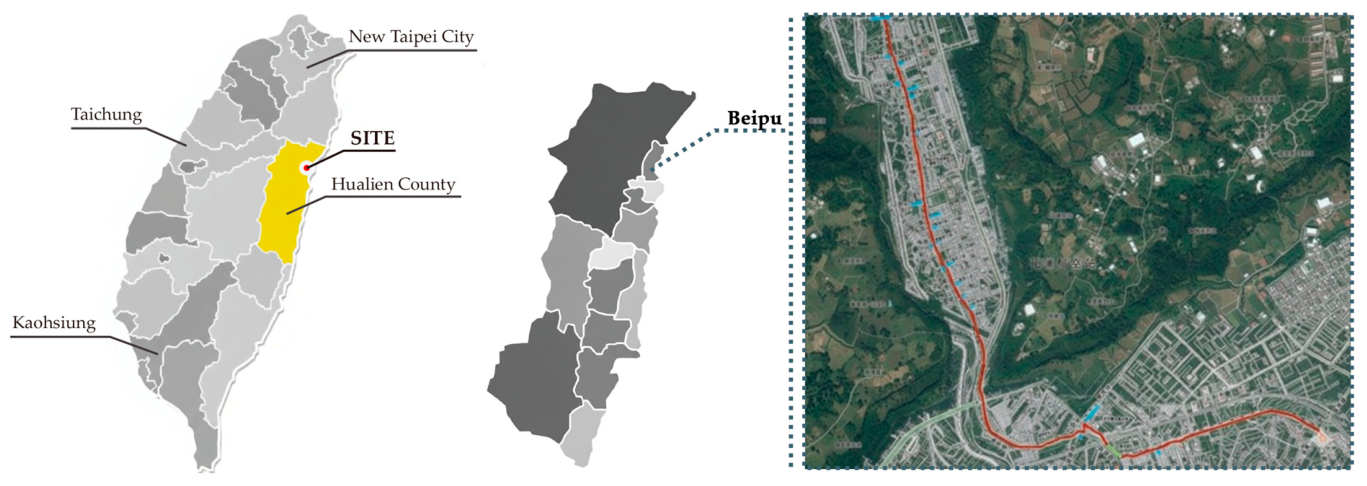
The empirical foundation of this research is anchored in a municipal sewerage construction project located in the Beipu area of Xincheng Township, Hualien County, Taiwan (coordinates: 24°2′N, 121°36′E). The project encompasses a total alignment of 614 m with 9 integrated working shafts, featuring deep excavations ranging from 10 to 12 m. Figure 1 illustrates the spatial scope of the project site and the designated Stage A1–A5 upfront carbon footprint inventory boundaries.
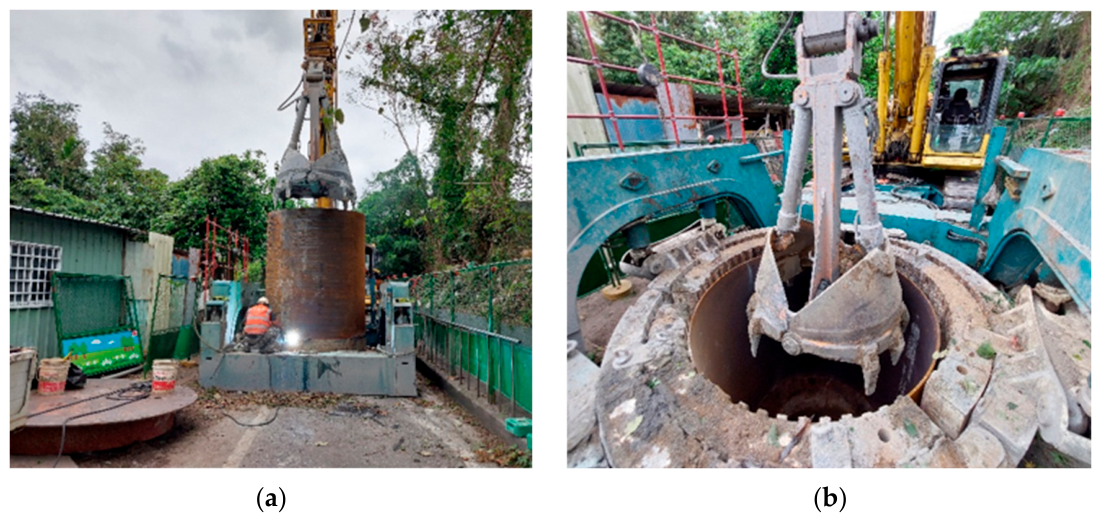
Borehole logs confirm that the underlying strata below GL −0.2 m consist entirely of highly compact gravel interspersed with silt and coarse sand (N > 50). To penetrate this challenging geological formation, excavation was executed using a heavy-duty casing oscillator combined with tubular steel casings and a hammer grab (Figure 2). Although the extreme formation resistance escalated diesel consumption during Stage A5, the full-casing oscillating method effectively sealed against high groundwater levels (GL −2.0 to −10.0 m), successfully eliminating the massive pumping electricity emissions that would have been incurred by traditional wellpoint dewatering.
The working shafts utilize P-1200 and P-1500 precast concrete manholes with a specified compressive strength of 280 kgf/cm2. The concrete matrix incorporates a 20% mineral admixture baseline (15% GGBS and 5% fly ash). Due to Hualien’s geographical isolation on Taiwan’s eastern coast, primary materials and heavy equipment required long-distance transportation across the Central Mountain Range. Heavy machinery (casing oscillators, generators) and entrance seals were hauled 173–188 km from New Taipei City; steel casings were transported 314 km from Kaohsiung City; and manhole covers were hauled 308 km from Taichung City. Local transport was utilized for precast manhole segments (4.7 km), ready-mixed concrete (2.5 km), and excavated surplus soil disposal (27.2 km).

3. Methodology

3.1. Assessment Framework and Functional Unit

The assessment framework of this study complies with the standardized LCA methodology defined by ISO 14040:2006 and ISO 14044:2006 [17,18] and integrates the sustainability construction standards established by the European Committee for Standardization (CEN/TC 350). The calculation logic at the engineering level is derived from the frameworks of EN 15804:2012+A2:2019 [7], EN 15978:2011 [8], ISO 14067:2018 [19], and ISO 21931-2 [6], whereby the interactions between geological conditions and construction machinery are incorporated into the system evaluation. The core product data utilized herein relies on Environmental Product Declarations (EPDs) and Product Category Rules (PCRs). For carbon emission factors, the “Carbon Emission Factor Database for Common Products in Public Works,” published by the Public Construction Commission (PCC) of Taiwan, is prioritized [20]. As for site-specific data, it is rigorously extracted from the contractor’s daily construction logs.
To ensure functional equivalence and comparability across scenario simulations, the Functional Unit (FU) in this study is defined as: “The safe construction of one completed underground vertical node (per shaft/manhole) to depths of 10–12 m under specific geological conditions, inclusive of temporary shoring operations and permanent precast manhole installation.” The reference flow corresponds to the cumulative project inventory comprising nine completed working shafts (four P-1200 and five P-1500 nodes). All material and energy inventories are systematically normalized to this single representative vertical node baseline for subsequent scenario evaluations.

3.2. System Boundaries and LCI Framework

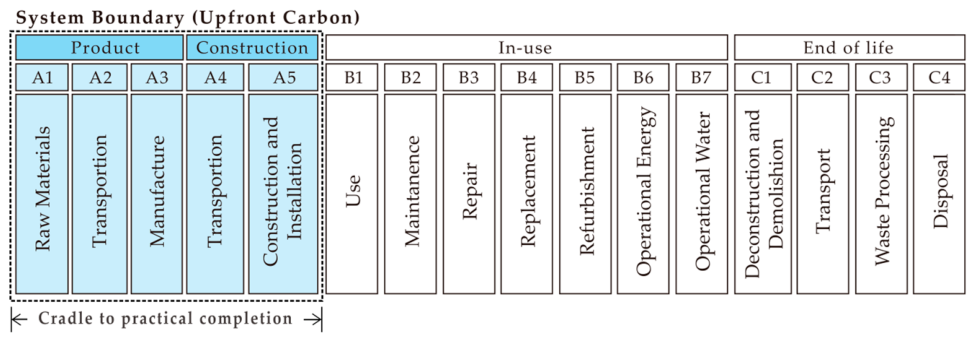
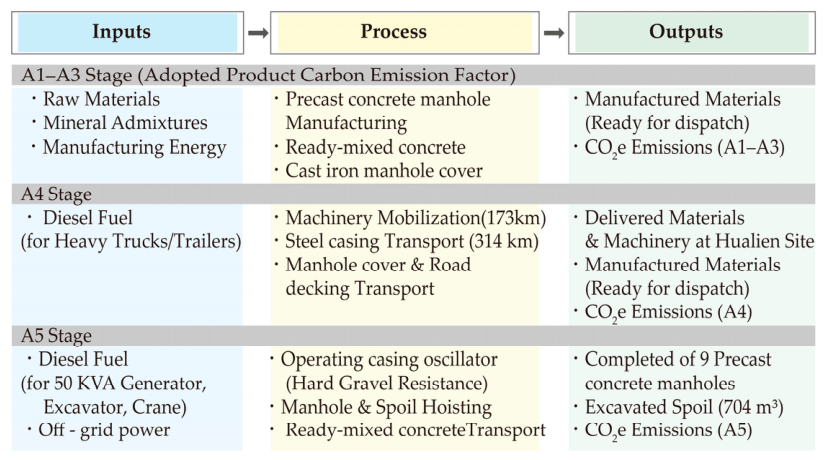
In accordance with the framework defined by the World Green Building Council (WorldGBC), the system boundary for this study is strictly established as the upfront carbon generated from “Cradle-to-Practical Completion,” which encompasses Stages A1 through A5 (refer to Figure 3) [21]. To ensure a systematic accounting of environmental impacts, the LCI is operationalized through an Input–Process–Output (IPO) model, as detailed in the step-by-step process diagram in Figure 4.
1.
System Boundary:
(1)
Product Stage (A1–A3): All permanent and temporary engineering materials required for the vertical nodes are accounted for within this boundary. This includes the precast manholes for the main structure, ready-mixed concrete utilizing Type II underwater cement (210 kgf/cm2) with a carbon emission factor of 359 kg CO2e/m3, and Type I underwater cement (140 kgf/cm2) with a carbon emission factor of 256 kg CO2e/m3 [20,22]. Furthermore, the carbon mitigation parameters of high-volume SCM concrete are introduced at this stage to conduct the material substitution analysis.
(2)
Transport Stage (A4): The mobilization and demobilization of heavy machinery, as well as the transport logistics, distances, and associated fuel consumption for delivering construction materials (e.g., tubular steel casings and ready-mixed concrete) from manufacturing facilities to the project site, are fully accounted for within this boundary [2]. Transport distances were calculated based on shortest-path spatial routing via Google Maps (Google LLC, Mountain View, CA, USA), and localized heavy-vehicle ton-kilometer (t·km) emission factors sourced from the Ministry of Environment (MOENV, Taiwan) were applied [22].
(3)
Construction Stage (A5): Primary emphasis is placed on quantifying the operational energy consumption of heavy construction equipment, including casing oscillators, diesel generators (utilized for steel casing welding), and mobile wheeled cranes. Furthermore, 15-ton dump trucks are deployed for the short-haul transport of steel casings and excavated soil within the site vicinity, whereas 35-ton gravel-specific heavy dump trucks handle the long-haul transport of excavated spoil to the designated soil and gravel recycling/disposal facility [2].
2.
Data Granularity:
(1)
Primary Data: For the construction installation stage (Module A5), high-resolution primary data were collected directly from daily site construction logs. This includes daily fuel consumption records for the casing oscillator, 15-ton dump trucks, mobile wheeled cranes (13.6 MT), 35-ton gravel-specific heavy dump trucks, and 50 kVA diesel generators, alongside precise site records of excavated soil removal volumes and vehicle trip counts.
(2)
Secondary Data: For the product stage (Modules A1–A3), life cycle inventories for precast concrete manholes, cast-iron manhole covers, and ready-mixed concrete were quantified using verified EPDs and national LCI databases. For the transport stage (Module A4), transportation distances for heavy machinery and engineering materials from production plants to the construction site were calculated based on shortest-path spatial routing via Google Maps, and localized heavy-vehicle ton-kilometer (t·km) emission factors sourced from the MOENV, were applied [22].
(3)
Cut-off Criteria: In alignment with ISO 14067 and EN 15804 guidelines, individual material or energy flows are omitted from the inventory if their estimated contribution to the total GWP of the assessed upfront stages (A1–A5) is less than 1%. Furthermore, the cumulative proportion of excluded material and energy inputs does not exceed 5% of the total mass and energy inputs across the defined system boundaries [19].

3.3. Upfront Carbon Modeling (A1–A5)

The total Global Warming Potential ( G W P t o t a l ) is calculated utilizing a summation method, with the overarching formula expressed as follows:
G W P t o t a l   =   G W P   A 1 A 3 +   G W P A 4     +   G W P A 5
where
G W P t o t a l is the Total Global Warming Potential, expressed in kgCO2e;
G W P   A 1 A 3 represents the carbon emissions during the product manufacturing stage;
G W P A 4 denotes the carbon emissions during transportation to the construction site;
G W P A 5 indicates the carbon emissions during the construction process stage.
To accurately represent the comprehensive A1–A5 inventory boundaries and accommodate the factorial scenario design, the simplified equation was expanded. The total upfront carbon footprint of a vertical node (CFnode, in kgCO2e) is explicitly modeled to include permanent materials, temporary works allocation, transport dynamics, and geologically induced machinery hours, as presented in Equation (2):
C F n o d e = i [ Q p , i E F p , i ( 1 γ R m a t ) ] + j [ Q t , j E F t , j A r e u s e , j ] A 1 - A 3 :   Product   Stage + k ( Q k D k E F t k m , k ) A 4 :   Transport + m [ H s t d , m ( 1 + K g e o ( N ) ) C e n e r g y , m E F e n e r g y ] A 5 :   Construction   Stage
where
C F n o d e : The total upfront carbon footprint of the vertical node (kgCO2e).
Q p , i & E F p , i : Mass (kg) and baseline carbon emission factor (kgCO2e/kg) for permanent material i (e.g., standard precast concrete manholes with 20% SCM).
γ : A binary scenario variable for material mitigation ( γ = 1 for High-volume SCM alternatives; γ = 0 for the baseline).
R m a t : The material carbon reduction factor achieved via the low-carbon alternative.
Q t , j & E F t , j : The physical quantity and emission factor for temporary retaining works j (e.g., steel sheet piles or tubular casings).
A r e u s e , j : The allocation rule/factor for temporary retaining works j, conceptually defined as 1/Nreuse (where Nreuse is the service life or number of reuses before end-of-life) in accordance with LCA allocation principles. However, strictly complying with the system boundary and cut-off provisions of ISO 14067 (Section 6.4.6), reusable temporary elements (such as tubular steel casings and steel sheet piles) are classified as auxiliary capital assets. Given that this temporary steel structures are fully recovered by the contractor and their single-project embodied carbon amortization falls below the 1% significance threshold, no multi-project reuse allocation factor (1/Nreuse) is applied to permanent material embodied carbon (Stages A1–A3) in the baseline inventory calculation to prevent speculative allocation errors. Instead, their associated carbon impacts are directly and comprehensively captured through Stage A4 inbound transportation and Stage A5 equipment operation fuel consumption.
Q k , D k , E F t k m , k : The mass (tons), transport distance (km), and ton-kilometer emission factor (kgCO2e/t km) for transported material or equipment k . Alternatively, emissions may be estimated using cargo volume and mass, incorporating comprehensive logistical variables such as vehicle type, number of trips, fuel consumption rate, total travel distance, and round-trip logistics to ensure accurate allocation.
H s t d , m : The baseline active operating hours for penetration-sensitive machinery m under standard soft-soil conditions ( N 20 ).
K g e o ( N ) : The dimensionless geological operating-hour increment factor (Kgeo = 0 for N 20 , and Kgeo = 0.187 for N 50 , reflecting an 18.7% escalation in duration).
H g e o ,   m : The actual active operating hours under geologically constrained conditions, formulated as H g e o , m = H s t d , m ( 1 + K g e o ( N ) ) .
C e n e r g y , m : The hourly energy consumption rate (e.g., liters of diesel/hour) for machinery m.
E F e n e r g y : The localized carbon emission factor for the specific energy vector consumed.
It is worth noting that while the geological premium factor ( K g e o = 1.187 for N > 50 ) was initially derived from horizontal pipe jacking empirical models, its application to vertical shaft excavation via casing oscillators is justified through the macro-level convergence of energy-consumption escalation, supported by direct site-level evidence from this study. Microscopically, the friction-dominated resistance in horizontal jacking fundamentally differs from the shearing and rotational resistance encountered during vertical casing oscillation. However, under extreme strata ( N > 50 , such as the Hualien gravel formations), both mechanical systems experience a common operational bottleneck: a sharp decline in the rate of penetration (ROP) coupled with a nonlinear increase in machine operating hours ( H s t a , m K g e o ) under idle and peak-load conditions due to severe boulder obstructions and tool wear.
To empirically validate this parameter transferability, direct shaft-level operational data were extracted from the contractor’s statutorily filed public works construction logs. For the working shafts investigated (average depth: 10–12 m; casing diameter: 2.0 m; groundwater level: approx. −3.0 m), the excavation primarily utilized a 198 kW casing oscillator combined with a hammer grab. Field inventory statistics confirm that the ROP dropped significantly in the hard gravel layer, driving the average fuel consumption to 16.25 L/hour and increasing total operational duration. Consequently, the empirical records exhibited an 18.4% to 19.2% surge in energy consumption compared to the established soft-soil baseline (detailed in the Supplementary LCI data). Thus, utilizing 0.187 serves as a preliminary empirical estimate for quantifying the geological upfront carbon premium in vertical nodes within the assumptions of this case study, providing cross-methodological consistency.

3.4. Integration of Carbon Emission Data Sources

In this study, carbon emission databases from the PCC [20] and the MOENV [22] of Taiwan were compiled. Furthermore, authoritative international sewerage data was gathered to facilitate a comparative analysis. The primary international data sources comprise benchmarks and technical reports from the PJA and the United Kingdom Society for Trenchless Technology (UKSTT) [23], as well as the Japan Sewage Works Association (JSWA) [4,24,25]. The integrated datasets possess the following characteristics:
  • Material Embodied Carbon: Localized factors from the PCC [20] are primarily cited, as the emissions derived from construction materials are most significantly influenced by the local electricity grid mix and production processes.
  • Benchmarking of Decarbonization Benefits: A study by the UKSTT [3,23] is cited, wherein the standard energy-saving percentages of the short pipe jacking method, as compared to the open-cut method, are explicitly defined.
  • Energy Consumption Details: The decarbonization manual published by the JSWA [25] is referenced, which provides precise technical parameters regarding the electricity and fuel consumption of short pipe jacking machinery commonly utilized in the Asian region.
  • Geological and Operational Variations: According to the study by the UKSTT [23], typical geological conditions consist of London Clay or chalk formations (SPT N < 20), with common excavation depths ranging from 1.2 to 6 m. In the study by the JSWA [4], the geological conditions comprise standard sand and cohesive soil layers (N < 20), with common depths ranging from 3 to 6 m. Conversely, in the case study of Hualien, Taiwan [2], the geological environment is characterized by hard gravel formations (N > 50), with excavation depths reaching 10 to 12 m.
  • Electricity and Fuel Carbon Emission Benchmarks (Table 1): The electricity and fuel carbon emission factors published by the UK Department of Energy [26] and the Ministry of the Environment and the Ministry of Economy, Trade and Industry of Japan [27,28] are cited. These are compared against Taiwan’s 2024 electricity carbon emission factor [29] to evaluate the impact of differences in national energy structures on construction efficiency assessments.

3.5. Progressive Factorial Scenario Matrix Design

To rigorously isolate the interactive effects among geological constraints, construction methods, and material substitutions, this study establishes a progressive four-scenario matrix (Table 2). By systematically adjusting one variable per analytical step, the framework isolates method-induced penalties, quantifies the geological premium, and evaluates the net decarbonization capacity of low-carbon materials.

4. Results

4.1. Construction Process and Cyclic Operations

The carbon inventory for the shaft construction in this study is based on the short pipe jacking method, which is characterized by highly standardized cyclic operations. The construction process involves repetitive cycles of tubular casing installation, excavation, and manhole assembly. The inherent periodicity of these procedures establishes a stable, linear correlation between energy consumption (fuel and electricity) and material input. This consistency provides a robust theoretical justification for utilizing a “three-month sampling inventory” as a representative basis for estimating the total carbon footprint of the project.

4.2. Environmental Characteristics of Hualien

The geological conditions of this project dictated the adoption of trenchless technologies to meet the technical requirements for “high strength” and “high durability.” Consequently, this directly led to a high reliance on the performance of precast concrete pipe materials during the product stage, with the associated carbon emissions being directly reflected in Stages A1–A3. Regarding construction, the shoring facilities must withstand immense lateral soil pressure, groundwater ingress, and the destructive effects of buoyancy during deep excavation operations. This renders the carbon emission challenges of the shoring facilities significant and not to be underestimated, with their carbon emissions being primarily reflected in the construction stage (Stage A5).

4.3. Total Carbon Inventory

The empirical case study in this research reflects the operational and structural baseline of Scenario III (Extremely Hard Gravel Formation × Casing-Oscillated Working Shaft × Standard 20% SCM Precast Manholes). Across the “Cradle-to-Practical Completion” system boundary (Stages A1–A5), nine working shafts were completed—comprising four P-1200 and five P-1500 manholes—with a cumulative steel casing excavation depth of approximately 92.1 m.
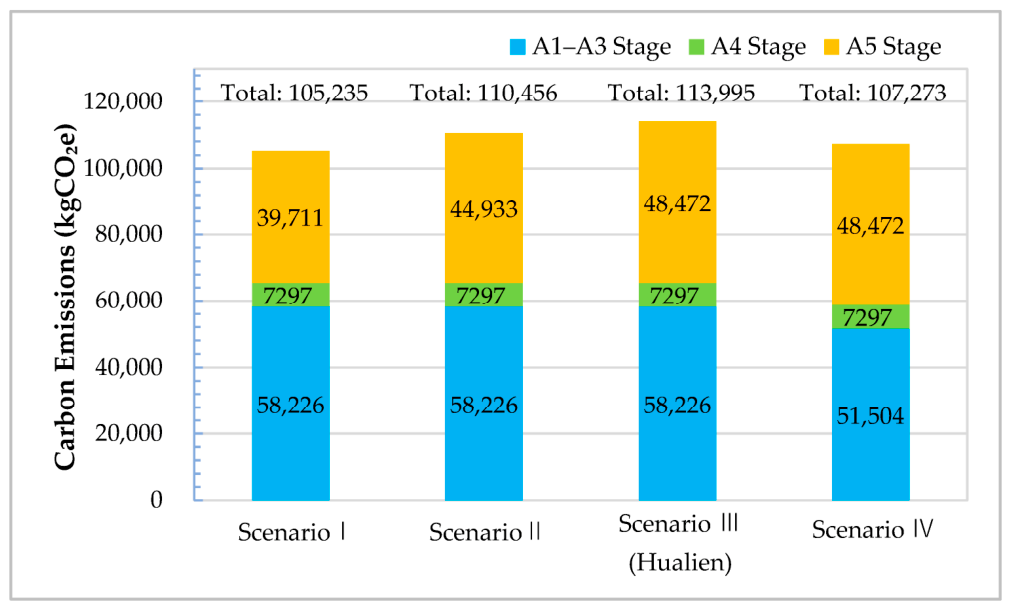
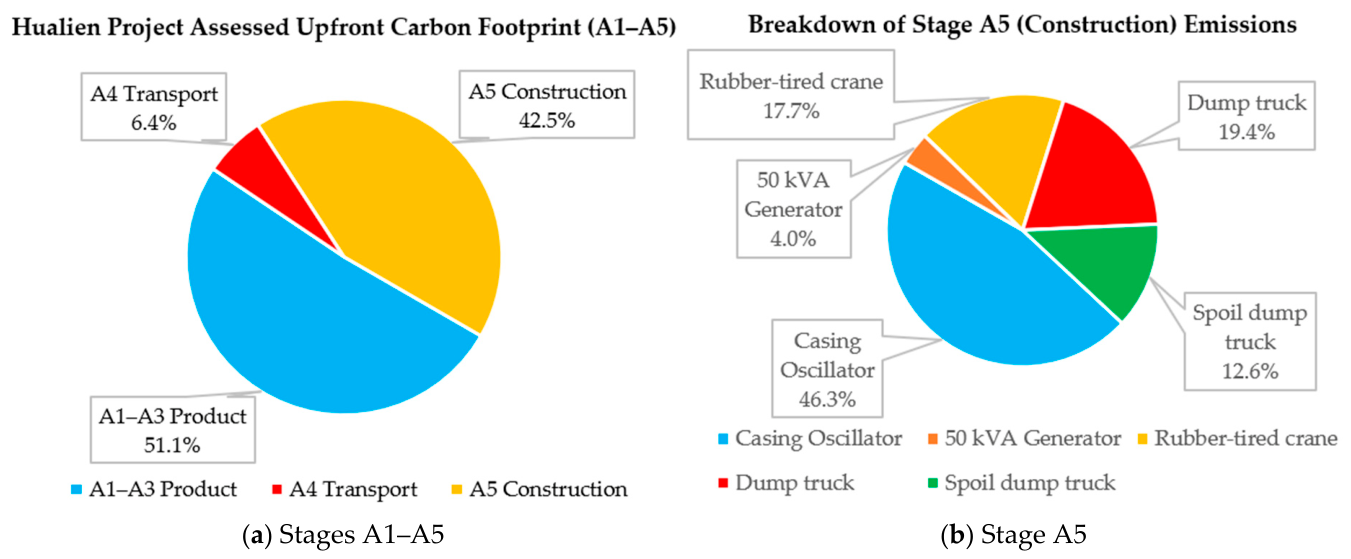
The total upfront carbon footprint for the working shaft engineering amounted to 113,995 kgCO2e, distributed across the assessed upfront modules (Stages A1–A3: 58,226 kgCO2e,51.1%; Stage A4: 7297 kgCO2e, 6.4%; and Stage A5: 48,472 kgCO2e, 42.5%). In alignment with the declared functional unit defined in Section 3.1, allocating this cumulative upfront carbon footprint across the nine completed working shafts yields an average upfront carbon intensity of 12,666 kgCO2e/shaft. Normalized against the cumulative excavation depth of 92.1 m (comprising four 10.1 m shafts and five 10.3 m shafts), the linear carbon intensity corresponds to 1238 kgCO2e/m.
The emissions for each stage are illustrated in Table 3 and Figure 5. The carbon emission hotspots are analyzed as follows:
  • Product Stage (Stages A1–A3) (51.1%): As the largest emission source for the overall tubular steel shaft engineering, this stage’s carbon emission hotspots are primarily contributed by the product carbon emissions of two types of precast concrete manholes. The carbon emissions for the P-1200 mm precast concrete manholes were 15,040 kgCO2e (across four units, with a single-unit emission of 3760 kgCO2e), accounting for approximately 25.8% of the product carbon emissions in Stages A1–A3. The carbon emissions for the P-1500 mm precast concrete manholes were 30,632 kgCO2e (across five units, with a single-unit emission of 6126 kgCO2e), accounting for approximately 52.6% of the product carbon emissions in Stages A1–A3.
  • Transportation Stage (Stage A4) (6.4%): These emissions are predominantly contributed by the mobilization transportation of heavy construction machinery and equipment (e.g., casing oscillators and tubular casings). The combined transportation carbon emissions for the two types of tubular casings were 3284 kgCO2e, accounting for approximately 45.0% of the emissions in Stage A4, representing the largest hotspot. The transportation carbon emissions for the casing oscillator were 1853 kgCO2e, accounting for approximately 25.4% of the emissions in Stage A4, representing the second-largest hotspot.
  • Construction Process Stage (Stage A5) (42.5%): The casing oscillator emerged as the primary carbon hotspot in Stage A5, with fuel-related emissions totaling 22,443 kgCO2e, accounting for 46.3% of the total emissions in this stage. Transportation operations for tubular steel casings and short-distance transit of excavated soil, facilitated by 15-ton dump trucks, generated 9412 kgCO2e (19.4% of Stage A5). Each shaft assembly required 4–5 casing sections (each 2.4 m in length), which were welded or cut to specification. Additionally, the 13.6-ton wheel crane used for casing installation contributed 8566 kgCO2e, or approximately 17.7% of the stage’s emissions. The transport of 704 m3 of excavated surplus soil from the nine working shafts to the resource stacking site—utilizing 35-ton dump trucks—resulted in 6126 kgCO2e, representing 12.6% of the stage. Finally, the 50 kVA diesel generator accounted for the remaining 1925 kgCO2e, contributing approximately 4.0% of the construction-stage emissions.

Table 3. Proportions of carbon emissions across Stages A1–A5 for the tubular steel shaft engineering in the Hualien project.
Assessment Stage (EN 15804)Carbon Emissions (kgCO2e)Total Proportion (%)Primary Construction Items in StageCarbon Emissions (kgCO2e)Proportion Within Stage (%)
A1–A3 Product Stage58,22651.1Precast concrete manhole (P-1200)15,04025.8
Precast concrete manhole (P-1500)30,63252.6
Precast manhole cover (Ø750 mm)830714.3
Ready-mixed concrete, Type II underwater (140 kgf/cm2)7681.3
Ready-mixed concrete, Type II underwater (210 kgf/cm2)28724.9
A4 Transportation Stage72976.4Casing oscillator (PC300LC)185325.4
Tubular steel casing (Ø1890 mm)164222.5
Tubular steel casing (Ø2090 mm)164222.5
Decking panels92612.7
Cast-iron manhole cover (Ø750 mm)6058.3
Entrance seal (mirror frame) (Ø600 mm)2813.9
Ready-mixed concrete, Type II underwater (140 kgf/cm2)811.1
Ready-mixed concrete, Type II underwater (210 kgf/cm2)1221.7
A5 Construction Stage48,47242.5Casing oscillator (PC300LC)22,44346.3
Dump truck (15-ton)941219.4
Wheel crane (13.6 MT)856617.7
Gravel-specific dump truck (35-ton)612612.6
Diesel generator (50 kVA)19254.0
Total113,995100% 113,24399.4%
Note: Items contributing less than 1.0% to the total assessed Stage A1–A5 upfront carbon emissions are excluded pursuant to the ISO 14067/EN 15804 cut-off rules.
Figure 5. Proportion of assessed upfront carbon footprint across Stages A1–A5 (Cradle-to-Practical Completion) for the Hualien empirical baseline (Scenario III).
Sustainability 18 08911 g005

4.4. Scenario Analysis of Carbon Footprints

To elucidate the interactive effects among geological conditions, construction methodologies, and low-carbon material applications on the upfront carbon footprint of vertical nodes, this study executed a quantitative scenario comparison based on the four-scenario matrix defined in Section 3.5. These empirical simulation results isolate shifting carbon emission hotspots and provide concrete verification for the existence of the “geological premium” and the offsetting potential of material-side compensation.

4.4.1. Quantifying Geological Premium and Forced Carbon Lock-In

Embodied Carbon Intensity in the Product Stage (A1–A3): Despite incorporating a standard 20% SCM replacement rate in Scenarios I, II, and III, carbon emissions in Stages A1–A3 remained high at 58,226 kgCO2e in total. Notably, 78.4% of these product stage emissions (45,672 kgCO2e) originated from the permanent precast concrete manhole segments. This indicates that during deep excavations in extreme strata, mandatory engineering codes requiring high-strength structural members to resist lateral pressures inevitably trigger a forced carbon lock-in effect. Consequently, this baseline embodied carbon cannot be sufficiently mitigated by conventional SCM ratios alone. As detailed in Table 4, variations in precast manhole emissions correlate directly with cement replacement percentages, underscoring the necessity of high-performance mineral admixture optimization.
Transport Stage (Stage A4): In accordance with ISO 14067 and EN 15804 system boundaries, Stage A4 strictly encompasses inbound logistics, specifically the delivery of permanent construction materials and equipment mobilization to the construction site. Although the physical delivery of sheet piles (Scenario I) and tubular steel casings (Scenarios II–IV) involves slight logistical differences in practice, Stage A4 emissions are intentionally maintained at a constant baseline value (7297 kgCO2e) across all scenarios as a controlled scenario-modeling assumption. This methodological standardization isolates confounding inbound logistical noise, thereby highlighting the decisive direct trade-offs between material decarbonization in the Product Stage (A1–A3) and geologically induced energy surges in the Construction Process Stage (A5).
Construction-Stage Energy Surge (Stage A5): In Scenario I, representative of soft-soil conditions (N < 20), the site employs a temporary steel sheet pile retaining system combined with H-beam walers. Because steel sheet piles are fully recovered and reused (categorized as recyclable temporary works, thus excluded from permanent A1–A3 embodied carbon), Stage A5 construction energy is primarily driven by pile driving and soil excavation, totaling 202 machine hours (39,711 kgCO2e, or 4412 kgCO2e per shaft). However, soil excavation volume reaches 972 m3, which is 268 m3 higher than the tubular casing method (704 m3), resulting in higher soil-haulage transport emissions; notably, in accordance with ISO 14067 guidelines, these excavated soil transport emissions are appropriately categorized under the Stage A5 construction phase.
In Scenarios II, III, and IV, full-casing oscillators pressing Ø1890 mm and Ø2090 mm tubular steel casings are deployed. In Scenario II (N < 20), combined oscillator and excavator operating time is 350 h, with auxiliary diesel generators operating for 52 h for steel casing cutting and welding, yielding 44,933 kgCO2e in Stage A5 (4993 kgCO2e per shaft). In Scenarios III and IV, severe penetration resistance within hard gravel strata (N > 50) escalates combined machinery operating hours to 416 h, while generator hours remain at 52 h. Consequently, Stage A5 emissions surge to 48,472 kgCO2e (5386 kgCO2e per shaft), quantifying an exact geological premium energy surge of 3539 kgCO2e—attributed specifically to the casing oscillator—over the baseline soft-soil casing installation (This surge in Stage A5 emissions is physically driven by the increase in active machine operating hours ( H g e o = H s t d ( 1 + K g e o ) , where K g e o = 0.187 ), directly accounting for the localized Stage A5 construction carbon increase under hard gravel strata.).

4.4.2. Optimal Solution: Material-Side Decarbonization Compensation

In Scenario IV, precast manholes are manufactured using a high-volume SCM concrete matrix featuring a 50% Portland cement replacement rate (37.5% GGBS and 12.5% fly ash). Localized LCI data lower the emission factor of this optimized mix to 252.995 kgCO2e/m3. Compared to the 20% SCM baseline in Scenarios I–III, this formulation achieves a material carbon reduction factor (Rmat) of 15.0% for the precast manhole units, effectively reducing total Stage A1–A3 emissions from 58,226 kgCO2e to 51,504 kgCO2e.
This material substitution plays a vital compensatory role at the system level. By curtailing embodied carbon in Stages A1–A3 by 6722 kgCO2e, Scenario IV fully offsets the isolated geologically induced construction-energy increment of 3539 kgCO2e incurred in Stage A5 under hard gravel strata (N > 50). However, when evaluating the complete assessed upfront boundary (Stages A1–A5), total emissions in Scenario IV (107,273 kgCO2e) remain slightly above the soft-soil sheet-pile baseline of Scenario I (105,235 kgCO2e), because the combined construction-method and geological penalties in Stage A5 (48,472 kgCO2e vs. 39,711 kgCO2e) exceed the net material savings. This progressive scenario analysis confirms that under unalterable hard geology and deep excavation mandates, material-side decarbonization serves as a primary operational strategy to decouple structural safety requirements from high carbon intensity, thereby optimizing the assessed Stage A1–A5 upfront carbon footprint of vertical nodes (Figure 6).

4.4.3. Empirical Validation of Dual Challenges and Forced Carbon Lock-In

Within the context of this case study, the empirical inventory results demonstrate the decarbonization bottlenecks inherent in underground infrastructure confronted with the dual challenges of extreme geology (N > 50) and deep burial requirements (10–12 m).
First, field inventory data from the Hualien empirical baseline (Scenario III) underscore the severity and irreversibility of upfront carbon, with total project emissions reaching 113,995 kgCO2e. The product stage (A1–A3, 58,226 kgCO2e) and construction stage (A5, 48,472 kgCO2e) accounted for 51.1% and 42.5% of total emissions, respectively. This demonstrates a key engineering reality: over 90% of the upfront carbon footprint is committed before the sewerage network enters its operational phase (Module B)—a climate debt that cannot be easily offset through operational energy savings alone.
Second, high carbon intensity in the product stage is not a result of design redundancy, but a direct consequence of the forced carbon lock-in effect driven by geotechnical safety mandates. Excavating to depths of 10–12 m in compact gravel formations requires thick precast concrete and temporary tubular steel casings to withstand lateral earth and hydrostatic pressures. Our findings confirm that unless low-carbon material substitutions—such as the 50% high-volume SCM concrete evaluated in Scenario IV—are integrated during initial manufacturing, underground infrastructure will remain structurally locked into geologically induced high carbon emissions.

5. Discussion

5.1. Geological Premium and Forced Carbon Lock-In: Empirical Insights

The empirical results of this Hualien case study establish a critical mechanism coupling extreme geotechnical constraints with elevated upfront carbon footprints in underground vertical nodes. While existing Life Cycle Assessment (LCA) literature on trenchless technologies focuses predominantly on horizontal pipe jacking in shallow soft soils, our field inventory data demonstrate that deep shaft excavations in hard gravel strata (N > 50) fundamentally reshape the upfront emission profile (Stages A1–A5).
In this study, the geological premium quantifies the geologically induced energy penalty incurred during site execution (Stage A5). Unlike standard soft-soil excavations that utilize temporary, recyclable retaining systems (e.g., steel sheet piles in Scenario I), the extremely compact gravel formation in Hualien forced the deployment of heavy-duty casing oscillators and tubular steel casings to reach depths of 10–12 m (Scenarios II and III). Dictated purely by geotechnical safety mandates, this methodological shift escalated combined machinery operating time to 416 h, driving Stage A5 emissions to 48,472 kgCO2e (42.5% of total upfront carbon).
Furthermore, resisting severe lateral earth and hydrostatic pressures mandates high-strength permanent structures, triggering a forced carbon lock-in effect. In the empirical baseline (Scenario III), product stage emissions (Stages A1–A3) reached 58,226 kgCO2e (51.1% of total emissions). This reveals a vital engineering reality: over 93.6% of the assessed Stage A1–A5 upfront carbon footprint of vertical nodes is irrecoverably committed to the atmosphere prior to the operational phase (Module B)—a subterranean “climate debt” that cannot be liquidated by operational energy efficiency gains alone. Because this lock-in stems from structural safety codes, it cannot be mitigated solely through incremental improvements in machinery fuel efficiency. While material-side decarbonization—specifically substituting standard cement with high-volume SCM matrices—provides a primary compensation mechanism, comprehensive decarbonization should also explore complementary construction-side strategies, such as equipment electrification, hybrid casing oscillators, or biodiesel fuels to further alleviate Stage A5 energy surges.

5.2. Policy Implications for Green Public Procurement (GPP)

Based on these empirical findings, this study outlines key strategic policy recommendations for carbon management in public utility infrastructure:
Establishing Localized Benchmarks Incorporating Kgeo: International LCA frameworks (e.g., Japanese JSWA or UKSTT guidelines) rely heavily on default soft-soil assumptions, leading to severe carbon underestimations when applied to Asian metropolitan contexts characterized by deep burial requirements. Procurement authorities should mandate the incorporation of the geological premium factor (Kgeo) into public carbon budgeting regulations to dynamically account for geotechnical complexity.
Institutionalizing Dual-Track Assessment in GPP: Public procurement protocols should evolve from traditional lowest-bid criteria toward a “dual-track assessment” that simultaneously evaluates financial bids and the assessed upfront carbon intensity (Stages A1–A5). Public agencies can accelerate the adoption of low-carbon materials by assigning higher evaluation scoring weightings or offering contract price adjustments for precast components certified under EN 15804 EPDs.

5.3. Sensitivity Analysis and Database Uncertainty Testing

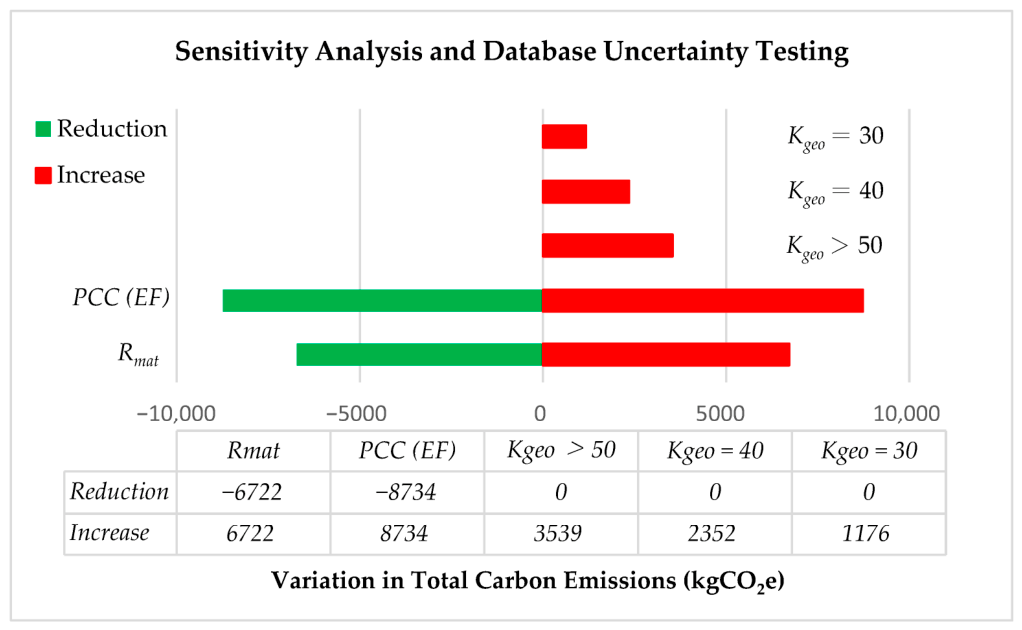
A comprehensive one-way sensitivity analysis was executed across the vertical node system boundary (Scenario III baseline: 113,995 kgCO2e) to evaluate the statistical resilience of the proposed material-side compensation mechanism. As illustrated in Figure 7, three distinct parameter categories were subjected to perturbation testing to evaluate their hierarchical leverage on total upfront carbon:
Material Carbon Reduction Factor (Rmat): Reflecting the transition from the standard 20% SCM baseline to the high-volume SCM concrete matrix (50% replacement: 37.5% GGBS and 12.5% fly ash, Scenario IV), Rmat was evaluated at the empirical baseline of 15.0% (achieving a net reduction of 6722 kgCO2e, lowering total upfront emissions from 113,995 kgCO2e to 107,273 kgCO2e). To assess parametric uncertainty, Rmat was perturbed across a range of 10.0% to 20.0% (centered at 15.0%). As detailed in Table 5 (or governing calculation Δ G W P A 1 A 3 = Q m a n h o l e E F b a s e l i n e R m a t ), total A1–A5 upfront emissions vary from 109,514 kgCO2e at R m a t = 10.0 % ( Δ = 4481 kgCO2e), to 107,273 kgCO2e) at Rmat = 15.0% ( Δ = 6722 kgCO2e), and 105,032 kgCO2e at Rmat = 20.0% ( Δ = 8963 kgCO2e). This confirms that material substitution provides dominant and resilient leverage in mitigating upfront carbon (Table 5).
Geological premium factor (Kgeo): To evaluate construction energy sensitivity under variable geotechnical profiles, Kgeo was formulated as an operating-hour increment factor ( H g e o = H s t d ( 1 + K g e o ) ) and perturbed from 0 (soft-soil baseline, Scenario II, representing standard operating hours) to 0.187 (hard gravel profile, N > 50, Scenario III, representing an 18.7% escalation in active machinery duration). This transition induces an isolated construction energy variance of 3539 kgCO2e (Stage A5 emissions rising from 44,933 to 48,472 kgCO2e), while keeping the constant hourly fuel consumption rate (Cenergy) unchanged. This empirical escalation is physically substantiated by on-site fuel logs from the casing oscillator (22,443 kgCO2e, representing 46.3% of Stage A5), providing solid physical grounding for the scaling function.
PCC Database Emission Factor (EF) Variance: To account for background registry uncertainty, a ±15 variance bound was applied simultaneously across all concrete and steel components in Stages A1–A3. This background noise induces a total emissions variance of 8734 kgCO2e (ranging from 105,261 to 122,729 kgCO2e).
Crucially, the statistical hierarchy in Figure 7 demonstrates that the targeted material mitigation achieved in Scenario IV (6722 kgCO2e) effectively neutralizes the geologically induced energy surge (3539 kgCO2e) by a factor of 1.90.
Although the background PCC database uncertainty (±8734 kgCO2e) introduces a numerical range overlapping with these localized effects, this pattern confirms that the directional benefit of the low-carbon material substitution remains robustly favorable under the evaluated scenarios, whereas its exact quantitative magnitude remains sensitive to background emission factor uncertainties.

5.4. Decarbonization Hierarchy: Balancing Geotechnical Constraints and Low-Carbon Material Interventions

Based on the empirical findings of the Hualien case study, the decarbonization hierarchy for vertical working shaft engineering follows a structured, two-step intervention approach:
First, selecting an appropriate construction method tailored to site-specific geotechnical conditions serves as the primary operational intervention (targeting Stage A5). Under soft-soil conditions (N < 20), ScI (steel sheet pile method) achieves an approximate 11.6% reduction in Stage A5 construction emissions compared to Scenario II (casing oscillator method). Although the larger excavation cross-section in Scenario I generates higher outbound soil-haulage emissions (allocated to Stage A5 per ISO 14067 guidelines), this trade-off is counterbalanced by the lower operational energy demand of the sheet pile installation equipment, resulting in a net 11.6% decline in construction-stage emissions.
Second, material-level decarbonization provides a meaningful intervention during the manufacturing phase (targeting Stages A1–A3). Under hard gravel conditions (N > 50), Scenario IV (high-volume SCM matrix: 50% cement replacement with 37.5% GGBS and 12.5% fly ash) demonstrates an approximate 15.0% carbon reduction across Stages A1–A3 compared to Scenario III (20% standard SCM mix).
When evaluated across the complete assessed upfront carbon boundary (Stages A1–A5), total emissions in Scenario IV (107,273 kgCO2e) remain slightly higher than those in Scenario I (105,235 kgCO2e). This difference occurs because the cumulative Stage A5 construction penalty under dense gravel compared to soft-soil sheet piling (48,472 kgCO2e vs. 39,711 kgCO2e, a difference of 8761 kgCO2e) exceeds the material savings (6722 kgCO2e). Nevertheless, when isolating the pure geological energy surge (3539 kgCO2e between Scenarios II and III), the material substitution in Scenario IV fully offsets this geotechnical energy penalty. This confirms that under unalterable hard geological constraints (N > 50), adopting high-volume SCM concrete provides a decisive and robust compensation pathway to decouple structural safety requirements from elevated carbon intensity.

5.5. Limitations and Future Research Directions

While this study provides actionable, empirically grounded insights into the upfront carbon footprint and material-side decarbonization of vertical nodes, several methodological and field constraints should be acknowledged:
Deterministic Boundaries of Sensitivity Analysis: The current evaluation relies on a deterministic one-at-a-time (OAT) sensitivity framework (±15%). While OAT effectively highlights primary engineering design drivers (e.g., Rmat and Kgeo), it does not capture interactive parameter variations or variance propagation. As highlighted by Larsson Ivanov [30], in engineering practice, Monte Carlo simulation often faces challenges regarding subjective distribution assumptions due to a lack of sufficient and precise probability density functions (PDFs). Conversely, deterministic OAT sensitivity analysis offers a practical alternative by rapidly generating uncertainty profiles and pinpointing key governing drivers. Nevertheless, as regional LCI databases mature and provide statistically validated PDFs, incorporating probabilistic Monte Carlo simulations (MCS) will be prioritized in future research to model multi-parameter joint uncertainty.
Empirical Field Inventory Boundaries: The construction-phase LCI data (Stage A5) were synthesized from a representative three-month field sampling period, material invoices, and contractor daily logs across the 20-month project life cycle. As pointed out by Zahir Barahmand [31], in the construction phase (Stage A5), field machinery energy consumption (diesel and electricity) and background database coefficients represent the primary sources of parameter uncertainty. While the cyclic periodicity of short pipe jacking renders our three-month sampling statistically representative, certain micro-scale operational fluctuations could not be captured continuously.
Geological Scaling Function Boundaries: The geological premium coefficient (Kgeo = 0.187) and its associated scaling function are empirically derived from a short pipe jacking project in Hualien gravel strata (N > 50). While the SPT N-value provides a practical proxy, it does not capture complex geotechnical and mechanical variables such as boulder distribution, gravel size, groundwater table, casing diameter, oscillator torque, or tool wear. Thus, this function should be interpreted as a provisional conceptual framework. Future research should incorporate multi-site empirical telemetry and geotechnical parameters to calibrate and generalize the model.
System Boundary Expansion: This study focuses on upfront carbon (Stages A1–A5) and material-side compensation. To support whole-life net-zero targets, future research could extend the system boundaries to include Module B (e.g., 50-year biogenic sulfuric acid corrosion resistance and passive carbonation of high-volume SCM concrete) and interface Building Information Modeling (BIM) with real-time equipment telemetry for dynamic carbon accounting.

6. Conclusions

This study establishes a high-resolution upfront carbon (Stages A1–A5) evaluation framework for underground “vertical nodes” (working shafts and precast manholes) in microtunneling projects, integrating ISO 21931-2 with EN 15804/EN 15978 standards [6,7,8,17]. Calibrated against empirical primary data from deep-buried sewerage operations in Hualien, Taiwan (depths of 10–12 m, N > 50), this research quantifies the carbon impacts imposed by extreme geological constraints. The principal findings and policy contributions are summarized as follows:
Embodied Carbon Dominance and Forced Carbon Lock-in: Existing international benchmarks constructed upon shallow, soft-soil premises may underestimate the climate footprint of deep-buried infrastructure. Under extreme gravel formations (N > 50), the mandatory deployment of heavy tubular steel casings and high-strength concrete triggers a forced carbon lock-in effect. In the empirical baseline (Scenario III), total upfront emissions reached 113,995 kgCO2e, with the product stage (A1–A3) and construction machinery energy (Stage A5) accounting for 51.1% (58,226 kgCO2e) and 42.5% (48,472 kgCO2e), respectively. This confirms that over 90% of the assessed Stage A1–A5 upfront carbon footprint is irrecoverably committed prior to operation, highlighting the critical need for upfront intervention.
Material-Side Compensation Mechanism: To compensate for the geologically induced construction-energy penalty (Stage A5, an 18.7% surge in active machinery operating hours under N > 50, Hgeo = Hstd · (1 + Kgeo)), material-side innovation offers a key compensation pathway. Scenario simulations demonstrate that upgrading precast manholes from the standard 20% SCM baseline to a high-volume SCM concrete matrix (50% cement replacement: 37.5% GGBS and 12.5% fly ash, Scenario IV) reduces A1–A3 emissions by 6722 kgCO2e (a 15.0% material reduction factor, Rmat). Within the assumptions of this case study, this material-driven carbon saving fully offsets the isolated 3539 kgCO2e construction-energy increment induced by casing oscillator penetration in hard strata. Nonetheless, across the complete assessed A1–A5 boundary, Scenario IV (107,273 kgCO2e) remains slightly above Scenario I (105,235 kgCO2e), confirming that material substitution substantially mitigates but does not entirely eliminate the combined method-and-geology carbon footprint.
Dynamic Carbon Budgeting and GPP: Public procurement policies should move beyond static national average emission factors. The geological premium factor (Kgeo) established herein should be integrated into public works inventory standards. Furthermore, to overcome geographical specificity, we formalize a piecewise linear geological scaling function:
K g e o ( N ) = { 0 ,                                                                                                 f o r   N 20 0.00623 × ( N 20 ) ,                                               f o r   20 < N < 50 0.187 ,                                                                                 f o r   N 50
This mathematical formulation enables municipal authorities to dynamically calibrate carbon budgets across variable geotechnical profiles (e.g., intermediate gravel or clay layers at N = 30 or N = 40), transforming site-specific inventories into an adaptable GPP instrument. Third, the proposed geological scaling function serves as a provisional conceptual framework to quantify construction operating-hour escalations in gravel strata, providing field engineers with an initial benchmark for low-carbon construction planning.
Limitations and Future Research Directions: While this study specifically evaluates the assessed upfront carbon footprint (Stages A1–A5) and material-side compensation mechanisms, achieving whole-life net-zero targets across infrastructure assets is expected to require broader, systemic decarbonization strategies. As detailed in Section 5.5, future research is recommended to pursue three key avenues: (1) extending the assessment boundaries to Module B to evaluate the long-term (50-year) biogenic sulfuric acid resistance and passive carbonation behavior of high-volume supplementary cementitious material (SCM) matrices; (2) investigating complementary construction-phase decarbonization measures, such as equipment electrification and alternative low-carbon fuels; and (3) integrating Building Information Modeling (BIM) with real-time Tunnel Boring Machine (TBM) and casing telemetry to facilitate automated, continuous carbon accounting. Specifically, while probabilistic approaches such as Monte Carlo Simulation (MCS) offer superior capability in modeling multi-parameter joint uncertainty and variance propagation, their statistical validity strictly depends on the availability of precise, empirically validated PDFs. Establishing comprehensive regional geotechnical and material LCI data distribution models remains an essential prerequisite before probabilistic MCS can be effectively operationalized in civil engineering LCA practice.

Supplementary Materials

The following supporting information can be downloaded at https://www.mdpi.com/article/10.3390/su18178911/s1. Supplementary LCI Data. Table S1. Comprehensive Life Cycle Inventory (LCI) for 9 Vertical Nodes (Working Shafts and Precast Manholes) in Deep Microtunneling (A1–A5 Stages). Table S2. Summary of Cumulative Upfront Carbon Emissions across Scenarios I–IV. Table S3. Carbon Emission Inventory for P-1200 Manhole Components. Table S4. Carbon Emission Inventory for P-1500 Manhole Components. Table S5. Operating hours and penetration rate of casing oscillator during the casing driving phase.

Author Contributions

Conceptualization, W.-S.O.; methodology, W.-S.O.; formal analysis, W.-S.O.; investigation, W.-S.O.; data curation, W.-S.O.; carbon emission calculations, W.-S.O.; international benchmarking, W.-S.O.; writing—original draft preparation, W.-S.O.; writing—review and editing, W.-S.O. and Y.-S.C.; formal data discussion and validation, Y.-S.C. All authors have read and agreed to the published version of the manuscript.

Funding

This work was supported by the Research Grant from National Chin-Yi University of Technology, Taiwan (Grant No. NCUT 24-T-HL-001).

Institutional Review Board Statement

Not applicable.

Informed Consent Statement

Not applicable.

Data Availability Statement

The primary inventory data and summary calculations supporting the findings of this study are presented within the article and its Supplementary Materials (Supplementary LCI Data). Detailed daily operational logs bound by local municipal project non-disclosure agreements are available from the corresponding author upon reasonable request.

Acknowledgments

The authors express their sincere gratitude to the Sewerage Engineering Division, National Land Management Agency, Ministry of the Interior, Taiwan, for generously providing the essential field case study data, engineering specifications, and construction logs that made this research possible.

Conflicts of Interest

The author declares no conflicts of interest.

Abbreviations

The following abbreviations are used in this manuscript:
BIMBuilding Information Modeling
EPDEnvironmental Product Declaration
FUFunctional Unit
GHGGreenhouse Gases
GGBSGround Granulated Blast-Furnace Slag
GPPGreen Public Procurement
GWPGlobal Warming Potential
ISOInternational Organization for Standardization
LCALife Cycle Assessment
LCILife Cycle Inventory
LCIALife Cycle Impact Assessment
OPCOrdinary Portland Cement
PCCPublic Construction Commission (Taiwan)
PCRProduct Category Rules
RCPReinforced Concrete Pipe
ROPRate of Penetration
SCMSupplementary Cementitious Material
SPTStandard Penetration Test
TBMTunnel Boring Machine

References

  1. Global Alliance for Buildings and Construction. 2022 Global Status Report for Buildings and Construction; UNEP: Nairobi, Kenya, 2022; Available online: https://globalabc.org/resources/publications/2022-global-status-report-buildings-and-construction (accessed on 7 May 2026).
  2. Ou, W.-S. Quantifying the Geological Premium in Carbon Footprints of Microtunneling: An EN 15804-Based Case Study in Hard Gravel Formations. Buildings 2026, 16, 1413. [Google Scholar] [CrossRef] [Scilit]
  3. Pipe Jacking Association (PJA); United Kingdom Society for Trenchless Technology (UKSTT). The Environmental Benefits of Pipe Jacking: Carbon Calculator and Industry Benchmarks; PJA: London, UK, 2021; Available online: https://www.pipejacking.org/ (accessed on 7 May 2026).
  4. Japan Sewage Works Association (JSWA). Technical Manual for Microtunneling Methods and CO2 Emission Standards; JSWA: Tokyo, Japan, 2021; Available online: http://www.jswa.jp/ (accessed on 7 May 2026). (In Japanese)
  5. Kaewunruen, S.; Sresakoolchai, J.; Ma, W.; Phil-Ebosie, O. Information Modelling of Underground Wall Structures for Evaluating Embodied Carbon and Energy. Sustainability 2021, 13, 6182. [Google Scholar] [CrossRef] [Scilit]
  6. ISO 21931-2:2019; Sustainability in Buildings and Civil Engineering Works—Framework for Methods of Assessment of the Environmental Performance of Construction Works—Part 2: Civil Engineering Works. International Organization for Standardization: Geneva, Switzerland, 2019.
  7. EN 15804:2012+A2:2019; Sustainability of Construction Works—Environmental Product Declarations—Core Rules for the Product Category of Construction Products. European Committee for Standardization (CEN): Brussels, Belgium, 2019.
  8. EN 15978:2011; Sustainability of Construction Works—Assessment of Environmental Performance of Buildings—Calculation Method. European Committee for Standardization (CEN): Brussels, Belgium, 2011.
  9. Generowicz-Caba, N. LCA of Cement with Alternative Additives: Pathways to Sustainable Production. Materials 2025, 18, 3057. [Google Scholar] [CrossRef] [Scilit] [PubMed]
  10. Toan, D.T.; Duc, H.M.; Dung, T.T. Evaluation of Carbon Emission Reduction in Concrete Using Fly Ash and Slag: Case Studies from Vietnam. J. Sci. Transp. Technol. 2025, 5, 81–97. [Google Scholar] [CrossRef] [Scilit]
  11. Ohno, M.; Li, V. Sulfuric Acid Resistance of Strain Hardening Fiber Reinforced Geopolymer Composite. Indian Concr. J. 2019, 12, 47–53. [Google Scholar]
  12. Shafiq, I.; Azreen, M.; Huseien, M.Z. Sulphuric Acid Resistant of Self Compacted Geopolymer Concrete Containing Slag and Ceramic Waste. MATEC Web Conf. 2017, 138, 01102. [Google Scholar] [CrossRef] [Scilit]
  13. Ariaratnam, S.T.; Sihabuddin, S.S. Comparison of emitted emissions between trenchless pipe replacement and open cut utility construction. J. Green Build. 2009, 4, 126–140. [Google Scholar] [CrossRef] [Scilit]
  14. Hunt, D.V.L.; Makana, L.O.; Jefferson, I.; Rogers, C.D.F. Liveable cities and urban underground space. Tunn. Undergr. Space Technol. 2016, 55, 8–20. [Google Scholar] [CrossRef] [Scilit]
  15. Chen, H.-C.; Lin, Y.-T.; Wang, K.-L. Development of Urban Stormwater Management and Flood Mitigation in Taiwan (Research Report); Architecture and Building Research Institute (ABRI), Ministry of the Interior: Taipei, Taiwan, 2020.
  16. Chau, C.K.; Hui, W.K.; Ng, W.Y.; Powell, G. Assessment of CO2 emissions reduction in high-rise concrete office buildings using different material use options. Resour. Conserv. Recycl. 2012, 61, 22–34. [Google Scholar] [CrossRef] [Scilit]
  17. ISO 14040:2006; Environmental Management—Life Cycle Assessment—Principles and Framework. International Organization for Standardization: Geneva, Switzerland, 2006.
  18. ISO 14044:2006; Environmental Management—Life Cycle Assessment—Requirements and Guidelines. International Organization for Standardization: Geneva, Switzerland, 2006.
  19. ISO 14067:2018; Greenhouse Gases—Carbon Footprint of Products—Requirements and Guidelines for Quantification. International Organization for Standardization: Geneva, Switzerland, 2018. Available online: https://www.iso.org/standard/71206.html (accessed on 7 May 2026).
  20. Public Construction Commission (PCC). Carbon Emission Factors Database for Common Public Works Product; Executive Yuan, R.O.C.: Taipei, Taiwan, 2024. Available online: https://pcc.gov.tw/ (accessed on 7 May 2026).
  21. World Green Building Council (World GBC). Bringing Embodied Carbon Upfront: Coordinated Action for the Building and Construction Sector to Tackle Embodied Carbon; World GBC: London, UK, 2019; Available online: https://worldgbc.org/advancing-net-zero/embodied-carbon/ (accessed on 7 May 2026).
  22. Ministry of Environment (MOENV). Carbon Footprint Information Platform; Executive Yuan, R.O.C.: Taipei, Taiwan, 2024. Available online: https://cfp-calculate.tw/ (accessed on 7 May 2026).
  23. United Kingdom Society for Trenchless Technology (UKSTT). Technical Guidelines for Pipe Jacking and Microtunnelling. 2021. Available online: https://www.ukstt.org.uk/ (accessed on 7 May 2026).
  24. Japan Sewage Works Association (JSWA). Manual for Lower Carbon Sewerage Systems; JWSA: Tokyo, Japan, 2021; Available online: http://www.jswa.jp/ (accessed on 7 May 2026). (In Japanese)
  25. Japan Sewage Works Association (JSWA). Manual for Promoting Decarbonization in Sewerage Systems; JWSA: Tokyo, Japan, 2021; Available online: http://www.jswa.jp/ (accessed on 7 May 2026). (In Japanese)
  26. Department for Energy Security and Net Zero (DESNZ). 2023 UK Government GHG Conversion Factors for Company Reporting; DESNZ: London, UK, 2023. Available online: https://www.gov.uk/government/publications/greenhouse-gas-reporting-conversion-factors-2023 (accessed on 13 August 2026).
  27. Ministry of the Environment, Government of Japan. Emission Factors for Greenhouse Gas Accounting and Reporting; Ministry of the Environment: Tokyo, Japan, 2025. Available online: https://www.env.go.jp/ (accessed on 7 May 2026). (In Japanese)
  28. Ministry of Economy, Trade and Industry (METI), Government of Japan. Greenhouse Gas Emission Factors for Calculation, Reporting, and Publication System; METI: Tokyo, Japan, 2023. Available online: https://www.meti.go.jp/ (accessed on 7 May 2026). (In Japanese)
  29. Bureau of Energy, Ministry of Economic Affairs (MOEA). 2024 Electricity Carbon Emission Factor; Ministry of Economic Affairs, R.O.C.: Taipei, Taiwan, 2025. Available online: https://www.moeaea.gov.tw/ (accessed on 7 May 2026).
  30. Larsson Ivanov, O.; Honfi, D.; Santandrea, F. Consideration of uncertainties in LCA for infrastructure using probabilistic methods. Struct. Infrastruct. Eng. 2019, 15, 711–724. [Google Scholar] [CrossRef] [Scilit]
  31. Barahmand, Z.; Eikeland, M.S. Life Cycle Assessment under Uncertainty: A Scoping Review. World 2022, 3, 692–717. [Google Scholar] [CrossRef] [Scilit]
Figure 1. Spatial scope and carbon footprint assessment boundary of the empirical case study in the Beipu area, Hualien, Taiwan. Note: The red line indicates the RCP sewer route [2].
Sustainability 18 08911 g001
Figure 2. Field operational machinery deployed for deep shaft excavation in hard gravel strata (N > 50) at the Hualien site: (a) Casing oscillator unit in operation; (b) Installation of tubular steel casing for excavation shoring.
Sustainability 18 08911 g002
Figure 3. System boundary of this study (Cradle-to-Practical Completion, Stages A1–A5).
Sustainability 18 08911 g003
Figure 4. Step-by-step process diagram based on the IPO model, highlighting main material/energy inputs and environmental outputs from cradle-to-practical completion (Modules A1–A5).
Sustainability 18 08911 g004
Figure 6. Comparative analysis of assessed upfront carbon emissions (Stages A1–A5) for vertical nodes across Scenarios I, II, III, and IV. Note: This figure illustrates the systemic trade-offs among construction methodologies, geological constraints, and material-side decarbonization. The transition from Scenario I to Scenario II isolates the method-induced carbon penalty of adopting the full-casing oscillator method in lieu of sheet piling. The shift from Scenario II to Scenario III quantifies the geological premium—a specific construction-energy increment in Stage A5 (3539 kgCO2e) resulting from penetration resistance in extreme gravel strata (N > 50). In Scenario IV, deploying high-volume SCM concrete (50% cement replacement) achieves an embodied carbon reduction of 6722 kgCO2e in Stages A1–A3, which fully offsets the isolated 3539 kgCO2e geological energy increment in Stage A5. Across the complete assessed A1–A5 boundary, however, Scenario IV (107,273 kgCO2e) remains slightly above Scenario I (105,235 kgCO2e) due to the residual method-induced baseline difference. Stage A4 inbound logistics (7297 kgCO2e) is maintained constant across all scenarios as a controlled modeling assumption to isolate direct process and material trade-offs.
Sustainability 18 08911 g006
Figure 7. One-way sensitivity tornado chart for upfront carbon emissions (Stages A1–A5) under the vertical node system boundary (baseline: 113,995 kgCO2e, Scenario III), where Kgeo represents the dimensionless geological operating-hour increment factor ( K g e o = 0.187 at empirical baseline, perturbed to K g e o = 0 for soft-soil reference), and Rmat denotes the material decarbonization ratio.
Sustainability 18 08911 g007
Table 1. Electricity and fuel carbon emission benchmarks for the United Kingdom, Japan, and Taiwan.
Country/RegionBenchmark SourceGrid Electricity Emission Factor
(kgCO2e/kWh)
Diesel Fuel Emission Factor
(kgCO2e/L)
United KingdomDESNZ, UK [26]0.19~0.222.512
JapanMOE/METI, Japan [27,28]0.44~0.472.585
TaiwanMOEA, Taiwan [29]0.4953.29~3.30
Table 2. Progressive Factorial Scenario Design Matrix for Upfront Carbon Assessment.
ScenarioGeological ConditionsRetaining MethodPrecast Manhole MaterialPrimary Analytical Purpose
Scenario ISoft Soil (N < 20)Sheet PileStandard (20% SCM Baseline)Define absolute global baseline practice
Scenario IISoft Soil (N < 20)Tubular CasingStandard (20% SCM Baseline)Isolate method-induced carbon penalty
Scenario IIIHard Gravel (N > 50)Tubular CasingStandard (20% SCM Baseline)Isolate geologically induced carbon premium (Hualien Case)
Scenario IVHard Gravel (N > 50)Tubular CasingHigh-volume SCM
(50% SCM)
Evaluate net material mitigation potential under extreme geology
Note: The analytical sequence follows a progressive logic: Scenario I represents the standard shallow soft-soil baseline. Comparing II to I isolates the effect of switching retaining methods; comparing III to II isolates the pure geological surge (geological premium); and comparing IV to III evaluates the compensation capacity of material substitution.
Table 4. Carbon Emission Analysis of Precast Manholes Based on Varying Cement Replacement Scenarios.
ScenarioManhole TypeConcrete Emission Factor [20,22]
(kgCO2e/m3)
Carbon Emissions per Unit (kgCO2e)Cement Replacement Rate (%)
Scenario I, II and IIIP-1200366.285376020
P-1500366.2856126
Scenario IVP-1200252.995319050
P-1500252.9955238
Note: Scenarios I–III utilize the standard 20% SCM baseline, whereas Scenario IV applies an optimized 50% SCM binary mix.
Table 5. Numerical Implementation and Sensitivity Perturbation of R m a t across Stages A1–A5.
Parameter LevelRmat
(%)
Precast Manhole Emissions
(A1–A3, kgCO2e)
Material Carbon Reduction
ΔGWPmat (kgCO2e)
Total Upfront Emissions (A1–A5, kg
CO2e)
Variance Relative to Baseline (kgCO2e)
No Substitution
(Scenario III Baseline)
0.0%45,6720113,9950
Lower Bound10.0%41,191−4481109,514−4481
Empirical Central Mix (Scenario IV)15.0%38,950−6722107,273−6722
Upper Bound20.0%36,709−8963105,032−8963
Disclaimer/Publisher’s Note: The statements, opinions and data contained in all publications are solely those of the individual author(s) and contributor(s) and not of MDPI and/or the editor(s). MDPI and/or the editor(s) disclaim responsibility for any injury to people or property resulting from any ideas, methods, instructions or products referred to in the content.