Article

Spatiotemporal Dynamics and Driving Mechanisms of Cropland Ecosystem Health in the Black Soil Region of Northeast China


College of Geographic Science and Tourism, Jilin Normal University, Siping 136000, China
*
Author to whom correspondence should be addressed.
Sustainability 2026, 18(17), 8874; https://doi.org/10.3390/su18178874 (registering DOI)
Submission received: 20 July 2026 / Revised: 19 August 2026 / Accepted: 28 August 2026 / Published: 30 August 2026

Abstract

Understanding the spatiotemporal dynamics and driving mechanisms of cultivated land ecosystem health in the Northeast black soil region is essential for sustainable land management, regional ecological security, and national food security. This study selected 2002, 2012, and 2022 as representative years. Based on CLCD land use data and related natural and socio-economic datasets, an evaluation framework was established incorporating comprehensive productivity, landscape stability, and ecological sustainability. The cultivated land ecosystem health index (FEHI) was calculated using an integrated evaluation framework combining the InVEST model and weighted evaluation method, and the spatial differentiation characteristics and driving mechanisms were investigated using the GeoDetector model. The results showed that (1) among the three study years, cultivated land comprehensive productivity generally increased, whereas landscape stability declined and ecological sustainability remained at a relatively low level with signs of degradation; (2) the FEHI exhibited a fluctuating upward pattern, with the mean value increasing from 0.195 to 0.211. Low-health areas decreased, while high-health areas expanded, suggesting an enhancement in the comprehensive health level of cultivated land ecosystems. (3) GeoDetector analysis revealed that precipitation and elevation were the dominant factors influencing spatial differentiation. The interactions between precipitation and slope, as well as precipitation and nighttime light intensity, showed strong explanatory power, although the explanatory power of dominant factors varied among different years. These findings provide scientific support for ecological protection, black soil conservation, and sustainable cultivated land management in the Northeast black soil region.

1. Introduction

The Northeast black soil region is a vital commercial grain production base in China and one of the word’s primary concentrated distribution areas of black soil. It plays an important strategic role in ensuring national food security, maintaining regional ecological security, and supporting sustainable agricultural development [1]. Studies have shown that the Northeast black soil region and its typical black soil regions concentrate high-quality and most productive black soil resources in China, and the delineation of its scope and resource identification is an important basis for studying black soil protection and sustainable utilization [2]. Within the Earth’s critical zone, black soil is not merely a soil resource, but a complex socio-ecosystem shaped by the interplay of soil, landform, climate, hydrology, vegetation, and human activities. Spatiotemporal evolution is influenced by multiple factors, including natural environmental changes, agricultural intensification, and policy regulation [3]. In recent years, under the long-term high-intensity agricultural development, changes in land use patterns, and continuous interference from human activities, the Northeast black soil region has shown problems such as thinning of the black soil layer, intensified soil erosion, degradation of soil structure, and weakened ecological service functions, and the stability of the regional cultivated land ecosystem is facing significant pressure [4,5,6]. Therefore, research on health and driving mechanisms of the cultivated land ecosystem in Northeast black soil region is critical for protecting black soil, sustainably utilizing cultivated land, and ensuring national food security.
Cultivated land ecosystem health refers to the capacity of cultivated land systems to maintain structural stability, functional integrity, and coordinated ecological processes under natural environmental changes and anthropogenic disturbances. It represents the comprehensive state of cultivated land ecosystems in resisting external pressures, sustaining productive capacity, and continuously providing ecosystem services. Black soil quality exhibits multi-level, multi-scale, and multi-type features and should be comprehensively understood in terms of basic soil fertility, spatial patterns, infrastructure, and ecological environment [2]. For instance, Su Hao and Wu Cifang (2023) established an agricultural ecosystem health diagnosis framework using Keshan County as the research case [7]. The findings indicated that agricultural ecosystem health within the study region exhibited an overall degradation trend during 1986–2018, with notable spatial differentiation. Further research indicates that factors such as total nitrogen in soil, available phosphorus, precipitation, temperature, soil erosion, organic matter, thickness of black soil layer, intensity of agricultural input, labor input, pH value, and soil texture all affect the health of the agricultural ecosystem, and their direction and intensity have significant spatial and temporal differences [8]. Thus, the health of the agricultural ecosystem in Northeast China’s black soil region is not the result of a single natural or anthropogenic factor but rather emerges from the long-term coupled interactions among the natural environment, land use, and socio-economic activities.
Recent research on the ecological health of the black soil area in Northeast China’s black soil mainly covers land quality assessment, ecological security early warning, ecological environment monitoring, land use change, and ecosystem service evaluation [9,10]. Among them, Tian combine the integrated protection concept of “quantity-quality-ecology” with the health evaluation of the cultivated land system, using Google Earth Engine, GeoDetector, and multi-scale geographically weighted regression models to reveal the spatiotemporal evolution and driving mechanisms of the ecological health of cultivated land ecosystems in typical black soil areas, indicating that relevant research is gradually shifting from static state evaluation to long-term time series dynamic monitoring and spatial heterogeneity analysis [10]. Feng construct an evaluation framework containing the following four dimensions: ecological vitality, organizational structure, resilience, and ecosystem services, based on the perspective of ecosystem health, and identify priority areas for ecological restoration in typical black soil areas, providing methodological references for regional ecological restoration and spatial control [11]. Furthermore, agricultural ecosystem health in Jilin Province is shaped by the interplay of economic development, environmental governance, social progress, ecological pressure, and agricultural inputs and is characterized by pronounced spatial heterogeneity [6].
In addition to socio-economic and land use factors, soil erosion, freeze–thaw erosion, and soil physicochemical changes also constrain the health of the cultivated land ecosystem in Northeast China’s black soil region. Relevant research has used the RUSLE and RWEQ models to simulate the water and wind erosion processes of Northeast black soil from 2000 to 2020, indicating that the erosion process is jointly influenced by climate, topography, soil, vegetation, and human activities and that changes in cultivated land use have a significant effect on the erosion process [5]. In addition, freeze–thaw erosion can change soil moisture, porosity, bulk density, aggregate stability, and organic matter content and may further affect the water and wind erosion processes by enhancing soil erodibility [12]. Changes in soil organic carbon (SOC), pH, and other key physicochemical properties serve as indicators of black soil quality dynamics. Ou reported that SOC stocks across the region exhibited an overall increasing trend from 1980 to 2010 yet declined sharply in several major grain-producing areas—a pattern suggesting that agricultural intensification exerted considerable pressure on soil quality [13].
Despite the important foundation provided by existing research for understanding the changes in arable land quality, ecological degradation processes, and soil erosion patterns in the Northeast Black Soil Region, there is still room for further deepening. First, existing research has focused more on individual aspects of cultivated land quality and ecological environment, but has insufficiently addressed the coupling among internal structure, functional processes, and ecosystem service capacity. Second, most studies have been conducted at typical county or local scales, with limited attention to the long-term evolutionary trends and spatial differentiation patterns of cultivated land ecosystem health across the entire Northeast Black Soil Region. Third, the impacts of natural environment, socio-economic development, and human activity intensity exhibit marked spatial heterogeneity, and their relative contributions and interactive mechanisms remain to be further identified.
Based on this, this paper takes the Northeast black soil region as the research object, constructs an evaluation framework for the health of cultivated land ecosystems from dimensions such as productivity, landscape stability, and ecological sustainability, systematically analyzes the spatiotemporal evolution characteristics of the health of cultivated land ecosystems during the research period, and identifies the driving effects of natural environment, socio-economic factors, and human activities on the health of cultivated land ecosystems and their spatial heterogeneity based on GeoDetector. This study addresses the following research questions: (1) how has the health level of cultivated land ecosystems in the Northeast Black Soil Region changed over time? (2) what spatial differentiation patterns did it exhibit? and (3) how do natural environment, socio-economic factors, and human activities collectively influence the evolution of cultivated land ecosystem health? This study provides a scientific basis for Black Soil protection, ecological restoration zoning, sustainable cultivated land use, and regional ecological security optimization in Northeastern China.

2. Overview of the Study Area and Research Methods

2.1. Overview of the Study Area

The Northeast black soil region is an important grain production base in China, where maize, rice, and soybean are the major grain crops. It plays a strategically important role in ensuring national food security. The study area mainly covers Heilongjiang and Jilin provinces, the northern part of Liaoning Province, and parts of eastern Inner Mongolia, including Hulun Buir City, Xing’an League, Tongliao City, Chifeng City, and Xilin Gol League. The region covers approximately 556,000 km2 and includes 146 county-level administrative units, representing one of the largest concentrated areas of black soils in China (Figure 1).
The region is characterized by a temperate continental monsoon climate, with annual precipitation ranging from 400 to 1200 mm, mainly occurring from June to September. Precipitation generally decreases from southeast to northwest. The terrain is dominated by the Songliao Plain, with mountainous and hilly areas distributed in the northwest and east. The central plains are relatively flat, with slopes generally below 5°, providing favorable conditions for agricultural production. Cultivated land covering approximately 183,000 km2 accounts for 32.9% of the study area, making it an important commodity grain production region in China.
The main soil types include black soil, chernozem, chestnut soil, and gray forest soil, among which black soil and chernozem are representative soil types. Long-term intensive agricultural activities and slope cultivation have resulted in severe soil erosion problems. Approximately 89,000 km2 of cultivated land with slopes greater than 0.25° are identified as key areas for soil and water erosion prevention and control, posing challenges to black soil conservation and sustainable cultivated land utilization [1].

2.2. Data Sources

The data used in this study mainly include farmland ecosystem health evaluation data and driving force analysis data. Land use data for 2002, 2012, and 2022 were derived from the China Land Cover Dataset (CLCD) developed by Yang and Huang [14].
Productivity indicators—including the enhanced vegetation index (EVI), net primary productivity (NPP), gross primary productivity (GPP), and evapotranspiration (ET)—were obtained from MODIS products (MOD13Q1 for EVI, MOD17A2HGF V6.1 for GPP, MOD17A3HGF V6.1 for NPP, and MOD16A2 for ET). Water use efficiency (WUE) was subsequently calculated as the ratio of GPP to ET. Landscape stability was quantified using the following three metrics: the largest patch index (LPI), patch density (PD), and aggregation index (AI), which were computed from the land use data for 2002, 2012, and 2022 using the moving-window method in Fragstats 4.2.
For the ecological sustainability assessment, road network data were sourced from the China Surface Transportation Network Database [15]; however, owing to data availability constraints, data for 2000, 2010, and 2020 were used as proxies for the target years of 2002, 2012, and 2022, respectively. Soil erosion intensity was extracted from the China Continental 30 m Annual Soil Water Erosion Dataset [16]. Precipitation and potential evapotranspiration data were obtained from the National Earth System Science Data Center (http://www.geodata.cn/). Root-limiting layer depth was derived from the 1:1,000,000 Soil Database of the Second National Land Survey, and basin boundaries were obtained from the Resource and Environmental Science and Data Center of the Chinese Academy of Sciences (https://www.resdc.cn/). Plant available water content was estimated based on soil texture properties. These datasets were collectively used as inputs to drive the InVEST model for habitat quality and water yield assessment.
For geographical detector analysis, nine driving factors—elevation, slope, aspect, annual precipitation, mean annual temperature, population density, GDP, grazing intensity, and nighttime light intensity—were selected to examine the determinants of cultivated land ecosystem health for 2002, 2012, and 2022. The sources and detailed descriptions of these factor datasets are summarized in Table 1.

2.3. Research Methods

2.3.1. Establishing the Indicator System

The Farmland Ecosystem Health Index (FEHI) is a comprehensive indicator for evaluating the overall health status of farmland as a complex ecosystem, emphasizing the sustainability, stability, and resilience of the farmland system, integrating natural ecological and socio-economic factors to quantify the ability of farmland to respond to external disturbances (such as climate change and human activities).
Refer to the selection of indicators in the research on ecosystem assessment [19,20,21,22], combined with the characteristics of the study area, select indicators related to the health of the cultivated land ecosystem, and identify and screen by experts. Finally, nine evaluation indicators closely related to the health of the cultivated land ecosystem in the study area were selected and divided into three dimensions, establishing a health model system for the cultivated land ecosystem in the Northeast Black Soil Region, as shown in Table 2.
To construct an indicator system for assessing cultivated land ecosystem health, we normalized each indicator using Equations (1) and (2). Based on expert pairwise comparisons, judgment matrices were established for each level of the indicator system, and all matrices satisfied the consistency criterion (CR < 0.10). The derived weights for each level are presented in Table 3.
P o s i t i v e   i n d i c a t o r :   Z i = X i X i m i n X i m a x X i m i n
N e g a t i v e   i n d i c a t o r : Z i = X i m a x X i X i m a x X i m i n
In the formula, X i is the value of the ith indicator, X i m i n is the minimum value of the ith indicator, and X i m a x is the maximum value of the ith indicator.
Forward indicators include EVI, NPP, WUE, LPI, AI, HQ, and WY; reverse indicators include PD and SE.

2.3.2. Indicator Calculation

(1)
Productivity Dimension
The enhanced vegetation index, net primary productivity, and water use efficiency were selected as key indicators, as they collectively capture the ecological vitality of the study area.
  • Enhanced Vegetation Index (EVI)
The enhanced vegetation index (EVI) can effectively reflect vegetation cover status and ecosystem productivity and exhibits high sensitivity to ecological environmental changes. Higher EVI values generally indicate vigorous vegetation growth and a relatively stable ecosystem, whereas lower values suggest a greater degree of ecological degradation. In this study, the EVI data were preprocessed through procedures such as spatial cropping and resampling and were subsequently employed as a key indicator to characterize the productivity of cultivated ecosystems.
b.
Net Primary Productivity (NPP)
Net primary productivity (NPP) reflects the capacity of vegetation to accumulate organic matter through photosynthesis, serving as a key indicator for evaluating both ecosystem productivity and carbon sequestration potential. Specifically, higher NPP values generally correspond to greater energy conversion efficiency within ecosystems and more favorable vegetation growth conditions, whereas lower values may signal the degradation of ecosystem functions. In this study, the NPP data were processed following the same preprocessing procedure as described above.
c.
Water Use Efficiency (WUE)
Water use efficiency (WUE) reflects the capacity of vegetation to utilize water resources and is an important indicator for assessing the relationship between ecosystem productivity and water consumption. The calculation formula is presented in Equation (3), and detailed information on the datasets is provided in Table 4.
W U E = G P P E T
In the equation, WUE represents water use efficiency; GPP (annual) represents annual gross primary productivity, expressed in kg C/m2; and ET (annual) represents annual evapotranspiration, expressed in kg/m2.
(2)
Landscape Stability Dimensions
In this study, the maximum patch index, patch density, and aggregation index are selected to represent landscape dominance, landscape fragmentation, and landscape connectivity, respectively, thereby reflecting changes in cultivated land structure.
a.
Maximum Patch Index (LPI)
The maximum patch index (LPI), which reflects the scale and dominance of dominant patches within the landscape, indicates greater landscape connectivity and reduced fragmentation at higher values. The corresponding calculation formula is presented in Equation (4).
L P I = M a x ( a 1 , , a n ) A × 100
In the formula, an represents the area of plaque n, and A denotes the total area.
b.
Patch Density (PD)
Patch density, which characterizes the degree of landscape fragmentation within the study area, is computed according to Equation (5).
P D = N A
In the equation, PD represents patch density; N represents the total number of patches within the landscape or study area (unit: number of patches); and A represents the total area of the landscape or study area (unit: corresponding area units, such as km2 or m2). A higher PD value indicates a higher degree of landscape fragmentation.
c.
Aggregation Index (AI)
The aggregation index (AI) quantifies the degree of aggregation and compactness among patches of the same type within the landscape, where higher AI values generally indicate better landscape connectivity. The index ranges from 0 to 100 (0 ≤ AI ≤ 100), and its calculation formula is presented in Equation (6).
A I = g i m a x g i × 100
In the formula, g i represents the number of adjacent edges between patches of the same type in the landscape (i.e., the common boundary length between patches of the same type), and m a x g i is the number of adjacent edges between patches of the same type under the maximum possible aggregation situation.
(3)
Ecological sustainability dimension
In this study, habitat quality (HQ), soil erosion intensity, (SE) and water yield (WY) are selected to respectively reflect regional ecological quality, soil and water conservation capacity, and ecological regulatory function, thereby comprehensively characterizing the sustainable development capacity of cultivated land ecosystems.
a.
Habitat Quality (HQ)
Habitat quality reflects the capacity of regional ecosystems to sustain biological survival and withstand external disturbances, serving as a key indicator for assessing the sustainability of cultivated land ecosystems. Accordingly, this study employs the InVEST model in conjunction with land use data, threat factor data, and biophysical parameters (Table 5) to compute the habitat quality index across the study area, thereby enabling a comprehensive analysis of the ecological status of cultivated land ecosystems.
b.
Land Erosion Intensity (SE)
The intensity of soil erosion can reflect the status of soil and water loss and land degradation in the region and is an important indicator for measuring the sustainability of cultivated land ecosystems. A higher SE value indicates poorer soil stability and a higher degree of ecological degradation.
c.
Water Conservation Function (WY)
The water conservation function can reflect the ecosystem’s regulation and storage capacity of precipitation and is an important indicator for measuring the regional ecological regulation function. Based on the principle of water balance, with the help of the InVEST model, by using annual precipitation grid data, land use data, biophysical parameters, etc. (Table 6), the water yield data of the study area are calculated. A higher WY value indicates that the ecosystem has a stronger water conservation capacity, which is conducive to maintaining the stability of the cultivated land ecosystem.
In addition, both the criterion layer and the objective layer are calculated using the comprehensive weighted index method, as shown in the following formula:
a.
Productivity Dimension Indicator ( P t )
P t = 0.54 × E V I + 0.30 × N P P + 0.16 × W U E
In the formula, Pt denotes the productivity dimension index of the study area; EVI, NPP, and WUE represent the enhanced vegetation index, net primary productivity, and water use efficiency, respectively. Higher values indicate stronger biological productivity and resource utilization efficiency within the system.
b.
Landscape Stability Index ( S t )
S t = 0.54 × L P I + 0.30 × P D + 0.16 × A I
In the formula, S t denotes the landscape stability dimension index of the study area, while LPI, PD, and AI represent the largest patch index, patch density, and aggregation index, respectively. Higher values of these indices indicate greater integrity and stronger resistance to disturbance in the spatial configuration of cultivated land.
c.
Ecological Sustainability Index ( E t )
E t = 0.34 × H Q + 0.38 × S E + 0.28 × W Y
In the formula, Et denotes the ecological sustainability dimension index, while HQ, SE, and WY represent habitat quality, soil erosion intensity, and water conservation capacity, respectively. Higher values of these indices indicate stronger ecological service provision and greater environmental carrying capacity of the system.
d.
Farmland Ecosystem Health Index (FEHI)
F E H I t = W P × P t + W S × S t + W E × E t
In this formula, t represents the year (2002, 2012, and 2022), while Pt, St, and Et denote the weights for productivity, landscape stability, and ecological sustainability, respectively. The values range from [0 to 1], with higher values indicating better health of the cultivated land ecosystem.

2.3.3. Geographical Detector

GeoDetector is a statistical tool proposed by Wang Jinfeng and Xu Chengdong for analyzing spatial differentiation characteristics, with its core function being to reveal the intensity of spatial differentiation phenomena and identify their driving factors [30]. The tool encompasses the following four main analysis methods: factor detection, interaction detection, risk detection, and ecological detection. Owing to its capacity to quantify explanatory power, GeoDetector has been widely applied in studies of geographical spatial dynamics and their driving forces. In this study, factor detection and interaction detection were employed to analyze the driving mechanisms underlying the ecological health of the cultivated land ecosystem in the Northeast black soil region, with particular focus on the explanatory strength of driving factors for landscape pattern spatial differentiation.
a.
Factor Detection
To test whether a certain geographical factor is a cause of the spatial differentiation of a certain geographical feature and the extent to which it can explain, the q-value can represent the explanatory power of the driving factor on the dependent variable, and the expression is as follows:
q = 1 h = 1 L N h σ h 2 N σ 2
In the formula, L is the classification of the driving factor X; Nh and N are the number of units in layer h and the total area, respectively; and σ2h and σ2 are the variances of the Y values in layer h and the total area, respectively. The q value is between 0 and 1, and the higher the value, the greater the explanatory power of the driving factor on landscape fragmentation.
b.
Interactive Detection
The criteria and basis for interactive detection are detailed in Table 7. By calculating the q-value after superimposing the two factors and comparing it with the q-value of a single factor, it can be determined whether there is a coupling effect between the two factors, as well as whether the explanatory ability of the factors on the landscape pattern index changes under the coupling effect, the intensity of the interaction, etc. The specific operational path is as follows: first, calculate the q-values of two different factors X1 and X2 on the dependent variable Y, denoted as q(X1) and q(X2), and then calculate the q-value of the new factor X1 ∩ X2 after superimposing these two factors, denoted as q(X1 ∩ X2). By comparing the values of q(X1), q(X2), and q(X1 ∩ X2), the type of coupling between the two variables can be determined.
Based on the natural geographical characteristics, regional economic development, and human activities in the Northeast Black Soil Region, and under the premise of ensuring data scientificity and availability, this study selected individual counties as the evaluation units and established an indicator system comprising nine driving factors across four dimensions as follows: topography, climate, socioeconomic conditions, and human activities, to systematically reflect the potential driving mechanisms of cropland ecosystem health.
Geographical detector analysis requires the discretization of continuous variables. Considering the differences among the driving factors in terms of measurement units, value ranges, and spatial distributions, particularly the strong spatial heterogeneity and high-value clustering characteristics of socioeconomic factors such as GDP (X7) and nighttime light (X8), the quantile method was adopted to uniformly discretize the continuous driving factors to avoid insufficient samples in some categories and improve the stability of the results. This method ensures relatively balanced numbers of county-level samples across categories, thereby enhancing the representativeness and comparability of the classification results. On this basis, the explanatory power and statistical significance of the geographical detector under different numbers of classes were compared. Considering the model explanatory power, statistical significance, and comparability of the classification results, a five-class quantile method was ultimately selected for the discretization of the driving factors. The specific driving factors and their discretization results are presented in Table 8.

3. Results

3.1. Analysis of Spatiotemporal Changes in the Ecological Health Model of Cultivated Land in the Northeast Black Soil Region

To more intuitively reflect the health status of the cultivated land ecosystem in the study area, based on the statistical characteristics of the normalized comprehensive index of cultivated land ecosystem health and relevant research [6,7,10], the health status of the cultivated land system was divided into five levels using the Jenks natural breaks classification method, ranging from 0 to 1 and representing health levels from low to high (hereinafter the same).

3.1.1. Characteristics of Spatiotemporal Changes in Arable Land Productivity

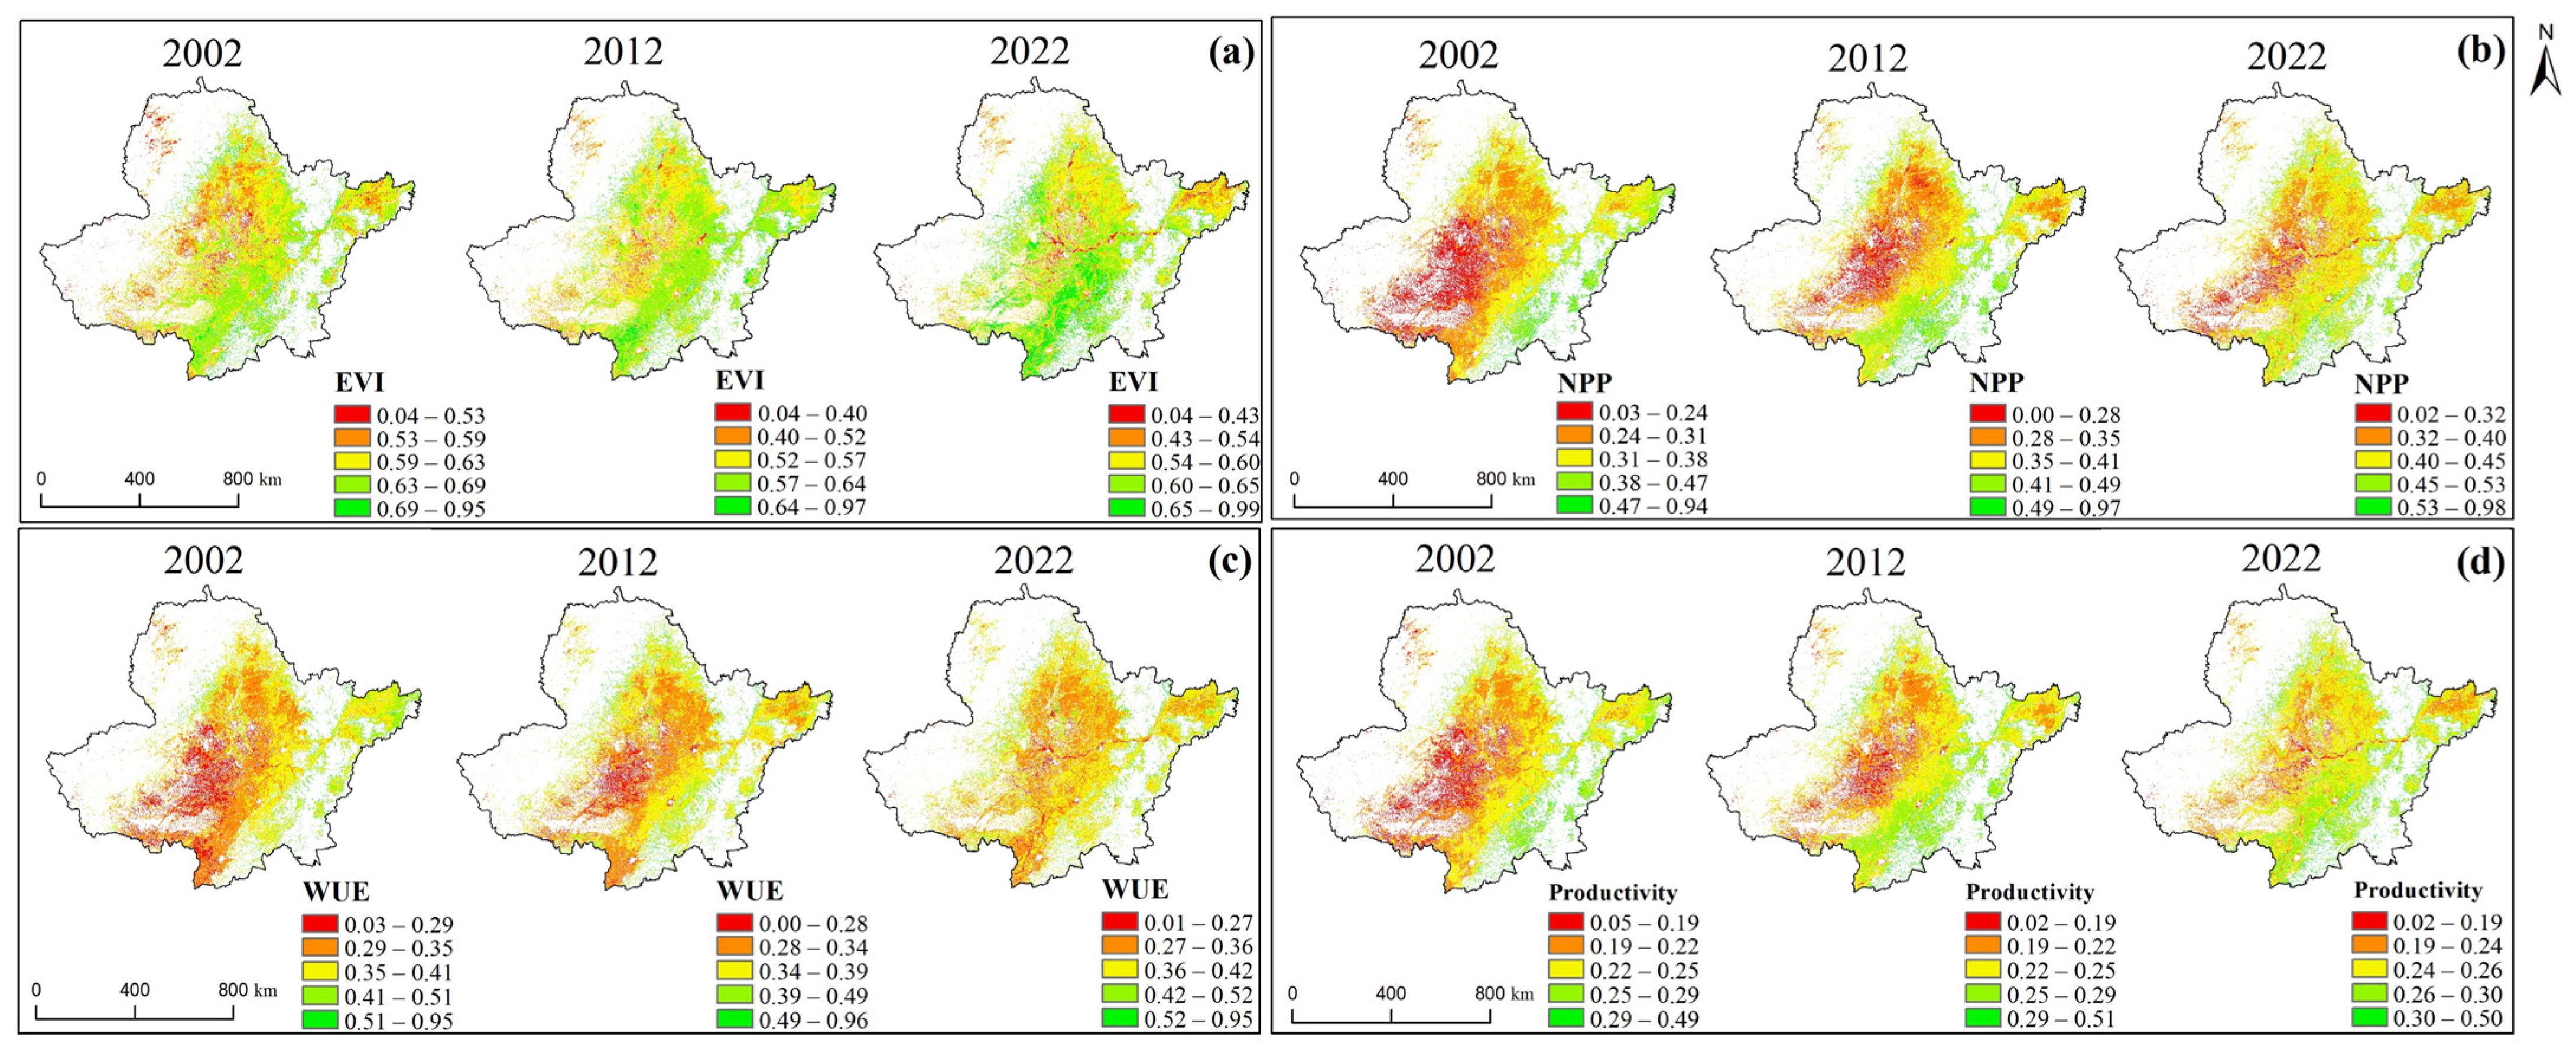
Between 2002 and 2022, the individual indices comprising the productivity dimension showed an overall increasing trend with certain spatial variations. As shown in Figure 2a, the enhanced vegetation index (EVI) exhibited a gradual increasing trend, with high-value areas expanding from the southeast toward the central and northern regions. In Figure 2b, the low-value areas of net primary productivity (NPP) decreased in the central and western regions, indicating an increase in the overall biomass production capacity of the region. In Figure 2c, water use efficiency (WUE) exhibited certain fluctuations among different study years, with low-value areas decreasing after a local expansion in 2012.
The comprehensive productivity of cultivated land exhibited a clear spatial gradient, characterized by a pattern of “high in the southeast and low in the northwest” (Figure 2d). Specifically, the eastern and southern marginal areas and transition zones (green areas) maintained relatively higher productivity levels, which may be related to favorable hydrothermal conditions. In contrast, the central and western plain agricultural areas (red/orange areas) exhibited relatively lower productivity levels, possibly due to differences in regional climatic conditions, soil properties, and agricultural environments.
Regarding temporal variations, the overall comprehensive productivity of cultivated land showed a relatively stable increasing trend during the study period, with improvements observed in some areas. From 2002 to 2012, the productivity pattern remained relatively stable, with low-productivity areas in the central and western regions (red) showing slight aggregation and high-productivity areas in the east and south (green) maintaining their spatial distribution characteristics. From 2012 to 2022, the comprehensive productivity increased further. Compared with the previous period, the low-productivity areas (red) in the central and western regions decreased in 2022, with some areas transitioning to medium productivity levels (orange–yellow). Meanwhile, the high-productivity areas (green) in the south expanded toward the central and northern regions.

3.1.2. Spatiotemporal Characteristics of Cultivated Land Landscape Stability

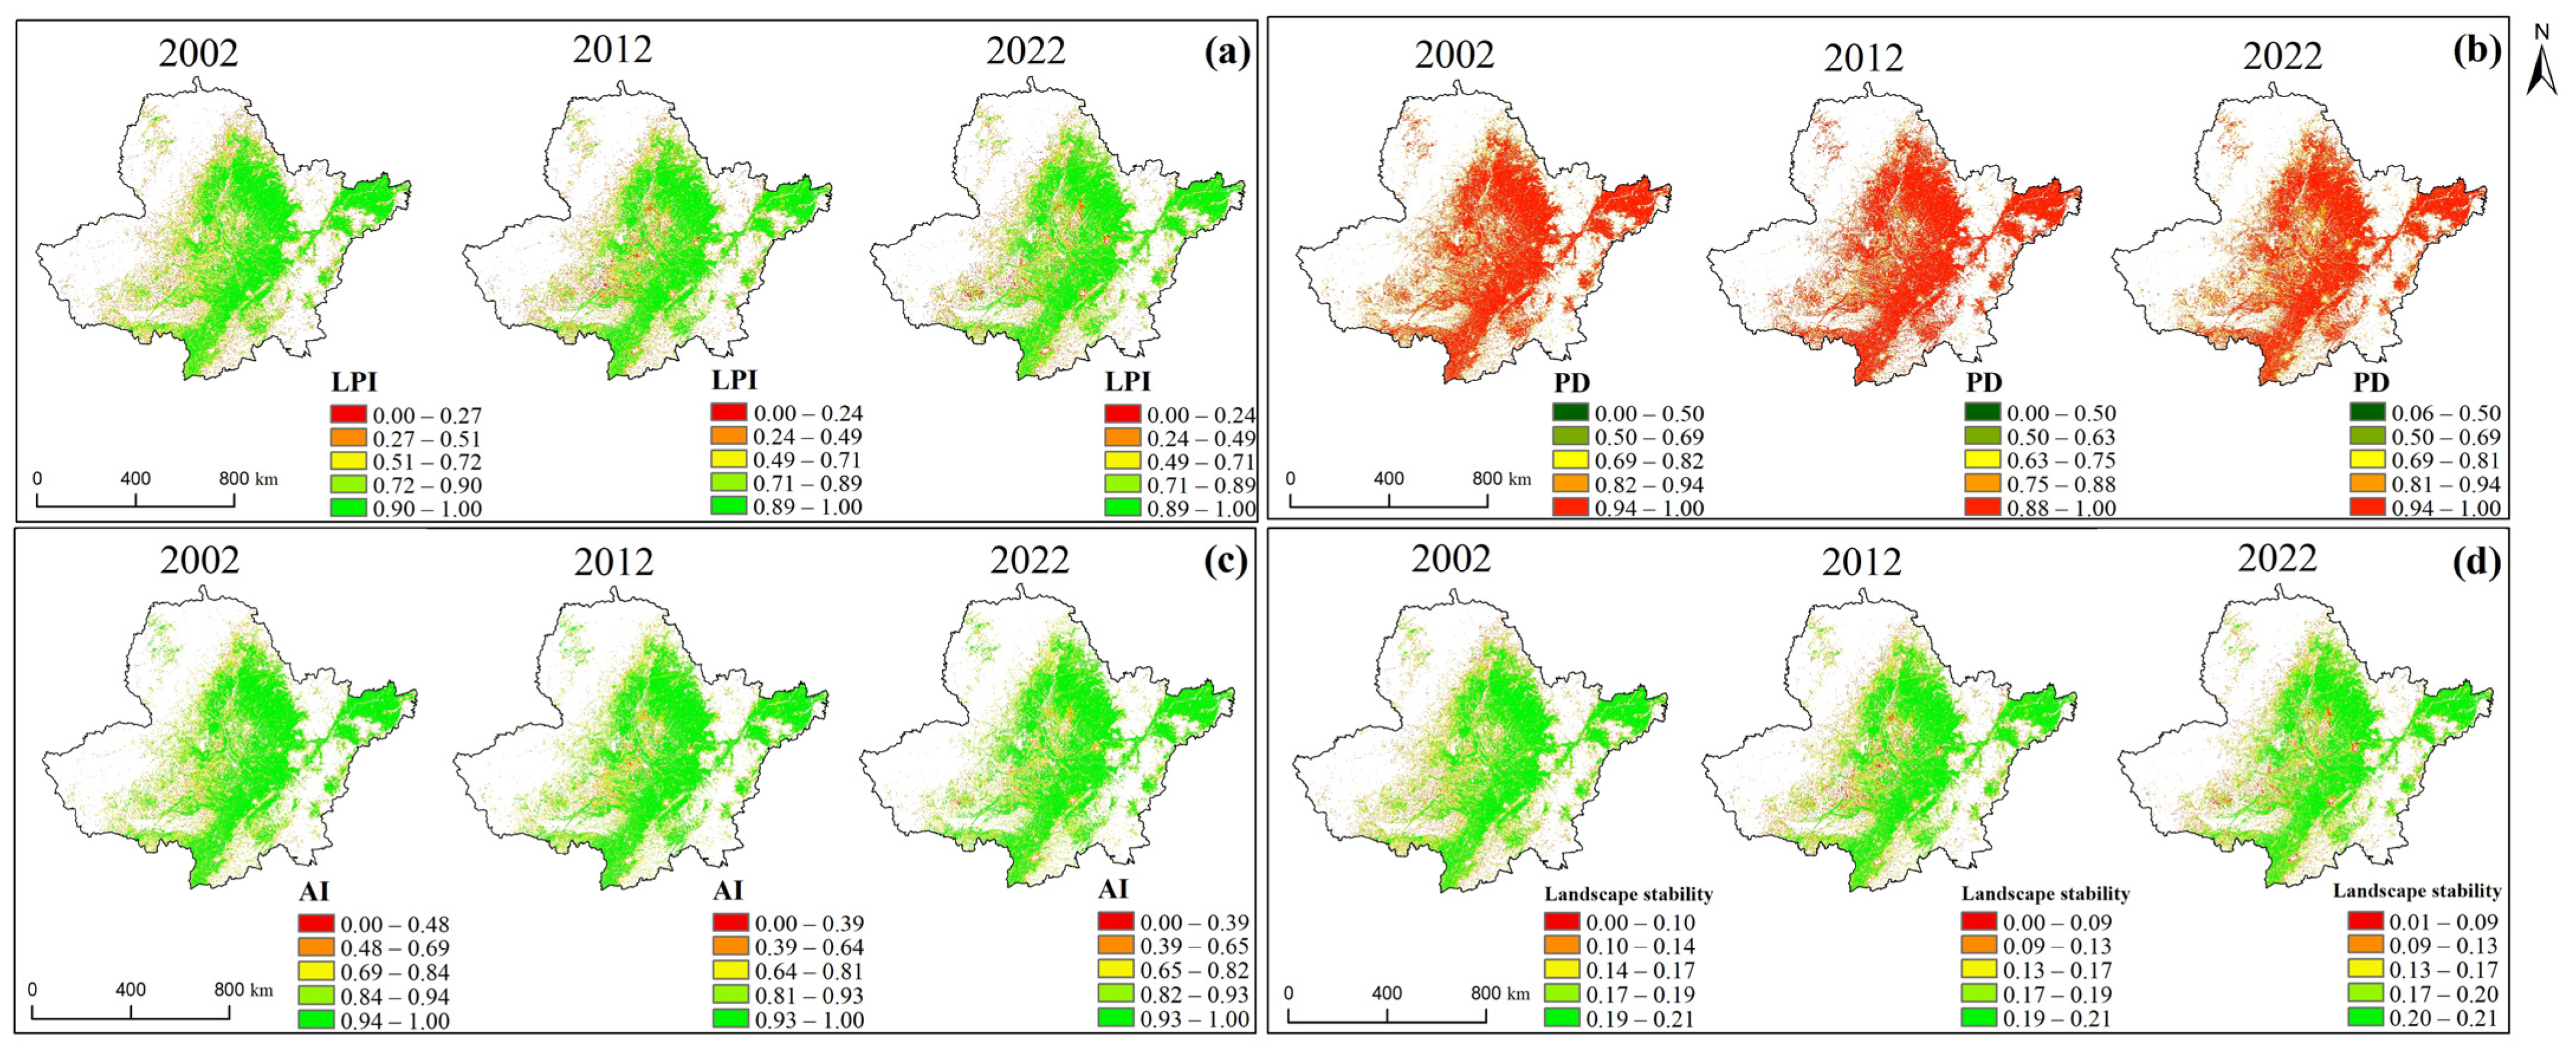
Between 2002 and 2022, the high-value areas of the Landscape Patch Index (LPI) and aggregation index (AI) in Figure 3a,c were consistently concentrated in the central plain, whereas the high-value areas of patch density (PD) in Figure 3b were mainly distributed in the eastern and peripheral hilly areas. This spatial contrast indicates that landscape patches in the core plain area were relatively continuous and aggregated, while landscape fragmentation was relatively higher in the marginal areas.
Regarding spatial patterns, the cultivated land landscape stability exhibited a distribution characteristic of “high in the core and low at the edges” (Figure 3d). Specifically, the plain core areas (green) showed relatively higher landscape stability, whereas the peripheral agricultural and forest–pastoral transition areas (red and yellow) exhibited lower stability, which may be related to differences in landscape structure and land use patterns.
Regarding temporal variations, the overall landscape stability of the study area showed a decreasing trend with spatial differences during the study period. From 2002 to 2012, the distribution range of high-stability areas in the core region decreased to some extent, while medium- and low-stability areas in the edge transition zones expanded inward. From 2012 to 2022, the high-stability areas in the peripheral regions further decreased and landscape fragmentation increased in some areas, while the overall spatial pattern of landscape stability remained relatively unchanged.

3.1.3. Spatiotemporal Characteristics of Ecological Sustainability of Cultivated Land

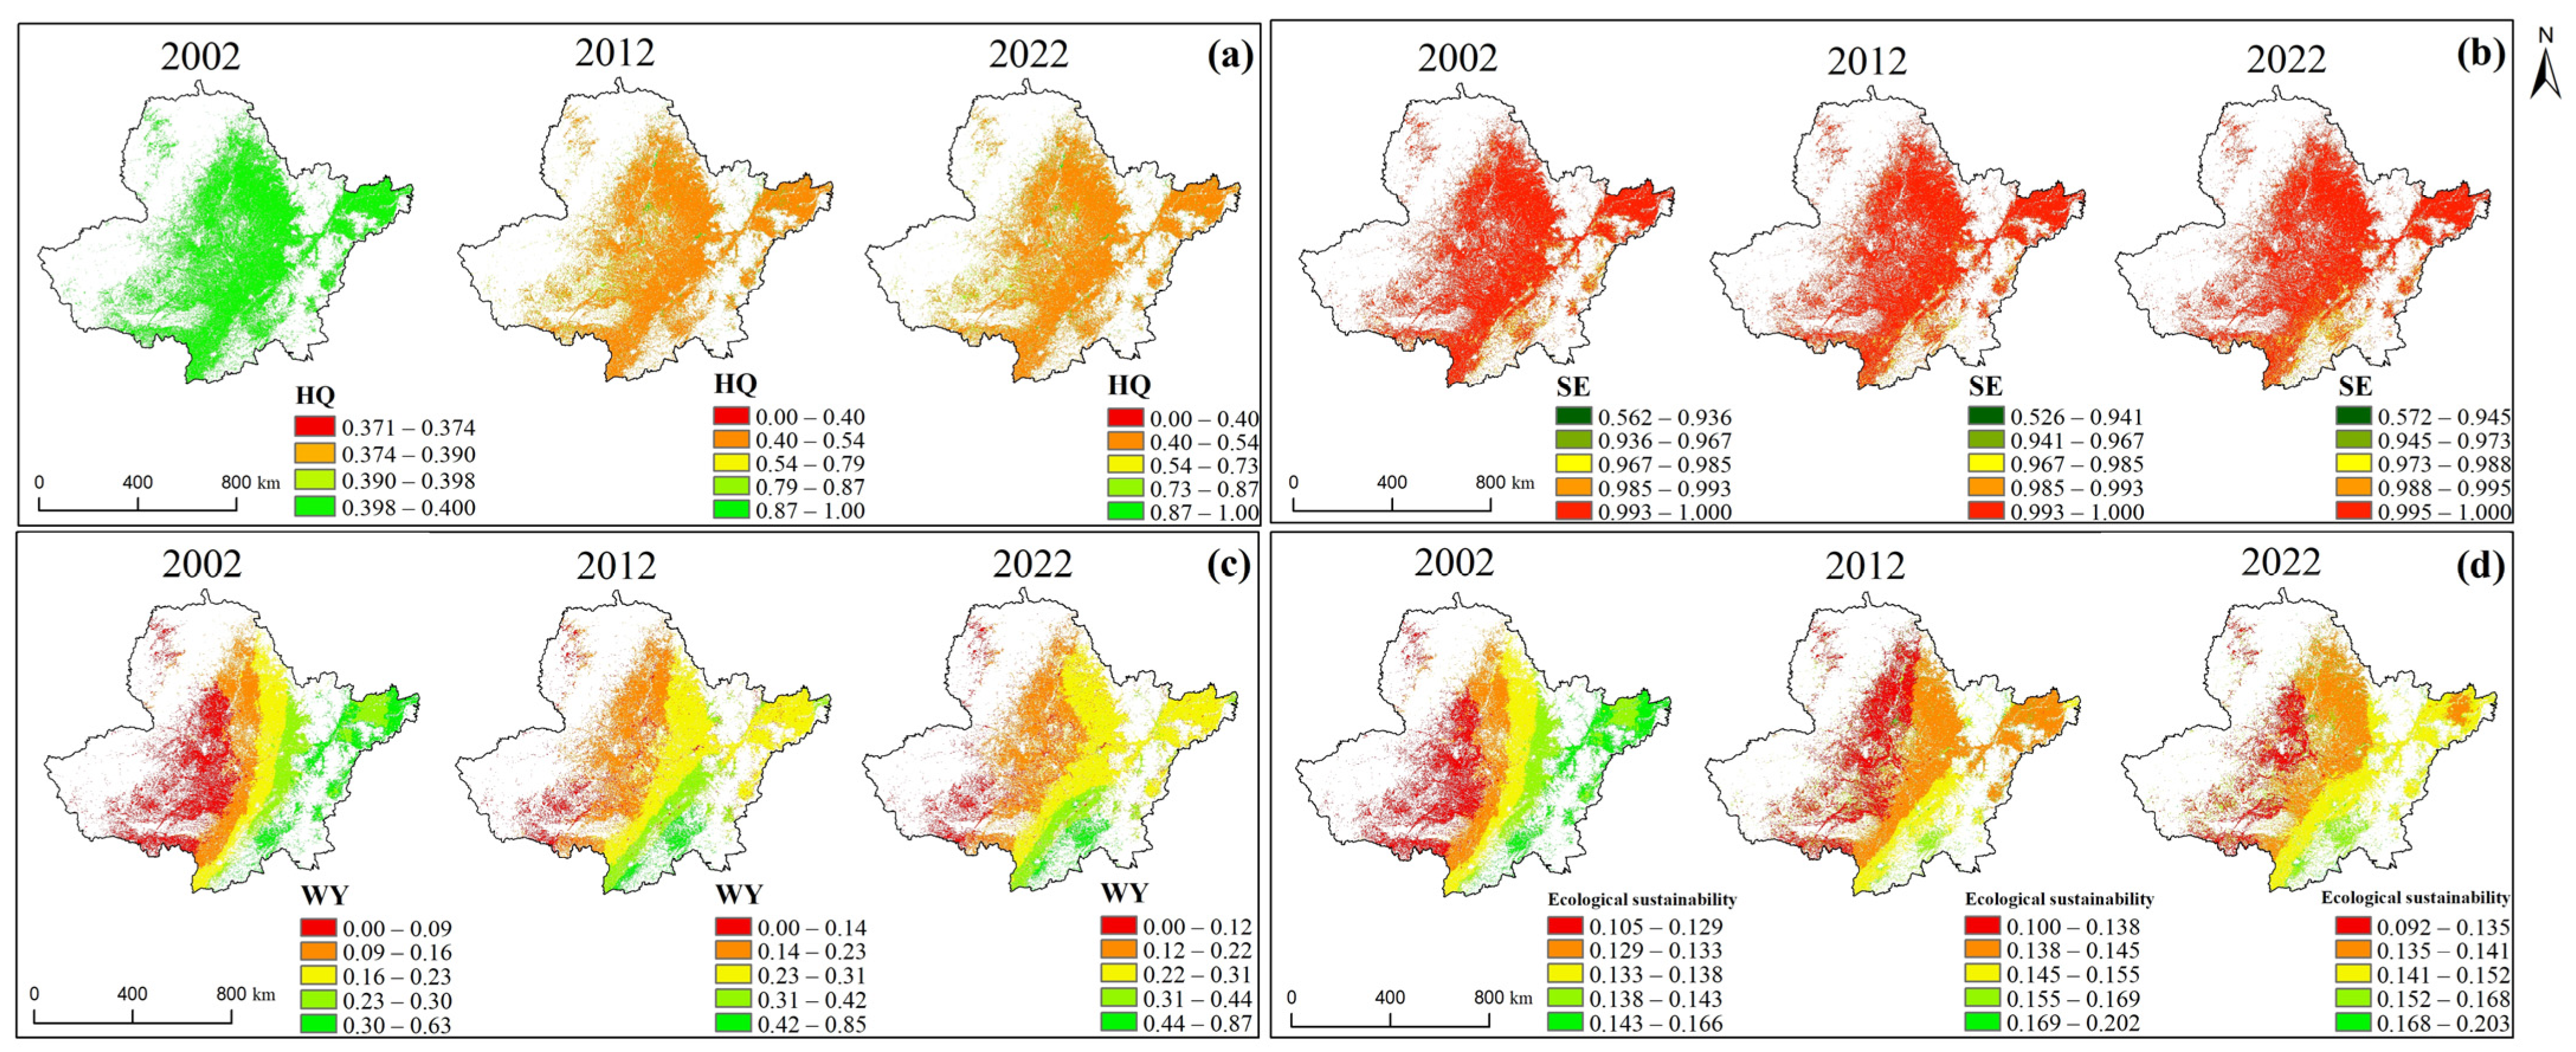
Between 2002 and 2022, the ecological indices exhibited different variation patterns. As shown in Figure 4a, habitat quality (HQ) showed an overall decreasing trend, accompanied by changes in its spatial distribution. In Figure 4b, soil-related indices (SE) remained relatively high in the central and western plain areas, with limited spatial variation among different study years. In Figure 4c, water yield (WY) exhibited a spatial gradient of “high in the east and low in the west”, with a decreasing trend in the high-value areas in the east.
Regarding spatial patterns, the ecological sustainability of cultivated land showed a distribution characteristic of “higher in the east and lower in the west” (Figure 4d). Specifically, the eastern agricultural and forest transition areas (green areas) exhibited relatively higher ecological sustainability, which may be related to differences in topography, land use patterns, and ecological conditions. In contrast, the central and western plain areas (red/orange areas) showed relatively lower sustainability levels, possibly due to intensive agricultural activities and differences in ecological conditions.
Regarding temporal variations, the ecological sustainability of cultivated land showed a decreasing trend followed by a relatively stable pattern at a low level during the study period. From 2002 to 2012, the high-sustainability areas in the east (green) decreased, with some areas transitioning to medium sustainability levels (yellow/orange), indicating a reduction in ecological sustainability during this period. From 2012 to 2022, the decreasing trend slowed, but the overall sustainability level remained relatively low. Low-sustainability areas in the central and western regions (red) remained relatively concentrated, while high-value areas in the east did not show a clear increase.

3.1.4. Characteristics of Spatiotemporal Changes in the Health of Cultivated Land Ecosystems

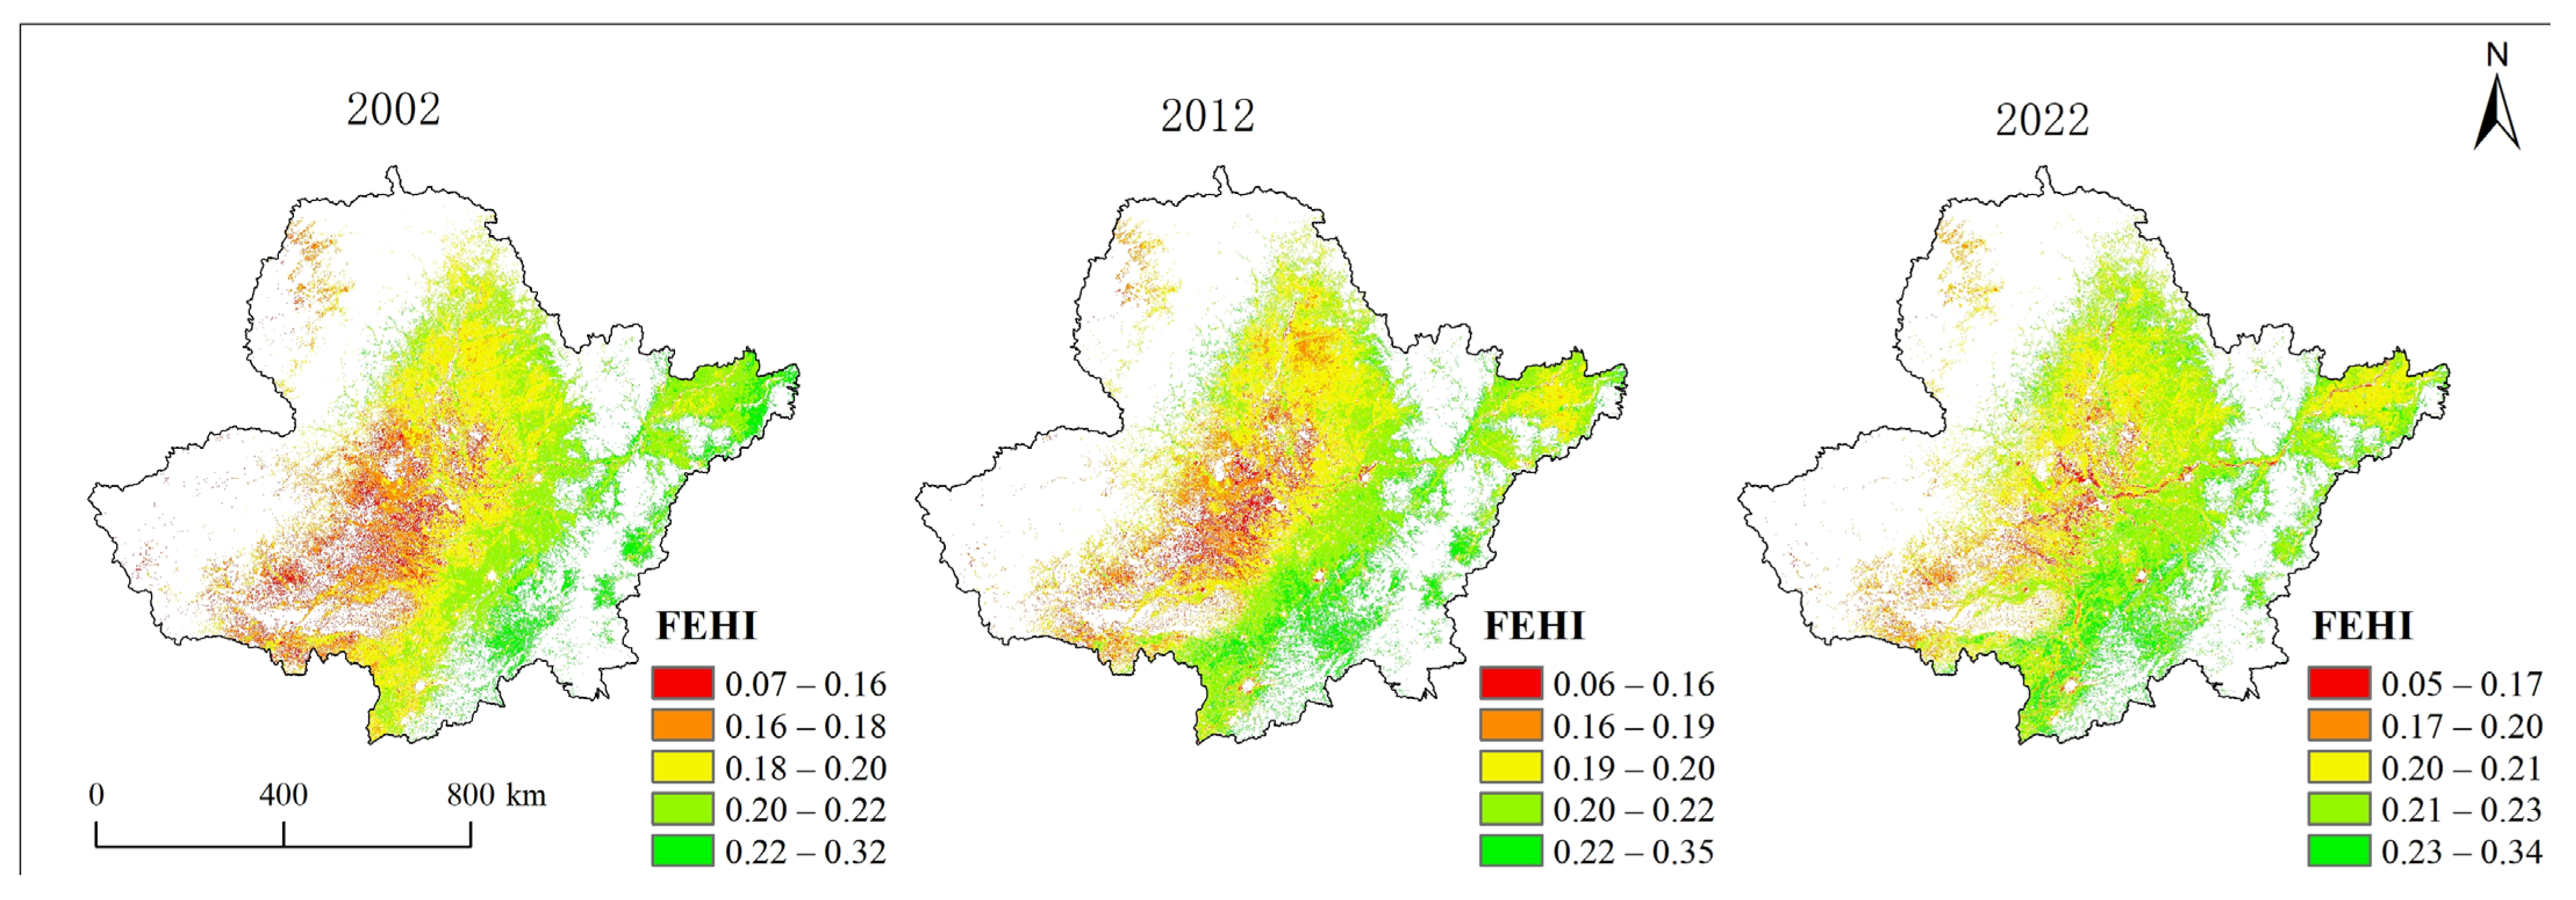
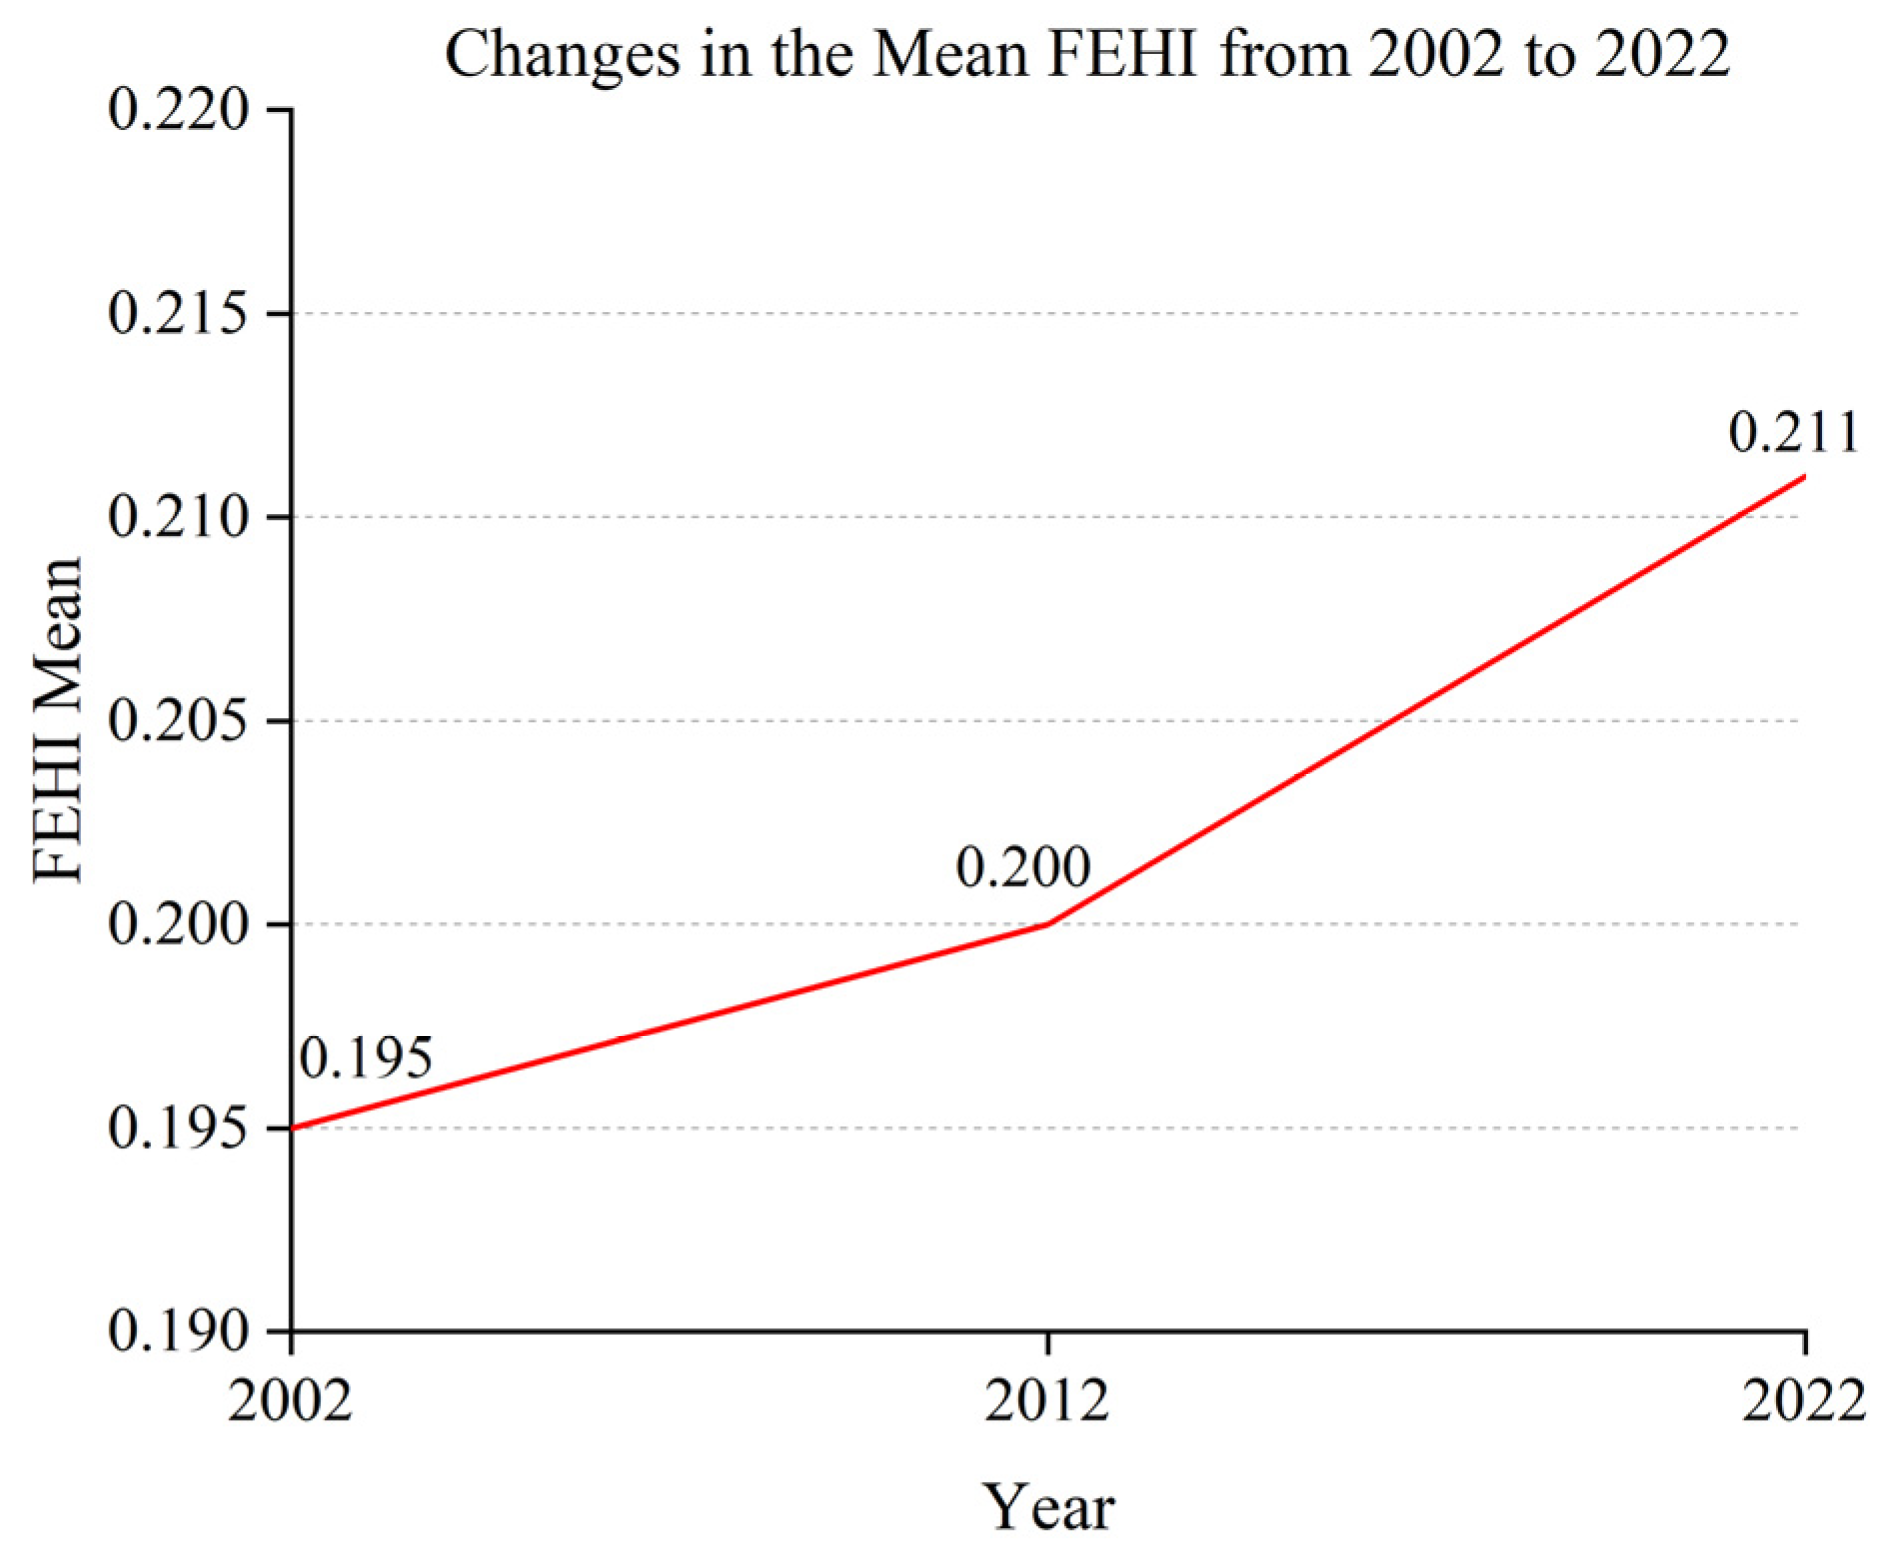
Based on the results shown in Figure 5, the mean Farmland Ecosystem Health Index (FEHI) of cultivated land in the Northeast black soil region exhibited an overall increasing trend among the three study years. From 2002 to 2012, the regional mean FEHI increased from 0.195 to 0.200, indicating a slight improvement in cultivated land ecosystem health during this period. From 2012 to 2022, the mean FEHI further increased to 0.211, with an increase of 0.011 compared with the previous period, suggesting that the overall health level of cultivated land ecosystems continued to improve.
In terms of spatial distribution, cultivated land ecosystem health showed clear spatial heterogeneity, generally presenting a pattern of “higher in the southeast and lower in the central and western regions.” High-health areas (green patches) were mainly distributed in the eastern and southern margins of the study area and the agroforestry transition zones of the Daxing’an Mountains, Xiaoxing’an Mountains, and Changbai Mountains. These areas generally have relatively favorable natural conditions, which may contribute to higher ecosystem health levels. In contrast, medium- and low-health areas (yellow, orange, and red patches) were mainly concentrated in the central and western plains, especially the Songnen Plain, where intensive agricultural activities and long-term land use may have affected ecosystem health levels.
Comparison of the spatial patterns among the three study years (Figure 6) revealed changes in the distribution of cultivated land ecosystem health. From 2002 to 2012, the overall spatial pattern remained relatively stable, although some low-health areas in the central and southern regions decreased and transitioned toward relatively low- or medium-health levels. Meanwhile, high-health areas in the eastern region maintained their original spatial distribution. From 2012 to 2022, further changes occurred in the spatial pattern. Low-health areas in the central and western regions decreased, with some areas transitioning to medium-health levels. At the same time, high-health areas in the east and south expanded to some extent, indicating an overall improvement in the spatial distribution of cultivated land ecosystem health.

3.2. Black Soil Region Analysis of Health Drivers in Cultivated Land Ecosystems

3.2.1. Factor Detector

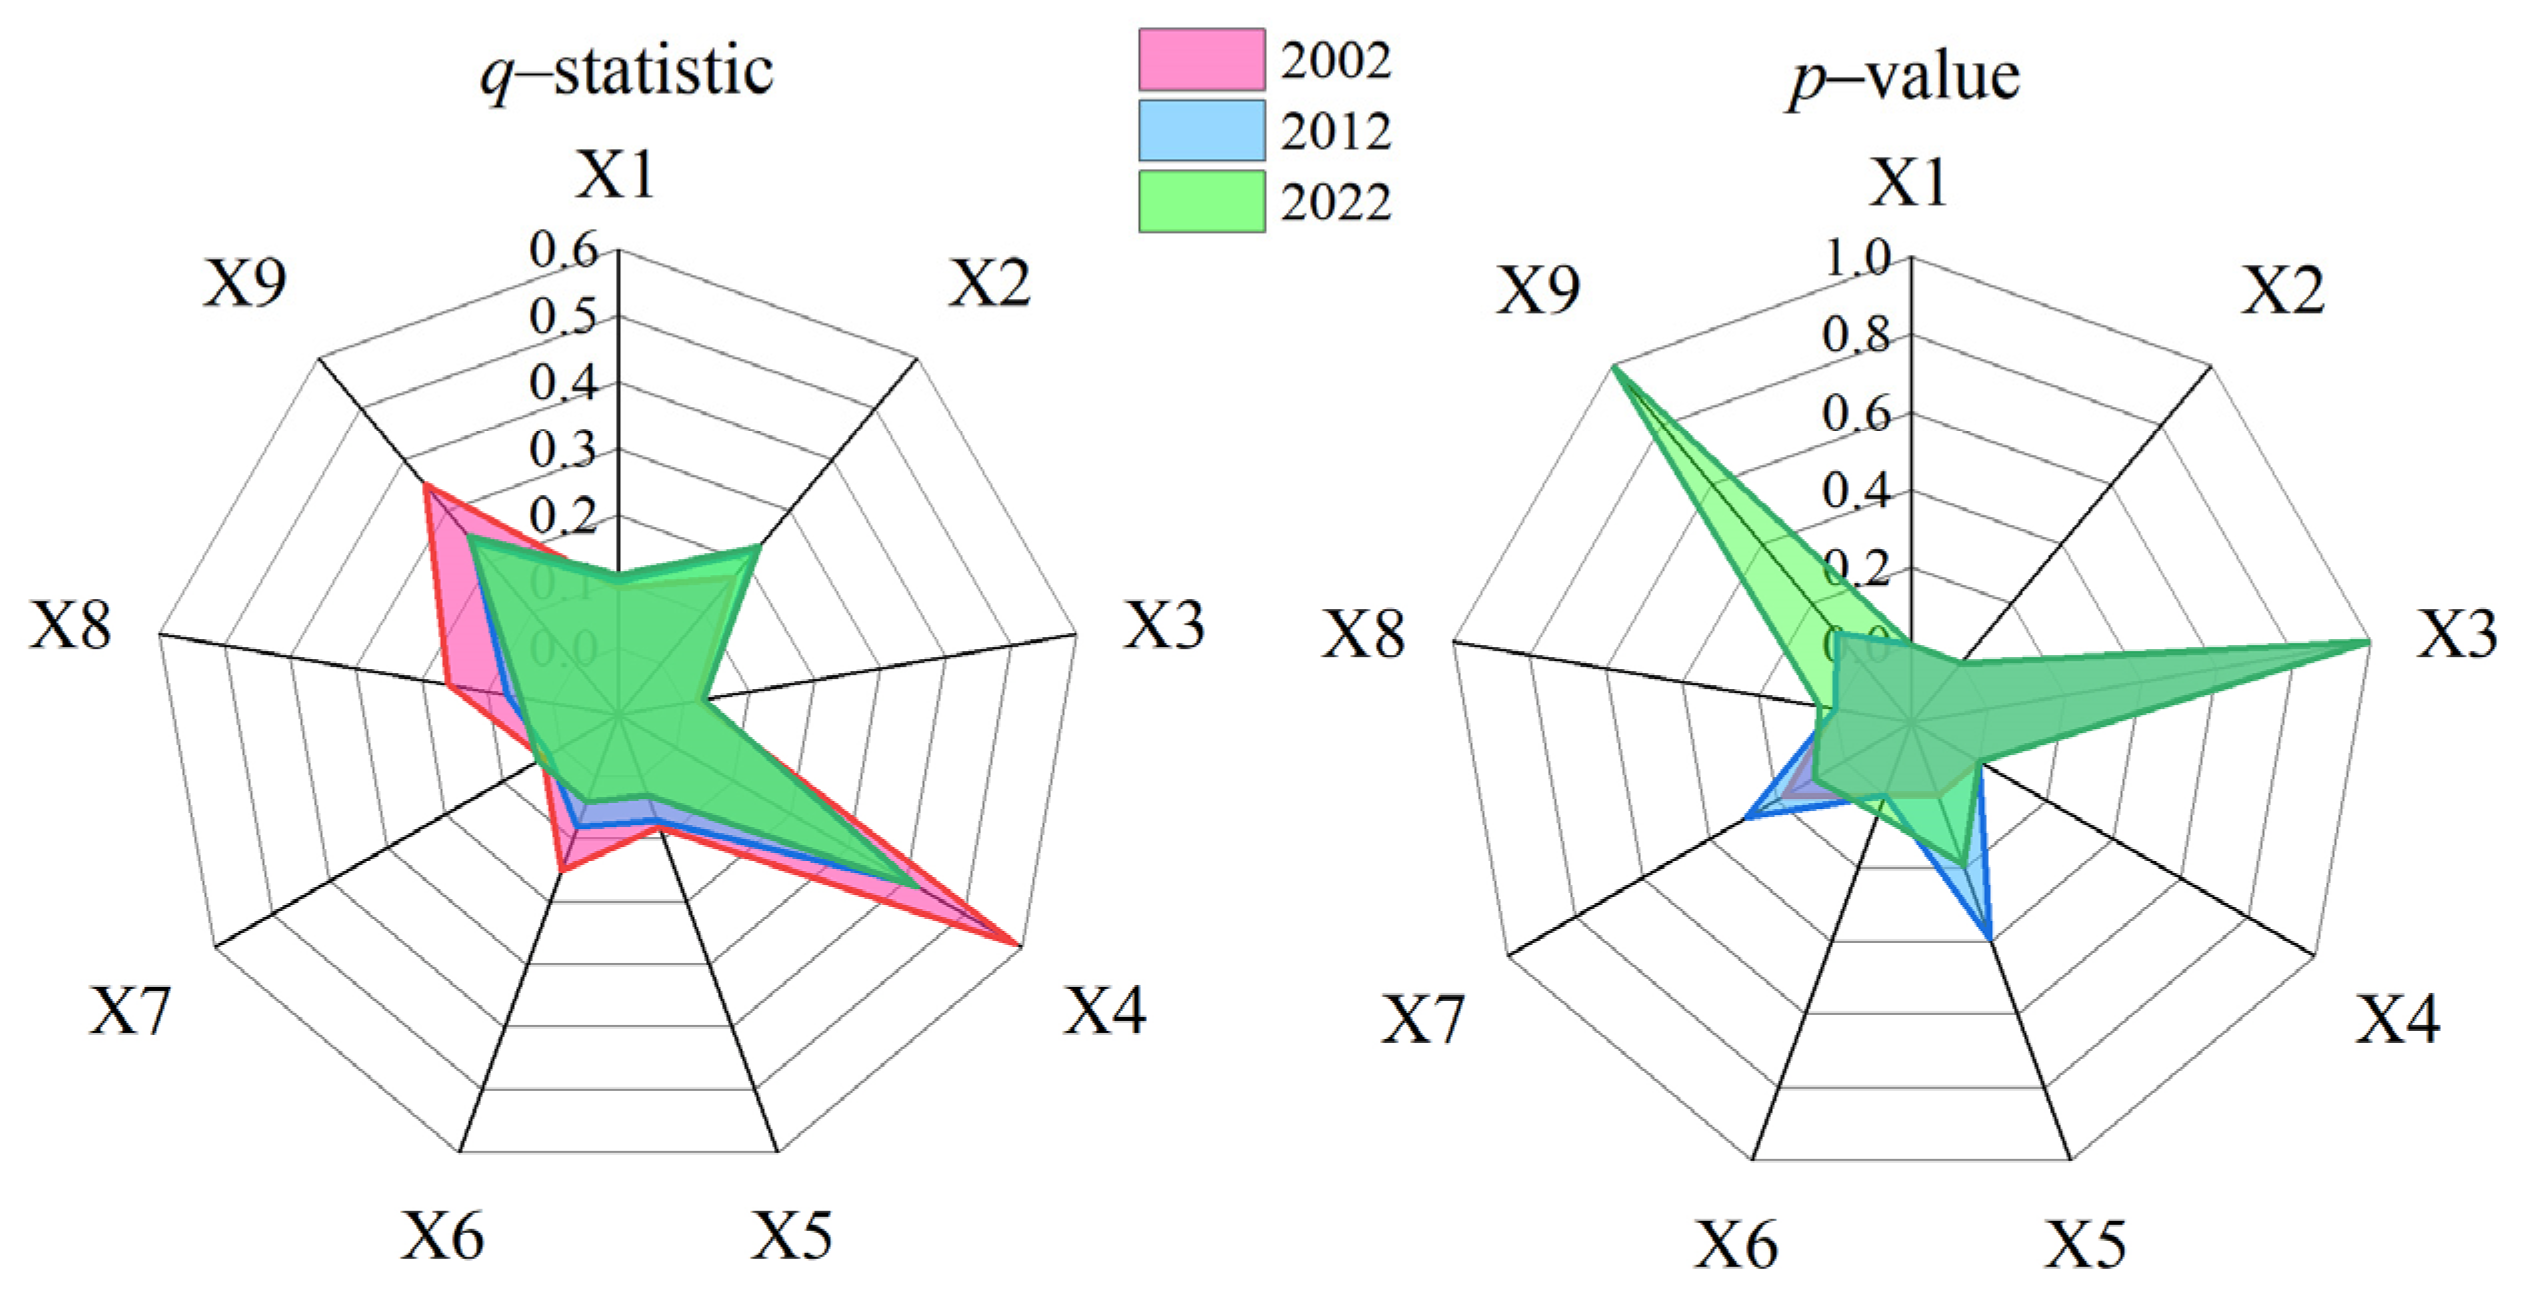
This study employs the factor detection function of the geographic detector to quantitatively evaluate the explanatory power of various driving factors on landscape pattern changes. To this end, three representative years—2002, 2012, and 2022—are selected as the study period, with a focus on the spatial differentiation characteristics of nine key driving factors, which are categorized into the following four groups: topographic factors (elevation X1, slope X2, and aspect X3), climatic factors (precipitation X4 and temperature X5), socio-economic factors (population density X6 and GDP X7), and human activity factors (nighttime lighting X8 and grazing data X9). Through an analysis of the spatial distribution patterns of the resulting q-values, this approach systematically reveals the differentiated mechanisms by which these driving factors influence land use change across the different periods.
As shown in Figure 7, the explanatory power of different factors varied among the three study years. Precipitation (X4) showed relatively high q-values in 2002, 2012, and 2022, indicating a strong explanatory ability for the spatial differentiation of cultivated land ecosystem health. However, the q-value of precipitation varied among different years, suggesting temporal differences in its contribution. Elevation (X1) also maintained relatively high explanatory power throughout the study period, indicating its important role in explaining spatial variations in ecosystem health.
The explanatory power of slope (X2) increased in 2022 compared with previous years, while aspect (X3) showed relatively low q-values and p-values close to 1.0, indicating that it did not pass the significance test and had limited explanatory ability. Temperature (X5) also exhibited relatively low explanatory power during the study period.
Among socio-economic and human activity factors, population density (X6), GDP (X7), and nighttime lighting (X8) showed relatively lower explanatory power, with variations among different study years. Grazing data (X9) showed higher explanatory power in 2002, accompanied by a lower p-value, whereas its explanatory ability decreased in later years and its statistical significance weakened.
Overall, the Geo-Detector factor detection results indicated that precipitation and elevation exhibited relatively higher explanatory power for the spatial differentiation of cultivated land ecosystem health, while the contribution of different factors varied among the three study years.

3.2.2. Interactive Detector

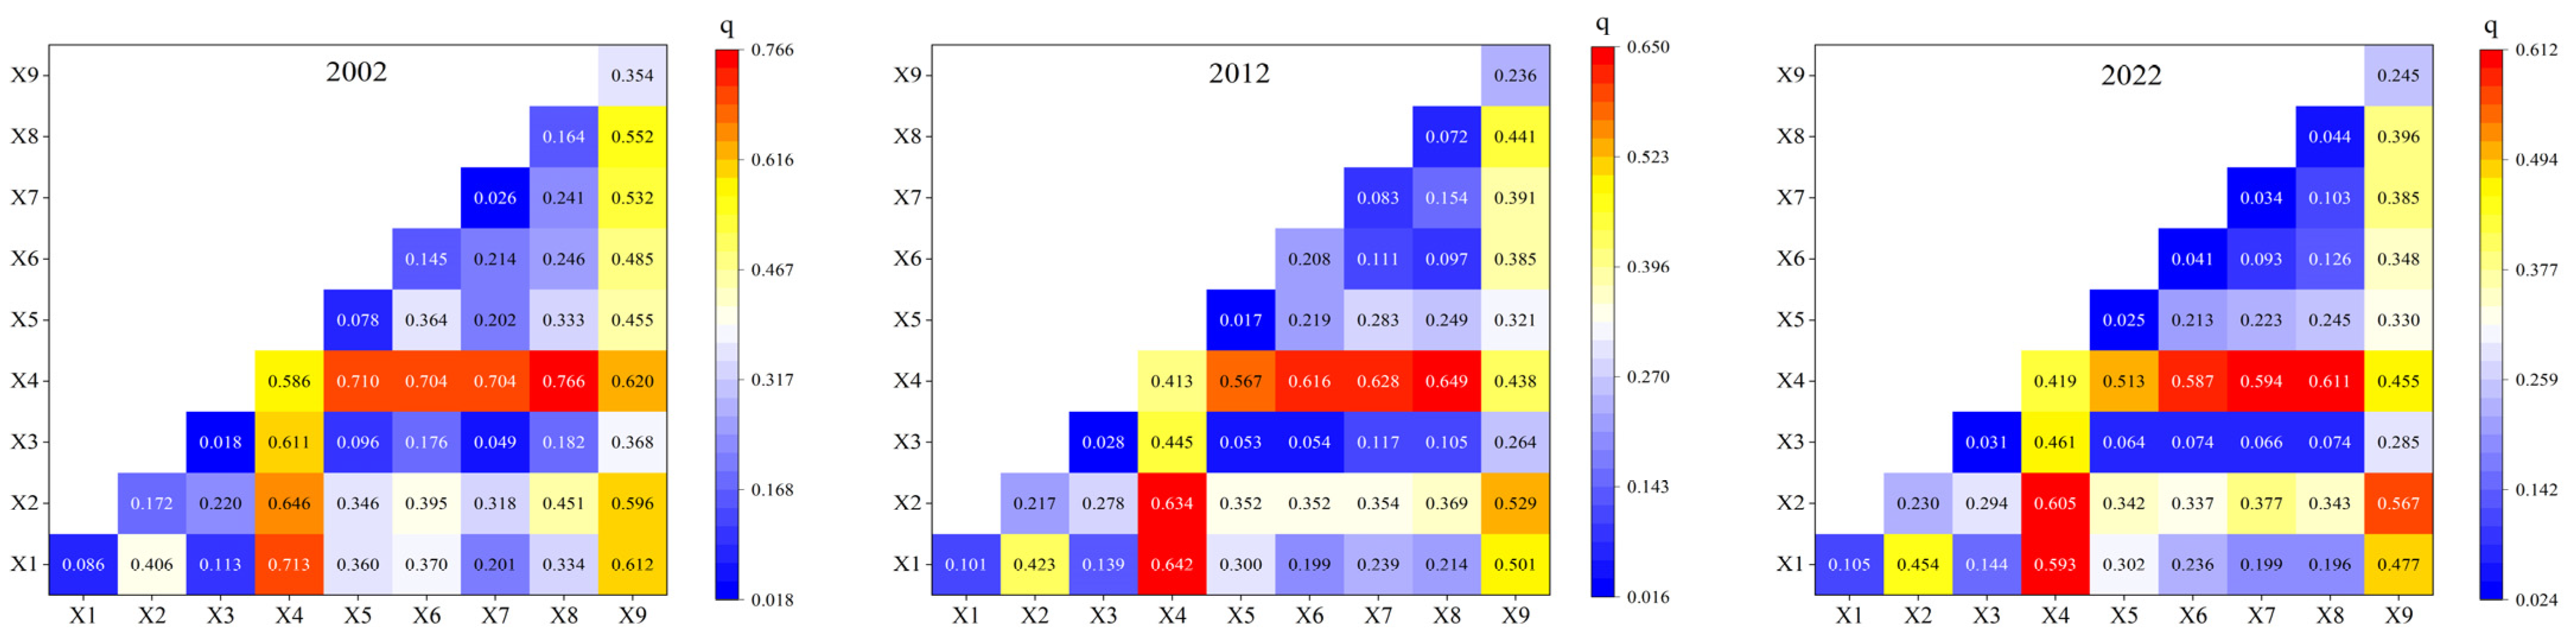
As shown in the interactive probe results (Figure 8), the interactive explanatory power (q-value) of any two driving factors for the spatial differentiation of ecological health in the black soil area of Northeast China during 2002–2022 is significantly greater than that of any single factor alone. This indicates that the interaction between factors is predominantly manifested as bivariate enhancement or nonlinear enhancement. Such a finding further reveals that the evolution of ecological health in the study area is not driven by the isolated impact of individual factors but rather results from the complex coupling effects among multiple factors.
Across all interaction pairs, the interaction terms involving precipitation (X4) consistently occupy an absolutely dominant position, presenting significant and sustained high-value areas (red/orange strips) in the heat map. Among these, “precipitation ∩ elevation (X4 ∩ X1)”, “precipitation ∩ slope (X4 ∩ X2)”, and “precipitation ∩ night light (X4 ∩ X8)” exhibit exceptionally high interaction explanatory power.
This result profoundly indicates that the natural coupling of the “climate–topography” background—such as the comprehensive hydrothermal configuration of precipitation combined with undulating terrain—constitutes the most core mechanism determining the spatial pattern of ecological health in the black soil area’s cultivated land ecosystem. Meanwhile, the superposition of climatic conditions and the intensity of human activities also exerts a strong synergistic impact on the local ecological environment.
Over the study period, the explanatory power of the dominant interaction factors exhibits a trend of overall high maintenance with slight local attenuation. Specifically, the highest interaction q-value has gradually declined from 0.766 in 2002 (precipitation ∩ night light) to 0.611 in 2022 (precipitation ∩ night light/precipitation ∩ slope), indicating that the absolute control of core driving factors over the ecological pattern has progressively weakened over time.
Furthermore, consistent with the single-factor detection results, the interactive explanatory power involving grazing intensity (X9) has undergone a significant overall decline over the past two decades, as reflected by widespread blue tones in the marginal areas of Figure 8’s 2022 panel. This trend further confirms the increasing marginalization of specific traditional agricultural and pastoral disturbance patterns as driving forces in the ecological evolution of the region.

4. Discussion

4.1. Evolution of Evaluation Indicators for the Health of Cultivated Land in the Northeast Black Soil Region

From the perspective of temporal evolution characteristics, the results of this study are both convergent with and significantly different from existing relevant research. Existing studies generally suggest that the overall health of the cultivated land system in the Northeast black soil region has been on a declining trend. For example, the research conducted by Tian et al. in a typical black soil region shows that the health level of the cultivated land system has continuously declined from 2003 to 2023, with the area of high-quality cultivated land reduced by about 30%, particularly with a significant decline in resilience, indicating that long-term land use pressure has weakened the ecological functions of the system; at the same time, the case study of Keshan County also found that the health threshold coefficient of the cultivated land system has continuously declined from 1986 to 2018, with a significant reduction in the proportion of high-quality cultivated land, and the overall health condition has continuously deteriorated [7,10]. However, this study finds that the health index of the cultivated land ecosystem in the Northeast black soil region (FEHI) has shown a general trend of continuous growth from 2002 to 2022.
The reasons for these discrepancies may lie, on the one hand, in the differences in evaluation frameworks and indicator systems. Previous studies have predominantly focused on ecological restoration capacity and threshold stability, operating under the assumption that long-term land use pressure has led to a decline in the ecological functions of the system. In contrast, the FEHI framework constructed in this study incorporates comprehensive productivity as a core dimension. On the other hand, the discrepancies may also stem from differences in the study area. Although the health threshold coefficient of the cultivated land system in Kexian County within the Northeast Black Soil Region has decreased, the overall health value of the cultivated land ecosystem across the broader Northeast Black Soil Region has continued to rise [7].

4.2. Spatial Evolution of Evaluation Indicators for the Health of Cultivated Land in the Northeast Black Soil Region

This study reveals that the spatial pattern of ecological health in the cultivated land ecosystem of the Northeast Black Soil Region follows a “high in the southeast and low in the northwest” distribution, which reflects, to some extent, the coupling characteristics between natural background conditions and agricultural productivity [11]. However, significant differences exist between this study and previous research based on ecosystem service value (ESV) with regard to both the distribution and the underlying causes of the “healthy high-value areas” [31].
Specifically, prior studies from the ESV perspective have predominantly emphasized the contributions of natural landscapes such as forests and water bodies, whereas the FEHI constructed in this study places greater emphasis on the synergy between agricultural utilization efficiency and system stability. This distinction explains why the high health value areas identified in this study are more concentrated in plains with strong agricultural productivity rather than being confined to traditional ecological protection zones. Furthermore, the east-high-west-low differentiation in ecological sustainability observed in intensive agricultural areas across central and western China corroborates the high risks of soil and water loss in the Songnen Plain and Liaohe Plain [32].

4.3. Analysis of Driving Factors for the Health Indicators of Cultivated Land in the Northeast Black Soil Region

The analysis of driving forces reveals that precipitation and elevation are the core factors shaping the spatial differentiation of ecological health in cultivated land ecosystems across the Northeast Black Soil Region, a finding that is generally consistent with existing research. For instance, Tian identified precipitation, relative humidity, and duration of sunshine as the dominant natural factors driving spatial variations in cultivated land system health [10]. Similarly, soil erosion research has demonstrated that climate conditions, topographic characteristics, and human activities collectively determine erosion patterns in the Northeast, with precipitation and topography serving as key contributors to soil and water loss [32]. Furthermore, studies on freeze–thaw erosion risk have indicated that slope is the primary factor influencing erosion risk, with its effect significantly exceeding that of other environmental variables [12]; this is consistent with the present study’s finding that the restrictive effect of slope on ecological health has intensified in recent years. In contrast to these prior studies, however, this research further reveals that the influence of traditional extensive human activities (such as grazing) is gradually weakening, whereas the interactions between human activities—represented by night lighting—and climatic and topographic factors are becoming increasingly pronounced, exhibiting clear two-factor enhancement and nonlinear amplification characteristics. Collectively, these findings suggest that the ecological health of cultivated land in the Northeast Black Soil Region has progressively shifted from being driven by a single natural force to a complex coupled process governed by the synergistic interplay of natural conditions and human activities.

5. Conclusions

(1)
From 2002 to 2022, cultivated land comprehensive productivity in the Northeast black soil region generally increased, with areas of lower comprehensive productivity in the central and western regions showing a transition toward medium- and higher-level comprehensive productivity. In contrast, landscape stability exhibited a declining trend, with fragmentation characteristics observed in some regions, while ecological sustainability remained at a relatively low level with a certain decreasing tendency.
(2)
The Farmland Ecosystem Health Index (FEHI) increased during the three study years, with the mean value increasing from 0.195 to 0.211. The spatial distribution of low-health areas decreased, whereas relatively higher-health areas expanded in some regions, indicating an overall upward change in the FEHI during the study period.
(3)
GeoDetector results showed that precipitation and elevation exhibited relatively higher explanatory power for the spatial differentiation of cultivated land ecosystem health, while the explanatory power of different factors varied among study years. Interaction detection further indicated that the spatial differentiation of cultivated land ecosystem health was jointly influenced by multiple environmental and human-related factors, with factor combinations generally showing stronger explanatory power than individual factors.
This study has several limitations. The constructed evaluation framework mainly considers productivity, landscape stability, and ecological sustainability, while some factors such as soil properties, agricultural management practices, and socio-economic conditions were not fully incorporated. In addition, the assessment was based on three representative years (2002, 2012, and 2022), which may limit the characterization of continuous temporal dynamics of cultivated land ecosystem health. Future studies could integrate more comprehensive indicators and continuous time-series data to further improve the understanding of the long-term evolution of cultivated land ecosystem health.

Author Contributions

Conceptualization, Y.Y. and G.Y.; methodology, Y.Y.; software, X.W.; validation, Y.Y., G.Y. and J.L.; formal analysis, Y.Y.; investigation, Y.Y.; resources, G.Y.; data curation, Y.Y.; writing—original draft preparation, Y.Y.; writing—review and editing, G.Y. and X.W.; visualization, Y.Y.; supervision, G.Y.; project administration, J.L.; funding acquisition, J.L. All authors have read and agreed to the published version of the manuscript.

Funding

This work was supported by the project from the Department of Science and Technology of Jilin Province (grant number 20240101040JC); the project from the National Key R&D Program of China (grant number 2022YFF1300900).

Institutional Review Board Statement

Not applicable.

Informed Consent Statement

Not applicable.

Data Availability Statement

All data are contained within the article.

Conflicts of Interest

The authors declare no conflicts of interest.

References

  1. Liu, B.; Zhang, G.; Xie, Y.; Shen, B.; Gu, Z.; Ding, Y. Scope and Delimitation of the Northeast China Black Soil Region and the Typical Black Soil Region in Northeast China. Chin. Sci. Bull. 2021, 66, 96–106. [Google Scholar]
  2. Zhang, N.; Du, G.; Zhang, R. A Theoretical Analysis of Black Soil Quality in the Context of Modern Agricultural Development. Resour. Sci. 2023, 45, 926–938. [Google Scholar] [CrossRef] [Scilit]
  3. Yao, D.; Cao, Y.; Cheng, J.; Lei, M.; Liao, Y.; Wang, L.; Zhao, J.; Kong, X. Spatiotemporal Evolution and Driving Factors of Black Soil within the Framework of the Earth’s Critical Zone. Resour. Sci. 2023, 45, 1856–1868. [Google Scholar] [CrossRef] [Scilit]
  4. Wang, H.; Yang, S.; Wang, Y.; Gu, Z.; Xiong, S.; Huang, X.; Sun, M.; Zhang, S.; Guo, L.; Cui, J.; et al. Rates and causes of black soil erosion in Northeast China. Catena 2022, 214, 106250. [Google Scholar] [CrossRef] [Scilit]
  5. Wang, S.; Xu, X.; Cao, W. Spatiotemporal Evolution of Soil Erosion in the Black Soil Region of Northeast China, 2000–2020. Resour. Sci. 2023, 45, 951–965. [Google Scholar]
  6. Zhao, H.B.; Zheng, H.; Miao, C.H.; Shao, T.T.; Feng, Y.B. Spatial-temporal pattern and factor diagnoses of agroecosystem health in major grain producing areas of Northeast China: A case study in Jilin Province. Ying Yong Sheng Tai Xue Bao=J. Appl. Ecol. 2016, 27, 3290–3298. [Google Scholar] [CrossRef] [PubMed]
  7. Su, H.; Wu, C. Diagnosis of Farmland System Health and Its Evolutionary Characteristics in the Northeast China Black Soil Region: A Case Study of Keshan County. Econ. Geogr. 2023, 43, 166–175. [Google Scholar] [CrossRef]
  8. Su, H.; Li, X.; Wu, C. Mechanisms of Factors Affecting the Health of Farmland Systems in the Northeast China Black Soil Region: A Case Study of Keshan County. Econ. Geogr. 2024, 44, 151–160. [Google Scholar] [CrossRef]
  9. Liu, Z.; Wang, M.; Liu, X.; Wang, F.; Li, X.; Wang, J.; Hou, G.; Zhao, S. Ecological Security Assessment and Warning of Cultivated Land Quality in the Black Soil Region of Northeast China. Land 2023, 12, 1005. [Google Scholar] [CrossRef] [Scilit]
  10. Tian, X.; Jiang, H.; Luo, N. Health Assessment and Driving Force Analysis of Cropland Systems in Typical Black Soil Region of Northeast China from 2003 to 2023. Chin. Geogr. Sci. 2025, 35, 564–580. [Google Scholar] [CrossRef] [Scilit]
  11. Feng, D.; Zhou, P.; Wang, D.; Shi, P. Reconstructing the ecological restoration pattern from the perspective of ecosystem health assessment in a typical black soil region of Northeast China. Front. Environ. Sci. 2023, 11, 1184517. [Google Scholar] [CrossRef] [Scilit]
  12. Zhai, Y.; Fang, H. Spatiotemporal variations of freeze-thaw erosion risk during 1991–2020 in the black soil region, northeastern China. Ecol. Indic. 2023, 148, 110149. [Google Scholar] [CrossRef] [Scilit]
  13. Ou, Y.; Rousseau, A.N.; Wang, L. Spatio-temporal patterns of soil organic carbon and pH in relation to environmental factors—A case study of the Black Soil Region of Northeastern China. Agric. Ecosyst. Environ. 2017, 245, 22–31. [Google Scholar] [CrossRef] [Scilit]
  14. Yang, J.; Huang, X. The 30 m annual land cover dataset and its dynamics in China from 1990 to 2019. Earth Syst. Sci. Data 2021, 13, 3907–3925. [Google Scholar] [CrossRef] [Scilit]
  15. Davis, S.J.; Qian, M.; Zeng, W. A Comprehensive GIS Database for China’s Surface Transport Network with Implications for Transport and Socioeconomics Research; National Bureau of Economic Research: Cambridge, MA, USA, 2025. [Google Scholar]
  16. Yan, J.; Wang, S.; Feng, J. The 30 m Annual Soil Water Erosion Dataset in Chinese Mainland from 1990 to 2022; Science Data Bank: Beijing, China, 2024. [Google Scholar]
  17. Wu, Y.; Shi, K.; Chen, Z.; Liu, S.; Chang, Z. An Improved Time-Series DMSP-OLS-Like Data (1992–2023) in China by Integrating DMSP-OLS and SNPP-VIIRS; Version 5; Harvard Dataverse: Cambridge, MA, USA, 2021. [Google Scholar] [CrossRef]
  18. Wang, D.; Peng, Q.; Li, X. A long-term high-resolution dataset of grasslands grazing intensity in China. Sci. Data 2024, 11, 1194. [Google Scholar] [CrossRef] [Scilit]
  19. Huang, Y.; Gan, X.; Feng, Y. A new framework for assessing ecosystem health with consideration of the sustainable supply of ecosystem services. Landsc. Ecol. 2024, 39, 37. [Google Scholar] [CrossRef] [Scilit]
  20. Sun, M.; Zhang, L.; Yang, R. Construction of an integrated framework for assessing ecological security and its application in Southwest China. Ecol. Indic. 2023, 148, 110074. [Google Scholar] [CrossRef] [Scilit]
  21. Zhou, X.; Liang, Y.; Li, X.; Chai, D. A Study on the Spatiotemporal Evolution of Arable Land System Health and Its Driving Factors: A Case Study of the Middle and Lower Reaches of the Yangtze River. J. Nat. Resour. 2024, 39, 1174–1192. [Google Scholar]
  22. Costanza, R.; Mageau, M. What is a healthy ecosystem? Aquat. Ecol. 1999, 33, 105–115. [Google Scholar] [CrossRef] [Scilit]
  23. Dai, L.; Li, S.; Lewis, B.J. The influence of land use change on the spatial–temporal variability of habitat quality between 1990 and 2010 in Northeast China. J. For. Res. 2019, 30, 2227–2236. [Google Scholar] [CrossRef] [Scilit]
  24. Wu, C.B.; Cui, Y.Y.; Zhen, J.L.; Huang, G.H. Spatio-Temporal Change of Habitat Quality in Northeast China: Driving Factors Exploration Based on Land Use and Land Cover Change. Land Degrad. Dev. 2025, 36, 3742–3755. [Google Scholar] [CrossRef] [Scilit]
  25. Wang, R.Q.; Li, H.; Shang, Y. Change of cultivated land area and effect on ecosystem service in black soil region in Northeast China: A case study of Lishu County, Jilin Province. Glob. Geol. 2023, 26, 251–263. [Google Scholar]
  26. Li, Y.; Duo, L.; Zhang, M. Habitat quality assessment of mining cities based on InVEST model—A case study of Yanshan County, Jiangxi Province. Int. J. Coal Sci. Technol. 2022, 9, 28. [Google Scholar] [CrossRef] [Scilit]
  27. Lyu, L.; Jiang, R.; Zheng, D. Impact of climate change and land use/cover change on water yield in the Liaohe River Basin, Northeast China. J. Arid Land 2025, 17, 182–199. [Google Scholar] [CrossRef] [Scilit]
  28. Wu, C.; Qiu, D.; Gao, P. Application of the InVEST model for assessing water yield and its response to precipitation and land use in the Weihe River Basin, China. J. Arid Land 2022, 14, 426–440. [Google Scholar] [CrossRef] [Scilit]
  29. Yang, X.; Chen, R.; Meadows, M.E.; Ji, G.; Xu, J. Modelling water yield with the InVEST model in a data scarce region of northwest China. Water Supply 2020, 20, 1035–1045. [Google Scholar] [CrossRef] [Scilit]
  30. Wang, J.; Xu, C. Geospatial Sensors: Principles and Prospects. Acta Geogr. Sin. 2017, 72, 116–134. [Google Scholar]
  31. Jiang, Y.; Du, G.; Teng, H.; Wang, J.; Li, H. Multi-Scenario Land Use Change Simulation and Spatial Response of Ecosystem Service Value in Black Soil Region of Northeast China. Land 2023, 12, 962. [Google Scholar] [CrossRef] [Scilit]
  32. Wang, S.; Xu, X.; Huang, L. Spatial and Temporal Variability of Soil Erosion in Northeast China from 2000 to 2020. Remote Sens. 2023, 15, 225. [Google Scholar] [CrossRef] [Scilit]
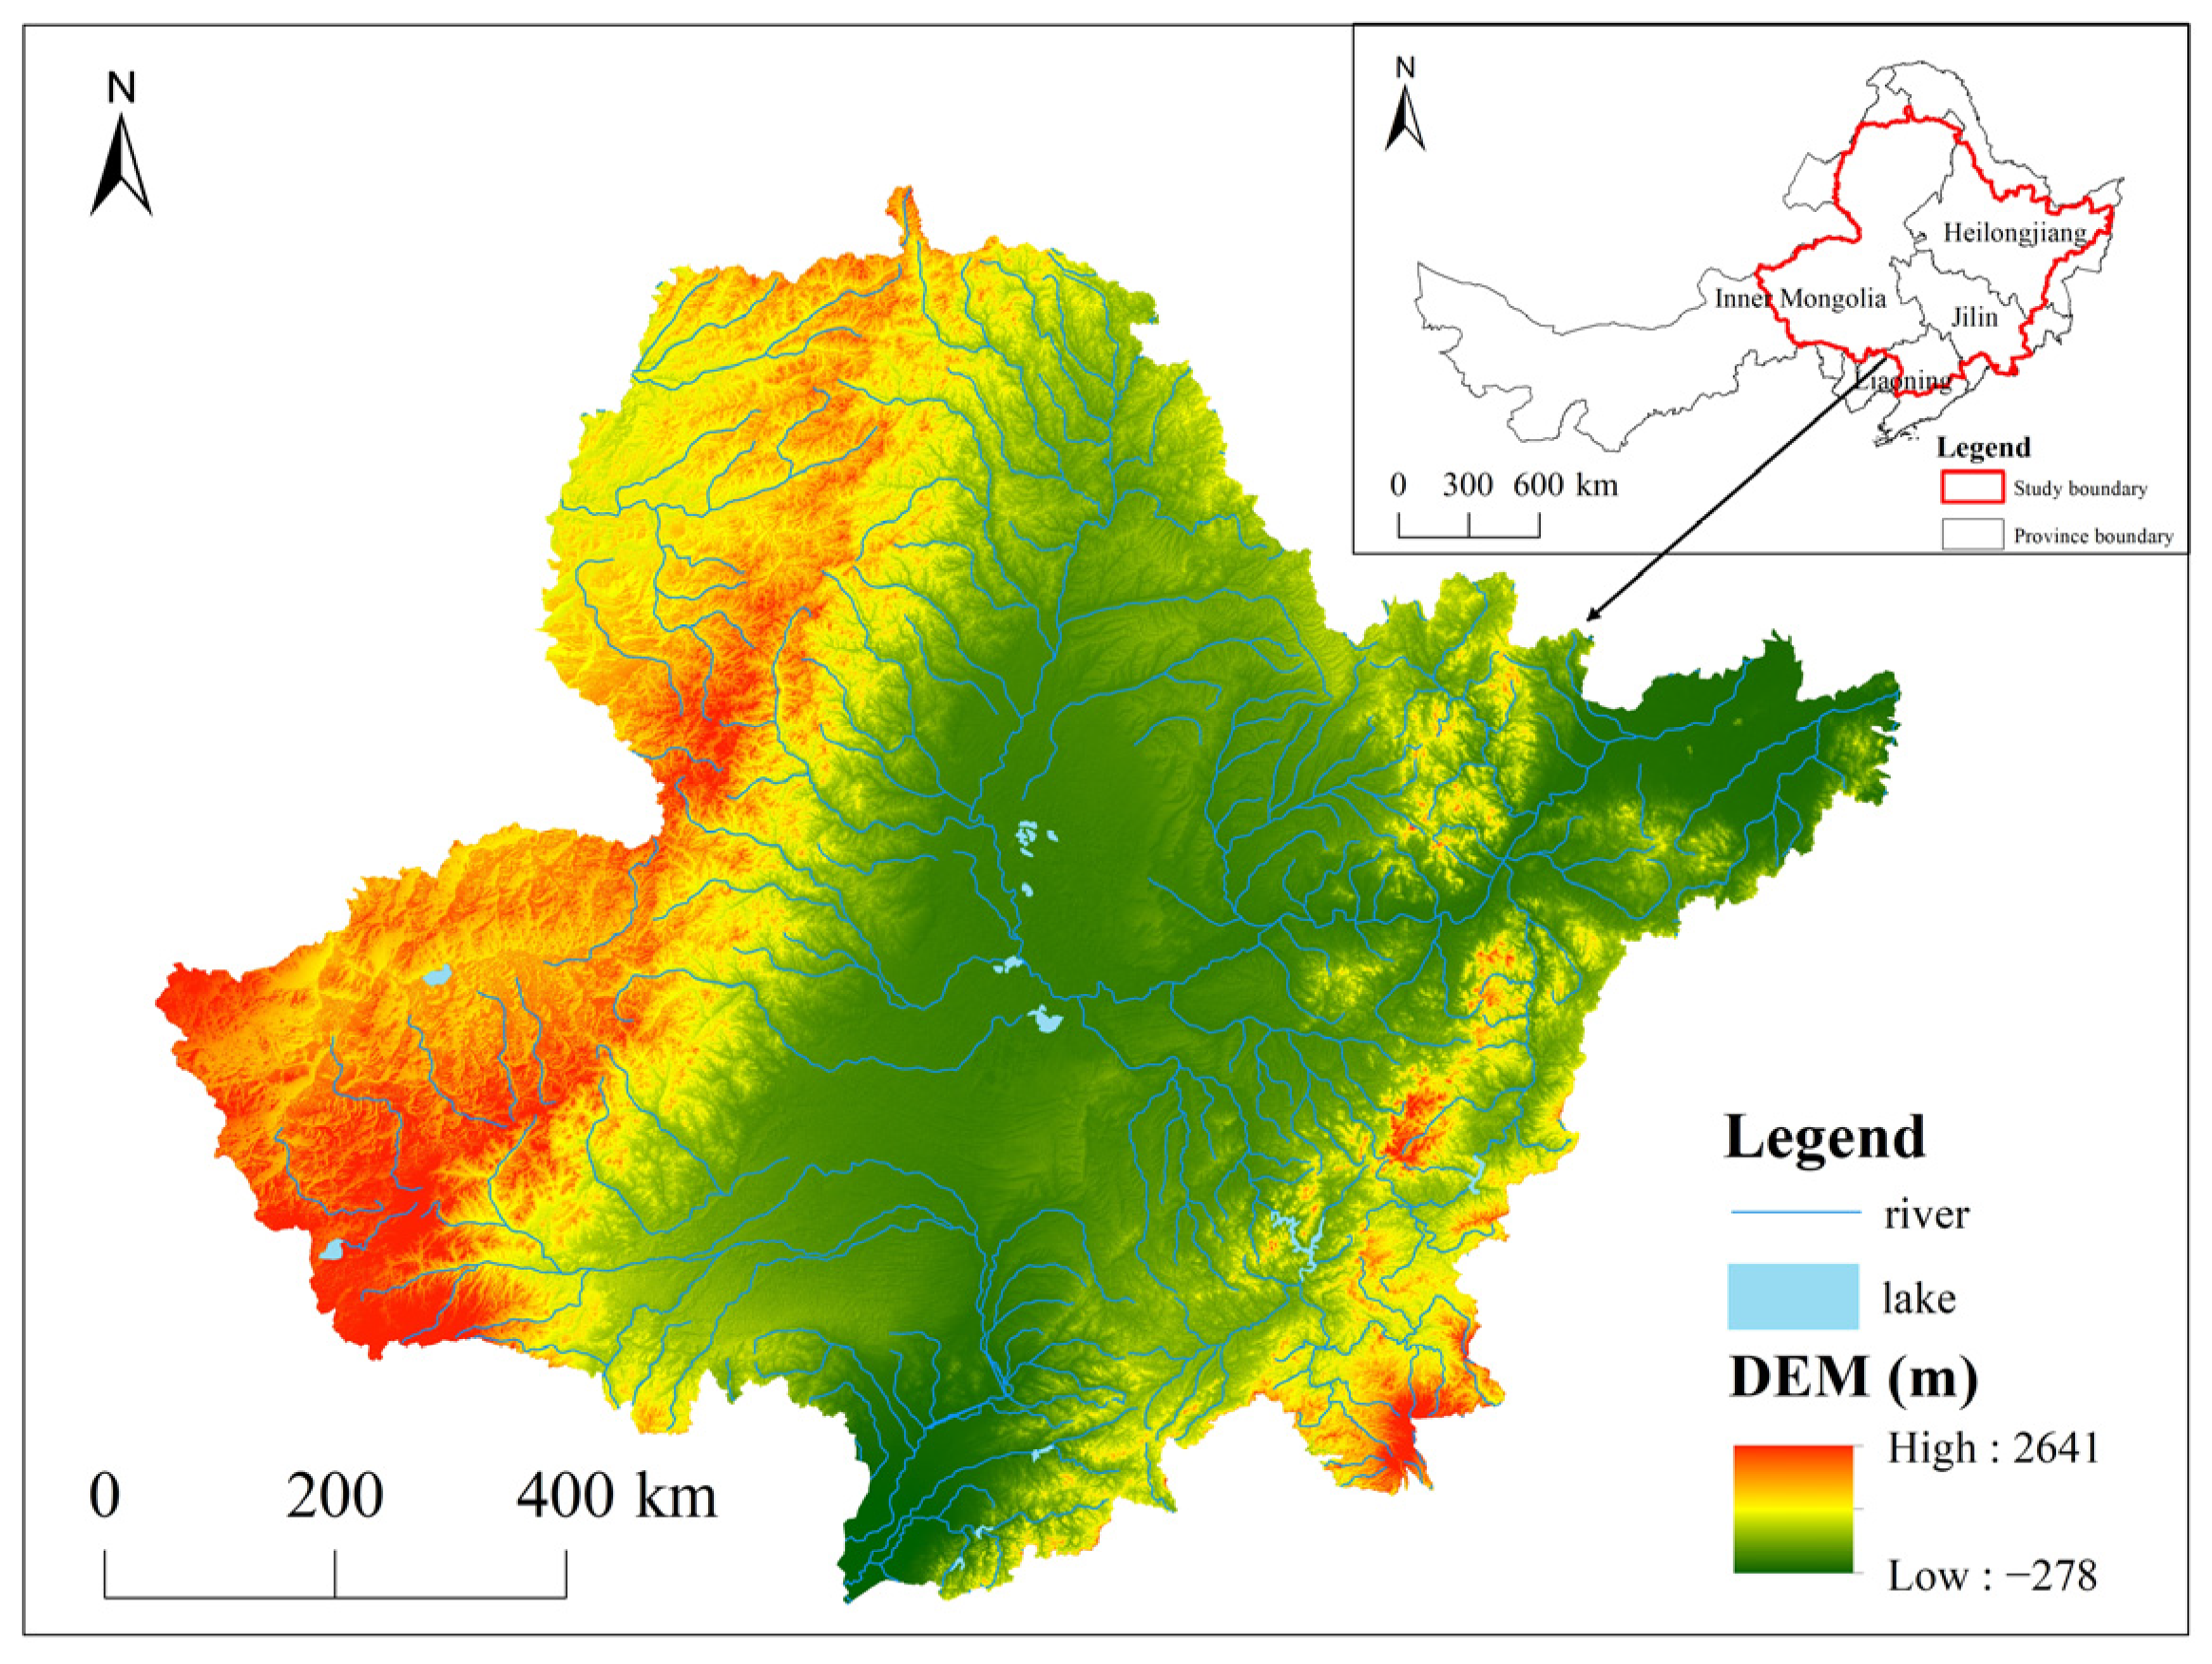
Figure 1. Location of the Northeast black soil region.
Sustainability 18 08874 g001
Figure 2. Spatial and temporal changes in arable land productivity in the Northeast Black Soil Region. The figure shows the characteristics of changes in different indicators from 2002 to 2022 (with an interval of 10 years): (a) enhanced vegetation index (EVI); (b) net primary productivity (NPP); (c) water use efficiency (WUE); (d) productivity index.
Sustainability 18 08874 g002
Figure 3. Spatial and temporal changes in the landscape stability of the Northeast black soil region cultivated land. The figure shows the characteristics of changes in different indicators from 2002 to 2022 (with an interval of 10 years): (a) LPI (LPI); (b) PD index (PD); (c) AI index (AI); (d) landscape stability index.
Sustainability 18 08874 g003
Figure 4. Spatial and temporal changes in the ecological sustainability of cultivated land in the Northeast Black Soil Region. The figure shows the characteristics of changes in different indicators from 2002 to 2022 (with an interval of 10 years): (a) habitat quality (HQ); (b) soil erosion (SE); (c) water yield (WY); (d) ecological sustainability index.
Sustainability 18 08874 g004
Figure 5. Average FEHI of cultivated land from 2002 to 2022.
Sustainability 18 08874 g005
Figure 6. Spatial distribution of ecological health of cultivated land ecosystems in the Northeast Black Soil Region.
Sustainability 18 08874 g006
Figure 7. Exploratory results of driving factor explanation power from 2002 to 2022.
Sustainability 18 08874 g007
Figure 8. 2002–2022 driving factor interaction detection results.
Sustainability 18 08874 g008
Table 1. Data sources for the driving force analysis using the geographical detector.
Driver Factor TypeParametersData Source
Topographical FactorsDEMGEE platform downloads SRTM data
GradeDerived from DEM data calculation
Slope Aspect
Climate FactorsAnnual PrecipitationNational Earth System Science Data Center
Annual Average TemperatureNational Qinghai–Tibet Plateau Science Data Center (https://data.tpdc.ac.cn/)
Social and Economic FactorsPopulation DensityWorldPop data (https://hub.worldpop.org)
Gross Domestic ProductNational Qinghai–Tibet Plateau Scientific Data Center (https://data.tpdc.ac.cn/)
Human Activity FactorsNight LightingNighttime lighting data comes from the paper titled “Improved Time Series DMSP-OLS Data for China from 1992 to 2019 by Integrating DMSP-OLS and SNPP-VIIRS Data” published by Wu in the journal IEEE Transactions on Geoscience and Remote Sensing [17].
PasturingFigshare platform [18]
Note: since WorldPop data are only available up to 2020, we use the 2020 population data in this study.
Table 2. Assessment index system for the health of agricultural ecosystem.
Target LayerRule LayerIndicator LayerIndex Attribute
Farmland Ecosystem Health Index (FEHI)Productivity Dimension Indicator (Pt)Enhanced Vegetation Index (EVI)+
Carbon Sequestration Total (NPP)+
Water Carbon Coupling Efficiency (WUE)+
Landscape Stability Dimension Index (St)Maximum Patch Index (LPI)+
Patches Density (PD)
Aggregation Index (AI)+
Ecological Sustainability Index (Et)Habitat Quality (HQ)+
Soil Erosion Intensity (SE)
Water Conservation Function (WY)+
Note: positive indicators are marked with “+” and the higher the value, the healthier they are; negative indicators are marked with “−” and the higher the value, the less healthy they are.
Table 3. Weights of indicators at each level.
Target LayerRule LayerRule Layer WeightIndicator LayerRelative Weight of Indicator Layer (Within Criterion Layer)Index Layer Combination Weight (for Total Target)
Farmland Ecosystem Health Index (FEHI)Productivity Dimension Indicator (Pt)0.55Enhanced Vegetation Index (EVI)0.540.30
Net Primary Productivity (NPP)0.300.16
Water Use Efficiency (WUE)0.160.09
Landscape Stability Dimension Index (St)0.21Maximum Patch Index (LPI)0.540.11
Patches Density (PD)0.300.06
Aggregation Index (AI)0.160.04
Ecological Sustainability Index (Et)0.24Habitat Quality (HQ)0.340.08
Soil Erosion Intensity (SE)0.380.09
Water Conservation Function (WY)0.280.07
Table 4. Data details for water use efficiency (WUE) calculation.
DataData SourceOriginal Spatial
Resolution
Original Temporal ResolutionFinal
Spatial Resolution
Final
Temporal Resolution
UnitCoordinate
System
Temporal ProcessingResampling Method
GPPMOD17A2HGF V6.1500 m8-day4.5 kmAnnualkg C/m2GCS_WGS_1984Annual GPP was obtained by summing the 8-day GPP data within each year using the SUM function on a pixel-by-pixel basisLinear Interpolation
ETMOD16A2GF500 m8-day4.5 kmAnnualkg/m2GCS_WGS_1984Annual ET was obtained by summing the 8-day ET data within each year using the SUM function on a pixel-by-pixel basisLinear Interpolation
Table 5. InVEST model habitat quality data sources and processing.
Model Required DataSourceProcessing Method
Land Use DataCLCDClipping, Projection, Resampling
Threat Table (csv)References [23,24,25,26]Table Format Conversion
Sensitivity Table (csv)
Half-Package and Constant0.5
Table 6. Data sources and processing for the InVEST water yield module.
Model Required DataSourceProcessing Method
Annual Precipitation Grid DataGEEClipping, Projection, Resampling
Annual Evapotranspiration DataGEE
Root Restriction Layer Depth1:1,000,000 million soil data
Plant Available WaterISRIC
Land Use DataCLCD
Study Area and Sub-Watershed DataDEM processing obtainedHydrological Analysis
Biophysical Parameter Table (csv)References [27,28,29]Table Format Conversion
Table 7. Factor interaction types and criteria.
Judgment BasisInteraction
q(X1 ∩ X2) < Min(q(X1), q(X2))Nonlinear Weak
Min(q(X1), q(X2)) < q(X1 ∩ X2)Single-Factor Nonlinear Weak
<Max(q(X1), q(X2))Dual Factor Enhancement
q(X1 ∩ X2) > Max(q(X1), q(X2))Independent
q(X1 ∩ X2) = q(X1) + q(X2)Nonlinear Enhancement
q(X1 ∩ X2) > q(X1) + q(X2)Interaction
Table 8. Driver factors and their discrete methods.
Factor CategoryDriver FactorsFactor NumberDiscretization MethodNumber of Categories
Topographical FactorsElevationX1Quantile Method5
GradeX2Quantile Method5
Slope AspectX3Quantile Method5
Climate FactorsPrecipitationX4Quantile Method5
Air TemperatureX5Quantile Method5
Social and Economic FactorsPopulationX6Quantile Method5
Gross Domestic ProductX7Quantile Method5
Human Activity FactorsNoctilucentX8Quantile Method5
PasturingX9Quantile Method5
Disclaimer/Publisher’s Note: The statements, opinions and data contained in all publications are solely those of the individual author(s) and contributor(s) and not of MDPI and/or the editor(s). MDPI and/or the editor(s) disclaim responsibility for any injury to people or property resulting from any ideas, methods, instructions or products referred to in the content.