Article

Establishing Measurement and Modeling Logic of Carbon Sequestration in Pocket Forests for Decentralized Climate Action

by
Negin B. Ficzkowski
*,
Renato S. L. Sant’Anna
and
Greg Zilberbrant
Beyond21 Academy, Hamilton, ON L9K 1L8, Canada
*
Author to whom correspondence should be addressed.
Sustainability 2026, 18(17), 8769; https://doi.org/10.3390/su18178769
Submission received: 30 June 2026 / Revised: 4 August 2026 / Accepted: 25 August 2026 / Published: 27 August 2026

Abstract

The article establishes a measurement and modeling framework to quantify carbon sequestration in pocket forests as part of a multi-year research program. Pocket forests are multi-layered native planting initiatives inspired by the Miyawaki method of afforestation, adapted for small-scale regenerative applications in urban and peri-urban contexts. In this study, a pocket forest is treated as a repeatable 10 m2 unit that can be distributed across small parcels and scaled through a network. The project examines how species composition and diversity affect above- and below-ground carbon storage under controlled field conditions. Twenty-one experimental plots were established with consistent soil preparation, planting density, plot geometry, and environmental exposure, while species diversity was varied from full capacity to reduced mixes and low-diversity reference conditions. The setup allows comparison of carbon-related performance across diversity levels and supports the development of a modeling framework linking proxy indicators and carbon sequestration potential. The initial phase focuses on system architecture, design criteria, baseline characterization, indicator selection, measurement integrity, sampling regime, and key parameter definition. Future phases will report temporal data and modeled outcomes to guide adaptive engineering of carbon-positive, self-sustaining landscapes.

1. Introduction

Nature-based solutions are increasingly recognized as necessary complements to deep emissions reductions because they can support climate mitigation, adaptation, biodiversity recovery, and human well-being. In Canada, national climate and biodiversity strategies identify ecosystem conservation, restoration, and improved land management as important pathways for reducing net greenhouse gas emissions, strengthening community resilience, and restoring ecological function in degraded landscapes [1,2]. Natural climate solutions in Canada have been estimated to provide mitigation equivalent to approximately one-quarter of the reductions required to reach Canada’s 2030 emissions target when implemented through protection, restoration, and improved management of forests, wetlands, grasslands, agricultural lands, and urban ecosystems [3,4]. However, the practical success of these interventions depends not only on increasing green cover but on designing, monitoring, and maintaining systems that can develop durable carbon stocks and broader ecosystem functions over time.
Urban and peri-urban landscapes represent an important frontier for this work. Although Canada is widely associated with extensive forests, nearly three in four Canadians live in large urban centres [5]. Despite being smaller carbon sinks than commercial or natural forest systems, urban forests are gaining more attention within climate research as they provide multiple co-benefits, including shade, cooling, stormwater regulation, habitat, air-quality improvement, and direct public access to nature in large urban centres where climate-change impacts such as extreme heat, flooding, air-quality stress, ecological fragmentation, and biodiversity decline are experienced directly [6,7]. In more populated provinces such as Ontario, these concerns are intensified by climate change, land-use pressure, and ecological fragmentation, with projected risks associated with heat, drought, precipitation extremes, pests, and forest disturbance [8,9]. These conditions create a need for compact, repeatable, and scientifically monitored natural climate solutions that can function within spatially constrained urban and peri-urban sites.
Pocket forests inspired by the Miyawaki afforestation method offer one such small-scale intervention model. In this study, a pocket forest is treated as a repeatable 10 m2 unit. This threshold is not proposed as a universal Miyawaki standard but as an operational unit for decentralized climate action that can be implemented on underused parcels of land large enough to support a forest-like structure. The Pocket Forest Network initiative extends this logic from isolated plantings to distributed implementation, where many small units across households, schools, institutions, community spaces, and other available lands can collectively support regional climate-action capacity.
The Miyawaki method is commonly associated with dense planting, high native species diversity, soil preparation, and the simultaneous establishment of multiple vegetation layers [10,11,12]. Its design logic is to shorten the time required for forest-like structure and function to emerge by working from the ecological memory and potential of place [10,11]. From a climate mitigation perspective, this approach is relevant as early development of forest structure supports a relatively steeper rate of carbon uptake as well as long-term storage [13].
Despite the promise, the empirical basis for Miyawaki-inspired forests remains underdeveloped. Many public claims associated with the method are repeated more often than they are tested. Recent evidence reviews indicate that only 41% of reviewed Miyawaki documents included quantitative assessments, and far fewer included controlled, replicated, or long-term experimental designs [14]. This is a critical gap for climate-oriented applications of the method, where carbon claims require transparent measurement across multiple carbon pools and time scales.
Carbon stocks in young planted systems are dynamic and complex. Early biomass accumulation, root development, soil disturbance, litter inputs, microbial activity, and mortality can all influence whether net carbon benefits emerge quickly, slowly, or unevenly across carbon pools. These uncertainties are amplified in northern urban and peri-urban contexts, where the growing season is shorter, winter stress is significant, freeze–thaw cycles affect soil structure and root establishment, and urban soils are often compacted, disturbed, or biologically depleted.
A related challenge concerns planting strategy. The Miyawaki method is commonly associated with high species diversity and dense planting, yet few studies isolate the effect of species diversity from other design variables such as soil preparation, planting density, maintenance, site condition, and initial seedling size. More broadly, carbon outcomes in planted forests are influenced by species composition and functional traits, and mixed-species plantings can differ from monocultures in above-ground productivity, below-ground allocation, litter quality, soil organic carbon formation, and resilience to disturbance [15,16].
The present study responds to these gaps through an engineering design lens, in which the pocket forest is treated as a configurable ecological system. The framework defines a standardized implementation unit, deliberately varies species richness and assemblage structure, and establishes a monitoring architecture through which ecological and carbon-related performance can be tested and optimized over time. The work is situated within the Pocket Forest Network initiative and is designed to generate comparable data across plot typologies with consistent carbon-focused monitoring procedures. The 10 m2 implementation unit is proposed as a deliberately constrained, repeatable, and scalable unit for testing decentralized climate action across spatially limited urban and peri-urban sites.
The present article reports the design, establishment, and baseline phase of a multi-year longitudinal experiment with an intentional methodological emphasis. Given the limited and fragmented evidence base for carbon assessment in Miyawaki-inspired pocket forests, a focused synthesis of ecological principles, measurement constraints, and reporting protocols is necessary to establish the basis for a credible monitoring framework. The purpose of the present article is therefore to define a comprehensive set of design criteria, experimental architecture, baseline conditions, measurement structure, key monitoring indicators, sampling regime, modeling logic, and uncertainty structure required for rigorous empirical evaluation of carbon outcomes. The paper does not present a finalized carbon outcome assessment. Rather, it uses early field observations to propose a monitoring framework better suited to dense, early-stage, multi-species pocket forests. The framework supports repeatable estimation of early-stage carbon stocks and future comparison of sequestration trajectories. It also provides the basis for modeling relationships among species mix, survival, growth, proxy indicators, cost, and carbon performance. In doing so, the article contributes a practical foundation for evaluating pocket forests as engineered natural climate solutions for decentralized climate action in urban and peri-urban landscapes.

2. Background

2.1. Miyawaki Method as a Function-Driven Regenerative Approach

The Miyawaki method is an ecological engineering approach to reconstructing native, multi-layered forest communities in compressed time and space [11]. The core logic of Miyawaki is to bypass or compress early successional stages by mimicking a multi-stratal system early in development, then allow competition, facilitation, canopy closure, litter cycling, and natural selection to drive the system toward a self-organizing forest structure [11]. The design intent is to accelerate forest-function development so that living relationships, ecological processes, and ecosystem services (including carbon sequestration) can begin emerging earlier than they would under passive or conventional successional timelines.
In practice, the method usually involves (a) surveying actual and potential natural vegetation (PNV) through field investigation, remnant forests, soil profiles, topography, and land-use history (b) selecting locally appropriate native species from that ecological community and arranging them in structural categories with companion species, (c) preparing degraded soil, often by loosening/decompacting and adding organic matter or compost to restore topsoil function, (d) planting young, often potted seedlings with developed root systems densely and in mixed arrangements, (e) mulching to reduce evaporation, erosion, weeds, and temperature stress, and (f) maintaining for the first 2 to 3 years, mainly watering and weeding, after which the planting is expected to become largely self-sustaining if the design and site conditions are appropriate [17].
The method’s intellectual foundation comes from vegetation ecology and phytosociology, especially the concept of PNV developed by Reinhold Tüxen. Miyawaki translated this ecological mapping tradition into a practical restoration method [11,12,17]. Historically, the method emerged in response to three pressures: (1) Postwar and high-growth industrialization in Japan, where cities, factories, highways, ports, and reclaimed lands required rapid environmental buffering, (2) The limits of conventional planting, especially monocultures, ornamental plantings, and exotic timber plantations, which Miyawaki criticized as maintenance-heavy and ecologically weak, (3) The cultural memory of native shrine/temple forests, which Miyawaki treated as living remnants of local native forest structure and species composition [11,12].

2.2. Pocket Forest as Purpose-Driven Adaptation of the Miyawaki Logic

Literature documents successful implementation of the Miyawaki method across Japan, Malaysia, Thailand, Brazil, and Chile [11,12,17]. Later interpretations within Mediterranean contexts extend the application to environmental conditions beyond those associated with tropical rainforests [10]. In urban “Tiny Forest” adaptation, especially in Europe and the UK, the method is combined with citizen science, education, and community stewardship [18]. The method is repeatedly linked to soil stabilization, erosion control, water retention, flood moderation, thermal comfort, and degraded-site recovery [11,18,19]. Economic feasibility and high initial investment are cited repeatedly as major barriers, especially for large-scale use or resource-constrained contexts. Reported Miyawaki planting densities in the peer-reviewed literature generally range from approximately 2 to 5 saplings per m2, with several recent urban Miyawaki carbon studies using 3 saplings per m2. The number of species is even less standardized across literature.
Within Canadian practice-oriented literature, densely planted, native, multi-layered urban or suburban plantings based on the Miyawaki method are often referred to as mini forests, microforests, or tiny forests with approximately 100 m2 land size [20]. For the present study, the original Miyawaki logic is adapted into the concept of a pocket forest as the smallest feasible scale for a multi-layered ecological system capable of initiating forest-like functions for rapid climate action within urban and peri-urban areas. This adaptation requires careful interpretation with respect to climatic and ecological contexts. Pocket forests are also distinct ecosystems compared to larger scale forests due to their size and may behave closer to an edge ecosystem. As such, the term “Pocket Forest” is used deliberately in this context to acknowledge the limitations of the intervention while retaining the ecological ambition of the original Miyawaki method.
The main climate argument is that multi-stratal native forests have far greater green surface area than lawns and therefore greater potential for carbon fixation [12]. While the empirical climate evidence is still uneven, some studies report total carbon storage of 156.53 t C ha−1, with most carbon in soil, followed by above-ground and below-ground biomass [21]. Recent studies have also argued that forest carbon responses to diversity may be nonlinear and may reflect interactions among niche complementarity, selection effects, structural development, and competition [22].

2.3. Empirical Characterization of Pocket Forests for Carbon Assessment

Standard forest carbon accounting recognizes five principal carbon pools: above-ground biomass, below-ground biomass, dead wood, litter, and soil organic matter [23]. In a pocket forest, all five are relevant, but their relative importance changes over time. Carbon measurement in pocket forests must account for the fact that early-stage planted systems are dynamic and structurally different from mature forests [16,24].

2.3.1. Conventional Biomass Calculation and Its Limitations for Pocket Forest Application

For young trees established in restoration plantations in Ontario, conventional diameter at breast height (DBH) measurements are often unsuitable because many individuals have not yet reached breast height (approximately 1.3 m) or possess stems too small for accurate DBH measurements. Consequently, biomass estimation for young trees commonly relies on root collar diameter (RCD), basal diameter (BD), total height (H), or combinations of these variables. These measurements exhibit strong allometric relationships with biomass during the early stages of tree development and generally provide greater prediction accuracy than DBH alone for small individuals [25]. Aboveground carbon stock is subsequently estimated by multiplying dry biomass by an appropriate carbon fraction, commonly between 0.48 and 0.50 for temperate and boreal tree species [26].
Forests in southern and central Ontario contain species with contrasting growth forms and wood densities, including conifers and deciduous species. Because biomass allocation differs among species, the use of Canadian species-specific equations substantially reduces estimation error compared with generalized allometric models [27]. However, pocket forests commonly include a larger and more structurally diverse species assemblage than is represented in available species-specific equations, creating a mismatch between field conditions and existing allometric databases.
For shrub species, biomass estimation requires additional consideration because these species frequently develop multiple stems from a common root system. In such cases, biomass is typically estimated using basal stem diameter or equivalent diameter calculated from all stems, often combined with plant height or crown dimensions. Incorporating crown measurements has been shown to improve biomass prediction for multi-stemmed shrubs compared with diameter-only models [25,28].
Below-ground carbon is equally important because the pocket forest climate relevance depends on rapid development of root systems, rhizosphere activity, and plant–soil interaction. The IPCC 2019 refinement notes that much forest soil organic matter is concentrated in upper horizons, with roughly half of soil organic carbon often in the upper 30 cm, while deeper-rooting systems can contribute below that depth [26]. However, below-ground biomass (BGB) is often estimated indirectly through root-to-shoot ratios, species-specific equations where available, or adjusted allometric models. A 2025 study, for example, estimated BGB in Miyawaki forest stands by applying a root-to-shoot ratio to AGB [29], while another conducted in 2022 estimated root biomass using allometric equations and measured carbon fractions separately for root tissue [21]. These approaches are useful, but they also show why a pocket forest carbon framework cannot depend on AGB alone. If AGB is uncertain because stems are juvenile, multi-stemmed, highly variable, or poorly matched to available equations, then any BGB estimate derived from AGB compounds that uncertainty. In other words, BGB cannot be treated as an independent or accurate carbon pool if it is mathematically dependent on an uncertain above-ground estimate.
The relationship between AGB, BGB, and soil carbon is also not fixed. Dense planting makes these relationships especially dynamic because rapid growth, root competition, and self-thinning can occur simultaneously [10,11,29]. Without baseline sampling and repeated monitoring, soil carbon cannot be attributed confidently to the pocket forest intervention. At the same time, direct measurement of BGB is often resource-intensive and may be impractical for repeated monitoring across distributed pocket forest sites. Therefore, a pocket forest carbon framework is required to combine accessible proxy indicators with periodic calibration.

2.3.2. The Role of Soil Properties in Below-Ground Carbon Stocks

Below-ground carbon storage is mediated by species identity, plant age, soil texture, soil moisture, compaction, nutrient availability, root turnover, mycorrhizal activity, planting density, mortality, and management history. Soil physical properties critically influence the carbon storage capacity of pocket forests by affecting the protection, stabilization, and turnover of organic carbon within the soil matrix.
  • Soil texture plays a key role. Soils with higher clay and silt content tend to have greater carbon storage because fine particles bind organic matter more effectively, protecting it from microbial decomposition and physical disturbance. For example, clay minerals can form mineral-associated organic matter complexes, which are more persistent and stabilize soil carbon longer term [30,31].
  • Soil bulk density and porosity affect root growth, microbial habitat, and gas and water exchange. Lower bulk density and greater porosity generally support better root biomass development and microbial activity, enhancing organic carbon inputs and soil carbon cycling. Conversely, compacted soils restrict root penetration and reduce oxygen availability, limiting carbon input and decomposition dynamics [32,33,34].
  • Soil moisture retention influenced by texture and structure is also vital because it regulates microbial activity and organic matter decomposition rates. Moist soils support microbial processes that decompose organic matter and facilitate root growth, but excessive saturation can create anaerobic conditions, slowing decomposition and promoting carbon preservation [30,32,33].
  • Soil pH and nutrient availability, which are influenced by soil physical and chemical properties, indirectly regulate soil organic carbon storage by shaping microbial community composition, nutrient cycling, and forest productivity. These factors influence both the decomposition of organic matter and the carbon inputs [35,36].
  • Soil physical disturbance such as tillage or compaction from urbanization reduces carbon stocks by breaking soil aggregates, exposing stabilized organic carbon to decomposition. As such, maintaining intact soil structure in pocket forests is essential for long-term carbon storage. That said, not tilling translates to the need for higher physical labour which may be viewed as a barrier to overcome within the broader model [37,38].
  • Microbial processes are a necessary part of pocket forest carbon assessment because soil carbon performance depends not only on how much organic matter enters the soil, but also on how microbial communities decompose, transform, respire, and stabilize that carbon. The soil microbiome helps determine whether plant-fixed carbon is lost through respiration, retained in microbial biomass, converted into microbial necromass, or stabilized in longer-lived soil organic carbon pools [39,40].
Recent early-stage microforest research has combined soil physical, chemical, and biological indicators and found that improvements in porosity and total carbon may emerge before some microbial responses become statistically detectable [41]. This suggests monitoring soil recovery as a time-dependent process rather than assuming that all carbon-related indicators respond simultaneously.

2.3.3. Studying Below-Ground Carbon Stocks

An important below-ground characterization technique is to divide the soil depth into depth increments, which will account for the changes in texture, density and concentration of nutrients and minerals in soil when calculating carbon stocks [42].
In northern forests, roots are generally restricted to the upper soil layers, with most roots occurring within the first 30 to 50 cm of the soil profile [43]. Evidence suggests that deeper fine roots may be less involved in soil mineral nutrient acquisition and carbon cycling than shallower fine roots, but of greater importance for water capture [44].
Forest rooting depth is strongly influenced by site characteristics, including soil texture, drainage conditions, water table depth, and the presence of restrictive layers such as compact subsoil horizons. Fine-textured soils with high clay content often exhibit lower aeration, reduced hydraulic conductivity, and greater mechanical resistance, which can limit root penetration and promote a greater concentration of fine roots in the upper mineral soil, particularly under poorly drained conditions [45,46,47]. Likewise, restrictive subsurface layers reduce the volume of soil available for root exploration, constraining rooting depth and influencing tree access to water and nutrients [46].
Accounting for the vertical variability of soil organic carbon (SOC) is essential when assessing soil carbon stocks, as both SOC concentration and stability change substantially with soil depth and horizon characteristics. The vertical distribution is primarily characterized by a progressive decrease in concentration as soil depth increases [48,49]. A substantial portion of global SOC is concentrated within the top 40 cm, with the highest concentrations usually occurring between 0 and 20 cm [30]. On average, 39% to 70% of the total SOC in the upper 100 cm of mineral soil is held within the first 30 cm [50].
While concentrations are lower at depth, subsurface soils (below 30 cm) are reported to store approximately 55% of the SOC found in the total 1 m profile because of the greater total mass of soil at those depths [51]. Additionally, carbon stored in deeper layers is often in more stable forms [50]. Table 1 shows the global estimates of soil organic carbon content in the first 3 m, based on 2721 soil profiles, from different regions and biomes. When considering SOC profiles by biome, relative to the first meter, temperate deciduous forest and temperate evergreen forest store 31% and 41% of SOC, respectively, in the second and third meter combined [52].
Equally important as understanding the natural processes of carbon turnover and storage is to report the results according to established protocols. In carbon credit accounting methodologies, Sampling to 30 cm is a mandatory standard to comply with IPCC recommendations for reporting soil organic carbon stock changes, with deeper increments suggested for increased accuracy and compliance with international standards [53]. Food and Agriculture Organization of The United Nations, 2020 also recommends SOC sampling in agricultural soils in intervals of 0–10 cm and 10–30 cm [53], and one of the most relevant independent agencies of carbon MRV, VERRA, in its VM0042 methodology (2025) recommends sampling to 50 cm depth where possible, using two increments (0–30 cm and 30–50 cm) to ensure sub-soil layers are sufficient for adjustments [54]. The WWF Canada guide notes that stock measurements are typically expressed at 30 cm, 50 cm, 1 m, or 2 m depths [55]. The cited protocols are consistent in mentioning that dividing samples into increments is necessary to account for different bulk densities and textures across soil horizons. In agricultural soils, this depth is also monitored due to tilling practices, reportedly a major factor of disturbance that can lead to depletion of carbon stocks [38].
Local aspects such as water table, bedrock depth, local soil characteristics and associated costs are essential for consistent sampling, data analysis and reporting. The literature and site-specific factors were considered to select the most appropriate vertical segmentation, as described in the Section 3.

2.4. Research Objectives

The objective of this study is to establish a baseline measurement and modeling framework for evaluating the carbon profile of Miyawaki-inspired pocket forests in a cold-temperate Canadian context. While species diversity is a key experimental variable, the broader purpose is to identify measurable indicators and relationships that can support reliable carbon monitoring over time. This is particularly important because direct soil carbon measurement can be costly, labour-intensive, and disruptive when repeated frequently or at depth.
The study therefore uses controlled diversity treatments to examine how species composition, survival, growth, canopy development, litter formation, soil conditions, and carbon pools relate to one another. By drawing relationships among these indicators, the framework aims to identify practical proxies that can reduce reliance on repeated deep soil sampling while still supporting credible carbon-performance assessment.
The central research question for this phase is: What baseline characterization, monitoring structure, and candidate proxy indicators are required to evaluate early-stage carbon performance in Miyawaki-inspired pocket forests, and how can species-diversity treatments be structured to test those relationships over time?

3. Materials and Methods

3.1. Geographical and Historical Characterization

The research is conducted primarily within the area of the living laboratory located 15 km south of Hamilton, Ontario, Canada. This rural parcel is historically a farm field where corn was cultivated up to a season prior to the start of the research. The topography of the area has moderate elevation variations (up to 7 m), without water bodies, and is surrounded by small forest fragments, agricultural fields and a private park.
The area is located within the Mixedwood Plains Ecozone according to the Ecological Framework of Canada [56]. The climate is classified as Humid Continental—Cool summer, no dry season (Dfa) [57], characterized by cool winters regulated by surrounding water bodies—most significantly, Lake Ontario 17 km north and Lake Erie 32 km south—and mean temperatures in January ranging from −3 °C to −12 °C. Summers are relatively warm with daily means around 18 °C to 22 °C in July [56]. The annual precipitation historical mean (1976–2005) is 844 mm [58].

3.2. Research Plot Setup

For experimental standardization and replication, a square-shaped 10 m2 plot, approximately 3.2 m × 3.2 m, was adopted as the study unit. Published and practice-oriented applications of the Miyawaki method vary considerably in area, and no universally accepted minimum plot size or number of species has been established. The 10 m2 area was therefore selected as a deliberately small operational unit for this application, as it can accommodate multiple planting rows, overlapping root zones, a high initial density, and representation of several vegetation layers within a spatially constrained area. These features allow the plot to function as more than a linear hedge or ornamental planting. Nevertheless, the unit is expected to remain strongly influenced by edge effects and is not assumed to reproduce the internal microclimate or spatial complexity of a larger forest stand. The sufficiency of the operational unit size proposed in this study for initiating persistent forest-like structure under cold-temperate conditions is therefore treated as a testable proposition of the longitudinal study rather than as a universally established minimum standard.
Each planted plot contains 30 plants, corresponding to an initial density of three (3) saplings per square metre, consistent with planting densities commonly reported for Miyawaki-inspired systems. Total planting density was held constant across all planted treatments, while species richness and tree-layer composition were varied. Because no universally recommended number of species exists for a 10 m2 Miyawaki-inspired planting, the treatment configuration was designed to provide systematic comparisons among the reference-richness, reduced-richness, and single-tree-species treatments.
The experimental block consists of 21 research plots. Group A comprises plots 1–3, each containing 30 plants representing 30 species. Group B comprises plots 4–6, each containing 30 plants representing 23 species. Group C comprises plots 7–9, each containing 30 plants representing 15 species. Group D comprises plots 10–18 and represents the single-tree-species treatment, referred to operationally in this study as the “Miyawaki monoculture” treatment. These plots contain one tree species together with approximately 17 shrub and perennial species. Plots 10–12 contain basswood, plots 13–15 contain sugar maple, and plots 16–18 contain bur oak. Plots 19–21 are unplanted controls. These plots received the same site preparation and maintenance regime as the planted plots but contain no intentionally planted vegetation. The unplanted controls are necessary to distinguish vegetation-associated changes from changes caused by soil preparation, compost, watering, mulching, maintenance, seasonal variation, and natural regeneration. The outlined experiment design isolates species richness and assemblage structure while holding plot area, planting density, soil preparation, compost application, mulch, watering, maintenance, and general environmental exposure as consistent as practicable. The plot, rather than the individual plant, is the experimental unit because plants within each dense planting share soil conditions, overlapping root zones, canopy space, litter inputs, and competitive or facilitative interactions.
Approximately 1 to 3 m of spacing was maintained between plots to provide access for sampling, monitoring, and maintenance activities. Figure 1 illustrates the research plot setup.
In this study, functional diversity is applied as an engineering design principle. Species are selected according to the ecological functions they are expected to perform within the pocket forest system, including but not limited to soil protection, litter production, habitat support, shade creation, and resilience to disturbance. Functional redundancy is incorporated by including, where possible, at least three species capable of contributing to a comparable ecological function. The diversity treatments therefore vary the number of species available to perform and reinforce these functions, while maintaining the broader design principles of forests. Functional diversity is not presented here as a formally calculated trait-based index, but as a design logic to be tested through future empirical monitoring.
Species selection was guided by the concept of potential natural vegetation rather than by native status alone. Accordingly, the assemblages were designed to represent complementary structural and successional roles associated with the local ecological context including tree, shrub, perennial and ground covering layers, while also accounting for practical plant availability. The experimental treatments vary species richness and assemblage composition while maintaining a consistent planting density and general multi-layered design logic. The framework is intentionally function-based rather than taxonomically prescriptive, because suitable species will vary by region, site conditions, and plant availability. Accordingly, replication should focus on maintaining comparable ecological roles and structural functions rather than reproducing an identical species list.
No mechanical tilling or broad-area soil disturbance was applied before planting. Because the site soil was highly compacted and difficult to penetrate with a shovel, individual planting holes were created manually using an auger. The soil removed from each hole was broken apart by hand during planting.
Approximately 200 L compost material sourced from local donors and distributers was applied to each 10 m2 plot (equivalent to 20 L/m2). The compost was placed at the soil surface and became incorporated locally into the planting zone during augering and manual backfilling.
Planting stock was supplied primarily as bare-root or lightly planted plugs in large nursery trays sourced from wholesale nurseries in Pontypool, ON, Canada and Hamilton, ON, Canada. In some cases, tree roots were enclosed in biodegradable nursery material that had become entangled with the root system and could not be removed without damaging the roots; this material was therefore left in place during planting.
Following installation, the plots were watered using well water and covered with approximately 2.5 cm (1 inch) of natural cedar mulch. Similar grade mulch was consistently topped up during the first two months after planting, with particular attention to plot edges to reduce weed encroachment and wind-borne seed entry. Plants that died during the initial establishment period (less than 5%) were replaced within the first planting season as part of the mortality replacement strategy to maintain the intended planting density and treatment composition. Replacements were recorded as part of the plot-establishment documentation.
The control plots received the same soil-preparation, compost, watering, mulching, and maintenance regime as the planted plots but contained no intentionally planted vegetation. The compost application rate was not standardized volumetrically during this establishment phase and is therefore reported as a procedural limitation.

3.3. Characterizing Forest Bed

For this study, the primary carbon-related indicators for below-ground biomass estimation are soil organic carbon concentration and soil bulk density, necessary to calculate carbon-per-unit-area. A baseline soil analysis was performed in October 2025, and continuous below-ground sampling will be conducted in the following years. Baseline characterization is treated as a primary scientific requirement because soil organic carbon, bulk density, texture, compaction, moisture conditions, and vertical variation influence both future carbon-storage capacity and the interpretation of observed change.
The number of sampling points and individual samples collected is, therefore, directly proportional to the size of the area of the research block, number of plots implemented, characteristics of the area, as well as number of depth increments.
As described earlier, it is essential for an accurate soil characterization to consider physical aspects and vertical distribution of parameters’ concentrations. Based on those considerations, we investigated primary and secondary data to determine the ideal vertical segmentation for this study that will be applied to all sampling points.
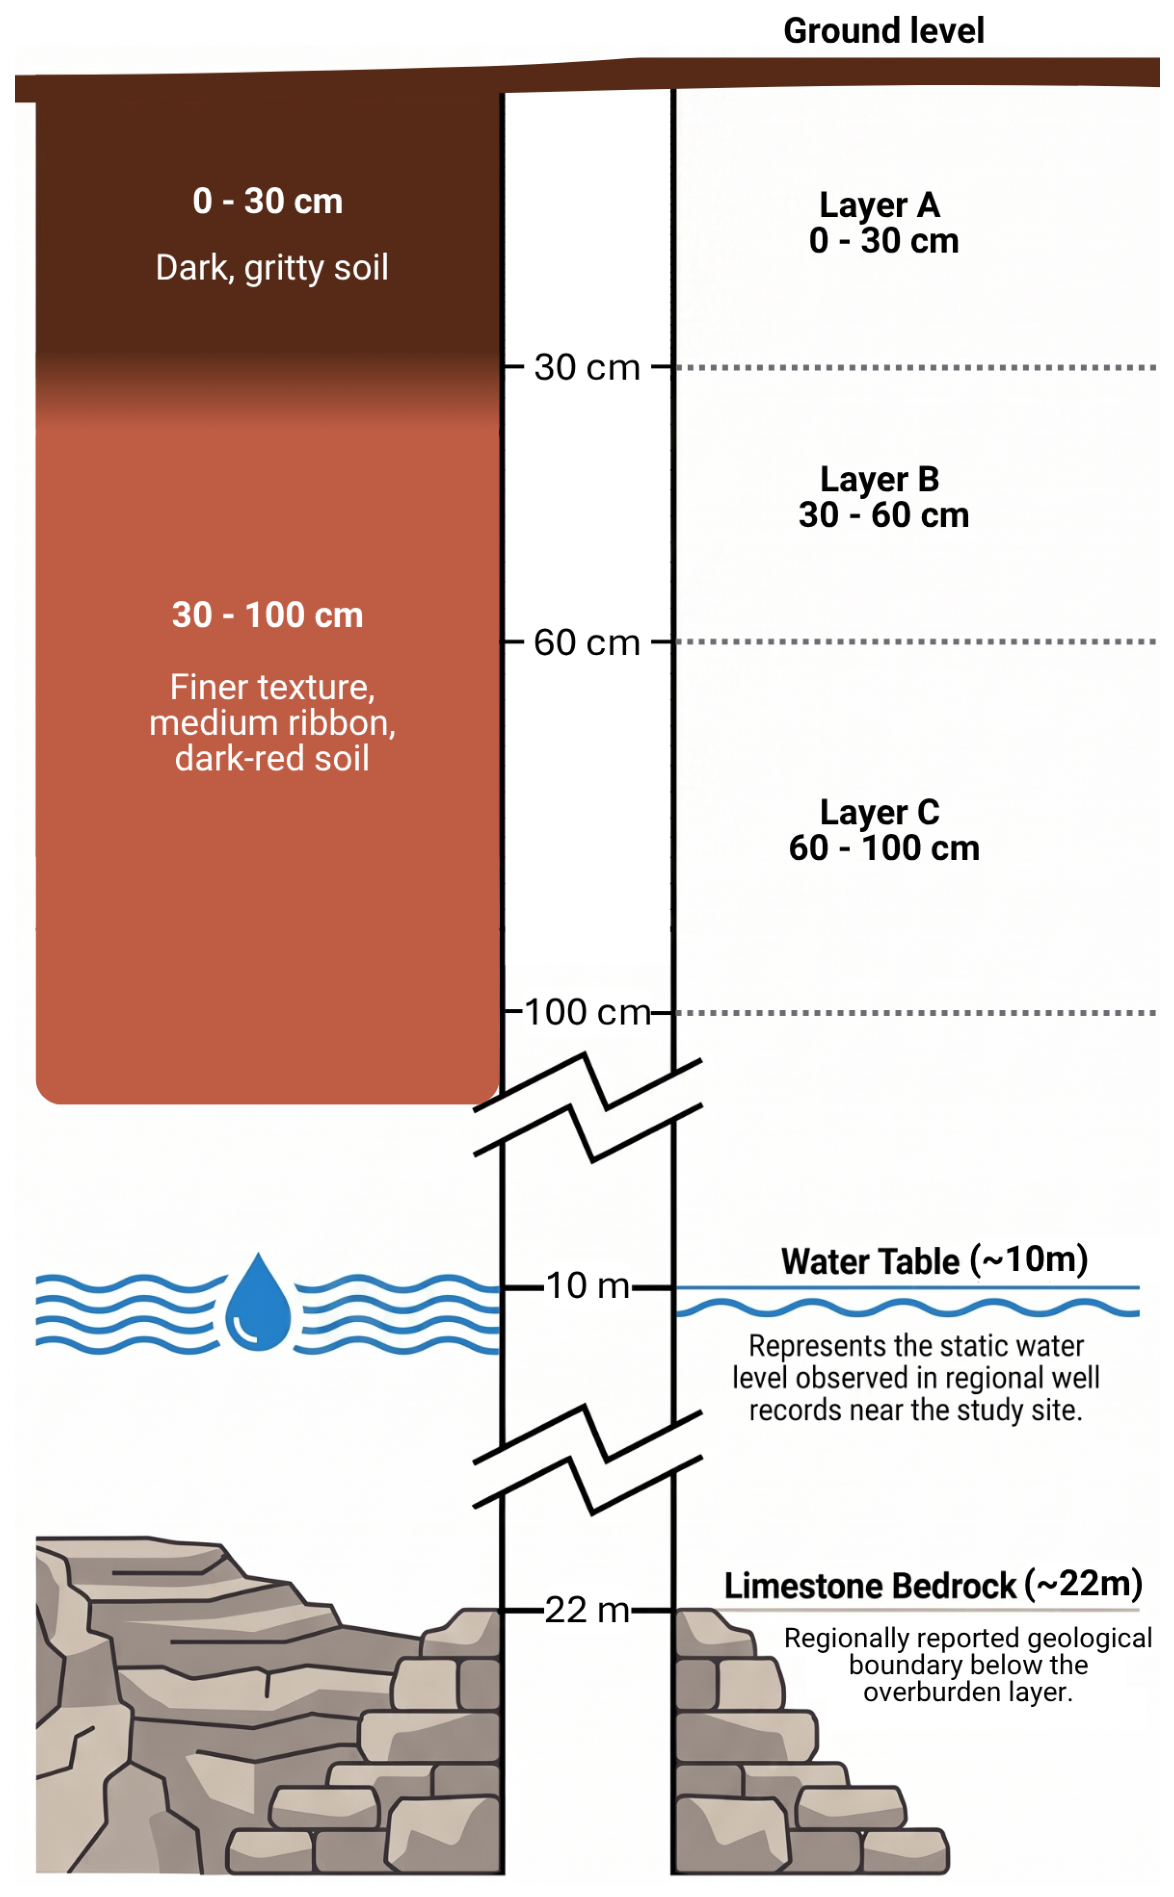
A preliminary soil sampling on 3 points of the area was conducted to comprehend changes in the soil characteristics that might justify (or not) partitioning into layers. Sampling every 40 cm up to 120 cm, and conducting visual and tactile observations (feel and ribbon test), we observed consistently that soils up to 30 cm had a darker color, and a gritty texture, whilst deeper samples had a finer texture, with medium ribbon and dark-red color, and no significant changes in aspect from 30 to 120 cm.
Data from water wells in the region was used to observe the average depth of the overburden layer and the water level in our area. The records (distant less than 100 m from our site) showed a grey limestone bedrock at 22 m belowground, and a recently built well reported a static level at around 10 m [59]. A high humidity was observed during preliminary sampling, with water-saturated soil starting from 50 cm depth in lower areas, excluded intentionally from the research.
Based on the characteristics of our research, the historical land use of our area and the early-stage development of the trees, the MRV protocols selected as references for this framework are the ones developed for agricultural soils.
Sampling techniques and associated costs were also considered. Given the size of our research plots and our goal of minimizing disturbance to the soil and root system within the plots, we decided to proceed with manual sampling using a 2.54 cm diameter hand probe with a 35 cm opening assisted by a slide hammer both supplied by AMS Inc. in American Falls, ID, USA. For bulk density sampling, the selected tool from the same manufacturer is a 2″ × 6″ (5 × 15 cm) soil core sampler cup for undisturbed sampling. In our silty clay soil, sampling deeper than 1.2 m using manual equipment is extremely challenging due to soil compactness, texture and humidity, as observed in the preliminary test. As such, a chain removal jack was obtained to be used in the future sampling events.
Considering all the variables and observations presented above, we opted to divide our experiment into 3 depth intervals. Additional layer stratification would increase sampling costs, without expected gain in terms of data quality.
The top layer was chosen to be 0–30 cm in accordance with MRV methodologies. Although the bottom layer did not exhibit significant changes in texture and density, it was divided into two sections to better represent carbon and nutrient cycling and stocks at different depths. Therefore, the proposed depth increments for this research are: 0–30 cm; 30–60 cm; 60–100 cm, named respectively Layer A, B, C, as represented in Figure 2.
During the first year of the project, baseline soil samples are being collected to characterize the area and will be replicated for future expansions.
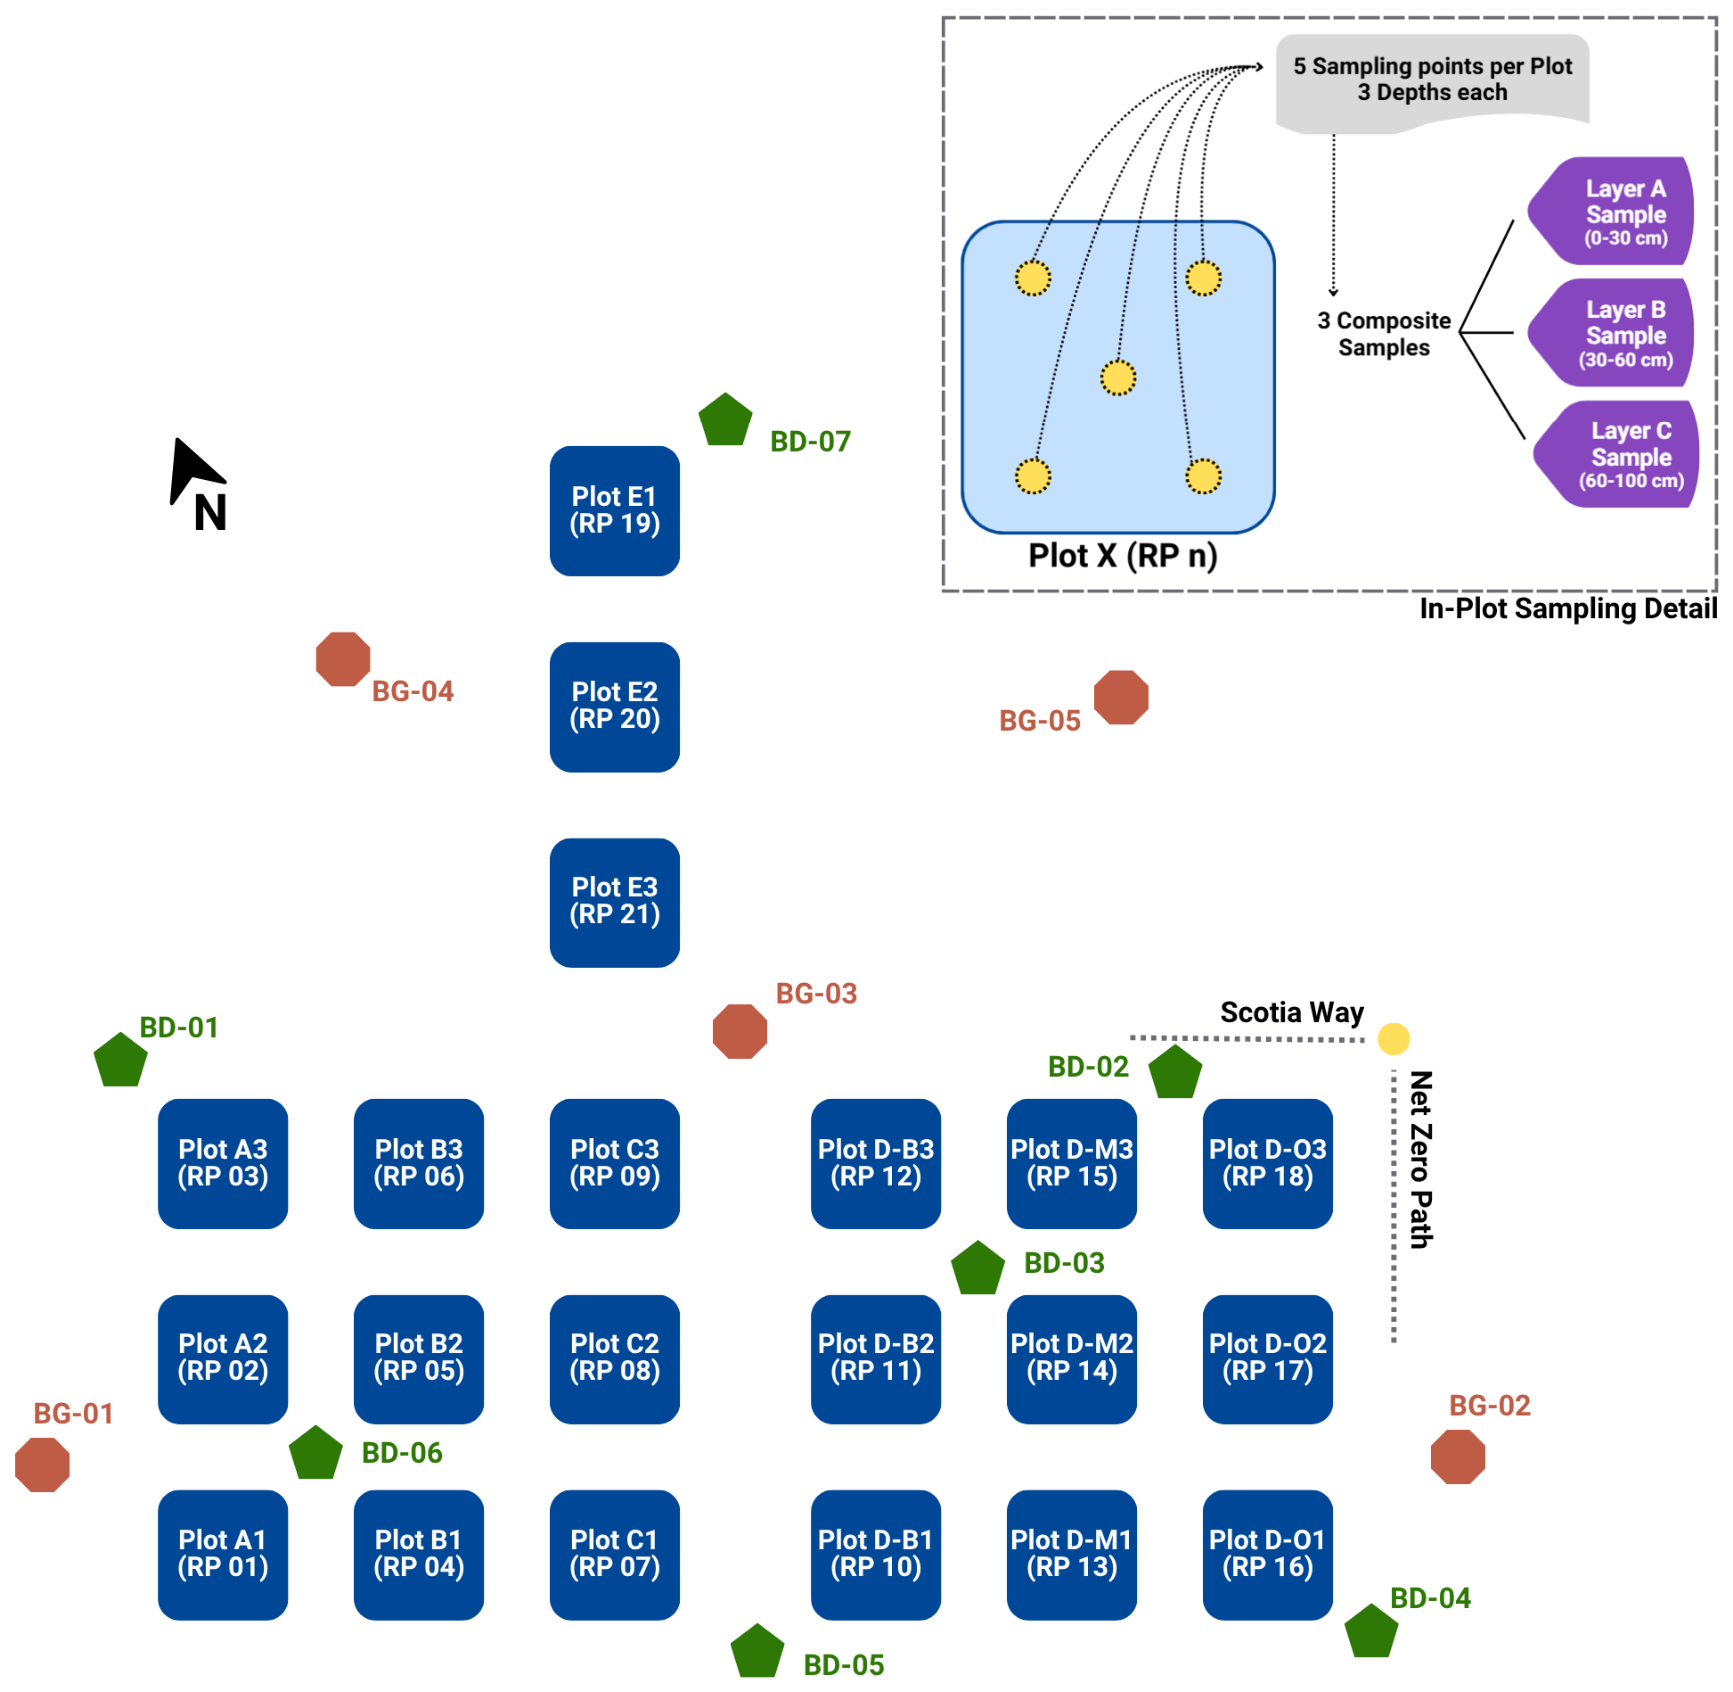
The baseline characterization sampling points were placed around the area designated for the first block of the research, no more than 25 m apart from each other. These points aim to represent different geomorphic features of the area and distance from surrounding forest fragments (minimum 5 m of distance).
For future soil analysis, soil samples will be divided into three categories:
  • In-plot: collected inside the plots (research, control or reference plots)—composite sample formed by a minimum of five individual samples combined;
  • Bulk Density points: individual sample collected out of the plots, for characterization, placed according to represent geomorphic features of the area.
  • Background points: individual sample collected out of the plots, in designated area, with no soil preparation, treatment or any other vegetation, representing geomorphic features of the area, as well as distinct orientation from the plots.
Seven individual sampling points were purposively located between the research plots to provide broad spatial coverage of the experimental block while minimizing disturbance within planted plots. Their placement was selected to capture the range of positions across the site rather than to form a strictly regular grid. The spatial arrangement of the seven bulk-density points and five background points relative to the 21 research plots is shown in Figure 3.

3.4. Monitoring Schedule

There are two commonly recommended planting seasons in Canada, Spring planting (late May/early June) and Fall planting (September/early October). Consequently, direct soil sampling is intended to occur twice annually, generally once in summer and once before winter, to capture seasonal conditions while limiting unnecessary disturbance during periods of elevated microbial activity. The 21 research plots in this study were established in June 2025, and baseline soil sampling was conducted in October 2025.
The monitoring schedule is designed as a planned framework rather than a rigid calendar. Field access and sampling windows may be adjusted in response to prolonged rainfall, saturated soils, extreme heat, or other conditions that could compromise worker safety, damage the plots, or affect sample integrity. This flexibility is necessary in field-based research on living systems, where environmental conditions vary among years and ecological changes develop gradually. Any deviations from the planned schedule are regularly documented, while consistency is maintained in the variables measured and the general timing of monitoring. Repeated measurements will continue as part of the ongoing multi-year research program. More intensive measurements, including reassessment of bulk density, will be conducted at longer intervals where repeated sampling could disturb developing root systems. Additionally, all species are monitored for health and measured for above-ground biomass calculation through allometric equations.

3.5. Carbon Stock Calculations

Following measurement, the data will be entered into allometric equations as described earlier. Individual tree and shrub biomass estimates are calculated by substituting field measurements into the selected allometric equations. Biomass is then summed for all individuals within each plot and converted to a per-area basis according to the research.
Soil Organic Carbon—SOC stock was calculated for each plot based on the methodology proposed by [50], which is specified in the formula below, for a specific point:
SOC = BD × TOC × D × (1 − CF) × 0.1
where SOC = Soil Organic Carbon stock (Mg/ha); BD = Bulk density in the layer (g/cm3); TOC = Total Organic Carbon (g/kg); D = Depth of the layer (cm); CF = coarse fragment fraction in layer (dimensionless).
Bulk density is directly measured in the field, for each depth increment. Total Organic Carbon (TOC) levels are calculated in field samples after Total Carbon was measured by the TMECC 04.01-A method (Dumas Dry Combustion) [53], and Inorganic Carbon was subtracted from the result. The coarse fragment ratio is also measured in the field.
It may be helpful to consider the potential uncertainty arising from laboratory measurement, carbon-fraction assumptions, the selection of allometric relationships, and specific species behaviour. Formal uncertainty propagation is not undertaken in the present baseline phase because the final allometric equation set and longitudinal dataset are not yet available. Future carbon estimates will report equation-specific uncertainty, sampling variability, and confidence intervals where the supporting data permit.

3.6. Planned Statistical Analysis

Future longitudinal analyses will treat the plots as the primary experimental unit. Treatment group and time will be evaluated as fixed effects, with repeated measurements accounted for at the plot level. Where appropriate, mixed-effects models will be used to examine treatment, time, and treatment-by-time relationships while accounting for plot-level and spatial variation. Baseline soil properties and initial plant characteristics may be included as covariates where justified by the data.
Because the current phase is intended to establish a baseline framework rather than test definitive treatment effects, no retrospective power claim is made. The existing replication structure was selected to support initial comparison among treatment configurations while remaining feasible within the available research area. Variance estimates from the first complete monitoring cycles will be used to refine future power and sample-size calculations. Early analyses will therefore emphasize effect sizes, confidence intervals, uncertainty, and temporal trajectories rather than relying only on statistical significance.

4. Results and Discussion

4.1. Pocket Forest Implementation

Broadly, the Pocket Forest Network initiative establishes, monitors, and records the performance of each intervention through three distinct plot typologies: (a) research plots, planted by the research team at the living lab, representing the most controlled level of observation (as described in the methodology), (b) educational plots, planted by student cohorts at the living lab, representing an intermediate level of control, and (c) community plots, planted by trained champions outside the living lab, representing diverse environmental conditions but the lowest level of monitoring control. While not all plots are used in empirical research, their implementation over the last three years has allowed us to refine seven function-driven design criteria summarized in Table 2. These design criteria treat the Miyawaki method as a design logic that must be translated into local context. For the purpose of this applied research, the initial interpretation of the underlying Miyawaki principles focused on designing for ecological compatibility, prioritizing functional diversity, building functional redundancy, using vertical structural diversity, designing across successional trajectories, designing for persistence and sustainability (not initial performance alone), and incorporating adaptive management through measurable decision thresholds to inform subsequent pocket forest design improvements. From an engineering application perspective, the key question is not whether a planting visually resembles a Miyawaki forest, but whether it performs as a compact repeatable natural climate solution.
A particularly important lesson emerging from the design process was the need to distinguish potential natural vegetation (PNV) from a list of available or preferred native species. Identifying PNV requires consideration of the regional climate and vegetation zone alongside site-specific conditions, including soil moisture and nutrient regimes, drainage, soil texture and depth, topography, hydrology, disturbance history, and the composition of nearby reference ecosystems and diagnostic plant communities. Species selection should therefore represent the ecological community that the site is capable of supporting, rather than simply drawing from species native to the broader region. Equally, forest vegetation should not be imposed on sites whose ecological potential is more consistent with wetlands, grasslands, alvars, tundra, or other non-forest communities. Because PNV reflects contemporary ecological potential rather than a fixed historical endpoint, it must also be reassessed as climatic conditions and disturbance regimes change. Research at Québec’s temperate–boreal ecotone, for example, indicates declining future habitat suitability for several diagnostic boreal species and the potential emergence of novel species assemblages [60].
The present study may have implications for scalability and future pocket forest design decision support. The diversity treatments are intended to test whether maximum species richness is necessary to achieve the strongest carbon-related performance. Highly diverse assemblages may increase ecological complexity, but they may also require greater procurement effort, higher establishment costs, and access to a wider range of site-appropriate planting material. By comparing richness levels while maintaining a consistent general functional design, empirical observations will evaluate whether lower-richness assemblages retain sufficient functional redundancy and achieve comparable carbon outcomes. This is important for identifying configurations that are not only ecologically effective, but also practical to reproduce across distributed sites and plot typologies.

4.2. Preliminary Observations

The observations presented in this section are intended to characterize baseline site conditions and to inform the development of the monitoring framework. They are not interpreted as evidence of treatment effects or established carbon-sequestration outcomes. Because the plots were recently established and ecological responses in vegetation, roots, microbial communities, and soil carbon develop over longer time scales, treatment-related conclusions will require repeated longitudinal measurements.
Initial soil measurements indicate that the study site falls within a baseline condition consistent with a functioning mineral-soil system. In practical terms, this suggests that the site is not severely degraded, but it is also not carbon saturated. This condition is consistent with the lower-end of global model estimates for the region, and indicates that there is potential for carbon recovery under afforestation treatment [61]. For the purposes of this study, this baseline condition is important because pocket forest interventions are expected to produce the clearest carbon response where soils retain biological function but have not reached their carbon storage potential. This supports the need to track both vegetation growth and soil carbon response over time, rather than relying on a single early-stage measurement.
A second preliminary observation is that the preliminary bulk-density measurements showed limited variation across the sampled points. This consistency supports the methodological rationale for applying a consistent bulk density value within each sampled depth layer when calculating soil organic carbon stocks. Because soil organic carbon stock calculations depend on both carbon concentration and bulk density, spatial consistency in bulk density reduces one source of calculation uncertainty. However, bulk density should not be treated as static. Over time, afforested plots may experience gradual changes in soil structure as root growth, organic matter inputs, and reduced surface disturbance alter pore space and aggregation. Bulk density monitoring is therefore warranted because even gradual changes can influence both root development and the interpretation of soil carbon stock trends. However, because bulk density sampling is intrusive and may disturb developing root systems, a five-year monitoring interval is proposed.
The site is classified as a gray brown luvisol, a clay-influenced, fine-textured soil common in southern Ontario. This classification is relevant because fine-textured soils generally have greater potential to retain organic carbon through mineral-organic associations and aggregate protection. However, this potential is conditional. Clay-influenced soils are also sensitive to compaction and mechanical disturbance, both of which can restrict root growth, alter aeration and water movement, and disrupt soil structure. For pocket forest establishment, this creates a design tension: soil preparation may be needed to support young plug establishment, but excessive mechanical disturbance may undermine longer-term carbon stabilization. The framework therefore needs to treat soil physical condition as a carbon-relevant design variable, not merely as a planting constraint.
Early observations from the treatment plots show slightly higher soil organic carbon levels across several pocket forest configurations compared with control areas. However, variation among treatment configurations remains limited. This is expected because the analysis was conducted approximately six months after implementation, which is too early to expect strong treatment-driven soil carbon separation. At this stage, observed differences should be interpreted cautiously and treated as an emerging baseline trajectory rather than evidence of established treatment performance. This is particularly important because early soil carbon readings may reflect pre-existing site conditions, soil amendment effects, mulch inputs, or historical land-use patterns rather than carbon accumulation caused by the pocket forest intervention itself.

4.3. Proposed Carbon Profiling Framework

The preliminary observations support the need for a carbon assessment framework designed specifically for pocket forests. Conventional approaches that rely primarily on AGB are insufficient. A more appropriate framework should combine accessible annual indicators, including survival, height, basal or root collar diameter, stem count, crown dimensions, litter development, soil organic carbon, and bulk density, with periodic calibration using more intensive measurements such as deeper soil sampling, tissue carbon fractions, root indicators, and microbial DNA testing where feasible. This approach would allow pocket forest carbon performance to be assessed as a developing system rather than as a simplified miniature version of a mature forest.
Based on the early observations summarized in Table 3, we synthesized a list of parameters presented in Table 4, along with the selected analysis methodology for a more comprehensive carbon monitoring framework.
During the current research phase, belowground biomass will be estimated indirectly where suitable literature-based root-to-shoot relationships are available. Because published relationships are not available for all species included in the study, broader growth-form or functional-group values may be used cautiously where justified, while some species may remain unestimated until more appropriate relationships or calibration data become available. All resulting values will be treated as modeled estimates with explicit uncertainty rather than as direct measurements. Destructive root excavation is not proposed because it would compromise the integrity of the longitudinal plots. Future phases will evaluate non-destructive or minimally invasive root indicators that may improve calibration for species and assemblages not adequately represented in the literature.
On a general note, the proposed parameters are considered a basis for understanding soil characteristics and health, that can be statistically correlated to soil organic carbon stocks variations and stability. Based on site-specific observations, the list can be altered to consider relevant trends and/or additional factors not accounted for in this work.
At this stage, the proposed monitoring structure should be understood as a synthesis of candidate measurements rather than as a validated decision-support or carbon-estimation model. The relationships among routine indicators, intensive measurements, and carbon outcomes will be calibrated and tested in subsequent longitudinal phases of the research program. Candidate proxy indicators will be evaluated in future phases by comparing accessible field measurements with direct carbon and soil measurements across repeated monitoring periods. Statistical methods will be selected according to the size, structure, and distribution of the resulting dataset and may include correlation, regression, and multivariable approaches. Proxy relationships will not be considered validated until their predictive performance and uncertainty have been assessed using longitudinal data.

4.4. Future Direction

Future work focuses on developing and validating proxy indicators for pocket forest carbon performance. The proposed carbon profiling framework is intentionally comprehensive, but many of its parameters, including MAOC, POC, microbial DNA, carbon fractions, and deeper soil sampling, are too technically intensive for frequent monitoring across distributed pocket forest sites. The next step is therefore to determine which accessible measurements can reliably approximate more intensive carbon indicators. The objective is not to replace direct carbon measurement, but to calibrate simpler indicators against more rigorous measurements so that pocket forest carbon assessment can become more scalable.
A validated proxy-based framework would allow monitoring to operate in tiers. Core indicators could be measured annually at low cost, while more intensive laboratory and molecular analyses could be conducted periodically for calibration and quality control. Over time, this would support the development of uncertainty ranges, correction factors, and site-specific relationships between easily measured field conditions and carbon stock or carbon stability outcomes. This direction is particularly important if pocket forests are to be considered in future carbon credit or climate-benefit accounting systems.
The longitudinal relationships developed through the study are also intended to support a future unit-level carbon estimation tool. The tool would combine design criteria with observed growth relationships, allometric equations, soil indicators, and clearly stated assumptions to estimate carbon performance at the pocket-forest-unit scale. Before sufficient longitudinal data are available, any projected outputs would be treated as scenario-based estimates rather than validated forecasts, and uncertainty would be reported explicitly.

5. Conclusions

The present study establishes a baseline measurement and modeling framework for assessing carbon sequestration in Miyawaki-inspired pocket forests under cold-temperate Canadian conditions. The paper does not present definitive carbon sequestration rates or treatment effects. Rather, it responds to a methodological and practical gap in the current literature; while Miyawaki-inspired approaches are increasingly promoted for urban climate action, their carbon performance remains insufficiently tested through controlled, replicated, multi-pool, and longitudinal research designs.
A second gap concerns implementation scale. Many urban tiny-forest models are framed around a minimum of 100 m2 planting areas, a size that may be feasible for some schools, parks, institutions, and public lands but is less compatible with broad deployment across private residential parcels, road corridors, bike paths, utility edges, and fragmented public spaces. In dense urban and peri-urban landscapes, land availability is often discontinuous, contested, and constrained by access, safety, maintenance, visibility, and existing recreational uses. For this reason, the present study treats the pocket forest as a repeatable 10 m2 unit, approximately 100 ft2, that can initiate forest-like structure while remaining small enough to be integrated into underused spaces without substantially reducing access to green space.
The preliminary observations support the central premise that carbon assessment in pocket forests cannot rely on above-ground biomass alone. Dense, juvenile, multi-species plantings differ substantially from mature forest systems and from conventional tree-planting models. In these early-stage systems, survival, root establishment, stem development, shrub architecture, litter formation, soil physical condition, microbial processes, and soil organic carbon dynamics may interact before standard diameter-based biomass metrics become fully reliable. A multi-pool monitoring approach is therefore necessary to avoid premature or incomplete carbon claims.
The baseline soil observations provide useful methodological guidance but should not be interpreted as evidence of established carbon sequestration. The observed vertical carbon distribution, clay-influenced soil conditions, and relatively consistent bulk density support the use of stratified soil sampling and repeated stock calculations. However, early differences between planted and control plots remain limited and may reflect pre-existing site variability, soil preparation, mulch inputs, amendment effects, or recent land-use history rather than treatment-driven carbon accumulation. These findings reinforce the importance of longitudinal monitoring before attributing changes in soil carbon to the pocket forest intervention.
A primary contribution of this study is the proposed proxy-calibrated carbon profiling framework. Accessible indicators such as survival, height, basal or root collar diameter, stem count, crown dimensions, litter development, soil organic carbon, and bulk density can be collected regularly with relatively low disturbance. More intensive measures, including deeper soil sampling, carbon fractionation, root indicators, tissue carbon fractions, and microbial DNA analysis, can then be applied periodically to calibrate these field indicators against more direct measures of carbon stock and carbon stability. This tiered approach is particularly relevant for small and distributed planting sites, where repeated intensive sampling may be costly, disruptive, or impractical.
The experimental design also provides a basis for future evaluation of species diversity as a carbon-relevant design variable. By varying diversity treatments while holding plot size, planting density, soil preparation, and monitoring procedures constant, future phases of the study can examine whether more diverse pocket forest assemblages differ from lower-diversity treatments in survival, growth, canopy development, soil response, and carbon-pool trajectories. At this stage, however, the role of species diversity should be understood as a testable hypothesis rather than a demonstrated effect. Similarly, the proposed proxy relationships, monitoring tiers, and future carbon-accounting applications remain hypotheses for longitudinal testing rather than validated outcomes of the present study. The present study does not demonstrate treatment-driven carbon sequestration, validate proxy relationships, or establish eligibility for carbon-credit or MRV applications. These outcomes require repeated longitudinal measurements, model calibration, and explicit uncertainty assessment.
Overall, this work contributes a methodological foundation for evaluating pocket forests as engineered natural climate solutions rather than as simplified miniature forests. Its value lies in translating the Miyawaki-inspired pocket forest model into a measurable, repeatable, and falsifiable research framework. Future research should use longitudinal data to validate proxy indicators, quantify uncertainty, compare diversity treatments, and determine whether tiered monitoring can support credible climate-benefit assessment for decentralized pocket forest implementation.

Author Contributions

Conceptualization, N.B.F., R.S.L.S. and G.Z.; methodology, R.S.L.S.; validation, N.B.F.; formal analysis, R.S.L.S.; investigation, N.B.F. and R.S.L.S.; resources, R.S.L.S.; data curation, R.S.L.S.; writing—original draft preparation, N.B.F. and R.S.L.S.; writing—review and editing, N.B.F., R.S.L.S. and G.Z.; supervision, N.B.F.; project administration, N.B.F.; funding acquisition, N.B.F. and G.Z.; All authors have read and agreed to the published version of the manuscript.

Funding

This research was partly funded by the Scotiabank Climate Action Research Fund (CARF) in 2024. The funding supported the establishment of the experimental plots, acquisition of research equipment, and purchase of materials required for field implementation and monitoring. The APC was not funded by this grant.

Institutional Review Board Statement

Not applicable.

Informed Consent Statement

Not applicable.

Data Availability Statement

The datasets generated and analyzed during the current study are part of an ongoing longitudinal field-monitoring program and are not publicly deposited at this stage. Data supporting the results reported in this article are available from the corresponding author upon reasonable request, subject to review of the proposed use, appropriate attribution, and any applicable data-sharing conditions.

Acknowledgments

The authors acknowledge the research assistants, students, volunteers, and community participants who supported field preparation, planting activities, plot documentation, soil sampling logistics, and ongoing monitoring associated with the Pocket Forest Network research program. The authors also acknowledge the administrative and technical support provided by Beyond21 Academy in maintaining the living laboratory and supporting the coordination of field activities.

Conflicts of Interest

This research was partly funded by the Scotiabank Climate Action Research Fund (CARF) in 2024. The funding supported the establishment of the experimental plots, acquisition of research equipment, and purchase of materials required for field implementation and monitoring. The APC was not funded by this grant. The funder was not involved in the study design, collection, analysis, interpretation of data, the writing of this article or the decision to submit it for publication. The authors declare no conflicts of interest.

References

  1. Environment and Climate Change Canada. Nature Smart Climate Solutions Fund. Available online: https://www.canada.ca/en/environment-climate-change/services/environmental-funding/programs/nature-smart-climate-solutions-fund.html (accessed on 27 June 2026).
  2. Environment and Climate Change Canada. Canada’s 2030 Nature Strategy: Halting and Reversing Biodiversity Loss in Canada. Available online: https://www.canada.ca/en/environment-climate-change/services/biodiversity/canada-2030-nature-strategy.html (accessed on 27 June 2026).
  3. Drever, C.R.; Cook-Patton, S.C.; Akhter, F.; Badiou, P.H.; Chmura, G.L.; Davidson, S.J.; Desjardins, R.L.; Dyk, A.; Fargione, J.E.; Fellows, M.; et al. Natural Climate Solutions for Canada. Sci. Adv. 2021, 7, eabd6034. [Google Scholar] [CrossRef] [Scilit] [PubMed]
  4. Environment and Natural Resources Canada. Greenhouse Gas Emissions. Available online: https://www.canada.ca/en/environment-climate-change/services/environmental-indicators/greenhouse-gas-emissions.html (accessed on 30 June 2026).
  5. Government of Canada; Statistics Canada. Canada’s Large Urban Centres Continue to Grow and Spread. The Daily, 9 February 2022. Available online: https://www150.statcan.gc.ca/n1/daily-quotidien/220209/dq220209b-eng.htm (accessed on 30 June 2026).
  6. Steenberg, J.W.N.; Ristow, M.; Duinker, P.N.; Lapointe-Elmrabti, L.; MacDonald, J.D.; Nowak, D.J.; Pasher, J.; Flemming, C.; Samson, C. A National Assessment of Urban Forest Carbon Storage and Sequestration in Canada. Carbon Balance Manag. 2023, 18, 11. [Google Scholar] [CrossRef] [Scilit] [PubMed]
  7. Akram, M.T.; Khan, M.M.; Nabi, T.; Qadri, R.; Al-Maskri, A.; Khan, M.A. Miyawaki Technique for Sustainable Urban Greening and Ecological Restoration: A Review. CABI Rev. 2025, 20, 0028. [Google Scholar] [CrossRef] [Scilit]
  8. Canada’s Changing Climate Report. Available online: https://changingclimate.ca/CCCR2019/ (accessed on 27 June 2026).
  9. Changing Climate: Regional Perspectives Report—Chapter 3. Available online: https://changingclimate.ca/regional-perspectives/chapter/3-0/ (accessed on 27 June 2026).
  10. Schirone, B.; Salis, A.; Vessella, F. Effectiveness of the Miyawaki Method in Mediterranean Forest Restoration Programs. Landsc. Ecol. Eng. 2011, 7, 81–92. [Google Scholar] [CrossRef] [Scilit]
  11. Miyawaki, A.; Golley, F.B. Forest Reconstruction as Ecological Engineering. Ecol. Eng. 1993, 2, 333–345. [Google Scholar] [CrossRef] [Scilit]
  12. Miyawaki, A. Restoration of Urban Green Environments Based on the Theories of Vegetation Ecology. Ecol. Eng. 1998, 11, 157–165. [Google Scholar] [CrossRef] [Scilit]
  13. Pregitzer, K.S.; Euskirchen, E.S. Carbon Cycling and Storage in World Forests: Biome Patterns Related to Forest Age. Glob. Change Biol. 2004, 10, 2052–2077. [Google Scholar] [CrossRef] [Scilit]
  14. Morales, N.S.; Fernández, I.C.; Durán, L.; Craven, D. Tiny Forests, Huge Claims: The Evidence Gap behind the Miyawaki Method for Forest Restoration. J. Appl. Ecol. 2026, 63, e70242. [Google Scholar] [CrossRef] [Scilit]
  15. Augusto, L.; Boča, A. Tree Functional Traits, Forest Biomass, and Tree Species Diversity Interact with Site Properties to Drive Forest Soil Carbon. Nat. Commun. 2022, 13, 1097. [Google Scholar] [CrossRef] [Scilit] [PubMed]
  16. Warner, E.; Cook-Patton, S.C.; Lewis, O.T.; Brown, N.; Koricheva, J.; Eisenhauer, N.; Ferlian, O.; Gravel, D.; Hall, J.S.; Jactel, H.; et al. Young Mixed Planted Forests Store More Carbon than Monocultures—A Meta-Analysis. Front. For. Glob. Change 2023, 6, 1226514. [Google Scholar] [CrossRef] [Scilit]
  17. Miyawaki, A. Creative Ecology. Plant Biotechnol. 1999, 16, 15–25. [Google Scholar] [CrossRef] [Scilit]
  18. Cárdenas, M.L.; Pudifoot, B.; Narraway, C.L.; Pilat, C.; Beumer, V.; Hayhow, D.B. Nature-based Solutions Building Urban Resilience for People and the Environment. Tiny Forest as a case study. Q. J. For. 2022, 116, 27–37. [Google Scholar]
  19. Kurian, A.L. Urban heat island mitigation and miyawaki forests: An analysis. Pollut. Res. 2020, 39, 186–191. [Google Scholar]
  20. Zeybek, O. Evaluating the Miyawaki Afforestation Technique in Urban Landscapes: Opportunities and Challenges. Iconarp Int. J. Archit. Plan. 2025, 13, 313–337. [Google Scholar] [CrossRef] [Scilit]
  21. Hanpattanakit, P.; Kongsaenkaew, P.; Pocksorn, A.; Thanajaruwittayakorn, W.; Detchairit, W.; Limsakul, A. Estimating Carbon Stock in Biomass and Soil of Young Eco-Forest in Urban City, Thailand. Chem. Eng. Trans. 2022, 97, 427–432. [Google Scholar] [CrossRef]
  22. Tong, L.; Wang, Y.; Zhu, Z.; Chen, Z.; Tang, S.; Zhao, X.; Chen, K.; Wang, L. Effects of Species and Structural Diversity on Carbon Storage in Subtropical Forests. Biology 2026, 15, 79. [Google Scholar] [CrossRef] [Scilit] [PubMed]
  23. IPCC. 2006 IPCC Guidelines for National Greenhouse Gas Inventories; Agriculture, Forestry and Other Land Use; Institute for Global Environmental Strategies (IGES): Hayama, Japan, 2006; Volume 4. [Google Scholar]
  24. Melikov, C.H.; Bukoski, J.J.; Cook-Patton, S.C.; Ban, H.; Chen, J.L.; Potts, M.D. Quantifying the Effect Size of Management Actions on Aboveground Carbon Stocks in Forest Plantations. Curr. For. Rep. 2023, 9, 131–148. [Google Scholar] [CrossRef] [Scilit] [PubMed]
  25. Flade, L.; Hopkinson, C.; Chasmer, L. Allometric Equations for Shrub and Short-Stature Tree Aboveground Biomass within Boreal Ecosystems of Northwestern Canada. Forests 2020, 11, 1207. [Google Scholar] [CrossRef] [Scilit]
  26. IPCC. 2019 Refinement to the 2006 IPCC Guidelines for National Greenhouse Gas Inventories; Agriculture, Forestry and Other Land Use; IPCC: Cham Switzerland, 2019; Volume 4. [Google Scholar]
  27. Lambert, M.-C.; Ung, C.-H.; Raulier, F. Canadian National Tree Aboveground Biomass Equations. Can. J. For. Res. 2005, 35, 1996–2018. [Google Scholar] [CrossRef] [Scilit]
  28. Conti, G.; Gorné, L.D.; Zeballos, S.R.; Lipoma, M.L.; Gatica, G.; Kowaljow, E.; Whitworth-Hulse, J.I.; Cuchietti, A.; Poca, M.; Pestoni, S.; et al. Developing Allometric Models to Predict the Individual Aboveground Biomass of Shrubs Worldwide. Glob. Ecol. Biogeogr. 2019, 28, 961–975. [Google Scholar] [CrossRef] [Scilit]
  29. Roy, A.; Lopus, M.; Surendran, S.; Kushwaha, A.; Sreejith, K.A.; Akhila, K.C.; Anna, G.; Saranga, P.; Sethulakhsmi, N.; Jaiswal, D. Assessing Carbon Sequestration in Urban Miyawaki Forests of South India: Implications for Climate Mitigation Planning and Land Suitability. Trees For. People 2025, 21, 100925. [Google Scholar] [CrossRef] [Scilit]
  30. Petropoulos, T.; Benos, L.; Busato, P.; Kyriakarakos, G.; Kateris, D.; Aidonis, D.; Bochtis, D. Soil Organic Carbon Assessment for Carbon Farming: A Review. Agriculture 2025, 15, 567. [Google Scholar] [CrossRef] [Scilit]
  31. Cotrufo, M.F.; Ranalli, M.G.; Haddix, M.L.; Six, J.; Lugato, E. Soil Carbon Storage Informed by Particulate and Mineral-Associated Organic Matter. Nat. Geosci. 2019, 12, 989–994. [Google Scholar] [CrossRef] [Scilit]
  32. Rabot, E.; Wiesmeier, M.; Schlüter, S.; Vogel, H.-J. Soil Structure as an Indicator of Soil Functions: A Review. Geoderma 2018, 314, 122–137. [Google Scholar] [CrossRef] [Scilit]
  33. Lu, J.; Zhang, Q.; Werner, A.D.; Li, Y.; Jiang, S.; Tan, Z. Root-Induced Changes of Soil Hydraulic Properties—A Review. J. Hydrol. 2020, 589, 125203. [Google Scholar] [CrossRef] [Scilit]
  34. Lal, R. Soil Organic Matter and Water Retention. Agron. J. 2020, 112, 3265–3277. [Google Scholar] [CrossRef] [Scilit]
  35. Philippot, L.; Chenu, C.; Kappler, A.; Rillig, M.C.; Fierer, N. The Interplay between Microbial Communities and Soil Properties. Nat. Rev. Microbiol. 2024, 22, 226–239. [Google Scholar] [CrossRef] [Scilit] [PubMed]
  36. Anthony, M.A.; Crowther, T.W.; Maynard, D.S.; van den Hoogen, J.; Averill, C. Distinct Assembly Processes and Microbial Communities Constrain Soil Organic Carbon Formation. One Earth 2020, 2, 349–360. [Google Scholar] [CrossRef] [Scilit]
  37. Bongiorno, G.; Bünemann, E.K.; Oguejiofor, C.U.; Meier, J.; Gort, G.; Comans, R.; Mäder, P.; Brussaard, L.; De Goede, R. Sensitivity of Labile Carbon Fractions to Tillage and Organic Matter Management and Their Potential as Comprehensive Soil Quality Indicators across Pedoclimatic Conditions in Europe. Ecol. Indic. 2019, 99, 38–50. [Google Scholar] [CrossRef] [Scilit]
  38. Haddaway, N.R.; Hedlund, K.; Jackson, L.E.; Kätterer, T.; Lugato, E.; Thomsen, I.K.; Jørgensen, H.B.; Isberg, P.-E. How Does Tillage Intensity Affect Soil Organic Carbon? A Systematic Review. Environ. Evid. 2017, 6, 30. [Google Scholar] [CrossRef] [Scilit]
  39. Xie, Z.; Yu, Z.; Li, Y.; Wang, G.; Liu, X.; Tang, C.; Lian, T.; Adams, J.; Liu, J.; Liu, J.; et al. Soil Microbial Metabolism on Carbon and Nitrogen Transformation Links the Crop-Residue Contribution to Soil Organic Carbon. npj Biofilms Microbiomes 2022, 8, 14. [Google Scholar] [CrossRef] [Scilit] [PubMed]
  40. Cole, L.; Goodall, T.; Jehmlich, N.; Griffiths, R.I.; Gleixner, G.; Gubry-Rangin, C.; Malik, A.A. Land Use Effects on Soil Microbiome Composition and Traits with Consequences for Soil Carbon Cycling. ISME Commun. 2024, 4, ycae116. [Google Scholar] [CrossRef] [Scilit] [PubMed]
  41. Ospina Parra, A.F.; Evangelista, J.; Shebitz, D.J. The Root of Urban Renewal: Linking Miyawaki Afforestation to Soil Recovery. Land 2026, 15, 84. [Google Scholar] [CrossRef] [Scilit]
  42. Gross, C.D.; Harrison, R.B. Quantifying and Comparing Soil Carbon Stocks: Underestimation with the Core Sampling Method. Soil Sci. Soc. Am. J. 2018, 82, 949–959. [Google Scholar] [CrossRef] [Scilit]
  43. Yanai, R.D.; Park, B.B.; Hamburg, S.P. The Vertical and Horizontal Distribution of Roots in Northern Hardwood Stands of Varying Age. Can. J. For. Res. 2006, 36, 450–459. [Google Scholar] [CrossRef] [Scilit]
  44. Brassard, B.W.; Chen, H.Y.H.; Bergeron, Y. Influence of Environmental Variability on Root Dynamics in Northern Forests. Crit. Rev. Plant Sci. 2009, 28, 179–197. [Google Scholar] [CrossRef] [Scilit]
  45. Canadell, J.; Jackson, R.B.; Ehleringer, J.B.; Mooney, H.A.; Sala, O.E.; Schulze, E.-D. Maximum Rooting Depth of Vegetation Types at the Global Scale. Oecologia 1996, 108, 583–595. [Google Scholar] [CrossRef] [Scilit] [PubMed]
  46. Schenk, H.J.; Jackson, R.B. Rooting Depths, Lateral Root Spreads and Below-ground/Above-ground Allometries of Plants in Water-limited Ecosystems. J. Ecol. 2002, 90, 480–494. [Google Scholar] [CrossRef] [Scilit]
  47. Fan, Y.; Miguez-Macho, G.; Jobbágy, E.G.; Jackson, R.B.; Otero-Casal, C. Hydrologic Regulation of Plant Rooting Depth. Proc. Natl. Acad. Sci. USA 2017, 114, 10572–10577. [Google Scholar] [CrossRef] [Scilit] [PubMed]
  48. Lal, R. Soil Carbon Management and Climate Change. Carbon Manag. 2013, 4, 439–462. [Google Scholar] [CrossRef] [Scilit]
  49. Conforti, M.; Lucà, F.; Scarciglia, F.; Matteucci, G.; Buttafuoco, G. Soil Carbon Stock in Relation to Soil Properties and Landscape Position in a Forest Ecosystem of Southern Italy (Calabria Region). CATENA 2016, 144, 23–33. [Google Scholar] [CrossRef] [Scilit]
  50. Batjes, N.H. Total Carbon and Nitrogen in the Soils of the World. Eur. J. Soil Sci. 1996, 47, 151–163. [Google Scholar] [CrossRef] [Scilit]
  51. Raffeld, A.M.; Bradford, M.A.; Jackson, R.D.; Rath, D.; Sanford, G.R.; Tautges, N.; Oldfield, E.E. The Importance of Accounting Method and Sampling Depth to Estimate Changes in Soil Carbon Stocks. Carbon Balance Manag. 2024, 19, 2. [Google Scholar] [CrossRef] [Scilit] [PubMed]
  52. Jobbágy, E.G.; Jackson, R.B. The Vertical Distribution of Soil Organic Carbon and Its Relation to Climate and Vegetation. Ecol. Appl. 2000, 10, 423–436. [Google Scholar] [CrossRef]
  53. FAO. A Protocol for Measurement, Monitoring, Reporting and Verification of Soil Organic Carbon in Agricultural Landscapes. GSOC-MRV Protocol, 1st ed.; FAO: Rome, Italy, 2020; ISBN 978-92-5-133126-2. [Google Scholar]
  54. VERRA. VM0042 Improved Agricultural Land Management; v2.2; Verified Carbon Standard (VCS); VERRA: Washington, DC, USA, 2025. [Google Scholar]
  55. WWF.CA. Carbon Measurement. Available online: https://wwf.ca/carbon-measurement/ (accessed on 24 June 2026).
  56. Landforms and Climate of the Mixedwood Plains Ecozone. Available online: http://www.ecozones.ca/english/zone/MixedwoodPlains/land.html (accessed on 22 June 2026).
  57. Natural Resources Canada. Climatic Regions—3rd Edition (1957) of the Atlas of Canada. Available online: https://open.canada.ca/data/en/dataset/09ffaeb5-ec8f-5bb5-bdcb-3436ccf26f58 (accessed on 25 June 2026).
  58. Municipality Hamilton|Climate Atlas of Canada. Available online: https://climateatlas.ca/data/city/451/hwlen_2030_85/line (accessed on 25 June 2026).
  59. Ontario. Map: Well Records. Available online: http://www.ontario.ca/page/map-well-records (accessed on 22 June 2026).
  60. Chalumeau, A.; Bergeron, Y.; Bouchard, M.; Grondin, P.; Lambert, M.-C.; Périé, C. Anticipated Impacts in Habitat of Diagnostic Species of Potential Natural Vegetations Due to Climate Change at the Ecotone between Temperate and Boreal Forests. Clim. Change Ecol. 2024, 8, 100089. [Google Scholar] [CrossRef] [Scilit]
  61. SoilGrids250m 2.0. Available online: https://soilgrids.org/ (accessed on 30 June 2026).
  62. Ratefinjanahary, I.; MacKenzie, R.; Sharma, S.; Razakamanarivo, H.; Razafintsalama, V.; Ravelosamiariniriana, K.; Welti, A.; Ramifehiarivo, N. Development of Soil Organic Carbon Quantification Model and Comparison Based on CHN Analyser, Loss on Ignition, and Walkley-Black Methods for Mangrove Soils in Madagascar. Estuar. Coast. Shelf Sci. 2025, 317, 109182. [Google Scholar] [CrossRef] [Scilit]
  63. Liao, J.; Yang, X.; Dou, Y.; Wang, B.; Xue, Z.; Sun, H.; Yang, Y.; An, S. Divergent Contribution of Particulate and Mineral-Associated Organic Matter to Soil Carbon in Grassland. J. Environ. Manag. 2023, 344, 118536. [Google Scholar] [CrossRef] [Scilit] [PubMed]
  64. Just, C.; Armbruster, M.; Barkusky, D.; Baumecker, M.; Diepolder, M.; Döring, T.F.; Heigl, L.; Honermeier, B.; Jate, M.; Merbach, I.; et al. Soil Organic Carbon Sequestration in Agricultural Long-Term Field Experiments as Derived from Particulate and Mineral-Associated Organic Matter. Geoderma 2023, 434, 116472. [Google Scholar] [CrossRef] [Scilit]
  65. USDA. USDA Natural Resources Conservation Service—Soil Health Assessment. Available online: https://www.nrcs.usda.gov/conservation-basics/soil/soil-health/soil-health-assessment (accessed on 25 June 2026).
  66. Cotrufo, M.F.; Lavallee, J.M. Chapter One—Soil Organic Matter Formation, Persistence, and Functioning: A Synthesis of Current Understanding to Inform Its Conservation and Regeneration. In Advances in Agronomy; Sparks, D.L., Ed.; Academic Press: Cambridge, MA, USA, 2022; Volume 172, pp. 1–66. [Google Scholar]
  67. Ganga, A.; Roder, L.R.; Guerrini, I.A.; Silva, R.B.; Farris, E.; Maccioni, A.; Capra, G.F. The Influence of Soil Physico-Chemical Properties and Land Uses on Organic Carbon Stocks in Contrasting Mediterranean Pedosystems. CATENA 2026, 264, 109746. [Google Scholar] [CrossRef] [Scilit]
  68. Das, S.; Beegum, S.; Acharya, B.S.; Panday, D. Soil Carbon Sequestration: A Mechanistic Perspective on Limitations and Future Possibilities. Sustainability 2025, 17, 6015. [Google Scholar] [CrossRef] [Scilit]
  69. Wang, C.; Wang, X.; Zhang, Y.; Morrissey, E.; Liu, Y.; Sun, L.; Qu, L.; Sang, C.; Zhang, H.; Li, G.; et al. Integrating Microbial Community Properties, Biomass and Necromass to Predict Cropland Soil Organic Carbon. ISME Commun. 2023, 3, 86. [Google Scholar] [CrossRef] [Scilit] [PubMed]
  70. Norris, C.E.; Bean, G.M.; Cappellazzi, S.B.; Cope, M.; Greub, K.L.H.; Liptzin, D.; Rieke, E.L.; Tracy, P.W.; Morgan, C.L.S.; Honeycutt, C.W. Introducing the North American Project to Evaluate Soil Health Measurements. Agron. J. 2020, 112, 3195–3215. [Google Scholar] [CrossRef] [Scilit]
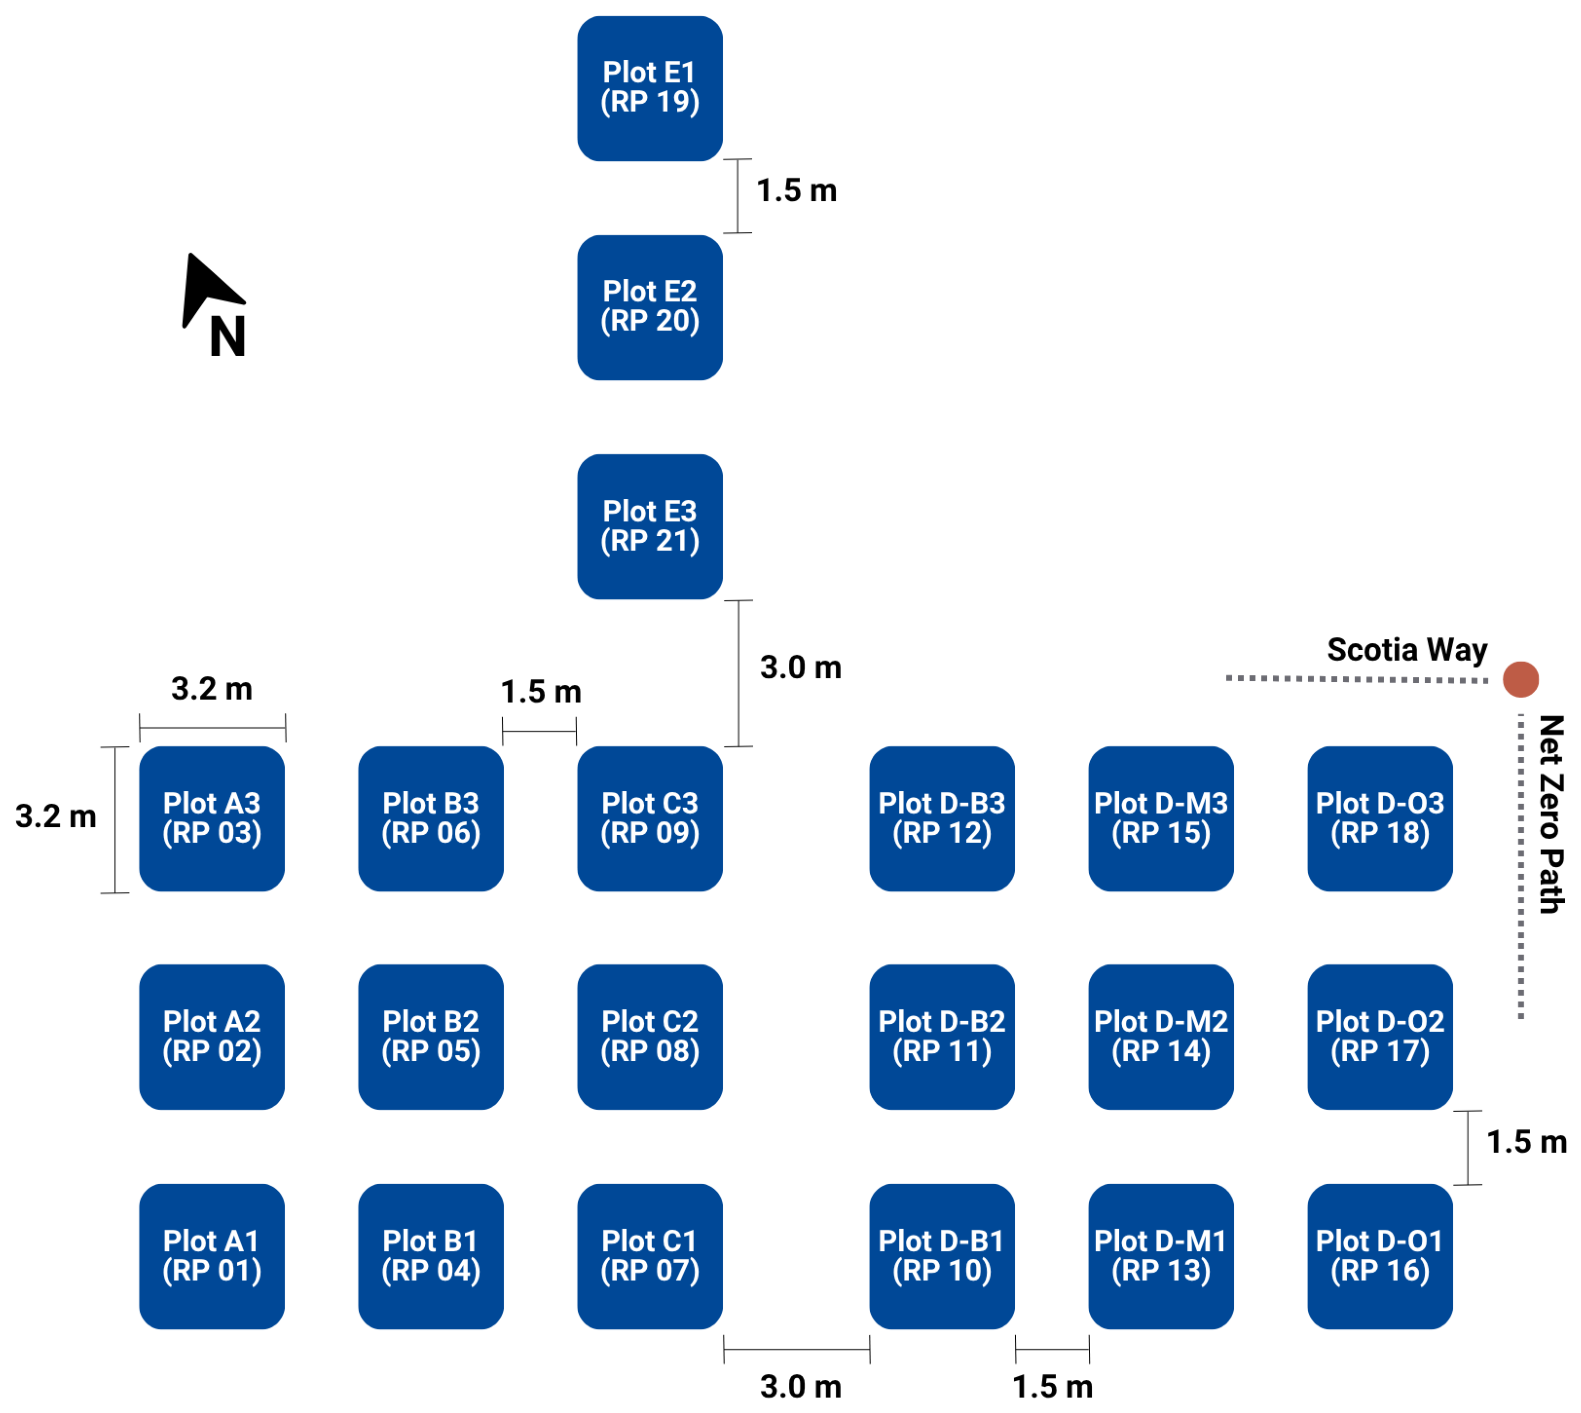
Figure 1. Experimental plot configuration and orientation of the 21 research plots (RP). Each plot measures 10 m2. Planted plots were established at a density of 3 saplings per m2 (30 plants per plot). Plots 1–3 represent Group A, plots 4–6 Group B, plots 7–9 Group C, plots 10–18 Group D, and plots 19–21 the unplanted controls Group E. Spacing of approximately 1.5 to 3.0 m was maintained between plots to allow access for sampling, monitoring, and maintenance.
Sustainability 18 08769 g001
Figure 2. Visual representation of the soil profile of the area and proposed depth increments.
Sustainability 18 08769 g002
Figure 3. Spatial arrangement of the seven purposively selected bulk-density sampling points and five background points relative to the 21 research plots. Sampling locations were positioned between plots to provide broad coverage of the experimental block while reducing disturbance within planted areas. Detail shows In-Plot composite sampling strategy.
Sustainability 18 08769 g003
Table 1. SOC vertical distribution (adapted from [52]).
DepthSOC (Pg of C)Percentage
0–1 m150264%
1–2 m49121%
2–3 m 35115%
Table 2. Function-driven pocket forest design criteria derived from the Miyawaki protocol.
Design Criterion Design Rationale, Implications, and Carbon Performance Relevance
Prepared minimum forest patch dimension A pocket forest needs enough contiguous area to behave as a small forest patch rather than a single row, hedge, or ornamental bed. A minimum 3 m dimension on at least one side allows multiple planting rows, interior-edge interaction, overlapping root zones, canopy closure, and early development of forest-like structure.
Native tree, shrub, and ground cover assemblage, selected from local potential natural vegetation (PNV), including early- and later-successional species, obtained based on size that is approximately 5 to 10 inches tall with a root plug no larger than 5 inches, planted in the same planting seasonAn operational adaptation of the Miyawaki method. The goal is to start with young plants that can establish their root systems directly in the shared forest soil. Small plugs reduce transplant shock, limit early dominance by oversized individuals, and allow plants to acclimate together under the same site conditions. Including both pioneer and secondary species accelerates succession by placing early-growth and longer-term forest functions into the system at the same time. Planting in one season ensures that all species enter the same competitive and cooperative establishment window.
High biodiversity and functional redundancy to support system resilienceA diverse portfolio reduces the risk that one pest, drought event, disease, soil limitation, or climate stressor will compromise the whole forest. The minimum number of species should support functional redundancy; multiple species may contribute to shade, carbon storage, soil building, pollinator support, wildlife food, or long-term canopy formation.
Stratified vertical multi-layered structureAllowing the forest to occupy vertical space efficiently, create shade gradients, support habitat complexity, and emulate the structure of a natural young forest.
High initial density of 2 to 3 woody plugs per m2, unless site-specific constraints justify adjustment Intentionally creates early root interaction among plants with the goal of forcing early forest dynamics, including mycorrhizal development, niche partitioning, canopy closure, and rapid occupation of above- and below-ground space.
Early emulation of natural forest floor function and complexity using natural cover, mulch, and locally appropriate soil conditioningThe forest floor is part of the system from the beginning. Mulch and natural cover protect soil moisture, reduce temperature extremes, suppress weeds, reduce erosion, and begin organic matter cycling. Soil conditioning should respond to local soil constraints rather than follow a generic recipe; the purpose is to create conditions where young plugs can root, interact, and build soil function.
Training (vs. maintenance) towards self-sustainingThe first two years are an active training period through a watering plan that resembles natural precipitation, weeding and mulch top-up, protection from wildlife, replacement decisions, and correction of early establishment failures. Success is achieved when the system has crossed an establishment threshold where interactions within the forest begin to regulate the site with reduced intervention. Premature carbon claims must be prevented before the forest has demonstrated survival and structural function beyond the training period.
Table 3. Baseline soil bulk density characterization at the study site. Parameter measured at seven purposively selected sampling points across the experimental block and reported by adopted sampling intervals of 0–30 cm, 30–60 cm, and 60–100 cm. These data are presented descriptively to characterize baseline site conditions and are not interpreted as evidence of treatment effects.
Bulk Density (g/cm3)BD01BD02BD03BD04BD05BD06BD07MeanSt. Dev.
Layer A 0–30 cm1.251.151.251.311.401.351.241.280.08
Layer B—30–60 cm1.341.481.351.531.351.451.271.390.09
Layer C—60–100 cm1.551.621.561.501.691.681.741.620.09
Table 4. Proposed soil analysis parameters list.
Parameter(s)Rationale and Procedure
Bulk DensityUndisturbed core bulk density, used for soil carbon stock calculation, including coarse fragment content [50].
Soil TextureSoil percentage of silt, clay and sand. Particle size is related to aeration, nutrient leaching and formation and stability of carbon aggregates [32].
Carbon fractions
Total carbon (TC), soil organic carbon (SOC), inorganic carbon (SIC).
Soil Organic Matter (SOM).
Mineral-associated organic carbon (MAOC), particulate organic carbon (POC), and active carbon (AC).
Direct TC measurement through dry combustion method by Dumas is recommended as golden standard [53].
SOM will be measured to build a dataset and may later be evaluated as a proxy for SOC [62].
MAOC and POC are used as carbon stability indicators, by physical fractionation of the sample [53,63,64], and AC is the fraction sensitive to management changes [65].
Nutrients and Minerals
Nitrogen, phosphorus, calcium, magnesium, potassium, sulfur, iron and aluminum; Cation Exchange Capacity—CEC, exchangeable cations (Ca2+, Mg2+, K+, Na+)
Important indicators to comprehend soil health for tree growth, and carbon cycling, including C:N:P:S stoichiometry of soil organic matter and carbon stabilization mechanisms [66].
Field measurements
pH, electrical conductivity and soil moisture
Soil’s physic-chemical parameters help understanding ion exchange interfaces, SOM stabilization and soil fertility [67,68].
Biology
DNA Amplicon sequencing
Microbial community properties (diversity, community composition and functional traits) to correlate data with soil carbon stocks and sequestration [69,70].
Disclaimer/Publisher’s Note: The statements, opinions and data contained in all publications are solely those of the individual author(s) and contributor(s) and not of MDPI and/or the editor(s). MDPI and/or the editor(s) disclaim responsibility for any injury to people or property resulting from any ideas, methods, instructions or products referred to in the content.