1. Introduction
Weirs are in-river structures that provide power generation, flood control and a means of redirecting water resources for human consumption [
1]. Low-head river barriers and conventional fixed weirs can provide these functions, but their impounding effect modifies local hydraulics and sediment continuity by reducing flow velocity and promoting upstream sediment deposition [
2,
3,
4]. Fine-grained sediment accumulation is particularly important because it is associated with water-quality degradation, contaminant transport, habitat alteration, and ecological stress in river systems [
5,
6,
7]. In regulated rivers, interrupted sediment transport can also reduce the long-term functionality of water-control infrastructure by decreasing effective storage, altering channel morphology, and increasing the need for sediment-management operations [
3,
7]. Therefore, river-control structures require not only adequate hydraulic performance but also operational strategies that can release accumulated sediment while maintaining stable flow conditions and long-term operational functionality. The environmental significance of sediment regulation also extends beyond channel morphology and storage capacity. For example, large-scale water-sediment regulation in the Yellow River was reported to alter the composition and transformation characteristics of dissolved organic matter in the estuarine environment, indicating that engineered changes in water and sediment delivery can influence downstream aquatic chemistry [
8]. Such findings further emphasize the need for hydraulic structures that can manage sediment release while maintaining stable water-control functionality.
Integrated movable weirs and inflatable rubber weirs can overcome some limitations of their fixed counterparts, but many systems still operate by lowering the entire span when sediment or floating debris must be discharged. This full-span operation can reduce upstream water level even when sediment is locally accumulated near only a portion of the weir. Additionally, suspended and bedload sediment transfer across weir-like structures is event-dependent and spatially variable, indicating that sediment-release performance should be evaluated together with local hydraulic behavior [
9]. Smart rubber and steel (SRS) movable weirs provide selective discharge through individually controlled airbags supporting each gate span [
10]. Technical development projects have established the basic configuration, selective-operation concept, and component design of hybrid rubber–steel movable weirs [
11]. By varying the internal air pressure, individual spans can be lowered where floating debris or sediment has accumulated, thereby limiting the reduction in upstream water level associated with the complete lowering of conventional movable weirs. However, selective gate lowering may produce concentrated flow, asymmetric hydraulic loading, and localized structural demand that are not captured by water-level control alone. It has been emphasized that similar discharge or water-level conditions may generate different local flow patterns around hydraulic structures, which can influence scour, vibration, and operational safety [
12]. The structural safety of the gate, longitudinal reinforcing ribs, anchor bolts, clamping plates, and airbags must therefore be evaluated under different selective-operation conditions.
Recent research relevant to selectively operated movable weirs can be categorized into hydraulic, structural, and advanced numerical-analysis approaches. From a hydraulic perspective, experimental investigation of a rising sector gate showed that gate-opening conditions substantially influence local velocity and turbulence characteristics [
13]. Experimental and numerical analyses of a multi-plate vertical rotary gate further demonstrated that operating conditions can markedly alter local flow behavior [
14]. Structural studies of movable-weir systems have meanwhile examined gate-panel behavior, reinforcement configurations, hybrid steel-composite components, clamping systems, and other load-carrying elements. More recently, advanced numerical methods have been developed for transient structural response under time-dependent and fluid-associated loading, including a numerically stable transient-analysis framework for thin-walled cylindrical shells [
15] and transient vibration analysis of underwater cylindrical shells [
16]. Although these studies advance the hydraulic or structural analysis of controlled hydraulic structures and fluid-loaded structural systems, hydraulic redistribution, gate response, and component-level safety are generally examined separately. Numerical investigations that directly connect selective operation of independently controlled hybrid rubber–steel gate spans with three-dimensional span-specific hydraulic loading and subsequent structural assessment therefore remain limited.
In addition, the sustainability of river infrastructure depends not only on hydraulic function but also on material-efficient structural design, component reliability, maintenance demand, and service life. Stiffened plate studies have shown that stiffener layout can strongly influence stress distribution, buckling resistance, and structural weight, suggesting that rib configuration may provide a material-efficient alternative to plate thickening [
17,
18]. Previous life-cycle studies of dam infrastructure also indicate that maintenance, retrofitting, and end-of-life stages should be considered when evaluating long-term sustainability [
19,
20]. Within this context, the contribution of the present study to lower-carbon hydraulic infrastructure is positioned at the structural design-decision level. By comparing longitudinal-rib arrangements with plate thickening and verifying the safety of the principal load-transfer components, the proposed framework identifies opportunities to improve structural efficiency without relying solely on additional material. Maintaining adequate component capacity may also help reduce unnecessary material use and premature component replacement. Accordingly, the present assessment provides engineering inputs for subsequent life-cycle assessment and cost–carbon optimization of movable-weir alternatives, through which the environmental benefits of material-efficient configurations can be quantified more explicitly.
Previous studies of gated weirs and hydraulic-control structures have primarily examined discharge characteristics and local flow behavior under partial gate-opening conditions. However, these studies generally treat gate operation as a hydraulic problem, and comparatively little attention has been given to how the selective lowering of individual spans redistributes three-dimensional hydraulic loads between the lowered and adjacent gates and transfers those loads to structural components. Consequently, the structural implications of selective operation, including the influence of longitudinal-rib configuration and the safety of the anchor bolts, clamping plates, and airbag system, remain insufficiently established. This study addresses this gap by coupling Environmental Fluid Dynamics Code (EFDC) hydrodynamic simulations with component-level MIDAS Civil structural analysis. EFDC was originally developed at the Virginia Institute of Marine Science and is a multifunctional surface-water model capable of three-dimensional simulation of hydrodynamics and constituent transport [
21,
22]. The model has been applied to rivers, lakes, reservoirs, wetlands, estuaries, and coastal waters and includes functions for wetting and drying, sediment transport, and hydraulic-structure representation. Four selective gate-operation scenarios were evaluated to characterize scenario-specific flow distributions and hydraulic loads. The resulting loads were transferred to the structural model to assess gate response, compare longitudinal-rib configurations, and verify the safety of the principal load-carrying components. By coupling span-specific hydrodynamic loading with component-level structural assessment, this study clarifies how selective operation affects both hydraulic behavior and the safety of individual components within the SRS movable-weir system. Compared with experimental approaches and more advanced transient numerical formulations, the present EFDC-MIDAS framework involves several simplifications, including steady-state one-way hydraulic-to-structural load transfer, idealized structural boundary conditions, and the absence of explicit transient fluid–structure interaction. These limitations define the framework as a preliminary static assessment and may be addressed in future studies through grid-convergence analysis, transient two-way coupling, nonlinear contact modeling, and physical or field validation. Nevertheless, the adopted approach provides a practical basis for relating selective gate operation to span-specific hydraulic loading and component-level structural response under the analyzed conditions.
2. Methods
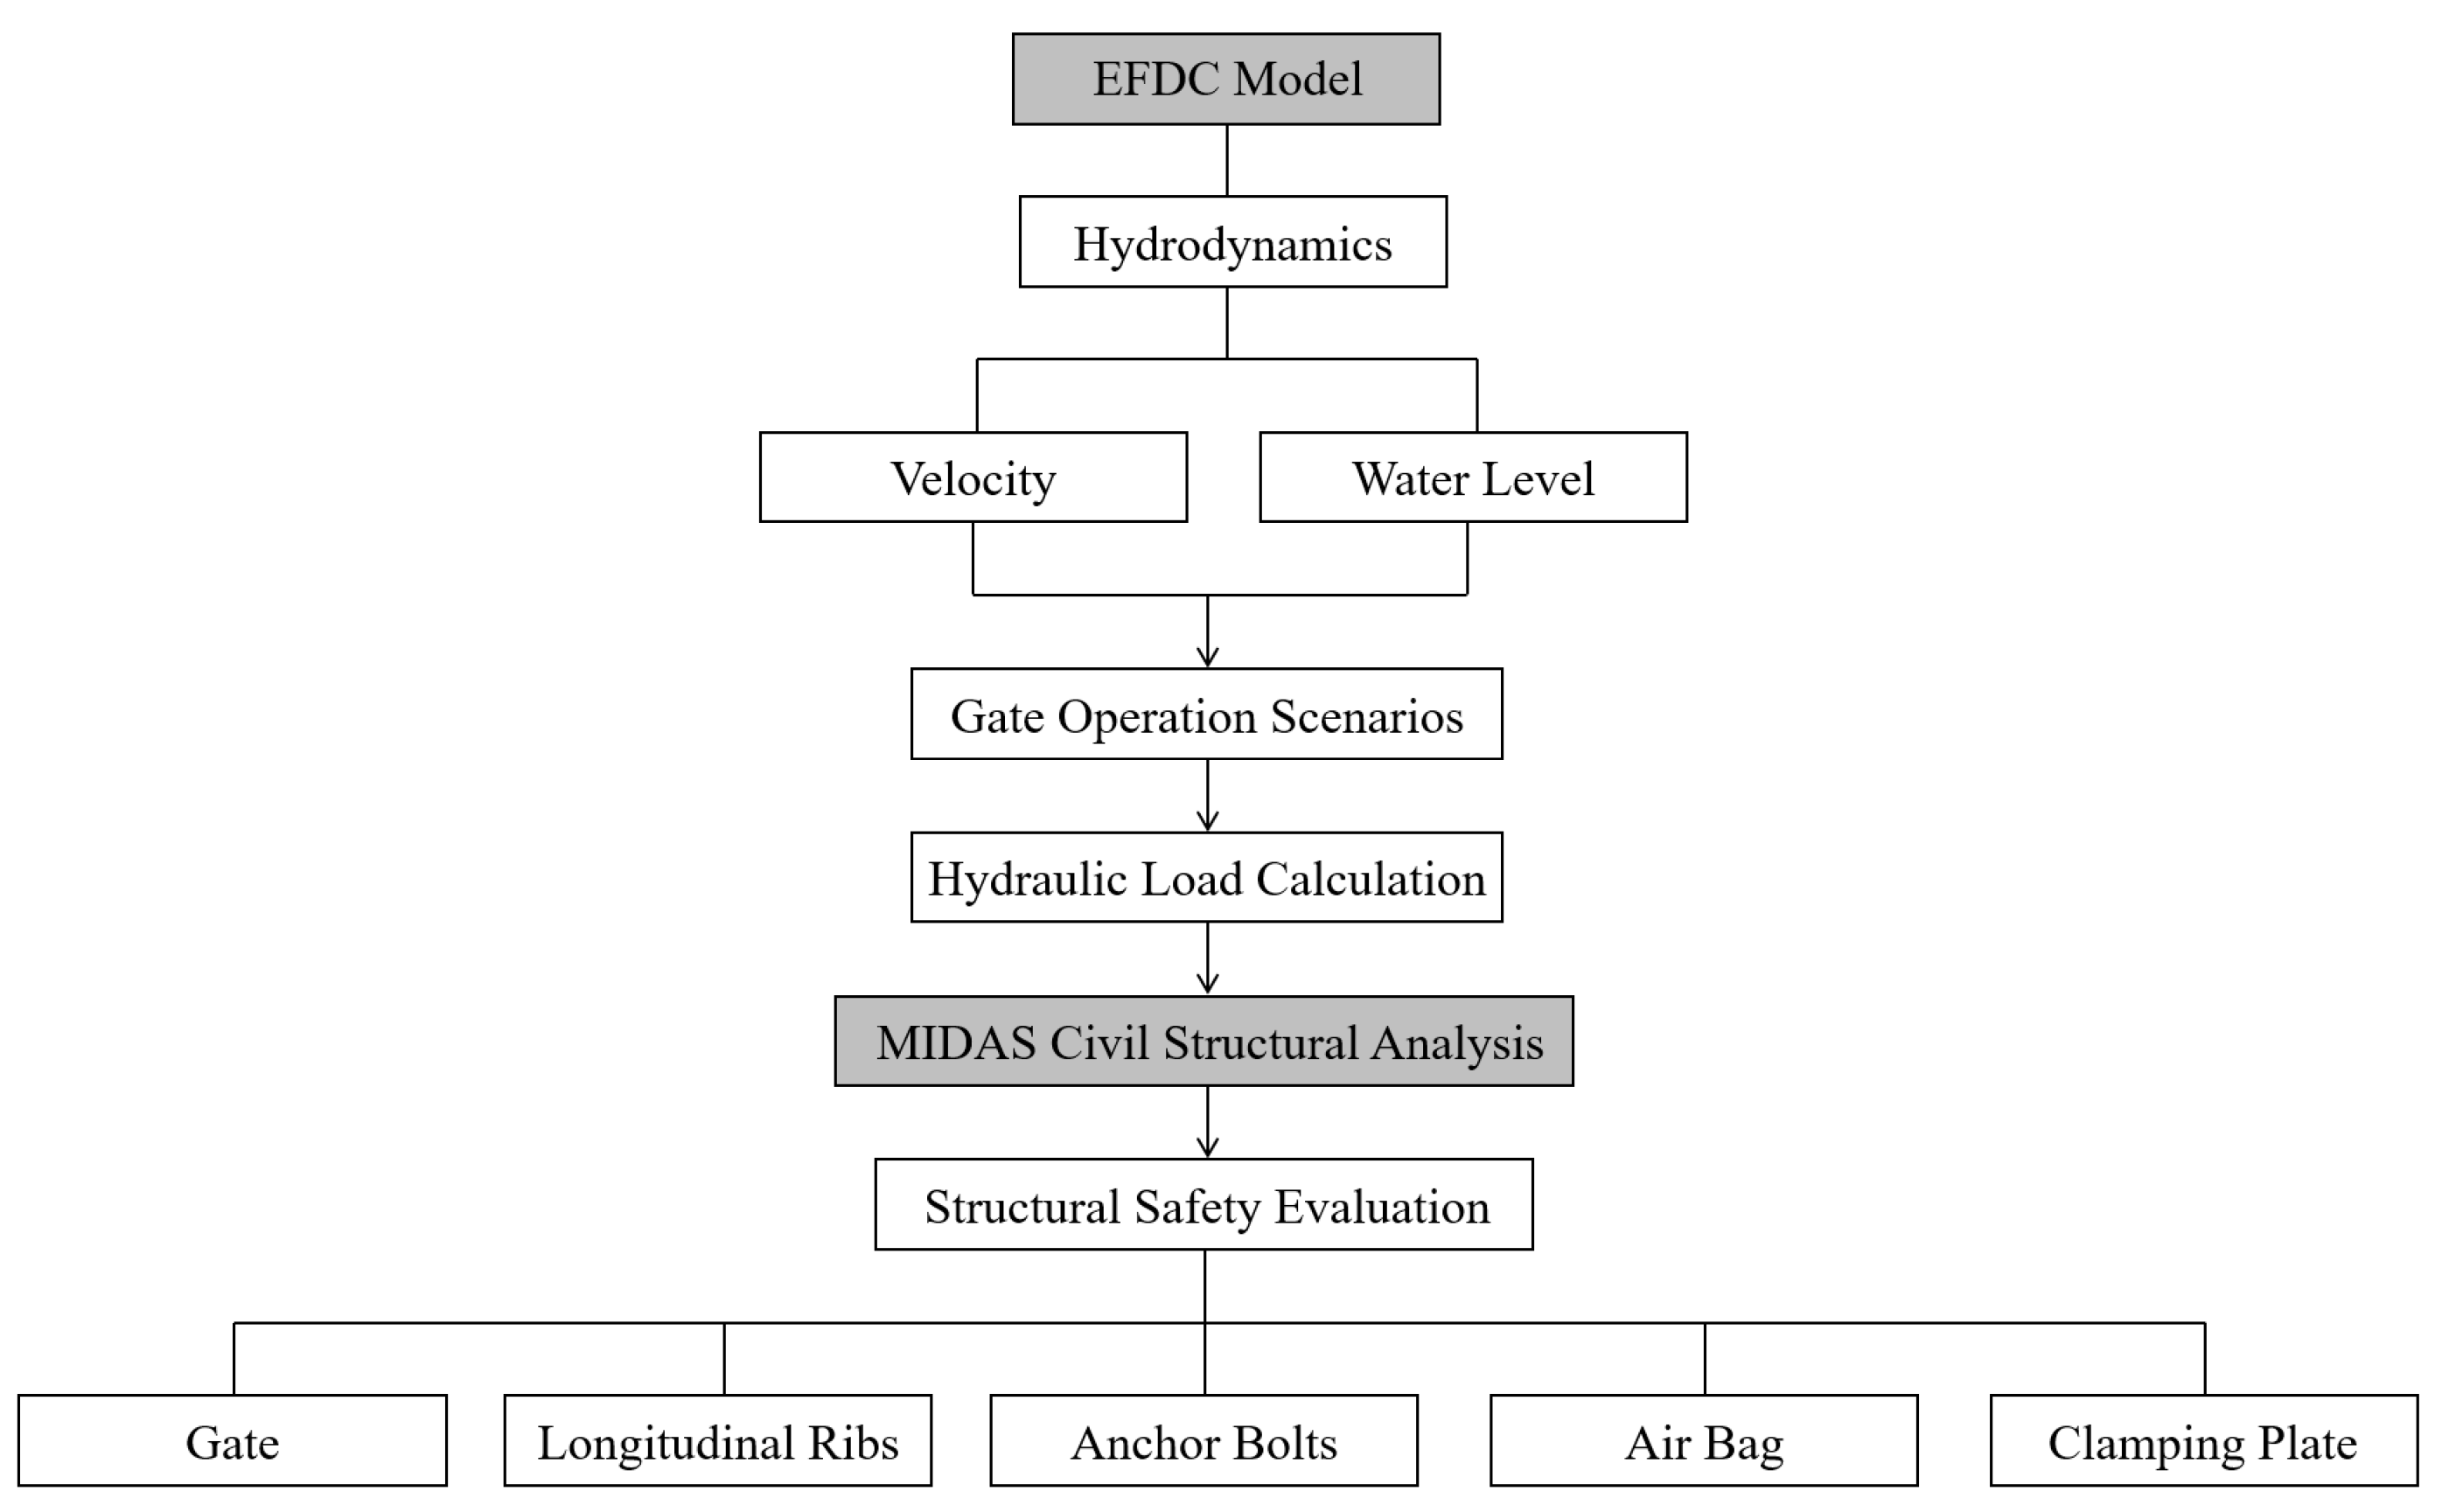
Figure 1 summarizes the coupled EFDC–MIDAS Civil framework adopted in this study. EFDC (EFDC+ version 12.5, DSI LLC, Edmonds, WA, USA) was used to simulate velocity and water-level distributions under four selective gate-operation scenarios. The resulting scenario-specific hydraulic loads were calculated and transferred to MIDAS Civil 2026 (MIDAS Information Technology Co., Ltd., Republic of Korea) to evaluate the structural responses of the gate body, longitudinal ribs, anchor bolts, clamping plates, and airbag system.
2.1. Model Parameters and Gate-Operation Scenarios
The gate-height cases and selective operating states were treated as separate parameters in the numerical analysis. Four nominal gate heights of 0.5, 1.0, 1.5, and 2.0 m were evaluated, while a standing angle of 50° was prescribed for the raised gate configuration. This angle defines the geometric orientation used in calculating the hydrostatic and self-weight components acting on a raised gate and was maintained consistently when comparing the four nominal gate-height cases. The 2.0 m case consequently represented the greatest hydraulic load among the evaluated heights and was subsequently used in the governing structural assessment, including the raised gate adjacent to the lowered span in the critical side-lowering scenario. Selective operation is achieved by controlling the pressure of the supporting airbags. In the present analysis, however, the raised and lowered gate configurations were prescribed for each operating scenario, and the gate motion during airbag inflation or deflation was not simulated. The material properties adopted for the SRS gate and its load-carrying components are summarized in
Table 1.
The river conditions used in the hydraulic model were based on the Korean River Directory and flow-duration data from the Water Resources Information System (WAMIS). The model stream length was set to 150.0 m, consisting of 75.0 m upstream and 75.0 m downstream of the SRS gate, with a stream width of 25.0 m and a bed slope of 0.004. A flow rate of 0.146 m
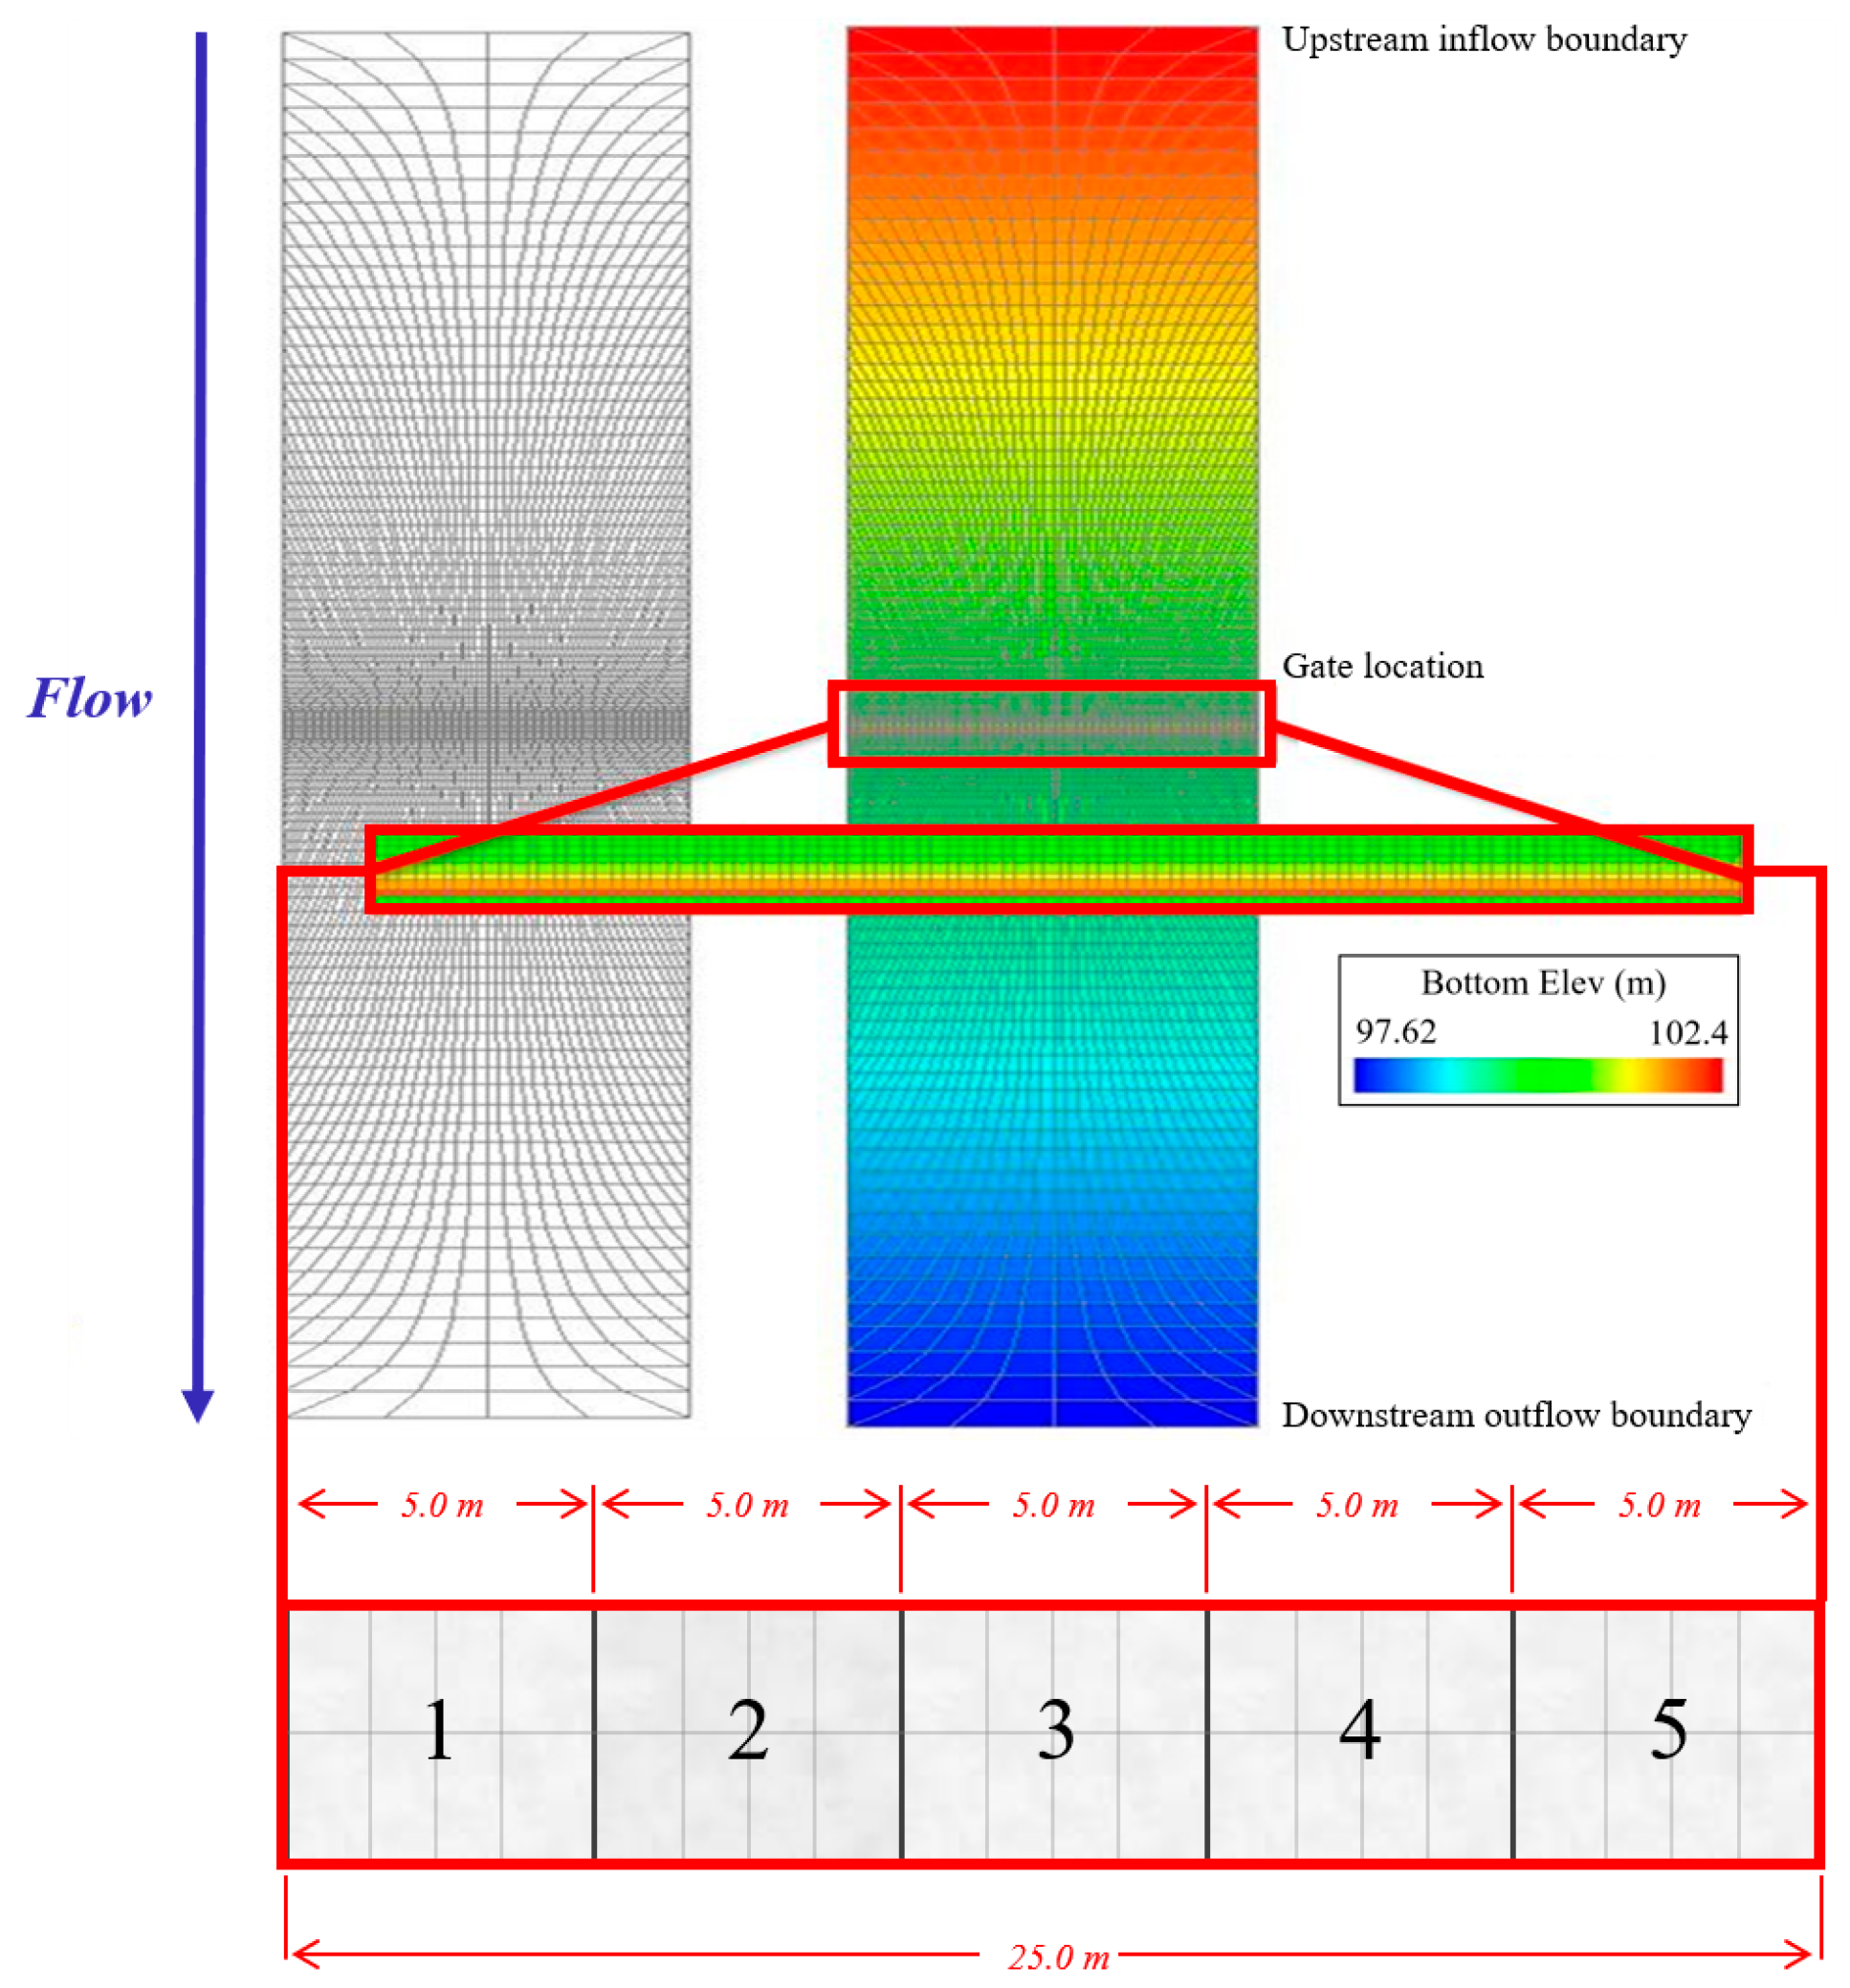
3/s was applied under ordinary-flow and steady-state conditions. Because this discharge represents a flow-duration-based ordinary-flow condition rather than a frequency-based design event, a recurrence interval was not assigned. The adopted discharge provides a common ordinary-flow condition for comparing the hydraulic response among the selective gate-operation scenarios. The computational domain was set to 25.0 m in the transverse direction and 150.0 m in the longitudinal direction. The grid size ranged from 0.25 m × 0.25 m near the SRS gate to 2.65 m × 6.225 m in the outer domain. A total of 5896 grid cells were used, including 600 cells assigned to the SRS gate region. Local refinement was concentrated around the SRS gate, where the minimum horizontal grid size corresponded to approximately 20 cells across each 5.0 m gate span. The same grid configuration was applied to all gate-operation scenarios to provide a consistent numerical basis for comparative evaluation of flow redistribution. However, a formal grid-convergence study using systematically refined meshes was not performed in the original numerical analysis. Accordingly, mesh independence of the absolute peak velocities and derived hydraulic forces cannot be established, and these quantities should be interpreted with respect to the adopted spatial resolution. The elevation range of the model was 4.75 m, from EL. 97.63 m to EL. 102.38 m, and a curvilinear orthogonal coordinate system was applied to represent the channel and gate region, as shown in
Figure 2.
Four operating scenarios were defined to represent different selective-discharge conditions.
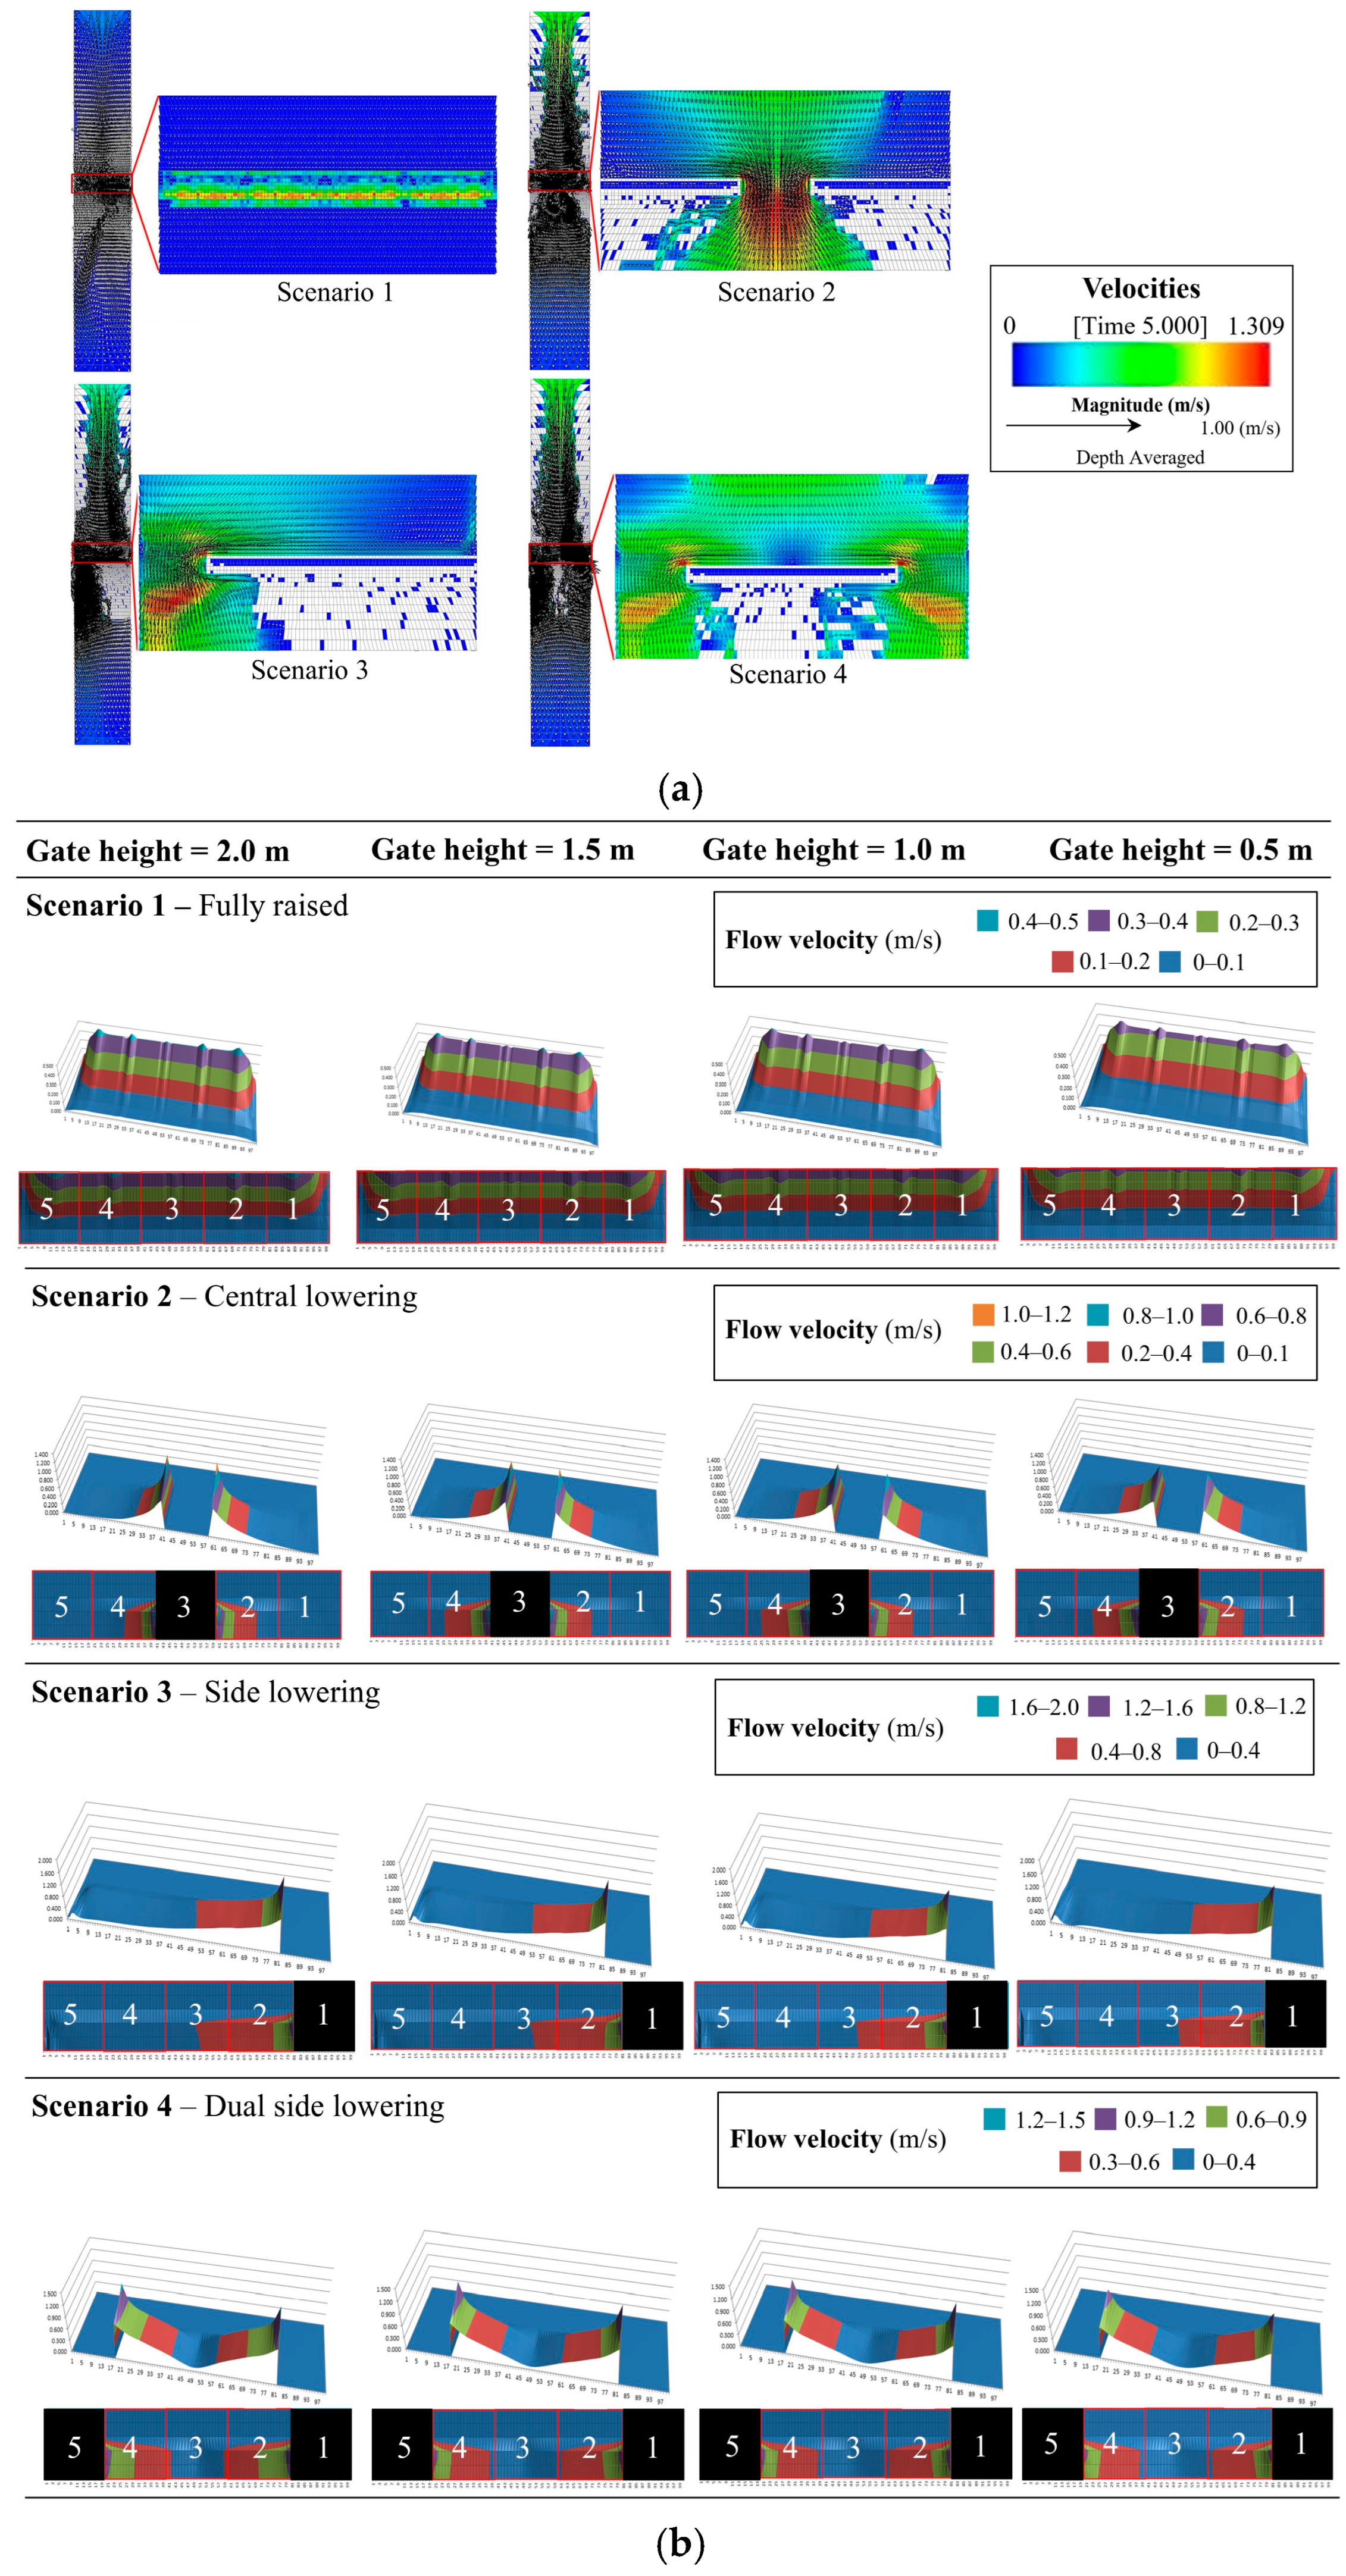
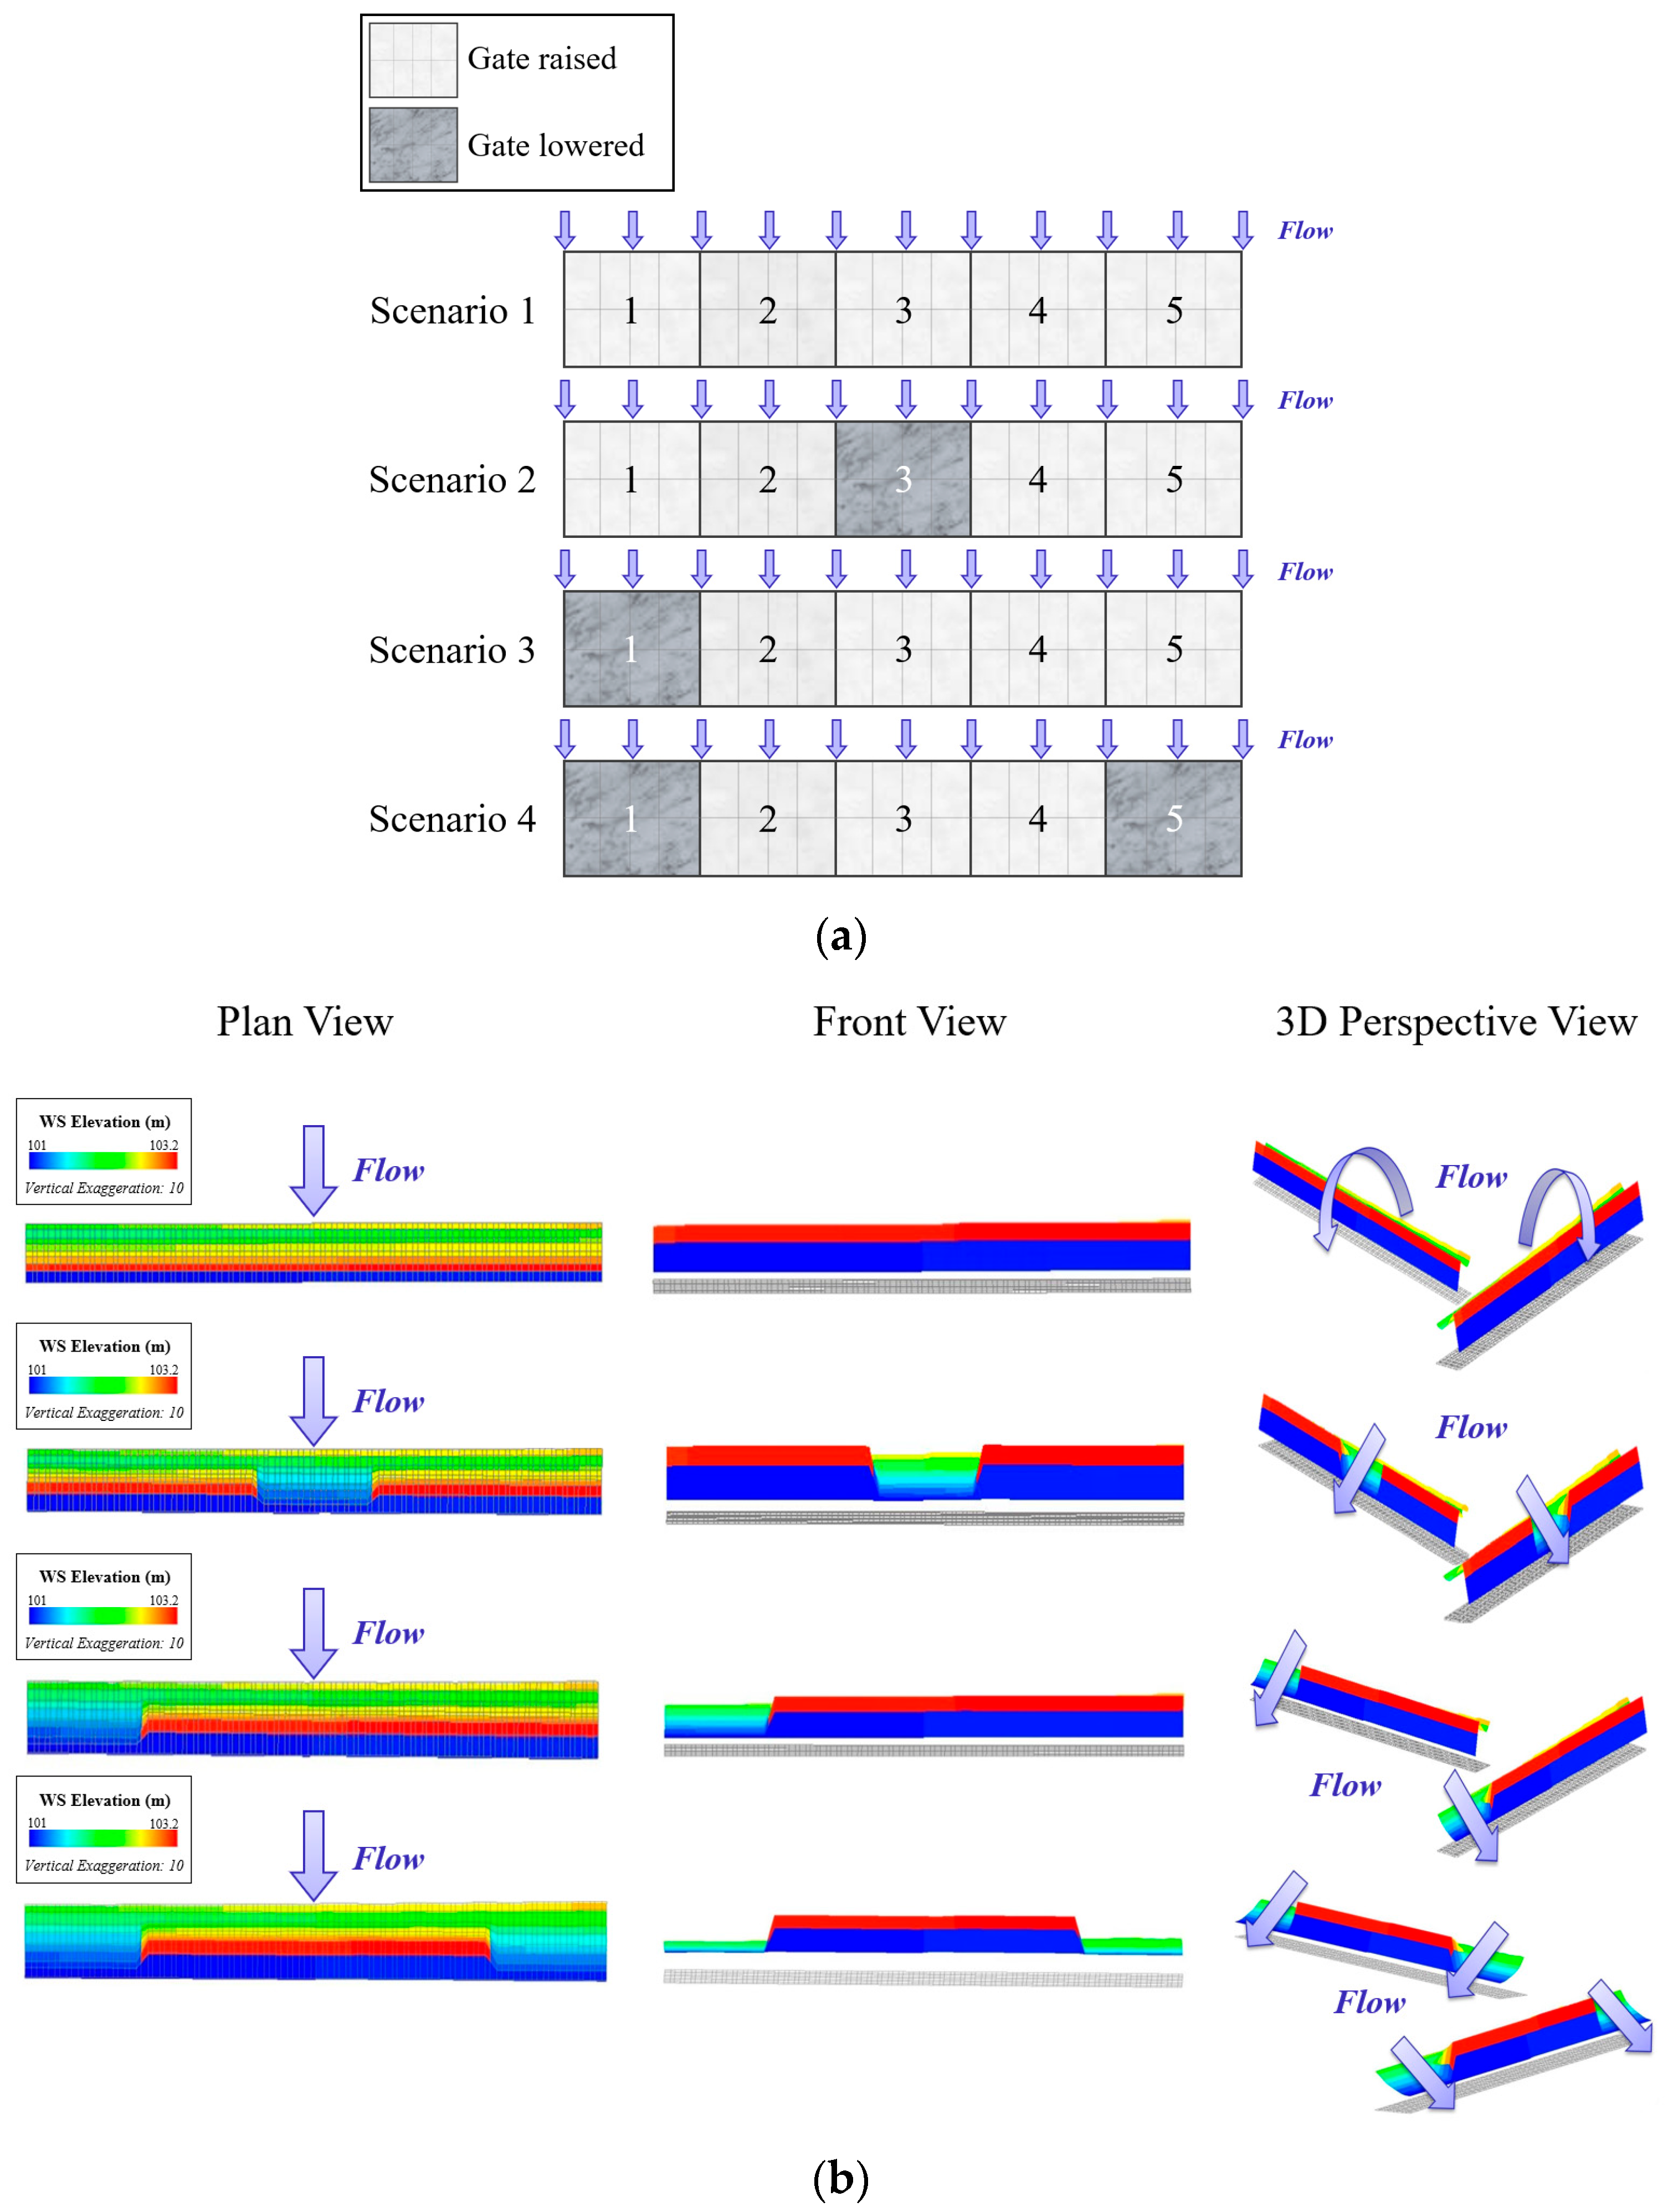
Figure 3a provides a schematic representation of the raised and lowered gate positions, while
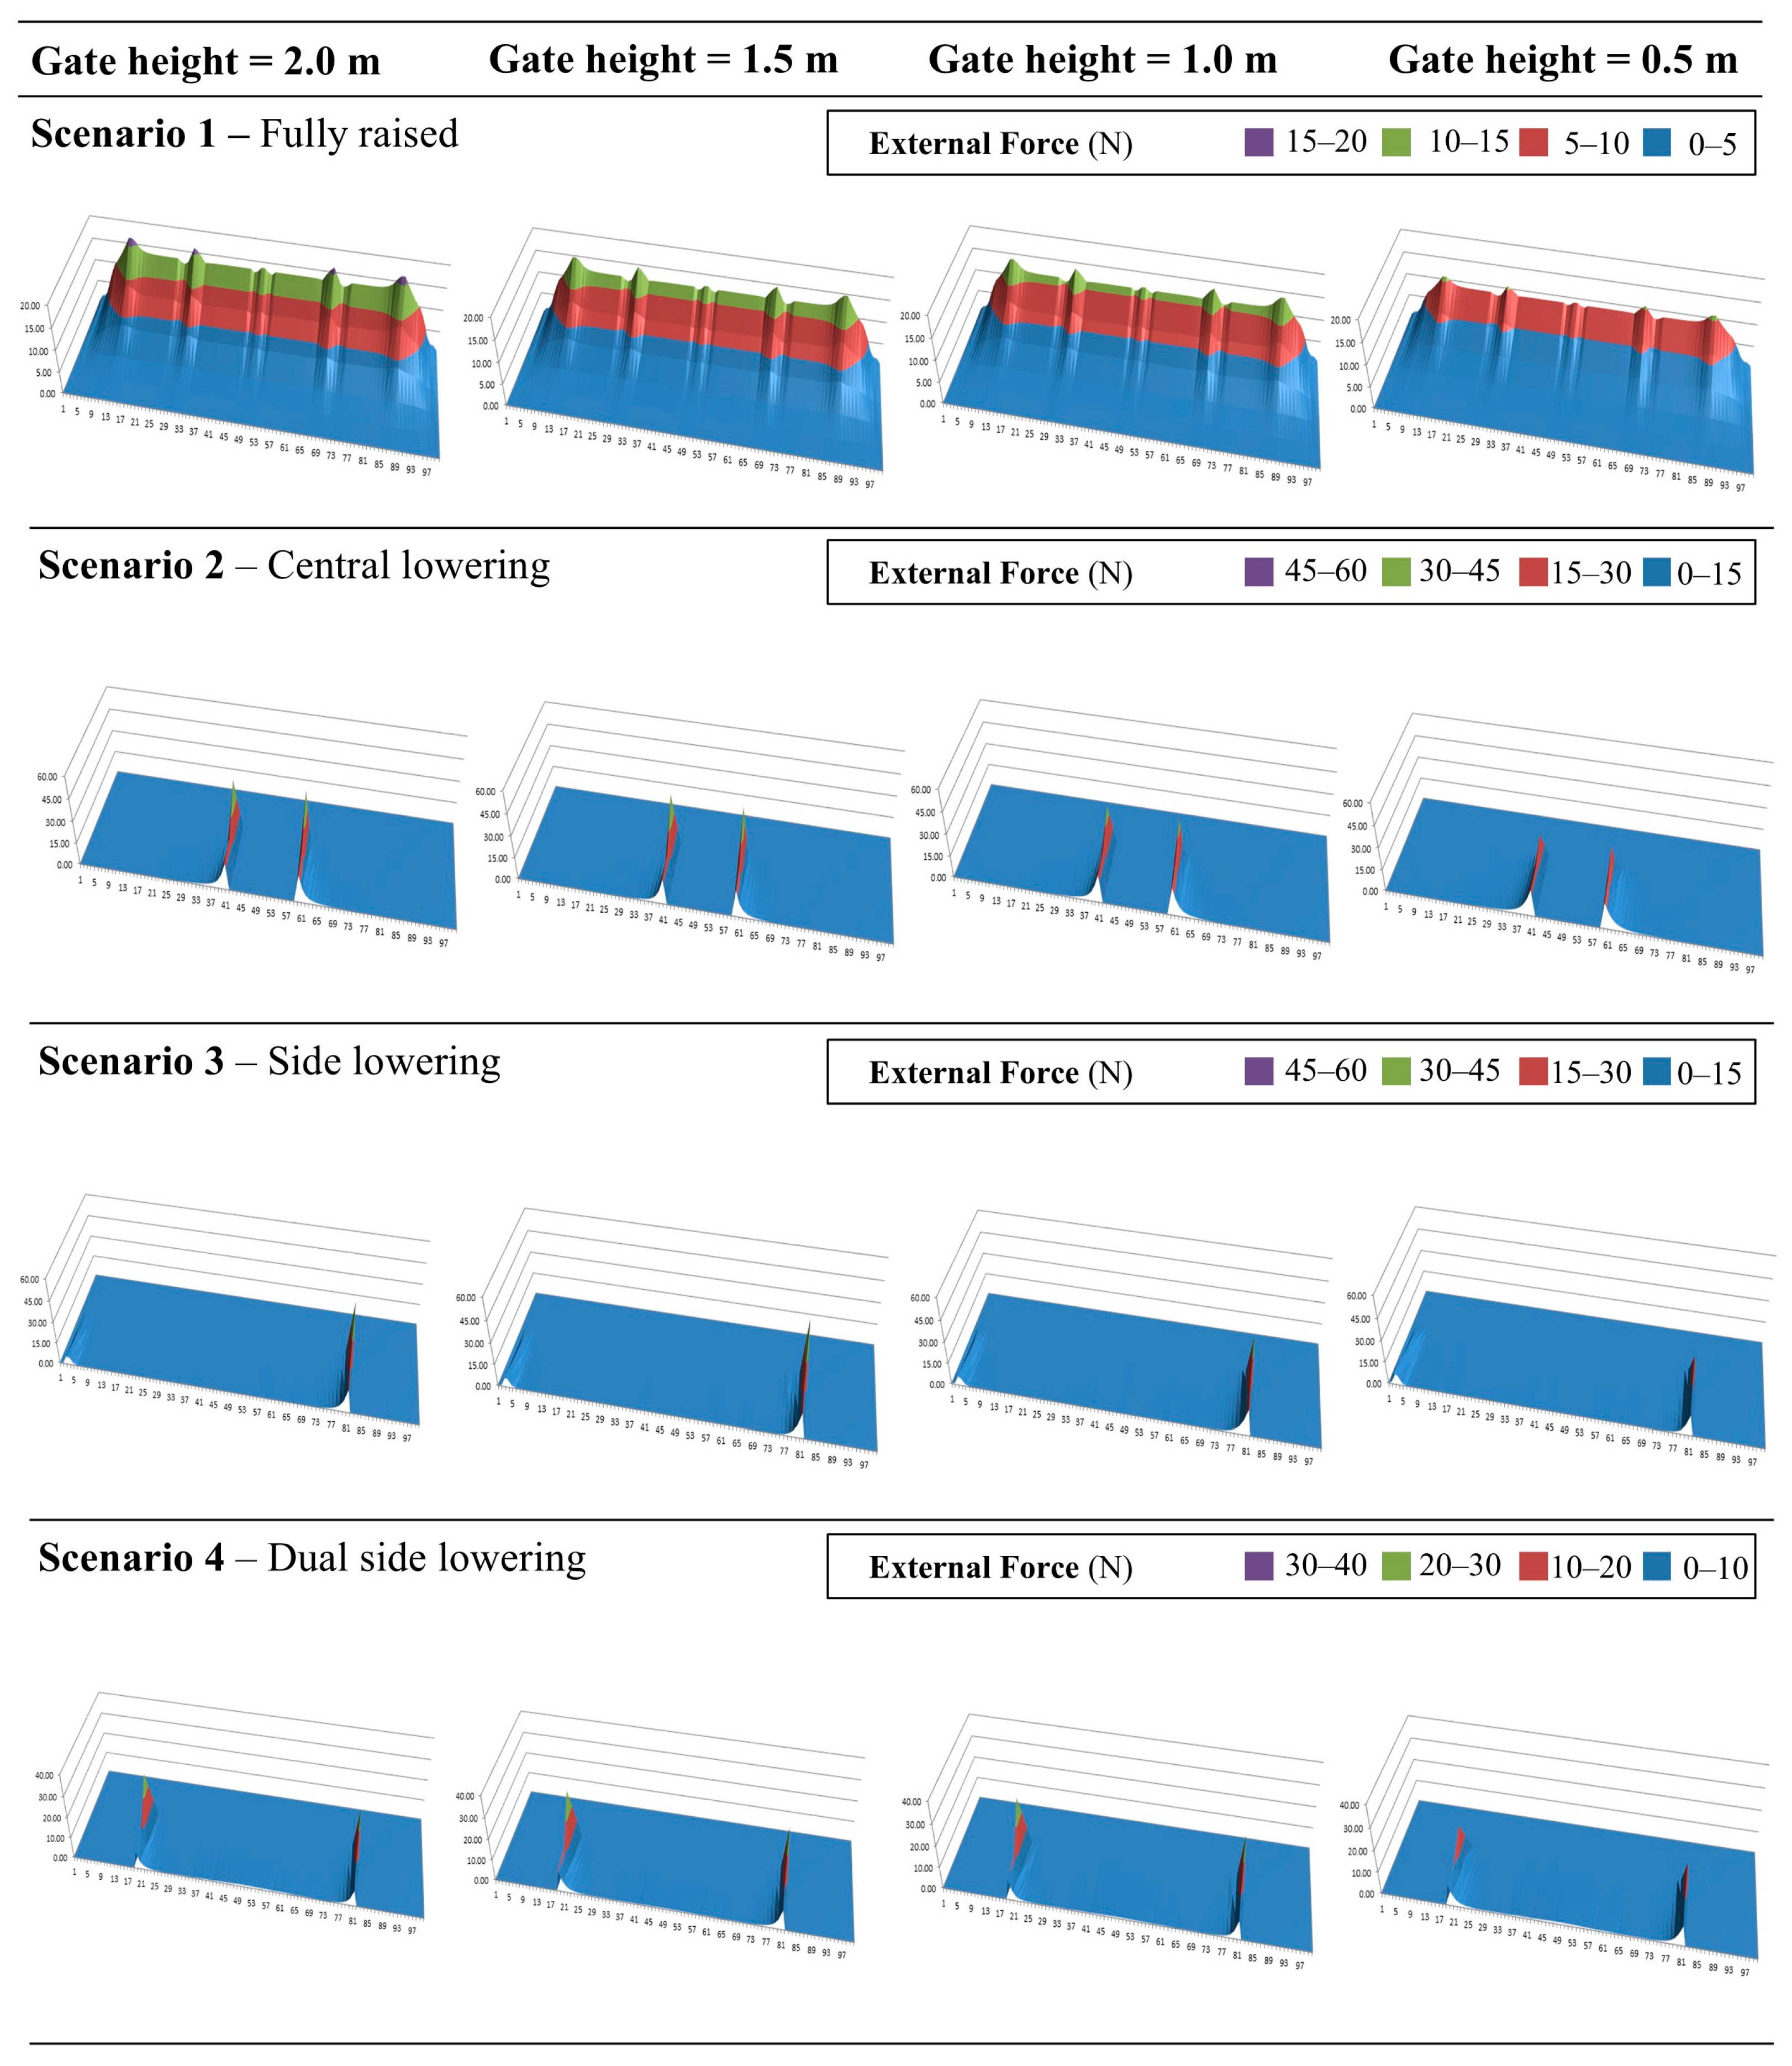
Figure 3b shows the corresponding EFDC model configurations in plan, front, and 3D perspective views. Scenario 1 represents the fully raised condition, in which Gates 1–5 are raised. Scenario 2 represents central lowering, in which Gate 3 is lowered while Gates 1, 2, 4, and 5 remain raised. Scenario 3 represents side lowering, in which Gate 1 is lowered while Gates 2–5 remain raised. Scenario 4 represents dual-side lowering, in which Gates 1 and 5 are lowered while Gates 2–4 remain raised. These scenarios were selected to compare distributed overflow under the fully raised condition with concentrated discharge through selected lowered gate spans.
2.2. Hydraulic Loading and External-Force Derivation
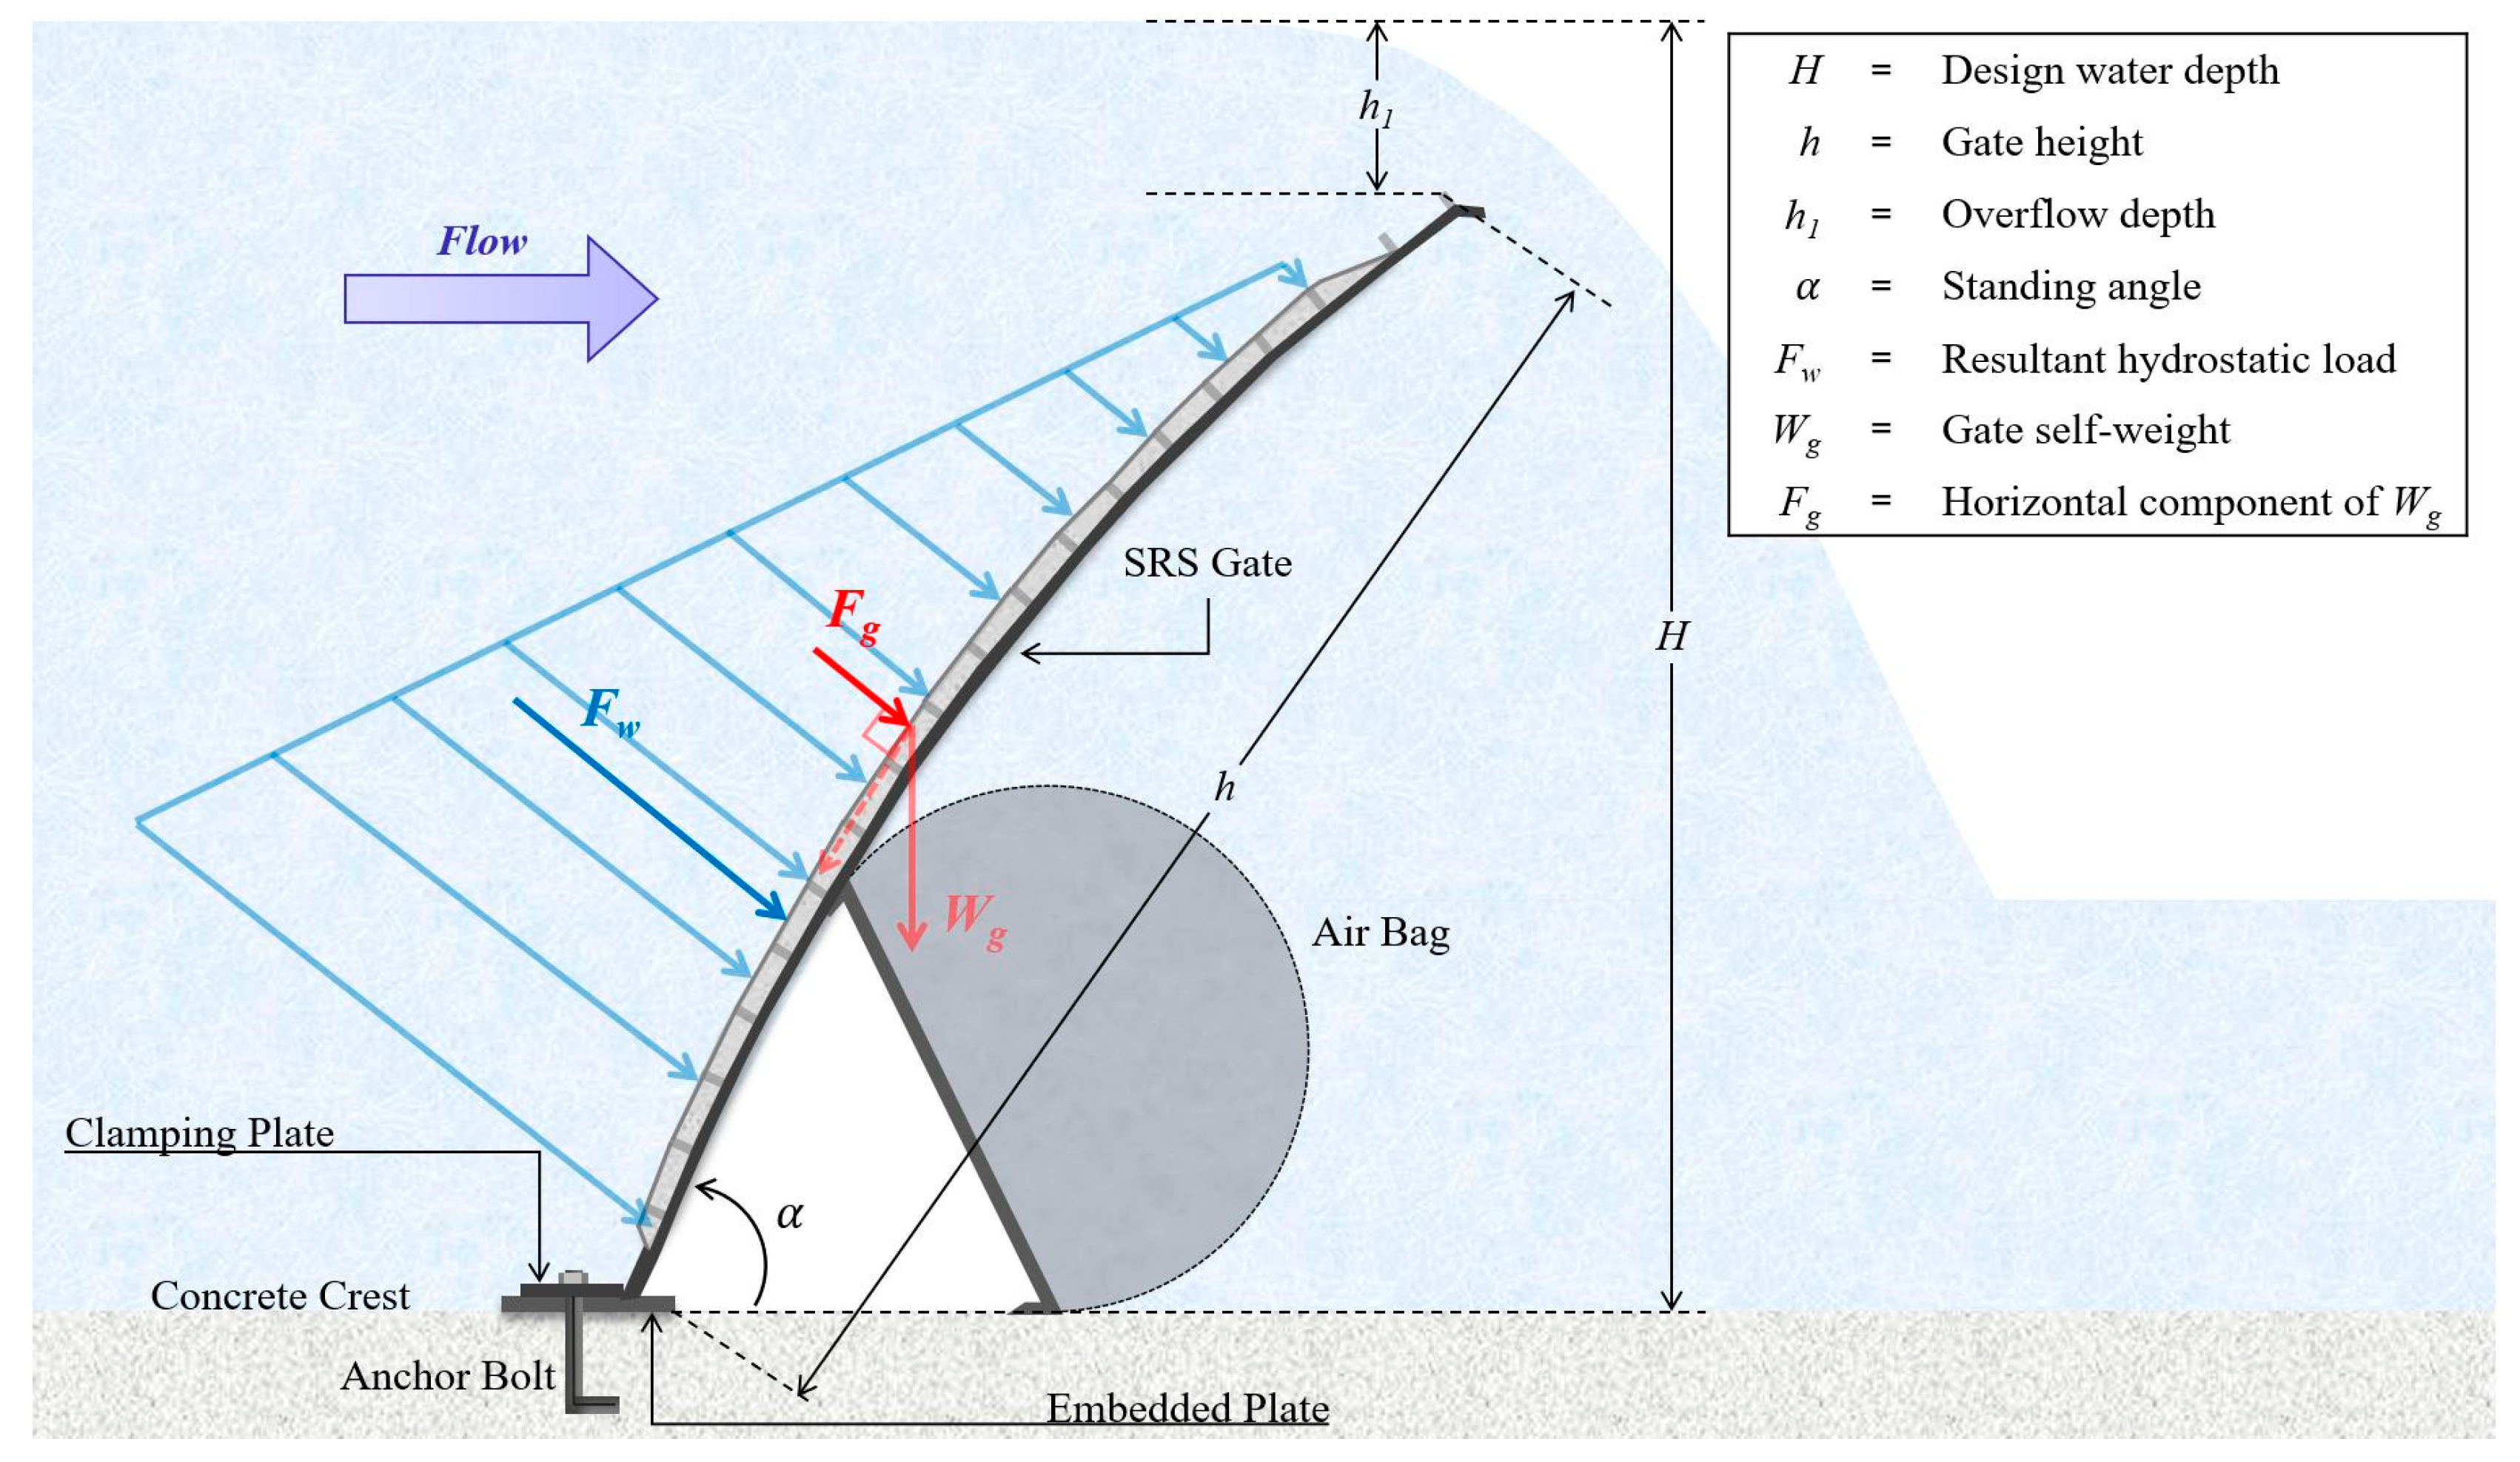
Figure 4 illustrates the primary loads acting on the SRS gate: the hydrostatic pressure induced by impounded water and the horizontal component of the gate self-weight.
Because the SRS gate is installed at an inclined standing angle, the hydrostatic load acting normal to the gate surface was calculated using the conventional hydrostatic-force formulation for a submerged inclined surface [
23]:
where
is the hydraulic load acting on the gate (in kN),
is the unit weight of water (in kN/m
3),
is the gate width (in m),
is the design water depth (in m),
is the overflow depth (in m), and
is the standing angle of the gate (in degrees). In this study,
,
,
, and
were set to 9.8 kN/m
3, 5.0 m, 0.4 m, and 50°, respectively. The horizontal component of the gate self-weight was calculated using Equation (2):
where
is the horizontal component of the gate self-weight (in kN) and
is the gate weight (in kN). A gate weight of 3.43 kN (350 kg) was applied. The calculated load components for each gate-height case are summarized in
Table 2.
The flow-induced external-force distribution was derived from the EFDC velocity field using the impulse–momentum relationship [
23]. The simulated velocity vector was decomposed into the x-component parallel to the SRS gate and the y-component normal to the gate. Because the normal component directly contributes to the force acting on the gate surface, the y-component velocity was used to estimate the flow-induced external force as follows:
where
is the flow-induced external force (in N),
is the water density (in kg/m
3),
is the discharge (in m
3/s),
is the EFDC-derived velocity component used for the force calculation (in m/s), and
is the initial velocity (in m/s). In this study,
was set to 1000 kg/m
3, and
was set to 0 m/s to represent the stationary gate/projection wall used as the reference surface. The calculated cell-level external-force distribution was then converted into a conservative span-level force using the maximum cell force:
where
is the maximum force obtained from the divided gate-span cells (in N), and
is the number of cells in one gate span. This procedure provided an equivalent span-level flow-induced load for the subsequent structural safety assessment.
The hydraulic-load formulation adopted in this study represents a steady-state loading condition. Hydrostatic loading, the gate self-weight component, and the momentum-based force derived from the EFDC velocity field were considered, whereas transient pressure fluctuations associated with vortex shedding, flow separation, downstream recirculation, and negative-pressure effects were not explicitly evaluated. Such effects contribute to dynamic loading of hydraulic gates under asymmetric gate-operation conditions [
24,
25] and should therefore be considered in future transient or fluid–structure interaction analyses.
2.3. Structural Modeling of the SRS Gate and Longitudinal-Rib Configurations
The longitudinal ribs of the SRS gate were examined to evaluate their effectiveness in preventing excessive gate deflection under hydraulic loading.
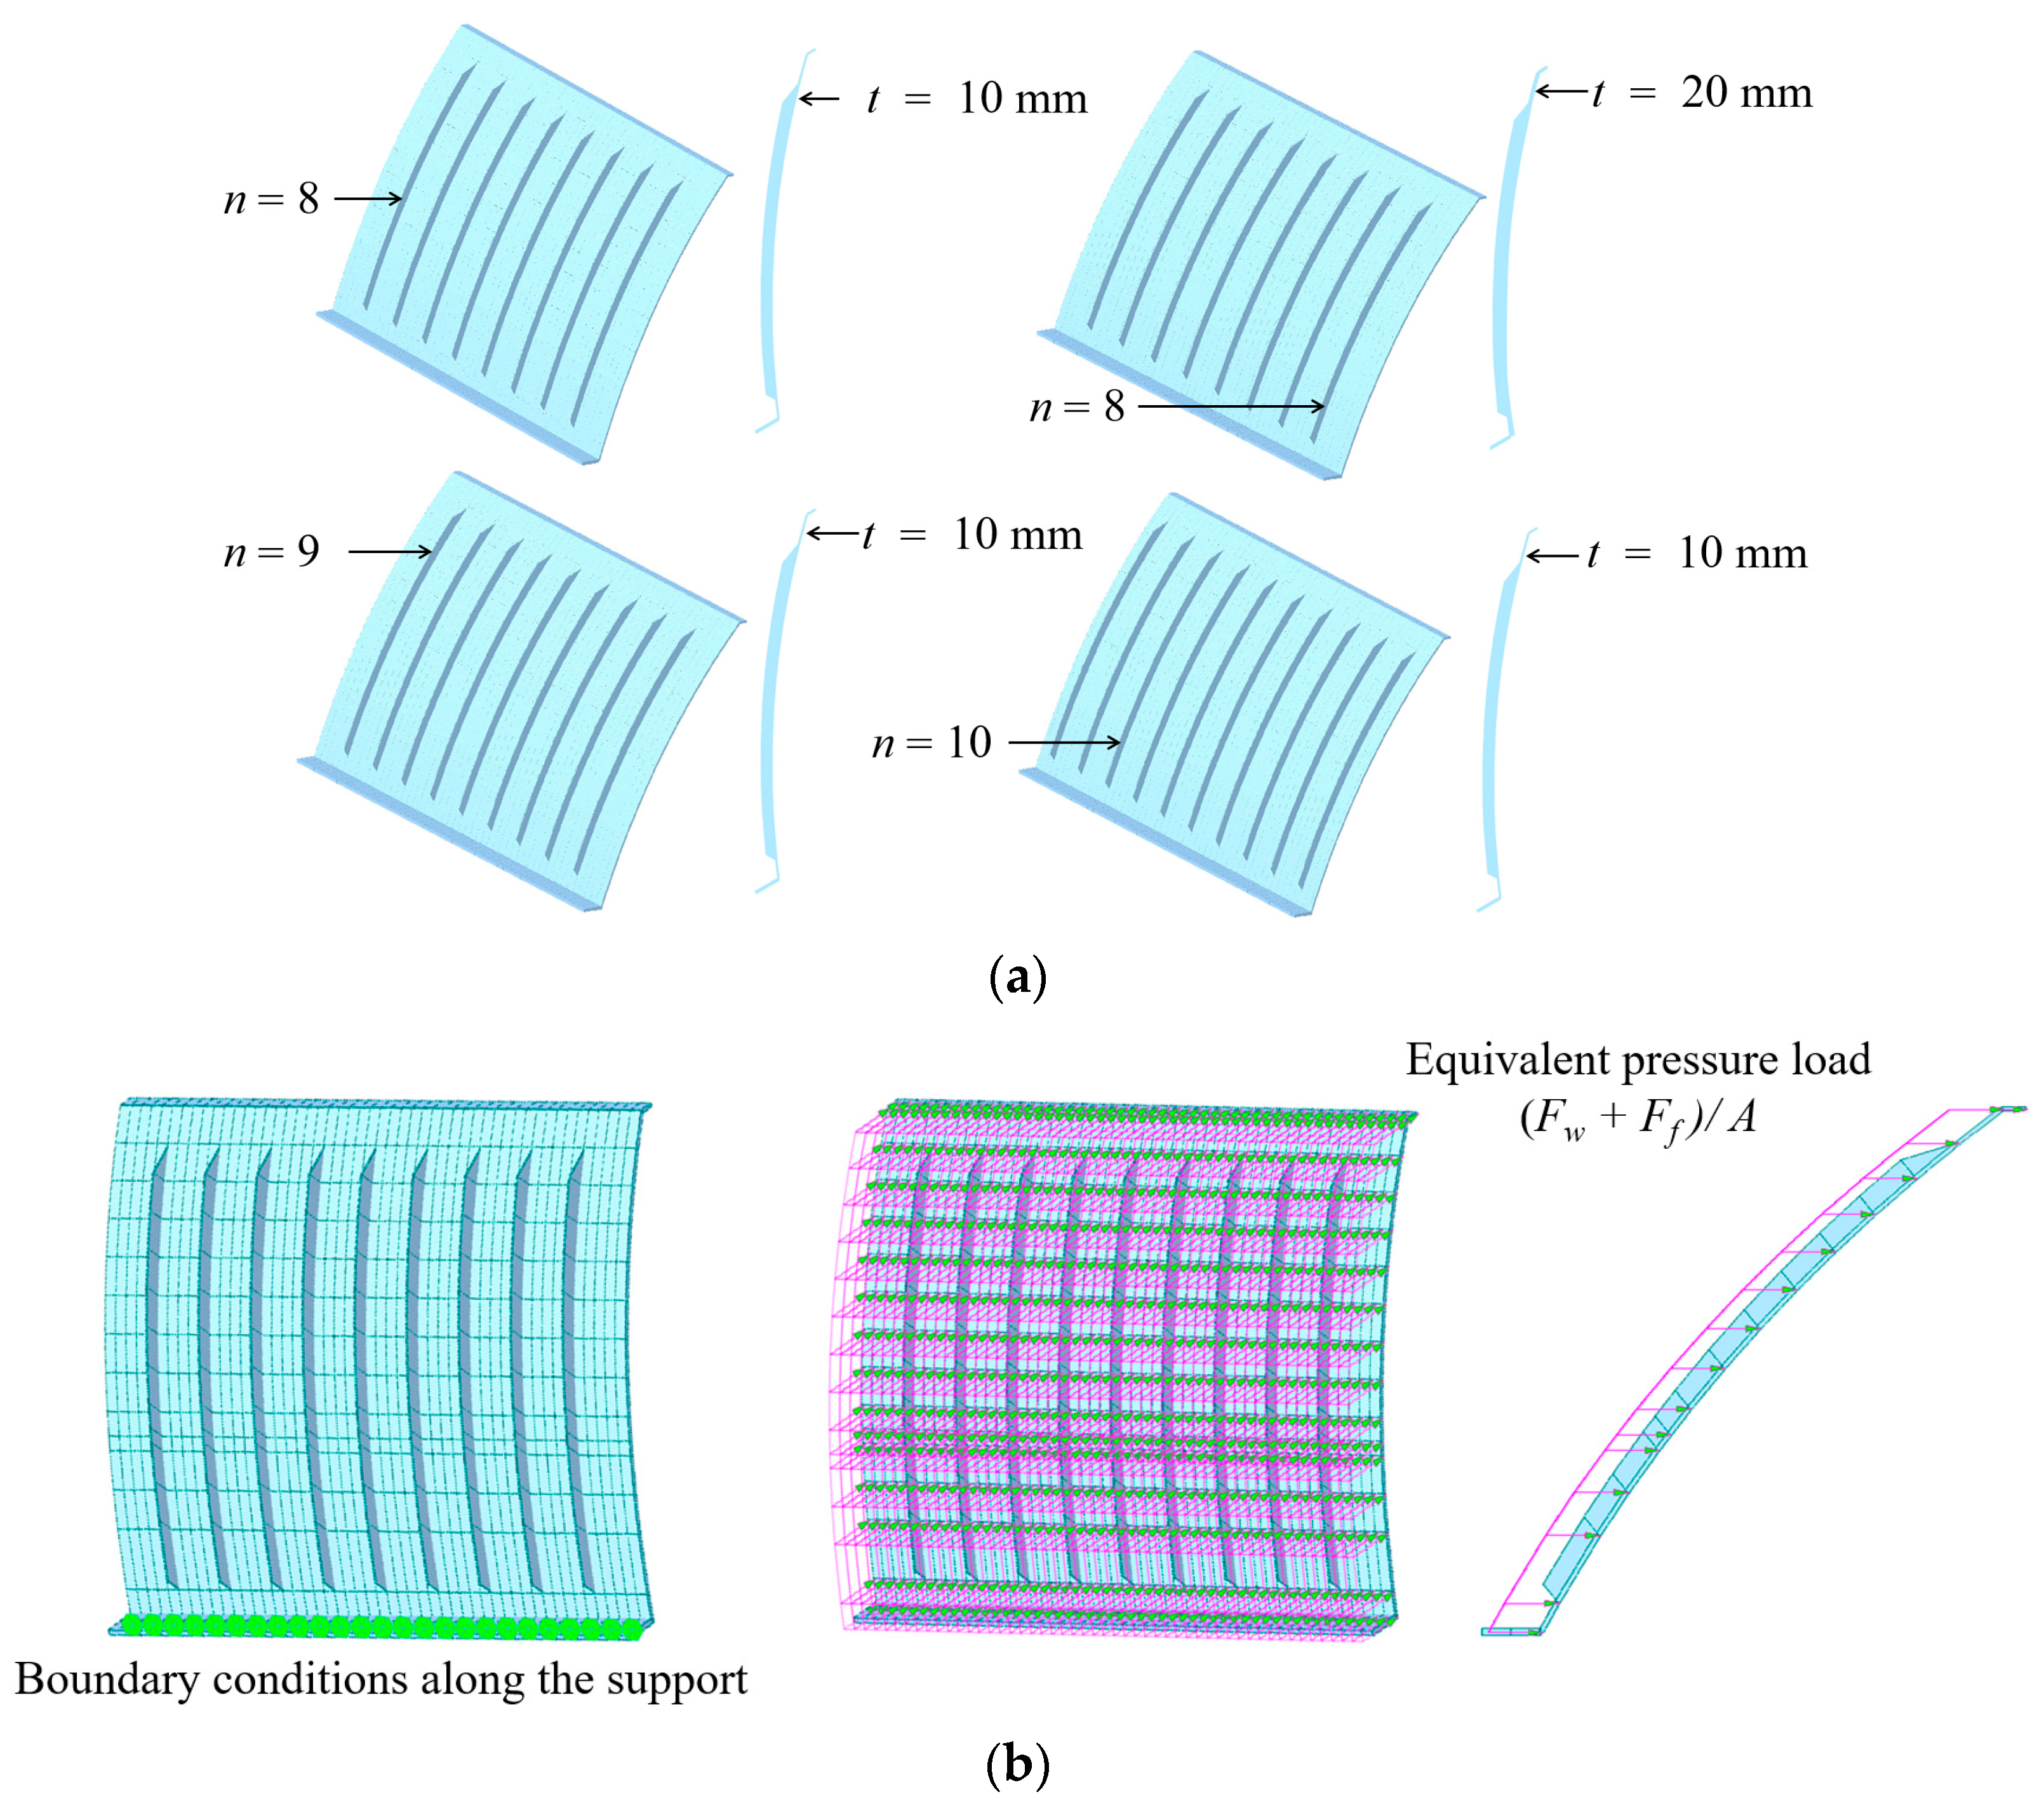
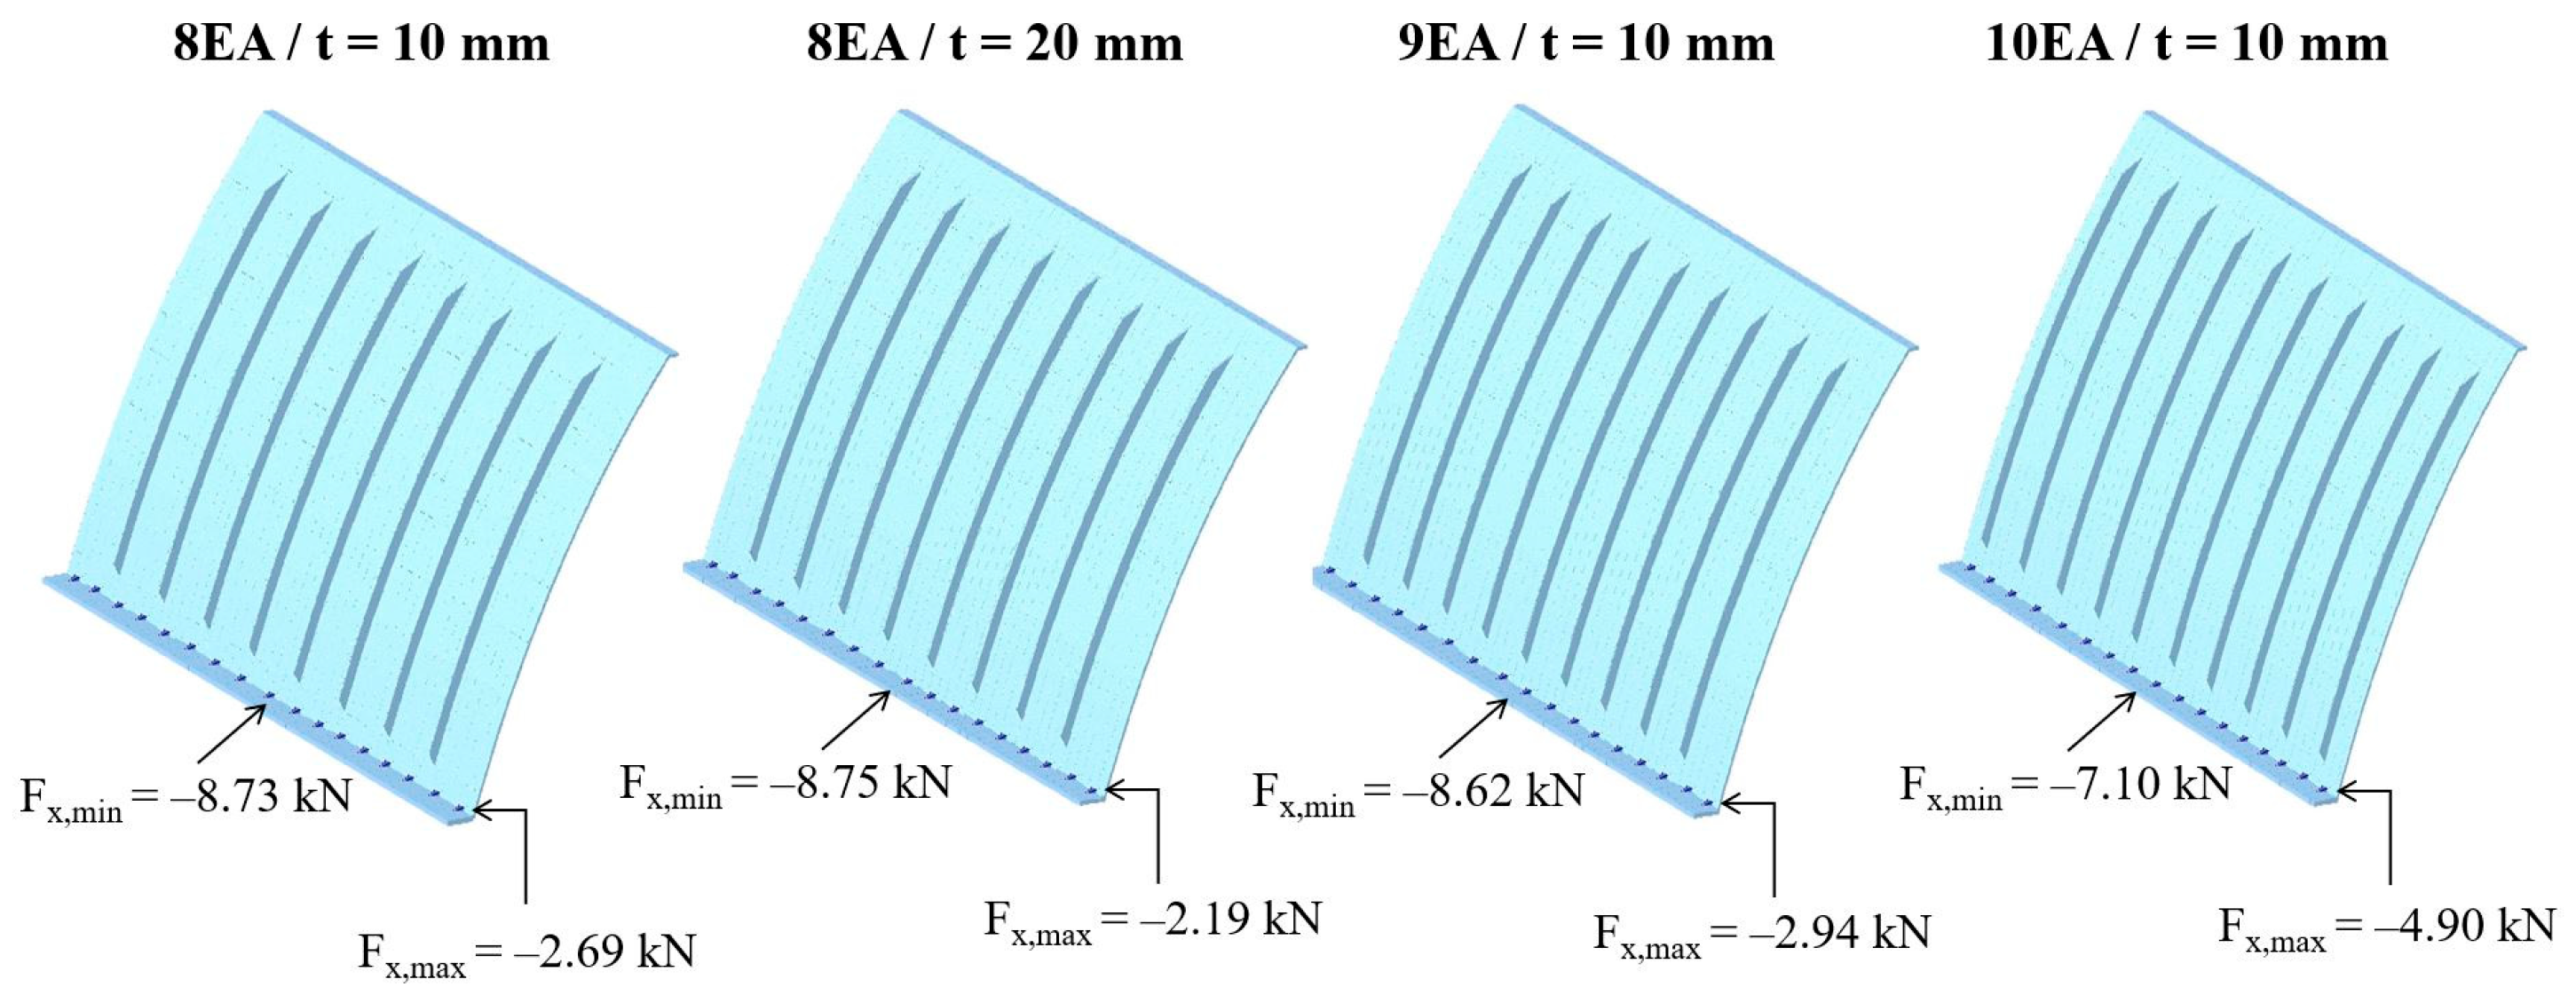
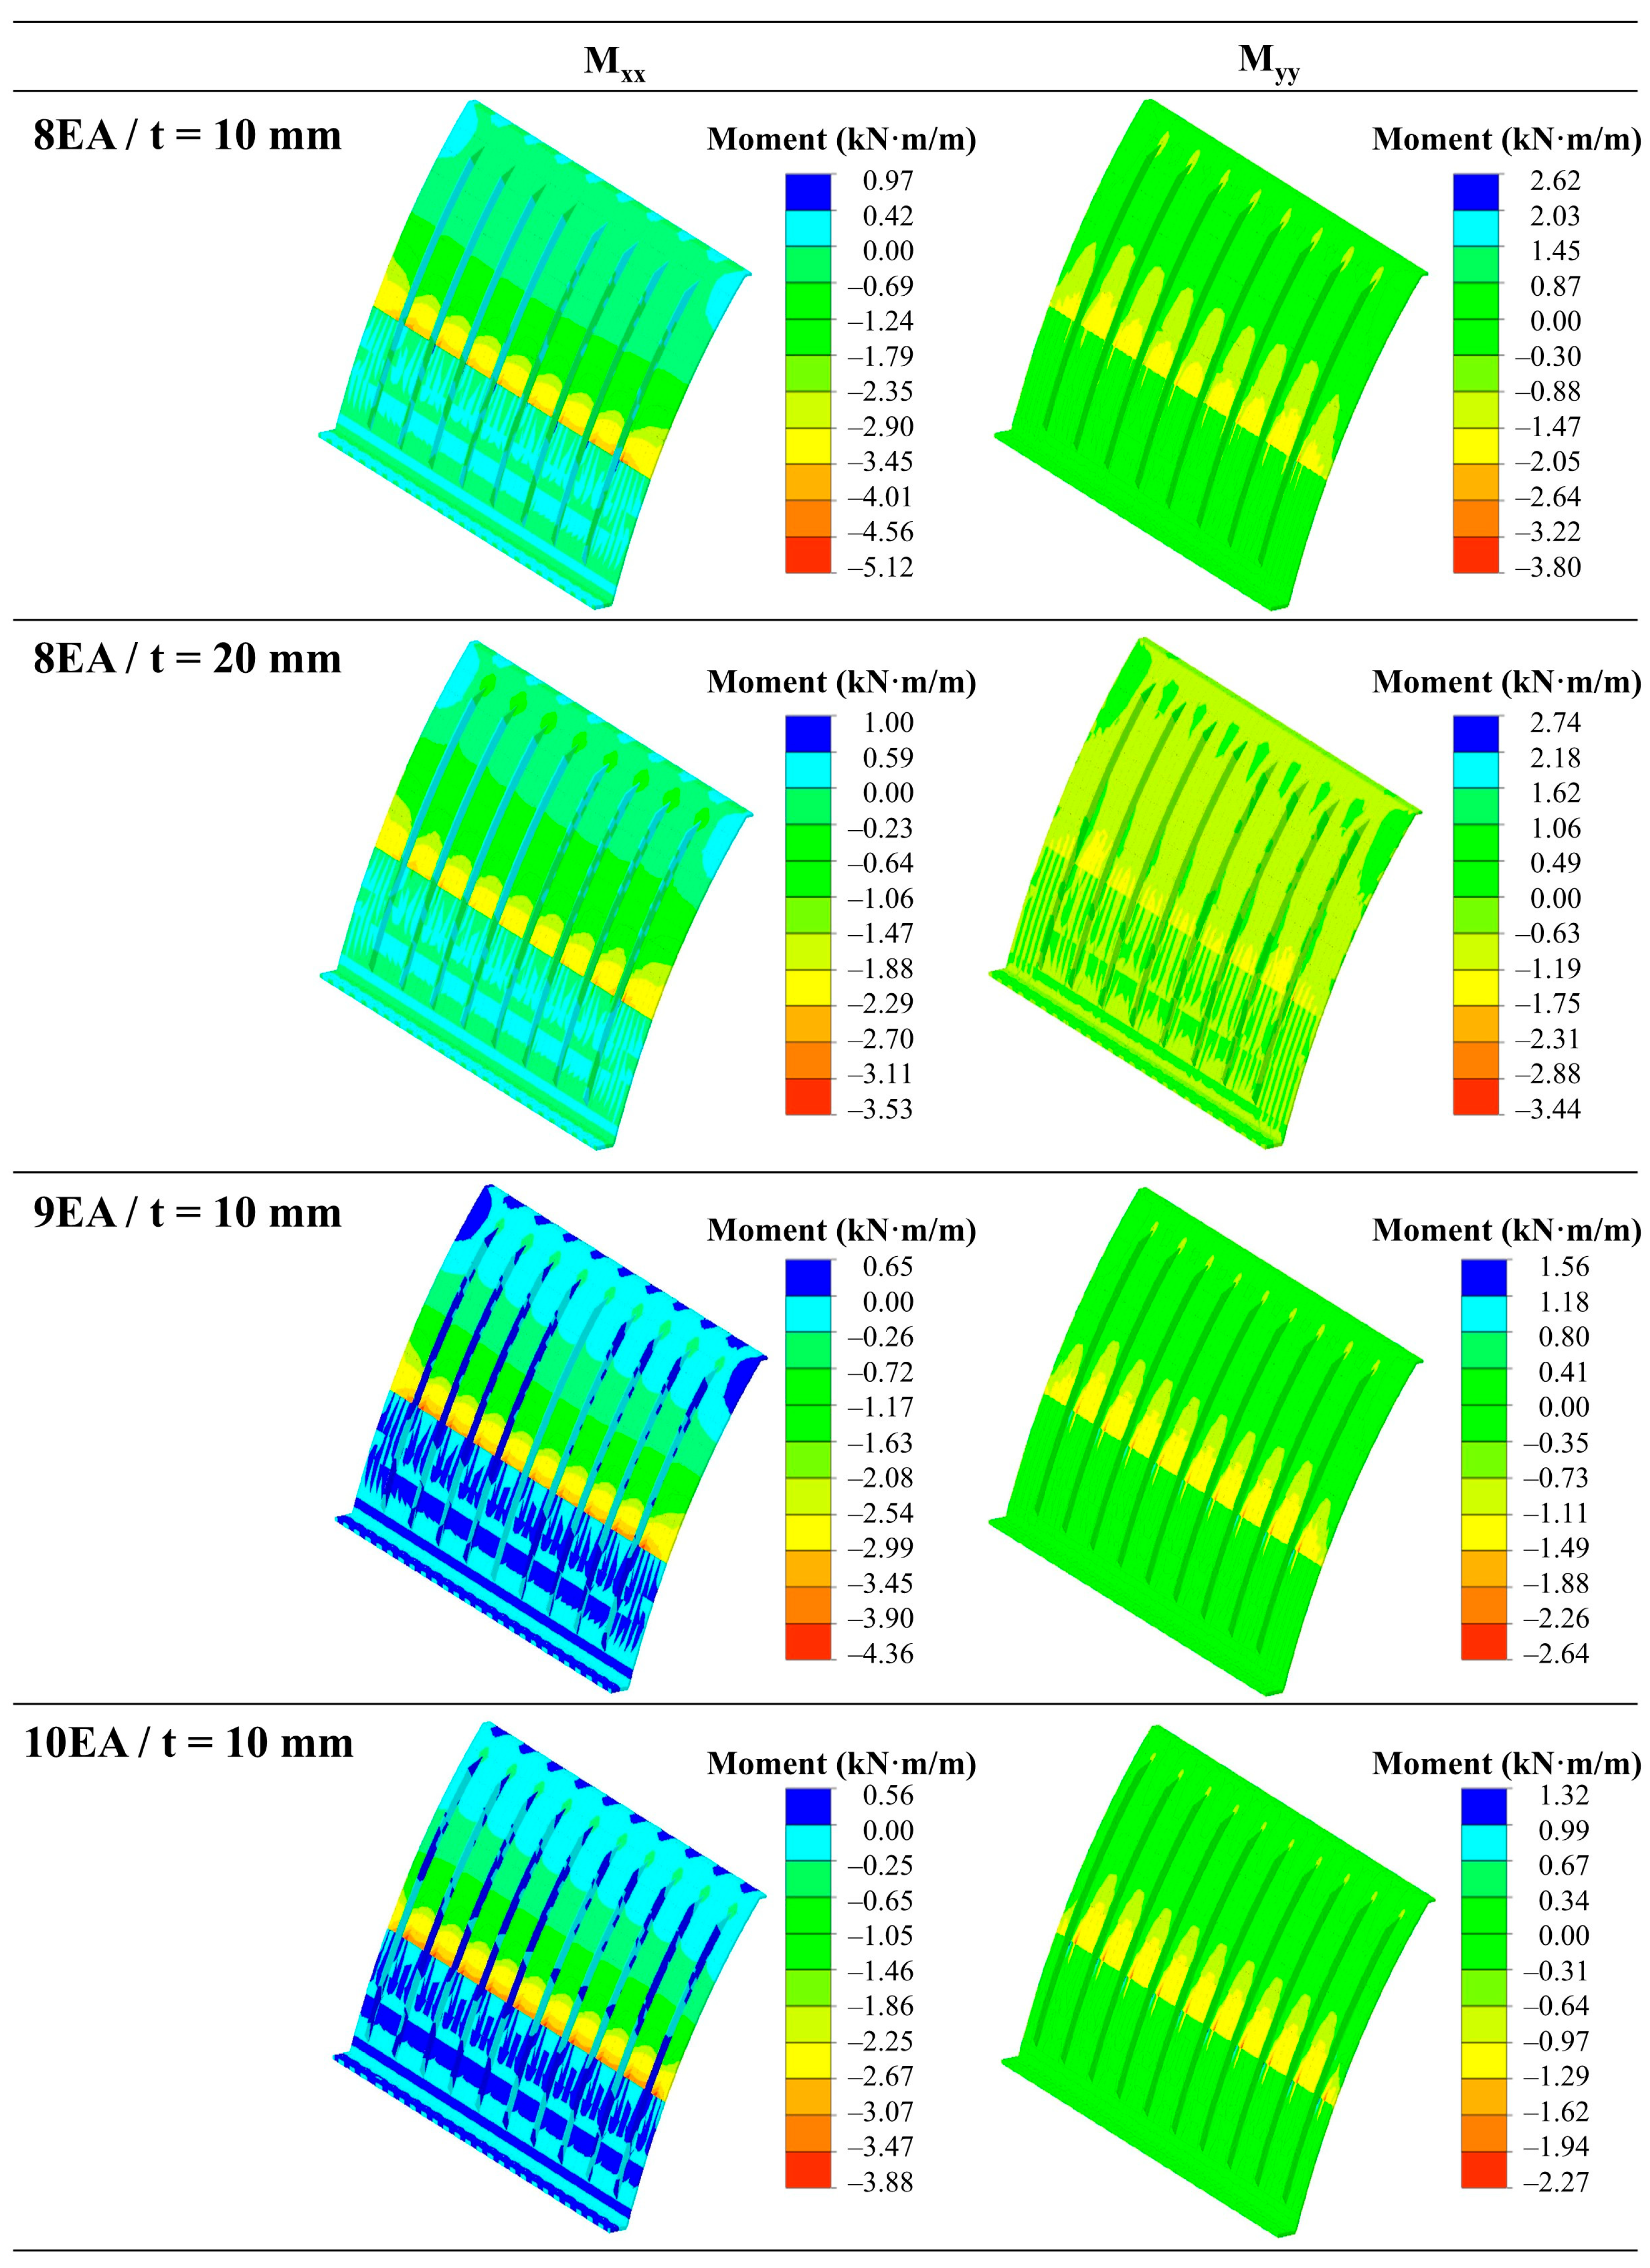
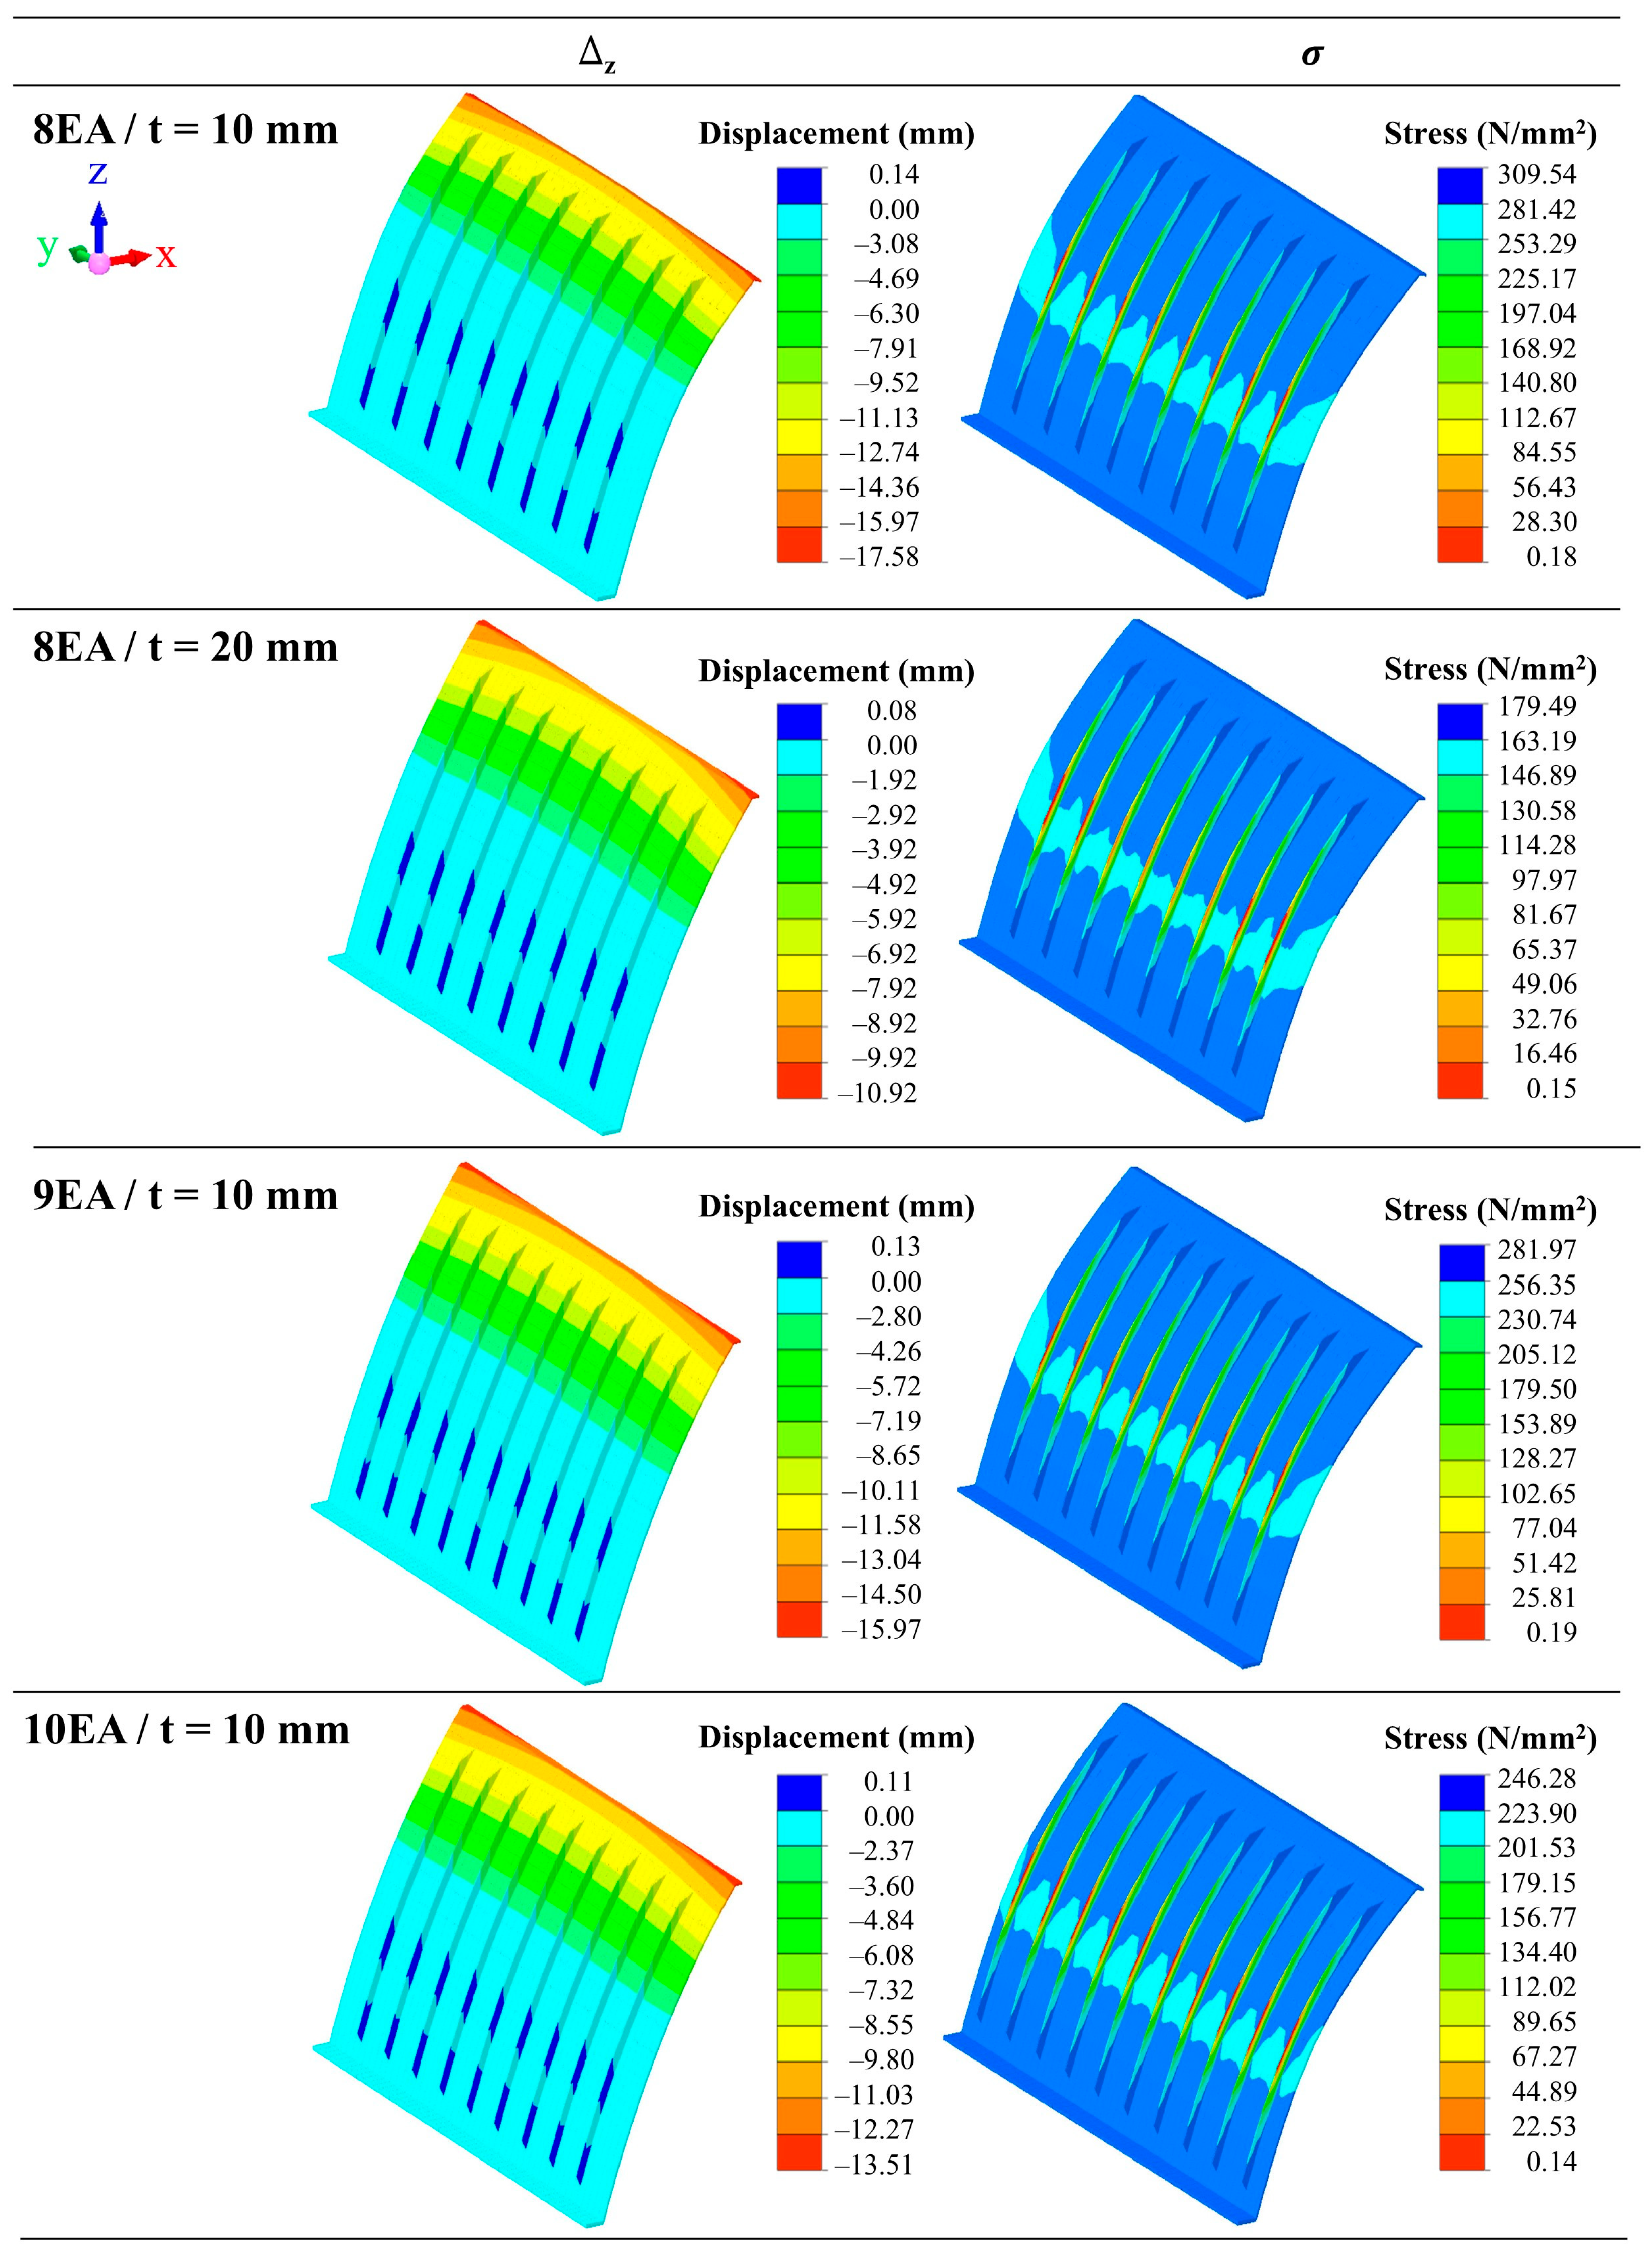
Figure 5a shows the four structural models used to compare the effects of longitudinal-rib number and gate plate thickness: 8EA-10 mm, 8EA-20 mm, 9EA-10 mm, and 10EA-10 mm. These cases were selected to examine the influence of rib quantity and plate thickness on the structural efficiency of the gate. Structural analysis was performed using MIDAS Civil. The reference gate geometry was 4978 mm in width and 2000 mm in height, while the comparative structural models varied the gate plate thickness between 10 and 20 mm according to the evaluated rib configuration.
The structural load was based on the governing hydraulic condition obtained from the three-dimensional flow analysis. The applied load consisted of the hydrostatic load, the component of the gate self-weight acting normal to the gate surface, and the flow-induced external force derived from the EFDC simulation. These load components were combined and converted into an equivalent static pressure load acting on the gate surface. A fixed restraint condition was applied at the actual anchor-bolt locations to idealize the kinematic restraint provided by the anchorage system during the static structural assessment. This boundary representation was adopted because the objective of the MIDAS Civil analysis was to evaluate the global response of the gate panel and longitudinal ribs under the prescribed hydraulic load, rather than to resolve local anchor deformation, bolt slip, or connection flexibility. These were therefore excluded from the finite-element model, while the anchor bolts were evaluated separately through the component-level safety checks described in the following section.
Figure 5b shows the corresponding load application and boundary-condition settings used in the structural model.
2.4. Component-Level Structural Safety Evaluation
After deriving the hydraulic and flow-induced loads, component-level safety checks were performed for the anchor bolts, clamping plates, and airbag of the SRS gate. These components were selected because selective gate operation can concentrate flow near lowered gate spans, increasing localized loading on the gate-support and sealing system.
2.4.1. Anchor Bolts
The anchor bolts were evaluated in terms of applied load and tensile stress. First, the total load acting on one gate span was converted into the load per unit gate width. Because five anchor bolts were considered for one gate span, the load acting on one anchor bolt was calculated as follows:
where
is the load acting on one anchor bolt (in kN),
is the total load (
) per 5.0 m gate width (in kN/m), and
is the number of anchor bolts (5EA). The safety factor against the applied load was calculated using the allowable bolt resistance:
where
is the safety factor of the anchor bolt,
is the allowable stress of the bolt material taken as 21 kgf/mm
2, and
is the effective bolt area, set as 245 mm
2.
The tensile force acting at the bolt axis was considered as the sum of the tensile force induced by the design load and the tensile force caused by nut tightening:
where
is the total tensile force at the bolt axis (in kN),
is the tensile force induced by the design load (in kN), and
is the tensile force induced by nut tightening (in kN). The design-load-induced tensile force was calculated as follows:
where is
the anchor-bolt spacing (in m) and
and
are the distances from the anchor bolt to both ends of the clamping plate (in m). In the study,
0.2 m and
0.09 m were applied.
The tightening-induced tensile force was calculated from the conventional torque–preload relationship [
26]:
where
is the tightening torque (in kN·m),
is the torque coefficient, and
is the nominal bolt diameter given by 24 mm. The tensile stress of the anchor bolt was then calculated as:
where
is the tensile stress in the anchor bolt (in MPa) and
is the effective cross-sectional area given by 3.53 cm
2. The tensile safety factor was calculated as:
where
is the reference failure stress of the bolt material, which was taken as 520 MPa corresponding to the tensile-strength level of STS304/Type 304 stainless steel.
For this study, a target safety factor of 3.0 was adopted as a conservative component-level screening criterion for the anchor-bolt checks. International anchorage design references emphasize that anchor systems should be evaluated with respect to relevant loading conditions and failure modes, including steel failure, concrete-related failure, pull-out, and combined actions [
27]. Modern anchorage design frameworks generally use limit-state or partial-safety-factor formats rather than a single global safety factor [
28]. However, an overall safety factor of 3.0 has also been used in allowable-stress-based anchor-bolt design practice to convert characteristic anchor resistance into design resistance [
29]. Therefore, the adopted value of 3.0 was used only to screen the component-level safety of the SRS gate under the analyzed load cases and should not be interpreted as a replacement for project-specific code-based anchor design.
2.4.2. Clamping Plates
The clamping plates were evaluated against bending failure. The total bending moment acting on the clamping plate was calculated as the sum of the bending moment induced by nut tightening and the bending moment induced by the design tensile force:
where
is the total bending moment (in kN·cm),
is the bending moment due to nut tightening (in kN·cm), and
is the bending moment due to design tension (in kN·cm). The tightening-induced bending moment was calculated as:
where
is the tightening-induced tensile force (in kN) and
is the width of the clamping plate (18 cm). The bending moment due to design tension was calculated as:
where
is the tensile force induced by the design load (in kN). The maximum bending stress of the clamping plate was calculated using the conventional flexure relation [
30] and the effective section modulus:
where
is the maximum bending stress of the clamping plate (in MPa),
is the effective section modulus (in cm
3),
is the clamping-plate length (100 cm),
is the number of anchor bolts,
is the anchor-bolt diameter (2.4 cm), and t is the clamping-plate thickness (2.5 cm). This calculation represents a global bending-stress check of the clamping plate based on the effective net section after deducting the anchor-bolt openings. The nominal safety factor against permanent deformation of the clamping plate under global bending was calculated as:
where
is the specified 0.2% proof strength of the Type 304 stainless-steel clamping plate, given by 210 MPa [
31]. The resulting
therefore represents a nominal proof-strength-to-stress ratio for global bending. Similarly to the anchor-bolt assessment, a nominal safety factor of 3.0 was adopted as the screening criterion for the clamping-plate global bending assessment.
2.4.3. Airbag
The internal pressure of the airbag was evaluated to verify whether the airbag could resist the overturning action generated during SRS gate operation. The pressure was calculated by considering the overturning moments induced by the hydrostatic load, the gate self-weight component, and the flow-induced external force. Based on static moment equilibrium about the gate rotation axis [
32], the required internal air pressure was determined as follows:
where
is the internal air pressure of the airbag (in MPa),
is the overturning moment caused by hydrostatic loading (in kN·m),
is the overturning moment caused by the gate self-weight component (in kN·m),
is the overturning moment caused by the flow-induced external force (in kN·m), and
is the sectional first moment of the airbag-to-gate contact surface about the rotation axis (in m
3).
The sectional first moment of the contact surface was calculated as:
where
is the contact length between the airbag and the gate (in cm),
is the unit gate width (in cm), and
is the length of the contactless region (in cm). This defines the first moment of the effective airbag-to-gate contact area about the gate rotation axis, which relates the internal air pressure to the resisting moment. A larger effective contact moment
reduces the pressure required to balance a given overturning moment, whereas a larger contactless region reduces the effective contact contribution. The contactless length was calculated using:
where
is the corner angle of the contact surface (in degrees) and
is the standing angle of the gate (in degrees). In this study,
= 12 cm,
= 500 cm, and
were applied, giving
and
= 9.21 cm.
The overturning moment caused by hydrostatic loading was calculated as:
where
is the unit weight of water (in kN/m
3),
is the design water depth (in m),
is the overflow depth (in m), and
is the standing angle (in degrees). The overturning moment caused by the gate self-weight component was calculated as:
where
is the component of the gate self-weight acting in the hydraulic-load direction (in kN) and
is the distance from the rotation center to the gate centroid (in m). The overturning moment caused by flow-induced loading was calculated as:
where
is the flow-induced external force (in kN) and
is the distance from the rotation center to the point of action of the flow-induced force (in m).
The calculated internal air pressure was then compared with the reinforcing-fabric strength of the airbag to evaluate pressure resistance under the modeled gate-height conditions. For the airbag safety evaluation, the calculated internal air pressure, , was compared with the reference reinforcing-fabric strength of the airbag, 180 kgf/cm2 (or 17.65 MPa), which was used as the material-strength criterion in the design calculation. Public rubber-dam bladder specifications report tensile-strength requirements of the same order of magnitude, with tensile strength at break values commonly reported in the range of approximately 12–19 MPa depending on rubber layer, aging condition, and test condition.
2.5. Modeling Assumptions and Scope
The numerical framework was developed as a steady-state, one-way hydraulic-to-structural assessment. The EFDC analysis represented the ordinary-flow steady-state condition adopted for the original model, and the channel bed and banks were treated as fixed boundaries. Sediment transport, bed or bank deformation, and transient hydraulic pressure fluctuations were not included. Hydraulic loads derived from EFDC were transferred to MIDAS Civil as equivalent static structural loads, while structural deformation was not fed back to the hydraulic model. Accordingly, the fluid–solid interface was not explicitly resolved, and deformation-induced changes in the surrounding flow field and associated two-way fluid–structure interaction effects were outside the scope of the present analysis. The span-level flow-induced force was estimated by applying the maximum cell-level force over the corresponding gate span rather than by spatially integrating the non-uniform EFDC force distribution. Four operating scenarios were evaluated using raised and lowered gate configurations, while the intermediate gate motion associated with airbag inflation or deflation was not included in the reported numerical analysis. In addition, a formal grid-convergence analysis was not performed; therefore, the adopted discretization provides a common basis for scenario comparison but does not establish mesh independence of the absolute peak hydraulic quantities. Future numerical investigations should therefore include systematic grid-sensitivity and convergence analyses to quantify discretization uncertainty in the peak hydraulic quantities, together with transient gate-motion analysis to represent the transition between raised and lowered configurations during airbag inflation and deflation.
In the structural analysis, a fixed restraint condition was applied at the actual anchor-bolt locations as an idealized representation of the anchorage restraint for evaluating the global static response. Local support flexibility, bolt slip, and connection deformation were not explicitly represented and therefore remain outside the scope of the finite-element model. Similarly, the clamping-plate assessment was based on nominal global bending of the effective net section and did not explicitly account for bolt-hole stress concentrations, local bearing/contact stresses, or nonlinear bolt–plate interaction. The airbag–gate interface was not modeled through an explicit nonlinear contact formulation; consequently, friction and normal contact stiffness were not prescribed. Airbag resistance was instead evaluated separately through static moment equilibrium and comparison of the calculated internal-pressure demand with the reinforcing-fabric strength. Accordingly, the current study is a preliminary component-level static structural-safety assessment under the analyzed hydraulic conditions, providing a basis for structurally efficient, resource-conscious, and more sustainable design of river infrastructure.
4. Discussion
4.1. Effect of Selective Gate Operation on Flow Concentration
Selective gate operation substantially altered the spatial distribution of flow across the SRS weir, with the strongest concentration occurring when a single side gate was lowered. Relative to the fully raised condition, side-gate lowering produced approximately a 267% increase in maximum velocity at the 2.0 m gate height. These results indicate that selective operation cannot be represented adequately by uniformly raised or symmetrically operated gate conditions because the location of the lowered span governs the resulting hydraulic response.
The pronounced response in Scenario 3 can be attributed to the asymmetric hydraulic condition created when a single side gate is lowered. Unlike central lowering, where approaching flow can converge toward the opening from both sides, side lowering generates an asymmetric cross-channel contraction that redirects flow toward a bank-adjacent opening. The resulting jet is bounded by the riverbank on one side and an adjacent raised gate on the other, thereby restricting lateral redistribution and producing steep transverse velocity gradients near the side span. This hydraulic mechanism also explains why the gate adjacent to the lowered side span was identified as the governing structural case in the subsequent load assessment. Accordingly, Scenario 3 represents a coupled hydraulic and structural design condition rather than merely the scenario with the highest local velocity.
The hydraulic trends obtained in the present analysis are consistent with published experimental and numerical studies of movable gates. Particle image velocimetry (PIV) experiments on a rising-sector gate showed that gate opening substantially alters the local velocity distribution and produces concentrated velocities near the gate opening [
13]. Similarly, combined experimental and numerical analysis of a multi-plate rotary gate demonstrated that changes in gate configuration redistribute both the flow field and the hydraulic force acting on individual gate plates [
14]. Together, these studies demonstrate gate-operation-dependent redistribution of velocity and hydraulic demand similar to that observed among the SRS spans. However, because the gate geometry, scale, operating mechanism, and hydraulic boundary conditions differ among these studies, the comparison supports the general consistency of the present EFDC results with previous findings rather than direct validation of the model.
The bank-adjacent concentration observed in Scenario 3 may also have implications beyond the structural response of the gate. Near-bank velocity and boundary shear stress are important controls on sediment entrainment and channel adjustment [
47], while experimental studies of gated hydraulic structures have demonstrated that concentrated and asymmetric flow can promote localized scour downstream of the opening [
48,
49]. In the present case, the combination of a bank-adjacent jet, restricted lateral redistribution, and steep transverse velocity gradients under side-gate lowering suggests that repeated operation of this scenario may increase scour susceptibility near the adjacent bank, downstream bed, or apron edge. This implication is particularly relevant where the bed or bank material is readily erodible or where local protection is limited. Because scour magnitude was not directly simulated in the present study, the observed hydraulic concentration should be interpreted as an indicator of potential scour susceptibility rather than as a prediction of erosion depth. To determine whether this hydraulic concentration translates into significant morphological change, repeated-operation effects should be evaluated through morphodynamic modeling or physical experiments.
4.2. Material-Efficient Rib Configuration for SRS Gate Design
The comparison of rib configurations indicates that structural improvement can be achieved through two fundamentally different design strategies: increasing plate thickness or improving stiffener arrangement. Plate thickening increases flexural rigidity directly, but it also increases steel demand throughout the gate panel. By contrast, additional longitudinal ribs redistribute bending demand while retaining the original plate thickness. The latter approach is therefore particularly relevant where structural efficiency must be balanced against material use. This result agrees with the general behavior of stiffened steel plate systems, where stiffener arrangement influences local deformation, buckling resistance, and stress distribution. Studies on longitudinally stiffened plates and stiffened steel plate systems have similarly shown that stiffener layout and stiffness affect plate response and can be evaluated through numerical or finite-element-based analysis [
35,
50,
51]. The stress distributions observed in the present analysis also indicate that local buckling should be considered when evaluating the longitudinal-rib configurations. Previous studies have shown that the buckling response of longitudinally stiffened plates is governed by stiffener stiffness, spacing, boundary restraint, and interactions among local, distortional, and global deformation modes [
51,
52]. In the present results, increasing the rib number reduced stress and displacement and improved load redistribution; however, these trends alone do not establish the buckling resistance of the ribs or adjacent plate regions. Dedicated eigenvalue and geometrically nonlinear buckling analyses incorporating initial imperfections are therefore needed to quantify critical loads and associated buckling modes. Additionally, a previous specialized stiffened-plate optimization considered plate thickness, stiffener number, and stiffener spacing as design variables for reducing structural weight while satisfying mechanical performance requirements, supporting the use of rib-layout modification as a material-efficient alternative to simple plate thickening [
18]. Therefore, future studies should further investigate optimized rib spacing, rib geometry, and rib–plate configurations to reduce steel demand while maintaining the required stress, displacement, and safety performance of SRS gates.
From a sustainability perspective, this selection is meaningful because material efficiency is increasingly recognized as a key strategy for reducing embodied carbon in structural systems. It has been reported that designing structural steel for minimum material use, rather than only minimum cost, can reduce steel consumption and associated embodied carbon [
39]. In recent studies, it has also been emphasized that material quantities and embodied carbon are closely linked, and that material efficiency is an important design lever for reducing embodied carbon in structural systems [
53]. Although the present study did not perform a life-cycle carbon assessment, avoiding unnecessary plate-thickness increase or excessive rib addition while satisfying stress and displacement requirements is consistent with sustainability-oriented structural design. Future studies should also quantify this potential benefit through life-cycle assessment and cost–carbon optimization of alternative rib layouts under different hydraulic loading and operational conditions.
4.3. Component-Level Safety and Service Life Implications
The component-level safety checks provide an important link between hydraulic–structural performance and sustainability-oriented operation of the SRS gate. For movable hydraulic structures, satisfactory global gate response alone does not fully demonstrate safe operation, because load transfer is ultimately governed by connection and support components such as anchor bolts, clamping plates, and airbag systems. International anchorage design guidance also emphasizes that anchor systems should be evaluated with respect to relevant loading conditions and failure modes, including steel failure, pull-out, concrete-related failure, and combined actions [
27]. Therefore, the component-level checks performed in this study are important for confirming that selective gate operation does not create localized component demands that could lead to premature repair or replacement.
From a life-cycle perspective, the component-level safety results are relevant because the sustainability of hydraulic infrastructure is affected not only by initial material quantities but also by service life, maintenance demand, repair frequency, and component replacement. Life-cycle studies on dams and hydropower infrastructure commonly define environmental impacts across construction, operation, maintenance, and end-of-life stages, showing that maintenance and repair activities should be considered when evaluating long-term infrastructure performance [
20,
54]. In this context, verifying the safety of the anchor bolts, clamping plates, and airbag is not only a structural requirement but also a way to support longer service life and reduce avoidable maintenance associated with localized component failure.
The anchor-bolt results showed that both the applied-load and tensile-stress checks satisfied the target safety criterion under all evaluated gate-height conditions. This indicates that the load transferred from the gate to the support system remained within the evaluated component capacity. The airbag results also showed that the calculated internal pressure was far below the reinforcing-fabric strength, indicating that internal-pressure demand was not critical under the analyzed hydraulic conditions. These results support the structural feasibility of selective gate operation, because the system maintained component-level safety even when hydraulic loading became locally concentrated around lowered and adjacent raised spans.
The relatively high clamping-plate safety factors indicate that global bending failure was not the governing limit state for this component. From a sustainable design perspective, this suggests that the clamping plate may have potential for future material optimization, provided that other limit states such as bolt-hole stress concentration, local bearing, contact pressure, fatigue, corrosion allowance, and constructability requirements are also satisfied. Previous studies on structural material efficiency have shown that reducing material use from unused capacity can contribute to lower steel consumption and embodied carbon in structural systems [
39,
53]. Therefore, future studies should examine optimized clamping-plate dimensions using detailed contact-based finite-element analysis and life-cycle assessment to quantify the trade-off between structural safety, fabrication requirements, and material-related environmental impact.
The present static checks also highlight several mechanisms that require separate evaluation before long-term service performance can be established. In particular, repeated operation, local contact behavior, fatigue, preload variation, and time-dependent material degradation were not analyzed in the present static safety assessment. Accordingly, the current component checks should be interpreted only as static strength assessments and not as predictions of component service life. Future work should therefore extend the component-level assessment beyond static safety-factor checks by examining local stress concentrations and contact behavior around the anchor and clamping regions, fatigue and preload variation under repeated selective gate operation, and airbag durability associated with repeated inflation–deflation, abrasion, aging, reinforcing-fabric degradation, and long-term airtightness. In addition, component-level life-cycle assessment and cost–carbon optimization should be conducted to determine whether reductions in plate dimensions, anchor-bolt layout, or airbag material specifications can reduce material demand and maintenance-related environmental impacts while maintaining structural safety.
5. Conclusions
This study evaluated the structural safety of an SRS movable weir under selective gate-operation conditions by combining EFDC-based hydraulic analysis with structural and component-level safety assessment. The principal findings and design implications are summarized as follows:
Selective gate operation produces strongly non-uniform hydraulic loading, with flow concentration extending beyond the lowered span to adjacent raised gates. Accordingly, segmented movable-weir design should consider span-specific loading rather than assuming uniform hydraulic demand across the structure.
The critical hydraulic demand occurred in the side-gate lowering scenario, where asymmetric gate operation concentrated the flow near the lowered side span and produced the maximum external-force condition.
Structural efficiency can be improved through stiffener arrangement without relying solely on increased plate thickness. The present rib comparison indicates that redistributing stiffness through additional longitudinal ribs can reduce stress and deformation while limiting additional plate material. Accordingly, rib layout and plate thickness should be optimized together when material efficiency is a design objective.
Global gate safety should be complemented by component-level verification of the load-transfer path. Anchor bolts, clamping plates, and airbag systems should be evaluated separately because satisfactory global gate response does not by itself demonstrate adequate resistance of individual connection and support components.
The results support the structural feasibility of selective SRS operation under the investigated static hydraulic conditions, while broader application requires consideration of site-specific hydraulic conditions, connection behavior, repeated operation, durability, and numerical uncertainty.
Although the coupled EFDC–MIDAS framework extends approaches that consider hydraulic or structural behavior separately by linking scenario-specific flow redistribution with structural and component-level response, several methodological limitations remain. The present framework relies on steady-state one-way hydraulic-to-structural load transfer, simplified contact and anchorage representations, and does not include formal grid-convergence verification, sediment morphodynamics, or experimental validation. These limitations can be addressed through systematic mesh-sensitivity analysis, spatial integration of hydraulic loads, transient two-way fluid–structure interaction, nonlinear contact modeling, and physical or field validation. Future investigations should further examine scour under repeated selective operation, fatigue and anchor-preload variation, airbag aging, abrasion and airtightness degradation, and long-term field performance. Life-cycle assessment and cost–carbon optimization should also be incorporated to establish site-specific design and maintenance strategies that balance structural safety, material efficiency, durability, and environmental performance.




 ,
,