1. Introduction
The textile dyeing and printing (TDP) industry is a fundamental pillar of China’s manufacturing sector, contributing significantly to employment, exports, and economic growth [
1]. However, this industry is also recognized as one of the most resource-intensive and polluting sectors [
2]. It consumes large quantities of water, chemicals, and energy while generating substantial amounts of high-concentration organic wastewater, volatile organic compounds (VOCs), particulate matter, and greenhouse gases [
3,
4,
5]. The environmental burden imposed by the TDP industry has drawn increasing attention from both regulators and researchers [
6].
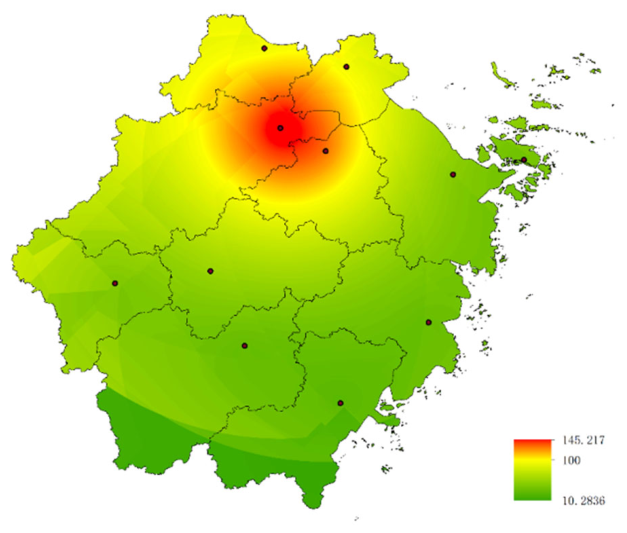
Zhejiang Province is the largest TDP hub in China [
7,
8]. According to recent statistics, Zhejiang accounts for approximately one-third of the total dyeing and printing production capacity nationwide [
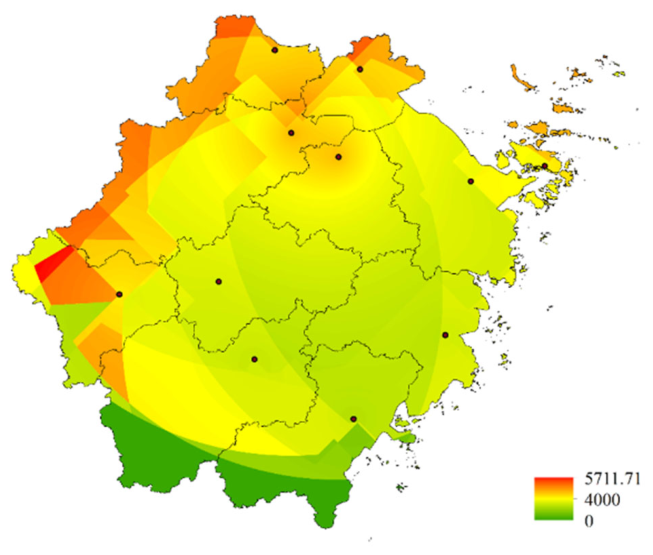
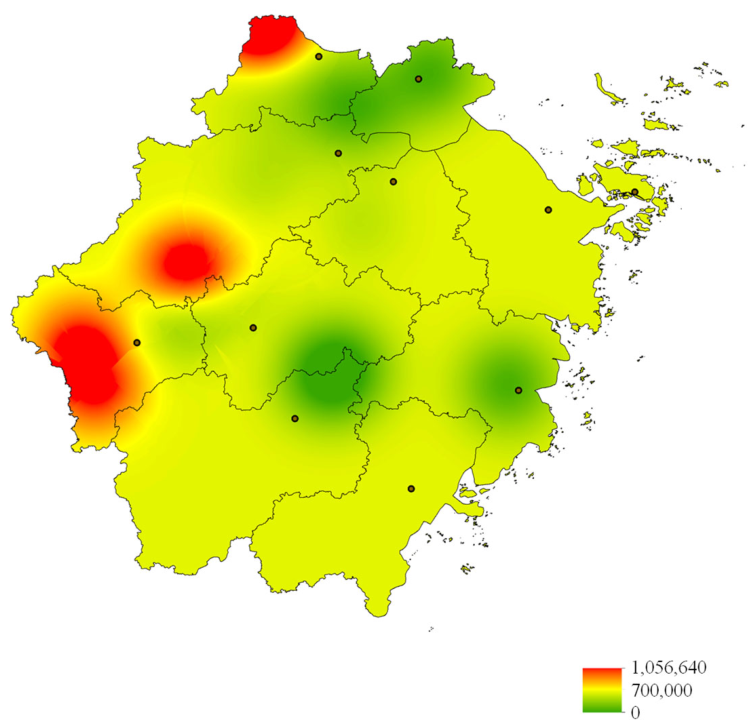
9]. The province hosts more than 770 registered dyeing and finishing (DF) enterprises, with the highest concentrations in Shaoxing, Jiaxing, and Hangzhou. The intensive spatial distribution of these enterprises has created significant environmental pressure on local water bodies and air quality [
10]. In 2024, the total wastewater discharge from the DF industry in Zhejiang reached 452 million cubic meters, with corresponding Chemical Oxygen Demand (COD) emissions of 63,286 tons and ammonia nitrogen emissions of 1161 tons [
11]. These figures highlight the urgent need for effective pollution control measures.
In response to these environmental challenges, China has implemented a series of increasingly stringent regulations. The Textile Dyeing and Finishing Industry Water Pollutant Discharge Standard (GB 4287-2012) sets strict limits on COD, ammonia nitrogen, total nitrogen, and total phosphorus [
12,
13]. Zhejiang Province has also introduced relevant local standards that impose more stringent requirements. For instance, in the area of air pollution control, the local standard Emission Standard of Air Pollutants for Textile Dyeing and Finishing Industry (DB 33/2500-2022) specifically sets strict limits on emissions of VOCs and particulate matter from DF processes in TDP [
14]. These regulatory developments reflect a clear trend toward stricter environmental compliance.
Beyond conventional pollutant control, China has announced its ambitious dual-carbon goals, aiming to peak carbon emissions by 2030 and achieve carbon neutrality by 2060 [
15]. This national strategy places new demands on all industrial sectors, including the DF industry. Enterprises are now required not only to reduce their discharge of conventional pollutants but also to lower their carbon emission intensity [
16]. The synergism of pollution reduction and carbon mitigation has become a central theme in environmental management. Synergy, conceptualized here as a co-benefit achieved through simultaneous reduction, denotes the capacity of a technology pathway to reduce both pollutants and carbon emissions concurrently, without compromising one for the other. This capability serves as the fundamental prerequisite for synergy.
However, achieving simultaneous reductions in both pollution and carbon emissions is not straightforward. In some cases, measures that effectively reduce water pollution may increase energy consumption and, consequently, carbon emissions. For example, advanced wastewater treatment technologies such as ultrafiltration (UF) and reverse osmosis (RO) can achieve high removal efficiencies for COD and nutrients [
17]. Yet these membrane-based systems consume substantial amounts of electricity [
18]. If the electricity is derived from fossil fuel sources, the resulting carbon emissions may offset some of the environmental benefits gained from pollution reduction. This type of trade-off, often described as “pollution reduction at the cost of carbon increase” [
19], poses a fundamental challenge to the concept of synergistic environmental management.
Given this challenge, it is essential to identify and evaluate technology pathways that can simultaneously address both pollution and carbon emissions. Life cycle assessment (LCA) provides a suitable methodological framework for this purpose [
20]. LCA is a systematic approach that quantifies the environmental impacts of a product, process, or technology throughout its entire life cycle [
21]. It follows the ISO 14040/14044 standards [
22] and covers multiple impact categories, including resource depletion, climate change, acidification, eutrophication, and human health effects. By applying LCA, researchers can compare different technology options and identify those that achieve the best overall environmental performance [
23].
Several studies have applied LCA to assess the environmental impacts of the textile industry as shown in
Table 1. Some researchers have focused on water consumption and wastewater treatment [
24,
25,
26]. Beyond pollution control technologies, recent studies have also applied LCA to evaluate the environmental footprint of advanced functional materials for dye removal from textile wastewater, such as biochar-supported layered double hydroxide composites [
27], though these assessments focus on single technologies rather than production-stage technology integration. A few studies have evaluated specific pollution control technologies [
28,
29,
30]. However, most existing studies have focused on single technologies [
31,
32] or individual life cycle stages. There is a notable lack of research that systematically compares multiple technology pathways across the full range of environmental impact categories. Furthermore, the synergistic effects and potential trade-offs between different technologies have not been fully explored.
This study aims to fill this research gap by conducting a comprehensive LCA of five synergistic technology pathways for pollution and carbon reduction in the DF industry. The study focuses on Zhejiang Province as a regional case study, using data collected from typical enterprises in the region. A hybrid LCA model is constructed to ensure both methodological rigor and system boundary completeness. One baseline scenario representing current industry practice and five optimization scenarios representing different technology pathways are established. The IMPACT 2002+ method is used to quantify 7 environmental impact categories. The results are analyzed to identify the most effective technology pathway and to elucidate the mechanisms underlying synergistic effects and trade-offs. The findings of this study are expected to provide scientific guidance for technology selection and policy formulation in the DF industry.
2. Methodology
2.1. Life Cycle Assessment Framework
2.1.1. Basic Information of LCA
This study follows the ISO 14040/14044 standards for life cycle assessment [
33]. A hybrid LCA approach was adopted. This approach combines process-based LCA at the micro level with economic input–output LCA at the meso and macro levels [
34]. At the micro level, process-based LCA was used to model the core dyeing and printing processes, including pretreatment, dyeing, and finishing. Detailed process data were obtained from field surveys of typical enterprises. At the meso level, regional input–output tables were introduced to reflect the energy structure and economic background of Zhejiang Province. At the macro level, the TianGong LCA Database was used as the background data source.
The openLCA 2.4.1 software platform was used for modeling and calculation [
35]. This software natively supports hybrid LCA modeling and provides seamless access to the TianGong LCA Database. The software also offers a comprehensive library of life cycle impact assessment (LCIA) methods, enabling multi-dimensional environmental impact analysis [
36]. As software users, we built the product system model through a graphical interface. The software automatically handled matrix calculations and integration logic in the background.
2.1.2. Hybrid LCA Model Construction
The hybrid LCA model in this study was constructed using a tiered integration approach that combines process-based foreground modeling, regional input–output (IO) analysis, and national background database.
For input–output table, the IO component is derived from the TianGong LCA Database, which incorporates 157 IO datasets from the Chinese Environmentally Extended Input–Output (CEEIO) framework. The core IO table is based on the China National Input–output Table (benchmark year: 2017), with sectoral updates through 2020. The database covers 55 industry sectors aligned with the China National Economic Industry Classification (GB/T 4754) [
37]. For Zhejiang-specific economic linkages, we used the Zhejiang Provincial Input–output Table (2024 edition), published by the Zhejiang Provincial Bureau of Statistics. This provincial table provides sectoral disaggregation at the 42-sector level, which was aggregated to match the 55-sector classification of the TianGong database where necessary.
For data classification and format, the TianGong database employs a three-tier data classification system: Unit Process data (raw material inputs, product outputs, energy inputs, waste outputs, and pollutant emissions); System Process data; and Input–output data. All data are structured in the ILCD (International Reference Life Cycle Data System) format, which is the internationally recognized standard for LCA data exchange. This format enables seamless data exchange between openLCA and other major LCA software platforms.
Physical process data were mapped to economic sectors through openLCA’s flow-matching mechanism. For each foreground unit process, inputs (materials, energy, water) and outputs (products, emissions, waste) were linked to corresponding IO sectors using standardized flow classifications. The mapping is bidirectional and fully traceable, allowing users to verify data origins and mapping assumptions.
The IO datasets use producer prices at the sector level, consistent with China National Bureau of Statistics standards. Price deflators based on the industrial producer price index (PPI) are applied to convert nominal values to constant prices (base year: 2017). The IO framework adopts a non-competitive import assumption, treating imported goods as distinct from domestically produced goods. Imported inputs are modeled through separate unit process datasets where applicable, using global average production data when China-specific import data are unavailable.
While the TianGong database provides national-average foreground datasets for most sectors, we regionalized the energy and electricity components using Zhejiang-specific parameters: the Zhejiang grid emission factor (0.29 kgce/kWh) and the Zhejiang cogeneration steam supply coefficients. The provincial IO table captures regional supply-chain structures for electricity, heat, and chemicals.
The integration follows the tiered hybrid LCA approach implemented in openLCA. Foreground unit processes for pretreatment and dyeing & finishing were modeled using enterprise-specific data. Each unit process specifies its inputs and outputs as physical flows. The Zhejiang Provincial Input–output Table was integrated to capture regional economic linkages. Energy inputs (steam, electricity) were linked to corresponding IO sectors using provincial coefficients. The TianGong database provided background unit processes for all upstream material production (coal, natural gas, chemicals, etc.). In openLCA, foreground unit processes were linked to background IO sectors through the product system construction mechanism. Energy inputs were connected to IO sectors via flow matching; material inputs were connected to TianGong background unit processes via matched flow names. The IO components compensate for truncation errors inherent in process-based LCA by capturing upstream economic activities not directly modeled as unit processes (e.g., transportation, warehousing).
2.2. Goal and Scope Definition
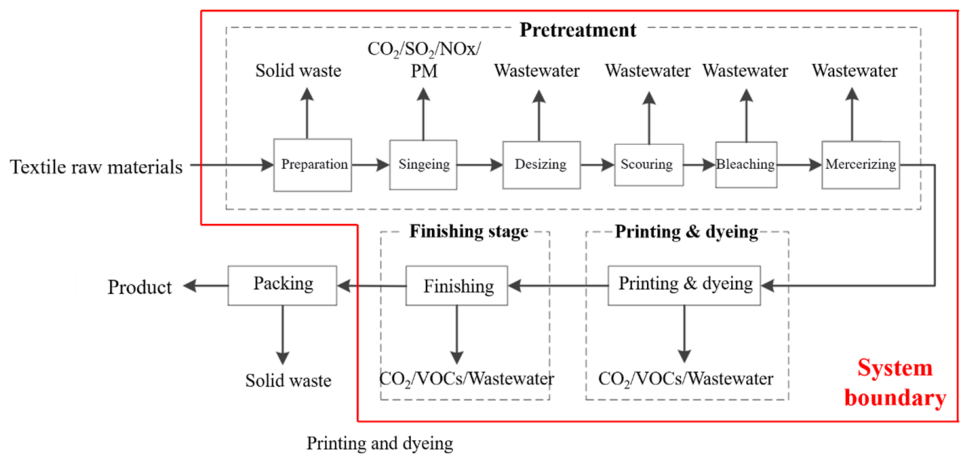
The goal of this study is to evaluate the environmental performance of five synergistic technology pathways for pollution and carbon reduction in the DF industry. The system boundary was defined as “gate-to-gate”, starting from the entry of gray cotton fabric into the factory and ending with the exit of finished dyed fabric. As shown in
Figure 1, two main stages were included: the pretreatment stage and the DF stage. The functional unit was defined as “the production of 1 ton of cotton dyed knitted fabric”.
The TianGong LCA Database provides national statistical data for China. It also offers data at the provincial level. The foreground data are based on Zhejiang Province data for 2024. This is consistent with the latest provincial statistics used in our modeling. The temporal scope covers the entire year of 2024. The electricity mix and steam supply coefficients are derived from Zhejiang’s specific power grid and cogeneration statistics.
2.3. Life Cycle Inventory Analysis
The life cycle inventory data were divided into background data and foreground data. Background data, including the production of coal, natural gas, electricity, sodium hydroxide, and hydrogen peroxide, as well as emission factors for CO2, COD, SO2, and NOx, were obtained from the TianGong LCA Database. The TianGong LCA Database is a full life-cycle inventory database that covers resource extraction, processing, transportation, and end-use consumption for all background processes, including natural gas. Foreground data, representing the material and energy inputs and outputs of the core dyeing and printing processes, were collected through field surveys of a typical dyeing and printing enterprise in Zhejiang Province.
This study selects Zhejiang Yingfeng Technology Co., Ltd. as a representative DF enterprise in Zhejiang Province. The company is located in Keqiao District, Shaoxing City, China, which is the largest DF industrial cluster in Zhejiang Province, accounting for approximately 62% of the province’s total DF production capacity. Keqiao hosts over 200 DF enterprises, representing the highest density of DF facilities in the province. The company’s location within this core cluster ensures that its production conditions—including raw material supply chains, energy infrastructure, and environmental compliance requirements—are representative of the regional industry norm.
Zhejiang Yingfeng Technology Co., Ltd. enjoys a high national reputation for its DF operations. Its main production processes include pretreatment, DF. In 2024, its annual output reached approximately 471.2 million meters of dyed and printed fabric corresponding to approximately 8.2% of Shaoxing’s total DF output and approximately 5.1% of Zhejiang Province’s total DF output. The principal products and their annual production of Zhejiang Yingfeng Technology Co., Ltd. are listed in
Table 2.
The company employs a “scouring–bleaching–mercerizing → dyeing → stentering setting” process chain, which is the most widely adopted technical route for cotton knitted fabric dyeing and finishing in Zhejiang Province. According to the industry survey conducted by the Zhejiang Textile Industry Association in 2024, approximately 74% of medium- and large-scale DF enterprises in the province employ the same core process sequence. The equipment configuration—including overflow dyeing machines, continuous pretreatment ranges, and stentering setting machines—is also consistent with the standard equipment portfolio documented in the provincial industry benchmark report.
This study divides the overall system boundary into two stages: the pretreatment stage and the DF stage. These two stages are linked through an intermediate product. Processes such as weaving, knitting, or yarn and cotton production are excluded.
The pretreatment stage receives 1071 kg of cotton yarn as input. Due to processing losses, it outputs 1020 kg of grey fabric. The loss rate is 4.76%. This loss mainly results from the removal of impurities, including cottonseed hulls, wax, and pectin. The 1020 kg of grey fabric then serves as the input to the dyeing and finishing stage. Finally, this stage outputs 1000 kg of finished dyed and finished fabric. The above loss rate is obtained from a survey of actual production at Zhejiang Yingfeng Technology Co., Ltd.
Key inputs to the pretreatment stage included cotton yarn, scouring agent, steam, electricity, hydrogen peroxide, sodium hydroxide, and water. Key outputs included cotton gray fabric, industrial waste, CO2, particulate matter, SO2, COD, wastewater, and ammonia. Key inputs to the dyeing and finishing stage included industrial salt, cotton gray fabric, reactive dyes, steam, electricity, hydrogen peroxide, sodium carbonate, sodium hydroxide, and water. Key outputs included dyed fabric, CO2, particulate matter, SO2, COD, NOx, VOCs, ammonia, and wastewater.
The input data were derived from multiple sources. These include on-site investigations, online monitoring data in 2024, the company’s pollutant discharge permit report in 2024, and the DF industry standard. Online monitoring data were given priority. Missing data were supplemented using calculations based on the company’s pollutant discharge permit report. According to the “Benchmark and Baseline Levels of Energy Efficiency in Key Industrial Sectors (2023 Edition),” the comprehensive energy consumption for producing 1 ton of cotton gray fabric is 800–1000 kgce (kilogram of standard coal equivalent). The median value of 900 kgce was used in this model. For the production of 1 ton of dyed cotton fabric, the consumption of cotton gray fabric is approximately 1.01–1.05 tons, fresh water consumption is 80–150 tons, and comprehensive energy consumption is 1.2–1.8 tce (ton of standard coal equivalent). Steam consumption is concentrated in the pretreatment stage (scouring, bleaching, mercerizing), with typical consumption of 2.5–3.5 tons of steam per ton of fabric. The value of 3.0 tons of steam per ton of fabric was used in this model.
For the energy structure, the enthalpy of purchased steam (from coal-fired cogeneration plants) was taken as 2.7 GJ per ton of steam, equivalent to 0.092 kgce/kg steam. The average coal consumption for power supply in the Zhejiang power grid was taken as 0.29 kgce/kWh. Pollutant emissions (CO
2, PM, SO
2, NOx) were calculated based on the steam and electricity consumption using the emission factors from the “Handbook of Pollution Source Generation and Discharge Coefficients for Industrial Pollution Sources (2021 Edition)” and the “Technical Specification for Wastewater Treatment Engineering of Textile Dyeing and Finishing Industry” (HJ 471-2020) [
38].
2.4. Scenario Design
Based on the technology screening results, one baseline scenario and five optimization scenarios were established. The baseline scenario represents the current typical practice in the DF industry in Zhejiang Province. This scenario uses conventional cotton dyeing processes. The energy supply relies heavily on purchased steam from coal-fired cogeneration plants and electricity from the East China Power Grid. Wastewater treatment uses conventional biological processes (such as anaerobic-aerobic methods) to meet discharge standards. Exhaust gas, particularly VOCs and oil mist from stenter setting processes, is treated using conventional methods such as water spraying and electrostatic precipitation.
2.4.1. Scenario 1
Scenario 1 focuses on low-carbon energy substitution. This scenario introduces two major changes. First, on-site natural gas boilers are installed to replace a portion of the purchased steam originally supplied by coal-fired cogeneration plants. Second, rooftop photovoltaic power generation systems are deployed to replace a portion of grid electricity, providing electricity with negligible direct combustion emissions. The use of environmentally friendly dyes and auxiliaries is also encouraged as a supplementary measure. This scenario aims to evaluate the direct environmental benefits of transitioning to a lower-carbon energy structure.
The quantitative assumptions underlying Scenario 1 are specified as follows, based on the complete inventory provided in
Supplementary Materials. For the dyeing and finishing stage, 20% of the coal-derived steam (3240 MJ per tonne of fabric, reduced from 16,200 MJ to 12,960 MJ) is replaced by on-site natural gas combustion, supplying 3888 MJ of natural gas per tonne of fabric. The natural gas boilers operate at a thermal efficiency of approximately 92–95%, with distribution losses of approximately 3–5%, whereas the baseline coal-fired cogeneration and long-distance steam transport system operates at an overall efficiency of approximately 80–85%. The efficiency gain from on-site natural gas combustion is therefore estimated at approximately 8–12% relative to the baseline steam supply.
For electricity, 20% of the grid electricity (648 MJ per tonne of fabric, reduced from 3240 MJ to 2592 MJ) is displaced by rooftop photovoltaic generation, corresponding to approximately 180 kWh per tonne of fabric. Extrapolated to the facility level (annual production of approximately 50,000 tonnes of dyed fabric), this would correspond to a PV capacity of approximately 1.0–1.2 MW, assuming 1200–1400 full-load hours per year in Zhejiang Province.
For chemicals, environmentally preferable dyes and auxiliaries are introduced as a supplementary measure. These include reactive dyes with higher fixation rates (reducing dye consumption by 15%, from 50 kg to 42.5 kg per tonne of fabric) and low-foaming, biodegradable scouring agents (reducing scouring agent consumption by 10%, from 10.2 kg to 9.18 kg per tonne of fabric). These substitutions not only reduce the chemical load in wastewater but also lower the associated COD emissions, contributing to the 12.75% reduction in eutrophication potential observed in Scenario 1. The complete mass and energy balances for Scenario 1 are provided in
Supplementary Table S1.
2.4.2. Scenario 2
Scenario 2 focuses on waste heat recovery and energy efficiency improvement. This scenario does not change the energy input structure of the baseline scenario. Instead, it aims to reduce total energy demand through process-level energy efficiency measures. The core measures include installing waste heat recovery systems on stenter machines, implementing closed-loop recovery of steam condensate, applying high-efficiency heat pump technology to recover low-grade waste heat, and retrofitting motors with variable frequency drives to match power output with actual load. This scenario aims to quantify the indirect emission reductions achievable through technical energy savings and internal resource recycling.
The key technical parameters applied in Scenario 2 are quantified as follows, based on field measurements from Zhejiang Yingfeng Technology Co., Ltd. and supplemented by industry-standard reference values.
The stenter machines operate at an exhaust temperature of approximately 160–180 °C. The installed gas-to-air heat exchangers recover approximately 30–35% of the sensible heat from the exhaust stream, corresponding to 1.8–2.2 MJ per kg of fabric processed. This recovered heat is used to preheat the incoming fresh air for the stenter burners, reducing natural gas consumption by approximately 8–12% for the stenter units.
The closed-loop condensate recovery system collects approximately 85–90% of the steam condensate generated across the dyeing and finishing stage. The recovered condensate (temperature > 80 °C) is returned directly to the boiler feedwater tank, reducing both fresh water intake and the thermal energy required for feedwater heating. This measure contributes to an overall steam consumption reduction of approximately 10–12% at the facility level.
Two high-temperature heat pumps (COP ≈ 3.5–4.0) are deployed to upgrade low-grade waste heat (from cooling water and exhaust air at 35–45 °C) to 65–75 °C for process hot water preparation. Each heat pump operates for 7200 h per year (equivalent to 300 days × 24 h), consistent with the continuous production schedule of the facility.
Variable frequency drive (VFD) retrofits are applied to the main circulating pumps, cooling fans, and air compressors—accounting for approximately 65% of the total motor capacity in the DF stage. Based on the actual load profiles, the VFDs achieve an average energy savings of 20–25% for the retrofitted motors, corresponding to a facility-wide electricity reduction of approximately 8–10%.
To avoid double counting among these energy-efficiency measures, the savings are calculated sequentially rather than additively. All parameter values are derived from on-site measurements at Zhejiang Yingfeng Technology Co., Ltd. and verified against the facility’s 2024 annual energy balance.
The water-saving measures in Scenario 2 mainly involve steam condensate recovery. Although these measures reduce the total volume of wastewater discharged, they do not change the pollutant generation rate in the DF processes themselves. Therefore, the mass load of pollutants such as COD discharged into the wastewater remains the same as in the baseline scenario. As a consequence, while the wastewater volume decreases, the pollutant concentration in the remaining wastewater increases accordingly.
2.4.3. Scenario 3
Scenario 3 focuses on advanced wastewater treatment and reuse. This scenario addresses the high water consumption and high pollution load characteristics of the dyeing and printing industry. The core technology is an advanced wastewater treatment and reuse system based on UF and RO membranes, supplemented by advanced oxidation processes such as ozone catalysis. The treated water is reused in processes with relatively low water quality requirements, such as pretreatment and dyeing rinsing. This scenario aims to reveal the potential trade-off between pursuing extreme pollution reduction and the associated increase in carbon emissions due to the high energy consumption of advanced treatment facilities.
The advanced treatment system treats a portion of the DF wastewater and returns the treated water to the production processes. As shown in the Scenario 3 inventory, fresh water input to the dyeing and finishing stage is reduced from 80,000 kg per tonne of fabric (baseline) to 52,000 kg, representing a 35% reduction in fresh water intake. Correspondingly, wastewater discharge is reduced from 78,000 kg to 50,700 kg per tonne of fabric. This 35% reduction in both intake and discharge implies a water reuse rate of approximately 35% within the system boundary. The pollutant removal efficiency of the UF/RO + AOP system is substantial: COD emissions from the dyeing and finishing stage decrease from 78 kg to 35.1 kg per tonne of fabric (a reduction of 55.0%), and ammonia nitrogen emissions decrease from 1.56 kg to 0.70 kg (a reduction of 55.1%).
The improved water quality and reduced pollutant discharge come at a cost of increased electricity consumption. The UF/RO membrane system, high-pressure pumps, blowers for membrane aeration, and advanced oxidation equipment collectively add significant electrical load. As shown in the inventory, electricity consumption in the dyeing and finishing stage increases from 3240 MJ to 3823.2 MJ per tonne of fabric—an increase of 18.0%. Similarly, electricity consumption in the pretreatment stage increases from 1575 MJ to 1858.5 MJ—also an 18.0% increase. The additional electricity is primarily used to drive the high-pressure pumps (operating at 1.0–1.5 MPa for RO and 0.2–0.4 MPa for UF), membrane aeration blowers, and ozone generation equipment for the AOP stage. Based on the facility’s engineering design specifications, the specific energy consumption of the UF/RO system is approximately 4.8–5.2 kWh per cubic meter of wastewater treated.
Steam consumption in the dyeing and finishing stage is reduced from 16,200 MJ to 14,256 MJ per tonne of fabric (a 12% reduction), while pretreatment stage steam consumption remains unchanged at 7425 MJ. The 12% reduction in the dyeing and finishing stage is attributable to the implementation of basic condensate recovery and heat exchange optimization measures (similar to those applied in Scenario 2), which are deployed in conjunction with the advanced treatment system. However, unlike Scenario 2, Scenario 3 does not include dedicated waste heat recovery from stenter exhaust or high-efficiency heat pump upgrades.
2.4.4. Scenario 4
Scenario 4 focuses on intelligent control and process optimization. This scenario represents the deep integration of digital and intelligent technologies with traditional manufacturing. It aims to improve overall resource productivity through source prevention and refined management. The measures include real-time monitoring of energy consumption, material consumption, and process parameters using IoT sensor networks; AI-based color matching and recipe optimization; automatic precise weighing and dosing of dyes and chemicals; promotion of low-resource consumption processes such as low-liquor-ratio dyeing and low-temperature pretreatment; and the establishment of an energy management system for optimized scheduling. This scenario aims to quantify the comprehensive resource savings and synergistic emission reductions achievable through “soft” technologies that enhance the intelligence of system operation.
The key quantitative assumptions underlying each intelligent control and process optimization measure are specified below. These values are derived from a combination of on-site measurements at Zhejiang Yingfeng Technology Co., Ltd., and operational data recorded by the company‘s energy management system (EMS) in 2024.
By leveraging a historical dyeing database and machine learning algorithms, the system reduces the number of trial-and-error dyeing runs by approximately 50–60% and increases the first-pass dyeing success rate to above 95%. This translates to a reduction of approximately 10–15% in reactive dye consumption and 8–12% in auxiliary chemical usage per tonne of fabric. The automated dispensing system replaces manual weighing and delivery of dyes and liquid auxiliaries. Based on the facility‘s operating records, this measure reduces chemical overuse by approximately 10–20% (depending on the chemical type) and minimizes the need for rework caused by dosing errors. The overall chemical savings are estimated at 8–12% across the dyeing and finishing stage. The adoption of advanced dyeing machines with a liquor ratio reduced from the conventional 1:8–1:10 to 1:4–1:5 directly lowers the water and steam demand per batch. This measure contributes to a 25–35% reduction in fresh water consumption and a 20–30% reduction in steam consumption for the dyeing stage, relative to conventional equipment. By employing bio-enzymatic scouring and low-temperature activated bleaching (operating at approximately 75–80 °C instead of the conventional 95–100 °C), this measure reduces the thermal energy demand of the pretreatment stage by approximately 20–30%, corresponding to a 10–15% reduction in overall steam consumption for the pretreatment stage.
The combined effect of these measures, as reflected in the Scenario 4 inventory (
Supplementary Files), yields net reductions of approximately 7–10% in steam consumption, 7–10% in electricity consumption, 8–12% in fresh water intake, and 10–15% in chemical inputs per functional unit, relative to the baseline. These aggregate values are consistent with the facility‘s annual energy and material balances for 2024.
2.4.5. Scenario 5
Scenario 5 represents the integrated application of multiple technologies. This scenario is not a simple superposition of the previous four scenarios. Instead, it is an organic integration based on systems engineering thinking. The technical implementation follows a logical sequence of “source prevention → process efficiency → energy substitution → end-of-pipe treatment.” First, the intelligent control and process optimization technologies from Scenario 4 are fully applied to minimize resource demand and pollution generation at the source. Second, on this optimized foundation, the waste heat recovery and energy efficiency technologies from Scenario 2 are deployed to maximize internal energy efficiency. Third, for the remaining energy demand that cannot be avoided, the clean energy substitution measures from Scenario 1 are introduced. Fourth, for wastewater that cannot be completely eliminated at the source or during processes, the advanced treatment technology from Scenario 3 is applied in a closed-loop manner. However, because the amount of wastewater requiring treatment is significantly reduced by the front-end water-saving measures, the energy burden of the treatment system is also substantially lowered. This scenario is designed to test whether technology integration can produce synergistic effects that exceed the sum of individual technologies.
In Scenario 5, the integration of multiple technologies follows a sequential calculation logic rather than additive superposition. The reductions are applied in a fixed order: intelligent control (Scenario 4) → waste heat recovery (Scenario 2) → clean energy substitution (Scenario 1) → advanced treatment (Scenario 3). At each step, the savings are calculated based on the residual demand after previous measures have been applied, which inherently avoids double counting.
A critical dependency is that the load entering the advanced wastewater treatment stage is determined after the water-saving effects of Scenario 4 (low-liquor-ratio dyeing) and Scenario 2 (condensate recovery) are applied. This reduces the advanced treatment inflow by approximately 25% relative to the baseline, as shown in the Scenario 5 inventory (
Supplementary Table S1). Consequently, the energy penalty of the UF/RO system in Scenario 5 is substantially lower than in Scenario 3, where the same membrane technology treats the full baseline wastewater volume.
The complete input and output tables for the five scenarios and the baseline scenario are provided in the
Supplementary Files. These tables include the two stages (pretreatment and DF) for each scenario.
2.5. Life Cycle Impact Assessment
The IMPACT 2002+ method was selected for life cycle impact assessment. This method has been widely used in industrial LCA studies and provides a comprehensive set of impact categories relevant to the DF industry. The IMPACT 2002+ method was originally developed at the Swiss Federal Institute of Technology Lausanne (EPFL) and has been widely used in industrial LCA studies. It links life cycle inventory results through 14 midpoint categories to four damage categories: human health, ecosystem quality, climate change, and resources.
In this study, the IMPACT 2002+ method was implemented through the openLCA LCIA Methods package (version 2.7.0), which is distributed via the openLCA Nexus platform. The package provides pre-calculated characterization factors for approximately 1500 elementary flows. For the global warming potential (GWP) category, the characterization factors are based on the IPCC 100-year time horizon. The method uses globally applicable characterization factors; regional specificity is incorporated at the inventory level through Zhejiang-specific foreground data, including the provincial electricity grid mix and steam supply coefficients.
As shown in
Table 3, seven impact categories were selected for detailed analysis: non-renewable energy, global warming, aquatic acidification, aquatic eutrophication, terrestrial acidification and nutrification, respiratory inorganics, respiratory organics, and carcinogens. In this study, the above 7 environmental impact categories were consolidated into four impact category groups.
The characterization factors used in this study—including the factor for converting COD emissions into aquatic eutrophication potential (expressed as kg PO4 P-lim)—are the default values provided by the IMPACT 2002+ method as implemented in the openLCA LCIA Methods package (version 2.7.0). These factors are derived from the original IMPACT 2002+ documentation developed at the Swiss Federal Institute of Technology Lausanne (EPFL). It should be noted that the COD-to-phosphorus equivalence (0.022 kg PO4 P-lim per kg COD) is specific to the IMPACT 2002+ characterization framework and may differ under other LCIA methods (e.g., ReCiPe, CML). In this study, all characterization factors are applied consistently within the IMPACT 2002+ framework without modification.
Characterization was performed using the contribution summation model. For each impact category, the total potential was calculated by multiplying the inventory flow of each substance by its characterization factor and summing across all contributing substances. The environmental impact potential is calculated using the following equation:
where
EPx is the total potential value for impact category
x (e.g., global warming potential);
Qi is the emission or consumption amount of inventory substance i (e.g., 5 kg COD); and CFi,x is the characterization factor of substance i with respect to impact category x (e.g., 1 kg COD = 0.022 kg P-equivalent for eutrophication).
For aquatic eutrophication, for example, the characterization process converts COD emissions into equivalent phosphorus units based on the oxygen depletion potential and subsequent phosphorus release in aquatic ecosystems. This process establishes a quantitative link between pollutant emissions and their potential environmental consequences.
Allocation was handled by assuming that the enterprise produces multiple fabric types and that shared environmental loads from energy and water treatment facilities are allocated based on production volume. The hybrid LCA approach, by incorporating regional input–output data, effectively compensates for upstream truncation errors inherent in traditional process-based LCA.
3. Results and Analysis
All results are expressed relative to the baseline scenario, with the baseline set to 100% for each impact category. This relative expression facilitates direct comparison of the performance of the five optimization scenarios across the seven impact categories.
3.1. Impact on Non-Renewable Energy Depletion
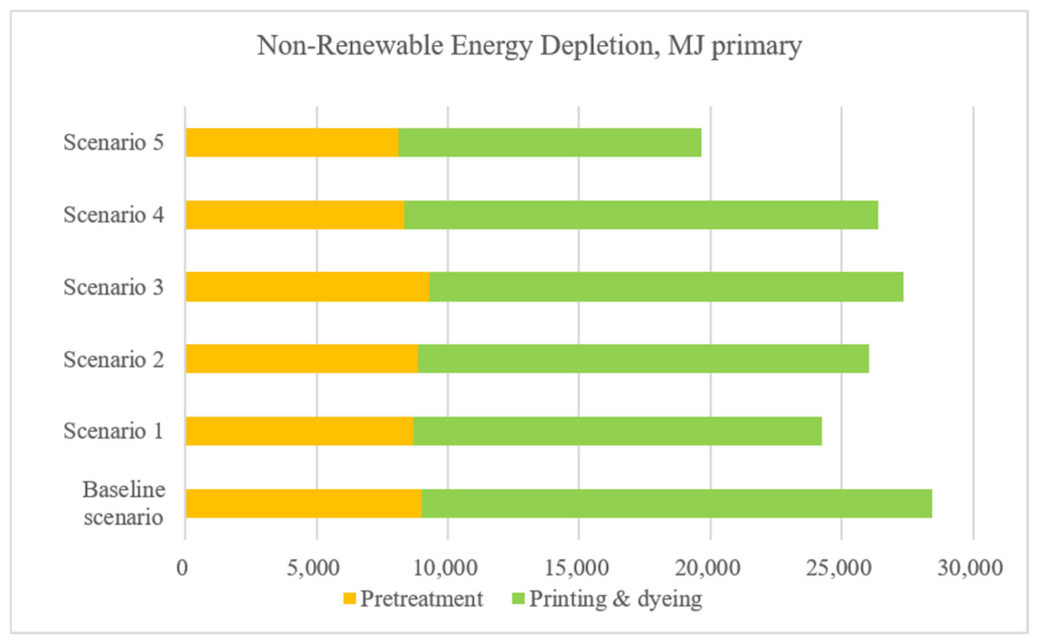
Non-renewable energy depletion potential directly reflects the primary energy consumption of fossil fuels (coal, natural gas, etc.) during production. This is a core indicator of resource efficiency and environmental sustainability. As shown in
Figure 2, the baseline scenario showed a non-renewable energy consumption of 28,440 MJ primary. This high consumption originates from two main sources: purchased steam from coal-fired cogeneration plants, which dominates the energy supply for the DF stage, and electricity from the grid, which powers motors, pumps, and auxiliary equipment in both stages. This energy supply pattern characterizes the DF industry as a typical fossil-fuel-dependent sector.
Scenario 1 reduced non-renewable energy consumption to 24,237 MJ primary, or 85.22% of the baseline. This represents a reduction of 14.78%. The reduction is primarily due to two parallel measures. The first is the partial replacement of purchased coal-fired steam with natural gas boilers. Natural gas has a higher energy density and more efficient combustion and transmission systems compared to coal-fired cogeneration with long-distance heat transport. The second measure is the deployment of rooftop photovoltaic power generation, which replaces a portion of grid electricity with zero-fossil-energy renewable power. The energy-saving benefit of this pathway comes entirely from changing the type and quality of energy inputs. It does not change the total energy demand within the production system. Therefore, the resource-saving effect has a theoretical upper limit determined by the maximum achievable substitution rate.
Scenario 2 reduced non-renewable energy consumption to 26,014.5 MJ primary, or 91.47% of the baseline. This is a reduction of 8.53%. The technical logic of this scenario is to maximize internal energy efficiency without changing the external energy input structure. Stenter waste heat recovery directly captures low-grade heat that would otherwise be discharged. Closed-loop steam condensate recovery prevents the loss of high-quality water and sensible heat. High-efficiency heat pump technology upgrades low-temperature waste heat into usable process heat. Variable frequency drive retrofits match motor output to actual load, reducing unnecessary losses. Together, these measures reduce the net energy input required to produce a unit of product. This represents a classic “technical energy saving” pathway. However, the emission reduction potential is limited by the second law of thermodynamics and the theoretical maximum efficiency of existing equipment.
Scenario 3 showed a non-renewable energy consumption of 27,362.7 MJ primary, or 96.21% of the baseline. This represents a slight reduction of only 3.79%. This result corrects the simple assumption that advanced treatment necessarily leads to a large increase in energy consumption. The small net reduction results from the cancellation of two opposing effects. On one hand, the UF/RO membrane systems and advanced oxidation processes add significant electricity consumption. On the other hand, the high-rate reuse of treated water substantially reduces fresh water intake and final wastewater discharge. The system thus avoids the significant energy consumption associated with water extraction, long-distance water transport, and conventional treatment of large volumes of wastewater. Scenario 3 is a pollution control pathway with relatively low energy efficiency but with a system-level energy offset effect. It is not simply an “energy consumer” but rather a system that uses energy for the specific environmental goal of pollutant removal and transfer.
Scenario 4 reduced non-renewable energy consumption to 26,377 MJ primary, or 92.75% of the baseline. This is a reduction of 7.25%. The energy-saving mechanism of this pathway differs from hardware additions or replacements. It relies on “soft” optimization through the integration of IoT, AI, and process knowledge. AI-based color matching and recipe optimization reduce the number of sample runs and the defect rate, thereby lowering the energy consumption associated with re-production. Automatic precise chemical dosing prevents the excessive use of chemicals and the subsequent energy consumption for their treatment. Low-liquor-ratio dyeing and low-temperature pretreatment directly reduce the heating demand for water and steam. The energy management system optimizes the overall energy flow through real-time monitoring and scheduling. This pathway represents a “management energy saving” or “knowledge energy saving” model whose potential depends on data accumulation, algorithmic models, and continuous optimization capability.
Scenario 5 achieved the most dramatic reduction, with non-renewable energy consumption dropping to 19,651 MJ primary, or 69.10% of the baseline. This is a reduction of 30.90%, far exceeding any single-technology pathway. This exceptional performance results from positive feedback and cascade optimization effects among the technologies. First, Scenario 4’s intelligent control and process optimization significantly reduces the baseline demand for water, steam, and electricity. Second, implementing Scenario 2’s waste heat recovery and energy efficiency measures on this “slimmed-down” system requires smaller equipment capacity and lower investment, while the recovered energy represents a higher proportion of total system energy demand. Third, the clean energy substitution from Scenario 1 is applied to the remaining unavoidable energy demand. Because the total demand has been greatly reduced, the required natural gas and photovoltaic capacity are also reduced. Fourth, although Scenario 3’s advanced wastewater treatment is still needed, the front-end water-saving measures have dramatically reduced the volume of wastewater requiring treatment. As a result, the scale of the treatment system and the load on high-energy-consumption units such as RO are proportionally reduced. This systematic sequence of “source reduction → process efficiency → structural optimization → refined end-of-pipe treatment” breaks the bottlenecks and trade-offs faced by individual technologies, achieving a multiplicative amplification of resource-saving benefits.
3.2. Impact on Global Warming Potential
Global warming potential is a core indicator of the contribution of human activities to climate change. As shown in
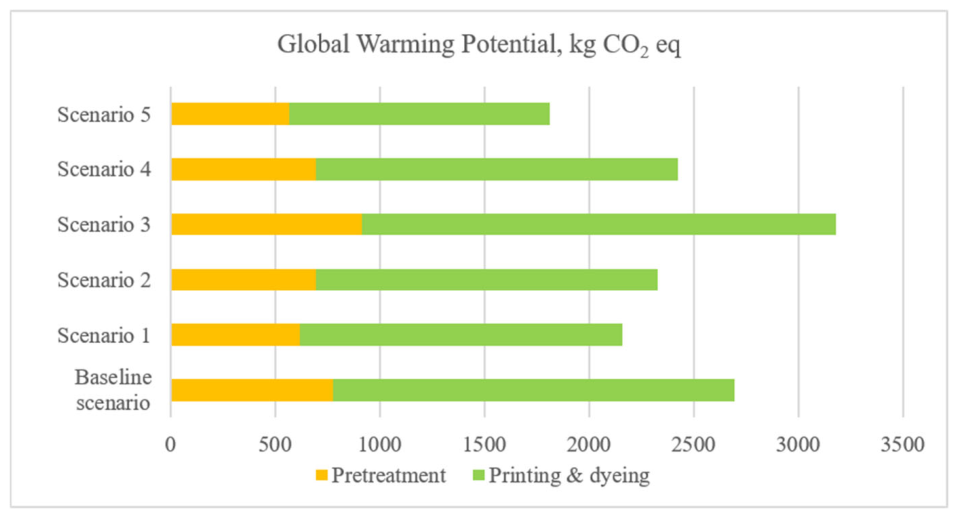
Figure 3, the baseline scenario showed a global warming potential of 2695 kg CO
2 eq. The emissions originate mainly from two sources. Purchased coal-fired steam accounts for the largest share of indirect emissions. Grid electricity accounts for the second largest share, reflecting the fossil-fuel-dominated power structure of Zhejiang Province. This baseline clearly illustrates the significant carbon footprint resulting from the heavy reliance of the traditional DF industry on high-carbon energy.
Scenario 1 showed the strongest single-technology carbon reduction effect, with global warming potential dropping to 2158 kg CO2 eq, or 80.07% of the baseline. This is a reduction of 19.93%. The dual substitution effects are responsible for this excellent performance. The replacement of coal-fired steam with natural gas takes advantage of the lower carbon emission factor of natural gas, which is approximately 60% that of standard coal. Replacing part of the grid electricity with photovoltaic power provides electricity with negligible direct combustion emissions. This pathway directly targets the source of carbon emissions, namely the energy structure. By introducing low-carbon and zero-operational-carbon energy, it achieves a rapid and significant reduction in carbon intensity. However, the emission reduction potential is limited by the availability and price of natural gas and the maximum developable capacity of on-site renewable energy.
Scenario 2 reduced global warming potential to 2330 kg CO2 eq, or 86.46% of the baseline. This is a reduction of 13.54%. The carbon reduction in this scenario is achieved indirectly through reducing total energy demand. Without changing the carbon intensity of the external energy supply, improving energy efficiency proportionally reduces all greenhouse gas emissions associated with energy consumption. The emission reduction effect is essentially synchronized with the energy-saving effect, confirming that energy efficiency improvement is a fundamental and universal tool for climate change mitigation. However, the marginal abatement cost may increase with the depth of retrofitting due to thermodynamic limits and the available space for equipment modification.
Scenario 3 showed a global warming potential of 3180 kg CO
2 eq, reaching 118.00% of the baseline with an increase of 18.00%. This is the only scenario in which carbon emissions increased. This result contrasts sharply with the finding from
Section 3.1 that non-renewable energy consumption in this scenario decreased slightly by only 3.79%. The key lies in the structure of the added energy consumption. The additional electricity required to drive the membrane systems, blowers, and advanced oxidation equipment is primarily supplied by the grid, which in Zhejiang Province is still dominated by fossil fuels. The energy consumption avoided through water reuse is mainly associated with water extraction and transport, whose carbon emission factors are lower than that of electricity. Therefore, although total energy consumption decreased slightly, the shift in energy structure toward high-carbon electricity led to a significant increase in carbon emissions. This scenario clearly reveals the sharp trade-off between pollution reduction and carbon mitigation in this technology pathway.
Scenario 4 reduced global warming potential to 2428 kg CO2 eq, or 90.09% of the baseline. This is a reduction of 9.91%. The emission reduction mechanisms are both direct and indirect. Directly, the reduction in steam and electricity consumption results in proportional carbon emission reductions. Indirectly, the reduction in chemical usage through process optimization also lowers the embodied carbon emissions associated with the production of these chemicals. The carbon reduction benefits of this pathway are highly synergistic with its resource-saving benefits, demonstrating the foundational role of digital and intelligent technologies in driving the decarbonization of industrial systems.
Scenario 5 achieved the deepest carbon reduction, with global warming potential dropping to 1814 kg CO2 eq, or 67.31% of the baseline. This is a reduction of 32.69%. This achievement results from multi-level, multi-dimensional carbon reduction synergies. First, the intelligent optimization and process improvements from Scenario 4 reduce the baseline carbon emissions. Second, the waste heat recovery and energy efficiency improvements from Scenario 2 further lower the energy demand. Third, the clean energy substitution from Scenario 1 decarbonizes the remaining energy demand. The per-unit emission reduction benefit of clean energy substitution is amplified because the total energy demand has been lowered. Fourth, for the advanced wastewater treatment from Scenario 3, the front-end water-saving measures have significantly reduced its treatment load. The resulting increase in high-carbon electricity consumption is thus minimized. The successful demonstration of Scenario 5 shows that systematic technology integration and process redesign can not only superimpose the emission reduction effects of individual technologies but also resolve the “pollution reduction at the cost of carbon increase” dilemma, transforming potential carbon emission growth points into controllable or negligible factors.
3.3. Impact on Acidification and Eutrophication
Acidification and eutrophication are key indicators of the long-term, cumulative pressure of industrial activities on regional water bodies and terrestrial ecosystems. Acidification potential is mainly associated with emissions of sulfur dioxide (SO2) and nitrogen oxides (NOx), which can lower the pH of soil and water bodies. Eutrophication potential is associated with discharges of chemical oxygen demand (COD), total phosphorus (TP), and total nitrogen (TN) to water bodies, which can trigger algal blooms and oxygen depletion.
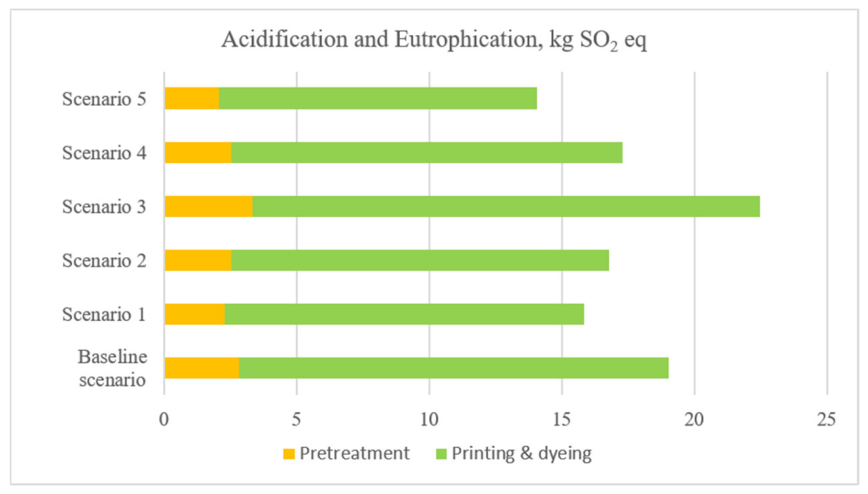
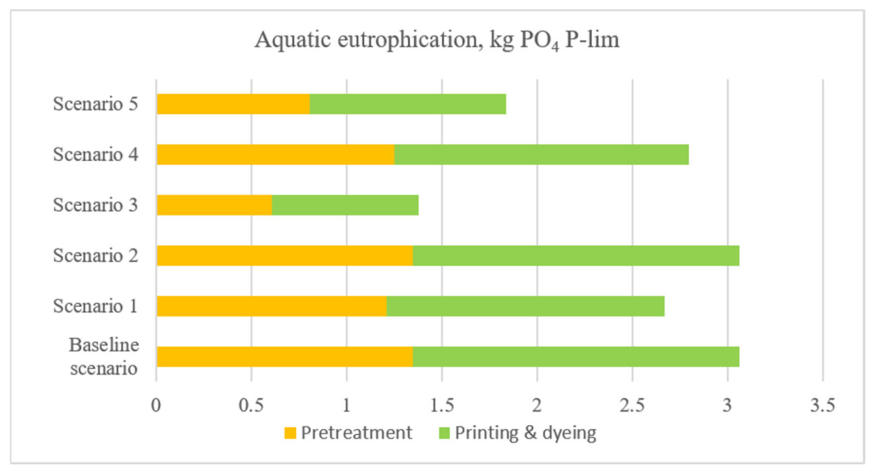
As shown in
Figure 4 and
Figure 5, the baseline scenario provides the initial environmental pressure baseline. The total terrestrial and aquatic acidification potential is 19.04 kg SO
2 eq. The total aquatic eutrophication potential is 3.06 kg PO
4 P-lim. The acidification pressure mainly comes from SO
2 and NOx emissions from coal-fired heat and power generation. The eutrophication pressure mainly comes from residual organic pollutants and nutrients in dyeing and printing wastewater after conventional treatment.
Scenario 1 shows a significant reduction in acidification potential. The total acidification potential drops to 15.86 kg SO2 eq, or 83.33% of the baseline. This is a reduction of 16.67%. The improvement is mainly due to the partial replacement of coal with natural gas. Natural gas combustion emits almost no SO2 and produces significantly lower NOx compared to coal, thus greatly reducing the precursors of acidification at the source. In contrast, the improvement in eutrophication potential is more limited. The total eutrophication potential drops to 2.67 kg PO4 P-lim, or 87.25% of the baseline. This is a reduction of 12.75%. This improvement mainly results from the use of environmentally friendly dyes and auxiliaries. These substances indirectly reduce the residual dye concentration in the wastewater. Consequently, the COD load discharged into water bodies is lowered. In addition, the reduced use of reactive dyes decreases the water demand in some pretreatment and washing processes. This, in turn, leads to a lower total volume of wastewater discharge.
Scenario 1 clearly demonstrates that cleaning the energy structure is the most effective tool for addressing regional atmospheric problems such as acid rain, but its effect on controlling nutrient pollution in water bodies is relatively indirect.
Scenario 2 shows asymmetric improvement effects on the two ecological impact categories. The total acidification potential drops to 16.79 kg SO2 eq, or 88.18% of the baseline. This is a reduction of 11.82%, which is directly related to the reduction in fuel combustion due to energy savings. However, the total eutrophication potential remains at 3.06 kg PO4 P-lim, unchanged from the baseline. This key result indicates that pure energy efficiency improvements do not alter the chemical input pattern of the production process or the concentration and nature of pollutants in the wastewater. Although the water consumption per unit of product may decrease due to condensate reuse, the pollutant load per unit of wastewater remains unchanged. Therefore, there is no direct effect on eutrophication potential. This result reveals the divergence between process energy-saving technologies and water pollution control technologies in terms of their environmental targets.
Scenario 3 provides the clearest illustration of the trade-off between pollution reduction and carbon mitigation. In terms of eutrophication potential, this scenario performs excellently. The total eutrophication potential drops sharply to 1.38 kg PO4 P-lim, only 45.03% of the baseline. This is a reduction of more than half. This result confirms the outstanding efficiency of advanced treatment technologies based on membrane separation and advanced oxidation in removing organic pollutants and nutrients from water. However, to achieve this excellent water environmental benefit, the system pays a significant cost in terms of acidification. The total acidification potential rises to 22.47 kg SO2 eq, reaching 118.00% of the baseline with an increase of 18.00%. This increase is entirely attributable to the high energy consumption of the advanced treatment facilities. This energy consumption comes mainly from the grid, which in turn causes more acid gas emissions from upstream power generation. Scenario 3 is a classic case of “pollution transfer” shifting some of the environmental pressure from water to the atmosphere. This trade-off may be an unavoidable reality in contexts where water quality targets are extremely strict but the regional energy structure remains dominated by fossil fuels. According to the normalization references for Asia (the default reference region in IMPACT 2002+), the 54.97% reduction in eutrophication potential (1.68 kg PO4 P-lim per tonne of fabric reduction) translates into an ecosystem-quality benefit of approximately 0.031 person-equivalent/year per tonne of fabric. Meanwhile, the 18.00% increase in GWP (485 kg CO2 eq per tonne of fabric increase) translates into a climate-change damage of approximately 0.015 person-equivalent/year per tonne of fabric. On the normalized scale, the net environmental balance of Scenario 3 remains positive—the ecosystem benefit (0.031) outweighs the climate damage (0.015) by a factor of approximately two.
Scenario 4 shows modest synergistic improvements in both ecological impact categories. The total acidification potential drops to 17.28 kg SO2 eq, and the total eutrophication potential drops to 2.80 kg PO4 P-lim. These represent 90.74% and 91.32% of the baseline, respectively, with reductions of about 9% in both categories. This balanced improvement comes from the source control nature of this pathway. By optimizing recipes to reduce dye and auxiliary consumption and lowering the liquor ratio to reduce water and chemical consumption, this pathway not only directly reduces the amount of pollutants in the wastewater, thereby improving eutrophication, but also indirectly reduces acid gas emissions by reducing the production and transport of related materials and the energy consumption for heating water and steam. This pathway demonstrates that by improving system resource efficiency, it is possible to achieve synergistic mitigation of multiple environmental problems without triggering significant trade-offs.
Scenario 5 successfully achieves comprehensive optimization of ecological impacts and resolves the trade-offs. The total acidification potential and total eutrophication potential drop to 14.07 kg SO2 eq and 1.84 kg PO4 P-lim, respectively, representing 73.92% and 60.00% of the baseline. This means that while achieving a 40% reduction in eutrophication potential, the acidification potential also decreases by more than 26%. How is this possible? The logic lies in the systematic design. First, intelligent optimization and process improvements from Scenario 4 reduce pollutant and energy demand at the source. Second, clean energy substitution from Scenario 1 fundamentally reduces the acidification potential per unit of energy consumed. Third, waste heat recovery from Scenario 2 further reduces total energy demand. Fourth, although advanced wastewater treatment from Scenario 3 is still applied, the front-end water-saving measures have dramatically reduced the volume of wastewater requiring treatment. As a result, the treatment scale and the load on high-energy-consumption units are significantly reduced, and the negative impact on acidification potential is minimized. Scenario 5 proves that through careful sequencing and synergistic optimization, it is possible to break the “pollution reduction at the cost of acid gas increase” deadlock.
3.4. Impact on Human Health
The potential impact of industrial processes on human health is mainly characterized by the risk of respiratory diseases caused by exposure to air pollutants. This study focuses on two key health impact indicators: respiratory organics potential (expressed as kg C2H4 eq) and respiratory inorganics potential (expressed as kg PM2.5 eq). Respiratory organics originate mainly from the emission of volatile organic compounds (VOCs) during production. Respiratory inorganics are mainly associated with emissions of SO2, NOx, and primary particulate matter from fuel combustion and process operations.
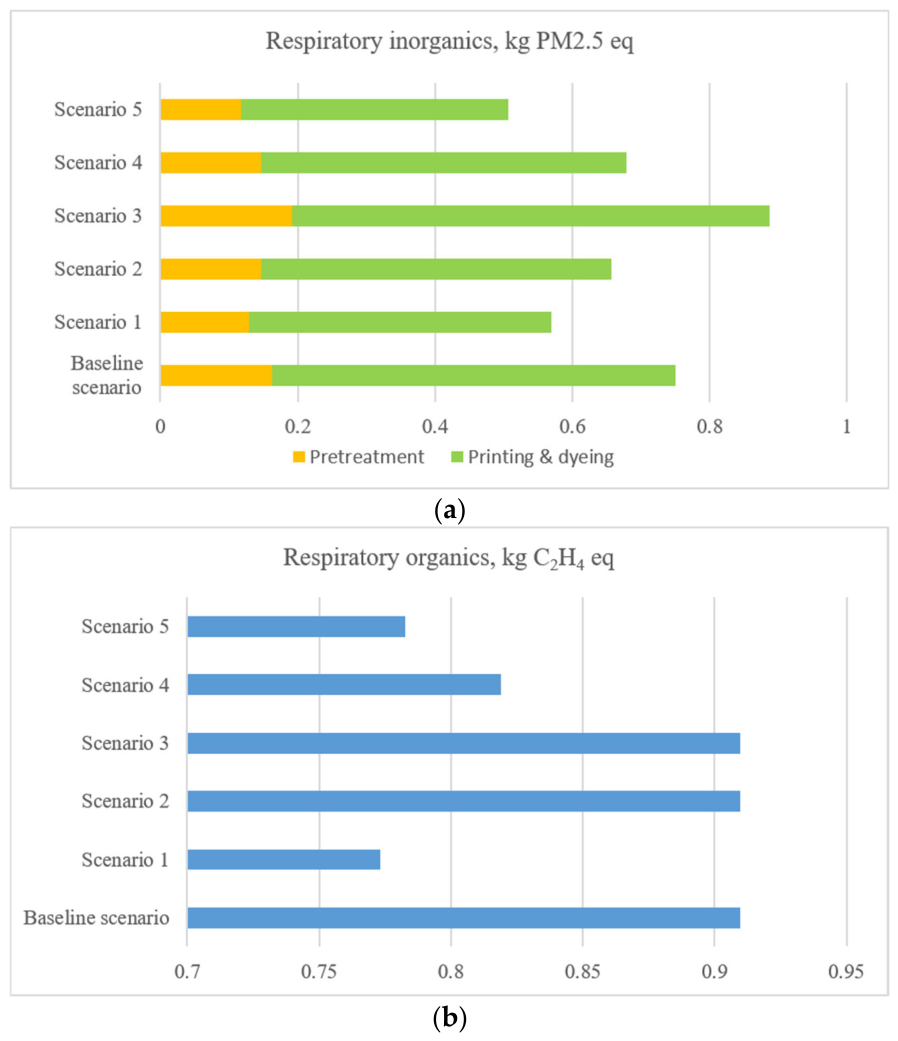
The evaluation results of the impact of various scenarios on human health are shown in
Figure 6. The baseline scenario sets the health impact baseline. The respiratory organics potential is 0.91 kg C
2H
4 eq. The total respiratory inorganics potential is 0.75 kg PM
2.5 eq. These emissions come mainly from the volatilization of organic compounds from high-temperature processes such as stenter setting, and from the indirect emissions of acid gases and particles from coal-fired steam and electricity production.
Scenario 1 shows significant and targeted health improvements. The respiratory inorganics potential drops sharply to 0.57 kg PM2.5 eq, or 76.03% of the baseline. This is a reduction of 23.97%. This excellent performance is directly due to the cleaning of the energy structure. Replacing coal with natural gas almost eliminates SO2 emissions and significantly reduces NOx and primary particle generation. Replacing a portion of grid electricity with photovoltaic power further reduces pollutant emissions from power generation. The respiratory organics potential drops to 0.77 kg C2H4 eq, or 85.00% of the baseline. This is a reduction of 15.00%. This improvement may be partly due to the use of environmentally friendly dyes and auxiliaries, which have lower volatility. Scenario 1 clearly demonstrates that adjusting the energy supply is the most powerful lever for reducing the health risks associated with inorganic pollutants closely linked to fuel combustion.
Scenario 2 shows an “inorganics significant, organics ineffective” pattern of health improvement. The respiratory inorganics potential drops to 0.66 kg PM2.5 eq, or 87.44% of the baseline. This is a reduction of 12.56%, which is directly related to the reduction in fuel consumption due to energy savings. However, the respiratory organics potential remains at 0.91 kg C2H4 eq, unchanged from the baseline. This is because waste heat recovery and condensate reuse do not affect the core process steps that generate VOCs, such as stenter temperature or the type and amount of oils used. This result clearly demarcates the boundary between process energy-saving technologies and VOCs pollution prevention technologies.
Scenario 3 shows a negative effect on human health. The respiratory inorganics potential rises to 0.89 kg PM2.5 eq, reaching 118.40% of the baseline. The increase is significant. This is entirely attributable to the added energy consumption of the advanced treatment facilities. The respiratory organics potential remains unchanged at 0.91 kg C2H4 eq, indicating that this technology focuses on water pollutant treatment and has no direct effect on airborne organic pollutants. This scenario again warns that if the cleanliness of the energy structure is ignored, upgrading end-of-pipe treatment alone may, while improving environmental quality in one medium, exacerbate pollution in another medium, thereby creating new risks to public health.
Scenario 4 shows synergistic improvements in both health indicators. The respiratory organics potential drops to 0.82 kg C2H4 eq, and the respiratory inorganics potential drops to 0.68 kg PM2.5 eq. These represent 90.00% and 90.51% of the baseline, respectively. This comprehensive improvement comes from the dual mechanisms of source control and process optimization. AI-based color matching and precise chemical dosing reduce the total amount of dyes and chemicals used and the associated volatilization. Low-liquor-ratio and low-temperature processes reduce heating energy consumption, thereby indirectly reducing fuel-combustion-related inorganic emissions. The energy management system improves overall energy efficiency. This pathway demonstrates that increasing the “intelligence” and refinement of the production system can synergistically reduce potential threats to worker health and public health.
Scenario 5 achieves optimal control of potential human health impacts. The respiratory organics potential and respiratory inorganics potential drop to 0.78 kg C2H4 eq and 0.51 kg PM2.5 eq, respectively, representing 85.80% and 67.46% of the baseline. This means that while achieving a 14% reduction in VOCs emissions, the reduction in inorganic pollutants, which are more directly and broadly harmful to the respiratory system, exceeds 32.54%. This outstanding achievement is due to systematic multi-technology synergy. Intelligent optimization from Scenario 4 first reduces the baseline of pollutant generation. Clean energy substitution from Scenario 1 then fundamentally reduces the health impact intensity of energy consumption. Waste heat recovery from Scenario 2 further lowers total energy demand, amplifying the marginal health benefits of clean energy. The health side effects of advanced treatment from Scenario 3 are greatly suppressed because its front-end load is significantly reduced. Scenario 5 demonstrates that full-chain technology integration—encompassing source reduction, process control, and clean energy substitution—can effectively reduce potential health risks for both workers and the general public.
It is noteworthy that the reduction rates for VOCs (14%) and NOx (10.67%) in Scenario 5 are substantially lower than those achieved for COD (40.00%) and SO2 (40.78%). This disparity warrants careful explanation, as it reflects fundamental differences in emission characteristics and technological targeting.
First, the reduction mechanisms differ in nature. The COD reduction is achieved through two direct technological pathways: the UF/RO membrane system physically removes organic pollutants from wastewater, while front-end water-saving measures reduce the total wastewater volume, proportionally lowering the pollutant mass load. Similarly, the SO2 reduction is a direct consequence of fuel substitution—natural gas combustion contains negligible sulfur—and is stoichiometrically determined. In contrast, Scenario 5 does not incorporate any dedicated VOCs end-of-pipe treatment upgrades (e.g., activated carbon adsorption, RTO, or RCO systems). The achieved VOCs reduction is therefore an indirect co-benefit derived primarily from reduced throughput (via intelligent process optimization) and decreased solvent handling, rather than from targeted abatement.
Second, the “gate-to-gate” system boundary of LCA inherently favors point-source pollutants. COD and SO2 emissions are concentrated at identifiable point sources—the wastewater outfall and the boiler stack, respectively—making them readily quantifiable and amenable to targeted intervention. VOCs emissions, conversely, originate from multiple diffuse and fugitive sources distributed across stenter setting, coating, printing, chemical storage, and wastewater treatment processes. Therefore, over 85% of the COD reduction and over 90% of the SO2 reduction are attributable to interventions applied to single dominant process nodes, whereas the VOCs reduction is distributed across different source categories.
3.5. Synergy Coefficient Analysis
To quantitatively assess the synergistic effect of pollution and carbon reduction, this study introduces the synergy coefficient (S). This coefficient is based on the concept of cross-elasticity of emission reductions. It reflects the relative strength and efficiency of air pollutant reduction in achieving carbon reduction.
The synergy coefficient is calculated using the following formula:
where ΔE
AP/E
AP,0 is the reduction rate of air pollutants, and ΔE
C/E
C,0 is the reduction rate of CO
2 emissions. In this study, the LCI does not include direct emissions of CH
4 or N
2O; consequently, the GWP reduction rate is numerically equivalent to the CO
2 reduction rate. The use of GWP in the formula maintains consistency with the IMPACT 2002+ characterization framework. In the IMPACT 2002+ framework, the key midpoint categories related to air pollutants are “Respiratory Inorganics” and “Acidification.” While acidification primarily concerns the acidification of soil and water, respiratory inorganics directly addresses particulate matter and aerosol effects on human health, both of which are representative of air quality improvements. Therefore, the “Air Pollutant Reduction Rate” used for the synergy coefficient is derived from a composite of the reduction in Respiratory Inorganics Potential and Acidification Potential.
The coefficient is named “synergy coefficient” (S) in this study, following the established nomenclature in Chinese environmental management and policy documents, where it is widely used to characterize the co-benefit relationship between air pollutant reduction and carbon mitigation. When S ≤ 0, there is no synergy. When S > 0 and CO2 and air pollutants are both reduced, there is synergy. When 0 < S < 1, the reduction effect on CO2 is greater than that on air pollutants. When S = 1, the reduction effects are comparable. When S > 1, the reduction effect on air pollutants is greater than that on CO2.
Based on the LCA results, the synergy coefficients for the five scenarios were calculated. For Scenario 1, the air pollutant reduction rate is 26.04%, and the CO2 reduction rate is 19.93%. The resulting synergy coefficient is 1.31. This indicates “strong pollution-reduction synergy,” meaning that for every unit of CO2 reduction, 1.31 units of equivalent air pollutants are reduced. This is mainly due to the direct replacement of coal with natural gas, which is the dominant source of SO2 emissions.
For Scenario 2, the air pollutant reduction rate is 12.90%, and the CO2 reduction rate is 13.54%. The synergy coefficient is 0.95. This is close to 1, indicating “balanced synergy.” Energy-saving technologies reduce both carbon emissions and air pollutants at nearly the same rate, reflecting the common source of both types of emissions from fossil fuel combustion.
For Scenario 3, both the air pollutant reduction rate and the CO2 reduction rate are positive (+18.03% and +18.00%, respectively). This means emissions increased rather than decreased. Scenario 3 reduces eutrophication potential by 54.97%, but it increases air pollutant emissions by 18.03% and GWP by 18%. Therefore, Scenario 3 is a typical case of trading increased energy consumption for reduced water pollution. The synergy coefficient is approximately 1 in absolute value, but the concept of synergy does not apply because both emissions increased. The synergy coefficient is designed to measure whether the reductions in pollutant and CO2 emissions are synergistic. It is not applicable to Scenario 3, where emissions increase rather than decrease. This scenario shows no synergy and exhibits a “both increase” effect.
To identify the conditions under which Scenario 3 would cease to increase global warming potential, we conducted a break-even analysis based on the relationship between additional electricity consumption and grid carbon intensity. In Scenario 3, the advanced wastewater treatment system (UF/RO + advanced oxidation) increases electricity consumption by approximately 866.7 MJ per tonne of fabric (from 4815 MJ to 5681.7 MJ), equivalent to approximately 240.8 kWh per tonne of fabric (assuming a conversion factor of 3.6 MJ/kWh for grid electricity). This additional electricity consumption, under the current Zhejiang grid emission factor of 0.4974 kg CO2/kWh, translates to approximately 119.8 kg CO2 eq per tonne of fabric—which accounts for the observed 18.00% GWP increase in Scenario 3. The break-even grid carbon intensity—the threshold at which the additional electricity consumption would produce zero net GWP increase—can be calculated as:
Break-even EF = (GWP increase from Scenario 3)/(Additional electricity consumption) = 485 kg CO2 eq/240.8 kWh = 2.01 kg CO2/kWh
This threshold is approximately four times higher than the current Zhejiang grid emission factor (0.4974 kg CO2/kWh) and approximately 3.7 times higher than the East China regional grid average (0.5500 kg CO2/kWh). In other words, under the current and foreseeable grid carbon intensities in Zhejiang and East China, Scenario 3 will continue to incur a GWP penalty. Only if the grid carbon intensity were to exceed 2.01 kg CO2/kWh—an unlikely scenario given China’s ongoing power sector decarbonization—would the GWP increase from Scenario 3 be eliminated.
Alternatively, the same break-even condition could be achieved through reducing the specific energy consumption of the advanced treatment system. If the membrane system’s electricity demand could be reduced from the current 240.8 kWh per tonne of fabric to approximately 60.2 kWh per tonne of fabric (a 75% reduction)—corresponding to an energy intensity of approximately 0.6–0.7 kWh/m3 of wastewater treated—Scenario 3 would also reach GWP neutrality under the current grid mix. While such a reduction is theoretically possible with next-generation low-energy membranes and advanced oxidation technologies, it is not yet achievable at commercial scale in the textile industry.
This threshold analysis confirms that the trade-off between water pollutant reduction and carbon increase in Scenario 3 is robust under current and foreseeable energy conditions in Zhejiang Province. It also highlights that future grid decarbonization and membrane energy efficiency improvements are the two key pathways to resolving this trade-off.
For Scenario 4, the air pollutant reduction rate is 9.63%, and the CO2 reduction rate is 9.91%. The synergy coefficient is 0.97, again indicating “balanced synergy”. Source-level intelligent control saves resources and energy, and the reduction is transmitted almost proportionally to carbon emissions and air pollutants.
For Scenario 5, the air pollutant reduction rate is 35.45%, and the CO2 reduction rate is 32.69%. The synergy coefficient is 1.08, indicating “strong pollution-reduction synergy.” The integrated pathway achieves deep carbon reduction while achieving an even slightly greater reduction in air pollutants. This is mainly due to the “clean energy substitution” and “source reduction” measures in the technology sequence, which are highly efficient at directly reducing air pollutants.
It should be noted that the synergy coefficient described above is a descriptive indicator rather than a causal one. It measures the relative balance between the reduction in air pollutants and the reduction in carbon emissions—specifically, the ratio of percentage changes between the two impact categories. While this coefficient is useful for comparing the co-benefit structure across different scenarios, it does not by itself demonstrate that technologies interact synergistically, nor does it prove causality or super-additivity. A coefficient greater than 1 indicates that, in relative terms, air pollutant reduction outpaces carbon reduction; it does not confirm that the combined effect of multiple technologies exceeds the sum of their individual contributions.
3.6. Integrated Effects
To substantiate the claim that Scenario 5 produces synergistic effects exceeding the sum of its individual components within the scenario-based modeling framework, we conducted a counterfactual comparison between a purely additive combination of Scenarios 1–4 and the actual integrated Scenario 5. Under the additive assumption—where technologies operate independently without interactions—the expected reduction rate for each impact category would be the arithmetic sum of the reductions achieved by Scenarios 1, 2, 3, and 4.
Using global warming potential (GWP) as the primary indicator, the additive expectation is calculated as:
Additive GWP reduction = 19.93% (S1) + 13.54% (S2) + (−18.00%) (S3) + 9.91% (S4) = 25.38%
The actual GWP reduction achieved by Scenario 5 is 32.69%. The difference—7.31 percentage points—suggests the net super-additive synergy arising from positive interactions among the component technologies under the assumptions of our scenario-based modeling approach. This excess reduction is attributable to the cascade optimization mechanism: front-end intelligent control and water-saving measures reduce the baseline loads, which in turn amplifies the marginal benefits of waste heat recovery and clean energy substitution, while simultaneously minimizing the energy penalty of advanced wastewater treatment.
For eutrophication potential, the standalone additive value is 12.75% + 0% + 54.97% + 8.68% = 76.4%. In contrast, the actual value of Scenario 5 is 40.00%. The integrated result being lower than the standalone additive value does not indicate poor performance. On the contrary, it reflects the successful suppression of the GWP penalty from Scenario 3. In the standalone additive scenario, Scenario 3 achieved a 54.97% eutrophication reduction at the cost of an 18.00% increase in GWP. However, in Scenario 5, the front-end water-saving measures substantially reduced the volume of wastewater requiring advanced treatment. This downsized the deployment scale of the UF/RO system and curbed its carbon penalty. The integrated design thus achieves a more balanced outcome—a substantial eutrophication reduction of 40.00% without an accompanying carbon increase.
This counterfactual analysis confirms that Scenario 5 delivers a genuine super-additive benefit in GWP reduction, while also demonstrating effective management of the trade-off in eutrophication. The results validate a systems engineering principle: following the sequential integration path of “source prevention → energy efficiency improvement → energy substitution → end-of-pipe treatment” can yield outcomes that simple addition of individual technologies cannot achieve.
3.7. Sensitivity Analysis
The results presented in the preceding sections are based on deterministic foreground inventory values derived from a single representative enterprise. However, key parameters in industrial practice are subject to inherent variability. To assess the robustness of the findings and to address the reviewer’s suggestion, a one-parameter-at-a-time sensitivity analysis was conducted on the most influential uncertain parameter in the inventory—the specific steam consumption per tonne of fabric. This parameter was selected because (i) it exhibits the widest reported range among all foreground parameters (2.5 to 3.5 t steam/t fabric, see
Section 2.3), (ii) steam consumption accounts for the largest share of both energy input and associated emissions across all scenarios, and (iii) variations in steam consumption propagate directly to non-renewable energy depletion, global warming potential, acidification, and respiratory inorganics—the four impact categories most sensitive to combustion-related emissions.
The analysis was performed for Scenario 5, the integrated pathway that demonstrated the best overall environmental performance, using the lower bound (2.5 t/t) and upper bound (3.5 t/t) of the reported range, while holding all other parameters at their baseline values. For each bound, the modified inventory flows were recalculated by scaling the steam-related input quantities proportionally, with all emission factors (CO
2, SO
2, NOx, and particulate matter) adjusted linearly with the change in steam consumption. The relative change in environmental impact was then computed using the following formula:
where
Ibase is the impact value under the baseline steam consumption (3.0 t/t fabric) and
Ibound is the impact value under the lower or upper bound of steam consumption. The results of this sensitivity analysis are summarized in
Table 4.
The sensitivity analysis reveals that varying the steam consumption within its reported range produces changes of approximately 5.5% to 5.9% in the affected impact categories. Most critically, the relative ranking of the five scenarios remains unchanged under both extreme assumptions: Scenario 5 consistently outperforms all other pathways across all impact categories. This is because the variations in steam consumption apply proportionally to all scenarios, and the superiority of Scenario 5 arises from its structural integration of multiple technologies—intelligent control, waste heat recovery, clean energy substitution, and downsized advanced treatment—rather than from any single input parameter. The reductions achieved by Scenario 5 relative to the baseline scenario remain substantial across the entire range of steam consumption, ranging from 27.5% to 34.6% for non-renewable energy depletion and from 29.0% to 36.4% for global warming potential. These findings indicate that the main conclusions of this study are qualitatively robust to reasonable variations in the foreground parameters.
It is important to acknowledge that the sensitivity analysis presented here is limited in scope. A more comprehensive uncertainty assessment—such as Monte Carlo simulation with defined probability distributions for multiple parameters (e.g., steam consumption, electricity intensity, heat recovery efficiency, photovoltaic substitution rate, and chemical substitution rates) and explicit correlation structures among dependent variables—would provide a more rigorous quantitative framework.
5. Conclusions
This study evaluated the environmental performance of five synergistic technology pathways for pollution and carbon reduction in the DF industry, using Zhejiang Province as a regional case study. A hybrid LCA model was constructed following the ISO 14040/14044 standards. The IMPACT 2002+ method was applied to quantify 7 environmental impact categories across a baseline scenario and five optimization scenarios. The results reveal the strengths and limitations of each pathway and demonstrate the superiority of an integrated approach. The main findings of this study are as follows:
(1) Individual technology pathways each have specific strengths but also face inherent limitations, within the scope of this analysis. Scenario 1 showed the strongest single-technology carbon reduction effect among the scenarios considered, reducing global warming potential by 19.93%, but its effect on water pollution was relatively limited. Scenario 2 provided moderate reductions in energy consumption and carbon emissions but had no effect on eutrophication potential or VOCs emissions within the modeled system. Scenario 3 was found to be highly effective at reducing eutrophication potential by 54.97%, but it increased global warming potential by 18.00%, revealing a clear “pollution reduction at the cost of carbon increase” dilemma. Scenario 4 achieved modest synergistic improvements across multiple indicators, with reductions of approximately 9% in both acidification and eutrophication potentials, but the magnitude of these improvements remained constrained under the assumed conditions.
(2) The integrated Scenario 5 achieved the best overall environmental performance across all impact categories. It reduced non-renewable energy consumption by 30.90%, global warming potential by 32.69%, acidification potential by 26.08%, and eutrophication potential by 40.00%, relative to the baseline. This performance far exceeded that of any single-technology pathway. The synergy coefficient of Scenario 5 was 1.08, indicating strong pollution-reduction synergy. This suggests that, within the scenario-based modeling framework of this case study, systematic integration that proceeds sequentially from source prevention to end-of-pipe treatment—via process efficiency and energy substitution—may produces multiplicative rather than additive effects, though further empirical validation would be beneficial.
(3) The cascade optimization mechanism is identified as the key to Scenario 5’s superior performance under the assumptions and conditions of this study. Front-end intelligent control and water-saving measures first reduced total system demand. This “slimming down” amplified the effectiveness of subsequent energy-saving measures. The reduced total energy demand also made clean energy substitution more affordable. Finally, the reduced wastewater volume minimized the energy penalty of advanced treatment. This systematic design, within the scenario-based modeling framework of this study, successfully resolved the trade-offs faced by individual technologies, transforming potential carbon emission growth points into controllable factors within the scenario framework.
(4) Extrapolating Scenario 5 to the entire TDP industry in Zhejiang Province shows substantial regional environmental benefits. The technology package is projected to reduce COD emissions by 40%, ammonia nitrogen by 39.76%, SO2 by 40.78%, NOx by 10.67%, and VOCs by 14%, based on the assumptions and data used in this study. These reductions would effectively relieve eutrophication pressure on water bodies and contribute to improving regional air quality. These results indicate that Scenario 5 not only achieves strong synergy between pollution reduction and carbon mitigation at the micro-enterprise level, but also exhibits significant environmental governance potential at the macro-industrial scale within the context of this case study.