Article

Research on the Impact of China’s Forestry Green Total Factor Productivity on Forest Ecological Security


1
School of Economics and Management, Jiangxi Agricultural University, Nanchang 330045, China
2
School of Public Administration, Jiangxi University of Finance and Economics, Nanchang 330013, China
*
Author to whom correspondence should be addressed.
These authors contributed equally to this work.
Sustainability 2026, 18(15), 8004; https://doi.org/10.3390/su18158004
Submission received: 6 July 2026 / Revised: 29 July 2026 / Accepted: 4 August 2026 / Published: 6 August 2026

Abstract

China’s forest ecological security (FES) system is currently undergoing a transformative phase characterized by the synergy between quantitative expansion and qualitative improvement. Against the backdrop of advancing ecological civilization, China has particular difficulties juggling economic expansion with ecological preservation. Improving forestry green total factor productivity (FGTFP) is regarded as a crucial pathway to achieving the dual objectives of “sustaining forestry growth without deforestation and ensuring ecological security without compromising output.” This study employs panel data from 30 Chinese provinces spanning 2004 to 2018. The entropy weight method and super-efficiency SBM-GML index model are utilized to quantitatively measure FES and FGTFP, respectively. This empirically examines the underlying mechanisms and threshold effects governing their relationship. The results indicate that FGTFP significantly improves FES, with urbanization exerting a positive moderating effect. Heterogeneity analysis reveals that FES dividends derived from FGTFP are more pronounced in southern collective forest regions and economically developed areas. Further threshold testing uncovers distinct patterns: once economic agglomeration surpasses specific thresholds, FGTFP triggers a stepwise surge in its positive effect on FES. While crossing its respective threshold, the tertiary industry share exhibits an inverted U-shaped trajectory. This research elucidates the stage-specific patterns of China’s green forestry transition, offering differentiated policy insights for fostering high-quality forestry development and strengthening the national ecological security barrier.

1. Introduction

In Albert Schweitzer’s philosophy of civilization, the benchmark of a truly advanced society is its extension of ethical reverence for life to the entire biosphere [1], necessitating a fundamental reconciliation between humanity and nature. Under this lens, forest ecological security (FES) is not merely an environmental metric but an empirical indicator of this harmony. Serving as a vital gauge of ecosystem health and service provision, FES is instrumental in evaluating ecological governance and addressing global crises, including climate change and biodiversity loss [2,3,4,5]. While the 2020 Global Biodiversity Framework emphasizes ecosystem restoration, FES remains under severe pressure from climate change and land-use conflicts. In China, despite achieving over 30 years of continuous growth in forest coverage, this “quantity” fails to guarantee “quality” [6]. Official data indicate that China’s forest stocking density is only about 70% of the world average. The dominance of artificial pure forests exacerbates problems like soil fertility decline and biodiversity loss, leaving China’s overall forest security performance trailing that of leading forested nations.
Serving as the linchpin of forestry supply-side reform, China’s forestry industry faces a growing rift between production efficiency and ecological costs despite rapid expansion [7]. Reliance on traditional, resource-intensive models persists, shifting priorities from conservation to exploitation. Deepening tenure reforms have spawned heterogeneous actors—from profit-driven commercial plantations to ecologically committed family farms—leading to behavioral fragmentation and a chronic “timber-or-ecology” trade-off [8,9]. This dynamic fuels significant spatiotemporal variability in ecosystem security. Examining the impact of forestry green total factor productivity (FGTFP)—which integrates economic and environmental performance—is thus essential. It illuminates the complex synergy between ecology and economy in green transitions and offers vital insights for leveraging technology, market optimization, and compensation schemes to safeguard forest security and drive sustainable growth.
Scholarly understanding of FES originates with Carl von Carlowitz’s 18th-century sustained-yield principle, which required timber use to preserve future availability [10]. Yet, this view primarily served timber provision. Only by the early 20th century were forests conserved as sustainable resources. Today, the “Lucid Waters and Lush Mountains Are Invaluable Assets” philosophy has repositioned FES from a marginal externality to a cornerstone of national security [11], shifting evaluation metrics from simple yield to the holistic health of the “community of life.” FES is defined as an ecosystem’s capacity to sustain structure, function, and services amid disturbances [12,13]. Beyond its biophysical implications, FES represents a vital conduit through which natural capital is transformed into human well-being [14,15]. This encompasses not only provisioning services but also critical contributions to public health, disaster mitigation, and recreational opportunities. Consequently, evaluating FES shifts from a purely environmental metric to a comprehensive assessment of nature’s contributions to society. Research predominantly employs PSR or DPSIR frameworks across biophysical, economic, and social indicators [16,17,18], identifying natural disasters, urbanization, market volatility, and policy as key drivers [19]. Crucially, FGTFP mitigates the growth-protection trade-off by replacing extensive practices with intensive ones. Green technological advancements allow for higher economic returns with less land conversion, reduced harvesting, and lower chemical and energy use [20,21], easing direct exploitation pressures. Furthermore, the drive for green efficiency promotes better silviculture—including optimized thinning and species mixing—and stronger environmental enforcement, actively restoring forest health [22]. Ultimately, rising FGTFP supports carbon neutrality targets, marking the pivot from quantitative forestry growth to a qualitative, high-efficiency model.
Against this backdrop, this study seeks to address three critical research gaps. First, while the literature on measuring FGTFP and FES is extensive, studies seldom integrate the two within a unified causal framework. There remains a paucity of direct empirical evidence regarding the core question: Can improvements in green efficiency substantively translate into tangible ecological security guarantees? Second, existing research largely overlooks the contextual contingencies of this relationship, neglecting the moderating roles of urbanization and industrial structure upgrading, which leaves a systematic analysis of their intrinsic linkages underdeveloped. Third, the threshold conditions and optimal ranges for FGTFP to exert positive ecological effects remain ambiguous. It is unclear whether the release of ecological dividends is subject to threshold effects and heterogeneous characteristics across different regions and conditions.
The study uses Chinese provincial panel data from 2004 to 2018 to fill in these gaps. It uses an entropy-weighted approach to create a FES index and a super-efficiency SBM-GML index model that includes unwanted outputs to quantify FGTFP. Furthermore, by applying moderation effect models and panel threshold models, the study systematically investigates the mechanisms through which FGTFP affects FES. Compared to prior research, the study’s marginal contributions are threefold. First, by empirically verifying the direction, magnitude, and robustness of the impact of FGTFP on FES, it enriches the literature on the synergy between ”green growth” and “ecological security.” Second, by incorporating urbanization and industrial structure upgrading into the analytical framework as moderators, it reveals how macro-structural changes reshape the ecological empowerment effect of forestry green efficiency, offering a contextually grounded perspective with greater explanatory power. Third, it identifies the threshold characteristics of economic agglomeration and the tertiary industry share in the FGTFP–FES nexus, confirming the stage-specific constraints on releasing ecological dividends. These findings provide crucial decision-making references for formulating differentiated policies for high-quality forestry development and for the precision enhancement of FES barriers.

2. Theoretical Analysis and Research Hypotheses

2.1. The Direct Impact of FGTFP on FES

FGTFP serves as a comprehensive metric for assessing the contribution of all inputs—including land, labor, capital, technology— to outputs in forestry economic activities. By moving beyond the limitations of traditional single-factor productivity measures, FGTFP provides a holistic indicator of green development [23]. Improvements in FGTFP facilitate the sustainable utilization of forestry resources and promote green economic growth, thereby underpinning FES.
In the forestry sector, gains in FGTFP typically stem from technological innovation and optimized resource allocation. Economic growth theory underscores technological advancement as a primary driver of production efficiency, which primarily affects FES through curbing resource consumption, mitigating environmental pollution, and fostering ecological restoration. First, leveraging natural comparative advantages allows for a “greening” of the factor input structure. Technological progress reduces the land, water, and energy intensity per unit of output, thereby alleviating overexploitation pressures and safeguarding FES [24]. Second, increased green investment disrupts the traditional development paradigm reliant on deforestation. It incentivizes a shift where capital transitions from a mere input to a valuable output within the forestry production function. For instance, reducing chemical pesticide and fertilizer use lowers soil and water pollution risks, enhances energy conservation and emission reduction efficiency, and lessens forest pollution [25]. Last but not least, guided by sustainable development principles, the economic returns generated by expanding FGTFP can be channeled into ecological restoration initiatives. This approach reduces direct reliance on forest resources while stimulating green sectors such as ecotourism and the understory economy. By facilitating quantitative valuation of forest ecological services, this ecological compensation mechanism ensures the long-term sustainability of forest resource supply. Consequently, aligned with green development tenets, enhancement of FGTFP significantly improves forest ecosystem integrity. Based on this theoretical framework, Hypothesis 1 is proposed:
H1. 
The improvement of FGTFP exerts a significantly positive impact on FES.

2.2. Moderating Effects of Urbanization and Industrial Structure Upgrading

The acceleration of urbanization signifies far more than the mere spatial concentration of populations; it represents a fundamental shift in production paradigms and consumption patterns [26]. While the urbanization process inherently drives increased resource consumption, it also generates countervailing forces that benefit FES. Specifically, urban greening initiatives, stimulated by the combination of tourism and forestry as well as the implementation of stricter environmental regulations, have yielded significant positive contributions to FES [21,27]. This phenomenon can be partly attributed to rural-to-urban migration, which alleviates direct anthropogenic pressures on forest ecosystems by reducing the scattered encroachment of rural populations on forestland. Concurrently, higher levels of urbanization incentivize local governments and societal stakeholders to augment investments in ecological governance, encompassing forest conservation and ecosystem restoration [21,28]. By amplifying these mechanisms, urbanization is poised to strengthen the positive impact of FGTFP on FES. Accordingly, Hypothesis 2 is proposed:
H2. 
Urbanization exerts a positive moderating effect on the relationship between FGTFP and FES, implying that higher urbanization levels reinforce the beneficial impact of FGTFP on FES.
Building on Hoffmann’s thesis, economic development is typically accompanied by a structural shift in industrial mix, marked by a decline in agriculture and a rise in manufacturing and services, fundamentally altering patterns of resource consumption. The upgrading of industrial structure not only enhances FGTFP but also mitigates pressures on forest ecosystems at the source [29]. This mechanism operates through two primary channels. First, the core feature of industrial upgrading is the progression of the value chain from low to high-end, which manifests in the forestry sector as a systemic transition from traditional logging to high-value-added industries. This transition replaces resource-intensive, polluting industries with greener, low-carbon alternatives, thereby weakening resource dependence and substituting away from pollution-heavy production. While traditional forestry relies heavily on timber extraction, the rise of secondary and tertiary industries—such as deep processing of forest products, forest health tourism, and carbon sink trading—transforms forests from mere sources of raw materials into ecological assets. This value-added pathway reduces reliance on primary forests [14,30]. Second, industrial upgrading stimulates technological progress and improves resource use efficiency, indirectly bolstering FES. The adoption of green technologies facilitates a shift from extensive management to precision forestry. By promoting the resource utilization of waste products and reducing pollutant emissions, upgrading drives the dual development of forest resources in terms of both quantitative expansion and qualitative improvement [25]. Consequently, Hypothesis 3 is proposed:
H3. 
Industrial structure upgrading exerts a positive moderating effect on the relationship between FGTFP and FES, implying that higher levels of industrial upgrading reinforce the beneficial impact of FGTFP on FES.

2.3. Threshold Effects of Economic Agglomeration Level and Proportion of Tertiary Sector

Drawing on externality theory and the Environmental Kuznets Curve (EKC) hypothesis, this study posits that economic agglomeration and tertiary industry development do not influence FES in a linear fashion. While the existing literature frequently identifies these factors as key drivers of environmental change [21,25], their specific relevance to FES warrants further theoretical clarification. Unlike industrial pollutants, forests provide immobile ecosystem services that are highly sensitive to spatial economic structures and industrial land-use patterns. Economic agglomeration shapes the spatial distribution of resource consumption intensity, whereas the tertiary sector determines the extent of economic decoupling from resource extraction. Therefore, selecting these two variables allows for a nuanced examination of how structural transformation moderates the ecological dividends of FGTFP.
Economic agglomeration demonstrates a threshold effect characterized by marginal incremental returns on FES. As a defining feature of modern economic activities, economic agglomeration facilitates the spatial concentration of resources, talents, and technology [15]. From the perspective of forest-specific land-use competition, higher agglomeration implies that human activities and production facilities are concentrated in non-forested areas, potentially reducing the direct encroachment of agricultural and industrial expansion into forested lands [31].
In the initial stages of low agglomeration, economic activities are spatially dispersed and operate at suboptimal scales, failing to generate effective environmental economies of scale [32,33]. During this phase, although improvements in FGTFP enhance forestry production efficiency, the lack of infrastructure and the inability to share pollution abatement facilities constrain positive ecological spillovers. However, once economic agglomeration surpasses a critical threshold, it triggers scale economies and technological spillovers. On the one hand, agglomeration reduces resource consumption and pollution emission intensities per unit of output [34], freeing up limited forestry resources to prioritize ecological conservation over mere production expansion. More importantly, high-density economic zones often enforce stricter environmental regulations and offer better-paid non-farm jobs, which discourages local households from relying on fuelwood collection and subsistence logging, thereby indirectly protecting forest stocks [35]. On the other hand, high-agglomeration zones possess greater capital and technological density, which accelerates the R&D and diffusion of green forestry technologies [23]. This amplifies the positive impact of FGTFP on key security indicators such as forest coverage and growing stock. Consequently, it is only after crossing this critical point—where “agglomeration dividends” materialize—that the positive driving effect of FGTFP on FES is significantly strengthened. Accordingly, Hypothesis 4 is proposed:
H4. 
Economic agglomeration exerts a single-threshold effect on the FGTFP–FES nexus. Specifically, once economic agglomeration surpasses a threshold value, the positive impact of FGTFP on FES is significantly reinforced.
Elevation of the tertiary sector share demonstrates a distinct threshold-dependent leapfrog pattern in FGTFP’s impact on FES. Empirical evidence suggests that an increasing proportion of tertiary industry significantly enhances FES [36]. This study focuses on the tertiary sector because, unlike heavy industry, service-oriented economies theoretically exert lower direct pressure on forest resources. However, the transition from a resource-based to a service-based economy involves complex interactions between consumption patterns and ecological footprints.
Specifically, at low levels of tertiary industry development, regional economies typically remain dominated by resource-exhaustive industries [37]. The underdevelopment of the service sector renders its substitution effect on forest ecosystems negligible. Consequently, even substantial improvements in FGTFP may be offset by the expansionary pressures of traditional industries, failing to translate into tangible gains in FES. However, once the tertiary sector share crosses a specific threshold—particularly with the maturation of high-value-added sectors such as finance, technology services, and ecotourism—the economy’s direct reliance on natural resource extraction diminishes markedly. In the context of forestry, the growth of ecotourism and forest wellness industries creates direct economic incentives for local stakeholders to preserve standing forests rather than converting them to cropland. The rapid expansion of high-end services, driven by large market scales and strong consumption capacities, contributes significantly to sustainable forest management, multi-functional forest utilization, and rural livelihood improvement [38]. Nevertheless, as the tertiary sector share continues to climb excessively, its marginal contribution to FES may reverse. Beyond the optimal threshold, the “rebound effect” of wealth accumulation may increase the demand for high-carbon luxury consumption and large-scale infrastructure, leading to habitat fragmentation [39]. An over-inflated service sector, especially one characterized by intensive ecotourism development and large-scale infrastructure construction, can trigger excessive spatial agglomeration of population and capital. This often leads to problems such as scenic overload, forestland encroachment, and domestic pollution. Ultimately, industrial hollowing-out or excessive commercialization resulting from a disproportionately high tertiary sector share may exacerbate disturbances to forest ecosystems. Therefore, an optimal interval likely exists in the relationship between the tertiary industry share and FES, manifesting as an inverted U-shaped non-linearity. Accordingly, Hypothesis 5 is proposed:
H5. 
The proportion of the tertiary sector has a significant double-threshold, inverted U-shaped effect on the relationship between FGTFP and FES.
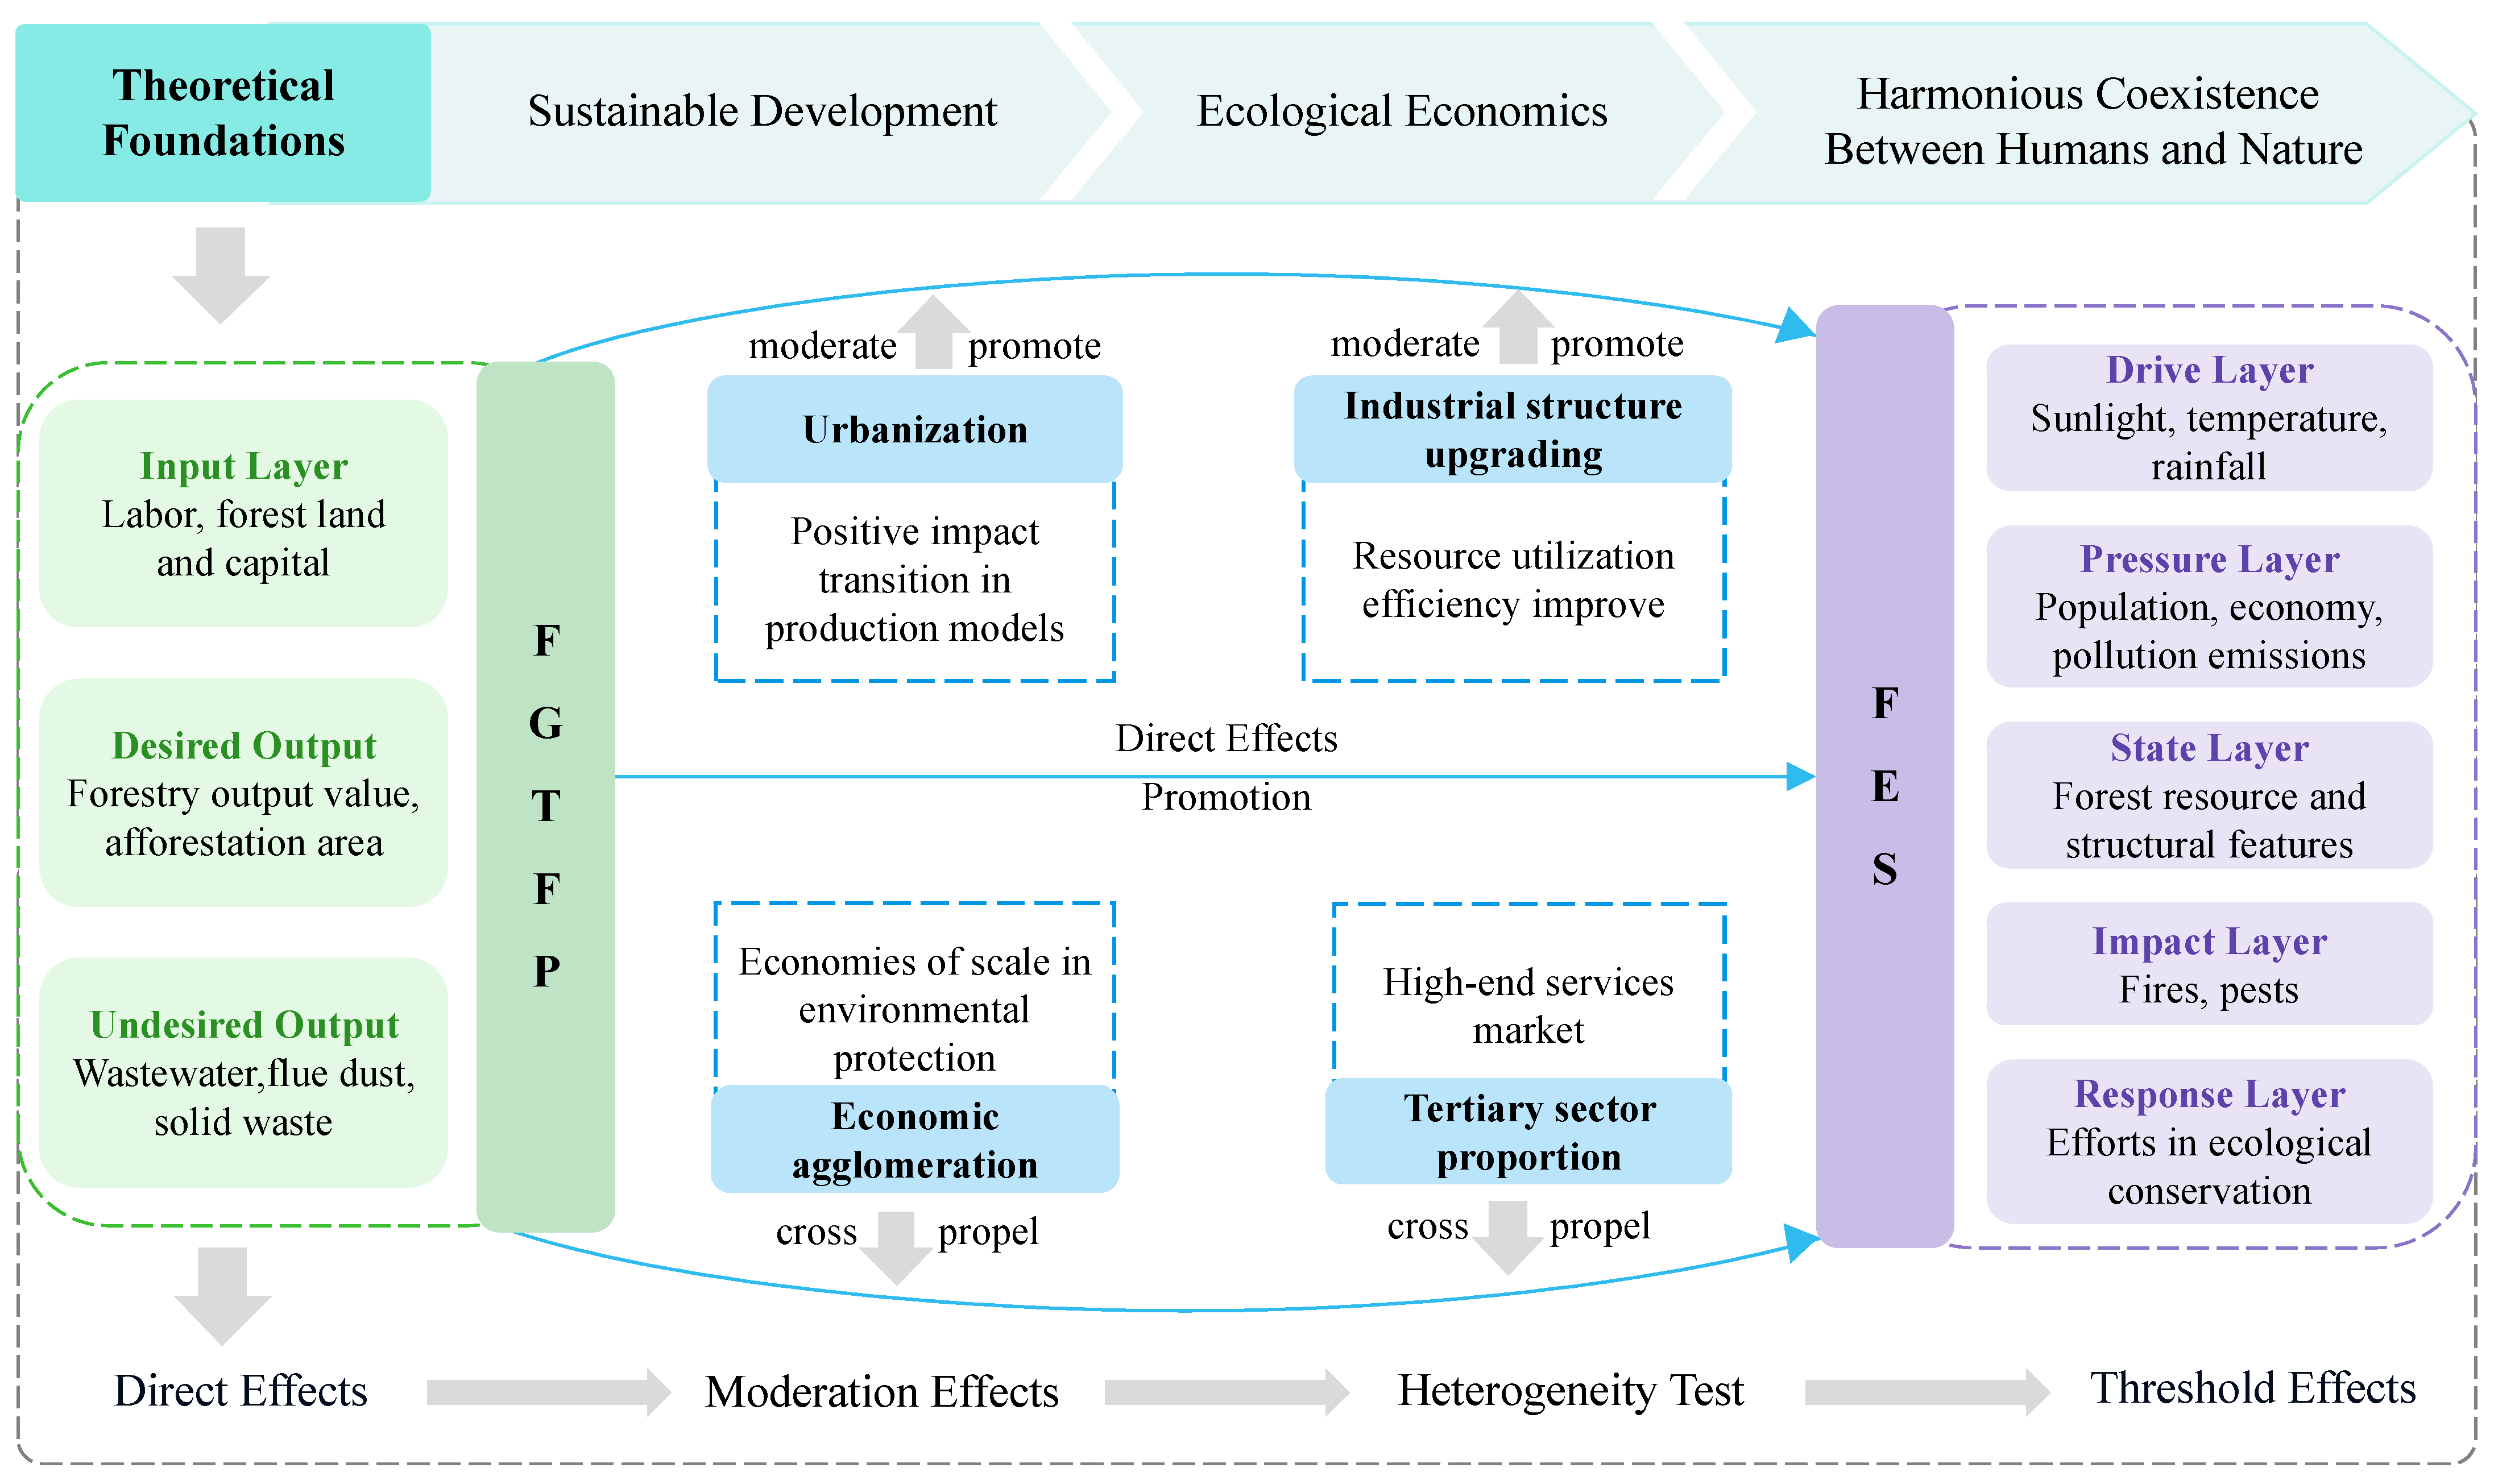
Figure 1 is the framework diagram of this study, which shows the relationship between FGTFP and FES.

3. Research Design

3.1. Data Sources and Descriptive Statistics

Considering the availability and stability of data, this study finally selected 30 provinces (municipalities and regions) in China from 2004 to 2018 after excluding some provinces with serious data deficiency. The dataset integrates information from authoritative sources, including the China Statistical Yearbook, the National Forest Resources Report, and the China Forestry and Grassland Statistical Yearbook, as well as yearbooks covering health, environmental, and energy statistics. Additionally, local statistical bulletins were consulted to supplement the data. After compiling the descriptive statistics presented, any remaining gaps were addressed using interpolation methods.

3.2. Variable Selection

3.2.1. Explained Variable

Anchored in systems theory and drawing on the empirical approach of Wang et al. (2023) [40], this study develops a multidimensional index system to quantify FES, which serves as the principal dependent variable. In alignment with the broader conceptualization of FES as a contributor to societal welfare, the index system captures both the integrity of forest ecosystems and their functional outputs that underpin human livelihoods. The evaluation follows the established Driver–Pressure–State–Impact–Response (DPSIR) framework, with specific indicators outlined in Table 1. Subsequently, the entropy weight method is applied to calculate the composite FES scores.

3.2.2. Core Explanatory Variables

The explanatory variable is FGTFP, a quantitative metric that captures the comprehensive effect of all factor inputs in forestry production processes and serves as a proxy for forestry sustainable development capacity. This study utilizes the super-efficiency SBM-GML index model to measure FGTFP. The calculation of FGTFP is performed using MATLAB R2022b. Compared to the NDDF-LHM model, this approach excels in capturing non-radial inefficiencies—meaning it directly accounts for slack variables in inputs and outputs rather than assuming proportional changes. This characteristic is critical for forestry production, as ecological constraints often require reducing specific undesirable outputs without a commensurate reduction in desired outputs.
The detailed index system established for measuring FGTFP is summarized in Table 2. Regarding input indicators, this study specifies forestry professionals, forestland area, and fixed-asset investment in forestry as core input factors. Additionally, energy consumption in the forestry sector is incorporated to provide a holistic reflection of resource use intensity. For output indicators, it is essential to distinguish between desirable and undesirable outputs. Desired outputs include the overall area of afforestation and the total forestry production value. In the context of green FGTFP measurement, undesirable outputs refer to the involuntary by-products generated alongside desirable outputs that impose environmental costs or degrade ecosystem quality. Specifically, the construction of FGTFP, particularly the incorporation of undesirable outputs, closely adheres to established scholarly conventions for measuring green development efficiency in the forestry sector [23,41]. The undesirable outputs in this study primarily stem from the downstream forestry product processing industry and consist of solid waste, wastewater discharge and soot emissions generated from the forestry product processing industry.

3.2.3. Control Variables

At the level of resource endowment, socioeconomic development, and technical advancement, the following variables may have an impact on FES: energy usage intensity (EUI), energy consumption structure (ECS), technology investment level (STI), environmental regulation (ER), level of government intervention (GI), urban road construction (RC), and greening level (GL).
As a result, descriptive statistics for variables are reported in Table 3.

3.3. Model Setting

3.3.1. Entropy Weight Method

The entropy weight method (EWM) is used to measure FES in the study. Compared to traditional subjective weighting approaches, EWM effectively circumvents biases arising from arbitrary parameter setting. It is particularly well-suited for evaluating complex systems and offers distinct advantages in assessing critical dimensions such as ecological security, economic performance, and forest fire prevention efficiency. The calculation procedure is outlined as follows:
First, normalize the raw data for both positive and negative indicators using the following formulas.
For positive indicators:
B i j = A i j m i n A j m a x A j m i n A j
For negative indicators:
B i j = m a x A j A i j m a x A j m i n A j
where A i j and B i j denote the initial and normalized values of indicator i in province j , respectively, and m i n A j and m a x A j denote the minimum and maximum values of indicator j, across the full sample.
Next, determine the contribution rate of each indicator.
Z i j = B i j i = 1 n B i j
Then, the information entropy values for the indicators can be obtained.
H j = 1 ln n i = 1 n Z i j ln Z i j
Third, the weights of each indicator are determined using the coefficient of variation and normalization.
W j = 1 H j j = 1 n 1 H j
Finally, the comprehensive FES evaluation index is calculated.
F E S j = j = 1 n ω j B i j

3.3.2. Super-Efficiency SBM-GML Index Model

Taking practical considerations into account, this study calculates the green total factor productivity of the forestry sector in China’s 30 provinces (cities/districts) using the super-efficiency SBM-GML index model. This method incorporates both desired and undesired outputs into the evaluation system, making the efficiency assessment more comprehensive and comparable. The global SBM directional distance function is formulated as Equations (7) and (8).
S v G x k t , y k t , z k t = m a x s x , s y , s z 1 n n = 1 N S n x x + 1 M + 1 m = 1 M S m y y + l = 1 L S l z z 2
s . t . x n 0 t = t = 1 T k = 1 K λ k x k t + s n x , n y m 0 t = t = 1 T k = 1 K λ k y k t + s m y , m z l 0 t = t = 1 T k = 1 K λ k z k t + s l z , l k = 1 , 0 K λ k = 1 , λ k 0 , k s n x 0 , s m y 0 , s l z 0
where x k t , y k t , z k t denotes the factor inputs, desirable outputs, and undesirable outputs of the k-th decision-making unit in period t. S n x ,   S m y , and S l z represent the slack values corresponding to these three components, respectively.
Mathematically, the GML index admits a multiplicative decomposition comprising the efficiency change (EFF) and technological change (TECH) indices. When GML > 1, it indicates that the total factor productivity (TFP) of the variables in period t + 1 has improved relative to period t; when GML = 1, TFP remains unchanged; and when GML < 1, TFP declines. The GML index can be expressed as:
M L v G x t , y t , z t , x t + 1 , y t + 1 , z t + 1 = E v G x t + 1 , y t + 1 , z t + 1 E v G x t , y t , z t                                                       = E v t + 1 x t + 1 , y t + 1 , z t + 1 E v t x t , y t , z t                                                       × E v G x t + 1 , y t + 1 , z t + 1 / E v t + 1 x t + 1 , y t + 1 , z t + 1 E v G x t , y t , z t / E v t x t , y t , z t                                                       = E F F v × T E C H v
where M L v G denotes the GML index under variable returns to scale (VRS); E v G represents the VRS efficiency value on the global frontier; E v t and E v t + 1 denote the efficiency scores in periods t and t + 1, respectively; x t , y t , z t and x t + 1 , y t + 1 , z t + 1 stand for the vectors of factor inputs, desirable outputs, and undesirable outputs in periods t and t + 1, respectively; E F F v represents the technical efficiency change index under VRS; and T E C H v represents the technological change index under VRS.

3.3.3. Econometric Model

This study employs a two-way fixed effects model, a moderation effect model, and a panel threshold model. All quantitative estimations are performed using Stata 18.0.
(1)
Two-way fixed-effects model
To verify the effect of FGTFP on FES, this study drew on the experience of Chen et al. (2023) and used a two-way fixed-effects model [23]. The model can effectively control the influence of individual and time factors on the results, so as to more accurately evaluate the role of FGTFP on FES. The specific model is constructed as follows Equation (10):
F E S i t = α 0 + α 1 F G T F P i t + i = 2 8 α i C i t + μ i + γ i + ε i t
where F E S i , t is the FES level of region i in period t, F G T F P i t is FGTFP of region i in period t, C i t is a set of control variables, α 0 is the intercept, α i is the regression coefficient value, μ i and γ i denote individual and time fixed effects, respectively, and ε i t are random perturbation terms.
(2)
Moderation effect model
To examine the moderating roles of urbanization and industrial structure upgrading between FGTFP and FES, this paper establishes the following moderation effect model:
F E S i t = δ 0 + δ 1 F G T F P i t + δ 2 M V i t + δ 3 F G T F P i t × M V i t + i = 2 8 δ i C i t + μ i + γ i + ε i t
where M V i t denotes the moderator variable and F G T F P i t × M V i t represents the interaction term between the dependent variable and the moderator.
(3)
Panel threshold model
To further investigate whether the impact of FGTFP on FES exhibits nonlinear characteristics, this study employs economic agglomeration and the proportion of tertiary industry as threshold variables to analyze the threshold effects of FGTFP on promoting FES. The specific model is presented in Equation (12):
F E S i t = β 0 + β 1 × Τ ρ i γ F G T F P i t + β 2 × Τ ρ i > φ F G T F P i t + i = 2 8 α i C i t + ε i t
where ρ i and φ represent threshold variable and threshold estimate, respectively. Τ · is the indicative function.

4. Analysis of Empirical Results

4.1. Estimation of Direct Effects

4.1.1. Benchmark Regression Analysis

Table 4 reports the baseline regression results based on the two-way fixed effects model and ordinary least squares (OLS) estimator. Overall, FGTFP exerts a significantly positive effect on FES, a conclusion that remains robust across different model specifications. Columns (1) and (2) present the baseline results of the two-way fixed effects model. Column (1) is the pure double fixed-effect model without control variables, where the coefficient of FGTFP is 0.017. Column (2) further introduces control variables such as EUI, ECS, and STI, resulting in a coefficient of 0.028 for FGTFP, which remains statistically significant. This indicates that after controlling for confounding factors, a one-unit increase in FGTFP yields a more pronounced gain in FES, thereby confirming Hypothesis 1. Columns (3) and (4) display the OLS regression results, with Column (3) excluding control variables and Column (4) including them. The coefficient of FGTFP in Column (4) is 0.054, further confirming the robustness of our findings.

4.1.2. Robustness Test

With the aim of reinforcing the methodological rigor of the baseline regressions and augmenting the robustness and breadth of the empirical evidence, this study conducts a series of robustness tests by replacing the dependent variable, excluding specific samples, and adopting alternative estimation models. The results are presented in Table 5.
First, we discuss replacing the dependent variable. Following the methodological approach of Wang et al. (2023) [40], this study excludes indicators related to forest tourism visits and reconstructs the FES index using only indicators reflecting the inherent ecological status and systemic pressures. The positive effect of FGTFP remains highly significant. Second, we exclude specific samples. Recognizing that substantial regional disparities in forestry productivity may bias the estimates, Column (2) displays the regression outcomes following removal of centrally administered municipalities from the sample. The coefficient remains significantly positive at the 5% level, aligning closely with the baseline regression results. Third, we adopt an alternative model. Replacing the two-way fixed effects model with a Tobit model to account for potential censoring in the dependent variable, the core explanatory variable continues to exhibit a statistically robust positive effect in Column (3), significant at the 1% level. This confirms that the research conclusions are robust to changes in model specification. Across all three robustness check specifications, the coefficient of FGTFP remains significantly positive, demonstrating the high robustness of the baseline results and providing further empirical support for Hypothesis 1.

4.2. Mechanism Test

To investigate whether ongoing urbanization and industrial restructuring enable FGTFP to more effectively safeguard and enhance FES, this study constructs a moderating effect model. Table 6 tabulates the regression results.
First, after introducing the urbanization variable and its interaction term with FGTFP, the coefficient of the main effect of FGTFP is 0.023, while the interaction term coefficient is 0.090, which is significantly positive at the 5% level. This indicates that urbanization significantly amplifies the positive impact of FGTFP on FES. In other words, in regions with higher urbanization levels, improvements in FGTFP yield more pronounced ecological security dividends. This phenomenon may be attributed to the factor agglomeration effect brought about by urbanization, which facilitates the diffusion and application of green technologies, thereby magnifying their beneficial effects on forest ecosystems. Thus, Hypothesis 2 is supported.
Second, after introducing the industrial structure upgrading variable and its interaction term, the coefficient of the main effect of FGTFP is 0.015, and the interaction term coefficient is 0.010, neither of which passes the conventional significance test. While this null result contradicts some prior expectations, it offers critical insights into the complexities of structural transformation in the forestry sector. A deeper interpretation, engaging with the specific limitations of the proxy and the sample context, is warranted. Two potential explanations emerge: (1) The measure of industrial upgrading may be too coarse to capture the structural shifts that specifically benefit forest ecology. While the tertiary sector broadly encompasses services, a significant portion of this growth in China during the sample period was concentrated in conventional service industries that have limited direct substitution effects for resource-intensive forestry production. Consequently, the aggregate indicator fails to distinguish between “ecologically benign” and “ecologically neutral”, potentially masking the true moderating effect. (2) The sample period (2004–2018) likely predates the full emergence of a mature forest-based service economy in most provinces. Although ecotourism and carbon sequestration projects began developing during this time [42], they had not yet reached the scale necessary to significantly alter the FGTFP–FES nexus at the provincial level. Given that forest ecosystems are slow-changing variables, the lag between industrial restructuring and measurable improvements in FES may exceed the timeframe captured by our data. Therefore, the insignificant moderating effect does not necessarily negate the theoretical importance of industrial upgrading. Rather, it suggests that during the 2004–2018 period, the quality of industrial restructuring had not yet reached a threshold sufficient to statistically modulate the relationship between FGTFP and FES. Accordingly, Hypothesis 3 is rejected.

4.3. Further Analysis

4.3.1. Heterogeneity Analysis

The impact of FGTFP on FES is not uniform across regions. Disparities in forest resource endowments and institutional environments profoundly shape the marginal returns to green technological progress and the associated implementation costs, leading to significant variations in ecological outcomes. At the macro-regional level, geographic location and economic development serve as critical external determinants of forest ecological governance efficacy. Acknowledging the prevailing reality of regional imbalances in China, this study follows the analytical framework of Cai et al. (2021) [43] by partitioning the sample into eastern, central, and western regions for heterogeneity analysis. Furthermore, aligning with the urban economic hierarchy and adopting the methodology of Guo et al. (2023) [44], this study subdivides the sample into developed and less-developed regions based on China’s per capita GDP threshold to capture differential characteristics along the economic gradient. The results, presented in Table 7, indicate that the enhancing effect of FGTFP on FES is most pronounced in the eastern and developed regions, while it appears comparatively weaker in the central and western regions and the less-developed areas.
This divergence stems from a combination of factors. The eastern region, benefiting from superior geographic conditions and robust economic strength, possesses more advanced forestry management technologies, well-established ecological compensation mechanisms, and higher public environmental awareness. These conducive conditions enable technological progress to translate effectively into substantive improvements in ecological quality. In contrast, central and western regions, as well as less-developed areas, often face intense survival-driven development pressures and exhibit stronger fiscal reliance on timber resources. Consequently, even significant improvements in FGTFP may be neutralized by extensive, scale-oriented expansion. Moreover, the fragile ecological baselines prevalent in these regions further impede the manifestation of discernible ecological security benefits.
From the perspectives of property rights and forestry characteristics, variations in the internal structure of the forestry sector and the institutional features of management regimes determine the pathways through which productivity gains translate into ecological outcomes. The degree of regional reliance on forestry and the prevailing models of property rights ownership directly modulate the willingness of management entities to prioritize long-term ecological benefits. Grounded in this understanding, this study categorizes the sample according to China’s distinctive tripartite forestry landscape—namely, the Southern Collective Forest Region, the Northeast State-Owned Forest Region, and other regions. Additionally, drawing on the methodology of Lin et al. (2026) [45], the study further partitions the sample into high- and low-contribution groups based on the share of forestry output value in regional GDP. The corresponding findings are summarized in Table 8.
The findings reveal that the positive effect of FGTFP on FES is significantly more pronounced in the Southern Collective Forest Region and in areas with a larger forestry share. Conversely, this effect fails to reach conventional levels of statistical significance in the Northeast State-Owned Forest Region and in areas where forestry constitutes a smaller portion of the economy. Several factors may account for this divergence. The Southern Collective Forest Region has undergone multiple rounds of forest tenure reform, establishing clear management entities and a high degree of marketization. Coupled with a high regional economic reliance on forestry, this incentivizes operators to pursue ecological–economic win–win outcomes through improvements in FGTFP, thereby actively safeguarding FES [46].
In contrast, the null effect observed in the Northeast State-Owned Forest Region likely reflects a measurement issue rooted in institutional mandates rather than merely operational inflexibility. These forests have long shouldered the dual mandates of serving as a strategic timber reserve and providing public ecological goods. Under strict conservation requirements, FGTFP is primarily captured in timber output targets and operational efficiency metrics, rather than manifesting as improvements in FES. Essentially, these forests operate under a conservation ceiling, where ecological metrics are constrained by predefined quotas, leaving limited variance to reflect the marginal ecological benefits brought by efficiency improvements. Thus, the ecological dividends of FGTFP are substantially absorbed by production quotas, rendering them statistically invisible in our current measurement framework. Furthermore, in regions where forestry accounts for a minor share of the economy, resource allocation logically prioritizes non-forestry sectors. This structural bias inevitably attenuates the marginal contribution of forestry total factor productivity to FFS.

4.3.2. Threshold Effect Analysis

The nonlinear impact of FGTFP on FES does not follow a monotonic gradual trajectory; rather, it is constrained by thresholds of key economic environment variables, exhibiting significant threshold effects. The structural characteristics of regional development define the efficiency frontier for green technological progress to unlock ecological dividends.
From the perspective of industrial spatial organization, economic agglomeration serves as a pivotal node in reshaping resource allocation efficiency. Moderate industrial agglomeration reduces transaction costs and facilitates the sharing of green technology spillovers. However, once agglomeration exceeds a critical threshold, overcrowding may trigger intensified resource competition and environmental negative externalities. Threshold estimation results for economic agglomeration (Table 9) report an F-statistic of 29.01 and a p-value of 0.007, which rejects the null hypothesis of a linear relationship at the 1% statistical level, confirming the presence of a distinct single-step threshold effect. Regression results across intervals (Table 10) further indicate that the driving effects of FGTFP on FES undergo a segmented mutation as economic agglomeration shifts between intervals. When economic agglomeration falls below the threshold value of 9.288, the estimated coefficient of FGTFP is −0.001 and statistically insignificant, indicating that insufficient agglomeration leads to excessive dispersion of production factors, which hinders the effective coordination and implementation of eco-friendly technologies. Once economic agglomeration surpasses this threshold, the coefficient turns positive and reaches significance at the 5% level, thereby supporting Hypothesis 4. This implies that only when regional economic development attains a sufficient density and scale can FGTFP generate a significant positive enabling effect on FES.
From the perspective of the alignment between regional industrial-financial structures and ecological service functions, the share of the tertiary industry reflects the coupling degree between the servicization and ecologization of the regional economy. An excessively high share may signal the relative atrophy of the real economy, while an insufficient share often implies continued reliance on an extensive development model characterized by high energy consumption and emissions. Panel threshold tests for the tertiary industry share (Table 9) yield an F-statistic of 52.63 and a p-value of 0.003, decisively rejecting the null hypothesis of linearity and confirming the existence of a double-threshold effect. Column (2) of Table 10 delineates the stage-specific characteristics of this relationship. When the threshold variable is at a low level, FGTFP exerts no statistically significant impact on FES. Upon crossing the first threshold, FGTFP begins to significantly and positively drive improvements in FES, with the promoting effect becoming markedly stronger. However, once the tertiary industry share escalates beyond the second threshold, this positive driving effect vanishes. This pattern substantiates an inverted U-shaped threshold characteristic, thereby supporting Hypothesis H5. The findings indicate that an optimal interval exists for the tertiary industry share to amplify the ecological dividends of FGTFP; both insufficient and excessive servicization dilute its marginal contribution to FES.

5. Discussion

5.1. Interpretation of Main Findings

The substantially beneficial impact of FGTFP on FES is confirmed in this study. Specifically, FGTFP alleviates the excessive reliance of forestry economic growth on forest resources through technological progress and optimized factor allocation, realizing an eco-friendly development pathway characterized by “expanding output without raising resource consumption, and improving efficiency without increasing pollution emissions”. This conclusion coincides with the findings of Lu et al. (2018) and Yan et al. (2024) [2,20], which demonstrate that improvements in forestry green efficiency effectively enhance the capacity and structural stability of forest ecosystems to supply ecosystem services. In contrast, Zhang et al. (2023) note that in some resource-dependent regions, forestry technological progress may coincide with a latent increase in logging intensity, exerting potential pressure on ecological security [21]—a result that diverges from the core finding of this study. This variation stems from the release of ecological dividends from FGTFP being closely tied to stage-specific regional development contexts. In areas with low levels of economic agglomeration or imbalanced tertiary industry shares, green technological progress is easily offset by extensive scale expansion, failing to translate into tangible gains in FES.
With respect to the underlying mechanisms, this study clarifies the moderating roles of urbanization and industrial structure upgrading in the FGTFP–FES nexus. First, this study finds that urbanization significantly amplifies the positive effect of FGTFP on FES, consistent with the findings of Wang et al. (2022) and Yuan et al. (2018) [27,28]. This alignment arises because urbanization refines forestry production modes through factor agglomeration, technological diffusion, and heightened public environmental awareness, thereby reducing the direct reliance of rural populations on forest resources. Second, while the main effect of industrial structure upgrading on FES is statistically significant, its moderating effect on the FGTFP–FES nexus proves insignificant in this study, diverging from the results reported by Ren et al. (2022) and Jiang et al. (2022) [25,30]. This discrepancy likely stems from the fact that China’s forestry industrial restructuring remains in a stage of quantitative accumulation. High-value-added business models such as forest health tourism and carbon sink trading have yet to develop sufficient ecological substitution capacity, leaving the ecological moderating function of industrial upgrading largely unrealized. These findings underscore that higher-order industrial upgrading does not automatically translate into ecological security advantages; rather, it requires coordinated policy guidance and well-functioning market mechanisms to realize such benefits. The mechanisms behind FGTFP and FES growth are increasingly mediated by digital technologies. While not explicitly modeled as a moderator herein, the penetration of smart monitoring, big data analytics, and the Internet of Things (IoT) offers a critical pathway to optimize resource allocation. Future research must therefore explore how digital governance mechanisms interact with traditional economic drivers to safeguard forest ecosystems.
Further heterogeneity analysis demonstrates that the positive ecological security effect of FGTFP is most pronounced in the eastern and central regions, economically developed areas, and the Southern Collective Forest Region. This finding resonates with the conclusions of Cai et al. (2021) and Guo et al. (2023) [43,44]. The underlying logic can be unpacked as follows: The eastern region, bolstered by robust economic foundations and well-functioning market mechanisms, translates green technological advances into ecological conservation investments far more efficiently. In the Southern Collective Forest Region, clearly defined property rights arrangements and a high degree of operational marketization have stimulated endogenous incentives among management entities to balance economic returns with long-term ecological stewardship. By contrast, the positive effect remains notably weaker in the western region, less-developed areas, and the Northeast State-Owned Forest Region. This pattern is largely attributable to three structural constraints in these areas: intense survival-driven development pressures, heavy fiscal reliance on timber resources, and inadequately developed ecological compensation mechanisms.
The threshold effect tests further illuminate the non-linear characteristics governing the release of ecological dividends from FGTFP. Regarding economic agglomeration, the existence of a single threshold implies that only after agglomeration surpasses a critical value can scale effects and technology spillovers become sufficiently potent to overcome the inefficiencies inherent in fragmented, small-scale operations, thereby significantly amplifying the positive ecological impact of FGTFP. Conversely, the tertiary industry share exhibits a double-threshold, inverted U-shaped pattern. This suggests that excessive servicization may trigger industrial hollowing-out, which, in turn, dilutes the resource availability for long-term investments in forest ecosystem maintenance. These empirical findings substantiate the presence of stage-specific constraints within sustainability transitions, as posited by sustainable development theory.
It is noteworthy that this study finds the spatial spillover effects of FGTFP on FES to be statistically insignificant. We attribute this discrepancy primarily to the specificity of our sample period (2004–2018). During this timeframe, inter-provincial factor mobility in China’s forestry sector faced significant institutional barriers, limiting the cross-regional diffusion of green technologies and ecological dividends. Moreover, our reliance on a geographic contiguity matrix may not fully capture economic or ecological linkages; future research employing alternative weight matrices may yield different insights into these spatial dependencies.

5.2. Research Limitations and Future Research Agenda

While the study applies a number of econometric models to elucidate the mechanisms and threshold effects through which FGTFP influences FES, several limitations remain, suggesting avenues for future research.
First, regarding data resolution and the evolution of ecological value realization, the FES evaluation index system, though multidimensional, remains inadequate in capturing hard-to-quantify indicators such as biodiversity and forest cultural services. Furthermore, the sample period (2004–2018) limits the generalizability of findings to the current policy context. Future study should extend the dataset to incorporate the transformative impacts of the burgeoning forest carbon sink market. Methodologically, future study could integrate multisource data—including high-resolution remote sensing, ground-based IoT monitoring, and social surveys—to construct a more finely resolved diagnostic system. A critical imperative is to investigate how market-based instruments—such as carbon sink trading, forest health tourism, and targeted ecological compensation schemes—can convert the latent ecological benefits generated by rising FGTFP into tangible economic returns and social welfare. Addressing this could fundamentally resolve the “protection-development trade-off,” thereby securing a “double dividend” of enhanced ecological security and increased rural prosperity.
Second, concerning spatial dimensions and emerging influencing factors. While this study examined the threshold characteristics of economic agglomeration and industrial structure, it falls short in uncovering the non-linear moderating effects of digital technology penetration and environmental regulation intensity. The insignificant spatial spillovers found herein suggest that future research should employ multi-dimensional spatial weight matrices and longer panel datasets to reassess these dynamics. Additionally, investigating how digitalization optimizes resource allocation through smart monitoring and big data is essential to demystifying the transmission mechanisms of green productivity growth.
Finally, regarding theoretical depth and social relevance, future research must move beyond a narrow focus on technical efficiency to deeply explore the synergies between the realization mechanisms of ecological product value and FES. Improving FES should not be viewed merely as an environmental metric but as a crucial mechanism for converting natural resources into tangible human well-being, encompassing public health, disaster resilience, and recreational opportunities. Synthesizing the lessons from China’s unique transition from a “production-oriented” to an “ecosystem-service-oriented” paradigm will provide globally relevant insights for sustainable forest management.

6. Conclusions and Policy Implications

Using panel data from 30 Chinese provinces (municipalities and autonomous regions) spanning 2004–2018, this study employs a multi-method approach—integrating the entropy weight method, the super-efficiency SBM-GML index model, two-way fixed effects models, and panel threshold models—to systematically investigate the mechanisms and threshold effects through which FGTFP influences FES. The main findings are as follows: First, baseline regression results confirm that improvements in FGTFP significantly enhance FES. This conclusion remains robust across various checks, including alternative variable specifications, winsorized samples, and alternative estimation models, substantiating the substantive contribution of China’s green forestry transition to national ecological security. Second, mechanism tests reveal asymmetric moderating effects of macro-structural changes. While urbanization significantly amplifies the positive impact of FGTFP on FES, industrial structure upgrading, despite its direct benefits to ecological security, has yet to establish a significant amplification mechanism for the ecological dividends generated by green efficiency gains. Third, the ecological security effect of FGTFP exhibits notable regional and property-rights-based heterogeneity. The positive impact is markedly stronger in eastern and developed regions, the Southern Collective Forest Region, and provinces with high forestry dependence. Conversely, the effect remains relatively limited in western and less-developed areas, as well as in the Northeast State-Owned Forest Region. Finally, threshold effect analysis identifies significant non-linear constraints imposed by economic agglomeration and the tertiary industry share. The promoting effect of FGTFP on FES reaches its maximum only when economic agglomeration surpasses a critical threshold and the tertiary industry share falls within an optimal bandwidth. These findings underscore that realizing the full ecological potential of green productivity growth is contingent upon specific structural conditions.
This study makes the following policy recommendations in light of the aforementioned empirical findings.
(1)
Adopt property-rights differentiated governance. Given the “conservation ceiling” in the Northeast State-Owned Forest Region, policy should shift from efficiency incentives to refined ecological compensation schemes that reward FGTFP improvements as managerial merit. Conversely, in the Southern Collective Forest Region, deepening tenure reform and market mechanisms is crucial to translating productivity gains into ecological security.
(2)
Calibrate interventions to agglomeration thresholds. Recognizing that FGTFP’s ecological dividends are significant only beyond specific thresholds, policies should prioritize industrial clustering in high-agglomeration areas to capture scale economies. For regions approaching the threshold, targeted investments in shared green infrastructure are necessary to unlock latent ecological benefits.
(3)
Navigate the inverted U-shaped industrial constraint. Policymakers must avoid excessive servicization. While fostering high-end eco-services, strict land-use controls are required to prevent over-commercialization and forestland encroachment associated with the declining marginal effects of tertiary expansion.
(4)
Tailor urbanization synergies to regional contexts. In developed eastern regions, integrate forestry with urban ecological demands. In less-developed western regions, enhance smallholder access to urban supply chains via logistics support, ensuring equitable gains without exacerbating regional disparities.
In summary, the impact of FGTFP on FES is mediated by a confluence of macro-structural, regional, and institutional factors. Our findings suggest that improved FES is not just an ecological metric, but a vital conduit for translating natural resources into human well-being, particularly regarding health benefits and disaster mitigation. Consequently, integrating green innovations into optimized spatial and industrial frameworks is essential for China to realize both high-quality forestry development and the delivery of tangible welfare to its populace.

Author Contributions

Conceptualization, X.L., H.X. and J.W.; methodology, X.L. and C.N.; software, G.L.; validation, H.X. and J.W.; formal analysis, X.L., H.X. and J.W.; investigation, G.L.; resources, G.L.; data curation, C.N.; writing—original draft preparation, all authors; writing—review and editing, all authors; visualization, G.L.; supervision, H.X. and J.W.; project administration, H.X. and J.W. All authors have read and agreed to the published version of the manuscript. We confirm that neither the manuscript nor any parts of its content are currently under consideration for publication with or published in another journal.

Funding

This research was funded by the Key Project of the Key Research Base for Philosophy and Social Sciences in Jiangxi Province, grant number 23ZXSKJD07; and the Early-Career Young Scientists and Technologists Project of Jiangxi Province, grant number 20262BEJ730105.

Institutional Review Board Statement

Not applicable.

Informed Consent Statement

Not applicable.

Data Availability Statement

The datasets generated and analyzed are available from the corresponding author on reasonable request.

Acknowledgments

The authors of this article would like to thank all people who participated in this study.

Conflicts of Interest

The authors declare no conflicts of interest.

References

  1. Schweitzer, A. Civilization and Ethics; A & C Black: London, UK, 1923. [Google Scholar]
  2. Lu, S.; Li, J.; Guan, X.; Wang, H.; Xu, H.; Zhang, J. The evaluation of forestry ecological security in China: Developing a decision support system. Ecol. Indic. 2018, 91, 664–678. [Google Scholar] [CrossRef]
  3. Lu, H.; Zhang, M.; Nian, W. The spatial spillover effects of environmental regulations on forestry ecological security efficiency in China. Sustainability 2023, 15, 1875. [Google Scholar] [CrossRef]
  4. Zhang, Q.; Wang, G.; Mi, F.; Guo, H. Evaluation and scenario simulation for forest ecological security in China. J. For. Res. 2019, 30, 1651–1666. [Google Scholar] [CrossRef]
  5. Kauppi, P.E.; Stål, G.; Arnesson-Ceder, L.; Rytter, L.; Börjesson, P.; Werner, F. Managing existing forests can mitigate climate change. For. Ecol. Manag. 2022, 513, 120186. [Google Scholar] [CrossRef]
  6. Ke, S.; Qiao, D.; Zhang, X.; Skidmore, A.K. Changes of China’s forestry and forest products industry over the past 40 years and challenges lying ahead. For. Policy Econ. 2021, 123, 102352. [Google Scholar] [CrossRef]
  7. Xu, P.; Zhang, Y.; Li, Q.; Chen, X. Evaluation of forest eco-efficiency: A transformation of ecological value quantity perspective. Sci. Total Environ. 2025, 965, 178612. [Google Scholar] [CrossRef] [PubMed]
  8. Yiwen, Z. Governance structures, resource mobilization, and organizational performance of community forest enterprises: Evidence from China. For. Policy Econ. 2024, 163, 103229. [Google Scholar] [CrossRef]
  9. Kaur, K.P.; Chang, K.; Andersson, K.P. Collective forest land rights facilitate cooperative behavior. Conserv. Lett. 2023, 16, e12950. [Google Scholar] [CrossRef]
  10. Prins, K.; Köhl, M.; Linser, S. Is the concept of sustainable forest management still fit for purpose? For. Policy Econ. 2023, 157, 103072. [Google Scholar] [CrossRef]
  11. Gao, M.; Hu, Y.; Bai, Y.; Qin, Y.; Liu, Y.; Wang, J. Construction of ecological security pattern in national land space from the perspective of the community of life in mountain, water, forest, field, lake and grass: A case study in Guangxi Hechi, China. Ecol. Indic. 2022, 139, 108867. [Google Scholar] [CrossRef]
  12. Gao, X.; Wang, G.; Innes, J.L.; Ma, X.; Yan, H.; Kang, H. Forest ecological security in China: A quantitative analysis of twenty five years. Glob. Ecol. Conserv. 2021, 32, e01821. [Google Scholar] [CrossRef]
  13. Wu, L.; Fu, W.; Hu, Y.; Zhang, Z. Spatial and temporal evolution of forestry ecological security level in China. Environ. Dev. Sustain. 2026, 28, 7623–7645. [Google Scholar] [CrossRef]
  14. Hernández-Blanco, M.; Costanza, R.; Chen, H.; Siriwardena, G.; Kubiszewski, I.; Anderson, S.; Sutton, P.; Willemen, L. Ecosystem health, ecosystem services, and the well-being of humans and the rest of nature. Glob. Change Biol. 2022, 28, 5027–5040. [Google Scholar] [CrossRef] [PubMed]
  15. Mann, C.; Hernández-Morcillo, M.; Ikei, H.; Miyazaki, Y.; Shin, W.S.; Tappeiner, U. The socioeconomic dimension of forest therapy: A contribution to human well-being and sustainable forest management. Trees For. People 2024, 18, 100731. [Google Scholar] [CrossRef]
  16. Du, Z.; Ji, X.; Zhao, W.; Wang, Z.; Li, S.; Zhang, H. Integrating revised DPSIR and ecological security patterns to assess the health of alpine grassland ecosystems on the Qinghai–Tibet Plateau. Sci. Total Environ. 2024, 957, 177833. [Google Scholar] [CrossRef] [PubMed]
  17. Sobhani, P.; Esmaeilzadeh, H.; Wolf, I.D.; Arabfard, M. Evaluating the ecological security of ecotourism in protected area based on the DPSIR model. Ecol. Indic. 2023, 155, 110957. [Google Scholar] [CrossRef]
  18. Zhang, R.; Wang, C.; Xiong, Y. Ecological security assessment of China based on the Pressure-State-Response framework. Ecol. Indic. 2023, 154, 110647. [Google Scholar] [CrossRef]
  19. Ma, L.; Yang, B.; Feng, Y.; Li, J. Evaluation of provincial forest ecological security and analysis of the driving factors in China via the GWR model. Sci. Rep. 2024, 14, 14299. [Google Scholar] [CrossRef] [PubMed]
  20. Yan, J.; Işık, C.; Ongan, S.; Alvarado, R.; Bekun, F.V. Analysis of green total factor productivity in China’s forestry industry: Technological, organizational, and environmental framework for sustainable economic development. Sustain. Dev. 2024, 32, 7278–7291. [Google Scholar] [CrossRef]
  21. Zhang, J.; Zhang, P.; Wang, R.; Liu, Y.; Lu, S. Identifying the coupling coordination relationship between urbanization and forest ecological security and its impact mechanism: Case study of the Yangtze River Economic Belt, China. J. Environ. Manag. 2023, 342, 118327. [Google Scholar] [CrossRef] [PubMed]
  22. Lo, K.; Zhu, L. Voices from below: Local community perceptions of forest conservation policies in China. For. Policy Econ. 2022, 144, 102825. [Google Scholar] [CrossRef]
  23. Chen, C.; Ye, F.; Xiao, H.; Xie, W.; Liu, B.; Wang, L. The digital economy, spatial spillovers and forestry green total factor productivity. J. Clean. Prod. 2023, 405, 136890. [Google Scholar] [CrossRef]
  24. Gao, D.; Zhang, B.; Li, S. Spatial effect analysis of total factor productivity and forestry economic growth. Forests 2021, 12, 702. [Google Scholar] [CrossRef]
  25. Ren, S.; Hao, Y.; Wu, H. How does green investment affect environmental pollution? Evidence from China. Environ. Resour. Econ. 2022, 81, 25–51. [Google Scholar] [CrossRef]
  26. Gu, C. Urbanization: Processes and driving forces. Sci. China Earth Sci. 2019, 62, 1351–1360. [Google Scholar] [CrossRef]
  27. Wang, F.; Wang, H.; Liu, C.; Xiong, L.; Qian, Z. The effect of green urbanization on Forestry Green Total Factor Productivity in China: Analysis from a carbon neutral perspective. Land 2022, 11, 1900. [Google Scholar] [CrossRef]
  28. Yuan, J.; Lu, Y.; Ferrier, R.C.; Liu, Z.; Su, H.; Meng, J.; Song, S.; Jenkins, A. Urbanization, rural development and environmental health in China. Environ. Dev. 2018, 28, 101–110. [Google Scholar] [CrossRef]
  29. Wan, M.; Han, Y.; Song, Y.; Jin, C.; Ran, J. Estimating and projecting the effects of urbanization on the forest habitat quality in a highly urbanized area. Urban For. Urban Green. 2024, 94, 128270. [Google Scholar] [CrossRef]
  30. Jiang, Y.; Wang, N. Impact of biased technological change on high-quality economic development of China’s forestry: Based on mediating effect of industrial structure upgrading. Sustainability 2022, 14, 10348. [Google Scholar] [CrossRef]
  31. MacDonald, H. Envisioning better forest transitions: A review of recent forest transition scholarship. Heliyon 2023, 9, e20429. [Google Scholar] [CrossRef] [PubMed]
  32. Liu, L.; Si, S.; Li, J. Research on the effect of regional talent allocation on high-quality economic development—Based on the perspective of innovation-driven growth. Sustainability 2023, 15, 6315. [Google Scholar] [CrossRef]
  33. Chen, C.; Sun, Y.; Lan, Q.; Liu, Y. Impacts of industrial agglomeration on pollution and ecological efficiency—A spatial econometric analysis based on a big panel dataset of China’s 259 cities. J. Clean. Prod. 2020, 258, 120721. [Google Scholar] [CrossRef]
  34. Fan, W.; Wang, F.; Liu, S.; Zhang, J.; Zhao, D. How does financial and manufacturing co-agglomeration affect environmental pollution? Evidence from China. J. Environ. Manag. 2023, 325, 116544. [Google Scholar] [CrossRef] [PubMed]
  35. Wu, J. Agglomeration: Economic and environmental impacts. Annu. Rev. Resour. Econ. 2019, 11, 419–438. [Google Scholar] [CrossRef]
  36. Shen, N.; Peng, H. Can industrial agglomeration achieve the emission-reduction effect? Socio-Econ. Plan. Sci. 2021, 75, 100867. [Google Scholar] [CrossRef]
  37. Yan, F.; Chao, D.; Qingfeng, B. Impact of urbanization on forest ecological security in China. Acta Ecol. Sin. 2022, 42, 2984–2994. (In Chinese) [Google Scholar] [CrossRef]
  38. Kalmykova, Y.; Rosado, L.; Patrício, J. Resource consumption drivers and pathways to reduction: Economy, policy and lifestyle impact on material flows at the national and urban scale. J. Clean. Prod. 2016, 132, 70–80. [Google Scholar] [CrossRef]
  39. Li, L.; Liu, J.; Cheng, B.; Chhatre, A.; Dong, J.; Liang, W. Effects of economic globalization and trade on forest transitions: Evidence from 76 developing countries. For. Chron. 2017, 93, 171–179. [Google Scholar] [CrossRef]
  40. Wang, J.; Xiao, H.; Hu, M. Spatial spillover effects of forest ecological security on ecological well-being performance in China. J. Clean. Prod. 2023, 418, 138142. [Google Scholar] [CrossRef]
  41. Wu, L.; Zhang, Z. Impact and threshold effect of Internet technology upgrade on forestry green total factor productivity: Evidence from China. J. Clean. Prod. 2020, 271, 122657. [Google Scholar] [CrossRef]
  42. Thompson, B.S. Ecotourism anywhere? The lure of ecotourism and the need to scrutinize the potential competitiveness of ecotourism developments. Tour. Manag. 2022, 92, 104568. [Google Scholar] [CrossRef]
  43. Cai, X.; Zhang, B.; Lyu, J. Endogenous transmission mechanism and spatial effect of forest ecological security in China. Forests 2021, 12, 508. [Google Scholar] [CrossRef]
  44. Guo, Y.; Ma, X.; Zhu, Y.; Chen, D.; Zhang, H. Research on driving factors of forest ecological security: Evidence from 12 provincial administrative regions in western China. Sustainability 2023, 15, 5505. [Google Scholar] [CrossRef]
  45. Lin, L.; Chen, W.; Chen, Q.; Huang, A. Mechanism and empirical analysis of the impact of forest sustainable management on “Four-Repository” security. Sci. Silvae Sin. 2026, 62, 214–229. (In Chinese) [Google Scholar]
  46. Wei, J.; Huang, X.; Xie, T.; Yin, R.; Hyde, W. Ecological-economic trade-offs in forest conservation: China’s public welfare forest compensation policy on farmers’ production factor reallocation and livelihood diversification. Front. For. Glob. Change 2025, 8, 1613517. [Google Scholar] [CrossRef]
Figure 1. Framework mechanism diagram.
Sustainability 18 08004 g001
Table 1. Index system for measuring FES.
TargetTypeIndexEncodeCalculation FormulaWeighProperties
FESDrivingPrecipitationD01Actual data0.020095+
SunlightD02Actual data0.013656+
TemperatureD03Actual data0.031892+
PressurePopulation densityP01Total population at the end of the year/area0.004888
Sulfur dioxide emissionsP02Industrial sulfur dioxide emissions/area0.002206
Industrial wastewater dischargeP03Industrial wastewater/area0.002856
Urbanization RatioP04Urban population/area0.016676Moderate
GDP per capitaP05Actual data0.006451Moderate
Forest tourismP06Number of forest tourists/people0.004746
StatePercentage of forest coverS01Forest area/area0.037686+
Percentage of forested land areaS02Area of forested land/area0.040096+
Forest stock per unit areaS03Forest stock/area0.066022+
Percentage of planted forest areaS04Area of planted forests/forest area0.030934+
ImpactFire damageI01Area of fire damage/area0.000406
Pest and disease damageI02Area of pest and disease damage/area0.005053
ResponseAnnual afforestation ratioR01New afforestation area/area0.047266+
Intensity of returning farmland to forestsR02Area of returning farmland to forests/area0.151432+
Share of nature reserve areaR03Nature reserve area/area0.044913+
Forestry investment intensityR04Investment in forestry/area0.165145+
Forest ecological construction and protection investment intensityR05Investment in forest ecological construction and protection/forest area0.264574+
Intensity of soil erosion controlR06Area of soils erosion control/area0.043007+
+ is a positive indicator, − is a negative indicator.
Table 2. Index system for measuring FGTFP.
Indicator TypeDefinitionUnit
InputForest practitioners at year-endPeople
Forestry land area104 hm2
Investment in forestry fixed assets104 CNY
Energy consumption of forestry industry104 tce
Output
Desired outputTotal output value of the forestry industry104 CNY
Afforestation area at year-end103 hm2
Non-desired outputWastewater discharge from forestry production104 t
Soot emissions from forestry production104 t
Solid waste from forestry production104 t
Table 3. Descriptive statistics of variables.
TypeNameSymbolNMeanS.D.MinMax
Dependent variableForest ecological securityFES4500.8090.0730.0890.939
Core independent variableForestry green total factor productivityFGTFP4500.3590.0640.2270.715
Control variablesIntensity of energy useEUI4501.0840.6660.2405.044
Energy consumption structureECS45062.98422.9442.714131.513
Technology investment levelSTI4501.6831.3720.2237.202
Environmental regulationER45066.13520.08120.276103.995
Degree of government interventionGI45021.6709.5617.67862.686
Urban road constructionRC4500.2300.4020.0013.389
Level of greeningGL45036.7775.34616.86049.130
Table 4. Benchmark regression results.
VariablesTwo-Way Fixed Effects ModelOLS Regression Model
(1)(2)(3)(4)
FGTFP0.017 **0.028 ***0.023 ***0.054 ***
(0.008)(0.01)(0.011)(0.015)
EUI−0.088 *** −0.07 ***
(0.013) (0.013)
ECS−0.001 −0.002 ***
(0.000) (0.0005)
STI0.007 ** 0.001 **
(0.001) (0.000)
GI0.002 *** −0.000
(0.000) (0.002)
ER0.000 0.000
(0.001) (0.016)
RC0.003 0.07 ***
(0.018) (0.001)
GL0.007 *** 0.000
(0.001) (0.13)
Constant0.383 ***0.191 ***0.037 ***0.177 ***
(0.109)(0.006)(0.064)(0.01)
Observations450450450450
Number of id30303030
R-squared0.3100.1210.5690.531
Note: ***, ** indicate significance at the 1%, 5% levels, respectively.
Table 5. Results of robustness test.
Variables(1)(2)(3)
Substitute Dependent VariableExcluding MunicipalitiesTobit Model
FGTFP0.012 ***0.032 **0.03 ***
(0.003)(0.016)(0.010)
Control variablesYESYESYES
Constant0.165 ***0.174 ***0.190 ***
(0.002)(0.009)(0.013)
Observations450390450
Number of id302630
R-squared0.3500.075——
Note: ***, ** indicate significance at the 1%, 5% levels, respectively.
Table 6. Moderating results.
Variables(1)(2)(3)(4)
FGTFP0.017 *0.023 **0.015 *0.014 *
(0.009)(0.008)(0.016)(0.015)
Urbanization−0.172 ***−0.194 **
(0.067)(0.071)
Industrial structure upgrading 0.024 ***0.025 **
(0.012)(0.012)
FGTFP × Urbanization 0.090 **
(0.014)
FGTFP × Industrial structure upgrading 0.010
(0.007)
Control variablesYESYESYESYES
Time fixedYESYESYESYES
Individual fixedYESYESYESYES
Constant0.122 ***0.117 ***0.170 ***0.171 ***
(0.030)(0.032)(0.013)(0.013)
Observations450450450450
Number of id30303030
R-squared0.3110.3290.5500.572
Note: ***, ** and * indicate significance at the 1%, 5% and 10% levels, respectively.
Table 7. Heterogeneity analysis: based on geographic location and economic development.
VariablesGeographical LocationEconomic Development Level
(1)
Eastern
(2)
Central
(3)
Western
(4)
Economically Developed
(5)
Less Developed
FGTFP0.050 ***0.005 *0.0090.038 ***0.005
(3.48)(1.67)(1.59)(3.16)(1.09)
Control variablesYESYESYESYESYES
Time fixedYESYESYESYESYES
Individual fixedYESYESYESYESYES
Constant−0.0660.435 ***0.327 ***0.1270.461 ***
(−0.66)(20.90)(7.24)(1.41)(13.15)
Observations165180105195255
Number of id111271317
R-squared0.5830.4110.3850.5270.256
Note: ***, * indicate significance at the 1%, 10% levels, respectively.
Table 8. Heterogeneity analysis: based on property rights and forestry characteristics.
VariablesProperty Rights StatusContribution of Forestry Economy
(1)
Southern Collective Forest Region
(2)
Northeast State-owned Forest Region
(3)
Other Regions
(4)
High Proportion
(5)
Low Proportion
FGTFP0.027 **−0.0530.0280.047 ***0.024
(0.009)(0.134)(0.021)(0.012)(0.018)
Control variablesYESYESYESYESYES
Time fixedYESYESYESYESYES
Individual fixedYESYESYESYESYES
Constant0.202 ***0.201 **0.185 ***0.2030.184 ***
(0.005)(0.028)(0.014)(0.006)(0.011)
Observations15045255150300
Number of id103171020
R-squared0.3960.2860.2140.3830.196
Note: ***, ** indicate significance at the 1%, 5% levels, respectively.
Table 9. Threshold estimation results.
VariablesThreshold TypeF-Valuep-ValueCritical ValueThreshold Estimate95% Confidence Interval
Economic agglomeration levelSingle threshold29.010.00716.51218.67528.8629.288[9.018, 9.380]
Proportion of tertiary industrySingle threshold18.770.03714.21016.41824.35756.436[55.519, 56.630]
Double threshold52.630.00318.10824.39745.50357.100[55.820, 58.1512]
Table 10. Threshold effect test.
VariablesEconomic Agglomeration LevelProportion of Tertiary Industry
(1)(2)
FGTFP × I (lneco ≤ 9.288)−0.001
(0.008)
FGTFP × I (lneco >9.288)0.067 *
(0.011)
FGTFP × I (third ≤ 56.436) 0.005
(0.007)
FGTFP × I (57.1 ≤ third < 58.152) 0.168 ***
(0.005)
FGTFP × I (third > 58.152) 0.000
(0.012)
Constant0.112 ***0.128 ***
(0.035)(0.031)
Control variablesYESYES
Time fixedYESYES
Individual fixedYESYES
Observations450450
R-squared0.4120.338
Note: ***, * indicate significance at the 1%, 10% levels, respectively.
Disclaimer/Publisher’s Note: The statements, opinions and data contained in all publications are solely those of the individual author(s) and contributor(s) and not of MDPI and/or the editor(s). MDPI and/or the editor(s) disclaim responsibility for any injury to people or property resulting from any ideas, methods, instructions or products referred to in the content.