1. Introduction
Reducing emissions from urban transport has become an important motivation for bus fleet electrification, and battery electric buses have the potential to substantially reduce lifecycle carbon dioxide emissions compared with conventional buses [
1]. Within this transition, nighttime centralized charging at bus depots has become a typical energy replenishment mode for battery electric buses. Unlike the largely random charging behavior of private electric vehicles, depot charging is organized around fixed routes, planned timetables, and explicit next-day departure requirements. At the same time, the rapid expansion of battery electric bus fleets has often outpaced charging infrastructure deployment, making insufficient chargers and constrained depot resources increasingly prominent operational issues [
2]. Under such conditions, charging queuing, congestion, and delayed energy replenishment may directly affect scheduled departures, which makes charging scheduling under limited depot resources a practical coordination problem rather than a simple charging task allocation problem.
Charging infrastructure is a key determinant of the scalability and operational performance of electric mobility systems. The number, location, accessibility, supply capacity, and technical capability of charging points determine charging coverage, service capacity, operational reliability, and system expandability [
3]. For electric bus systems, this infrastructure issue is further reflected at the depot level, where charger availability and depot power capacity shape the feasible space of nighttime charging scheduling. Recent system-level studies also indicate that charging infrastructure configuration is closely related to fleet operation efficiency, charging scheduling, energy pricing, and grid integration [
4,
5].
For bus depots, nighttime charging scheduling is shaped not only by electricity prices but also by charger availability, depot power capacity, vehicle time windows, and departure state-of-charge (SOC) requirements. The time-of-use pricing mechanism provides operators with an opportunity to reduce charging cost by shifting charging tasks to low-price periods. However, when many vehicles compete for limited charging resources within overlapping nighttime windows, a price-driven charging strategy may intensify charging concentration, create new depot load peaks [
6], and weaken desired SOC or even minimum departure SOC attainment [
7]. Therefore, the core issue is not simply how to exploit low-price periods but how to coordinate low-price charging opportunities with depot-level peak load control and vehicle departure energy assurance under limited resources. This coordination requirement naturally leads to a multi-objective scheduling framework that optimizes the economic objective and depot-level peak load while maintaining SOC-related feasibility.
Research on battery electric bus charging scheduling can be classified according to different energy replenishment modes, including opportunity charging during route operation [
8], battery swapping operations [
9], and centralized charging at depots [
10]. Among these, opportunity charging studies have examined the joint optimization of charging infrastructure, vehicle scheduling, and charging management [
11], as well as charging scheduling on bus networks [
12]. Battery swapping studies mainly focus on battery inventory configuration, demand matching, and the joint management of charging and swapping resources [
13,
14]. For nighttime centralized charging scenarios in bus depots, a substantial body of research has focused on cost reduction while considering constraints such as vehicle arrival and departure times, charging demand, and charger availability. Qin et al. [
15] simulated the daily charging behavior and demand charges of a battery electric bus fleet under a fast charging system and reduced station demand charges by optimizing the SOC charging threshold. Teng et al. [
16] developed a multi-objective optimization model that considered constraints such as vehicle mileage and charging conditions, with the aims of improving departure headway regularity, reducing fleet size, and minimizing total charging cost.
In addition, increasing attention has been paid to time-of-use electricity pricing [
17], charging management strategies [
18], and depot-level peak load control [
19]. Zhang et al. [
20] investigated the role of time-of-use electricity pricing in electric bus charging scheduling by considering partial charging and limited charger resources, demonstrating its impact on fleet operating costs. Jahic et al. [
21] addressed charging scheduling for large-scale electric bus depots and proposed scheduling algorithms with the explicit objective of minimizing the depot-level peak load, showing that coordinated charging can reduce excessive load peaks caused by uncontrolled depot charging. Grenander and Daniels [
22] analyzed electric bus charging costs from the perspectives of electricity price signals and load flexibility, showing that peak-related tariff components can substantially affect charging economy. Furthermore, some studies [
23,
24] have introduced battery-related factors and nonlinear charging processes into scheduling models to better reflect real-world charging behavior. Recent studies have also addressed uncertainty in vehicle-to-grid operation and compatibility among multiple vehicle and charger types, further showing that charger constraints, operational feasibility, and multi-objective decision making are central issues in electric bus charging scheduling [
25,
26].
Although previous studies have addressed depot-level peak load control, nonlinear charging processes, battery-related factors, and multi-objective charging scheduling under limited resources, these elements are often modeled from separate perspectives. In nighttime depot charging, however, SOC-dependent charging power affects time-slot-level load formation, while vehicle time windows, charger exclusivity, departure SOC requirements, and depot capacity jointly shape scheduling feasibility. This study therefore integrates staged charging and interval-overlap-based load calculation into a discrete nighttime charging scheduling model, providing a more detailed basis for coordinating depot load, vehicle availability, and departure SOC constraints.
For model solving, commonly used approaches for such scheduling optimization problems include mathematical programming methods, heuristic rule-based methods, and metaheuristic optimization algorithms [
27,
28,
29]. In the scenario studied here, whether a vehicle is charged, when charging starts, how long charging lasts, and which charger is assigned are all discrete decisions jointly constrained by vehicle operating time, departure energy requirements, and depot resource conditions. Therefore, simple rule-based methods have difficulty balancing feasibility and multi-objective trade-offs, whereas directly applying fine-grained mathematical programming to obtain a set of compromise solutions may involve a relatively high modeling and computational burden. On this basis, Strength Pareto Evolutionary Algorithm 2 (SPEA2) is adopted as the basic framework in this study. The problem considered here requires a set of executable Pareto compromise scheduling schemes, and SPEA2 combines Pareto fitness assignment with an external archive mechanism to preserve high-quality nondominated solutions during evolution, making it suitable as the basis for further developing a problem-specific algorithmic design.
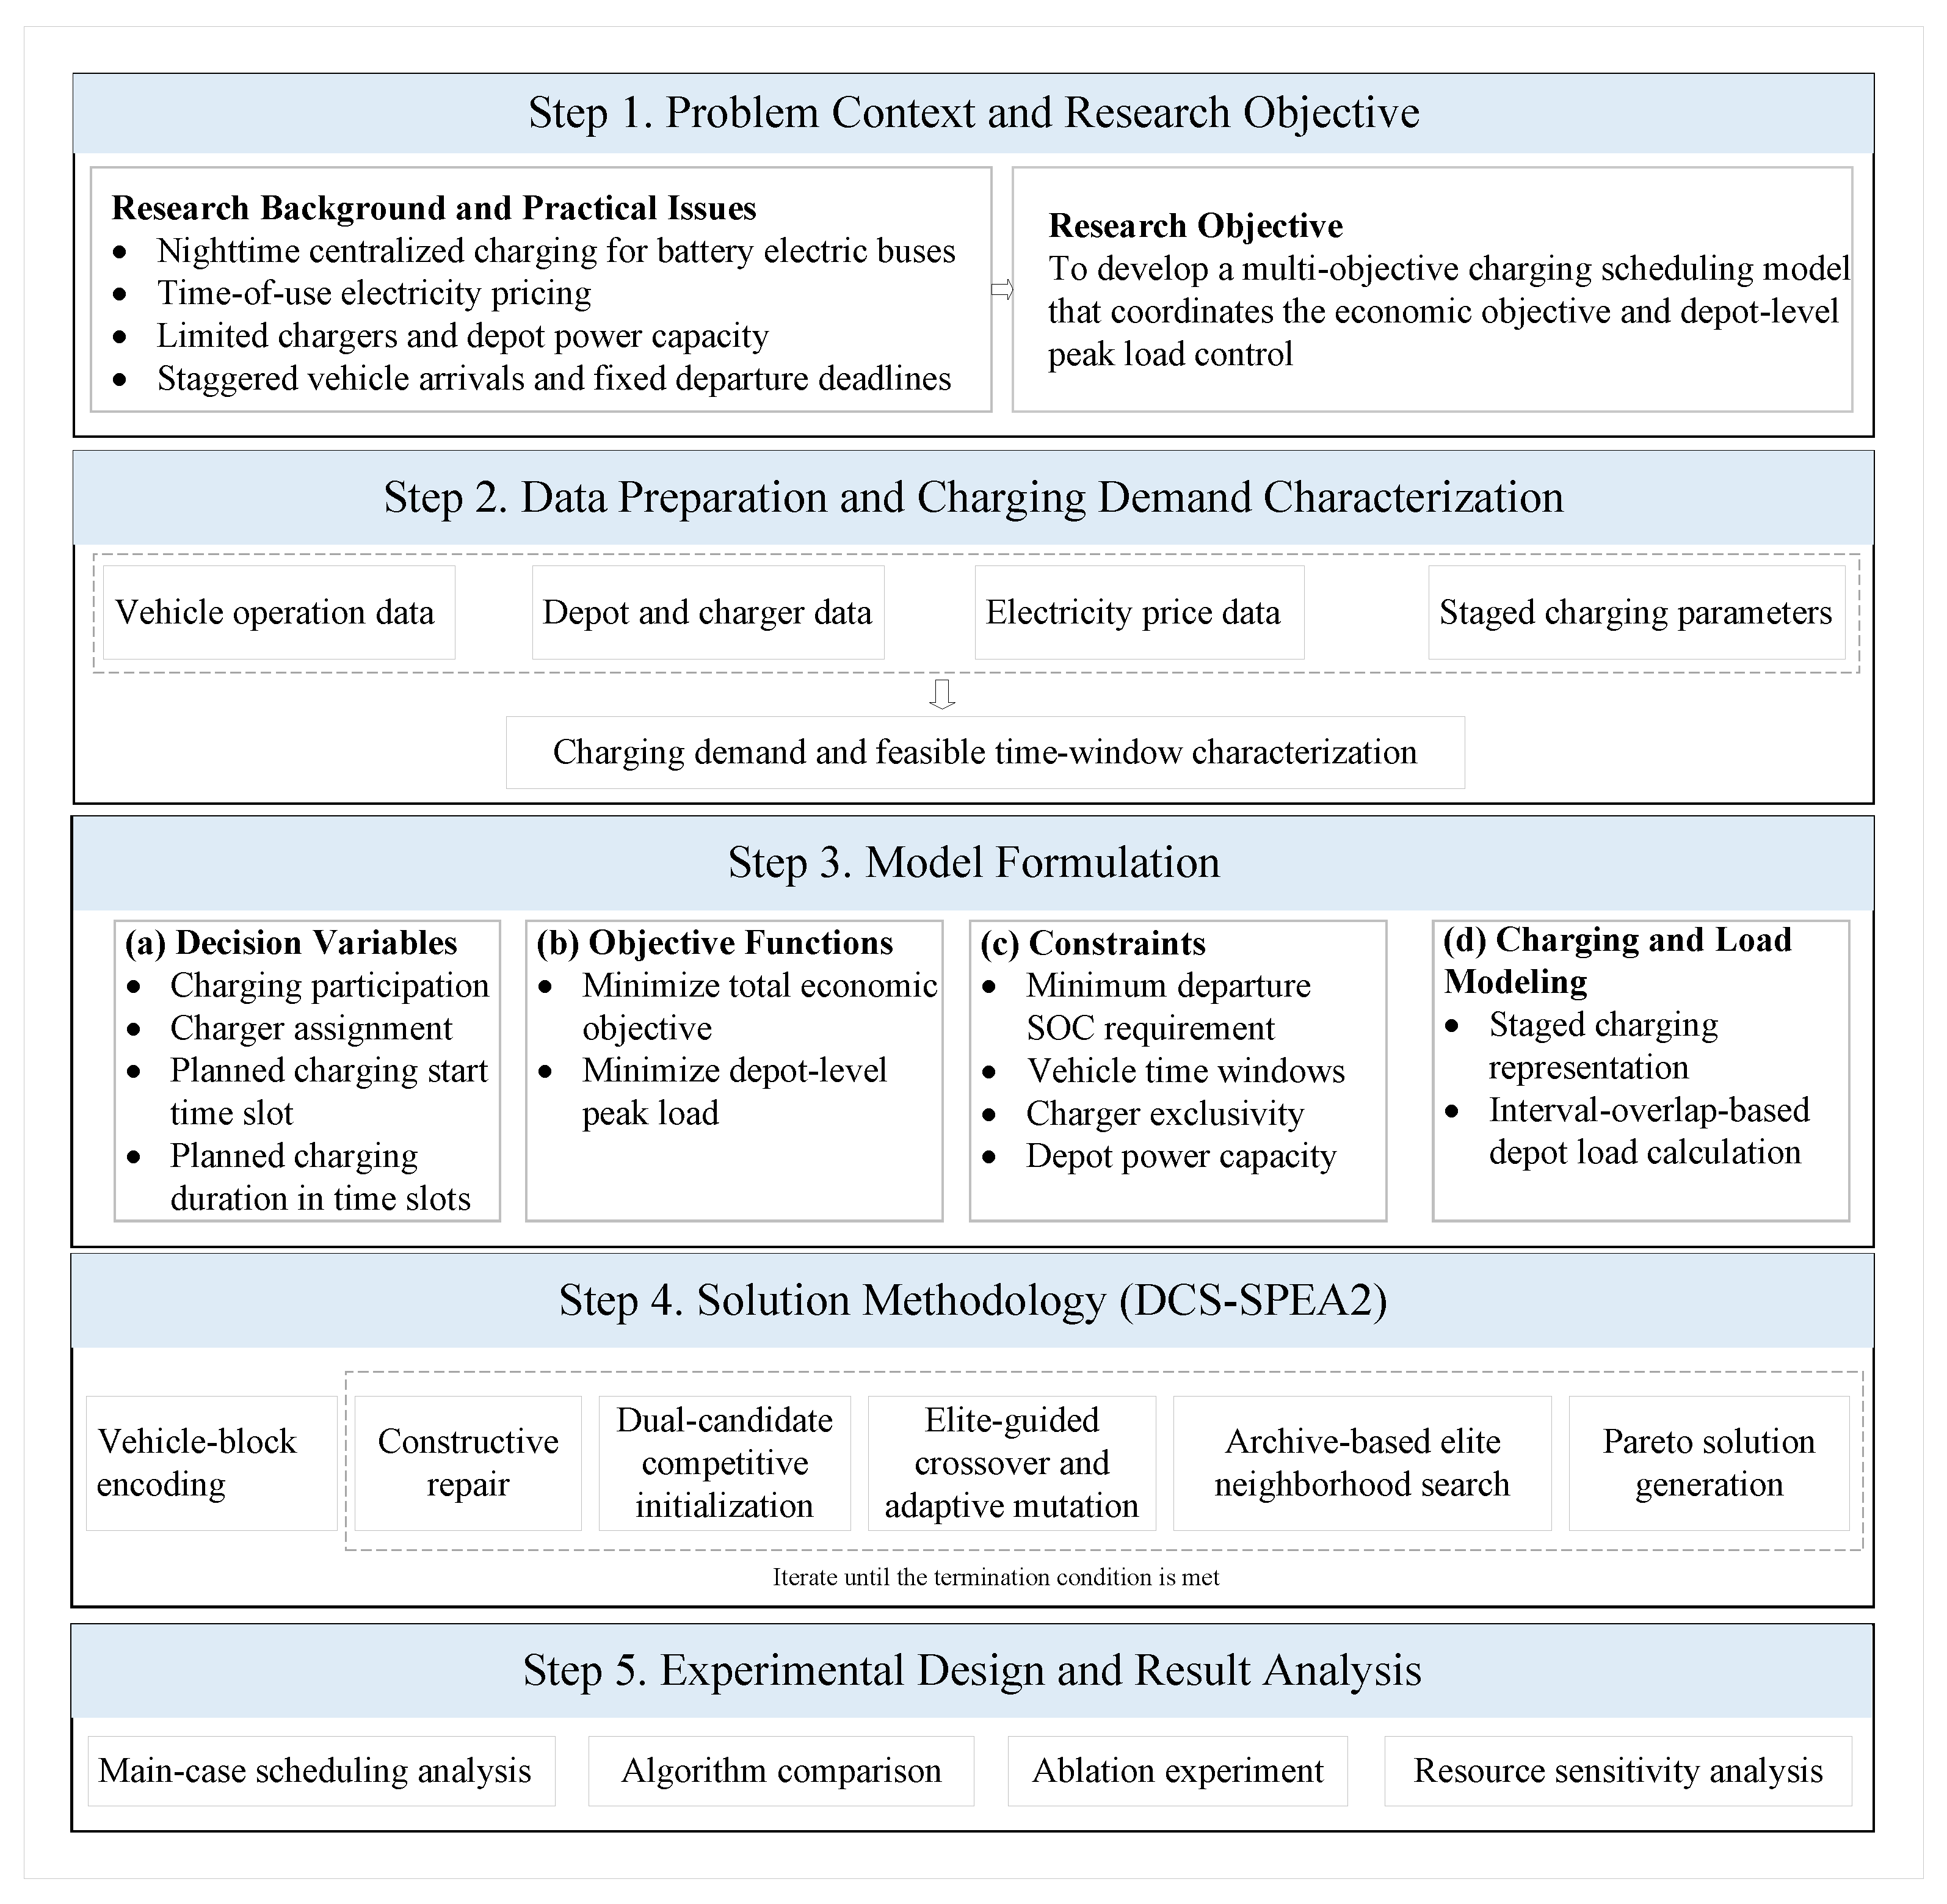
Based on the above considerations, this study examines the nighttime centralized charging scenario of battery electric buses. From the perspective of coordinated bus depot resource management and sustainable depot operations, the nighttime charging scheduling problem is formulated as a multi-objective discrete parallel-machine scheduling problem for charging management at urban bus depots considering vehicle arrival and departure time windows, SOC requirements, charger exclusivity, depot power capacity, and staged charging characteristics. The main contributions of this study are as follows:
- (1)
A multi-objective optimization model is developed for nighttime centralized charging scheduling of battery electric buses under limited depot resources. With the economic objective and depot-level peak load control as the core objectives, the model characterizes the scheduling trade-off among the utilization of low-price periods, departure energy assurance, and depot resource constraints.
- (2)
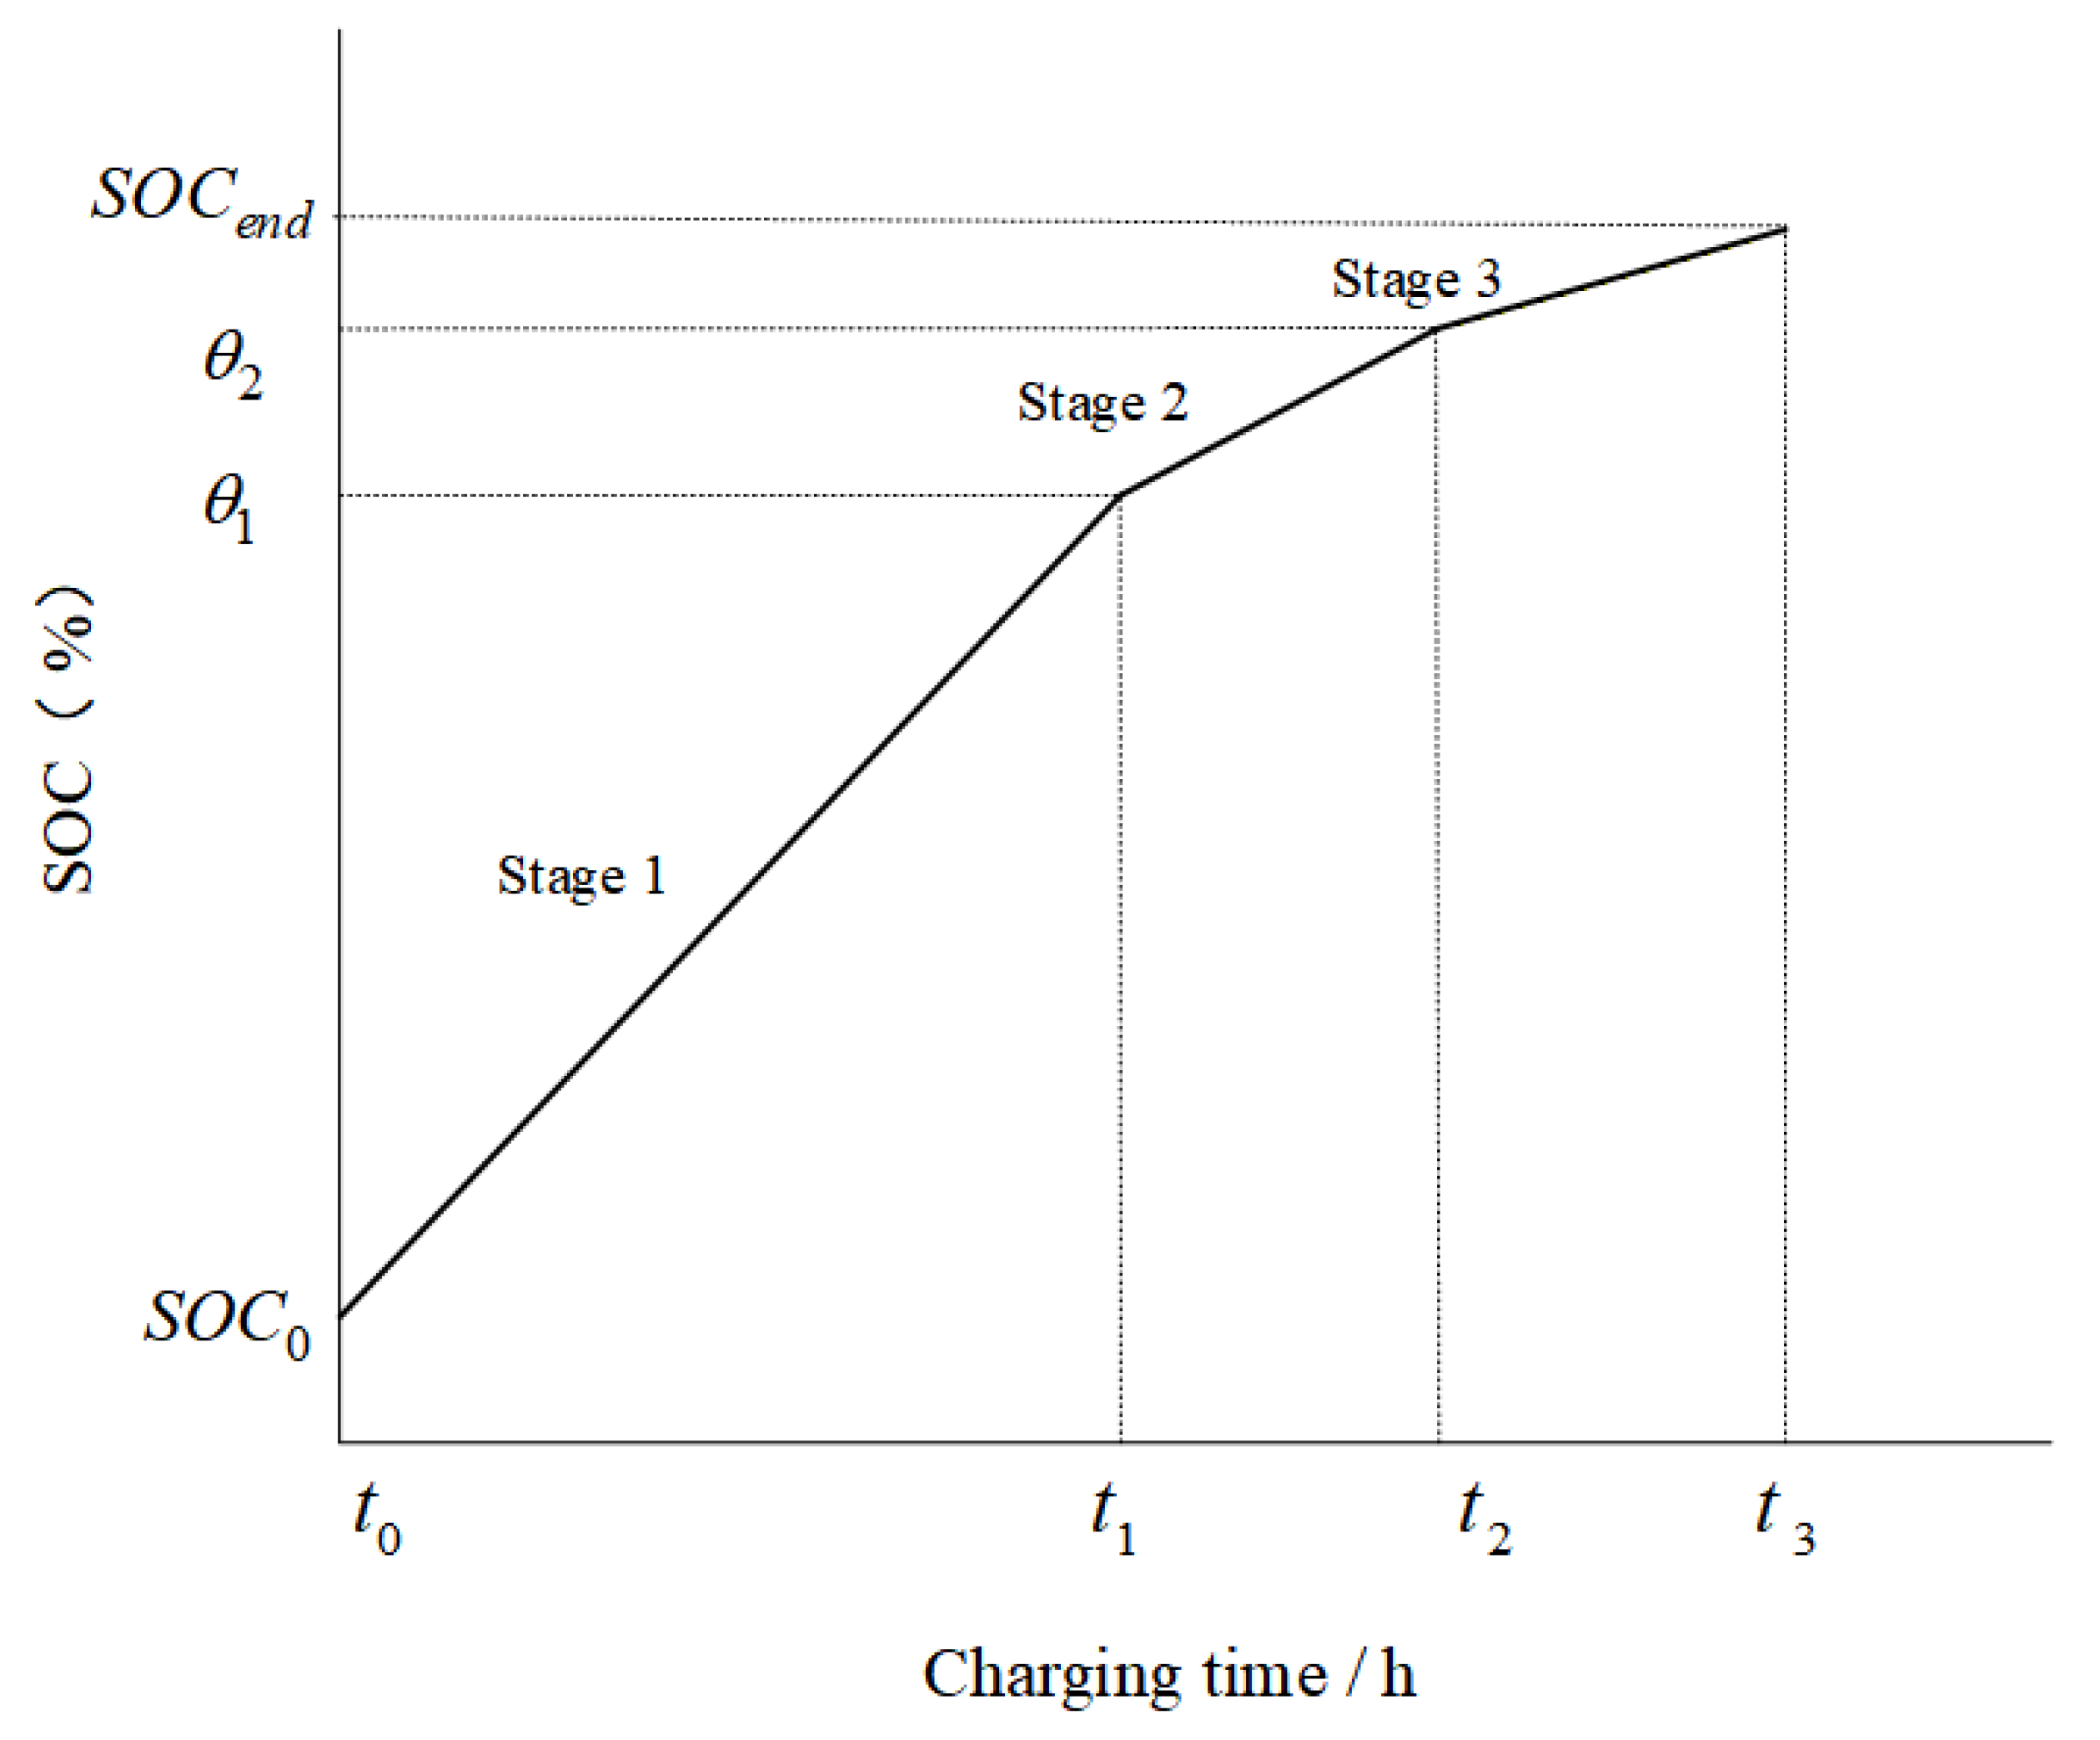
A staged charging representation and an interval-overlap-based load calculation method are introduced to describe the charging process as a function of SOC and its contribution to depot load within discrete scheduling windows. This modeling treatment enables a more refined characterization of vehicle load contribution across different time windows under staged charging conditions, thereby providing a more accurate calculation basis for depot capacity constraints and peak load control.
- (3)
A problem-specific algorithm based on SPEA2, termed Discrete Charging Scheduling SPEA2 (DCS-SPEA2), is developed for the charging scheduling problem studied here. By combining problem-specific encoding, decoding, and constraint-handling mechanisms, the algorithm generates executable Pareto charging schedules. A real-world bus depot case study is conducted to verify the effectiveness of the solution method and the applicability of the proposed modeling framework.
The remainder of this article is organized as follows.
Section 2 formulates the nighttime depot charging scheduling problem and presents the multi-objective optimization model.
Section 3 describes the DCS-SPEA2 algorithm and its problem-specific mechanisms.
Section 4 reports the case study, main-case scheduling results, algorithm comparison, ablation experiment, and scheduling adaptability analysis under depot resource constraints.
Section 5 discusses the main findings and their implications, and
Section 6 concludes the study and outlines future research directions.
3. Algorithm Design
SPEA2, proposed by Zitzler et al. as an extension of the Strength Pareto Evolutionary Algorithm, has been applied to various multi-objective engineering optimization problems [
33]. The nighttime depot charging problem studied here requires a set of executable Pareto compromise schedules rather than a single optimum. SPEA2 is therefore adopted as the base framework because its Pareto fitness assignment and external archive mechanism can preserve high-quality nondominated solutions during evolution.
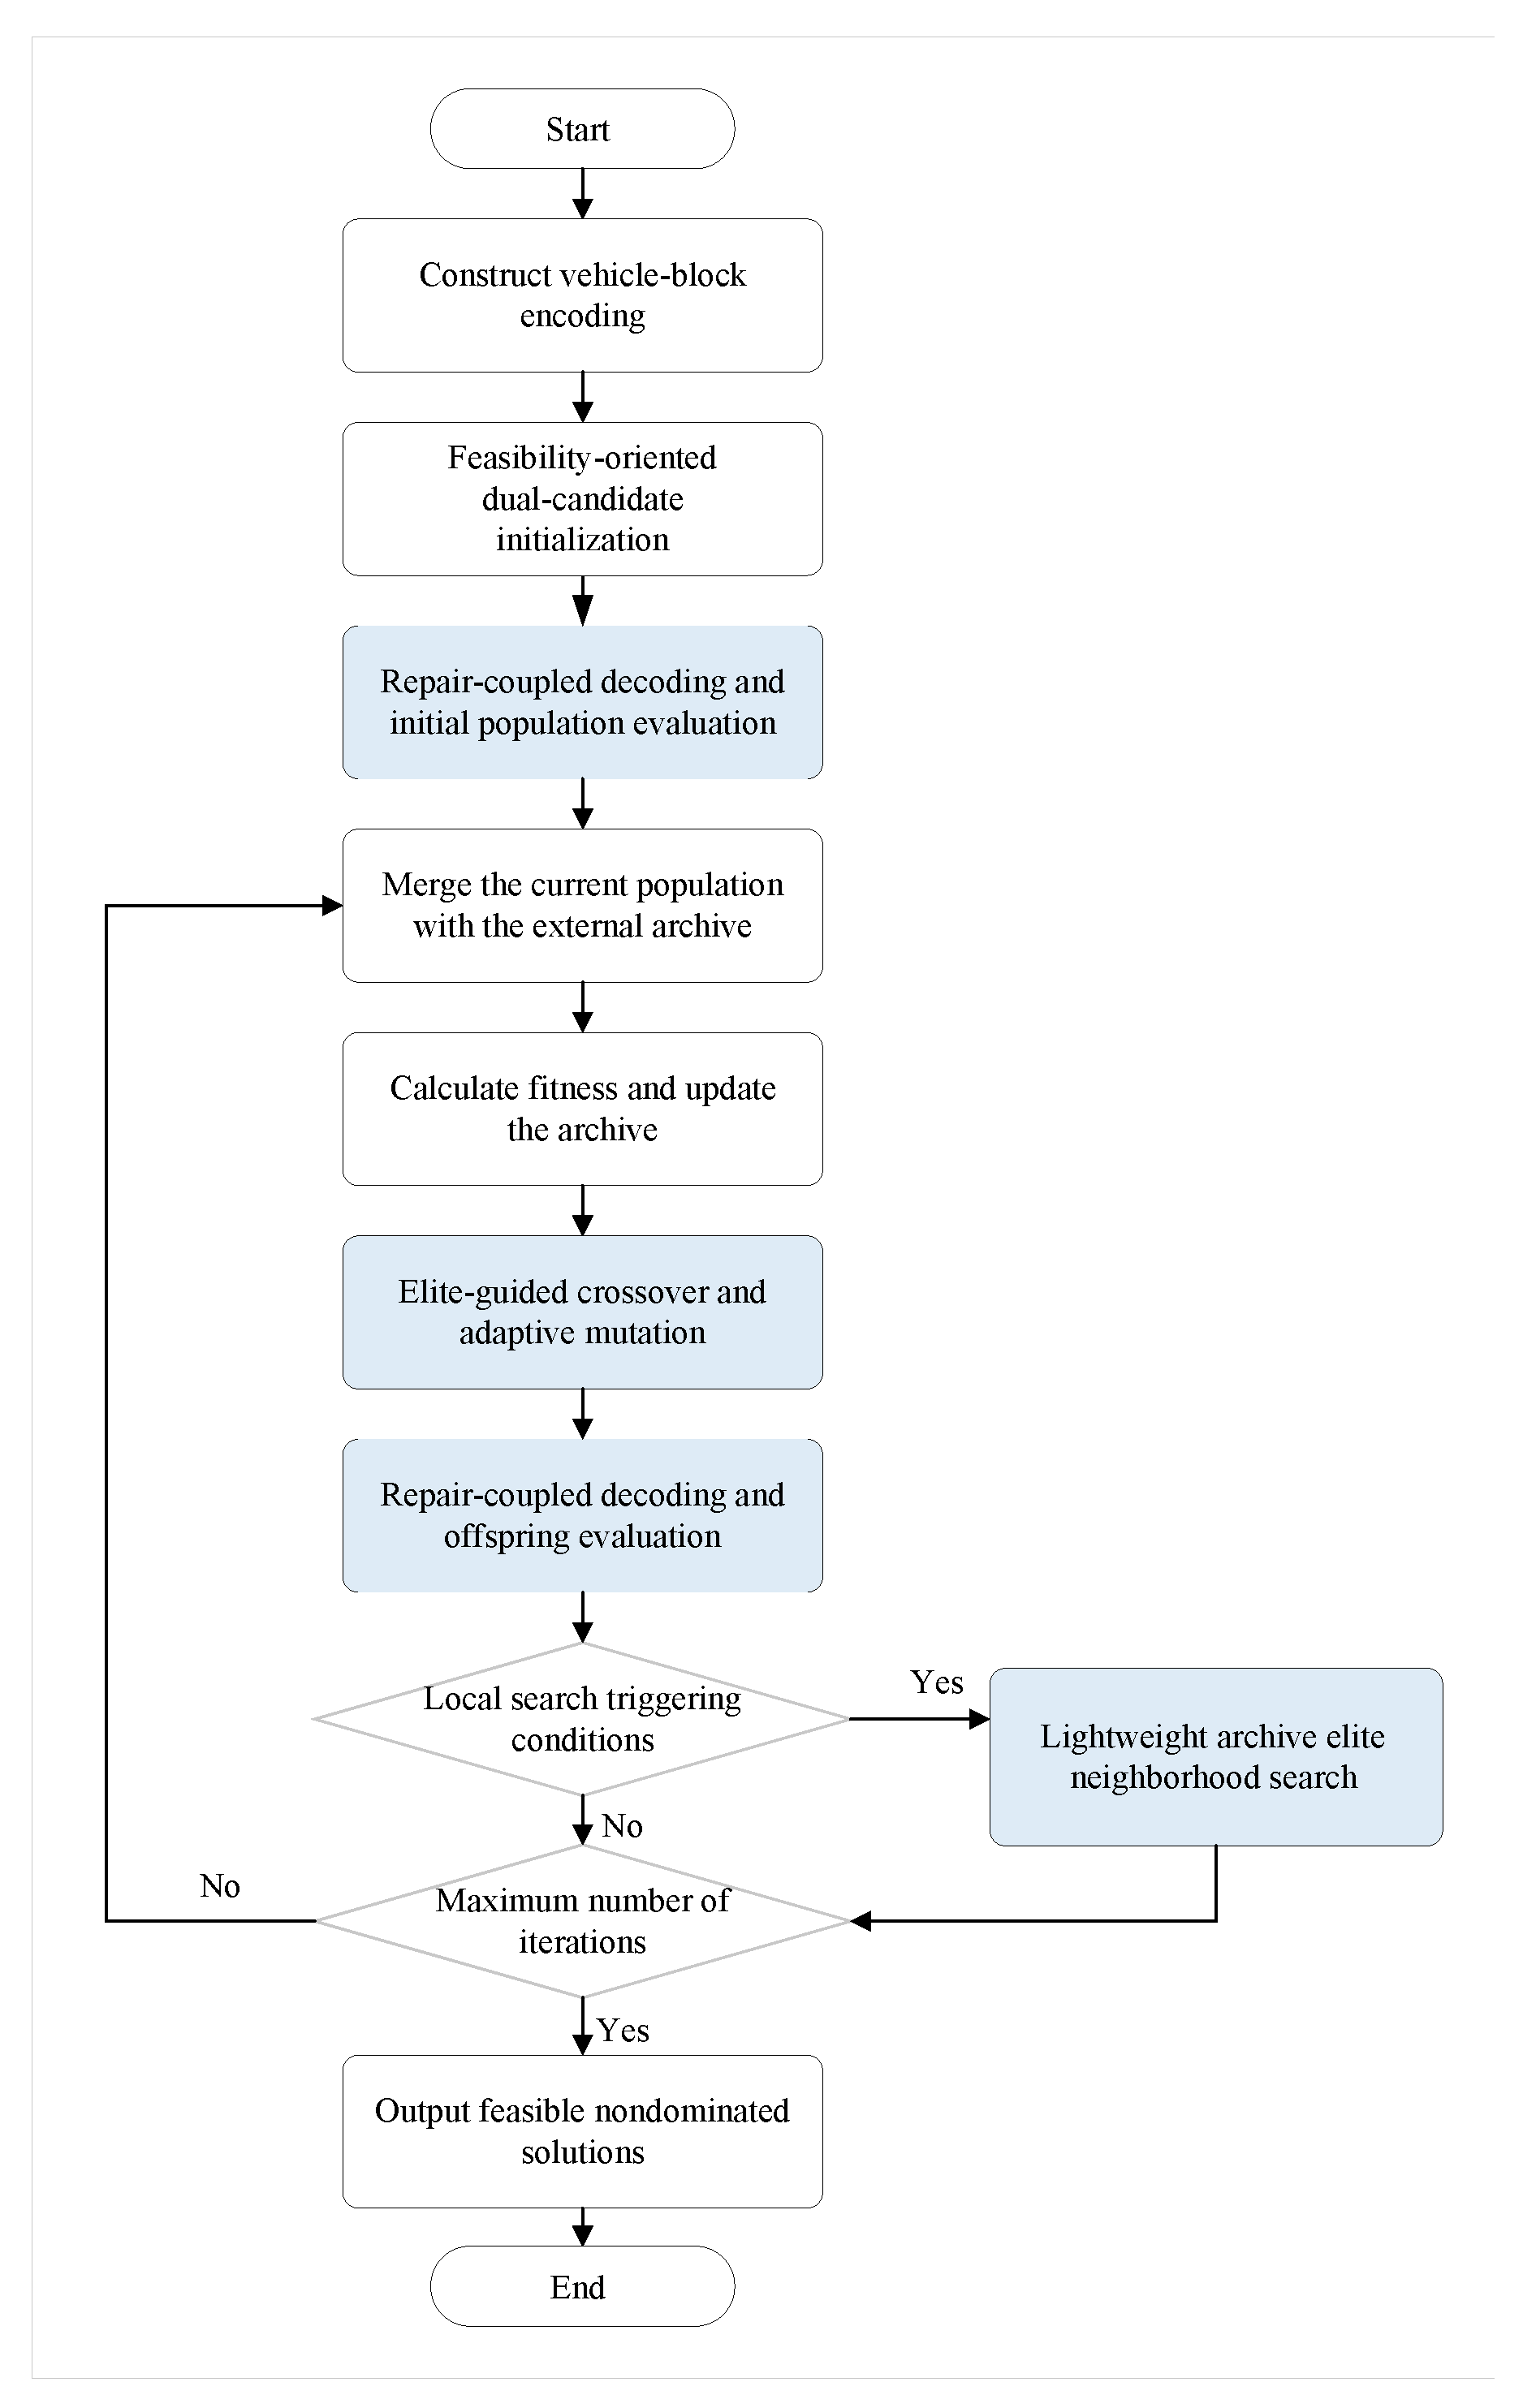
However, directly applying standard SPEA2 to this problem may generate many infeasible or structurally poor individuals. Vehicle charging decisions are block-structured rather than independent genes, and feasibility is jointly shaped by time windows, charger exclusivity, staged charging characteristics, SOC requirements, and depot capacity. To address these features, DCS-SPEA2 combines vehicle-block encoding, constructive repair, feasibility-oriented initialization, elite-guided crossover, adaptive mutation, and lightweight archive-based elite neighborhood search.
Figure 3 illustrates the overall algorithmic procedure.
3.1. Vehicle-Block Encoding, Decoding, and Constructive Repair
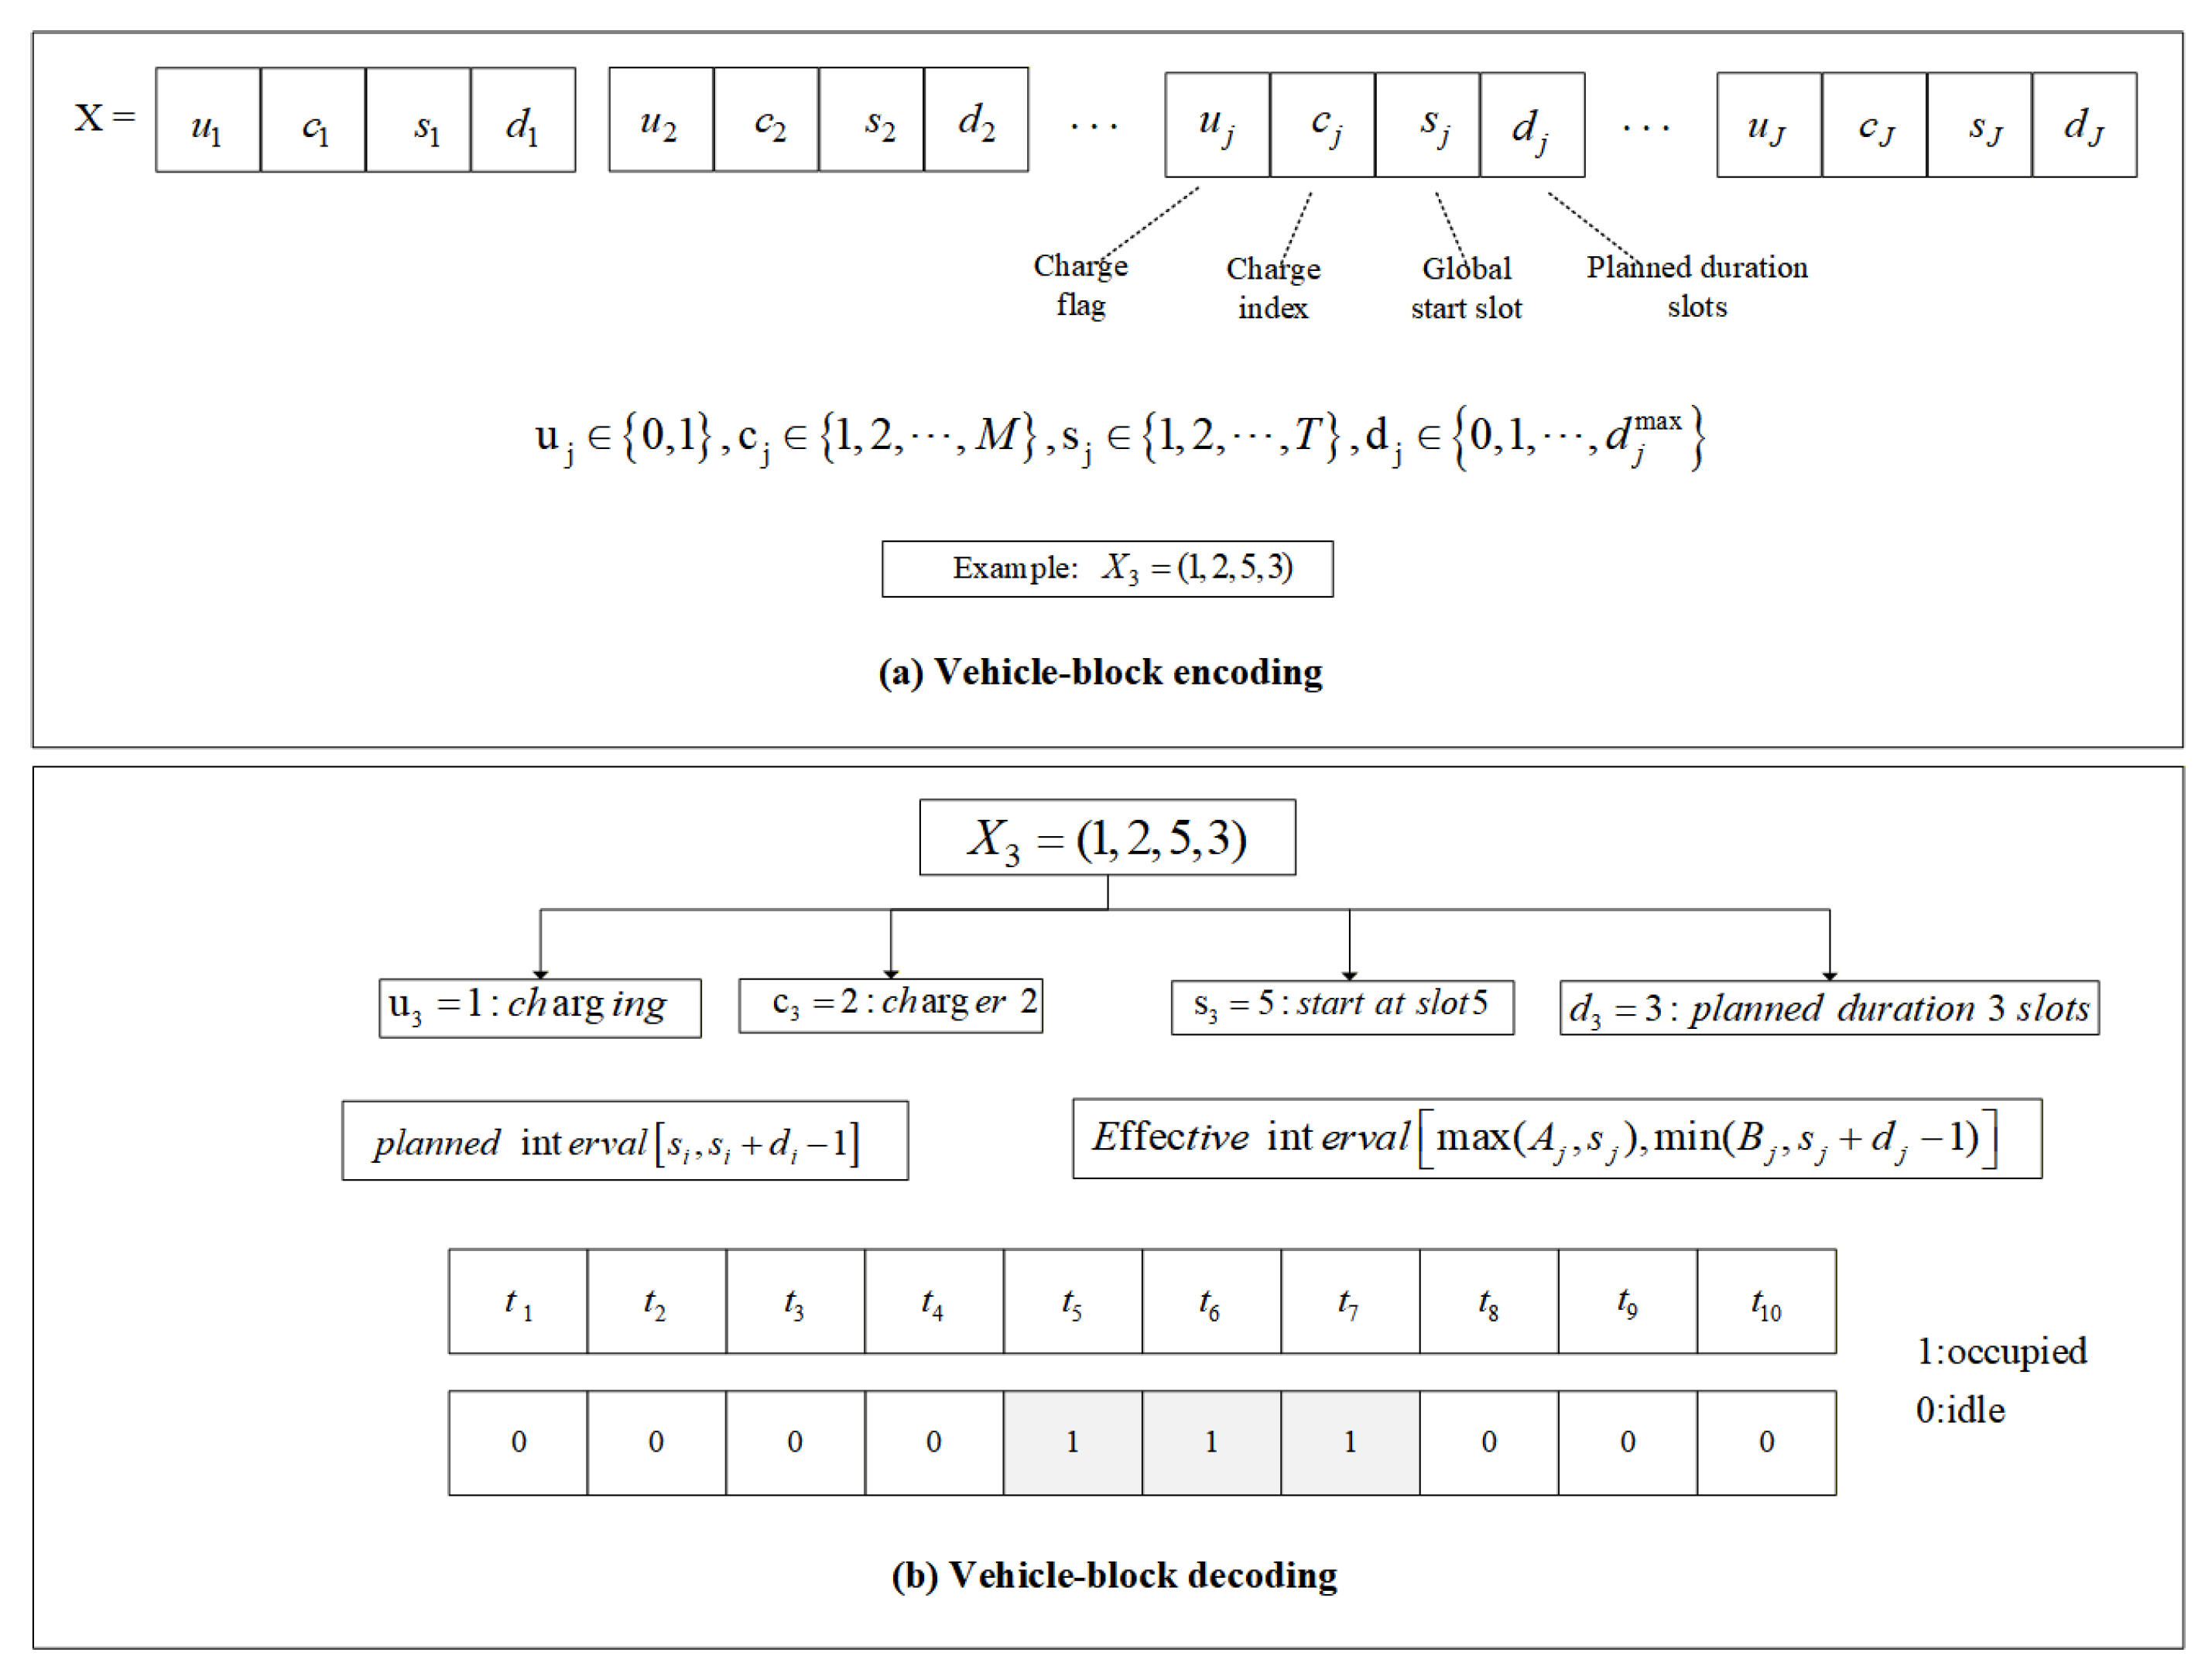
In the battery electric bus charging scheduling problem, an algorithmic individual represents a candidate scheduling plan. Considering that vehicle operation tasks have fixed temporal connections and that the charging process is simultaneously constrained by vehicle time windows, charger exclusivity, depot capacity, and SOC requirements, this study adopts a vehicle-block-based encoding scheme to describe the individual structure. Each vehicle block corresponds to the charging decision unit of one bus within the scheduling horizon, and all vehicle blocks together constitute a complete scheduling individual. Vehicle-block encoding does not directly yield an executable charging schedule. In the proposed algorithm, the variables directly involved in evolutionary search include whether a vehicle participates in charging, the assigned charger index, the planned charging start time slot on the global time axis, and the planned charging duration in time slots. In contrast, service precedence on the same charger, effective charging intervals after time-window truncation, staged charging start and end times, and depot load on a time-slot basis are determined through decoding, constructive repair, and feasibility checking after the vehicle blocks are specified. Therefore, constructive repair is not merely a boundary adjustment step, but a key problem-specific mechanism linking discrete encoding to executable charging schedules.
Figure 4 illustrates how the four-dimensional vehicle block
is decoded into an executable charging schedule. When a vehicle participates in charging, the planned interval generated by
and
is first intersected with the vehicle arrival–departure time window to obtain the effective charging interval. The SOC evolution, final SOC, and time-slot load are then evaluated using the equivalent average charging power sequence. Constructive repair coordinates charger conflicts, temporal overlaps, depot capacity, and minimum departure SOC feasibility, thereby linking the encoded vehicle blocks to executable schedules.
3.2. Population Initialization
For the nighttime centralized charging scheduling problem of battery electric buses, each individual consists of multiple interdependent vehicle blocks. If the initial population is generated in a completely random manner, a large number of infeasible individuals or structurally poor initial solutions may be produced, thereby increasing ineffective search in the early stage. To improve the feasibility of the initial search region and the quality of the search starting points, a dual-candidate competitive initialization strategy is introduced in the initialization stage. For each initial individual, two candidate scheduling schemes are constructed.
Here,
denotes the heuristic candidate, which is mainly generated according to vehicle demand information so that the initial individual is as close as possible to the feasible scheduling region;
denotes the random candidate, which is used to maintain the diversity of the initial population. After the two candidate schemes are generated, both are subjected to boundary handling and constructive repair, and their objective function values and total constraint violation (CV) are calculated:
where
denotes the objective function vector of the candidate scheme, and
denotes the total constraint violation.
Candidate selection follows the feasibility-first principle. If only one of the two candidates is feasible, the feasible candidate is selected. If both candidates are infeasible, the one with the smaller total constraint violation is selected. If both candidates are feasible, they are first compared according to the Pareto dominance relation. If neither candidate dominates the other, the candidate with better overall performance is selected based on the normalized compromise score.
3.3. Elite-Guided Crossover and Adaptive Mutation
Even after decoding with constructive repair improves schedule feasibility, the subsequent evolutionary search still needs to avoid disrupting effective vehicle scheduling structures during recombination. Standard discrete-encoding SPEA2 usually generates offspring through random recombination between parent individuals and fixed mutation. However, in the battery electric bus centralized charging scheduling problem studied here, the charging participation status, charger index, charging start time, and charging duration of a vehicle jointly form a complete scheduling unit. Conventional gene-level crossover may disrupt such block-structured scheduling information. Therefore, this study uses the vehicle block as the basic crossover unit and introduces elite individuals from the external archive to guide parent recombination, thereby preserving high-quality vehicle-block structures in offspring generation.
Fixed crossover and mutation probabilities are also difficult to adapt to changes in the search state, which may cause insufficient population diversity or search stagnation. To address this issue, problem-specific improvements are introduced into the crossover and mutation stages without changing the strength fitness calculation or external archive maintenance framework of SPEA2. Specifically, adaptive mutation adjusts the perturbation intensity according to population diversity, the feasible solution ratio, and the search stagnation degree. The crossover probability is also adjusted according to the search state to reduce repeated recombination between similar parents. The detailed procedure is shown in Algorithm 1.
| Algorithm 1 Elite-guided vehicle-block crossover and adaptive mutation |
Input: Parent individuals and ; external archive ; number of vehicles ; population diversity D; stagnation degree ; feasible solution ratio . |
Output: Offspring individual . |
1: Select an elite guiding individual from the external archive . |
2: Calculate the adaptive mutation probability . |
3: Calculate the adaptive crossover probability . |
4: if then |
5: Initialize as an empty offspring individual. |
6: for do |
7: Generate a random number . |
8: if then |
9: . |
10: else if then |
11: . |
12: else |
13: . |
14: end if |
15: end for |
16: else |
17: Randomly copy one parent individual as . |
18: end if |
19: Apply discrete mutation to according to . |
20: Apply boundary handling and constructive repair to . |
21: Decode and evaluate to obtain objective values and total constraint violation. |
22: return . |
First, in the crossover stage, this study does not adopt random single-gene exchange. Instead, the vehicle block is used as the basic operating unit. Let the vehicle block of vehicle
j be
, and let the two parent individuals be
and
, respectively. Let
denote the elite individual selected from the external archive. Then, the offspring vehicle block is generated according to the following rule:
where
r is a random number in the interval
,
and
denote the probabilities of inheriting the vehicle block from Parent 1 and Parent 2, respectively, while
denotes the probability of inheriting the vehicle block from the archive elite individual, satisfying
.
This strategy preserves the differential information of the two parents to maintain population diversity, while inheriting high-quality vehicle blocks from the archive elite individual with a certain probability, so that vehicle charging arrangements with good performance can be propagated in subsequent populations. Since each vehicle block contains a complete charging decision for a single vehicle, this crossover method can reduce the damage caused by conventional random crossover to feasible scheduling structures.
Adaptive mutation is used to dynamically adjust the search intensity. The algorithm dynamically adjusts the crossover and mutation probabilities according to population diversity, the search stagnation degree, and the feasible solution ratio. When population diversity is insufficient or search stagnation occurs, the mutation probability is increased to enhance global exploration. When the feasible solution ratio is low, mutation perturbation is appropriately strengthened and combined with constructive repair to increase the opportunity to search feasible regions. Meanwhile, when search stagnation occurs or the feasible solution ratio is low, the crossover probability is appropriately reduced to avoid repeated recombination between similar parents. The mutation probability is set as follows:
where
D denotes the population diversity indicator,
denotes the search stagnation degree, and
denotes the feasible solution ratio of the current population. The parameters
,
, and
are the weights of the three state indicators, respectively, satisfying
.
In the implementation, the vehicle-block inheritance probabilities are set as , , and . Therefore, the inheritance boundaries are 0.35 and 0.70. For adaptive mutation, the probability bounds are set as and . The weights of diversity deficiency, stagnation degree, and infeasible-ratio terms are set as , , and , respectively.
3.4. Lightweight Archive-Based Elite Neighborhood Search
Introducing local search into the multi-objective evolutionary process can improve exploitation around high-quality solutions. However, because a complete decoding, repair, and evaluation procedure is computationally expensive in battery electric bus charging scheduling, this study does not adopt large-scale local search. Instead, a lightweight archive-based elite neighborhood search mechanism is designed.
The proposed local search is not applied to all vehicles. It preferentially focuses on three types of candidate vehicles that are more likely to affect objective quality and constraint feasibility, namely vehicles with insufficient SOC margins, vehicles charged during peak load periods, and vehicles with relatively large desired SOC gaps. Neighborhood operations are performed mainly in three directions: shifting the charging start time, adjusting the charging duration, and replacing the charger.
To limit computational overhead, the mechanism is executed in a lightweight manner through interval-based triggering, elite-ratio control, and neighborhood evaluation budget limitation. Let the size of the external archive be
, the archive capacity be
, and the elite ratio for local search be
. Then, the number of elite individuals participating in neighborhood search each time is given by
where
denotes the current archive size.
In the implementation, local search is embedded after the external archive update and is activated only when the archive is nonempty. The triggering interval is set to 10 generations, the archive size is set to , and the elite ratio is set to . In addition, for each elite solution, the local search examines at most 5 candidate vehicles and allows at most 8 fresh neighborhood evaluations, while the number of retained candidate start-time adjustments is capped at 7. When the triggering conditions are satisfied, local intensification is performed on a small number of archive elite individuals. The generated neighborhood solutions are then subjected to constructive repair and objective evaluation, and are accepted or rejected according to the feasibility-first rule.
4. Case Study
4.1. Experimental Design
To verify the applicability of the proposed charging scheduling optimization scheme and evaluate the effectiveness of the improved algorithm, this study selects Shanghai bus route 71 as a representative case. The vehicles on this route undergo nighttime centralized charging at the same bus depot, namely the Shenkun Road Depot. The case with 29 battery electric buses and 6 chargers is selected as the main case for Pareto front analysis, compromise scheduling scheme analysis, depot-level load analysis, and comparative experiments between the improved algorithm and the standard SPEA2 algorithm. The vehicle-level operational data are provided in
Appendix A. According to the vehicle operation timetable, the available charging time window of the bus depot is set from 21:00 to 09:00 the next day, and this time window is discretized into time slots of 10 min. The parameters include vehicle battery capacity, rated power of chargers, and depot capacity. The values of these parameters are summarized in
Table 3. The staged charging power levels and SOC thresholds are case-study parameters used to approximate the decrease in charging power at high SOC levels, rather than field-calibrated charger-control curves. Monetary values are reported in Chinese yuan (CNY).
All numerical experiments were conducted on a 64-bit Windows personal computer equipped with an Intel Core i7-13650HX processor with 16 GB of RAM. All algorithms were implemented and executed in MATLAB R2023b.
4.2. Main Case Charging Scheduling Analysis
To verify the scheduling effectiveness of the proposed model in a centralized bus depot charging scenario, three charging strategies are compared: first-come-first-served (FCFS) charging, valley-price-priority charging, and DCS-SPEA2 optimization. The FCFS charging strategy schedules vehicles according to the chronological order of their effective chargeable start times within the scheduling window, representing a basic dispatching rule without global coordination. The valley-price-priority charging strategy preferentially assigns vehicles to consecutive chargeable intervals with lower electricity prices, representing a cost-oriented rule under depot resource constraints. The DCS-SPEA2 optimization strategy jointly searches the economic objective and the depot-level peak load objective to obtain a compromise charging schedule between the two objectives.
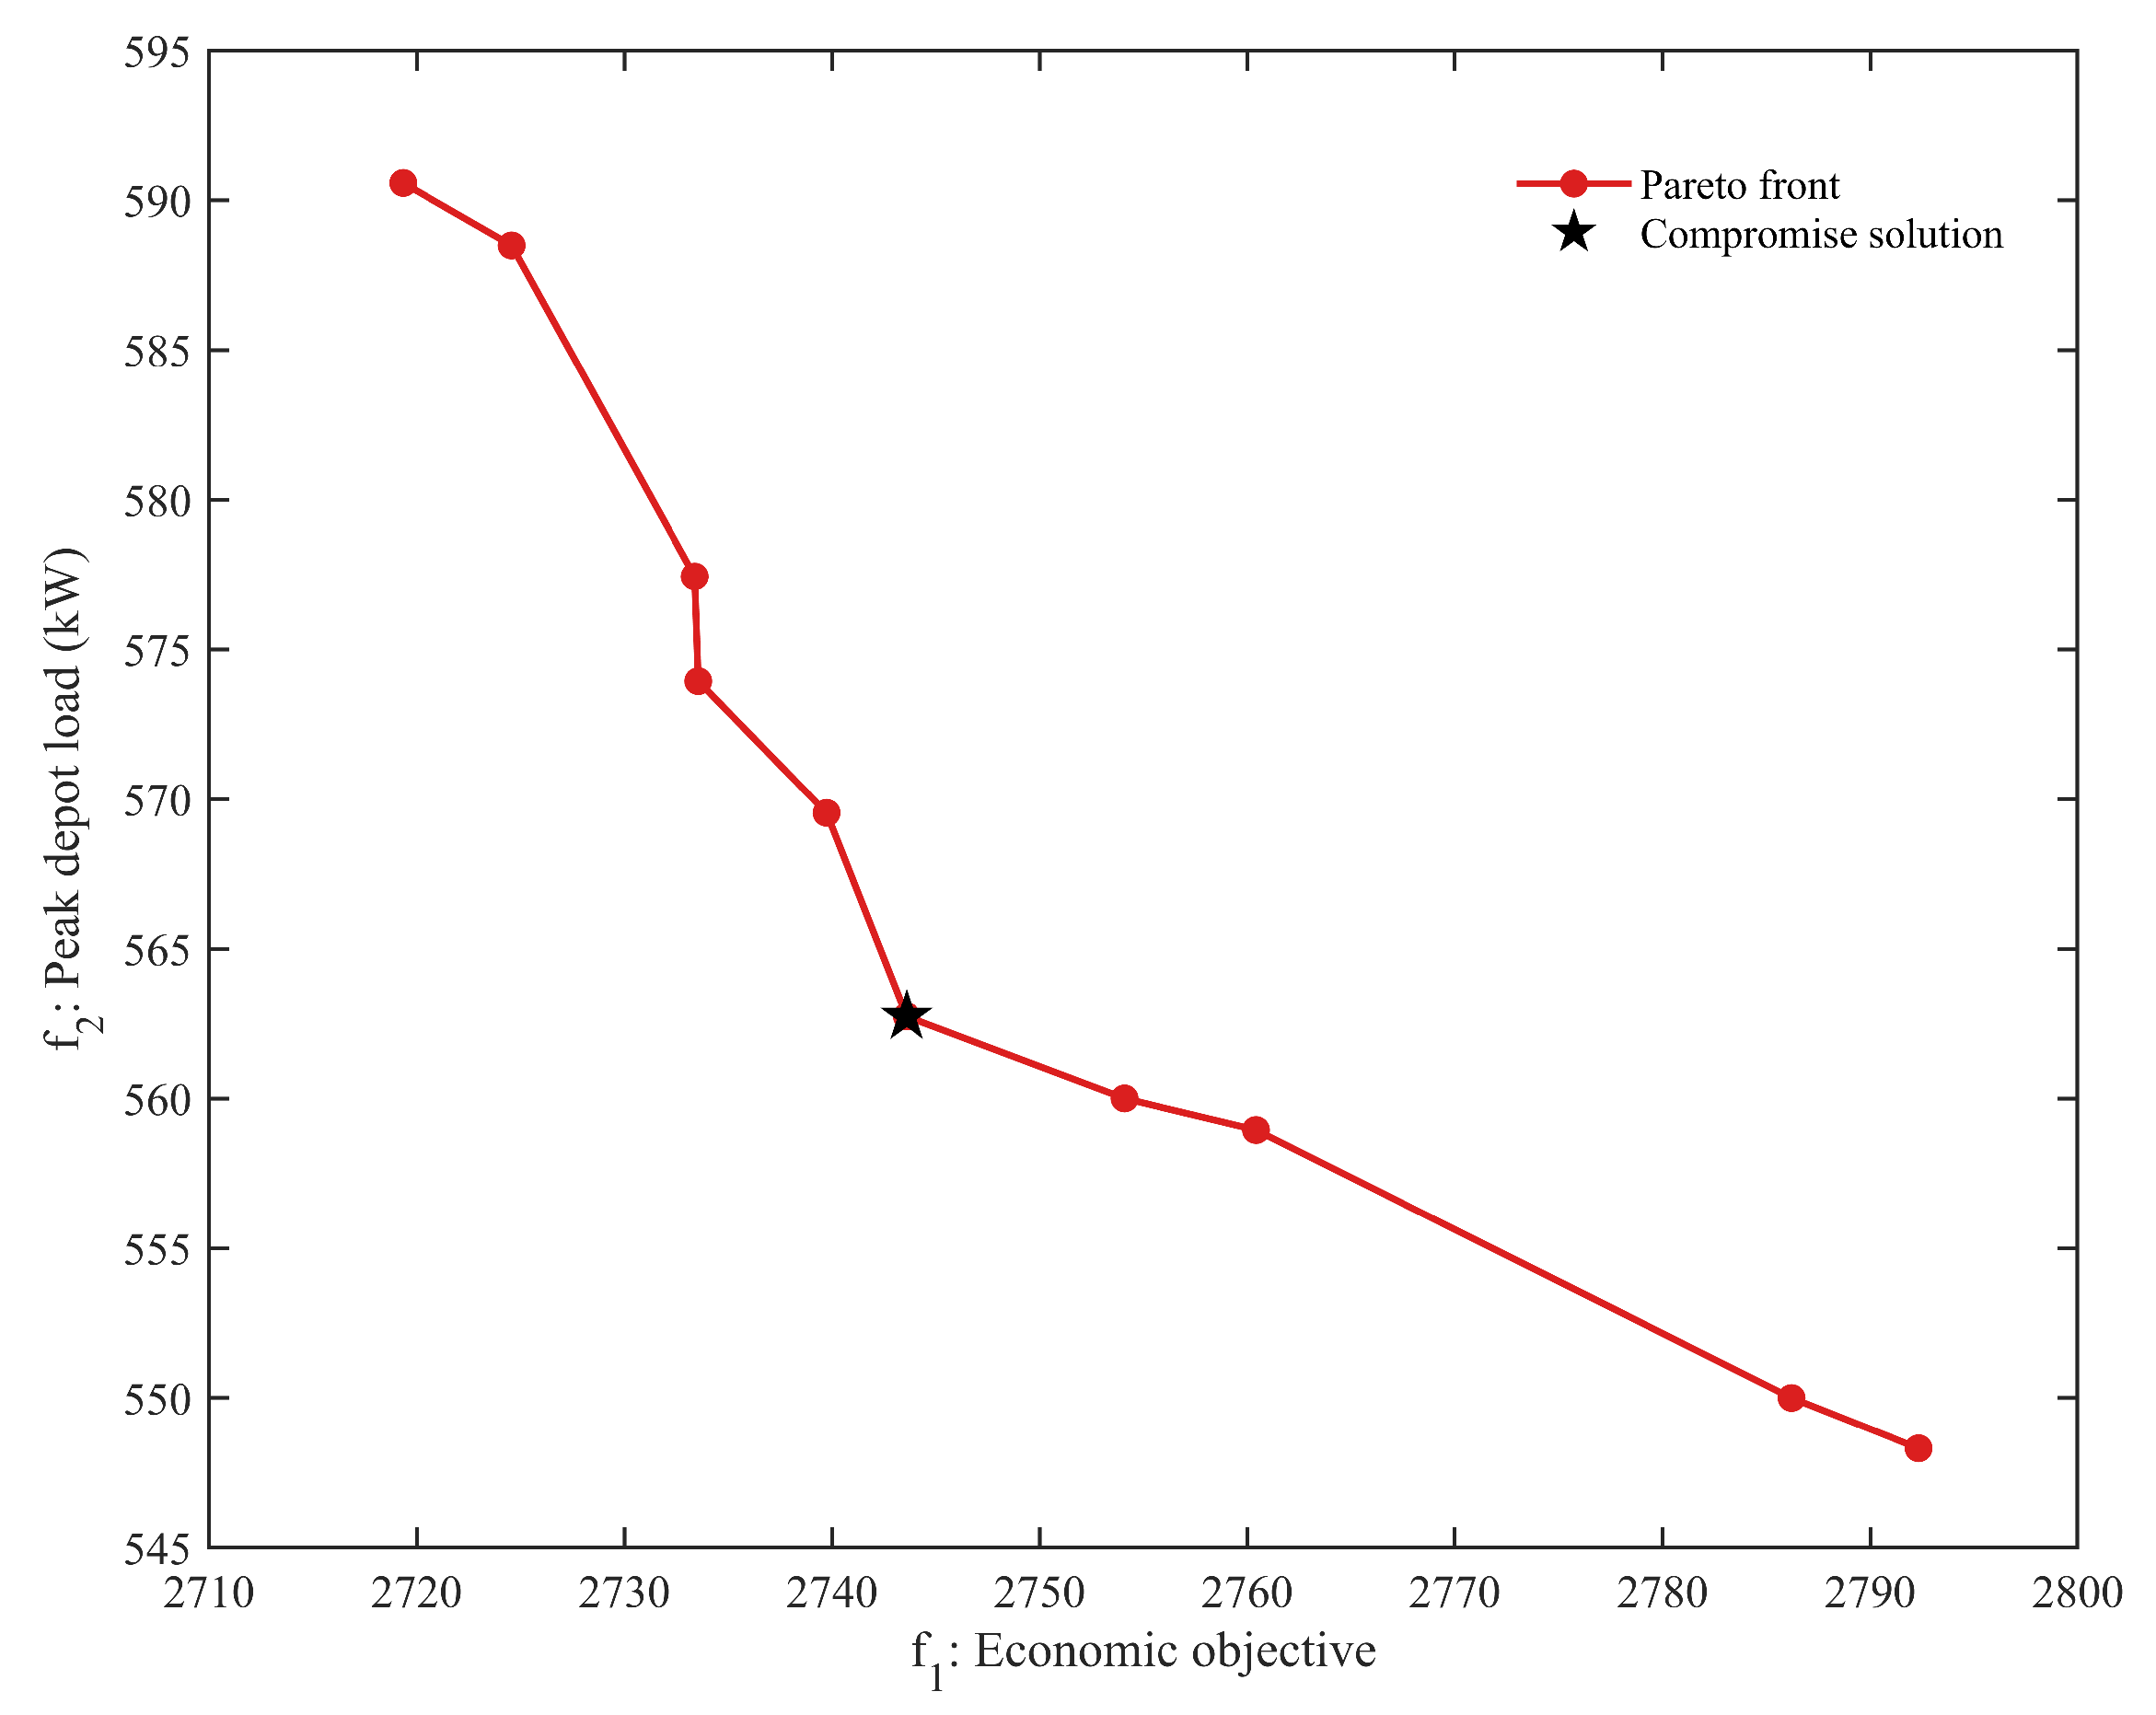
To reduce the influence of stochastic variation on result interpretation, DCS-SPEA2 is independently run 30 times under the main case, and the run whose hypervolume (HV) value is closest to the median HV of the 30 runs is selected as the representative result. HV is computed on the normalized objective space using the reference point . For the Pareto front obtained in this representative run, the two objectives are first processed using min–max normalization. The compromise solution is then selected according to the minimum equally weighted sum of the two normalized objectives. The subsequent comparison is based on this compromise solution and the corresponding schedules generated by the two rule-based strategies.
Table 4 summarizes the three charging strategies under the same SOC-handling rule, in which the desired SOC is first used as the charging target and the minimum departure SOC is treated as the feasibility threshold when the desired SOC cannot be fully reached. The results show clear differences in scheduling coordination. FCFS charging lacks global optimization and therefore performs poorly in both economic cost and SOC feasibility, while the valley-price-priority strategy lowers the direct energy cost but still reaches the depot capacity limit and leaves part of the fleet below the minimum departure SOC requirement. In contrast, DCS-SPEA2 achieves the most balanced performance: compared with FCFS and valley-price-priority charging, it reduces the total economic objective by 17.97% and 16.30%, respectively, while lowering the depot-level peak load by 6.21%. More importantly, it achieves a 100% minimum departure SOC compliance rate and reduces the SOC deviation penalty by 57.78% relative to the valley-price-priority strategy. These improvements indicate that the proposed method does not simply shift charging to low-price periods but coordinates cost reduction, peak-load control, and departure SOC feasibility under limited depot resources.
Figure 5 illustrates the Pareto solution set obtained from the representative DCS-SPEA2 run. The nondominated solutions form a relatively clear distribution in the objective space, indicating a trade-off between the economic objective and the depot-level peak load objective. When the economic objective value is relatively low, some vehicles tend to be scheduled in low-price periods, which increases the depot-level peak load objective. When charging tasks are further dispersed over time, the depot-level peak load is controlled, but the corresponding economic objective value increases. The black star in the figure denotes the compromise scheduling scheme selected according to the normalized equally weighted sum criterion.
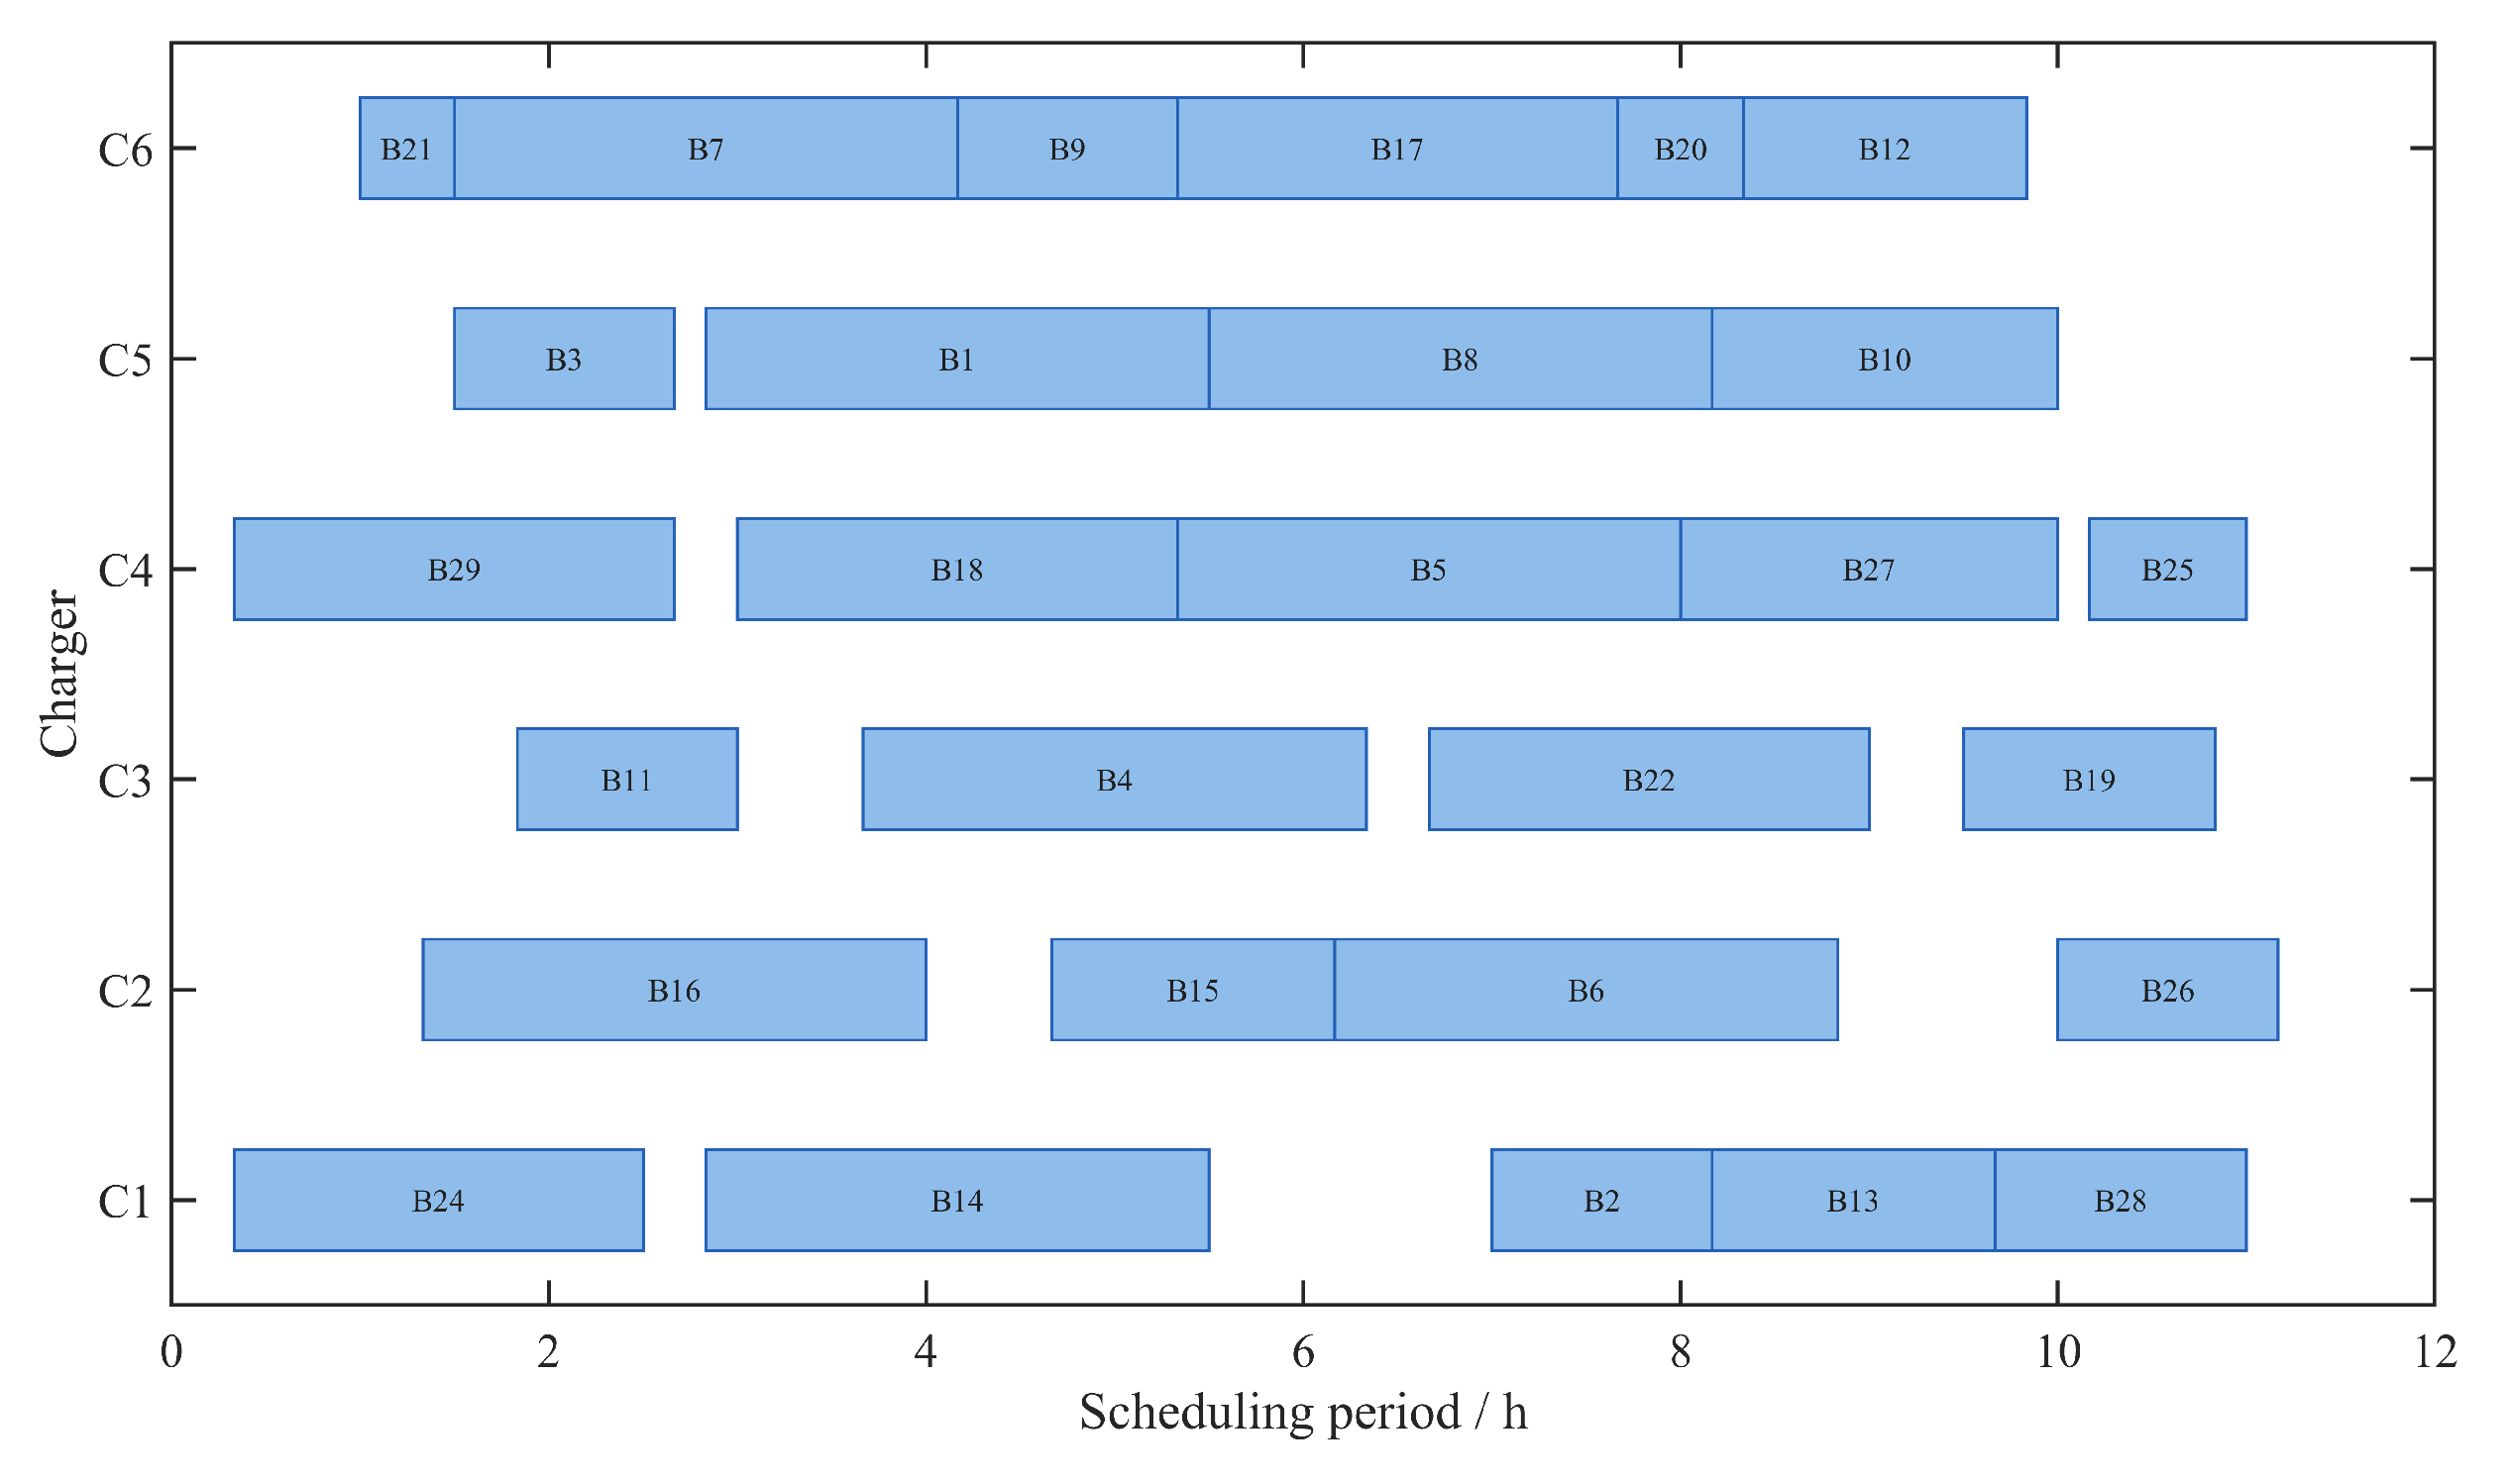
Figure 6 depicts the vehicle–charger scheduling arrangement associated with the selected compromise solution. The charging tasks of all vehicles are arranged within the available nighttime charging windows and are assigned to different chargers and time periods by considering charging demand, departure deadlines, and charger occupancy. The charging tasks on the same charger are connected in chronological order, with no overlapping charging tasks, showing that the schedule is consistent with the charger exclusivity requirement.
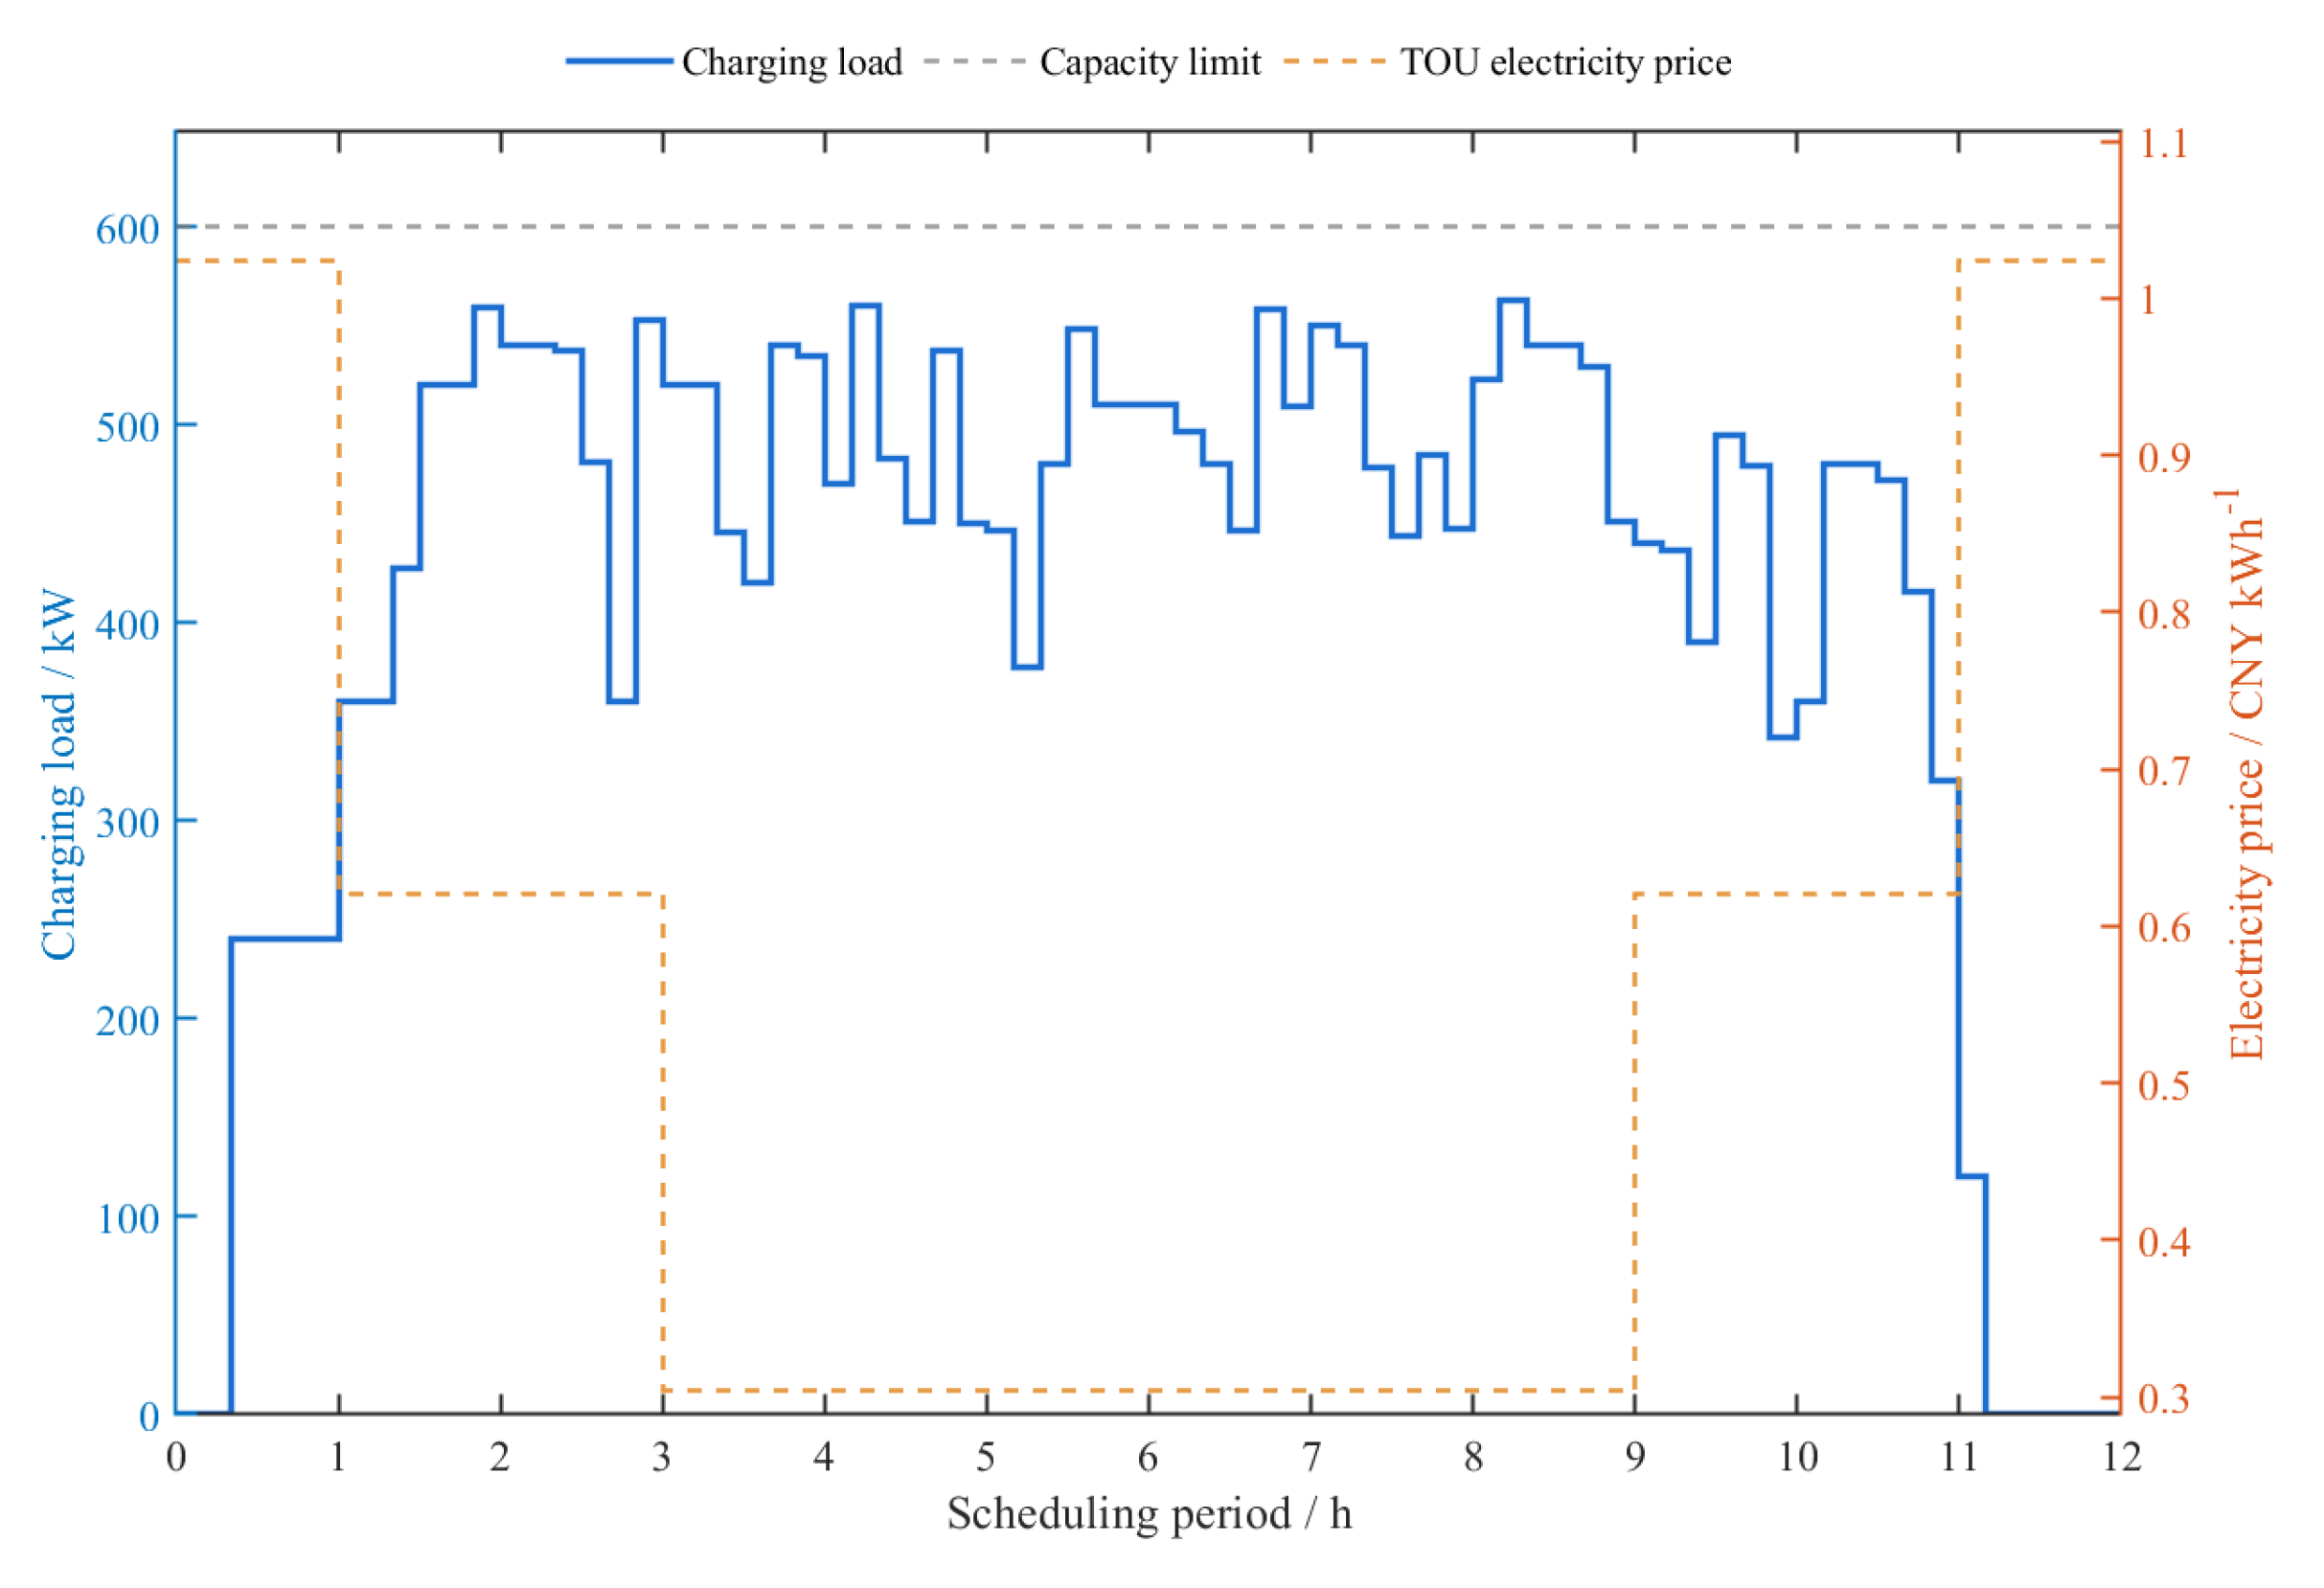
Figure 7 illustrates the relationship between the depot charging load and the time-of-use electricity price over the scheduling horizon. Throughout the scheduling horizon, the depot charging load is restricted by the capacity constraint and does not exceed the upper limit of 600 kW. Low-price periods still carry the main charging tasks, while the load peak remains below the capacity limit. Some periods still maintain relatively high loads, mainly because vehicle departure deadlines, minimum departure SOC requirements, desired SOC guidance, and the number of chargers jointly restrict the transferable space of charging tasks.
4.3. Algorithm Comparison
To evaluate whether the proposed problem-specific mechanisms improve the search performance of the basic SPEA2 framework, SPEA2 and DCS-SPEA2 are compared under the same parameter settings and computational budget.
Table 5 summarizes the statistical comparison between SPEA2 and DCS-SPEA2 over 30 independent runs. Since the true Pareto front is usually difficult to obtain directly, this study adopts an approximate reference front. Specifically, the final nondominated solution sets obtained by all compared algorithms across all independent runs are first merged, and the overall nondominated solution set is then extracted from the merged set as the reference front for inverted generational distance (IGD) calculation. Note that HV and IGD are computed using the same metric definitions in both the algorithm-comparison and ablation experiments, but the normalization bounds and approximate reference front are constructed separately from the merged nondominated solution sets within each experimental group.
Overall, DCS-SPEA2 improves solution-set quality compared with standard SPEA2. The mean HV increases from 0.5783 to 0.6620, corresponding to an improvement of approximately 14.47%, while the mean IGD decreases from 0.2505 to 0.1993, representing a reduction of approximately 20.44%. The Wilcoxon test confirms that these improvements are statistically significant, with p-values of 0.0018 and 0.0024 for HV and IGD, respectively. In contrast, the mean Spacing value of DCS-SPEA2 is slightly higher than that of SPEA2, indicating a small loss in distribution uniformity, and its average CPU time is also higher because of the additional problem-specific mechanisms. Considering that the studied task is an offline nighttime depot scheduling problem, this computational cost remains acceptable.
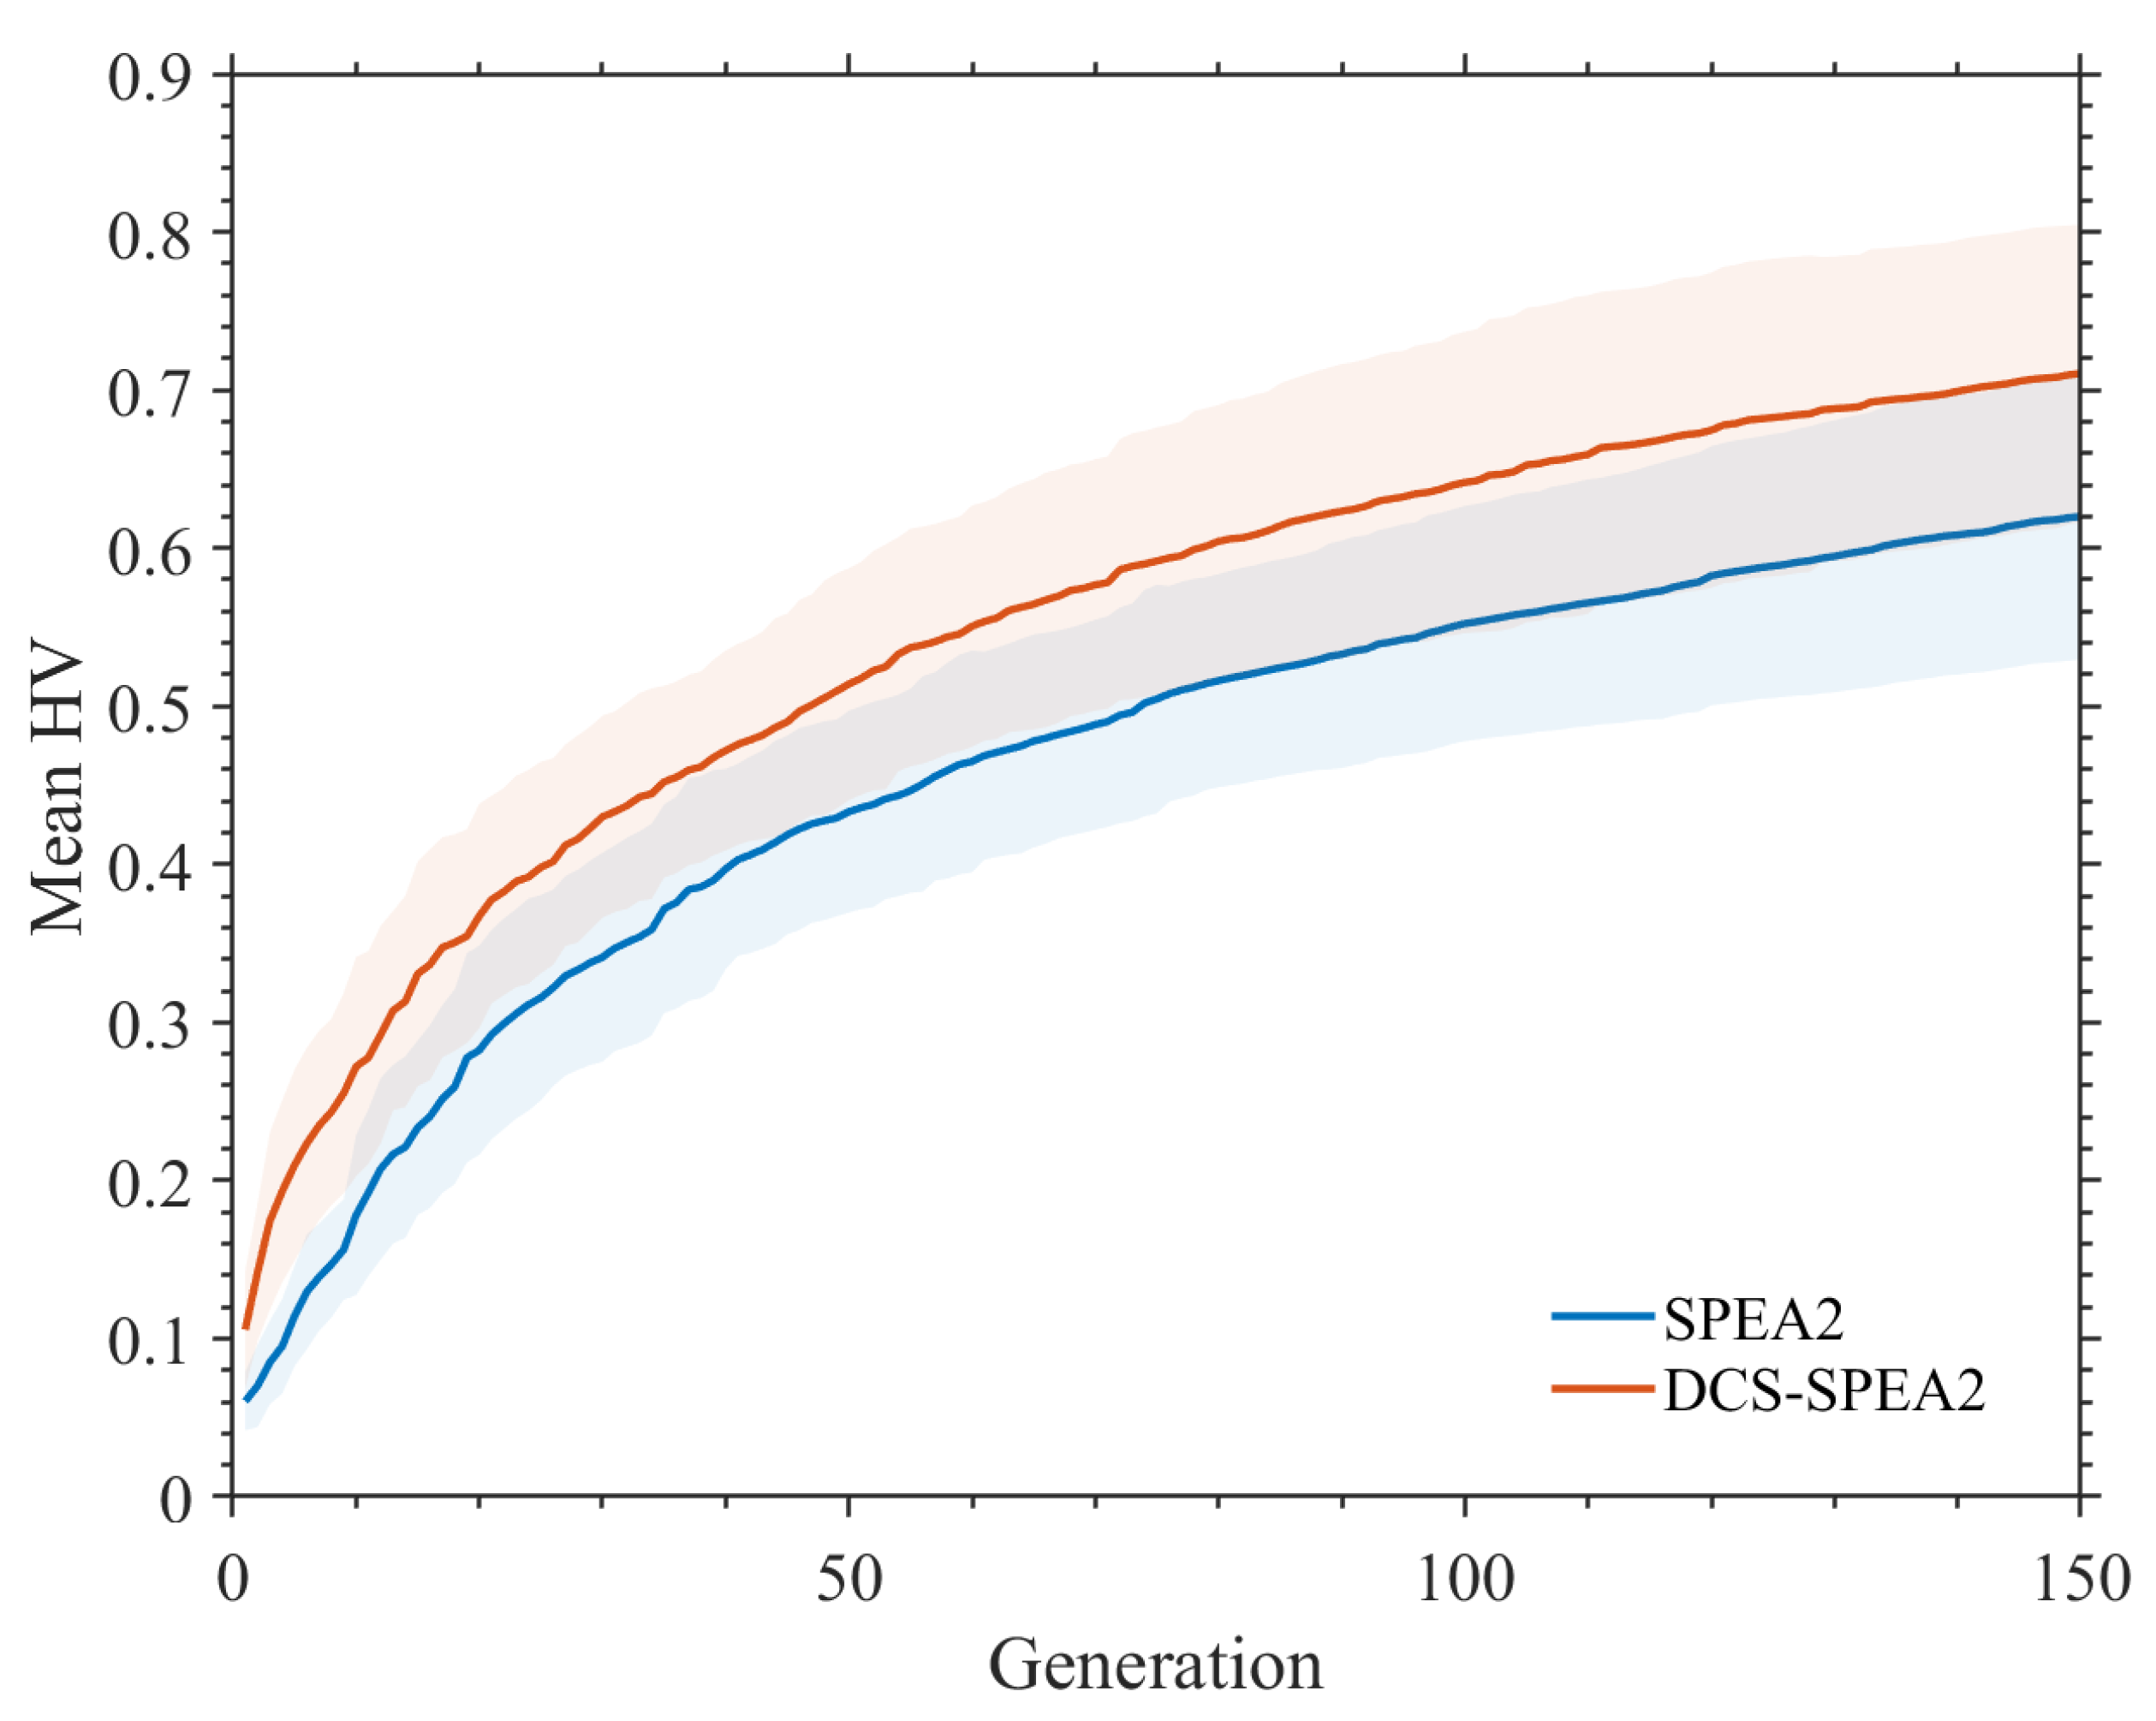
Figure 8 traces the evolution of the mean HV values of the two algorithms over successive generations. The solid lines represent the mean HV values over 30 independent runs, and the shaded regions indicate the standard deviation ranges. As the number of generations increases, the mean HV values of both algorithms continue to improve, indicating that the evolutionary search process gradually improves the quality of the nondominated solution set. Compared with the basic SPEA2, DCS-SPEA2 maintains a higher HV level in most generations and shows a faster improvement rate in the early stage of the search. In the later stage, the HV curve of DCS-SPEA2 still increases slightly, but the growth rate gradually decreases, indicating that the search process enters a relatively stable stage.
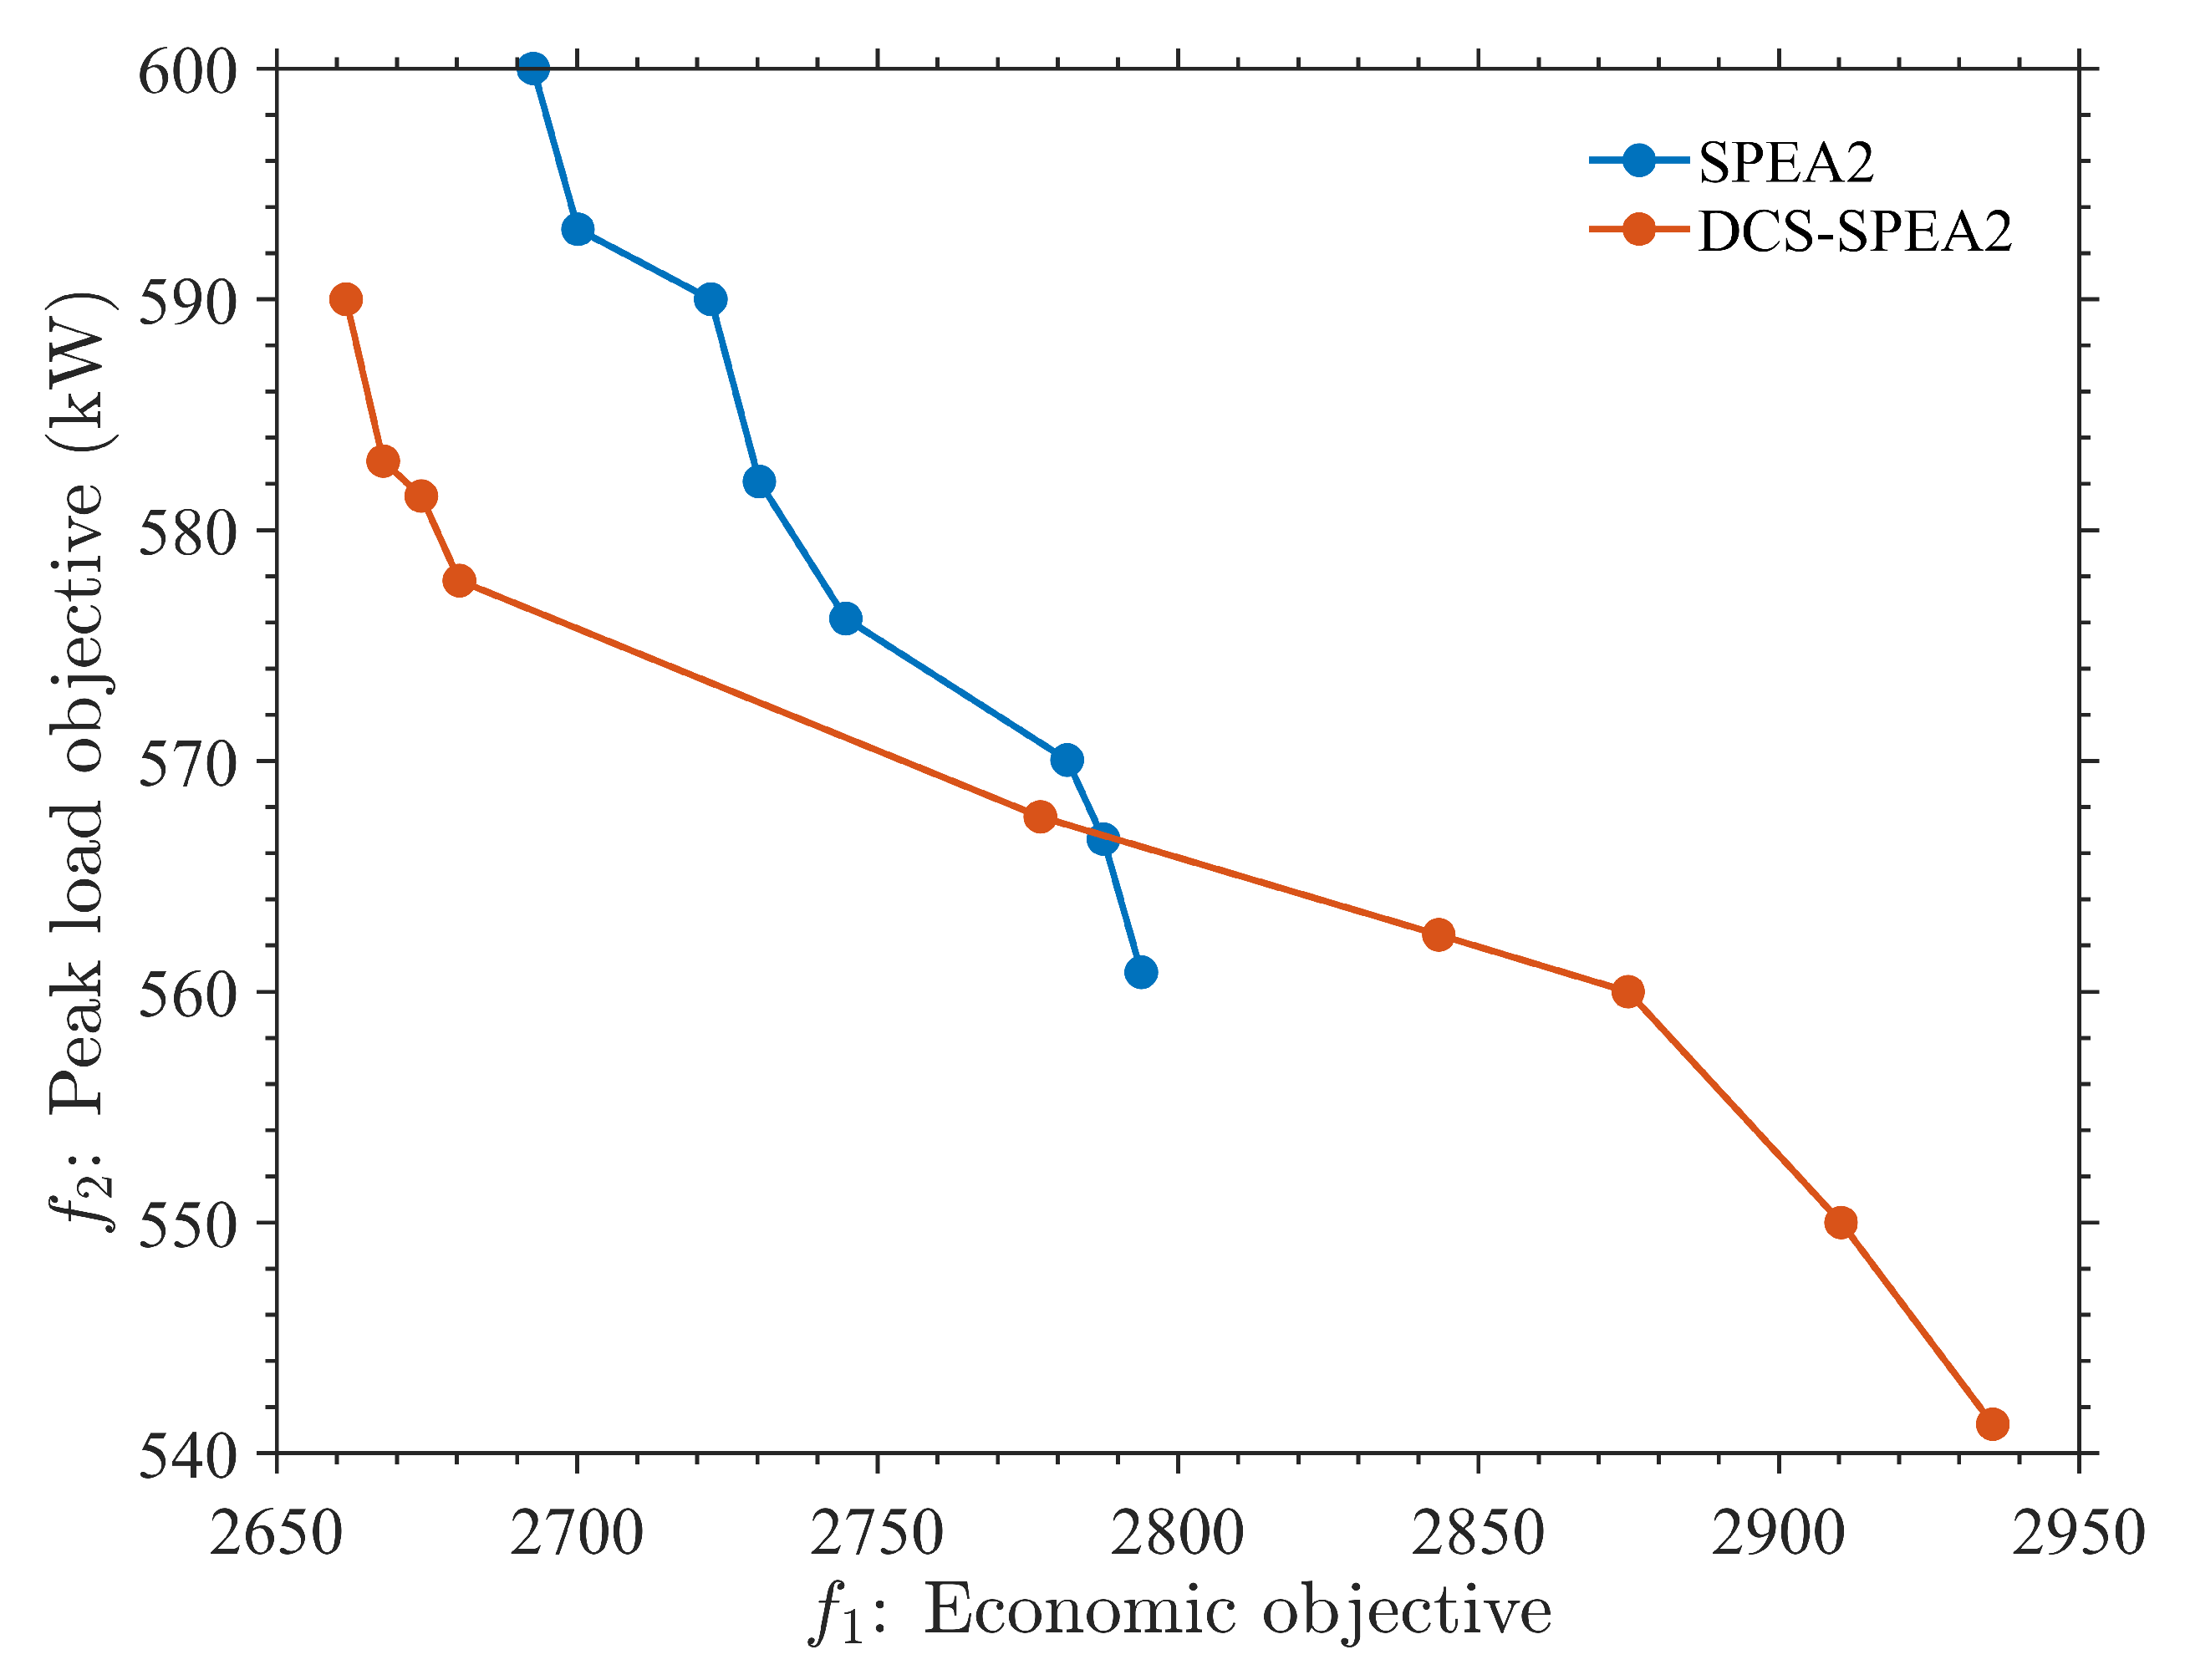
Figure 9 compares the Pareto solution sets generated by SPEA2 and DCS-SPEA2 in the paired representative run, providing a visual comparison of the distribution differences between the nondominated solution sets obtained by the two algorithms. As shown in the figure, both algorithms obtain nondominated solutions. Compared with SPEA2, the front obtained by DCS-SPEA2 covers a wider range and extends toward the region with lower depot-level peak load, especially by providing more effective compromise solutions in the low-peak-load region. This result indicates that, in this representative run, DCS-SPEA2 has stronger front coverage and better search performance in the low-peak-load region, thereby providing a richer set of compromise schemes for scheduling decisions.
4.4. Ablation Experiment
An ablation experiment is conducted with the complete DCS-SPEA2 as the baseline to identify the contribution of each improvement mechanism. Each variant removes or replaces one mechanism while retaining the remaining algorithm settings, allowing its individual effect on solution quality and search performance to be assessed. Each variant is independently run 30 times on the same main case to ensure a fair comparison.
Table 6 reports the performance of the complete DCS-SPEA2 and its ablation variants. The results show that the search enhancement mechanisms and the constructive repair mechanism have more direct effects on solution-set quality and schedule feasibility, whereas dual-candidate competition initialization and lightweight archive-based elite neighborhood search mainly provide auxiliary improvements under the current case setting.
When elite-guided crossover and adaptive mutation are removed, HV decreases to 0.5363 and IGD increases to 0.2365, indicating weaker front approximation and search stability. Although this variant can still generate nondominated solutions, its coordination between the economic objective and peak-load control is weakened. When the complete constructive repair mechanism is replaced by weak repair, performance deteriorates most sharply: HV drops to 0.1055, IGD rises to 0.5897, and the number of nondominated solutions decreases to 1.77. This indicates that repair quality is critical for maintaining feasible and structurally reasonable schedules under interacting time-window, charger, SOC, and depot-capacity constraints.
4.5. Scheduling Adaptability Analysis Under Depot Resource Constraints
A sensitivity analysis based on the main case is conducted to examine how key depot constraints affect scheduling quality and operational feasibility. The analysis considers charger availability, depot power capacity, and vehicle charging time-window pressure, thereby revealing the main resource bottlenecks under constrained operating conditions.
Table 7 summarizes the scenario settings.
Based on the above scenario settings, each scenario is independently run 10 times, and
Table 8 summarizes the scheduling outcomes under different depot-resource and time-window conditions.
4.5.1. Scheduling Results Under Different Charger Availability Levels
Under different charger configurations, the minimum departure SOC compliance rate remains 100%, indicating that the minimum departure requirement is still satisfiable with 4–7 chargers in the tested scenarios. However, charger availability strongly affects desired SOC attainment and SOC deviation. With only four chargers, the desired SOC attainment rate is 27.59% and the SOC deviation penalty reaches 990.49, reflecting severe competition for charging service. Increasing the number of chargers to six improves the desired SOC attainment rate to 50.00% and reduces the SOC deviation penalty by approximately 43.33%. Further increasing the number of chargers to seven yields only limited additional improvement, suggesting that charger quantity is no longer the dominant bottleneck under the current vehicle scale. Therefore, charger expansion should be coordinated with vehicle return patterns, departure times, depot capacity, and electricity prices rather than treated as uniformly beneficial.
4.5.2. Charging Load Control Under Limited Depot Power Capacity
The P scenarios show that the minimum departure SOC compliance rate remains 100% even when the depot capacity is reduced to 480 kW, but tight power capacity substantially limits desired SOC attainment. When the capacity is 480–500 kW, peak loads remain close to the corresponding capacity limits, while the desired SOC attainment rate remains below 31% and SOC deviation penalties exceed 820 CNY. Increasing the capacity to 550–600 kW relieves aggregate power congestion and improves charging quality, with the desired SOC attainment rate rising to 50.00%. When the capacity further increases to 650 kW, the SOC deviation penalty declines to 423.32 CNY, but the benefit of additional capacity begins to be constrained by other operational factors.
4.5.3. Scheduling Adaptability Under Compressed Vehicle Charging Time Windows
In actual operations, compressed chargeable time windows may arise when vehicles return to the depot later than planned because of traffic congestion, temporary detours, or delayed vehicle handover, or when they need to depart earlier because of next morning service adjustments, temporary dispatch reinforcement, or changes in vehicle circulation plans. To simulate such operational pressure, the S group scenarios examine how scheduling results vary when vehicle time windows are tightened, while keeping the number of chargers and the depot power capacity unchanged. In these scenarios, S0 denotes the baseline case, whereas S1 and S2 increase the proportion of disturbed vehicles and simultaneously impose delayed return and earlier departure disturbances.
The S scenarios show that time-window compression can reduce the feasible scheduling space even when infrastructure conditions remain unchanged. In S1, the minimum departure SOC requirement is still satisfied, but the desired SOC attainment rate decreases by 14.83 percentage points and the SOC deviation penalty increases by 16.79%, indicating reduced flexibility for charging toward the desired SOC. Under the more severe S2 scenario, the minimum departure SOC compliance rate drops to 93.10%, the desired SOC attainment rate decreases to 30.69%, and the SOC deviation penalty increases by approximately 74.13%. These results indicate that concentrated late returns and earlier departures can shift the scheduling priority from desired SOC improvement to the preservation of minimum departure feasibility.
5. Discussion
The results show that nighttime centralized charging scheduling for battery electric buses is a resource-allocation problem involving multiple interacting objectives rather than a simple electricity-cost minimization task. Under simultaneous constraints on charger availability, depot power capacity, vehicle time windows, and departure SOC requirements, neither FCFS nor valley-price-priority charging can effectively coordinate the economic objective, SOC attainment, and depot-level peak-load control. By contrast, the compromise solution obtained by DCS-SPEA2 reduces both the composite economic objective and the depot-level peak load while ensuring that all vehicles satisfy the minimum departure SOC requirement. This finding is consistent with previous studies showing that time-of-use electricity pricing can improve charging economy and that coordinated scheduling can mitigate excessive depot charging peaks. The present study further demonstrates that effective depot operation depends on the coordinated allocation of limited charging resources among vehicles with heterogeneous time windows and energy demands, so that economic performance, departure energy assurance, and load control can be balanced within the feasible scheduling space.
The Pareto front, vehicle charging Gantt chart, and depot load curve in the main case further reveal the relationship between the two optimization objectives. A clear scheduling trade-off exists between economic performance and peak load control. This trade-off is not determined solely by electricity prices but is jointly constrained by vehicle arrival and departure times, minimum departure SOC requirements, and charger exclusivity relationships. Compared with modeling methods that approximate charging power as a constant input, the staged charging model and interval-overlap-based load calculation method adopted in this study explicitly link SOC evolution with load contribution in each time period. Thus, depot load calculation depends not only on vehicle charging duration or charged energy but also on the charging stage of each vehicle within each time window. Therefore, the formation process of depot-level peak load under different scheduling sequences can be characterized more specifically.
The algorithm comparison and ablation experiments show that problem-driven search design is important for maintaining solution quality and feasibility in constrained depot charging scheduling. Compared with standard SPEA2, DCS-SPEA2 achieves better HV and IGD performance, while the ablation results indicate that search enhancement mechanisms and constructive repair contribute more directly to the observed improvement. This suggests that, for electric bus charging scheduling, the effectiveness of a metaheuristic framework depends not only on Pareto-based selection but also on whether its search and repair operators reflect the structural coupling among charging duration, charger assignment, SOC feasibility, and depot capacity.
The sensitivity analysis of depot resources and vehicle time windows further reveals that different constraints create distinct scheduling bottlenecks. Charger availability mainly determines parallel service capability and therefore directly affects desired SOC attainment, whereas depot power capacity limits the aggregate charging intensity and is more closely associated with power congestion and peak load. By contrast, delayed vehicle returns and earlier departures reduce the available scheduling slack and may compromise minimum departure SOC compliance under severe disturbances. These findings indicate that charger availability, depot power capacity, and time-window stability influence different dimensions of scheduling performance and should not be treated as interchangeable indicators of resource adequacy. Accordingly, infrastructure configuration and charging scheduling should be coordinated to jointly account for depot resource limits, vehicle operational stability, and charging demand.
6. Conclusions
This study addresses the nighttime centralized charging scheduling problem for battery electric buses under limited depot resources. A multi-objective optimization model is developed by integrating staged charging characteristics, interval-overlap-based load calculation, minimum departure SOC constraints, charger exclusivity, and depot capacity limits, and a problem-driven DCS-SPEA2 algorithm is designed to solve the resulting discrete scheduling problem. In the main case with 29 battery electric buses and 6 chargers, the compromise solution obtained by DCS-SPEA2 achieves a 100% minimum departure SOC compliance rate, reduces the depot-level peak load to 562.74 kW, and decreases the composite economic objective by 17.97% and 16.30% compared with FCFS charging and valley-price-priority charging, respectively. These results indicate that coordinated charging scheduling can improve both economic performance and depot-level load control without sacrificing basic departure energy feasibility.
The algorithm comparison and ablation experiment indicate that the performance gains of DCS-SPEA2 are mainly associated with its problem-specific search enhancement and constructive repair mechanisms. Compared with standard SPEA2, DCS-SPEA2 increases the mean HV from 0.5783 to 0.6620 and reduces the mean IGD from 0.2505 to 0.1993, corresponding to improvements of approximately 14.47% and 20.44%, respectively. These improvements are obtained at the cost of a higher average CPU time, which increases from 60.84 s to 144.12 s, but the added computational burden remains acceptable for offline nighttime depot scheduling. The ablation results further show that removing the search enhancement mechanisms weakens front approximation, while replacing constructive repair with weak repair causes the most severe deterioration, with HV falling to 0.1055 and IGD increasing to 0.5897. The sensitivity analysis further shows that charger availability, depot power capacity, and vehicle time-window stability correspond to different scheduling bottlenecks, affecting desired SOC attainment, aggregate charging intensity, and minimum departure SOC compliance, respectively. For example, increasing the number of chargers from four to six raises the desired SOC attainment rate from 27.59% to 50.00%, while reducing the SOC deviation penalty by approximately 43.33%, increasing depot capacity from 480 kW to 650 kW lowers the SOC deviation penalty from 821.62 CNY to 423.32 CNY, and the severe time-window-compression scenario becomes infeasible for some vehicles under the original resource setting, with the minimum departure SOC compliance rate decreasing to 93.10%. These findings suggest that charger deployment, depot power capacity planning, and vehicle schedule stability should be jointly considered in depot-level charging management rather than optimized separately.
This study has several limitations. First, DCS-SPEA2 is a metaheuristic method, and the obtained Pareto charging schedules should therefore be regarded as approximate nondominated solutions rather than globally optimal solutions. Since no exact-solver benchmark is provided, the optimality gap to the true global Pareto front cannot be quantified at this stage. Second, the case study is based on a single-depot offline scheduling scenario with a limited fleet size, and further validation is still needed for larger-scale bus fleets. Third, electricity prices, vehicle operation disturbances, and battery state evolution are treated in a deterministic manner. Future research may extend the framework by incorporating exact-solver benchmarking for small instances and conducting broader comparisons with other multi-objective algorithms and larger-scale depot cases.