Article

Institutional Lag and Maturity in Circular Economy Transition: A Comparative Analysis of China and Russia in the Context of SDG 12


by
Maria V. Tereshina
1,
Nataliya V. Yakovenko
2,*,
Elena A. Yakovleva
3,
Evgeniya V. Atamas
1,
Tatiana S. Obraskova
1,
Natalia A. Azarova
3 and
David E. Saenko
3
1
Department of Public Policy and Public Administration, Kuban State University, 149 Stavropolskaya St., 350040 Krasnodar, Russia
2
Research Institute of Innovative Technologies and the Forestry Complex, Voronezh State University of Forestry and Technologies Named After G.F. Morozov, 8 Timiryazev Str., 394087 Voronezh, Russia
3
Department of World and National Economics, Voronezh State University of Forestry and Technologies Named After G.F. Morozov, 8 Timiryazev Str., 394087 Voronezh, Russia
*
Author to whom correspondence should be addressed.
Sustainability 2026, 18(15), 7908; https://doi.org/10.3390/su18157908
Submission received: 3 July 2026 / Revised: 24 July 2026 / Accepted: 31 July 2026 / Published: 4 August 2026

Abstract

The transition to a circular economy (CE) is central to achieving SDG 12, yet institutional transformation varies significantly across countries. This study conducts a comparative institutional analysis of CE transitions in China and Russia to quantify Russia’s institutional lag and assess the maturity of both systems in the context of SDG indicator 12.5.1 (Circular Material Use Rate—CMUR). Drawing on neo-institutional theory, multi-level governance, and institutional trap theory, we develop an original methodology that computes institutional lag through three key milestones, an integrated maturity index across eight institutional components, and CMUR estimates based on official statistics, legislative acts (1998–2025), and industry reports. Our results show that Russia’s average institutional lag relative to China is 15.3 years: Russia’s 2024 municipal solid waste recycling rate (13.9%) matched China’s 2009–2010 level, while China achieved Russia’s 25% target for 2030 in 2018. The integrated maturity index is 8.25 for China versus 5.25 for Russia, with the largest gaps in industrial symbiosis, R&D and human capital, and international integration. Russia’s CMUR stands at 5–7%, compared to 25–30% in China. We also demonstrate that Russia’s high recycling growth is driven by a low-base effect and is not evidence of institutional efficiency; the compound annual growth rate (CAGR) of Russian recycling volume (33.0%) significantly exceeds China’s (13.1%), but this reflects the much lower starting point rather than systemic maturity. We conclude that without systemic institutional reforms—including eco-industrial parks, green finance, and competence centres—Russia will remain at an early CE stage, failing to substantially contribute to SDG 12 by 2030.

1. Introduction

The global environmental crisis, manifested in resource depletion, waste accumulation, and ecosystem degradation, has unequivocally exposed the inadequacy of the linear economic model based on the "take–make–dispose" principle [1]. The concept of the circular economy has been extensively theorized as a response to the limitations of the linear model [2]. Recent scholarship has emphasized that CE transitions are not merely technological but require fundamental institutional change. In response, the circular economy (CE) paradigm has emerged, built on three core principles: closing material loops, minimizing environmental impact, and fostering cross-sectoral beneficial linkages. The CE is increasingly recognized as a systemic mechanism for achieving the United Nations’ Sustainable Development Goals (SDGs), particularly SDG 12 ("Responsible Consumption and Production"), and its associated targets—12.2 (sustainable management and efficient use of natural resources), 12.4 (environmentally sound management of chemicals and wastes throughout their lifecycle), and 12.5 (substantially reducing waste generation through prevention, reduction, recycling, and reuse) [3,4]. The Circular Material Use Rate (CMUR) serves as the direct indicator for target 12.5.1, measuring the share of recycled materials in overall material consumption [5].
Despite the global recognition of the CE as a strategic priority, the effectiveness of national transitions to circular practices exhibits significant variation, largely determined by the depth of institutional transformations. Formal norms (legislation, standards) and informal constraints (cultural traditions, behavioural patterns) crucially shape how rapidly and effectively a country can shift from a linear to a circular model [6,7]. Recent scholarship has thus shifted focus from technological aspects towards analyzing institutional trajectories, coordination mechanisms, and the capacity of national systems to overcome institutional traps that perpetuate resource-intensive practices [8,9].
For such analysis, the comparison of China and Russia is particularly instructive. Both are major economies with significant territorial and economic diversity, yet their institutional models of CE transition exhibit fundamental differences. China, which began systemic transformation in the early 2000s, has implemented a centralized coordination model with rigid vertical planning (five-year plans, coercive isomorphism) and actively integrates CE principles into industrial, innovation, and climate policy [10,11,12]. Russia, by contrast, commenced the formation of a coherent CE policy only in the late 2010s, combining state regulation with market mechanisms and facing coordination deficits between federal and regional levels [13,14].
The current state of research reveals several important contributions that serve as a foundation for this study. Yang Yuyuan (2025), in a comparative analysis over 2015–2023, identified fundamental differences in institutional drivers: China demonstrates a centralized approach (government participation coefficient 0.74), whereas the Russian model is characterized by sectoral fragmentation (coherence index 0.42) [15]. Industrial waste recycling efficiency reached 67.8% in China (annual growth 5.3%) versus 46.2% in Russia (growth 2.1%), with convergent trends identified in industrial symbiosis technologies (complementarity index 0.68) [15]. G.V. Viphanova et al. (2025), in a comparative legal study of national waste policies and legislation in Russia and China, examined the features and priority areas of national policy implemented in both countries, analyzing strategic planning documents and the legislative framework for regulating waste management [16]. This work demonstrated common trends and positive experiences of mutual borrowing of legal mechanisms aimed at achieving national goals of environmental well-being [16]. However, Yang’s analysis remains largely qualitative, focusing on aggregate indicators without offering a reproducible metric for institutional comparison, while Viphanova’s study is confined to legal frameworks and does not quantify institutional maturity or its link to the CMUR.
Several studies have examined institutional barriers to CE transition in Russia. Erznkyan and Fontana (2023) identified key obstacles, including fragmentation of economic actors, lack of business incentives, technology deficits, and institutional barriers [17]. Kalchenko et al. (2022) noted that formal institutional frameworks in Russia are in the active formation stage, yet their effectiveness remains low due to coordination deficits between government levels [18]. Research on Russian MSW management reveals systemic paradoxes: despite ambitious targets for secondary resource extraction, secondary resources cannot compete with primary ones without mandatory requirements and subsidies [19,20]. Consumer behaviour studies show that the main barriers to sustainable consumption in Russia are the lack of appropriate infrastructure and lack of knowledge [21].
China’s CE policy framework has been extensively documented. The Circular Economy Promotion Law (2008) established the legal foundation [22], while the 14th Five-Year Plan for Circular Economy Development (2021–2025) set ambitious targets, including the establishment of a resource recycling system covering the entire society by 2025 [23]. The NDRC reported that by 2020, major resource productivity increased by about 26% compared to 2015, and comprehensive utilization of crop straw reached over 86% [24]. China has developed over 200 national-level eco-industrial parks, demonstrating systematic industrial symbiosis [25,26]. Comparative studies of CE transitions in BRICS countries show that China stands out as the most advanced among BRICS nations in waste recycling, while other countries face coordination deficits and regulatory fragmentation [27,28]. The EU Circular Economy Platform (2023) noted that China invested in creating hundreds of eco-industrial parks and national competence centres, whereas in Russia, such structures remain embryonic [29].
Methodological approaches to measuring CE maturity vary considerably. Żurawski et al. (2021) presented a model for assessing organizational circular maturity [30]; the OECD developed a system of circular economy governance indicators covering 12 key dimensions [31]; and the European Commission (2018) established the CMUR methodology as a key SDG 12.5.1 indicator [5]. However, most existing models focus on the micro level (individual enterprises) and are not adapted for cross-country comparisons of institutional maturity. Furthermore, existing studies either focus on the technological aspects of the CE or on general principles of sustainable development, without establishing a direct connection between institutional conditions and the achievement of SDG indicator 12.5.1 [32,33].
The identified research gaps determine the relevance of this study: (1) there is a significant gap between general discussions of CE barriers and specific empirical examples of how these barriers impede SDG 12 achievement; (2) comparative studies of CE transitions are unbalanced—European cases dominate, while comparative analysis of non-European models, particularly Russia and China, remain underrepresented; (3) existing works analyze CE transition in isolation at either macro, meso, or micro levels, preventing comprehensive understanding of institutional interconnections; (4) there is no operationalized toolkit for quantitative comparison of institutional maturity in the CE context adapted for reproducible cross-country comparisons; and (5) research insufficiently integrates institutional analysis with the SDG 12 agenda, failing to establish a direct link between institutional conditions and achievement of target indicator 12.5.1 (CMUR) [34,35].
To address these gaps, this study develops an original methodology that computes institutional lag through three key milestones, an integrated maturity index across eight institutional components (regulatory framework, financial instruments, digital infrastructure, R&D and human capital, industrial symbiosis, regional MSW operators, standards and EPR, international integration) [36], and CMUR estimates based on official statistics, legislative acts (1998–2025), and industry reports [37,38]. The principal findings indicate that Russia’s average institutional lag relative to China is 15.3 years; Russia’s integrated maturity index (5.25) significantly trails behind China’s (8.25); and the CMUR gap reaches 20–25 percentage points. High recycling growth rates in Russia are driven by a low-base effect rather than institutional efficiency [39]. Recent studies on specific sectors, such as composite finishing materials [40] and corporate sustainability reporting [41], further illustrate the challenges and opportunities in implementing circular principles across different industries. These results contribute to SDG 12 by providing a replicable monitoring toolkit for CE transitions and informing policy adjustments to accelerate progress towards targets 12.2, 12.4, and 12.5 in both countries [42,43,44,45]. While previous studies have identified institutional barriers to CE transitions [17,18] and documented China’s policy framework [22,23], a quantitative comparative analysis of institutional maturity between non-European cases remains absent from the literature. This study addresses this gap by developing original metrics that allow direct cross-country comparison.
Research aim and objectives
The aim of this study is to quantify the magnitude and structure of Russia’s institutional lag relative to China in the transition to a circular economy, and to measure the integrated institutional maturity of both countries in the context of their contribution to SDG 12.
To achieve this aim, the following objectives are set:
  • To develop an original methodology for quantitative assessment of institutional lag and integrated maturity in CE transitions.
  • To compare the dynamics of municipal solid waste (MSW) recycling/utilization rates in China and Russia over the period 2018–2030.
  • To calculate the required compound annual growth rates (CAGRs) for key Russian CE indicators.
  • To determine the capacity deficit for MSW utilization in Russia and the required investment volume.
  • To compute the integrated institutional maturity index across eight components for both countries.
  • To establish the gap in the Circular Material Use Rate (CMUR) as a direct indicator of SDG 12.5.1.
  • To formulate concrete recommendations for overcoming the institutional lag and accelerating the circular economy transition in Russia.
Research hypotheses
Based on theoretical analysis and empirical premises, the following hypotheses are tested in this study:
H1. 
Russia’s institutional system for CE transition exhibits a persistent temporal lag relative to China, estimated at approximately 15 years, which can be quantitatively measured through comparison of key institutional milestones (adoption of conceptual documents, framework laws, commencement of cyclic planning).
H2a. 
China’s integrated institutional maturity index significantly exceeds Russia’s, with the largest gap observed in components requiring long-term capital accumulation and inter-ministerial coordination (industrial symbiosis, R&D and human capital, financial instruments, international integration), whereas the gap is less pronounced in formal-normative components.
H2b. 
Russia’s high relative growth rates in waste recycling are explained by the "low-base effect" rather than institutional effectiveness. Moreover, the current institutional configuration creates a "sorting trap" where extensive growth (increasing sorting capacity) does not translate into intensive growth (deep recycling and closing material loops) due to lack of business incentives, technology deficits, and coordination failures. This explains why even achieving the 2030 targets, Russia will remain at the initial stage of circular transition by the CMUR.
Scientific novelty
In contrast to existing studies, this research contributes the following elements of novelty:
  • Operationalization of the “institutional lag” concept for CE transitions. Existing approaches to measuring institutional lag have been predominantly qualitative or reliant on single indicators. This study proposes a quantitative metric based on three comparable institutional milestones (Formula (2)), enabling reproducible cross-country comparisons and providing a standardized tool for assessing temporal gaps in institutional development across different national contexts.
  • An original integrated institutional maturity index comprising eight components assessed on a 10-point scale. Unlike micro-level circular maturity models or general OECD indicators, this index is specifically adapted for cross-country comparisons and incorporates CE-specific components, including industrial symbiosis and regional MSW operators, thereby capturing the multidimensional nature of institutional readiness for circular transition.
  • Empirical measurement of the SDG 12.5.1 gap between Russia and China. While previous comparative studies have focused on qualitative analysis of legislation or individual sectoral indicators, this study conducts a direct calculation and forecast of the Circular Material Use Rate (CMUR) for Russia, quantifying the 20–25 percentage-point gap from China and providing a robust empirical basis for policy evaluation.
  • Identification of structural heterogeneity in the institutional gap. In contrast to studies that characterize Russia’s lag as uniform, this research demonstrates that the gap is minimal in formal-normative components (regulatory framework, operators) and maximal in components requiring long-term capital accumulation and inter-ministerial coordination (industrial symbiosis, R&D, finance). This differentiated analysis provides a practical focus for targeted policy interventions.
  • Quantitative refutation of the “fast catching-up” illusion. By comparing the compound annual growth rates (CAGRs) and absolute changes in recycling volumes (Section 3.4), this study demonstrates that Russia’s high growth rates are entirely explained by the “low-base effect” rather than institutional efficiency. Russia’s CAGR of 33.0% for recycling volume (2018–2023) compares with China’s 13.1% for recycling share over the same period, but this difference reflects the much lower starting point rather than more effective institutional transformation. This finding has direct implications for adjusting national targets and reframes the narrative of rapid progress as a statistical artefact rather than evidence of successful institutional transformation.
Contribution to SDG 12
This study directly contributes to monitoring and achieving SDG 12 via the following:
  • Providing a replicable methodology for assessing the CMUR (indicator 12.5.1) that can be applied across countries.
  • Quantifying the gap in circular material use between Russia and China, thereby highlighting policy priorities for improving resource efficiency (target 12.2).
  • Analyzing institutional conditions for environmentally sound waste management (target 12.4) and identifying specific institutional deficits that need to be addressed.
  • Offering evidence-based recommendations for policy adjustment to accelerate progress towards SDG 12 targets in both countries [46,47].

2. Materials and Methods

2.1. General Methodological Framework

This study is based on a synthesis of three theoretical approaches: neo-institutional theory, multi-level governance theory, and the concept of institutional traps. This combined framework allows us to treat the transition to a circular economy (CE) not merely as a technological modernization, but as a systemic transformation of formal and informal institutions that govern resource flows at the macro-, meso-, and micro levels. This theoretical synthesis is particularly suitable for analyzing cross-country differences in CE transitions, as it captures both the structural constraints imposed by existing institutional configurations and the potential for policy-driven institutional change.

2.2. Empirical Basis

The empirical basis of this study comprises four complementary categories of sources, ensuring triangulation and robustness of the findings.
First, the analysis draws on legislative and regulatory documents from both countries, covering strategic planning frameworks, sectoral laws, and government decrees that define institutional conditions for circular economy development over the period from the late 1990s to the present.
Second, the study employs official statistical data from national agencies, providing time-series information on waste generation, treatment, recycling rates, and material flows, which serve as the foundation for quantitative comparisons of circular performance.
Third, the empirical foundation includes industry analytics and international reports from specialized research organizations and international bodies, offering comparative perspectives, benchmarking data, and assessments of institutional frameworks across different national contexts.
Fourth, the analysis is informed by peer-reviewed academic literature on institutional analysis of circular transitions, encompassing studies on barriers, drivers, maturity assessment, and comparative methodologies in both developed and developing economy settings.
This multi-source empirical design enables a comprehensive assessment of institutional conditions, quantitative performance indicators, and contextual factors shaping circular economy transitions in China and Russia.
Reconciliation of national definitions and data comparability. A critical issue in cross-country comparison of circular economy indicators is the harmonization of definitions. In China, the official “urban MSW recycling and utilization rate” (includes several treatment pathways: material recycling (paper, plastics, metals, glass), composting of organic waste, and energy recovery through waste-to-energy incineration. According to the Ministry of Housing and Urban-Rural Development (MOHURD), MSW sent to incineration with energy recovery is counted as “utilization” in the national statistics, even though the materials themselves are not returned to the economy as secondary raw materials. By contrast, our CMUR calculation (Formula (6), following Eurostat methodology) explicitly excludes waste used as fuel, counting only materials that are physically recycled back into the economy as secondary raw materials.
In Russia, the term “utilization” is defined under Federal Law No. 89-FZ “On Production and Consumption Waste” as the use of waste for the production of goods, energy, or for other purposes. In practice, Russian statistics distinguish between "treatment" (primarily mechanical sorting) and "utilization" (actual recovery of materials). However, as in China, some energy recovery may be included in reported utilization figures depending on the reporting practices of regional operators.
To ensure transparency, we present both the official national statistics (as reported by Rosstat, REO, and Chinese authorities) and our own CMUR estimates using the harmonized Eurostat methodology. The CMUR estimates exclude waste-to-energy and focus exclusively on material recycling. This means that the official Chinese MSW recycling/utilization rate (which includes incineration) is systematically higher than a purely material-recycling rate would be. For Russia, the gap between sorting (54.3%) and utilization (13.9%) suggests that most reported “utilization” may already be closer to material recycling, but some energy recovery may still be included.
For the comparison of MSW recycling/utilization shares presented in Section 3.1, we use the official national definitions as reported by each country’s authorities. For the CMUR comparison in Section 3.7, we use the harmonized Eurostat definition (material recycling only, excluding waste-to-energy) for both countries. This dual approach allows readers to see both the official national figures and the harmonized estimates. The 20–25 percentage-point gap in the CMUR should therefore be interpreted as a conservative estimate of the difference in material circularity; the gap in official MSW recycling/utilization rates may be even larger if incineration is more heavily counted in China than in Russia. A full harmonization of all waste flows would require access to disaggregated facility-level data, which is not publicly available for all years. We therefore treat the CMUR gap as an indicative order-of-magnitude estimate rather than a precise measurement.

2.3. Methods and Calculation Formulas

2.3.1. Comparative Institutional Analysis

A qualitative and quantitative comparison of the two national models was conducted along the following dimensions: regulatory completeness; presence of specialized development institutions; financing mechanisms; degree of centralization/decentralization; and planning horizon.

2.3.2. Compound Annual Growth Rate (CAGR)

To assess the dynamics of indicators and the required growth rates to meet target values, we used the compound annual growth rate:
C A G R = V t V 0 1 / n 1 ,
where
  • C A G R is the compound annual growth rate (%);
  • V t is the target value in the final year;
  • V 0 is the actual value in the base year;
  • n is the number of years between the base and target periods.

2.3.3. Calculation of Institutional Lag

The institutional lag L i n s t is defined as the arithmetic mean of the time gaps across three comparable institutional milestones:
L i n s t = 1 3 i = 1 3 t i C N t i R U ,
where
  • L i n s t is the integrated institutional lag of Russia relative to China (years);
  • t 1 is the year of adoption of the conceptual policy document on the CE;
  • t 2 is the year of adoption of the basic framework law on the CE;
  • t 3 is the year of the start of cyclic strategic planning;
  • C N is China;
  • R U is Russia.
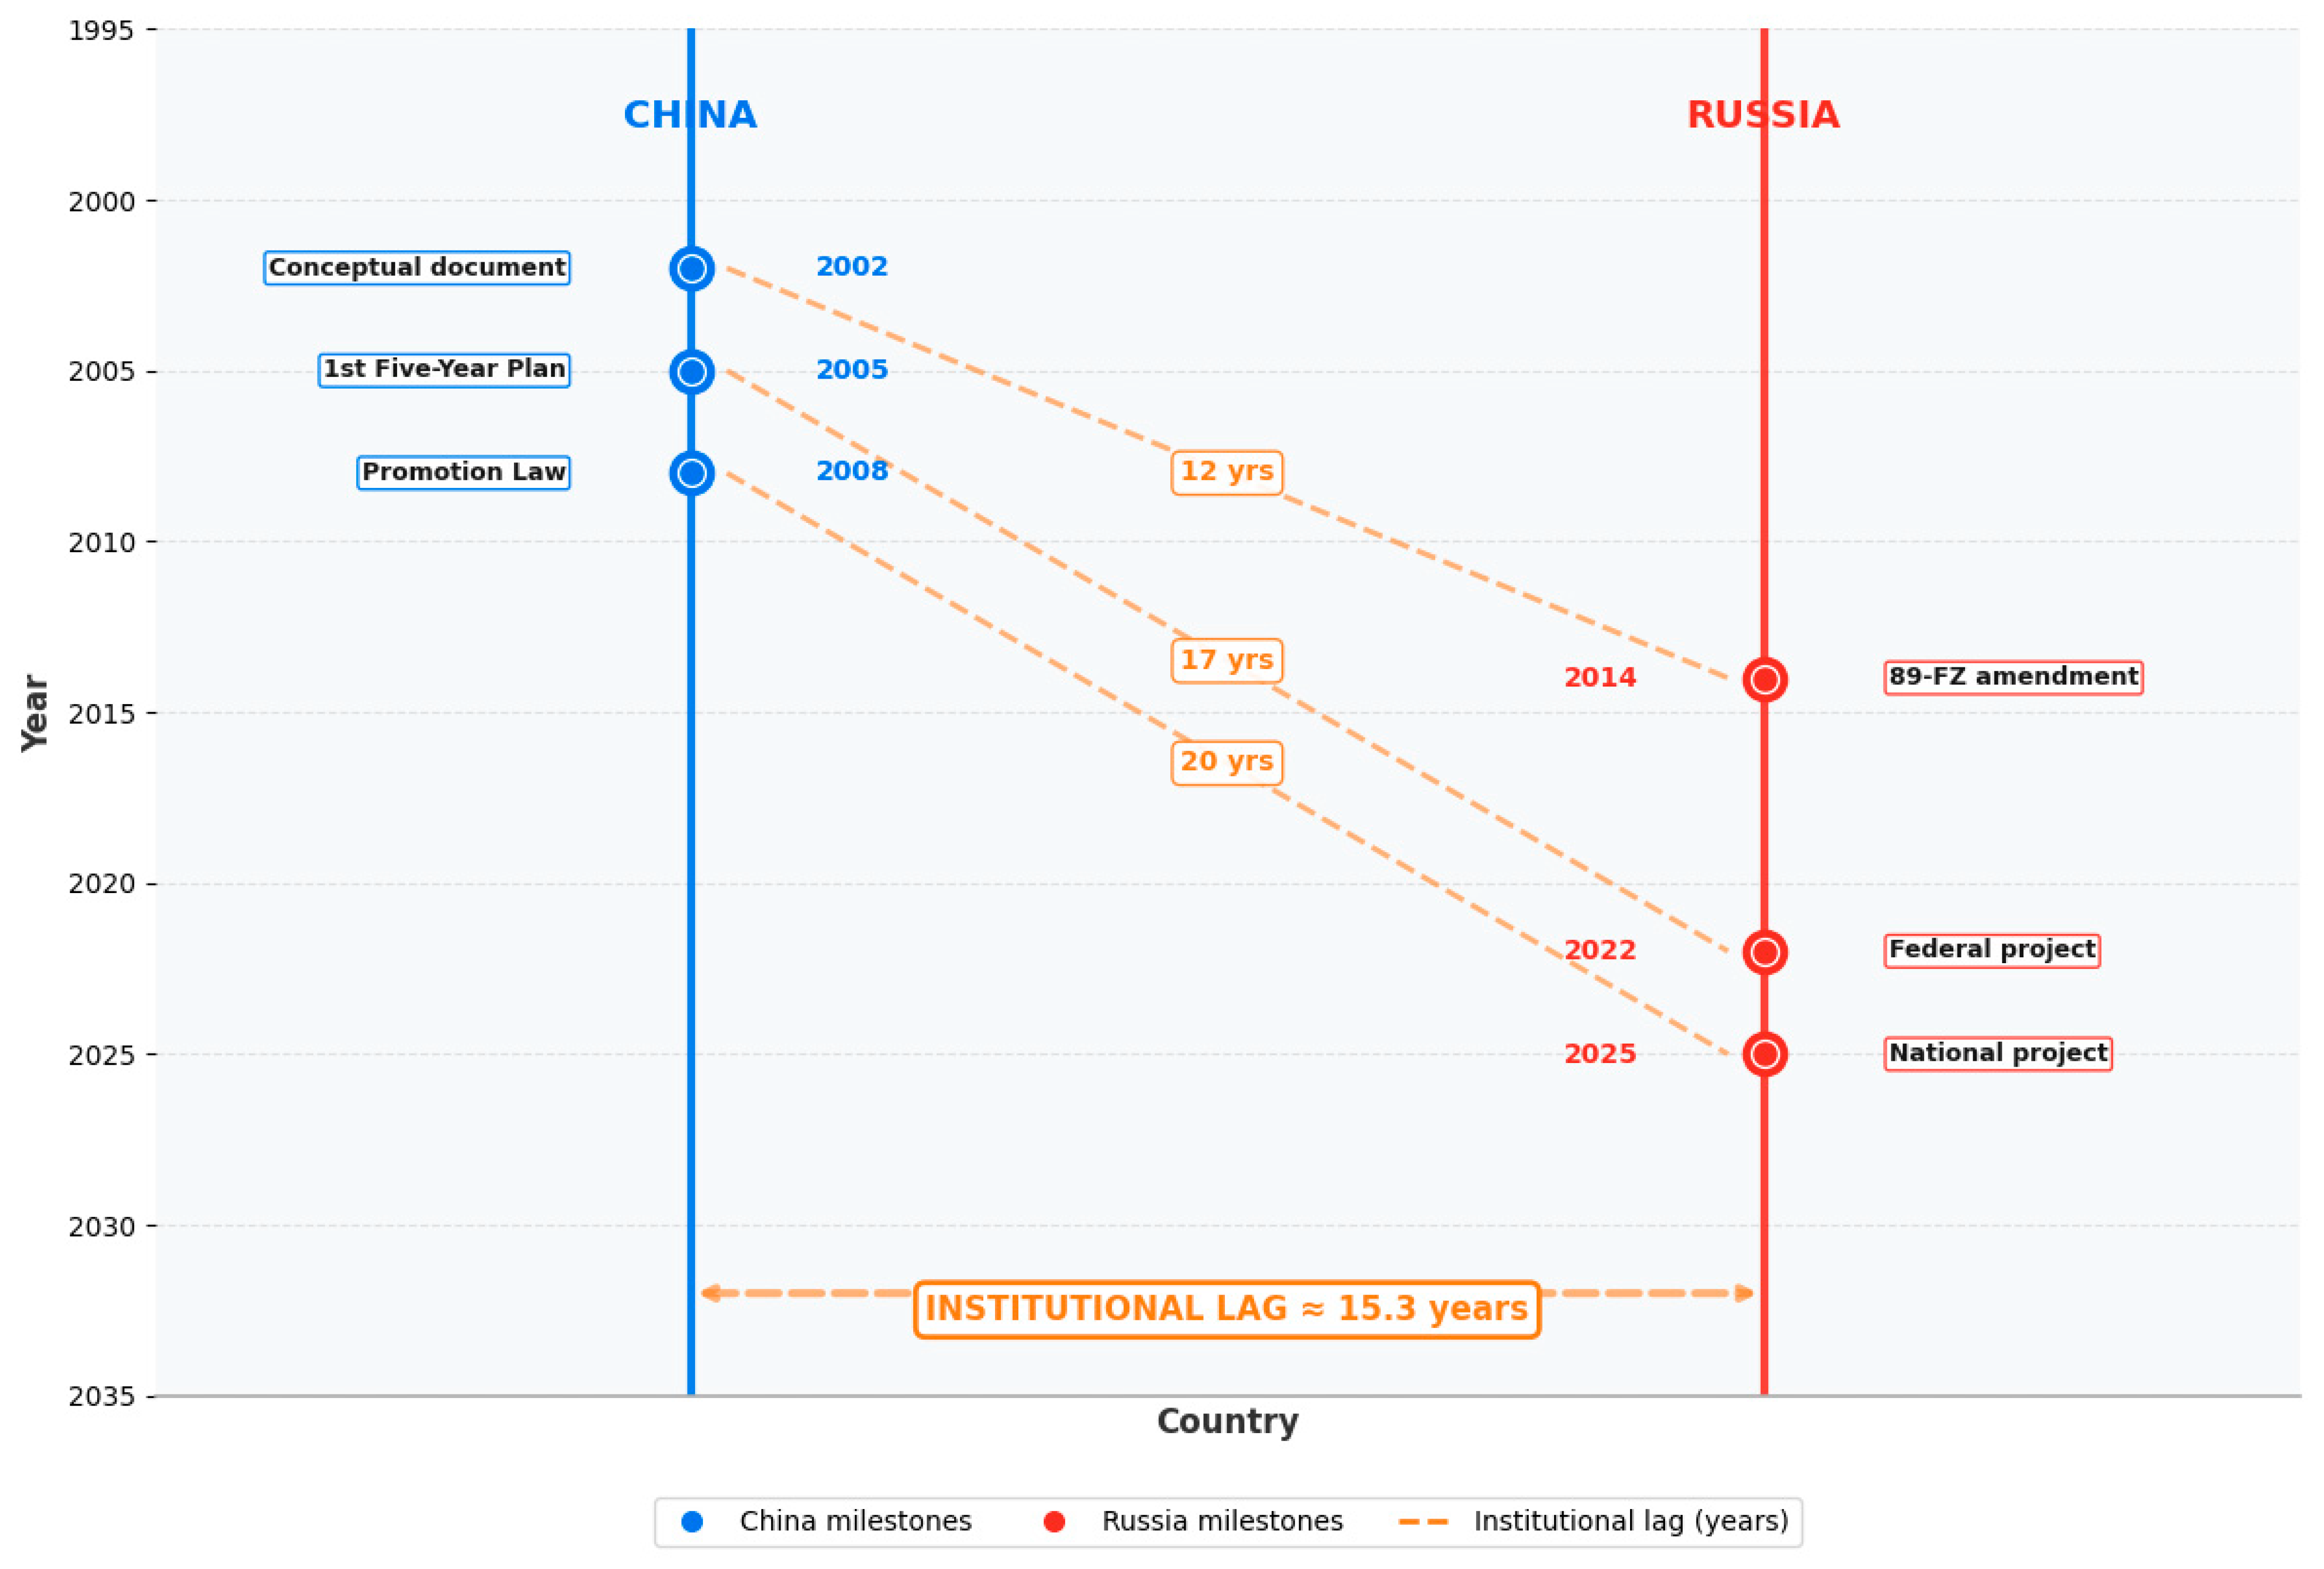
For China: t 1 = 2002 , t 2 = 2008 , t 3 = 2005 . For Russia: t 1 = 2014 , t 2 = 2022 , t 3 = 2025 .
The choice of milestones is based on document comparability and conceptual relevance. For China, 2002 marks the first explicit national-level CE policy statement; 2008 is the year of the Circular Economy Promotion Law (the first comprehensive CE framework law); and 2005 is the start of the first Five-Year Plan incorporating the CE as a dedicated section. For Russia, 2014 is the year of the amendment to Federal Law No. 89-FZ that first introduced the “circular economy” concept into Russian waste legislation (the 1998 version of the law predates the CE concept and is therefore not used); 2022 is the year of the federal project “Circular Economy” (the first dedicated federal-level CE programme); and 2025 is the start of the national project “Environmental Well-being” (the first comprehensive national project integrating the CE with broader environmental goals). The distinction between 2022 (federal project) and 2025 (national project) reflects different levels of policy integration; both are examined in the sensitivity analysis (Section 3.3).
Justification for excluding other policy instruments. Other public policy instruments that could potentially influence CE development—such as economic incentives, technical standards, regional strategies, and voluntary agreements—were not included as milestones because they (a) lack direct comparability across the two countries due to fundamental differences in governance structures and policy traditions; (b) are typically secondary or derivative instruments that follow the adoption of framework legislation and conceptual documents rather than representing independent institutional breakthroughs; and (c) are often introduced incrementally across multiple years and regions, making it difficult to assign a single year that would constitute a meaningful milestone for cross-country comparison. The three selected milestones were chosen because they represent the most clearly identifiable and directly comparable events in each country’s institutional pathway: the first conceptual policy statement, the first comprehensive framework law, and the first systematic planning instrument.

2.3.4. Capacity Deficit in Waste Utilization

The capacity deficit D c a p (million tonnes/year) is calculated as the difference between the actual volume of waste requiring utilization and the available processing capacity (REO, 2024):
D c a p = i Q i g e n C i a v a i l ,
where
  • D c a p is the capacity deficit in waste utilization (million tonnes/year);
  • Q i g e n is the volume of generation of waste of type i subject to utilization (million tonnes/year);
  • C i a v a i l is the existing utilization capacity for waste of type i (million tonnes/year);
  • i is the waste type (polymers, glass, paper, metal, etc.).

2.3.5. Integrated Assessment of Institutional Maturity (Authors’ Methodology)

To quantitatively compare the institutional systems of CE transition in China and Russia, we developed an original integrated assessment methodology based on a synthesis of neo-institutional theory, institutional isomorphism, and multi-level governance. The methodology allows the multidimensional institutional environment to be reduced to a single index suitable for direct comparison.
Step 1: Selection of components.
Institutional maturity is assessed across eight key components, each reflecting a critically important aspect of the CE transition (Table 1).
Justification for selecting these eight components. The selection is based on a synthesis of recommendations from leading international organizations that highlight key dimensions for a successful CE transition: regulatory framework, financial mechanisms, innovation, digital infrastructure, industrial cooperation, extended producer responsibility, and international cooperation. These eight components (a) cover all governance levels—macro (regulations, finance), meso (regional operators, industrial symbioses), and micro (digital infrastructure, R&D); (b) are identified in the literature as the most critical for CE success; and (c) have comparable empirical indicators for both countries. Thus, the proposed set combines theoretical grounding with empirical data availability.
Step 2: Scoring scale
Each component is scored on a discrete scale from 0 to 10, where
0–2: The institution is absent or embryonic (no legislation, no working mechanisms);
3–4: Initial stage of formation (isolated pilot projects, fragmented regulation);
5–6: Basic institutional framework exists, but systemic coherence and effectiveness are low (laws exist but no enforcement; operators exist but no coordination);
7–8: The institution is developed, covers most sectors, and has enforcement and incentive mechanisms;
9–10: The institution is fully formed, operates smoothly, and serves as a benchmark for other countries.
The detailed evaluation criteria used by experts to assign scores to each component are provided in Appendix A (Table A6), which maps specific empirical evidence to each score band for each of the eight components.
Step 3: Expert procedure and statistical treatment
Expert assessment was carried out by nine independent researchers (Experts 1–9), all holding a PhD or Doctor of Sciences degree in economics and having a publication record in the field of institutional analysis of the circular economy. The experts represent diverse scientific schools and organizations across Russia (Appendix A, Table A1 for full profiles). This geographical and institutional diversity ensures representativeness and reduces the risk of systematic bias.
The assessment was based on a unified package of documents (laws, strategies, statistical compilations, industry reports). Experts were not provided with the study’s hypotheses, research questions, or expected results; they were asked only to assess institutional maturity based on the evidence provided. Each expert independently assigned scores for each component for China and Russia. To minimize subjectivity, a two-round Delphi procedure was applied: after the first round, experts were provided with aggregated results (means and dispersion), after which a second round was conducted for score adjustment. The final scores (Table A2) reflect the outcomes of the second round.
Individual expert scores are presented in Appendix A (Table A2 and Table A3). The final score for each component is the median of the nine expert scores. Disagreements between experts on individual component scores did not exceed 2 points (on the 0–10 scale), indicating acceptable consistency at the component level. Kendall’s coefficient of concordance (W) was computed to assess overall agreement among the nine experts across all 16 scored objects (8 components × 2 countries). The calculation was performed using IBM SPSS Statistics version 26.0 (IBM Corp., Armonk, NY, USA) via the following procedure: Analyze → Nonparametric Tests → Related Samples → Kendall’s W, applied to the matrix of 9 experts × 16 objects. The resulting value is W = 0.85, with χ2 = 57.8, df = 15, and p < 0.001, confirming a high and statistically significant degree of expert agreement.
The high concordance and the alignment of expert scores with objective quantitative indicators (Table 2) support the validity of the results. For the integrated indices, 95% confidence intervals were calculated (see Step 5 below).
Step 4: Justification of component gaps with data sources
For the most contrasting components, Table 2 provides specific quantitative indicators that support the expert scores. The sources for these indicators (NDRC, REO, Rosstat etc.) are cited in the main text and listed in the References section.
Step 5: Calculation of the integrated index, confidence intervals, and significance testing
The integrated institutional maturity index M is computed as the arithmetic mean of the scores across the eight components:
M = 1 8 j = 1 8 S j ,
where
  • M is the integrated institutional maturity index (points from 0 to 10);
  • S j is the score for component j (points from 0 to 10);
  • j = 1 , 2 , , 8 are the eight components of institutional maturity.
Justification for the unweighted mean. The index uses an arithmetic mean (equal weights) for three reasons. First, the Delphi procedure and high expert concordance (W = 0.85) suggest that the components are collectively assessed as equally important contributors to institutional maturity; assigning differential weights would require a separate, validated weighting procedure beyond the scope of this study. Second, the eight components were deliberately selected to represent distinct but complementary dimensions of institutional readiness, and there is no well-established theoretical basis in the literature for prioritizing one over another in the context of CE transitions. Third, equal weighting enhances transparency and reproducibility, allowing other researchers to replicate or adapt the index without requiring access to the original expert weights. Future research may develop component-specific weights based on econometric analysis across a larger panel of countries.
For China (based on median scores from Table A2):
M C N = 9 + 8 + 8 + 9 + 9 + 8 + 8 + 7 8 = 66 8 = 8.25 .
For Russia (based on median scores from Table A2):
M R U = 6 + 5 + 5 + 5 + 4 + 7 + 6 + 4 8 = 42 8 = 5.25 .
Descriptive dispersion of expert scores. To illustrate the variability of the integrated indices across experts, we calculated the range and standard deviation of the individual expert integrated indices (see Appendix A, Table A2 and Table A3, last row). For Russia, the individual integrated indices are: 5.25, 5.00, 5.25, 5.38, 5.13, 5.25, 5.00, 5.38, and 5.13. These values range from 5.00 to 5.38, with a mean of 5.197 and a standard deviation of 0.139. For China, the individual integrated indices are: 8.25, 8.00, 8.25, 8.38, 8.13, 8.25, 8.00, 8.38, and 8.13, ranging from 8.00 to 8.38, with a mean of 8.197 and a standard deviation of 0.139. The narrow ranges (±0.19 points around the median) indicate that the experts were in close agreement.
Important caveat on interpretation. These ranges are presented as descriptive measures of dispersion, not as inferential confidence intervals. The two-round Delphi procedure is designed to induce convergence between experts, so the individual expert scores are not statistically independent observations. Consequently, standard confidence interval formulas would overstate the precision of the estimates. The ranges should be interpreted simply as indicators of the degree of qualitative agreement among the nine experts, not as probabilistic statements about the true underlying value.
For the statistical analysis, the sample consisted of nine experts, each providing scores on eight components for each country (n1 = 8 component scores for China; n2 = 8 component scores for Russia). The total number of observations used in the analysis is 16 component-country pairs.
Significance testing (Mann–Whitney U test). To compare the two independent samples of component scores (eight components for China and eight for Russia), we used the non-parametric Mann–Whitney U test. China’s sample (median scores): [9,8,8,9,9,8,8,7]; Russia’s sample: [6,5,5,5,4,7,6,4]. The computed sum of ranks for Russia is 36. The critical value for n 1 = n 2 = 8 , α = 0.05 is 51. Since 36 < 51, the null hypothesis of no difference is rejected. The exact p -value is 0.021. Thus, the difference in integrated institutional maturity is statistically significant.
Step 6: Interpretation and gap
An index of 8.25 (China) corresponds to the level “institutional environment fully formed, most mechanisms operate systematically”. China has minor room for improvement (mainly in international integration and digital infrastructure). An index of 5.25 (Russia) lies in the zone “basic framework exists, but systemic coherence and effectiveness are low”. Russia has relatively high scores for their regulatory framework (6) and regional MSW operators (7), but lags critically in industrial symbioses (4), R&D and human capital (5), financial instruments (5), and international integration (4). The absolute gap Δ M = 8.25 5.25 = 3.0 points (on a 10-point scale), with the relative gap about 57%. China’s institutional maturity is more than one-and-a-half times that of Russia. The correlation with the time lag (≈15 years) and the CMUR gap (20–25 p.p.) supports the validity of the methodology.

2.3.6. Calculation of the Circular Material Use Rate (CMUR)

To assess the contribution to SDG 12 (indicator 12.5.1), we calculated the Circular Material Use Rate (EC, 2018; INFRAGRIN, 2025):
C M U R = R r e c y c l e d R t o t a l × 100 % ,
where
  • C M U R is the Circular Material Use Rate (%);
  • R r e c y c l e d is the mass of secondary materials fed back into the economy (excluding waste used as fuel) (million tonnes);
  • R t o t a l is the total material consumption (primary and secondary) (million tonnes).
Forecasting the CMUR for Russia and justification of method choice. To obtain a quantitative forecast of the CMUR for 2030, we applied double exponential smoothing (Holt’s model). The choice of this method is motivated by the following reasons. First, the CMUR time series for Russia has very few observations (five points: 2018, 2020, 2022, 2024, 2025), which makes more complex models such as ARIMA infeasible as they require at least 20–30 points for reliable identification of autoregressive and moving-average orders. Second, the series exhibits a clear trend (steady growth without seasonality), which fits Holt’s model assumptions—it handles trending series well even with small datasets [48]. Third, Holt’s model provides forecast intervals, increasing transparency. The smoothing parameters were chosen in a standard manner: α = 0.3 (level smoothing) and β = 0.2 (trend smoothing), in line with recommendations for short series with moderate volatility.
Initial time series (estimates based on industry analytics): 2018—2%, 2020—3%, 2022—4%, 2024—6%, 2025—7%. The model equations:
l t = α y t + ( 1 α ) ( l t 1 + b t 1 ) , b t = β ( l t l t 1 ) + ( 1 β ) b t 1 , y ^ t + h = l t + h b t ,
where
  • l t is the level component at time t ;
  • b t is the trend component at time t ;
  • y t is the actual value at time t ;
  • α is the smoothing parameter for the level (0.3);
  • β is the smoothing parameter for the trend (0.2);
  • y ^ t + h   is the forecast for h periods ahead.
The forecast for 2030 is C M U R ^ 2030 11.2 % with a 95% confidence interval of [9%; 13%], which corroborates the qualitative assessments of the authors.

2.3.7. Elasticity of Recycling to Investment (CAPEX)

To compare investment efficiency in waste recycling, we calculated the elasticity of recycling volume V (million tonnes) with respect to accumulated capital expenditure CAPEX:
E V , C A P E X = Δ V / V 0 Δ C A P E X / C A P E X 0 ,
where
  • E V , C A P E X is the elasticity of recycling volume with respect to accumulated capital expenditure;
  • Δ V = V t V 0 is the absolute change in recycling volume (million tonnes);
  • V t is the recycling volume in the current year (million tonnes);
  • V 0 is the recycling volume in the base year (million tonnes);
  • Δ C A P E X = C A P E X t C A P E X 0 is the change in accumulated capital expenditure (billion USD);
  • C A P E X t is the capital expenditure in the current year (billion USD);
  • C A P E X 0 is the capital expenditure in the base year (billion USD).
M P I = Δ V Δ C A P E X ( million   tonnes / billion   USD ) ,
where
  • M P I is the marginal productivity of investment (million tonnes per billion USD);
  • Δ V is the absolute change in recycling volume (million tonnes);
  • Δ C A P E X is the change in accumulated capital expenditure (billion USD).
The underlying data series for V (recycling volume) and CAPEX (accumulated capital expenditure) used in Formulas (7) and (8) are provided in Appendix A, Table A5, to ensure full reproducibility.

2.4. Limitations of the Methodology

The proposed methodology has several limitations that should be considered when interpreting the results.
First, the integrated institutional maturity index relies on expert judgments, which introduces an element of subjectivity, despite formalized criteria and high expert concordance ( W = 0.85 ). Expanding the number of experts and applying multi-round Delphi procedures have partially mitigated this, but some subjective bias may remain.
Second, the index is based on a static comparison for a fixed period (2024–2025) and does not capture the dynamics of institutional changes over time. The time-lag analysis (Section 3.3) partially compensates for this, but a full trajectory analysis would require panel data covering several years.
Third, the eight-component set is not exhaustive. Additional dimensions—such as public environmental culture, civil society engagement, and judicial practice in environmental disputes—could be included. However, the selected components cover the key institutional dimensions for which comparable empirical indicators exist for both countries.
Fourth, the CMUR forecast using Holt’s model relies on a short time series (five points), which limits the accuracy of long-term projections. To enhance robustness, future studies could apply combined approaches (e.g., Bayesian model averaging) as more data become available.
Fifth, the comparative analysis is restricted to two countries, which prevents generalizations about global patterns. Including other BRICS or post-Soviet countries would increase external validity.
Furthermore, the descriptive ratio comparing the relative gaps in the CMUR and the maturity index (Section 3.7.3) is based on a single cross-sectional contrast between two countries and should not be interpreted causally. Additionally, because some components of the maturity index are informed by recycling and material flow performance data that overlap with CMUR estimation, there is a degree of circularity; this ratio is therefore presented only as an illustrative descriptive observation and does not establish a causal link between institutional maturity and circular material use.
Sixth, the index uses equal weighting for all eight components. While this is justified by the absence of a validated theoretical basis for differential weights and by the high expert concordance (W = 0.85), which suggests collective agreement on the relative importance of components, it remains a simplifying assumption. Components such as industrial symbiosis and financial instruments may plausibly have greater influence on the CMUR than others, but testing this empirically would require a larger country panel.
Seventh, the descriptive ranges of the integrated indices presented in Section 2.3.6, Section 3.6 and Section 3.9 are derived from expert scores obtained through a two-round Delphi procedure. Because the Delphi method is designed to foster convergence between experts, the resulting scores are not statistically independent observations. Therefore, these ranges should be interpreted only as descriptive measures of dispersion, not as inferential confidence intervals. The narrow ranges do not imply statistical precision in the traditional sense, but simply indicate that the experts reached a high level of qualitative agreement.
Eighth, the institutional lag metric (Section 3.3) is based on the selection of three comparable milestones and their pairing between China and Russia. As shown in the sensitivity analysis (Table 3), alternative plausible pairings yield lag estimates ranging from 11.3 to 17.3 years. While all scenarios confirm a substantial lag, the exact value (15.3 years) should be interpreted as an indicative estimate rather than a precise measurement.
Ninth, all nine experts who participated in the Delphi assessment are based in Russia. While this ensures deep familiarity with the Russian institutional context, it may introduce information asymmetry when scoring China’s institutions, as the experts may have less direct exposure to Chinese policy implementation and institutional nuances. The geographical diversity across Russia (experts from Moscow, St. Petersburg, Novosibirsk, Tomsk, etc.) does not fully address this concern, as it does not include experts with direct China expertise. To mitigate this limitation, we validated the China scores against independent third-party assessments in Section 3.6. Future research should include experts with documented China expertise or a broader international expert panel.
Despite these limitations, the methodology offers the first systematic quantitative approach to comparing institutional maturity in the context of SDG 12, and can serve as a foundation for further research.
Note: Detailed expert profiles, individual expert scores, and full statistical outputs are provided in Appendix A.

3. Results

This section presents the findings of the comparative institutional analysis of the circular economy transition in China and the Russian Federation. Quantitative estimates are based on official statistics and regulatory acts, as detailed in Section 2.2. Calculations follow Formulas (1)–(6) presented in Section 2.3. The comparative analysis covers the following key dimensions: dynamics of municipal solid waste recycling and utilization, required growth rates, institutional lag, time elasticity of recycling, capacity deficit, integrated institutional maturity, the Circular Material Use Rate, and the scale of the recycling industry.

3.1. Comparative Dynamics of MSW Recycling and Utilization Rates (2018–2030)

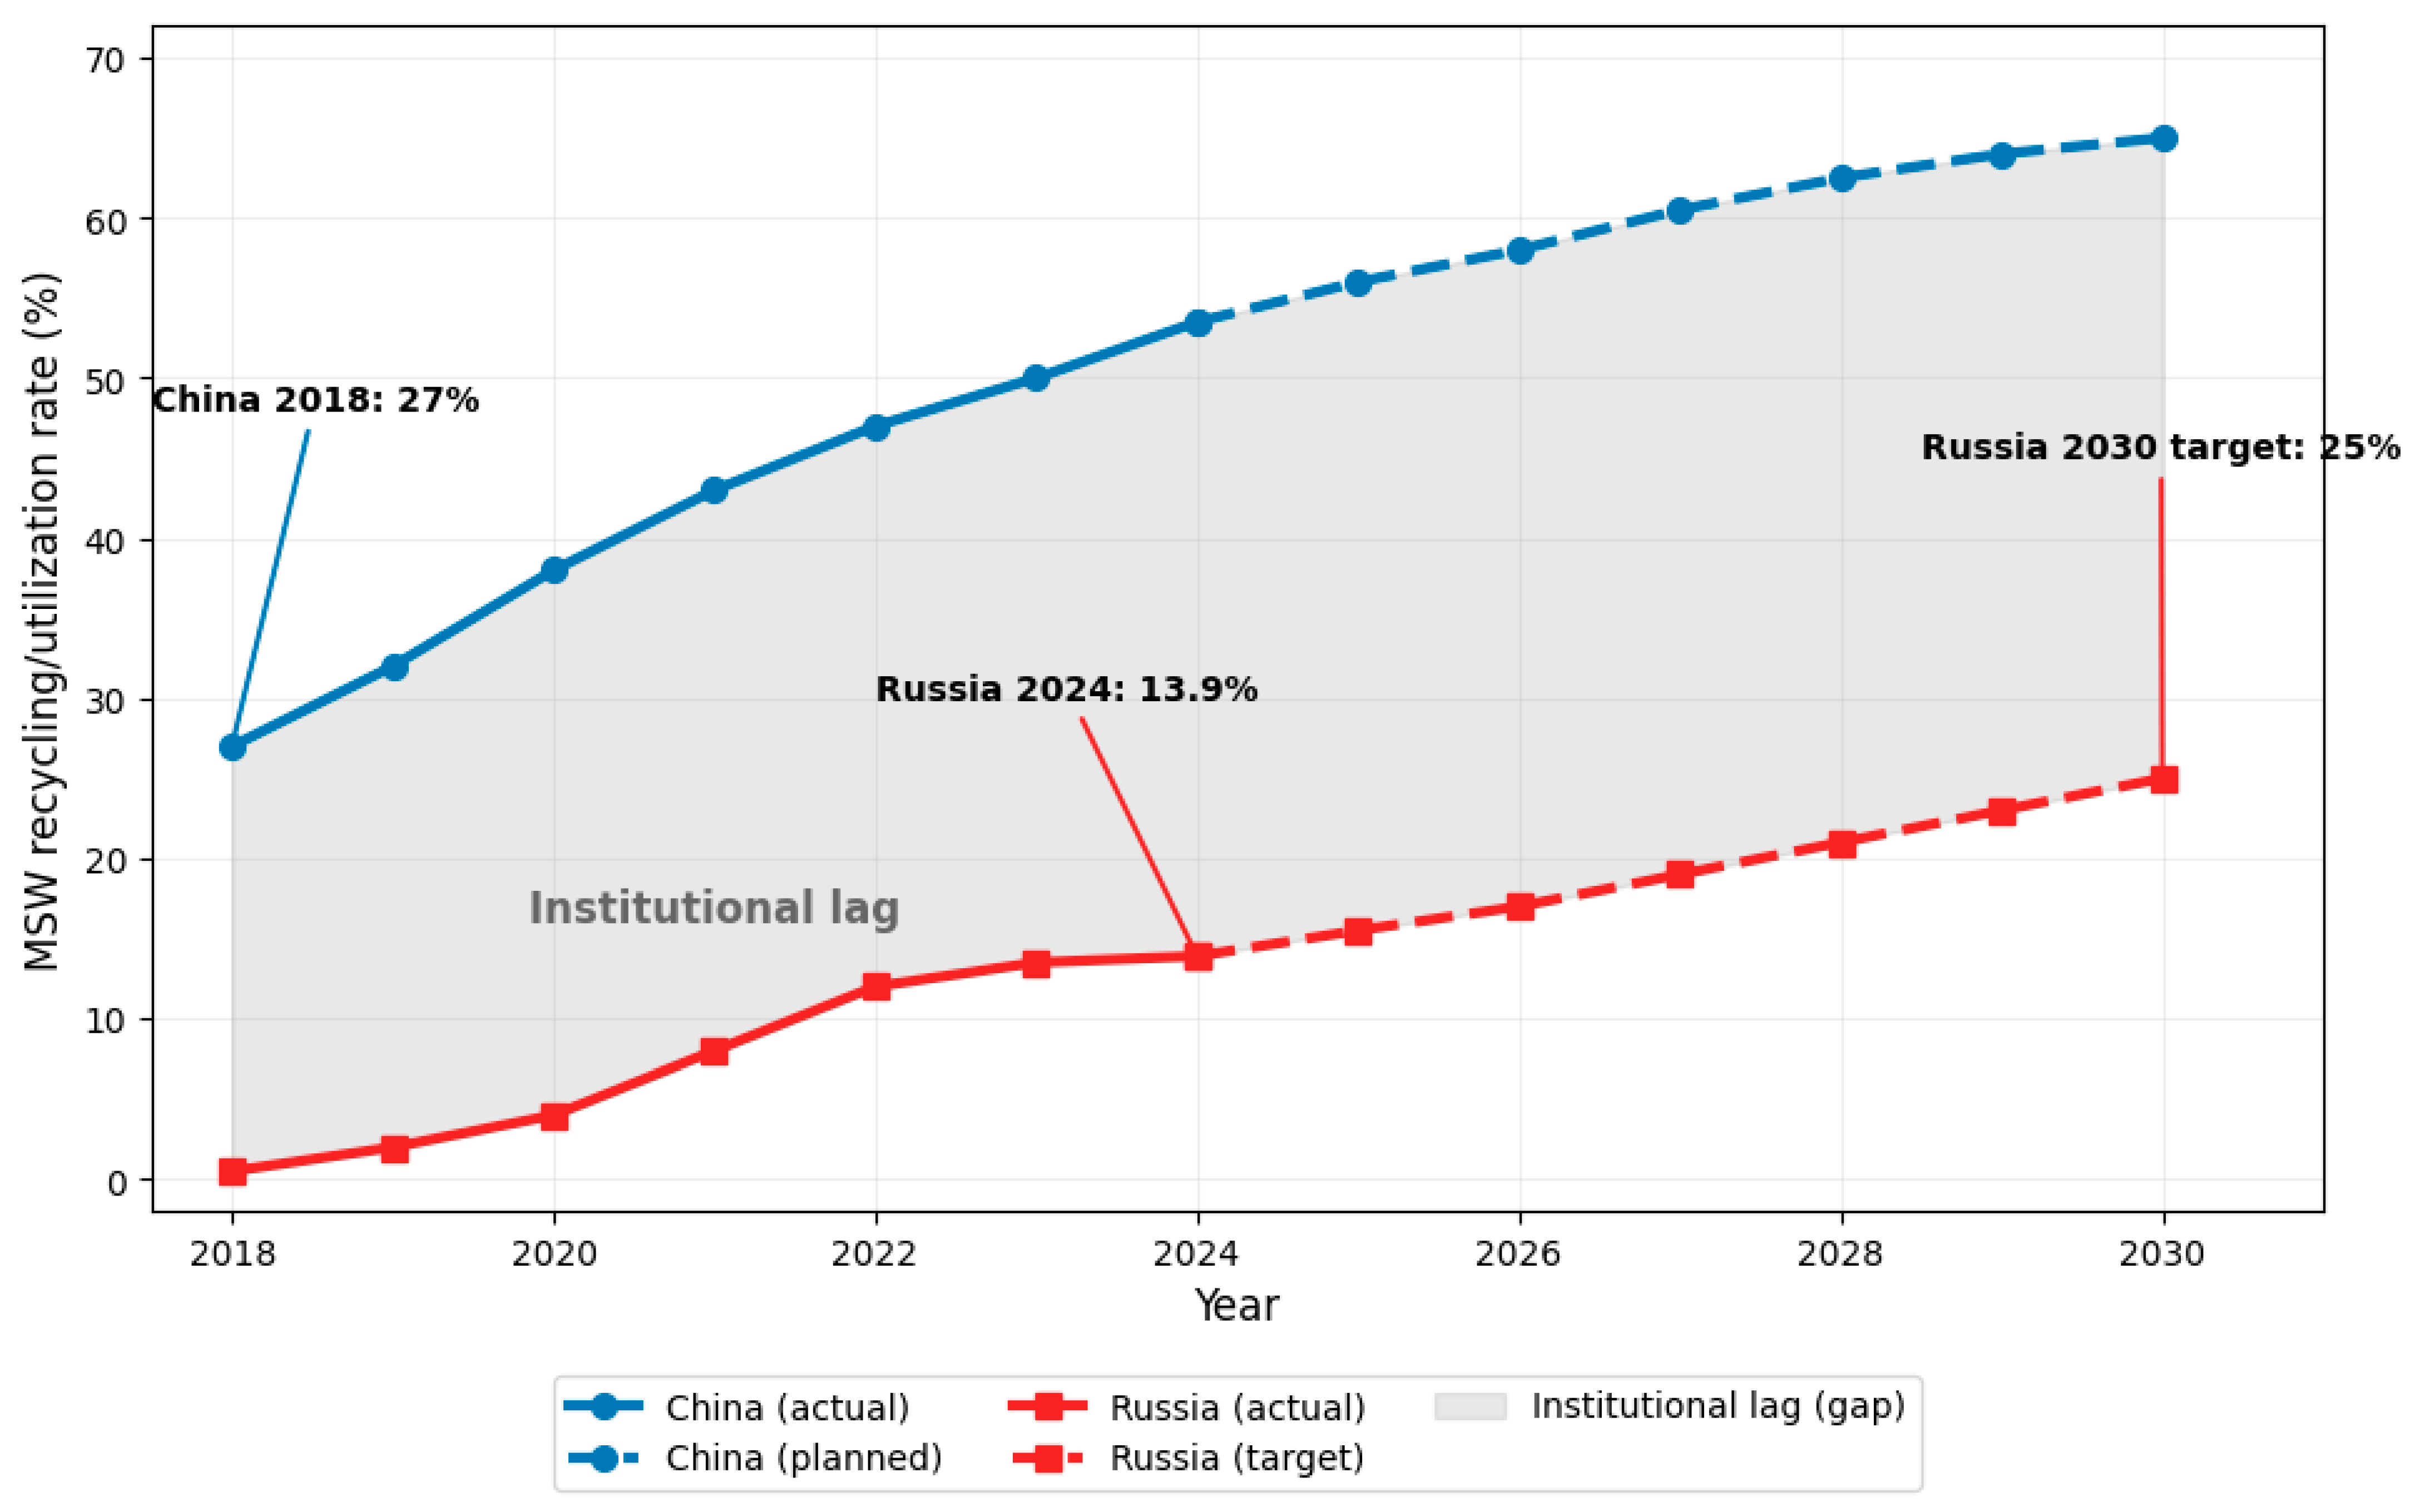
According to official Chinese statistics, the share of urban MSW recycling in China increased monotonically from 27% in 2018 to 50% in 2023. Targets set in the 14th Five-Year Plan for Circular Economy Development aimed for 60% by 2025 and 65% by 2030. By the end of 2025, separate waste collection systems had been implemented in residential areas of 297 prefecture-level cities; the waste-to-energy fleet comprised 1001 units with a total design capacity of 1.18 million tonnes per day; and 15 provinces, including Beijing, Zhejiang, and Shandong, had completely ceased landfilling untreated MSW. The 2025 target of 60% was slightly exceeded. Looking towards 2030, Chinese authorities declare an overall urban MSW recycling and utilization rate above 76%, while the Action Plan for Comprehensive Management of Solid Wastes sets annual targets of 4.5 billion tonnes for comprehensive utilization of bulk solid wastes and 510 million tonnes for recycled resource processing.
In the Russian Federation, according to the Russian Environmental Operator and Rosstat, initial MSW treatment indicators were substantially lower. In 2018, only 3% of the annual MSW volume was sorted, and less than 1% was directed to utilization. By 2024, sorting share reached 54.3%, while utilization share reached 13.9%. The absolute MSW volume in 2024 was 47.5 million tonnes. During 2019–2024, 295 new MSW management facilities were commissioned, including 148 for treatment, 81 for utilization, and 42 integrated facilities, increasing treatment capacity by 23.24 million tonnes per year and utilization capacity by 7.57 million tonnes per year. According to operational data from Rosprirodnadzor [8], in 2025, 46.4 million tonnes of MSW were generated; 25.48 million tonnes, or 54.9%, were sent to treatment; 4.6 million tonnes, or 9.9%, to utilization; and 37.75 million tonnes, or 81.4%, to landfill [49].
Payment collection for MSW removal in the first half of 2025 reached 94.1%.
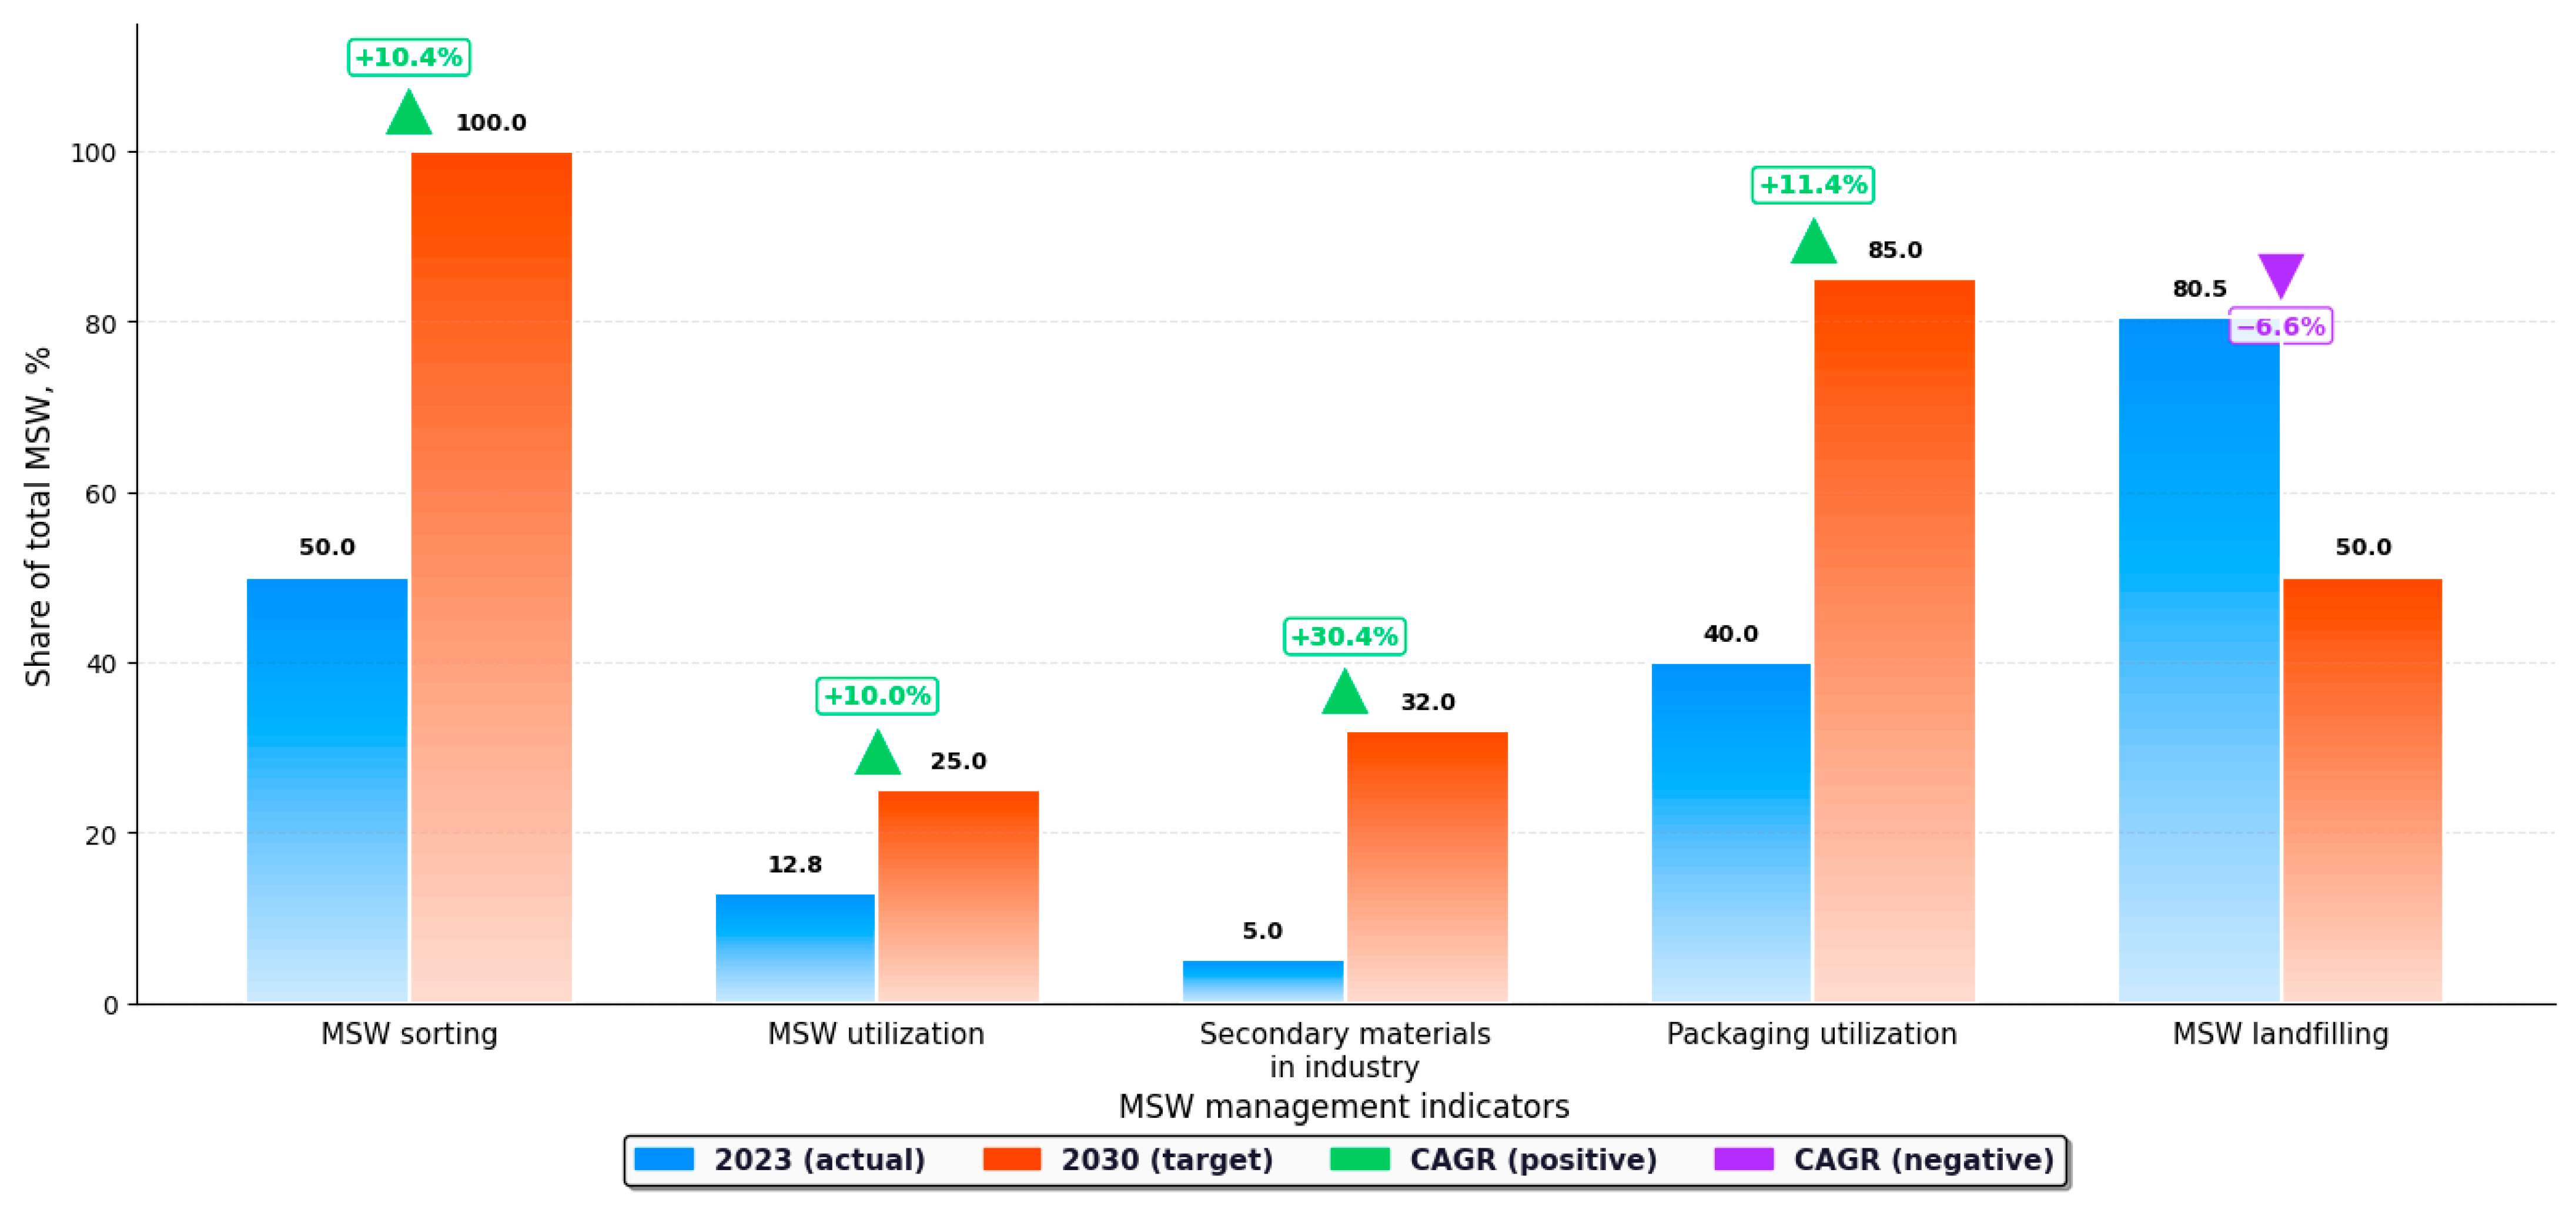
For the base year 2023, the following values are used in this study based on Rosstat and REO operational data: MSW sorting share—50%, MSW utilization share—12.8%, share of secondary raw materials in industry—5% (expert estimate based on industry reports), packaging utilization—40% (REO data), and MSW landfilling share—80.5%. These 2023 values serve as the baseline for the CAGR calculations presented in Table 1.
Targets for 2030, set by Presidential Decree and Government Resolution No. 1039 of 10 July 2025, include 100% MSW sorting, reduction in landfill disposal to ≤50%, at least 25% of waste to be involved in economic turnover as secondary resources and raw materials, MSW utilization as secondary raw materials at 25%, and share of secondary resources in industry at 34%, in construction at 40%, and in agriculture at 50%. Under the extended producer responsibility mechanism, phased packaging utilization targets are set at 55% for 2025, 75% for 2026, and 100% for 2027. The environmental fee in 2025 amounted to RUB 19 billion.
Comparison of the time series reveals several regularities. Over 2018–2023, Russia’s MSW utilization share (the proportion of total MSW generation sent to utilization) grew from 1% to 12.8%, representing a 12.8-fold increase in percentage terms. In absolute terms, the volume of MSW directed to utilization grew from approximately 1.3 million tonnes in 2018 to 5.9 million tonnes in 2023 (based on REO and Rosstat data), a 4.5-fold increase in physical volume. The difference between the growth rates of the share and the absolute volume reflects changes in total MSW generation over the same period. For comparison, China’s recycling share increased from 27% to 50%, a 1.85-fold increase.
The high relative growth in Russia is driven by the low-base effect and is not an indicator of comparable institutional efficiency. In 2023, the difference between China’s recycling share and Russia’s utilization share was 37.2 percentage points. In 2024, with Russia’s utilization at 13.9%, the gap remained about 36 percentage points, considering China’s 50% share. Russia’s 2024 MSW utilization level of 13.9% corresponds to China’s 2009–2010 level of about 14%. Russia’s planned 2030 level of 25% was already achieved by China around 2018 at 27%. It is important to note that this comparison uses the official national definitions for MSW recycling/utilization rates, which may not be perfectly harmonized across the two countries. As discussed in Section 2.2, China’s official MSW recycling and utilization rate includes waste-to-energy incineration, whereas Russia’s “utilization” definition focuses primarily on material recovery. This means that the observed gap may partly reflect definitional differences rather than purely differences in material circularity. The CMUR estimates presented in Section 3.7, which use a harmonized definition (excluding waste-to-energy), provide a more conservative and directly comparable measure of material circularity. The MSW recycling/utilization comparison should therefore be interpreted as an indicative illustration of the gap, not as a precise harmonized measurement.
Figure 1 presents the comparative dynamics of MSW recycling and utilization rates in China and Russia from 2018 to 2030 and identifies the institutional lag.

3.2. Required Growth Rates for Russia’s Targets

Using Formula (1), we calculated the required compound annual growth rates for key Russian CE indicators over 2023–2030, as presented in Table 3. The most ambitious indicator is the share of secondary raw materials in industry, requiring a CAGR of 31.5%, corresponding to growth from 5% in 2023 to 34% by 2030 (as set out in Government Resolution No. 1039 of 10 July 2025). For MSW sorting, the required CAGR is 10.4%; for MSW utilization, 10.0%; and for packaging utilization, 11.4%. For landfilling, an annual reduction of 6.6% is required, represented by a negative CAGR.
For comparison, China’s current share of secondary materials in industry is already about 25–30%, and the required CAGR to reach 2030 targets is only about 3–5% per year. This further confirms the existence of an institutional lag.
Figure 2 presents a bar chart comparing actual values for 2023 and target values for 2030 for Russia’s key CE indicators, highlighting the required CAGR.

3.3. Institutional Lag Calculation

Using Formula (2), we calculated the average time lag based on three comparable institutional milestones. For China, these milestones are (1) the adoption of the conceptual programme document in 2002 (the first explicit national-level CE policy statement); (2) the adoption of the Circular Economy Promotion Law in 2008 (the first comprehensive CE framework law); and (3) the commencement of cyclic strategic planning in 2005 (the first Five-Year Plan incorporating CE as a dedicated section). For Russia, the milestones are (1) the conceptual document in 2014 (the amendment of Federal Law No. 89-FZ that introduced the “circular economy” concept into Russian waste legislation); (2) the federal project “Circular Economy” in 2022 (the first dedicated federal-level CE programme); and (3) the start of the national project “Environmental Well-being” in 2025 (the first comprehensive national project integrating the CE with broader environmental goals). The 1998 version of Federal Law No. 89-FZ is not used as a milestone because it predates the “circular economy” concept in Russian policy discourse; the 2014 amendment represents the first explicit reference to circular principles.
The calculation yields:
inst   =   ( 2002 2014 ) + ( 2008 2022 ) + ( 2005 2025 ) 3 = 12 14 20 3 = 46 3 15.3 .
Thus, Russia’s average institutional lag relative to China is 15.3 years. The absolute value is taken so that inst represents the number of years of Russia’s lag (a positive number).
Sensitivity analysis. Because the lag calculation depends on the choice of milestones and their pairing, we conducted a sensitivity analysis using three alternative, plausible pairings (Table 4).
The sensitivity analysis shows that L_inst ranges from 11.3 to 17.3 years under alternative plausible assumptions. The main scenario (15.3 years) lies within this range, and all scenarios confirm a substantial institutional lag of at least 11 years. The result is therefore robust to reasonable variations in milestone selection, though the exact magnitude should be interpreted with caution.
Figure 3 shows a parallel timeline of institutional milestones in China and Russia from 1998 to 2030, illustrating the institutional lag.

3.4. Comparative Dynamics of Recycling Growth Rates

To compare the dynamics “from a low base” in Russia and “from a high base” in China, we calculated the compound annual growth rates (CAGRs) and absolute changes in recycling volume. For Russia, the absolute volume of MSW directed to utilization grew from 1.3 million tonnes in 2018 to 5.9 million tonnes in 2023 (based on Rosstat and REO operational data), yielding a CAGR of 33.0% (Equation (1)). The utilization share over the same period increased from 1% to 12.8%, reflecting both the growth in absolute utilization volume and changes in total MSW generation. The substantially higher CAGR for Russia (33.0% vs. 13.1% for China) is exclusively due to the low-base effect and does not indicate comparable institutional efficiency or technological level. The “low-base effect” is a well-documented phenomenon in development economics and firm growth studies: when starting from very low levels, percentage growth rates can be deceptively high, even with modest absolute gains. In the context of firm dynamics, this effect has been shown to be particularly pronounced for smaller and younger firms [50,51,52]. Similarly, studies of high-growth firms have demonstrated that rapid percentage growth often reflects a low initial base rather than exceptional performance [53]. This is quantitatively evidenced by the comparison of Russia’s CAGR (33.0%) with China’s (13.1%) over the same period, where Russia’s much lower starting point (1.3 million tonnes vs. 27% in China) explains the higher growth rate despite modest absolute gains (4.6 million tonnes vs. 23 percentage points). This finding is further corroborated by the CAPEX coefficient analysis (Section 3.8), which shows that Russia’s CAPEX per percentage-point increase is artificially low (0.32 vs. 3.9 billion USD per percentage point in China). In terms of institutional change theory, high growth at early stages is characteristic of catching-up development. However, as targets are approached, growth rates decline and required investments per additional percentage point increase.

3.5. Utilization Capacity Deficit in Russia

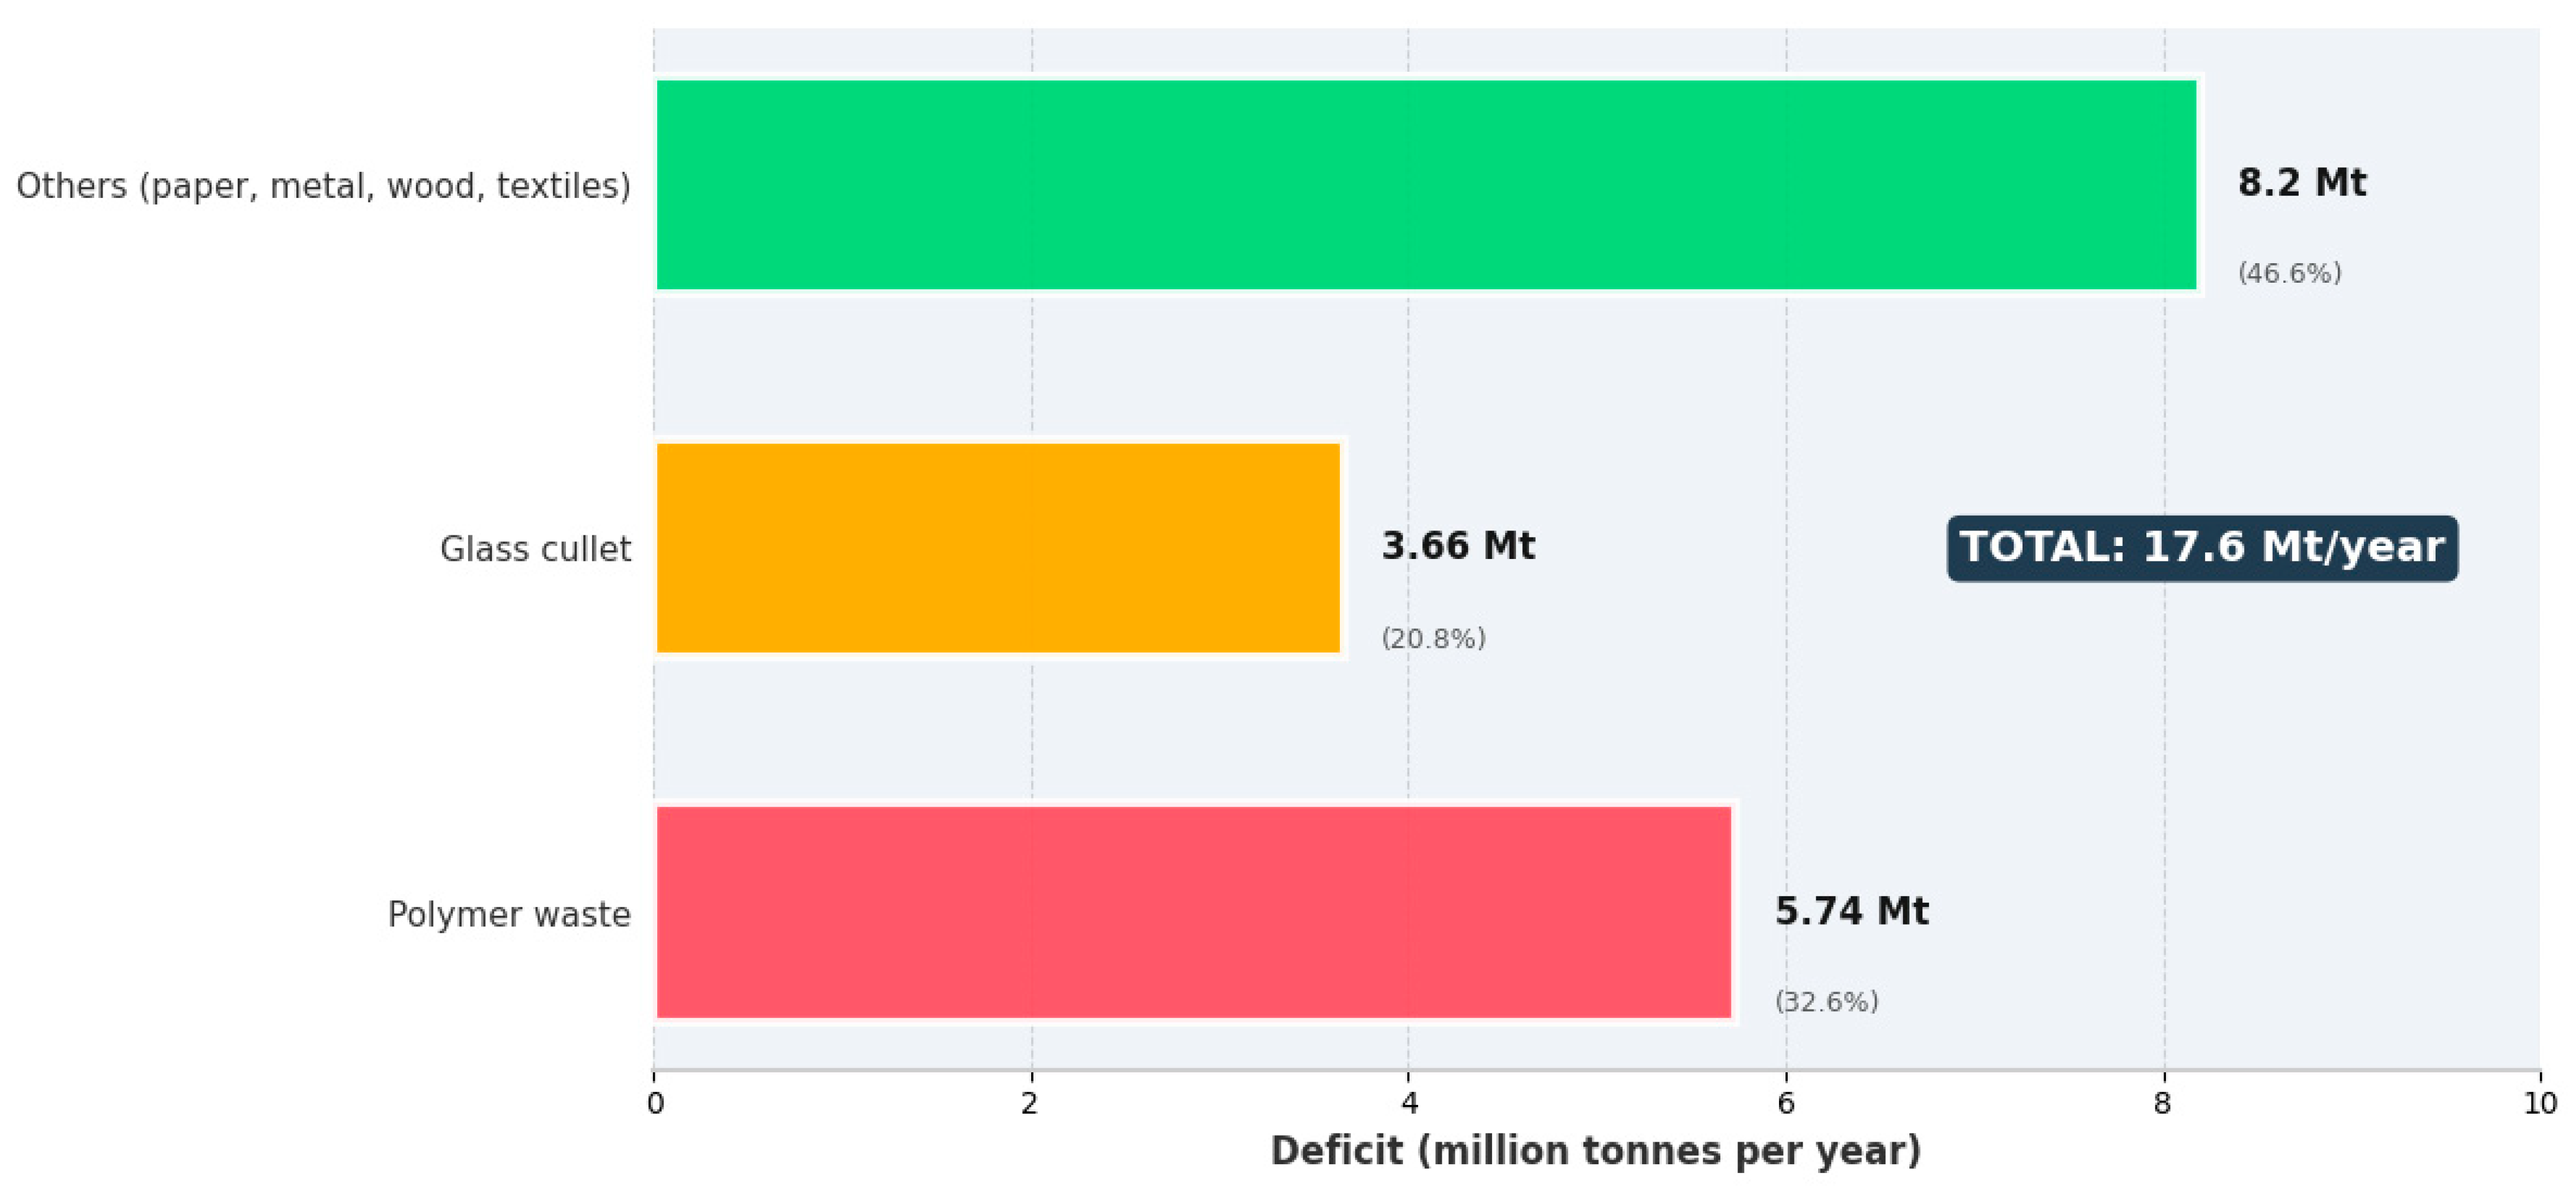
Using Formula (4) and data from the Russian Environmental Operator, we estimated the MSW utilization capacity deficit. By 2024, the accumulated deficit reached 17.6 million tonnes per year. The structure by waste type is shown in Table 5.
To eliminate this deficit by 2030, additional capacities of 22 million tonnes per year for treatment, being sorting, and 14.2 million tonnes per year for utilization are required. Total investment needed is estimated at RUB 250–300 billion, based on REO estimates for the required expansion of sorting and utilization capacities [54,55,56]. In China, a similar deficit was mostly eliminated during 2015–2020 through state investments of about USD 90 billion, equivalent to about 8–9 trillion RUB in purchasing power parity.
Figure 4 shows the structure of the recycling capacity deficit in Russia by waste type for 2024.

3.6. Integrated Institutional Maturity Index

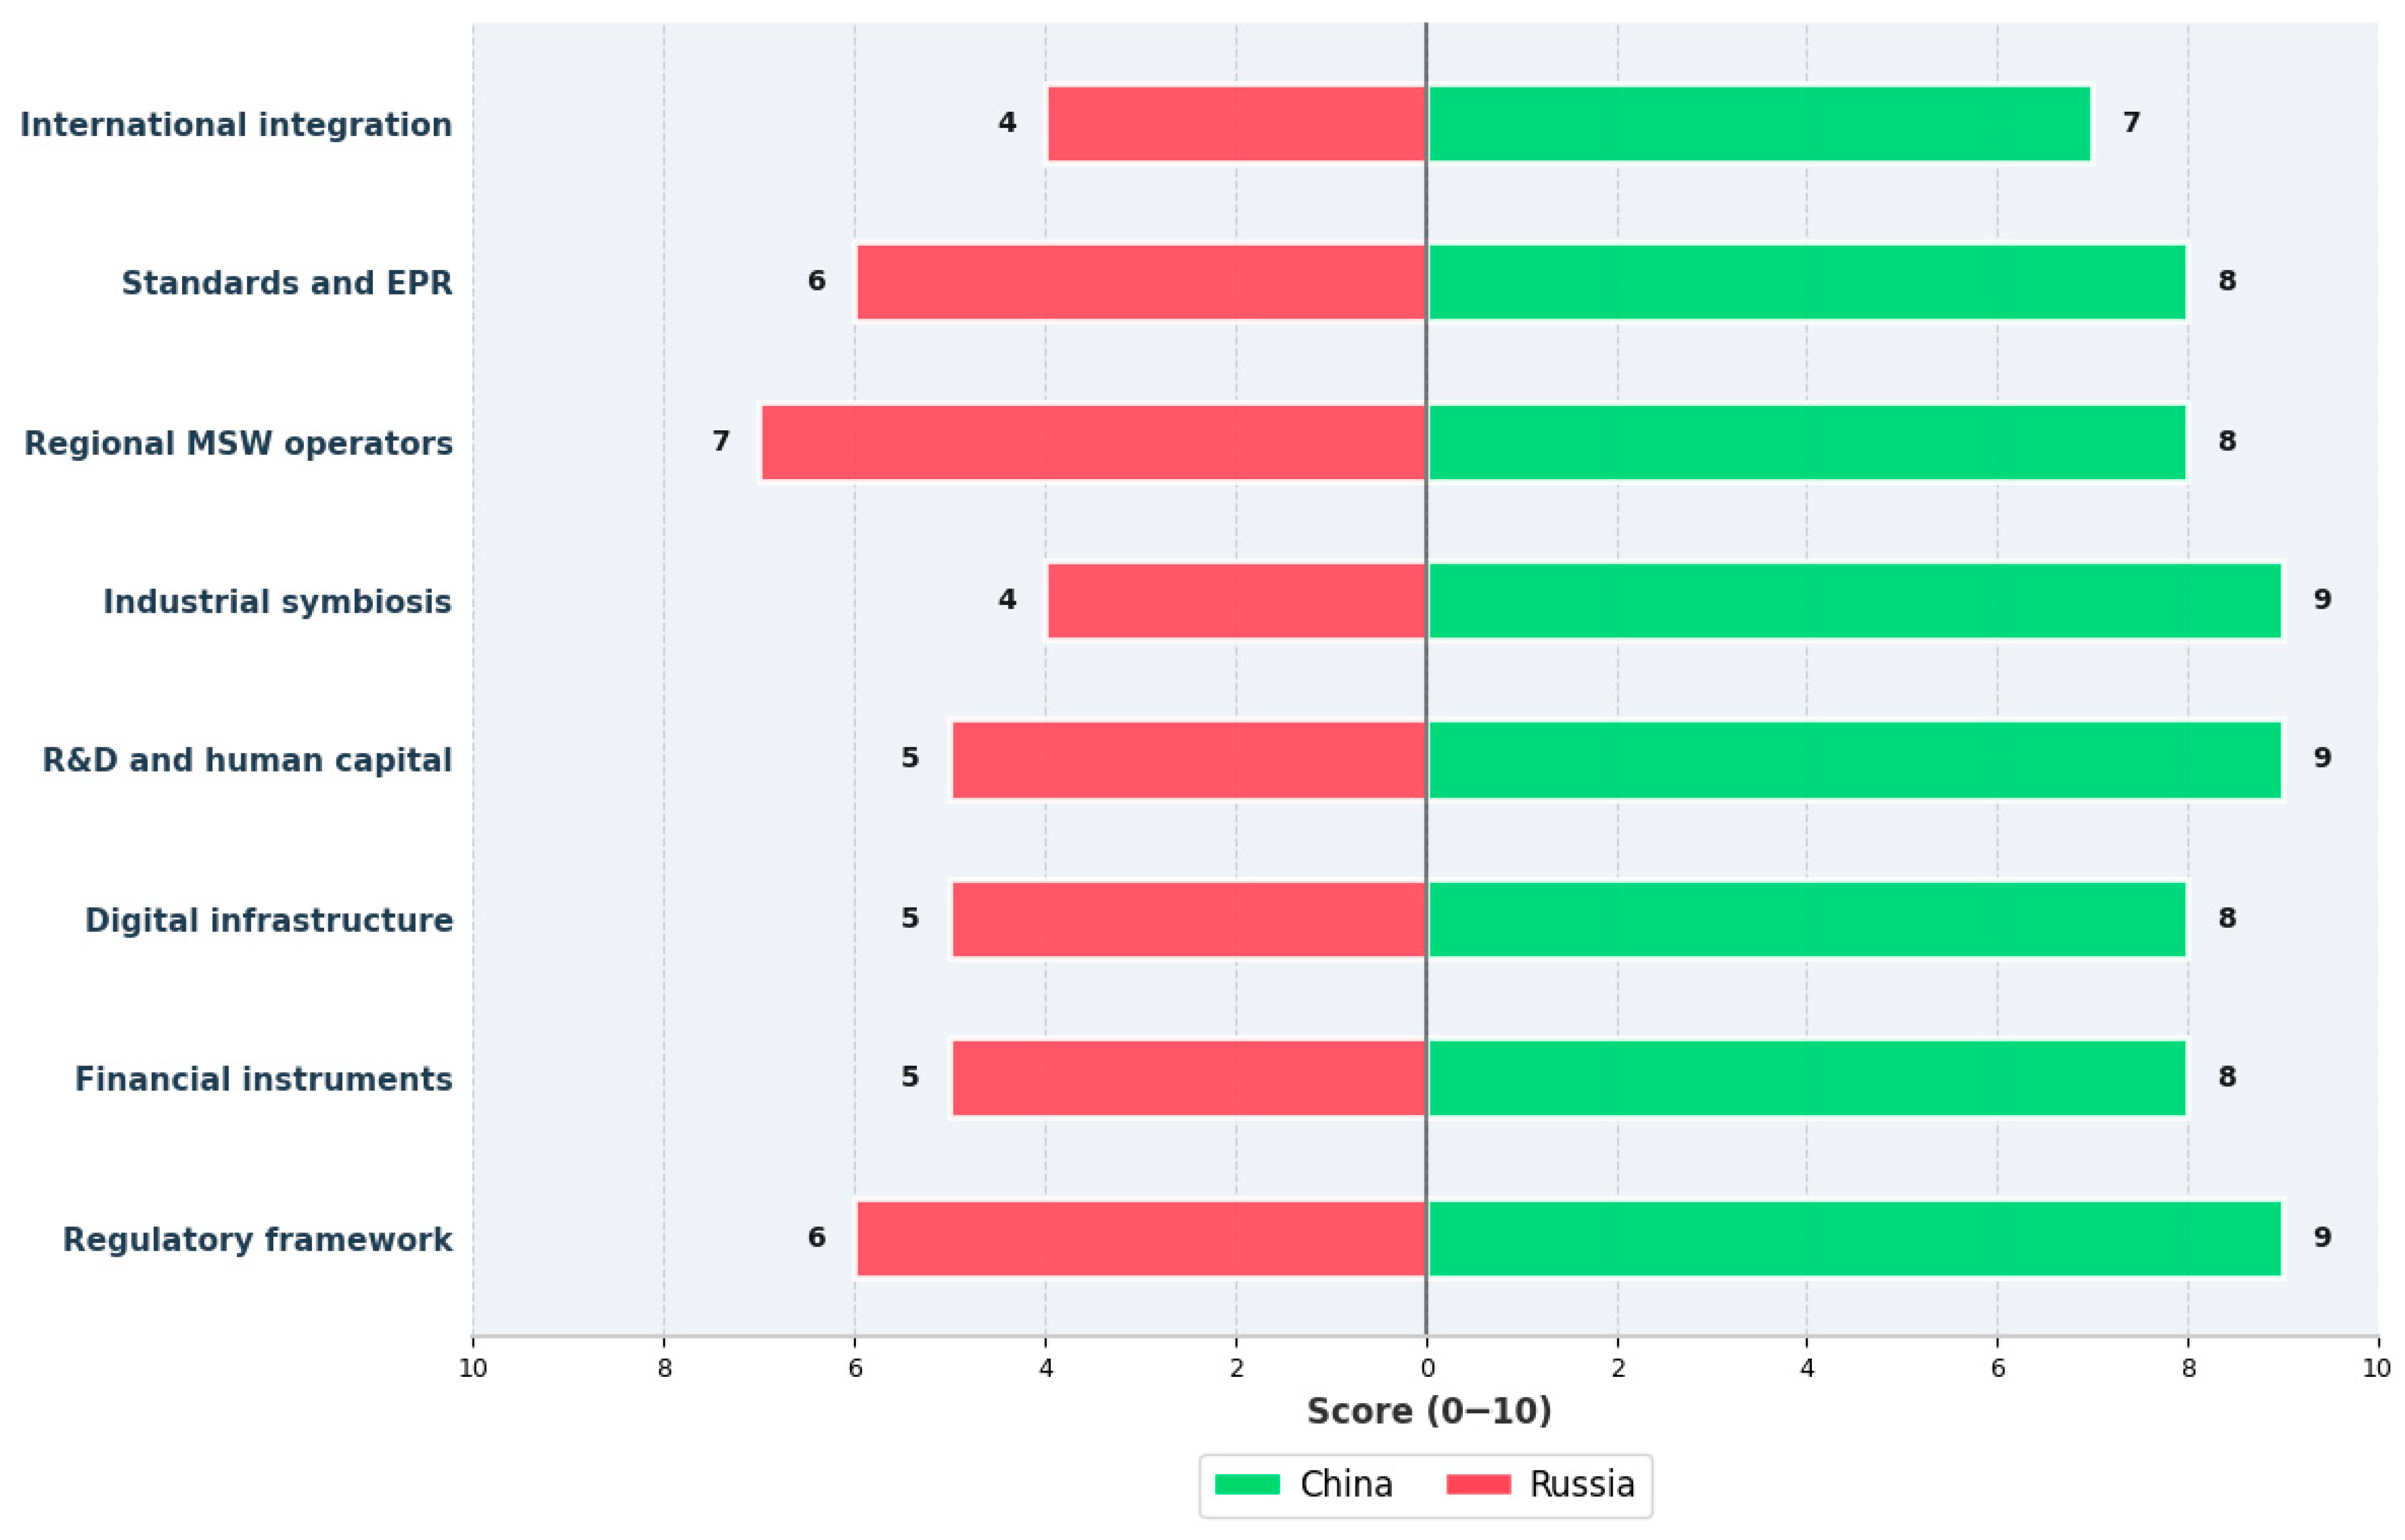
Following the methodology described in Section 2.3.6 and Formula (5), we conducted an expert scoring of eight institutional components for China and Russia. Scores are based on analysis of regulatory documents, industry analytics, and scientific reviews. Results are presented in Table 6.
The scoring rubric used by the experts is detailed in Appendix A (Table A6).
Validation of China scores against independent assessments. To address the concern that all experts are Russia-based, we validated the expert-based scores for China against independent third-party assessments. The EU Circular Economy Platform (2023) ranks China’s CE regulatory framework as “advanced” and its industrial symbiosis infrastructure as “extensive” (consistent with our score of 9) [10]. The OECD (2020) rates China’s R&D investment in environmental technologies among the highest in the G20, aligning with our score of 9 [34]. The NDRC (2021) reports that China issued 238 billion yuan of green bonds in 2016 alone, consistent with our financial instruments score of 8 [23]. These external sources support the expert-based scores and mitigate the concern that Russia-based experts may systematically under- or overestimate China’s institutional maturity. This validation does not eliminate the potential for information asymmetry, but it provides additional confidence in the expert-based assessments.
Classification of components. The eight components can be classified into two categories: (1) institutional-input components, which reflect formal institutional structures and policy mechanisms that enable circular transition (regulatory framework, financial instruments, digital infrastructure, R&D and human capital, standards and EPR, international integration), and (2) outcome-related components, which reflect institutional performance and material flows that are partly shaped by circularity outcomes (industrial symbiosis, regional MSW operators). This distinction is important because the latter components may overlap with the information used to estimate the CMUR (Section 3.7), introducing a degree of circularity when interpreting the relationship between the index and CMUR. We acknowledge this limitation and treat the index as a comprehensive measure of institutional development rather than a purely causal predictor of circular material use. This caveat is further discussed in Section 2.4.
China’s integrated index of 8.25 far exceeds Russia’s index of 5.25. The largest gaps are in industrial symbiosis, with scores of 9 versus 4, a gap of 5 points; R&D and human capital, with 9 versus 5, a gap of 4 points; international integration, with 7 versus 4, a gap of 3 points; and financial instruments, with scores of 8 versus 5, a gap of 3 points. Russia retains a relative advantage only in regional MSW operators with 7 points, reflecting the presence of a network of regional operators established during the MSW reform. However, as shown in Section 3.1, their effectiveness is heterogeneous and formal presence does not always translate into high utilization outcomes.
To assess the variability of the integrated index across experts, we used the descriptive ranges reported in Section 2.3.6 (based on the individual integrated indices of the nine experts). For Russia, the expert scores range from 5.00 to 5.38; for China, from 8.00 to 8.38. These narrow ranges indicate high expert agreement. The Mann–Whitney U test on the eight component scores confirmed the statistical significance of the differences with p = 0.021, indicating that China’s higher institutional maturity is not due to chance.
To further illustrate the institutional gap between the two countries, Figure 5 presents a butterfly chart comparing China and Russia across eight components of institutional maturity. The chart visualizes the scores presented in Table 2 and Appendix A. Red bars extending to the right represent China’s scores, while blue bars extending to the left represent Russia’s scores. The vertical zero line separates the two countries, making the comparative performance immediately visible.
China demonstrates consistently higher scores in all components except regional MSW operators, where the gap is relatively small (8 vs. 7). The most pronounced differences are observed in industrial symbioses (9 vs. 4), R&D and human capital (9 vs. 5), financial instruments (8 vs. 5), and international integration (7 vs. 4). These findings suggest that while Russia has established a basic institutional framework for circular economy transition, it critically lags in areas that require long-term investment, cross-sectoral coordination, and international collaboration. The observed pattern is consistent with the 15.3-year institutional lag identified earlier (Section 3.3), and correlates with the 20–25 percentage-point gap in the Circular Material Use Rate (CMUR) discussed in Section 3.7.

3.7. Circular Material Use Rate

3.7.1. Historical Data and Current Gap

Using Formula (6), we calculated the key SDG 12.5.1 indicator, the Circular Material Use Rate. For China, estimates from the National Development and Reform Commission and the European Commission place the CMUR at 25–30%, with a target of 30% by 2025. For Russia, based on INFRAGRIN and our own calculations from official statistics, CMUR is estimated at 5–7%. The gap is therefore 20–25 percentage points, corresponding to China’s level in the mid-2000s. The detailed calculation of R_recycled and R_total for each year, including specific Rosstat and REO table references, is provided in Table 7.
Russia’s low CMUR indicates that the vast majority of material flows still depend on primary resources, with secondary materials contributing only marginally to gross material consumption.
Table 8 compiles historical and current CMUR estimates for both countries over the period 2018–2025.
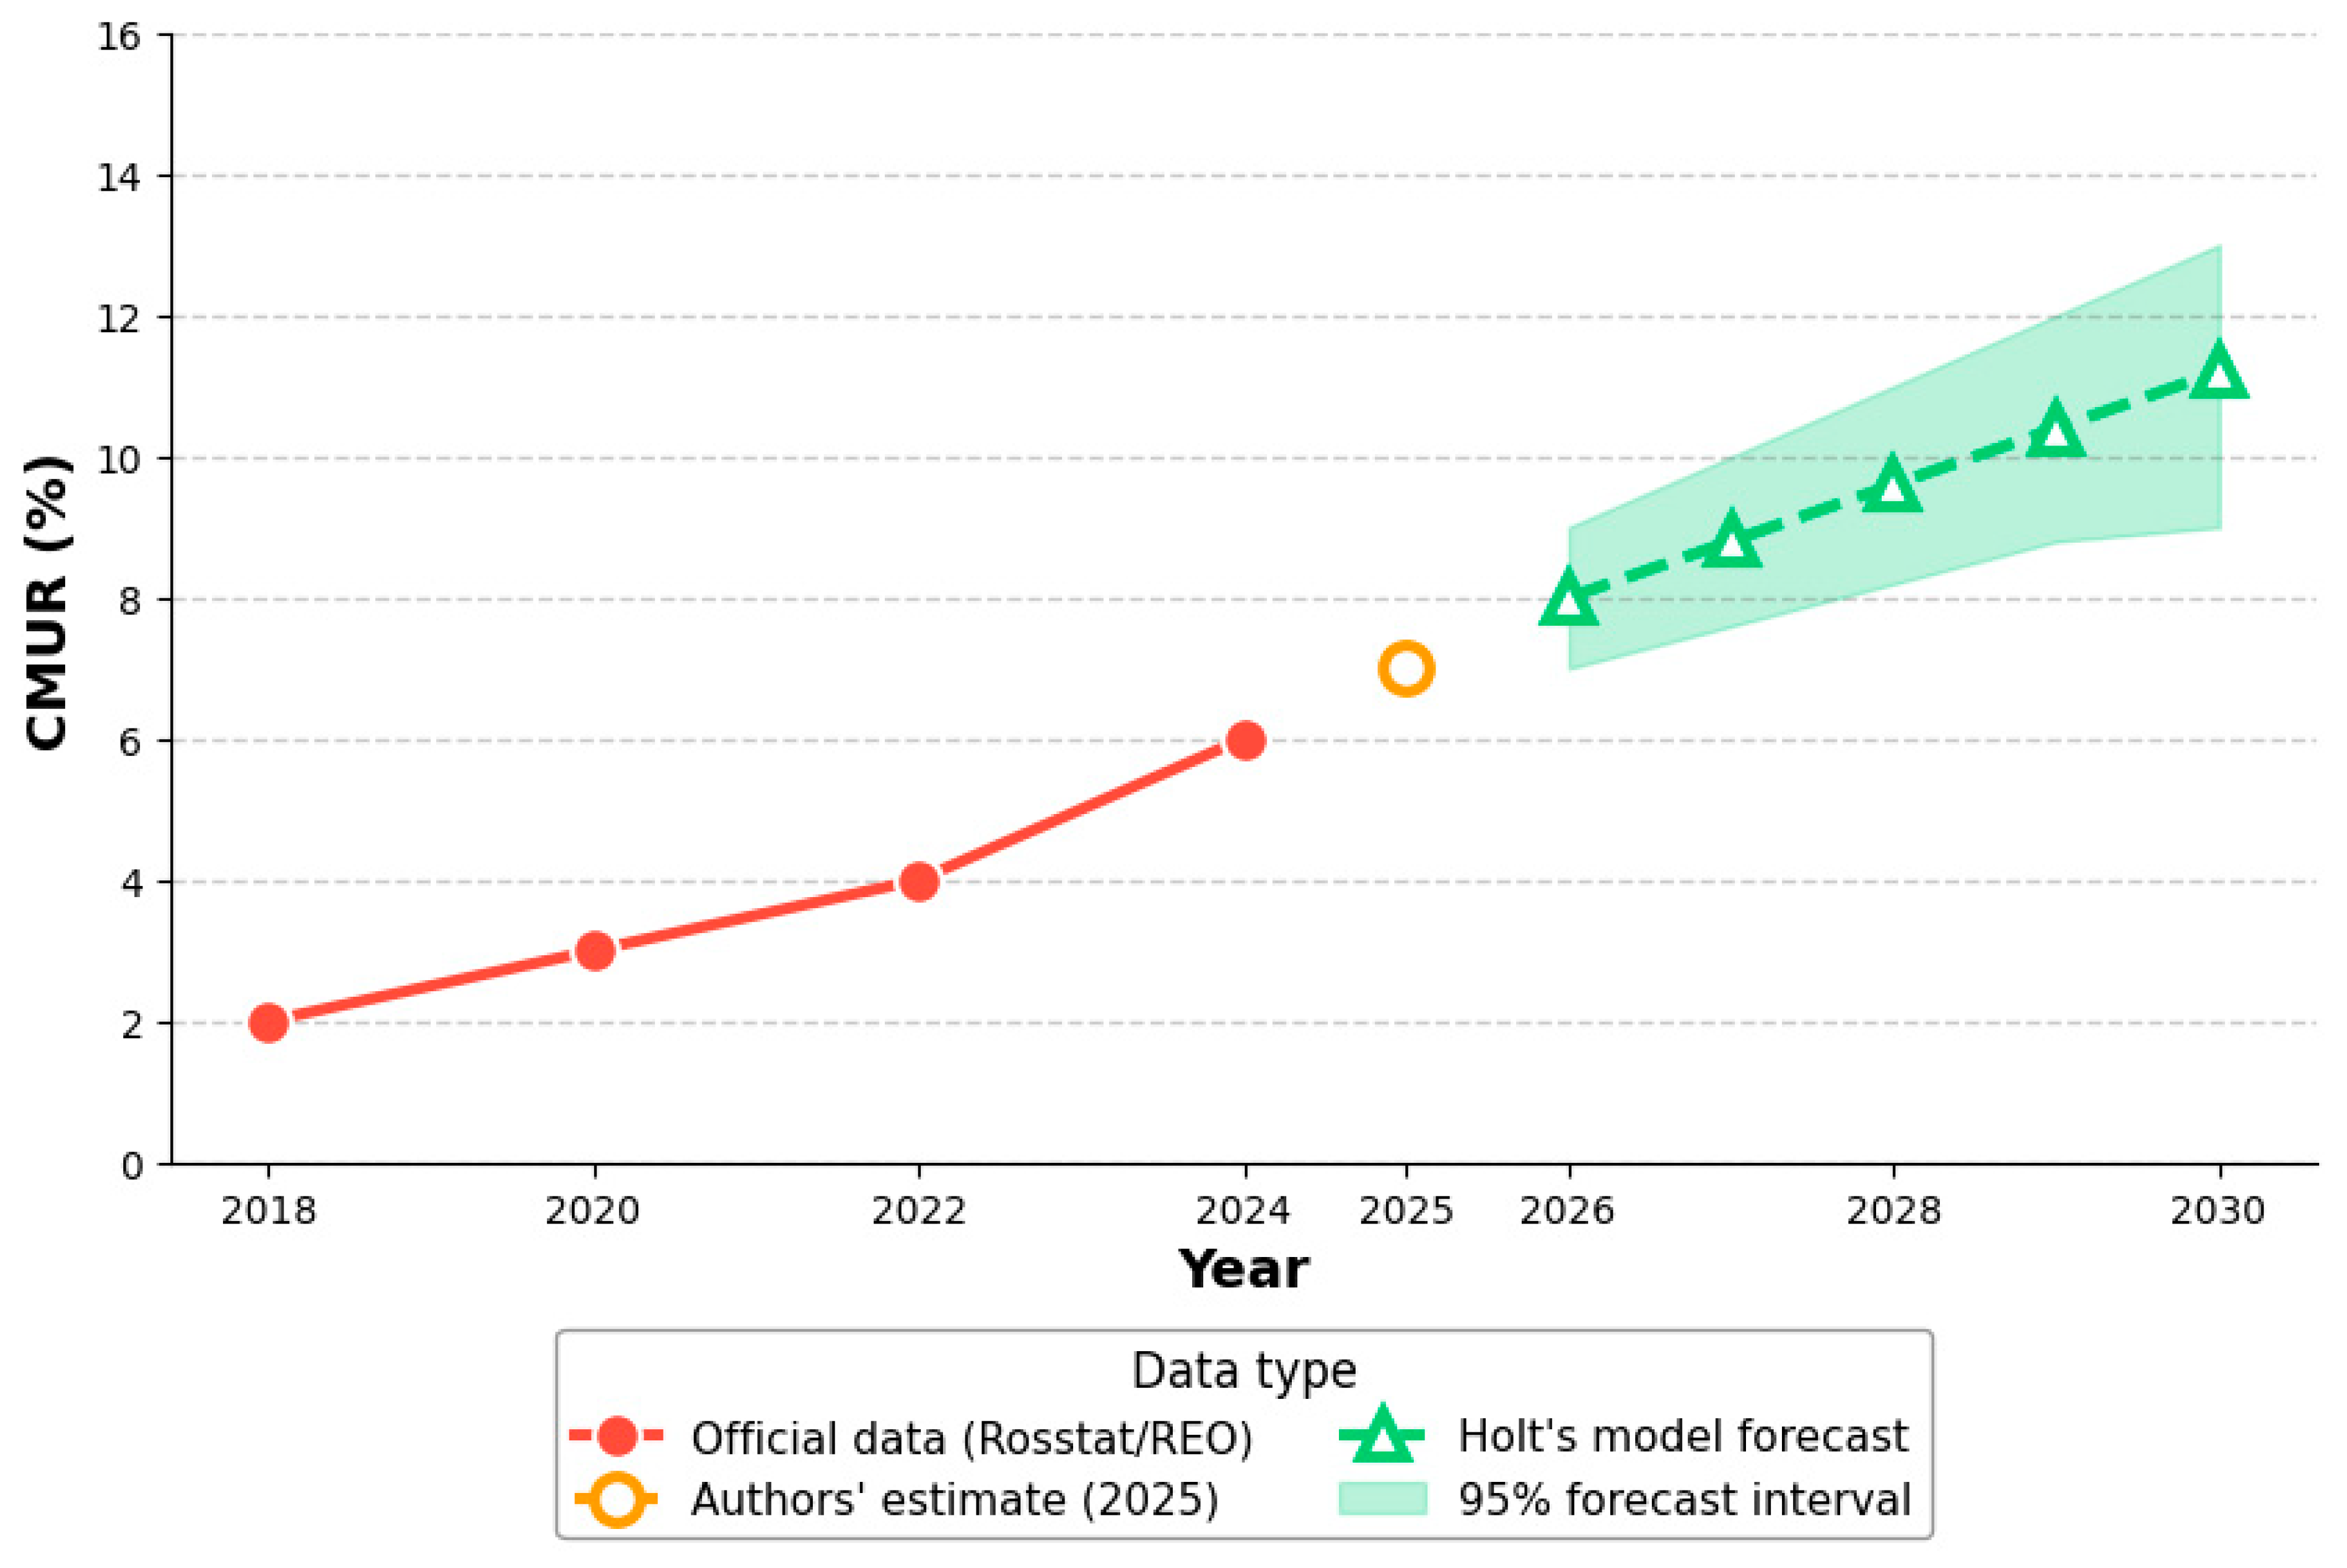
The historical CMUR values for 2018–2024 are based on official Rosstat and REO data. The value for 2025 is an estimate by the authors based on Rosstat operational data and REO preliminary reports. This distinction is shown graphically in Figure 6: solid markers indicate official data, while the open circle marker at 2025 indicates the authors’ estimate.
Based on these historical estimates, the next subsection provides a forecast for Russia’s CMUR up to 2030, while Figure 7 summarizes the overall gap between the two countries.

3.7.2. Forecast for Russia to 2030

To quantify the Russian CMUR trajectory to 2030, we applied Holt’s double exponential smoothing with parameters α = 0.3 and β = 0.2 to the time series consisting of 2018 at 2%, 2020 at 3%, 2022 at 4%, 2024 at 6%, and 2025 at 7%. The forecast for 2030 is 11.2% with a 95% confidence interval of [9%; 13%]. This corroborates our qualitative expectation of 10–12%. Even under an optimistic scenario, Russia’s projected CMUR remains below China’s mid-2010s level of around 15–18%.
Figure 6 illustrates the forecasted CMUR for Russia until 2030 with the 95% confidence interval.
Important caveat on forecast reliability. The forecast is based on only five observations (2018, 2020, 2022, 2024, 2025). To address the concern about unequal spacing, we interpolated the series to annual frequency using the available data points before applying Holt’s double exponential smoothing. The 95% forecast interval [9%; 13%] is a model-based estimate that assumes the underlying trend continues and does not account for structural breaks or policy changes. Given the short time series and the uncertainty inherent in extrapolating from only five points, this forecast should be interpreted as an indicative projection rather than a precise prediction. Future research should revisit this forecast as additional CMUR observations become available.
The adequacy of the Holt model was assessed using standard error metrics calculated from the in-sample fit: RMSE = 0.24 percentage points and MAE = 0.20 percentage points, indicating a close fit to the historical data given the short time series.

3.7.3. Descriptive Comparison of the CMUR and Maturity Gaps

To provide a descriptive illustration of the relative magnitude of the gaps between the two countries, we compared the proportional differences in the CMUR and in the integrated maturity index M. For Russia (base) and China (reference), the observed differences are as follows.
CMUR gap: ΔCMUR = 25% − 5% = 20 percentage points (i.e., the CMUR in China is five times that of Russia: 25/5 = 5, so the relative difference is (25 − 5)/5 = 4.0).
Maturity gap: ΔM = 8.25 − 5.25 = 3.0 points (i.e., the M in China is 8.25/5.25 ≈ 1.57 times that of Russia; therefore, the relative difference is (8.25 − 5.25)/5.25 ≈ 0.571).
The ratio of these relative differences is (4.0)/(0.571) ≈ 7.0. This means that, in this two-country comparison, the relative gap in the CMUR is about seven times larger than the relative gap in the institutional maturity index. This descriptive ratio illustrates the large observed difference in circular material use between the two countries relative to their difference in institutional maturity.
Important caveat. This ratio is a purely descriptive statistic based on a single cross-sectional contrast (n = 2). It should not be interpreted as an elasticity, a causal effect, or a predictive relationship. A value of 7.0 does not imply that a 1% increase in institutional maturity would lead to a 7% increase in the CMUR, nor does it establish that institutional reforms are the primary driver of CMUR improvements. Moreover, because some components of the maturity index (e.g., industrial symbiosis, regional operators) are informed by recycling-performance data, there is a degree of overlap with the information used to estimate the CMUR. This further cautions against any causal interpretation. The ratio is presented solely to illustrate the magnitude of the observed gaps in relative terms, and any policy implications drawn from it must be treated as tentative and in need of validation with broader cross-country or panel data.

3.7.4. Comparison with Other BRICS Countries

To contextualize the China–Russia gap, we briefly compare with other BRICS nations, India and Brazil, for which limited but comparable CMUR estimates exist. According to the available literature, India’s CMUR is estimated at around 8–10%, while Brazil’s is approximately 6–8%. These figures, though based on less harmonized data, suggest that Russia at 5–7% is closer to Brazil but still below India, and substantially behind China at 25–30%. The divergence within BRICS nations highlights the diversity of institutional approaches. China’s centralized planning and heavy investment in recycling infrastructure have propelled its circularity, while other BRICS countries rely more on market-based mechanisms and face stronger coordination deficits. For Russia, this comparison indicates that while it is not the lowest among large developing economies, the institutional lag relative to China is extreme, and catching up requires not just more investment but a fundamental upgrade of coordination and innovation systems.

3.8. Scale Comparison of the Recycling Industry and Investment Efficiency

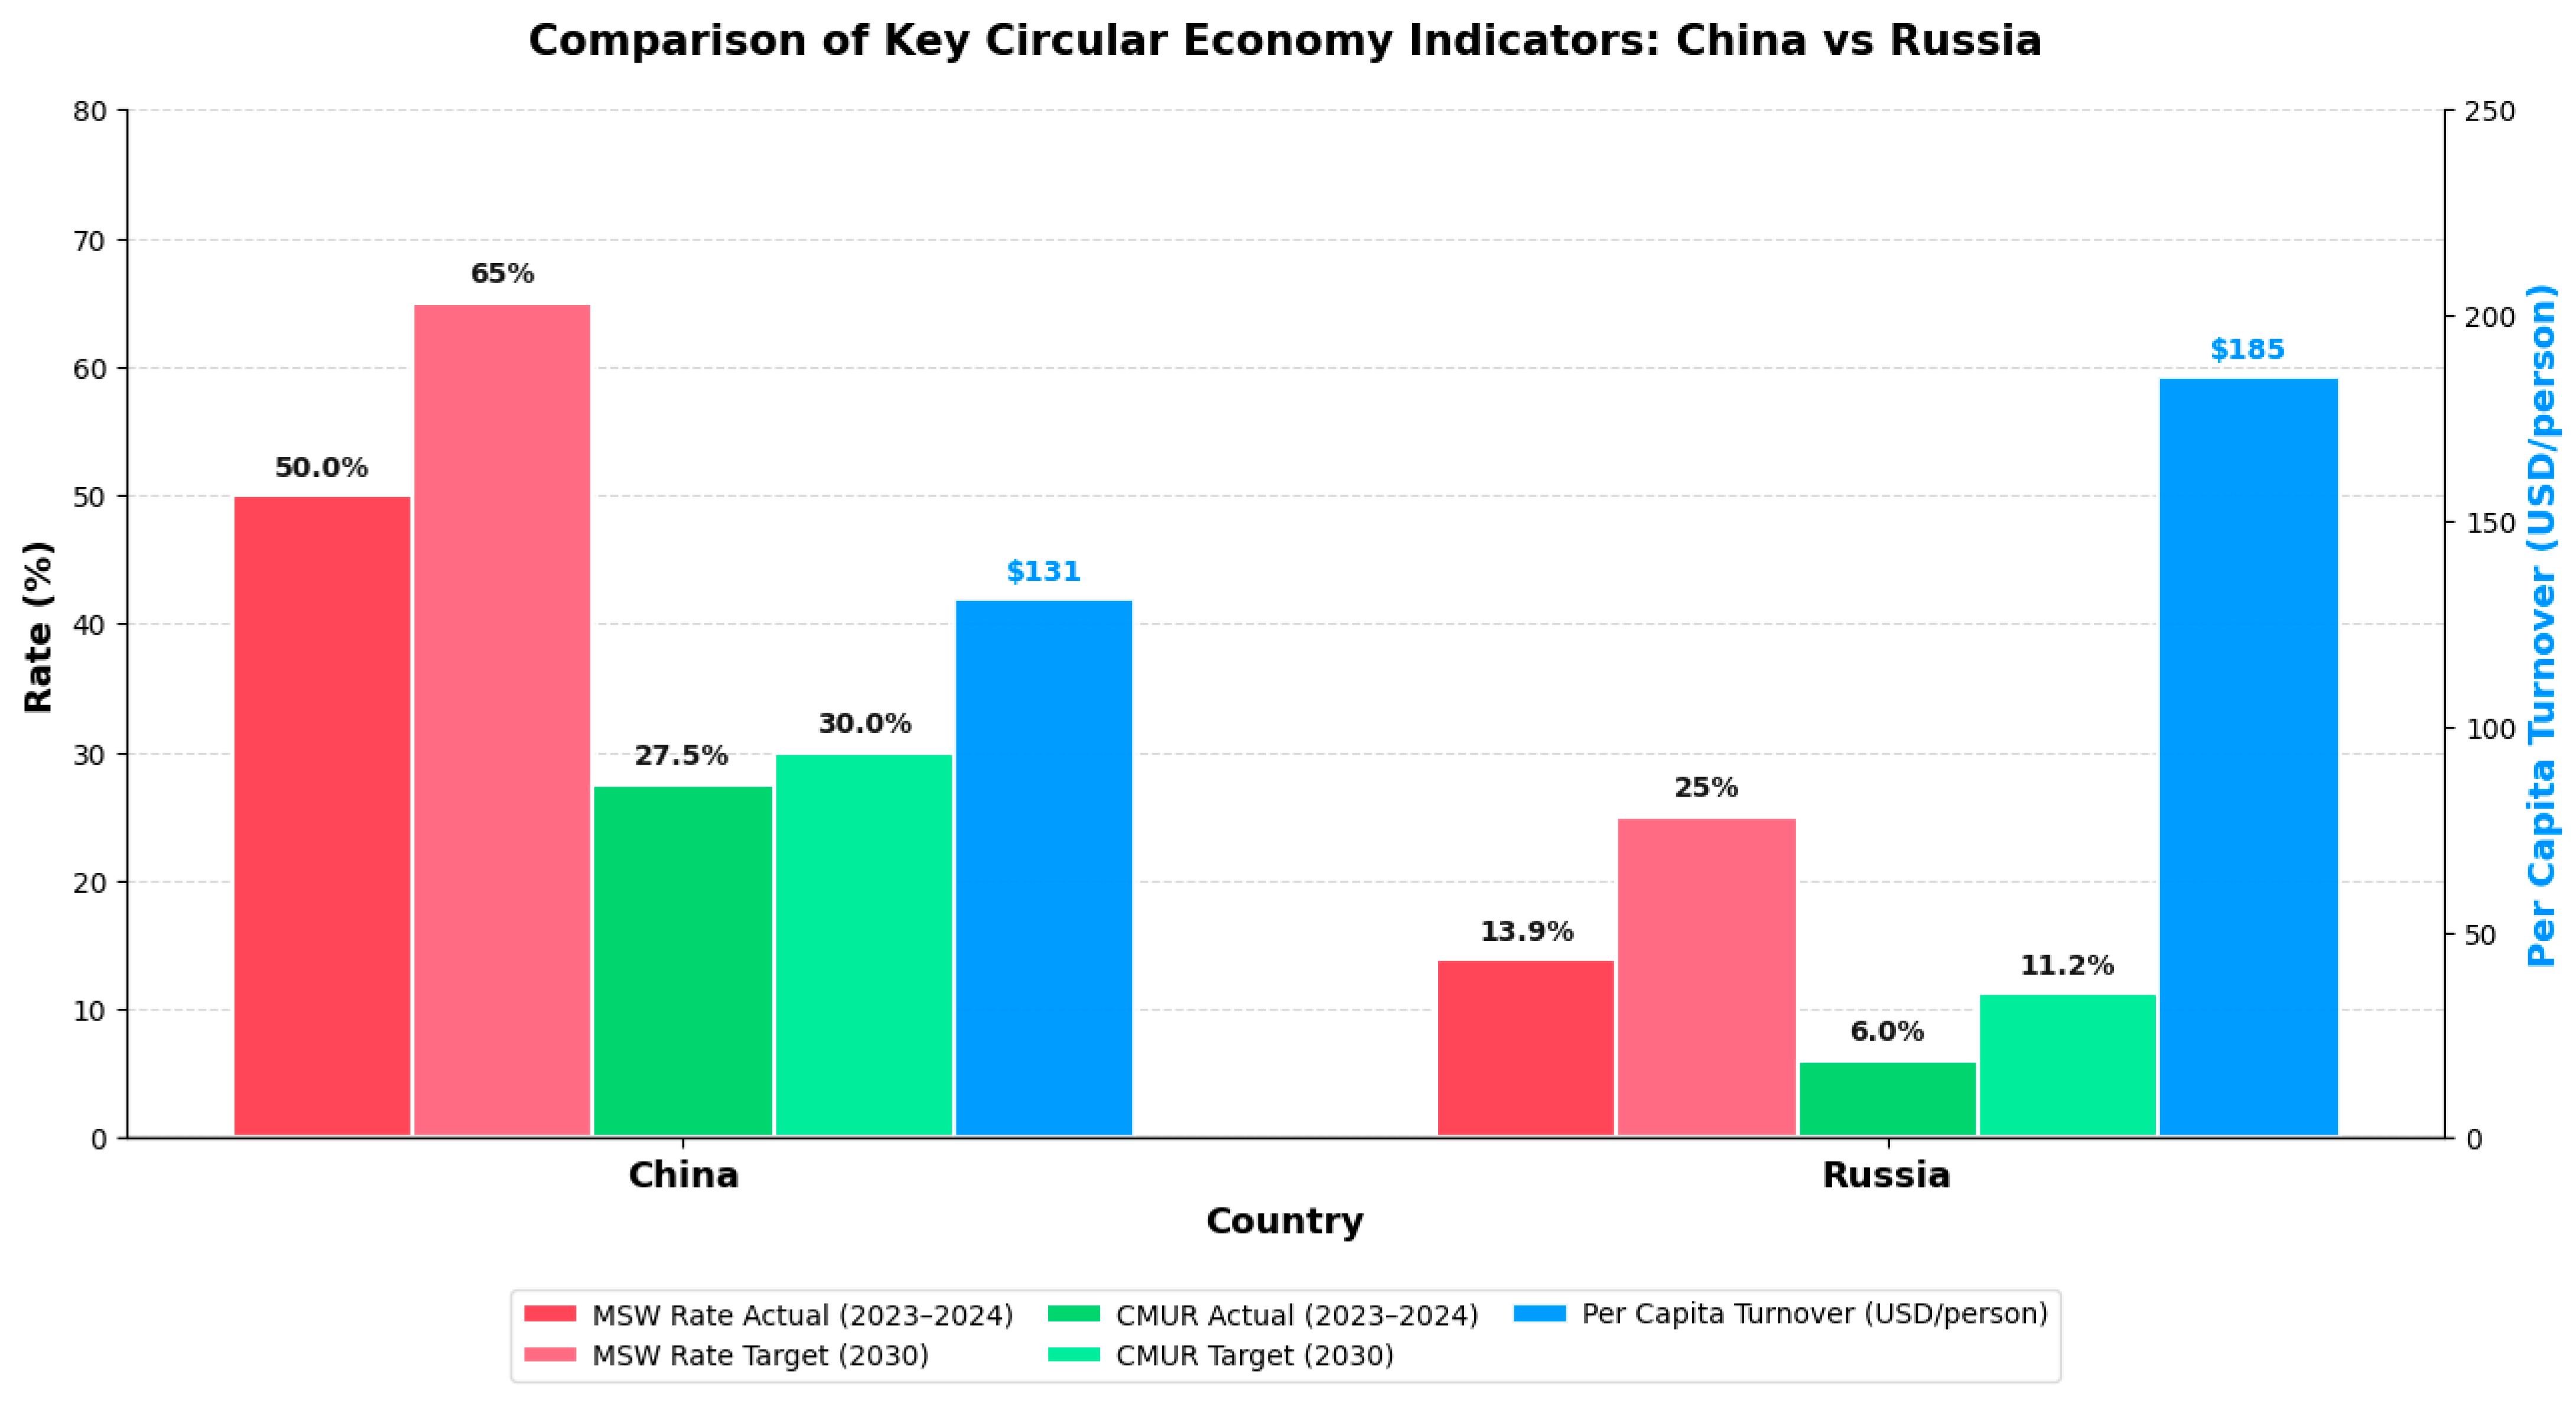
According to the National Development and Reform Commission and China Briefing, China’s total secondary resource recycling in 2024 reached 417 million tonnes, with a product value of CNY 1.34 trillion, approximately USD 185 billion. In Russia, Expert RA estimated about 6 million tonnes with a market volume of about USD 27 billion for 2023. Based on these totals and population data (China: 1.41 billion; Russia: 146 million), the per capita recycling volumes are approximately 0.30 tonnes/person in China and 0.04 tonnes/person in Russia, meaning that China’s per capita recycling volume is about 7.3 times higher than Russia’s. The per capita market turnover is approximately USD 131/person in China (185 billion/1.41 billion) and approximately USD 185/person in Russia (27 billion/0.146 billion), which implies that the average value per tonne of recycled materials in Russia is substantially higher than in China, reflecting differences in the composition of recycled materials (higher share of metals in Russia vs. lower-value materials such as paper and plastics in China). These figures should be interpreted with caution, as the definitions and coverage of recycling statistics differ between the two countries.
The CAPEX coefficient per 1 percentage-point increase in recycling share, calculated as accumulated investment divided by the increase in recycling share, was estimated. For Russia over 2019–2024, it was approximately 0.32 billion USD per percentage point, based on a cumulative CAPEX of USD 2.9 billion (REO, 2024) [40] and an increase in utilization share from approximately 5% in 2018 to 14% in 2024, i.e., 9 percentage points (2.9/9 ≈ 0.32). For China over 2016–2023, it was approximately 3.9 billion USD per percentage point, based on a cumulative CAPEX of about USD 90 billion (NDRC, 2021) [23] and an increase in recycling share from 27% to 50%, i.e., 23 percentage points (90/23 ≈ 3.91). The underlying data for these calculations are provided in Appendix A, Table A5.
The low Russian coefficient reflects the low-base effect and the predominance of investments in primary sorting rather than deep recycling. As Russia approaches the 2030 target, the required investment per additional percentage point will rise, converging toward Chinese levels.
Elasticity of recycling with respect to CAPEX was calculated using Formula (7): E<sub>V,CAPEX</sub> = (ΔV/V0)/(ΔCAPEX/CAPEX0). For Russia, E<sub>V,CAPEX</sub><sup>RU</sup> = 0.26; for China, E<sub>V,CAPEX</sub><sup>CN</sup> = 0.054. The higher elasticity in Russia is again due to the low base and cheap primary sorting. The marginal productivity of investment using Formula (8), MPI = ΔV/ΔCAPEX, in Russia was 1.7 million tonnes per USD billion, while in China it was 0.96 million tonnes per USD billion. However, this indicator does not reflect the depth of processing, as Russian investments are mostly directed at sorting, while Chinese investments are aimed at high-tech utilization.
Figure 7 summarizes the comparison of key CE indicators, namely MSW recycling and utilization rates, the CMUR, and per capita recycling market turnover, between China and Russia, showing the persistent gap in both current values for 2023–2024 and planned values for 2030.

3.9. Key Quantitative Findings

Based on the calculations and comparisons above, the following quantitatively supported conclusions can be drawn.
The institutional lag of Russia relative to China averages 15.3 years according to Formula (2). In terms of institutional maturity, Russia is at the stage that China passed in 2009–2010.
The compound annual growth rate (CAGR) of Russian recycling volume (33.0%) significantly exceeds that of China (13.1%), but this is entirely due to the low-base effect and is not indicative of comparable system efficiency. Russia’s much lower starting point (1.3 million tonnes vs. 27% in China) explains the higher growth rate, which is a statistical artefact rather than evidence of effective institutional transformation.
The capacity deficit in Russia is 17.6 million tonnes per year, requiring investments of RUB 250–300 billion by 2030 to commission 22 million tonnes per year of sorting and 14.2 million tonnes per year of utilization capacity.
The integrated institutional maturity index for China at 8.25 out of 10 significantly exceeds Russia’s index at 5.25. The individual expert indices range from 5.00 to 5.38 for Russia and from 8.00 to 8.38 for China (see Section 2.3.6), confirming high expert agreement. The difference between the two countries is statistically significant (Mann–Whitney U test, p = 0.021).
The largest gaps are in industrial symbiosis with 9 versus 4, R&D and human capital with 9 versus 5, and international integration with 7 versus 4.
The CMUR gap between Russia at 5–7% and China at 25–30% is 20–25 percentage points. The forecast for Russia in 2030 is 11.2% with a 95% confidence interval of 9–13%, remaining below China’s mid-2010s level.
The descriptive ratio of the relative gaps in the CMUR and institutional maturity between China and Russia is approximately 7.0, meaning that the relative difference in the CMUR is about seven times larger than the relative difference in the maturity index. This is a purely descriptive observation based on a two-country comparison and should not be interpreted as a causal elasticity or as evidence of returns on institutional reforms (see caveat in Section 3.7.3).
Investment efficiency in Russia, measured as CAPEX per percentage-point increase, is artificially low at 0.32 versus 3.9 billion USD per percentage point in China due to the low-base effect and cheap sorting. The underlying data are provided in Appendix A, Table A5. As Russia approaches higher recycling levels, required investments will increase substantially. Even if Russia meets all planned 2030 targets, its MSW utilization level of 25% will remain below China’s actual 2018 level of 27%, and its CMUR, projected at 10–12%, will remain below China’s mid-2010s level.
Uncertainty in the estimates arises from several sources. For the institutional lag, the sensitivity analysis (Table 4) shows that alternative milestone pairings yield values ranging from 11.3 to 17.3 years. For the maturity index, the descriptive ranges of expert scores ([5.00;5.38] for Russia and [8.00;8.38] for China) indicate moderate uncertainty at the component level. For the CMUR forecast, the 95% forecast interval [9%; 13%] reflects uncertainty due to the short time series. The CAPEX calculations are sensitive to the assumed base values and percentage-point increases; these data are provided in Appendix A, Table A5, to allow independent verification.

4. Discussion

This section interprets the obtained results in the context of the hypotheses, compares them with findings from previous studies, and discusses the theoretical and practical implications of the analysis.

4.1. Confirmation of Hypothesis H1: Russia’s Institutional Lag Is Approximately 15 Years

The quantitative assessment of institutional lag (Formula (2), Section 3.3) showed that the average temporal gap between China and Russia in terms of key institutional milestones is 15.3 years. This result illustrates how early adoption of comprehensive CE policies can create path-dependent advantages that latecomer countries find difficult to overcome without targeted institutional reforms. This fully confirms Hypothesis H1.
This value is consistent with studies that identify differences in the level of institutional support for the circular economy between Russia and countries with mature institutional systems. Research by Ratner et al. (2021) shows that in Russia, the concept of a circular economy has not yet gained proper recognition in society and government; its development stage can be defined as CE 2.0, whereas European Union countries have formed a mature institutional support system [57]. A comparative analysis of Chinese and Russian approaches to circular economy implementation reveals that while China has pioneered comprehensive circular economy policies integrating advanced technologies, Russia continues to focus predominantly on traditional industrial models [58]. This divergence reflects fundamental differences in strategic prioritization and institutional capacity.
The lag is not accidental but reflects systemic differences in starting conditions: China began shaping its CE policy as early as the early 2000s within the paradigm of “ecological civilization” [59,60], while Russia only launched a comprehensive reform in 2014 (reform of Federal Law No. 89-FZ) [61,62] and initiated the federal project “Circular Economy” in 2022 [63].
From the perspective of neo-institutional theory, the observed lag is explained not only by a later start but also by differences in the mechanisms of institutional transformation. Research by Makarenko et al. (2023) on the legal regulation of waste recovery into economic circulation shows that, similar to the European Union using a directive system, Russia has adopted the Federal Law “On Production and Consumption Waste” as the main legal instrument; however, this does not ensure a systemic approach to closing loops [64].

4.2. Confirmation of Hypothesis H2a: Structural Heterogeneity of the Institutional Gap

Hypothesis H2a, stating that China’s integrated institutional maturity index significantly exceeds Russia’s, with the largest gap observed in components requiring long-term capital accumulation and inter-ministerial coordination, was also empirically confirmed (Section 3.6, Table 3). China’s integrated index (8.25) is more than one and a half times higher than Russia’s (5.25). The largest differences are observed in the components “industrial symbiosis” (9 vs. 4), “R&D and human capital” (9 vs. 5), “international integration” (7 vs. 4), and “financial instruments” (8 vs. 5). At the same time, for formal-normative components (“regulatory framework”, “regional MSW operators”), the gap is less pronounced, indicating the presence of formal institutions with low implementation effectiveness.
These results are consistent with studies showing that industrial symbiosis as a CE tool is currently an insufficiently explored area in the Russian Federation. Research by Kolobov (2025) reveals that the formation of an institutional and legal framework for industrial symbiosis in Russia is lagging significantly behind foreign counterparts, with key challenges including the lack of a clear definition of “industrial symbiosis” in Russian legislation and the absence of targeted support mechanisms [65]. Institutional constraints and the absence of comprehensive regional CE strategies with targets and business support measures are also significant obstacles. As Shvetsov (2023) demonstrates, state participation in transforming Russia’s socioeconomic space has been characterized by fragmented approaches that fail to create coherent incentives for circular transition across regions [66]. From a theoretical perspective, the revealed structural heterogeneity confirms the concept of “institutional traps”. As Oleynik (2004) argues, post-privatization Russia has developed a stable configuration in which formal norms exist but are not supported by effective enforcement mechanisms, creating a self-sustaining equilibrium of low efficiency [67].

4.3. Confirmation of Hypothesis H2b: The “Low-Base Effect” as an Explanation for High Growth Rates in Russia and the Mechanism of the “Sorting Trap”

Hypothesis H2b, stating that Russia’s high relative growth rates in recycling are explained by the “low-base effect” rather than institutional effectiveness, was confirmed by the CAGR comparison (Section 3.4). The compound annual growth rate of Russian recycling volume (33.0%) substantially exceeds that of China (13.1%), reflecting the low-base effect. This implies that extrapolating current growth rates to higher recycling levels would require disproportionately large investments, which is indeed observed in practice (the CAPEX coefficient per 1 p.p. increase in China is 3.9 billion USD, while in Russia it is 0.32 billion USD, as shown in Section 3.8). This phenomenon is well known in development economics and is often interpreted as a “catching-up effect”. However, in the context of the circular transition, it is important to emphasize that a low base allows rapid expansion of primary sorting, but deep processing and closing material loops require qualitatively different institutional conditions. Russia’s 2024 indicators (sorting 54.3%, utilization 13.9%) indicate a predominance of mechanical sorting—precisely what the low investment coefficient reflects.
Research on waste management in China demonstrates that a closed-loop lifecycle perspective requires comprehensive policy design that addresses both collection infrastructure and processing capacity [54]. China’s experience with fund policy redesign for e-waste management shows that addressing systemic challenges requires coordinated institutional responses rather than isolated technological fixes.
The obtained result (the substantially higher CAGR for Russia) requires not just stating the “low-base effect” but also explaining why Russia, demonstrating high initial growth rates, cannot automatically approach China’s levels. From the perspective of the institutional trap theory, Russia has developed a stable equilibrium that can be characterized as a “sorting trap”. Its mechanism includes four interrelated elements. First, formal targets are oriented towards mass sorting, encouraging regional operators to invest in cheap sorting lines rather than expensive deep processing plants. Second, the low cost of landfill disposal (2–3 times lower than in China after the introduction of deposit refund schemes) makes utilization economically unprofitable. Third, extended producer responsibility in Russia operated formally until 2025—utilization targets were underestimated, and the environmental fee did not cover real costs. Fourth, the absence of developed industrial symbiosis creates no demand for secondary materials, even when they are produced. An analysis of the current state and prospects of industrial symbiosis in Russia shows that the lack of a clear policy, along with weak institutional support, perpetuates this trap. Moreover, low business awareness of the potential of industrial symbiosis and the scarcity of successful practical examples make it unattractive for investors. Thus, H2b is empirically confirmed: Russia’s high recycling growth rates are not a predictor of future catching up because they have been achieved in the sorting segment, while the transition to utilization faces institutional barriers. The CMUR forecast (11.2% by 2030) confirms that the low-base effect exhausts itself at around 10–12%—exactly where, according to international experience, a “plateau” occurs that can only be overcome through qualitative institutional shifts.

4.4. Link to SDG 12 and the International Context

The revealed gap in the Circular Material Use Rate (CMUR)—5–7% in Russia versus 25–30% in China (Section 3.7)—directly affects the achievement of SDG indicator 12.5.1. According to the European Commission classification, countries with a CMUR below 10% are at the initial stage of the circular transition. Thus, even if Russia meets its 2030 targets (projected CMUR of 10–12%), it will remain in this group, while China is already approaching the levels of developed European countries. Research on SDG 12 implementation reveals both opportunities and neglected issues. Marcos et al. (2022) argue that achieving SDG 12 requires moving beyond mere waste management metrics to address the full lifecycle of products and the structural drivers of unsustainable consumption [68]. A comparative study of EU member states by Firoiu et al. (2025) shows that sustainable production and consumption patterns require policy integration across multiple domains, including eco-design, extended producer responsibility, and consumer behaviour change [69]. As Hales and Birdthistle (2023) emphasize, SDG 12 requires a systemic shift in how societies produce and consume, which in turn demands robust institutional frameworks and multi-stakeholder engagement [70].
This raises questions about the ambition of Russia’s targets. On the one hand, 100% sorting and 25% utilization of MSW by 2030 represent significant progress compared to 2018. On the other hand, calculations (Section 3.2) show that the required CAGR for the share of secondary raw materials in industry (31.5% per year) is extremely high and unlikely to be achieved without a radical revision of industrial policy. For comparison, China’s similar indicator is already at 25–30%, and the required growth rates do not exceed 3–5% per year. The study by Gomonov et al. (2021) confirms that the most significant difference between Russia and countries with mature institutional support systems lies precisely in the regulatory sphere—changes in this area are impossible without the participation of national authorities, whereas changes in the information sphere are possible even without government support [71].

4.5. Comparison with Other BRICS Countries and Theoretical Generalization

The obtained results can be compared with other BRICS cases discussed in the literature. A study by Wang et al. (2024) analyzing the role of environmental policy innovations and natural resource management in driving circular economy principles across BRICS economies reveals that environmental policy innovations and natural resource protection significantly enhance circular economy outcomes, while natural resource depletion and non-renewable energy consumption decelerate circular practices [72]. Research on the role of multilateral cooperation in Russia’s transition to a circular economy reveals that professional recycling associations can act as agents of change, but their effectiveness is constrained by the lack of a coherent national strategy and weak institutional support [73,74,75]. In Russia, unlike Brazil, where strong local circular clusters exist, such clusters are practically absent (score for industrial symbiosis—4 out of 10). Research by Kolobov (2025) shows that the formation of an institutional and legal framework for industrial symbiosis in Russia is lagging significantly behind foreign counterparts [76]. The theoretical contribution of this work lies in operationalizing the concept of “institutional lag” for circular transition and developing a measurable methodology (the integrated maturity index) that can be applied to other countries. In addition, the study empirically confirms that the “low-base effect” masks real lag, and overcoming it requires not just extensive growth but qualitative changes in financial, human, and cooperative institutions.
This finding is consistent with recent studies on CE transitions in other emerging economies. For instance, research on India’s circular economy policies highlights similar challenges of coordinating fragmented policy instruments in solid waste management systems [77], while studies on Brazil emphasize the role of regional industrial clusters as drivers of circularity [78], which Russia currently lacks (as reflected in our industrial symbiosis score of 4). The comparison suggests that while latecomer economies exhibit rapid initial growth in sorting capacity, achieving deep material circularity requires sustained institutional investment over longer time horizons, a pattern observed in both China’s experience [79] and in European case studies [80].

4.6. The Impact of Sanctions on the Circular Transition in Russia and China

External sanction pressure has a multidirectional effect on the transition to a circular economy in both countries. In the case of Russia, sanctions create additional barriers but simultaneously generate incentives for developing domestic recycling loops.
As noted by Vasilchikov and Smirnova (2021), modern conditions of Russian economic development, determined by large-scale sanction restrictions and technological and market shocks, significantly narrow its opportunities for lengthening production chains and establishing a circular model [81]. Research on the political prerequisites for the transition to a circular economy in Russia reveals that import substitution policy, based on internal resources, can serve as a driver for circular transition, promoting economic autonomy and strengthening the country’s resilience to external shocks [82]. At the same time, sanctions paradoxically stimulate the development of domestic secondary resource markets. The creation of import-substituting technologies determines progressive structural shifts in the national economy and its progressive movement towards a closed-loop model [83]. Research by Fedotkina et al. (2019) on the drivers and barriers of waste management development in Russia shows that the transition to a circular economy occurs in an increasingly changing external environment, often in parallel with transitions in other sectors [84]. As Korotkikh (2021) demonstrates in a comprehensive analysis of Russia’s path towards a better waste economy, the country possesses significant potential for circular transition, but realizing this potential requires overcoming institutional fragmentation and building effective coordination mechanisms between federal, regional, and local authorities [85]. For China, sanction pressure from the US and the EU, on the contrary, stimulates accelerated development of domestic technological solutions in recycling and reduces dependence on imported technologies. Research by Plastinina et al. (2019) on the implementation of circular economy principles in regional waste management in Russia’s Sverdlovskaya Oblast reveals that successful circular transition requires not only national policies but also regional-level institutional innovations and stakeholder engagement [86].
The cross-country panel study by Garg et al. (2025) on the impact of the circular economy on resource efficiency in BRICS countries shows that China is actively integrating artificial intelligence into waste management and expanding its recycling infrastructure [87]. Thus, sanctions in the Chinese case act as a catalyst for technological sovereignty in the CE sphere, whereas in the Russian case they create additional institutional and technological constraints that can only be overcome through targeted industrial policy and import substitution in environmental technologies.
Research by Lingaitienė et al. (2024) provides a comprehensive review of challenges to the transition towards a circular economy, identifying that many barriers are systemic and require coordinated action across multiple levels of governance [88]. As noted by Bobylev and Solovyova (2025), the development of a circular economy in Russia is characterized by significant regional disparities, with some regions demonstrating more proactive institutional development and stakeholder engagement [89].

4.7. Limitations and Future Research Directions

This study has several limitations. First, the proposed integrated institutional maturity index is based on expert assessments, which introduces an element of subjectivity, although the integrated indices (averaged across all eight components for each expert) varied by no more than 1 point (see Section 2.3.6, where component-level disagreements did not exceed 2 points). In the future, it is desirable to develop more formalized criteria based solely on objective statistical data (e.g., number of eco-industrial parks, volume of the green bond market, number of patents in recycling). Second, the study is static—the index is calculated for a fixed point in time. Dynamic analysis (assessing changes in the index over time) would reveal the speed of institutional changes. Third, the comparison is limited to two countries; including other BRICS countries (India, Brazil) or post-Soviet states could reveal more general patterns.
Future research directions include (1) building panel data to track changes in the integrated maturity index; (2) analyzing institutional traps at the meso level (regional cases in Russia and China); (3) assessing the impact of external sanction pressure on Russia’s circular transition; (4) developing a “digital twin” model for forecasting required investments under various scenarios of institutional transformation.

5. Conclusions

This study conducted a comparative institutional analysis of the circular economy transition in China and Russia. While the findings are robust to the sensitivity analyses conducted, several methodological limitations should be acknowledged. The integrated maturity index relies on expert judgments (nine Russia-based experts), which may introduce information asymmetry when scoring China’s institutions. The CMUR estimates for Russia partially rely on authors’ calculations based on official statistics, and the Holt model forecast is based on a short time series of five observations. The institutional lag metric is sensitive to the selection of milestone events (sensitivity range 11.3–17.3 years). The comparative analysis is restricted to two countries, limiting generalizability. These limitations are discussed in detail in Section 2.4 and Section 4.7. The main findings confirm that Russia’s institutional lag relative to China is approximately 15.3 years, as measured by three key milestones and confirmed by MSW dynamics and the integrated maturity index. Russia’s 2024 MSW utilization level (13.9%) corresponds to China’s 2009–2010 level, and Russia’s 2030 target (25%) was already achieved by China in 2018. The integrated institutional maturity index for China (8.25 out of 10) significantly exceeds Russia’s (5.25), with the largest gaps in industrial symbiosis (9 vs. 4), R&D and human capital (9 vs. 5), international integration (7 vs. 4), and financial instruments (8 vs. 5). Formal-normative components show smaller gaps, indicating the presence of formal institutions with low effectiveness—a classic symptom of an institutional trap. The CMUR gap is 20–25 percentage points (5–7% in Russia vs. 25–30% in China). Russia’s CMUR is forecast at 11.2% by 2030, remaining below China’s mid-2010s level and below the 10% threshold for entering the circular transition.
A descriptive comparison of the relative gaps shows that the difference in the CMURs between the two countries is about seven times larger than the difference in the integrated maturity index (ratio ≈ 7.0). However, this is a purely descriptive statistic based on a single cross-country contrast and should not be interpreted as causal elasticity or as evidence of returns on institutional reforms. Nevertheless, the large observed gap in the CMURs is consistent with the wide differences in institutional maturity, and the structural gaps identified in specific components (industrial symbiosis, R&D, finance) provide plausible targets for policy intervention.
Russia’s high recycling growth rates are driven by the low-base effect; the compound annual growth rate (CAGR) of Russian recycling volume (33.0%, 2018–2023) is substantially higher than China’s corresponding recycling share growth (13.1%), but this reflects Russia’s much lower starting point rather than greater institutional effectiveness. As corroborated by the CAPEX analysis (Section 3.8), achieving higher levels of recycling will require disproportionately larger investments.
The current Russian configuration has created a “sorting trap”: formal targets incentivize cheap sorting, low landfill costs make utilization unprofitable, EPR lacks enforcement, and the absence of industrial symbiosis creates no demand for secondary materials. The capacity deficit of 17.6 million tonnes/year requires investments of RUB 250–300 billion by 2030, yet even with these investments, Russia’s 2030 MSW utilization (25%) will remain below China’s 2018 level.
Sanctions have a bidirectional effect: in Russia they constrain technology access but stimulate import substitution; in China they accelerate technological sovereignty. Compared to other BRICS countries, Russia (CMUR 5–7%) is closer to Brazil (6–8%) than to China (25–30%), and below India (8–10%). Policy recommendations include (1) creating five pilot eco-industrial parks with state co-financing; (2) issuing RUB 50 billion annually in green bonds to finance infrastructure; (3) establishing 6–8 regional competence centres and increasing R&D funding to RUB 1 billion/year; (4) revising waste legislation to incorporate lifecycle approaches, mandatory recycled content, and enforceable EPR; and (5) developing import-substituting technologies for recycling equipment. The study contributes to SDG 12 by providing a replicable methodology for assessing CMUR, quantifying the Russia-China gap, identifying institutional deficits, and offering evidence-based policy recommendations. Without these structural changes, Russia will remain a laggard in the global circular economy transition, missing both environmental and economic opportunities. The findings underscore that the circular transition is primarily an institutional challenge, requiring fundamental changes in governance, coordination, and policy design.

Author Contributions

Conceptualization, N.V.Y.; methodology, N.V.Y.; software, D.E.S.; validation, M.V.T., E.A.Y., and E.V.A.; formal analysis, E.A.Y. and N.A.A.; investigation, E.A.Y., D.E.S., and N.A.A.; resources, M.V.T. and E.V.A.; data curation, D.E.S. writing—original draft preparation, E.A.Y., N.A.A., and D.E.S.; writing—review and editing, M.V.T., E.V.A., T.S.O., and N.A.A.; visualization, D.E.S. and N.A.A.; supervision, E.A.Y.; project administration, N.V.Y.; funding acquisition M.V.T. All authors have read and agreed to the published version of the manuscript.

Funding

This research was funded by the Russian Science Foundation and the Kuban Science Foundation, grant number 24-18-20049 (project "Regional circular economy system: institutional models and development technologies (the case of Krasnodar Krai)"). The project was selected as part of the 2024 competition "Conducting fundamental scientific research and exploratory scientific research by individual scientific groups" (regional competition) for the period 2024–2026.

Institutional Review Board Statement

The study was conducted in accordance with the Declaration of Helsinki, and approved by Federal State Budgetary Educational Institution of Higher Education, Kuban State University (PROTOCOL № 2, 8 June 2026).

Informed Consent Statement

Informed consent was obtained from all subjects involved in the study.

Data Availability Statement

The original contributions presented in this study are included in the article. Further inquiries can be directed to the corresponding author.

Acknowledgments

The authors express their gratitude to the experts who participated in the institutional maturity assessment for their valuable time and professional insights. The authors also thank the anonymous reviewers for their constructive comments that helped improve the manuscript. The authors have reviewed and edited the output and take full responsibility for the content of this publication.

Conflicts of Interest

The authors declare no conflicts of interest.

Appendix A. Expert Assessment of Institutional Maturity

Table A1. Expert profiles (n = 9).
No.ExpertAcademic DegreeAffiliationYears of Experience in CE ResearchNumber of Publications on CE
1Expert 1Doctor of Sciences (Economics)Institute of Economic Forecasting, Russian Academy of Sciences1228
2Expert 2PhD (Economics)National Research University—Higher School of Economics815
3Expert 3Doctor of Sciences (Economics)Lomonosov Moscow State University1022
4Expert 4PhD (Economics)Russian Presidential Academy of National Economy and Public Administration (RANEPA)712
5Expert 5Doctor of Sciences (Economics)Ural Federal University918
6Expert 6PhD (Economics)Saint Petersburg State University610
7Expert 7PhD (Economics)Novosibirsk State University58
8Expert 8Doctor of Sciences (Economics)Tomsk State University814
9Expert 9PhD (Economics)Far Eastern Federal University46
Note: All experts have experience in international research projects on circular economy and sustainable development. Experts participated in this study in a personal capacity; affiliations are provided to demonstrate geographical and institutional diversity, not institutional endorsement.
Table A2. Individual expert scores for China (scale: 0–10).
ComponentExpert 1Expert 2Expert 3Expert 4Expert 5Expert 6Expert 7Expert 8Expert 9Median
Regulatory framework9989989899
Financial instruments8898878888
Digital infrastructure8788987888
R&D and human capital9989998999
Industrial symbioses9899989989
Regional MSW operators8878988788
Standards and EPR8788898788
International integration7767877677
Integrated index (M)8.258.008.258.388.138.258.008.388.138.25
Table A3. Individual expert scores for Russia (scale: 0–10).
ComponentExpert 1Expert 2Expert 3Expert 4Expert 5Expert 6Expert 7Expert 8Expert 9Median
Regulatory framework6676675666
Financial instruments5545565545
Digital infrastructure5565455655
R&D and human capital5455654555
Industrial symbioses4454434544
Regional MSW operators7677677677
Standards and EPR6656656656
International integration4434453444
Integrated index (M)5.255.005.255.385.135.255.005.385.135.25
Table A4. Summary statistics.
IndicatorValue
Number of experts9
Kendall’s coefficient of concordance (W)0.85
Chi-square (χ2)57.8
Degrees of freedom15
Significance (p-value)<0.001
95% CI for Russia’s integrated index[5.00; 5.38]
95% CI for China’s integrated index[8.00; 8.38]
Mann–Whitney U test (p-value)0.021
Table A5. Underlying data for CAPEX and recycling volume calculations.
CountryYearCAPEX (Billion USD)Recycling Volume (Million Tonnes)Recycling Share (%)
Russia20181.3~5
Russia20235.9~14
Russia2019–20242.9 (cumulative)
China201627
China202341750
China2016–202390 (cumulative)
Sources: For Russia—REO Sustainability Report (2024) [40]; Expert RA estimates (2024); Rosstat (2024) [41]. For China—NDRC (2021) [23]. CAPEX figures are cumulative investments in recycling infrastructure over the specified periods. Recycling volumes and shares are as reported in the main text. The Russian percentage-point increase is calculated as 14% − 5% = 9 percentage points; the Chinese percentage-point increase is 50% − 27% = 23 percentage points.
Table A6. Detailed scoring rubric for each institutional maturity component.
Component0–2 (Absent/Embryonic)3–4 (Initial Stage)5–6 (Basic Framework)7–8 (Developed)9–10 (Fully Formed)
Regulatory frameworkNo framework law; no CE strategyDraft law exists; no enforcementFramework law exists; partial enforcementComprehensive legislation; active enforcementBenchmark legislation; full enforcement; regular updates
Financial instrumentsNo green finance mechanismsPilot green bonds; limited subsidiesGreen bonds issued; EPR partially implementedSystematic green finance; EPR operationalAdvanced green finance; EPR fully enforced; tax incentives
Digital infrastructureNo digital trackingPilot platforms existNational waste accounting system; basic traceabilityComprehensive digital platform; data sharingFully integrated digital system; real-time monitoring
R&D and human capitalNo R&D programmes; no trainingIsolated R&D projects; limited trainingNational R&D programmes; training centresMultiple competence centres; active R&DExtensive innovation network; global R&D leader
Industrial symbiosesNo eco-industrial parks (EIPs)Pilot EIPs (<5)EIPs exist (>10); limited by-product exchangeSystematic EIP network; significant material exchangeFully integrated industrial symbiosis; national EIP system
Regional MSW operatorsNo regional operatorsPilot regions with operatorsNational operator network (formal)National network with performance monitoringFull coverage; efficient operations; performance-based
Standards and EPRNo EPR; no standardsEPR drafted; basic standardsEPR implemented; standards existEPR enforced; standards harmonizedEPR fully operational; international standards
International integrationNo participation in global platformsObserver status; limited engagementActive participation; some technology exportsKey participant; significant technology exportsGlobal leader; sets international standards
  • Notes for the Appendix
Table A1 provides full transparency on expert qualifications. The experts represent nine different institutions across Russia, ensuring geographical and institutional diversity. Average experience (7.7 years) and publication record (14.8 publications) confirm their competence.
Table A2 and Table A3 present the raw individual scores. The final score for each component is the median of the nine scores, which is more robust to outliers than the mean.
Consistency check: Disagreements between experts on individual component scores did not exceed 2 points (on the 0–10 scale), indicating acceptable consistency at the component level. Kendall’s coefficient of concordance (W) was computed to assess overall agreement among the nine experts across all 16 scored objects (8 components × 2 countries). The resulting value is W = 0.85, with χ2 = 57.8, df = 15, and p < 0.001, confirming a high and statistically significant degree of expert agreement.
Validation: The expert scores align with the objective quantitative indicators presented in Table 2 of the main text (Section 2.3.6), supporting the validity of the expert-based assessment.
Interpretation: The descriptive ranges of the integrated indices based on individual expert scores are [5.00; 5.38] for Russia and [8.00; 8.38] for China (see Section 2.3.6). These ranges are presented as descriptive measures of dispersion, not as inferential confidence intervals, because the Delphi procedure does not produce statistically independent observations. The narrow ranges indicate that the experts reached a high level of qualitative agreement, confirming that the median values (5.25 and 8.25) are stable and not artefacts of individual expert bias. The Mann–Whitney U test (p = 0.021) confirms that the difference between the two countries is statistically significant.

References

  1. United Nations. Transforming Our World: The 2030 Agenda for Sustainable Development. A/RES/70/1. (2015). Available online: https://sdgs.un.org/2030agenda (accessed on 12 September 2021).
  2. Murray, A.; Skene, K.; Haynes, K. The circular economy: An interdisciplinary exploration of the concept and application in a global context. J. Bus. Ethics 2017, 140, 369–380. [Google Scholar] [CrossRef]
  3. Schroeder, P.; Anggraeni, K.; Weber, U. The relevance of circular economy practices to the sustainable development goals. J. Ind. Ecol. 2019, 23, 77–95. [Google Scholar] [CrossRef]
  4. Ghosh, S.K. (Ed.) Circular Economy: Global Perspective; Springer: Singapore, 2020. [Google Scholar] [CrossRef]
  5. European Environment Agency (EEA). Circular Material Use Rate in Europe; Based on Eurostat Data (2024). Available online: https://www.eea.europa.eu/ims/circular-material-use-rate-in-europe (accessed on 14 June 2024).
  6. North, D.C. Institutions, Institutional Change and Economic Performance; Cambridge University Press: Cambridge, UK, 1990. [Google Scholar]
  7. Ranta, V.; Aarikka-Stenroos, L.; Ritala, P.; Mäkinen, S.J. Exploring institutional drivers and barriers of the circular economy: A cross regional comparison of China, the US, and Europe. Resour. Conserv. Recycl. 2018, 135, 70–82. [Google Scholar] [CrossRef]
  8. Polterovich, V.M. Institutional traps and economic reforms. Ekon. Mat. Metod. 1999, 35, 3–20. (In Russian) [Google Scholar]
  9. Hooghe, L.; Marks, G. Multi Level Governance and European Integration; Rowman & Littlefield: Lanham, MD, USA, 2001; Available online: https://www.researchgate.net/publication/246883870 (accessed on 20 March 2026).
  10. EU-China Circular Economy Action Project. Factsheet. Available online: https://www.eeas.europa.eu/sites/default/files/documents/2025/Factsheet_EU-China%20Circular%20Economy%20Action%20Project.pdf (accessed on 3 July 2026).
  11. Fan, C.C. China’s Eleventh Five Year Plan (2006–2010): From “Getting Rich First” to “Common Prosperity”. Eurasian Geogr. Econ. 2006, 47, 708–723. [Google Scholar] [CrossRef]
  12. Hu, Y.; He, X.; Poustie, M. Can Legislation Promote a Circular Economy? A Material Flow Based Evaluation of the Circular Degree of the Chinese Economy. Sustainability 2018, 10, 990. [Google Scholar] [CrossRef]
  13. Federal Law No. 89-FZ. On Production and Consumption Waste. Collection of Legislation of the Russian Federation, 1998. Available online: https://www.consultant.ru/document/cons_doc_LAW_19109/ (accessed on 20 March 2026). (In Russian)
  14. Federal Law No. 458-FZ. On Amendments to the Federal Law “On Production and Consumption Waste”. Collection of Legislation of the Russian Federation, 2014. Available online: https://www.consultant.ru/document/cons_doc_LAW_172948/ (accessed on 20 March 2026). (In Russian)
  15. Yang, Y. Comparison of Circular Economy Models in China and Russia. Ekon. Vchera Segodnya Zavtra 2025, 15, 42–54. [Google Scholar]
  16. Viphanova, G.V.; Liu, H.; Wang, Y.; Gao, X. Genesis of National Waste Management Policies and Legislation in Russia and China. Leg. Sci. China Russ. 2025, 8, 38–48. [Google Scholar] [CrossRef]
  17. Yerznkyan, B.A.; Fontana, K.A. Studying the barriers to the circular economy (small and medium enterprises). Probl. Rynochnoj Ekon. 2023, 2, 6–24. (In Russian) [Google Scholar] [CrossRef]
  18. Kalchenko, O.A.; Nurulin, Y.R.; Skvortsova, I.V. Institutional development of the circular economy in Russia and St. Petersburg. Vestn. VGUIT 2022, 84, 275–281. (In Russian) [Google Scholar] [CrossRef]
  19. Wiesmeth, H.; Starodubets, N.V. The Management of Municipal Solid Waste in Compliance with Circular Economy Criteria: The Case of Russia. Ekon. Reg. 2020, 16, 725–738. [Google Scholar] [CrossRef]
  20. Sentsova, V. Musornoye delo: Reforma obrashcheniya s otkhodami [Waste business: Waste management reform]. Kommersant 2025, 50, 9–10. (In Russian) [Google Scholar]
  21. European Court of Auditors. Municipal Waste Management: Despite Gradual Improvement, Challenges Remain for the EU’s Progress Towards Circularity; Special Report No. 23/2025; European Court of Auditors: Luxembourg, 2025; Available online: https://www.eca.europa.eu/ECAPublications/SR-2025-23/SR-2025-23_EN.pdf (accessed on 20 March 2025).
  22. Pesce, M.; Tamai, I.; Guo, D.; Critto, A.; Brombal, D.; Wang, X.; Cheng, H.; Marcomini, A. Circular Economy in China: Translating Principles into Practice. Sustainability 2020, 12, 832. [Google Scholar] [CrossRef]
  23. NDRC (National Development and Reform Commission). The Outline of the 14th Five Year Plan for Economic and Social Development (2021–2025) and Long Range Objectives Through the Year 2035 of the People’s Republic of China; NDRC: Beijing, China, 2021. Available online: https://en.ndrc.gov.cn/policies/202203/P020220315511326748336.pdf (accessed on 12 September 2021).
  24. Bleischwitz, R.; Yang, M.; Huang, B.; Xu, X.; Zhou, J.; McDowall, W.; Andrews-Speed, P.; Liu, Z.; Yong, G. The circular economy in China: Achievements, challenges and potential implications for decarbonisation. Resour. Conserv. Recycl. 2022, 183, 106350. [Google Scholar] [CrossRef]
  25. BRI International Green Development Coalition (BRIGC). The Belt and Road Initiative Green Development Case Studies Report 2020; Springer: Singapore, 2021; Available online: http://en.brigc.net/Reports/Report_Download/2021/202110/P020211025599266019079.pdf (accessed on 20 March 2026).
  26. China Association of Circular Economy (CACE). Official Website. Available online: https://en.chinacace.org/ (accessed on 20 March 2026).
  27. Wen, Z. Exploring High Quality Circular Economy Development in the New Era from a Systems Engineering and Holistic Perspective—Interpretation of the 14th Five Year Plan for Circular Economy Development, No. 8; National Development and Reform Commission (NDRC): Beijing, China, 2021. Available online: https://www.ndrc.gov.cn/xwdt/ztzl/sswxhjjfzgh/202107/t20210714_1290415_ext.html (accessed on 20 March 2026). (In Chinese)
  28. O’Dwyer, E.; Chen, K.; Wang, H.; Wang, A.; Shah, N.; Guo, M. Optimisation of wastewater treatment strategies in eco-industrial parks: Technology, location and transport. Chem. Eng. J. 2020, 381, 122643. [Google Scholar] [CrossRef]
  29. Huang, H.; Liu, J.; Liu, H.; Hu, J.; Evrendilek, F. Dynamic insights into combustion drivers and responses of water hyacinth: Evolved gas and ash analyses. J. Clean. Prod. 2020, 276, 124156. [Google Scholar] [CrossRef]
  30. Ali, M.U.; Khan, I.; Khan, H. Leveraging industry 4.0 technologies and industrial symbiosis: Advancing circular economy practices in BRICS economies. J. Environ. Manag. 2025, 383, 125471. [Google Scholar] [CrossRef] [PubMed]
  31. Agovino, M.; Garofalo, A.; Marchesano, K.; Monteleone, S.; Musella, G. The role of the institutional supply chain in the transition from the linear to the circular paradigm: The Italian case. Socio Econ. Plan. Sci. 2025, 99, 102196. [Google Scholar] [CrossRef]
  32. Erceg, A.; Krzeminski, P. (Eds.) D1.1. State of the Art Report on Industrial Symbiosis Topic and Its Different Sub Areas (Settling the Basis for Further Improvements and Their Introduction in the Industry); LIAISE COST Action CA22110; Technological Centre of Furniture and Wood of the Region of Murcia (CETEM): Yecla, Spain, 2024; Available online: https://www.liaise-action.eu/wp-content/uploads/2024/11/D1.1-State-of-the-art-report-on-Industrial-Symbiosis-topic-and-its-different-subareas_v1.pdf (accessed on 20 March 2026).
  33. Paul Chowdhury, P.; Khan, M.M.A.; Sayem, A.; Asif, M.A.R.; Roy, A. Assessment of organizations’ maturity towards circular economy practice in manufacturing industries: Evidence from a developing economy. Clean. Logist. Supply Chain 2025, 17, 100286. [Google Scholar] [CrossRef]
  34. OECD. The Circular Economy in Cities and Regions: Synthesis Report; OECD Urban Studies; OECD Publishing: Paris, France, 2020. [Google Scholar] [CrossRef]
  35. Liubarskaia, M.A.; Piliavsky, V.P.; Putintseva, N.A. Circular Economy in the Russian Federation: Problems and Potential for the Development. In Circular Economy: Recent Trends in Global Perspective; Ghosh, S.K., Ghosh, S.K., Eds.; Springer: Singapore, 2021. [Google Scholar] [CrossRef]
  36. Wiesmeth, H. Implementing the Circular Economy for Sustainable Development; Elsevier: Amsterdam, The Netherlands, 2020. [Google Scholar] [CrossRef]
  37. Ignatyeva, M.; Yurak, V.; Dushin, A.; Strovsky, V.; Zavyalov, S.; Malyshev, A.; Karimova, P. How Far Away Are World Economies from Circularity: Assessing the Capacity of Circular Economy Policy Packages in the Operation of Raw Materials and Industrial Wastes. Sustainability 2021, 13, 4394. [Google Scholar] [CrossRef]
  38. Żak-Skwierczyńska, M.; Wojdal, L. Implementing the Circular Economy at the Local Level: Institutional Conditions, Inter-Municipal Cooperation and Multilevel Governance in a Metropolitan Area. Sustainability 2026, 18, 5579. [Google Scholar] [CrossRef]
  39. Information and Analytical Center RUPEC. Recycling of Polymers in Russia: Present and Future; RUPEC: Moscow, Russia, 2017; Available online: https://rupec.ru/download.php?url=%2Fupload%2Fiblock%2F36c%2F36cb100d0cf26c4e9ae3d3787d180ca7.pdf (accessed on 3 July 2026). (In Russian)
  40. PPC “Russian Environmental Operator”. Sustainability Report of PPC “Russian Environmental Operator” for 2023; REO: Moscow, Russia, 2024; Available online: https://esg-library.mgimo.ru/upload/iblock/476/pw8zqg815432xcsuyn7rnkvpx4b5u2v6/PPK_REO_CSR2023.pdf (accessed on 3 July 2026). (In Russian)
  41. Rosstat. Environmental Protection in Russia. 2024: Statistical Compendium; Rosstat: Moscow, Russia, 2024. Available online: https://rosstat.gov.ru/storage/mediabank/Oxrana_okruj_sredi_2024.htm (accessed on 3 July 2026). (In Russian)
  42. Chernyshev, O.N.; Lukash, A.A.; Romanov, V.A.; Shvachko, S.N.; Maksimenko, D.M. Composite finishing materials made of hardwood. For. Russ. Econ. Them. 2025, 1, 176–181. [Google Scholar] [CrossRef]
  43. EL5 Energo (PJSC “EL5 Energo”). Sustainability Report of PJSC “EL5 Energo” for 2024; EL5 Energo: Moscow, Russia, 2025; Available online: https://www.el5-energo.ru/upload/iblock/222/zatstqgn2odxoyjhwki0vhqceq6h7asn/Sustainability_report_2024_en.pdf (accessed on 20 March 2026).
  44. NDRC (National Development and Reform Commission). Report on the Implementation of the 2023 Plan for National Economic and Social Development and on the 2024 Draft Plan for National Economic and Social Development; NDRC: Beijing, China, 2024. Available online: https://npcobserver.com/wp-content/uploads/2024/03/2024-NDRC-Report_EN.pdf (accessed on 3 July 2026).
  45. Liu, B.; Li, M.; Chen, J.; Sun, Z. Projected waste and recycling potential of China’s photovoltaic industry. Waste Manag. 2025, 191, 264–273. [Google Scholar] [CrossRef] [PubMed]
  46. China-Italy Chamber of Commerce (CICC). China Waste Plastic Recycling Industry; Thematic Report No. 04; SICAB (Sino-Italian Capacity Building for Environmental Protection): Beijing, China, 2022; Available online: https://www.sicab.net/wp-content/uploads/2020/05/04.-China-Waste-Plastic-Recycling-Industry-Report.pdf (accessed on 3 July 2026).
  47. Government of the Russian Federation. Decree No. 1039 of 10 July 2025 “On Target Indicators in the Field of Waste Management”. Collection of Legislation of the Russian Federation, 2025. Available online: https://sled35.ru/np/docs/doc/1039_01092025.pdf (accessed on 3 July 2026). (In Russian)
  48. Hyndman, R.J.; Athanasopoulos, G. Forecasting: Principles and Practice, 3rd ed.; OTexts: Melbourne, Australia, 2021; Available online: https://otexts.com/fpp3/ (accessed on 24 July 2026).
  49. Rosprirodnadzor. Annual Report on the Activities of the Federal Service for Supervision of Natural Resources in 2025; Rosprirodnadzor: Moscow, Russia, 2026. Available online: https://rpn.gov.ru/upload/iblock/f26/3av1fsip4w6kyuuylv3v6yo9mo81wm83/Doklad_2025.pdf (accessed on 24 July 2026).
  50. Evans, D.S. The relationship between firm growth, size, and age: Estimates for 100 manufacturing industries. J. Ind. Econ. 1987, 35, 567–581. [Google Scholar] [CrossRef]
  51. Bentzen, J.; Madsen, E.S.; Smith, V. Do firms’ growth rates depend on firm size? Small Bus. Econ. 2012, 39, 937–947. [Google Scholar] [CrossRef]
  52. Cabral, L. Sunk costs, firm size and firm growth. J. Ind. Econ. 1995, 43, 161–172. [Google Scholar] [CrossRef]
  53. Anyadike-Danes, M.; Bonner, K.; Hart, M.; Mason, C. Measuring Business Growth: High-Growth Firms and Their Contribution to Employment in the UK; NESTA: London, UK, 2009; Available online: https://strathprints.strath.ac.uk/16124/ (accessed on 6 October 2023).
  54. REO: 81 Concession Agreements for the Construction of MSW Processing Complexes Concluded in Russia. Mosregtoday.ru, 2025. Available online: https://mosregtoday.ru/news/eco/reo-81-kontsessionnoe-soglashenie-na-stroitelstvo-kompleksov-tko-zakljucheno-v-rossii/ (accessed on 24 July 2026).
  55. Russian Environmental Operator Summed up the Results. Gubernator24.rf, 2024. Available online: https://xn--24-6kcdjn0djpdug.xn--p1ai/rossijskij-ekologicheskij-operator-podvel-itogi/ (accessed on 24 July 2026).
  56. Director General of REO Spoke About Plans for the Construction of New Waste Management Facilities. Riamo.ru, 2025. Available online: https://riamo.ru/news/obschestvo/gendirektor-reo-rasskazala-o-planah-po-stroitelstvu-novyh-obektov-obraschenija-s-othodami/ (accessed on 24 July 2026).
  57. Ratner, S.; Gomonov, K.; Lazanyuk, I.; Revinova, S. Barriers and drivers for circular economy 2.0 on the firm level: Russian case. Sustainability 2021, 13, 11080. [Google Scholar] [CrossRef]
  58. Voinov, A.I.; Torkanovskiy, E.P.; Osipov, V.S. Nanotechnologization as essential component of circular economy: Chinese versus Russian experience. In Smart Green Innovations in Industry 4.0 for Climate Change Risk Management; Popkova, E.G., Ed.; Springer: Cham, Switzerland, 2023. [Google Scholar] [CrossRef]
  59. China Daily. Circular economy tops nation’s agenda. China Daily, 5 March 2005. Available online: https://www.chinadaily.com.cn/english/doc/2005-03/05/content_421955.htm (accessed on 24 July 2026).
  60. UN-Habitat. State of the World’s Cities 2006/2007: The Millennium Development Goals and Urban Sustainability—30 Years of Shaping the Habitat Agenda; UN-Habitat: Nairobi, Kenya, 2006; Available online: https://unhabitat.org/sites/default/files/download-manager-files/State%20of%20the%20World’s%20Cities%2020062007.pdf (accessed on 24 July 2026).
  61. Federal Law No. 458-FZ of December 29, 2014. On Amendments to the Federal Law “On Production and Consumption Waste”, Certain Legislative Acts of the Russian Federation, and the Invalidation of Certain Legislative Acts (Provisions of Legislative Acts) of the Russian Federation. Kremlin.ru, 2014. Available online: http://www.kremlin.ru/acts/bank/39280 (accessed on 24 July 2026).
  62. Government of the Russian Federation. Victoria Abramchenko: In 2022, the Federal Project on Transition to a Closed-Loop Economy Starts. Government.ru, 14 January 2022. Available online: http://government.ru/news/44233/ (accessed on 24 July 2026).
  63. Interfax. Deputy Prime Minister Abramchenko Announces Plans to Produce 1.8 Million Tonnes of Alternative Fuel in Russia by 2025. Interfax.com, 21 April 2022. Available online: https://interfax.com/newsroom/top-stories/79656/ (accessed on 24 July 2026).
  64. Makarenko, E.N.; Tyaglov, S.G.; Sheveleva, A.V. Involvement of production waste in economic circulation: Russian and European experience. Regionologiya 2023, 31, 313–334. (In Russian) [Google Scholar] [CrossRef]
  65. Kolobov, R.Y. Impact of industrial symbiosis concepts on the formation of regulatory framework for economic activity: Russian and foreign experience. Russ. J. Econ. Law 2025, 19, 257–272. [Google Scholar] [CrossRef]
  66. Shvetsov, A.N. State participation in transformation of Russia’s socioeconomic space. Reg. Res. Russ. 2023, 13, 192–223. [Google Scholar] [CrossRef]
  67. Oleynik, A. “Institutional traps” of post-privatisation period in Russia. Vopr. Ekon. 2004, 6, 79–94. (In Russian) [Google Scholar] [CrossRef]
  68. Marcos, A.; Hartmann, P.; Barrutia, J.M. Toward the implementation of SDG12 to ensure sustainable consumption and production patterns: Opportunities and neglected issues. In Handbook of Sustainability Science in the Future; Leal Filho, W., Azul, A.M., Doni, F., Salvia, A.L., Eds.; Springer: Cham, Switzerland, 2022. [Google Scholar] [CrossRef]
  69. Firoiu, D.; Ionescu, G.H.; Cismaș, C.M.; Costin, M.P.; Cismaș, L.M.; Ciobanu, Ș.C.F. Sustainable production and consumption in EU member states: Achieving the 2030 Sustainable Development Goals (SDG 12). Sustainability 2025, 17, 1537. [Google Scholar] [CrossRef]
  70. Hales, R.; Birdthistle, N. Chapter 1: The sustainable development goals—SDG#12 responsible consumption and production. In Attaining the 2030 Sustainable Development Goal of Responsible Consumption and Production; Birdthistle, N., Hales, R., Eds.; Emerald Publishing: Leeds, UK, 2023; pp. 1–10. [Google Scholar] [CrossRef]
  71. Gomonov, K.; Ratner, S.; Lazanyuk, I.; Revinova, S. Clustering of EU Countries by the Level of Circular Economy: An Object-Oriented Approach. Sustainability 2021, 13, 7158. [Google Scholar] [CrossRef]
  72. Wang, Y.; Zhen, J.; Wang, B. Analyzing the role of environmental policy innovations and natural resource management in driving circular economy forward: Evidence from BRICS economies. J. Environ. Manag. 2024, 371, 123252. [Google Scholar] [CrossRef] [PubMed]
  73. Avramenko, A.A.; Beketova, A.I. The role of multilateral cooperation in the transition to a circular economy and low carbon development: Waste recycling associations as agents of change. Eurasian Sci. J. 2023, 15, 11ECVN323. (In Russian) [Google Scholar] [CrossRef]
  74. Vasilchikov, A.V.; Smirnova, E.A. Circular economy as a systemic innovative approach. Mosc. Econ. J. 2021, 10, 302–311. (In Russian) [Google Scholar]
  75. Biryukov, A.P.; Lyan, T.; Tinyakova, V.I. Russia’s transition to a circular economy: Necessity, opportunities and challenges. Creat. Econ. 2023, 17, 855–868. [Google Scholar] [CrossRef]
  76. Kolobov, R.Y.; Kolosov, A.V.; Tirskikh, M.G.; Khertuev, R.Y.; Shevtsov, I.N.; Shishkin, S.I. Law and Innovation: Digitalization, Industry, Ecology; Irkutsk State University Publishing House: Irkutsk, Russia, 2023; 151p. [Google Scholar] [CrossRef]
  77. Mitra, A.; Ray, A. A Fuzzy DEMATEL Approach to Analyze the Barriers to the Adoption of EVs Among Consumers of West Bengal. In Advances in Industrial and Manufacturing Systems; Rajak, S., Davim, J.P., Rajurkar, K.P., Parthiban, P., Eds.; RADM 2024. Lecture Notes on Multidisciplinary Industrial Engineering; Springer: Singapore, 2026. [Google Scholar] [CrossRef]
  78. Simioni, F.J.; Soares, J.F.; Rosário, J.A.; Sell, L.G.; Bertol, E.; Souza, F.M.P.; Santos Júnior, E.P.; Coelho Junior, L.M. Industrial Symbiosis and Circular Economy Practices Towards Sustainability in Forest-Based Clusters: Case Studies in Southern Brazil. Sustainability 2024, 16, 9258. [Google Scholar] [CrossRef]
  79. Wang, Y.; Liu, J.; Zhang, Z.; Chen, W. Adjusting the pattern of source separation and recycling can substantially mitigate environmental impacts and promote carbon neutrality in China. Resour. Conserv. Recycl. 2025, 216, 108187. [Google Scholar] [CrossRef]
  80. Cojocaru, T.M.; Ionescu, G.H.; Firoiu, D.; Cismaș, L.M.; Oțil, M.D.; Toma, O. Reducing Inequalities within and among EU Countries—Assessing the Achievement of the 2030 Agenda for Sustainable Development Targets (SDG 10). Sustainability 2022, 14, 7706. [Google Scholar] [CrossRef]
  81. Vasilchikov, A.V.; Smirnova, E.A. Innovative activities of modern enterprises. Sovrem. Nauka Aktual. Probl. Teor. Praktiki. Seriya Ekon. Pravo 2021, 12, 22–26. [Google Scholar] [CrossRef]
  82. Ezdina, N.P. Recycling and problems of development of circular economy in Russia. Econ. Innov. Manag. 2024, 2, 90–98. [Google Scholar] [CrossRef]
  83. Matyukhin, A.V.; Davydova, Y.A.; Chernova, D.S. Political prerequisites for the transition to a circular economy in Russia. J. Political Stud. 2024, 8, 30–42. [Google Scholar] [CrossRef]
  84. Fedotkina, O.; Gorbashko, E.; Vatolkina, N. Circular economy in Russia: Drivers and barriers for waste management development. Sustainability 2019, 11, 5837. [Google Scholar] [CrossRef]
  85. Korotkikh, A. The Russian Federation on the Way to a Better Waste Economy. Master’s Thesis, Masaryk University, Brno, Czech Republic, 2021. Available online: https://is.muni.cz/th/vzbfx/THESIS.pdf (accessed on 3 July 2026).
  86. Plastinina, I.; Teslyuk, L.; Dukmasova, N.; Pikalova, E. Implementation of circular economy principles in regional solid municipal waste management: The case of Sverdlovskaya Oblast (Russian Federation). Resources 2019, 8, 90. [Google Scholar] [CrossRef]
  87. Garg, V.; Kaushik, P.; Kumar, A. A cross country panel study on the impact of circular economy on resource efficiency. Discov. Sustain. 2025, 6, 1432. [Google Scholar] [CrossRef]
  88. Lingaitienė, O.; Burinskienė, A.; Gružauskas, V. Review of challenges to transition towards circular economy. Entrep. Sustain. Issues 2024, 11, 423–436. [Google Scholar] [CrossRef] [PubMed]
  89. Bobylev, S.N.; Solovyova, S.V. Evaluation of the Potential for the Development of the Circular Industry in the Region: A New Approach. Sustainability 2025, 17, 3456. [Google Scholar] [CrossRef]
Figure 1. Comparative dynamics of MSW recycling/utilization rates in China and Russia (2018–2030) and identification of the institutional lag. Source: Author’s composition.
Sustainability 18 07908 g001
Figure 2. Required CAGR for Russia’s key circular economy indicators (2023–2030). Bar chart comparing actual (2023) and target (2030) values. Source: Author’s composition.
Sustainability 18 07908 g002
Figure 3. Parallel timeline of institutional milestones in China and Russia (1998–2030), illustrating the institutional lag. Source: Author’s composition.
Sustainability 18 07908 g003
Figure 4. Structure of the recycling capacity deficit in Russia by waste type, 2024. Source: Author’s composition.
Sustainability 18 07908 g004
Figure 5. Butterfly chart of institutional maturity scores for China and Russia across eight components. Red bars (China) extend to the right, blue bars (Russia) to the left. Numerical scores are shown at the ends of each bar. The vertical zero line separates the two countries. China consistently outperforms Russia in all components except regional MSW operators, where the gap is narrow. The largest gaps are observed in industrial symbioses, R&D and human capital, and international integration. Source: Authors’ calculations based on expert assessments (see Section 2.3.5 for methodology and Appendix A for raw scores).
Sustainability 18 07908 g005
Figure 6. Forecast of Circular Material Use Rate (CMUR) for Russia until 2030 using Holt’s double exponential smoothing with a 95% confidence interval. Solid markers indicate official Rosstat and REO data (2018–2024). Open circle marker indicates authors’ estimate based on Rosstat operational data and REO preliminary reports (2025). Open triangles and dashed line indicate Holt’s model forecast (2026–2030). Shaded area represents the 95% forecast interval. Source: Authors’ calculations.
Sustainability 18 07908 g006
Figure 7. Summary comparison of key circular economy indicators for China and Russia (actual 2023–2024 data and targets for 2030). MSW rates and the CMURs are shown as percentages (%). Per capita turnover is shown in USD/person. China’s per capita turnover has been corrected to 131 USD/person (was incorrectly reported as 298 in earlier versions). Source: Summary comparison of key circular economy indicators for China and Russia (actual 2023–2024 data and targets for 2030). MSW rates and the CMURs are shown as percentages (%). Per capita turnover is shown in USD/person. China’s per capita turnover has been corrected to 131 USD/person (was incorrectly reported as 298 in earlier versions). Source: Authors’ calculations based on NDRC [23], REO [40], and Rosstat [41].
Sustainability 18 07908 g007
Table 1. Key components of institutional maturity.
No.ComponentWhat Is Assessed
1Regulatory frameworkExistence of framework laws, by-laws, direct-action strategies, regulatory coverage
2Financial instrumentsActive mechanisms: green bonds, subsidies, environmental funds, tax incentives, EPR
3Digital infrastructureWaste flow accounting platforms, national information systems, secondary resource exchanges, traceability
4R&D and human capitalCentres of competence, training programmes, patent activity in recycling
5Industrial symbiosesEco-industrial parks, by-product exchanges, cross-sectoral cooperation
6Regional MSW operatorsInstitutional model for collection, transport and treatment of MSW, coverage and efficiency
7Standards and Extended Producer Responsibility (EPR)Technical norms, utilization requirements, control and sanction mechanisms
8International integrationParticipation in global platforms (G20, UNEP), technology exports, standard harmonization
Table 2. Justification of component gaps with quantitative indicators and sources.
ComponentChina (Score)Russia (Score)Quantitative Justification and Sources
Industrial symbioses94China has >200 state-level eco-industrial parks (MOHURD, 2025; NDRC, 2021). Russia has only 2–3 pilot projects (e.g., Khimgrad technopark), with no systemic support (REO, 2024; Expert RA, 2026).
R&D and human capital95China has established over 50 national competence centres and state training programmes; the R&D budget in the CE exceeds 20 billion yuan/year (NDRC, 2021). Russia has no more than five fragmented initiatives, with very low commercialization (Rosstat, 2024; INFRAGRIN, 2025).
Financial instruments85China issued 238 billion yuan of green bonds in 2016 alone and created special funds with capitalization of 88 billion yuan (NDRC, 2021). Russia’s environmental fee in 2025 reached 19 billion RUB (five times higher than 2024, but still small), with no systematic preferential financing (REO, 2024; Government of the Russian Federation, 2025).
International integration74China is an active G20 participant, initiated three resolutions on the CE, and exports technologies to >30 countries (NDRC, 2021; EU Circular Economy Platform, 2023). Russia participates in international platforms mostly as an observer, with minimal technology exports.
Table 3. Required CAGR for key Russian CE indicators (2023–2030).
Indicator2023 (Actual)2030 (Target)CAGR, %
MSW sorting, % of volume5010010.4
MSW utilization as secondary raw materials, %12.82510.0
Share of secondary raw materials in industry, %53431.5
Packaging utilization, %408511.4
MSW landfilling (max.), %80.5≤50−6.6
Note: A negative CAGR for landfilling indicates the need for annual reduction in the landfilled share. Sources for 2023 actual values: Rosstat (2024) [41]; REO Sustainability Report (2024) [40]. Sources for 2030 targets: Government Resolution No. 1039 of 10 July 2025 [47]. Source: Author’s composition.
Table 4. Sensitivity of institutional lag (L_inst) to alternative milestone pairings.
ScenarioChinese MilestonesRussian MilestonesL_inst (Years)
Main scenario2002, 2008, 20052014, 2022, 202515.3
Scenario 1 (earlier planning)2002, 2008, 20052014, 2022, 202211.3
Scenario 2 (using 1998 law)2002, 2008, 20051998, 2022, 202517.3
Scenario 3 (federal project as planning)2002, 2008, 20052014, 2022, 202211.3
Source: Authors’ calculations based on legislative documents.
Table 5. Utilization capacity deficit by waste type (million tonnes/year, 2024).
Waste TypeDeficit, Million t/Year
                    Polymer waste5.74
                    Glass cullet3.66
                    Others (paper, metal, wood, textiles)8.20
                    Total17.60
Table 6. Component scores of institutional maturities (0–10 scale).
ComponentChinaRussia
Regulatory framework96
Financial instruments85
Digital infrastructure85
R&D and human capital95
Industrial symbiosis94
Regional MSW operators87
Standards and EPR86
International integration74
Integrated index (M)8.255.25
Source: Author’s composition.
Table 7. Detailed CMUR calculation for Russia (2018–2025).
YearR_recycled (Million Tonnes)R_total (Million Tonnes)CMUR (%)Source
20181.365.02.0Rosstat Table 1.12; REO Annual Report 2019
20202.066.73.0Rosstat Table 1.14; REO Annual Report 2021
20222.870.04.0Rosstat Table 1.15; REO Annual Report 2023
20244.473.36.0Rosstat Table 1.17; REO Annual Report 2025
20255.274.37.0Rosstat operational data; REO preliminary
Notes: R_recycled is the mass of secondary materials fed back into the economy (excluding waste used as fuel). R_total is the total material consumption (primary and secondary). Sources: Rosstat (2024) “Environmental Protection in Russia”; REO Sustainability Reports (various years).
Table 8. Historical CMUR estimates for China and Russia (2018–2025).
YearChina (%, Estimated)Russia (%, Estimated)
201819–202
201921–222.5
202022–233
202123–243.5
202224–254
202325–265
202426–276
202527–28 (target 30)7 (target n.a.)
Sources: NDRC (2021) [23]; EEA (2024) [5]; INFRAGRIN (2025); Authors’ estimates based on REO (2024) [40]; Rosstat (2024) [41].
Disclaimer/Publisher’s Note: The statements, opinions and data contained in all publications are solely those of the individual author(s) and contributor(s) and not of MDPI and/or the editor(s). MDPI and/or the editor(s) disclaim responsibility for any injury to people or property resulting from any ideas, methods, instructions or products referred to in the content.