In this section, the presentation of the results and discussion regarding the utilization of the novel method will be carried out. Examples are provided to examine how the application of and influences performance evaluation. Additionally, this section elaborates in detail on the influential parameters affecting . It will become evident that the new method enables the assessment of performance and facilitates comparisons between various types of PV enhancers, especially when considering the energy of both the PV systems with and without an enhancer in the analysis. Although a comprehensive uncertainty analysis is beyond the scope of the present study, the robustness of the proposed metric can be qualitatively assessed based on the sensitivity analysis results. Uncertainties in the enhancement cost (Z), PV electricity value (U), baseline energy output (), and enhanced energy output () may affect the calculated value. Systems with values close to the classification threshold of 1 may be more sensitive to such uncertainties, potentially leading to changes in classification. However, systems exhibiting values significantly below or above the threshold are expected to retain their classification under reasonable parameter variations. Future studies should incorporate formal uncertainty quantification techniques to evaluate the statistical confidence of -based assessments.
3.1. Experimental Validation for the New Method and Comparison with the Existing Method
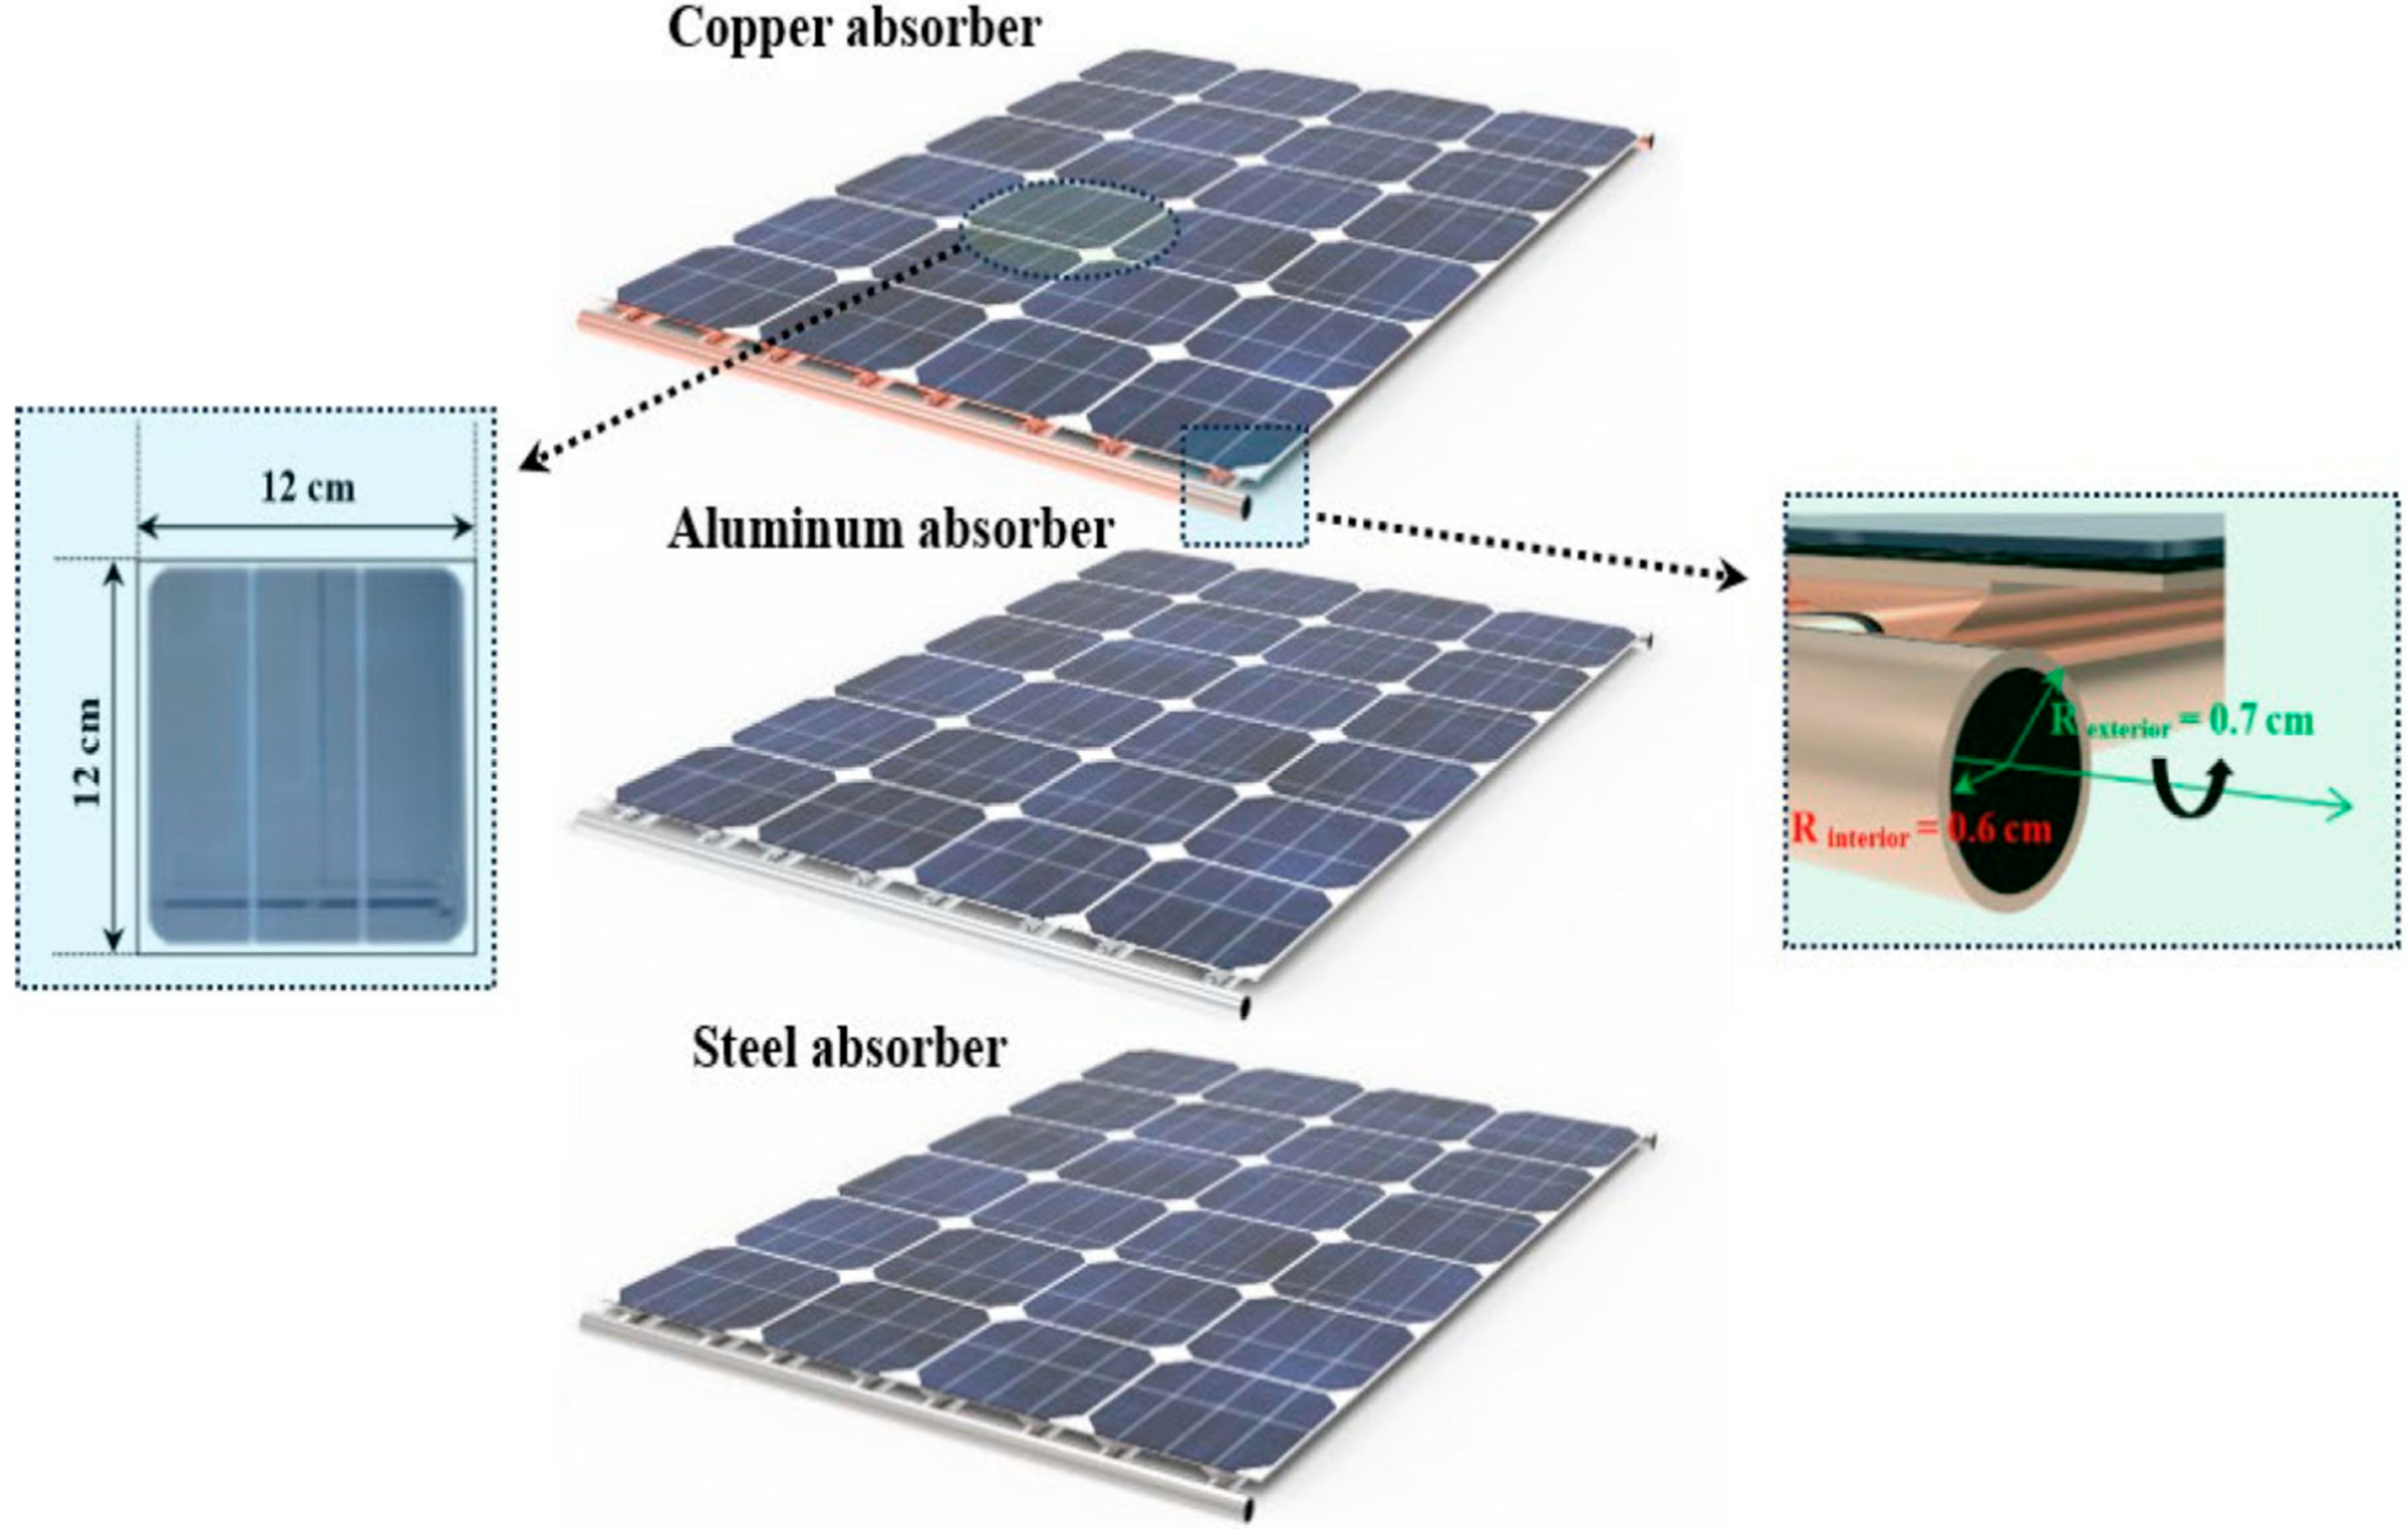
The experimental validation is conducted to support the applicability of the proposed method in a real case study. A previous experimental study was carried out for a PV system with different cooling configurations, as shown in
Figure 1 (Harby et al. [
29]). The total cost values, including the investment, maintenance and replacement costs, for the three PV cooling configurations were
$171.94,
$168.34 and
$179.04 for PVT steel, PVT aluminum and PVT copper. The total cost value for the PV reference without cooling was
$91.56. The total produced energy values were 428.56, 446.45, 487.17 and 163.41 kWh for PVT steel, PVT aluminum, PVT copper and the PV reference, respectively (shown in
Table 1). The one-unit electricity cost for the PV reference is 0.56
$/kWh. Now, using Equation (2), the F
CEE values are 1.1, 1.04 and 0.99 for PVT steel, PVT aluminum and PVT copper, respectively. It can be seen that PVT copper is cost-effective, whereas PVT steel and PVT aluminum are not. Using the existing assessment method, it is shown that PVT copper is better than PVT steel and PVT aluminum. However, it does not directly indicate the cost–energy effectiveness of these cooling configurations.
To further evaluate the applicability of the proposed Cost–Energy Effectiveness Factor (
), experimental data from a previously published outdoor photovoltaic study conducted under Malaysian climatic conditions [
30] were utilized.
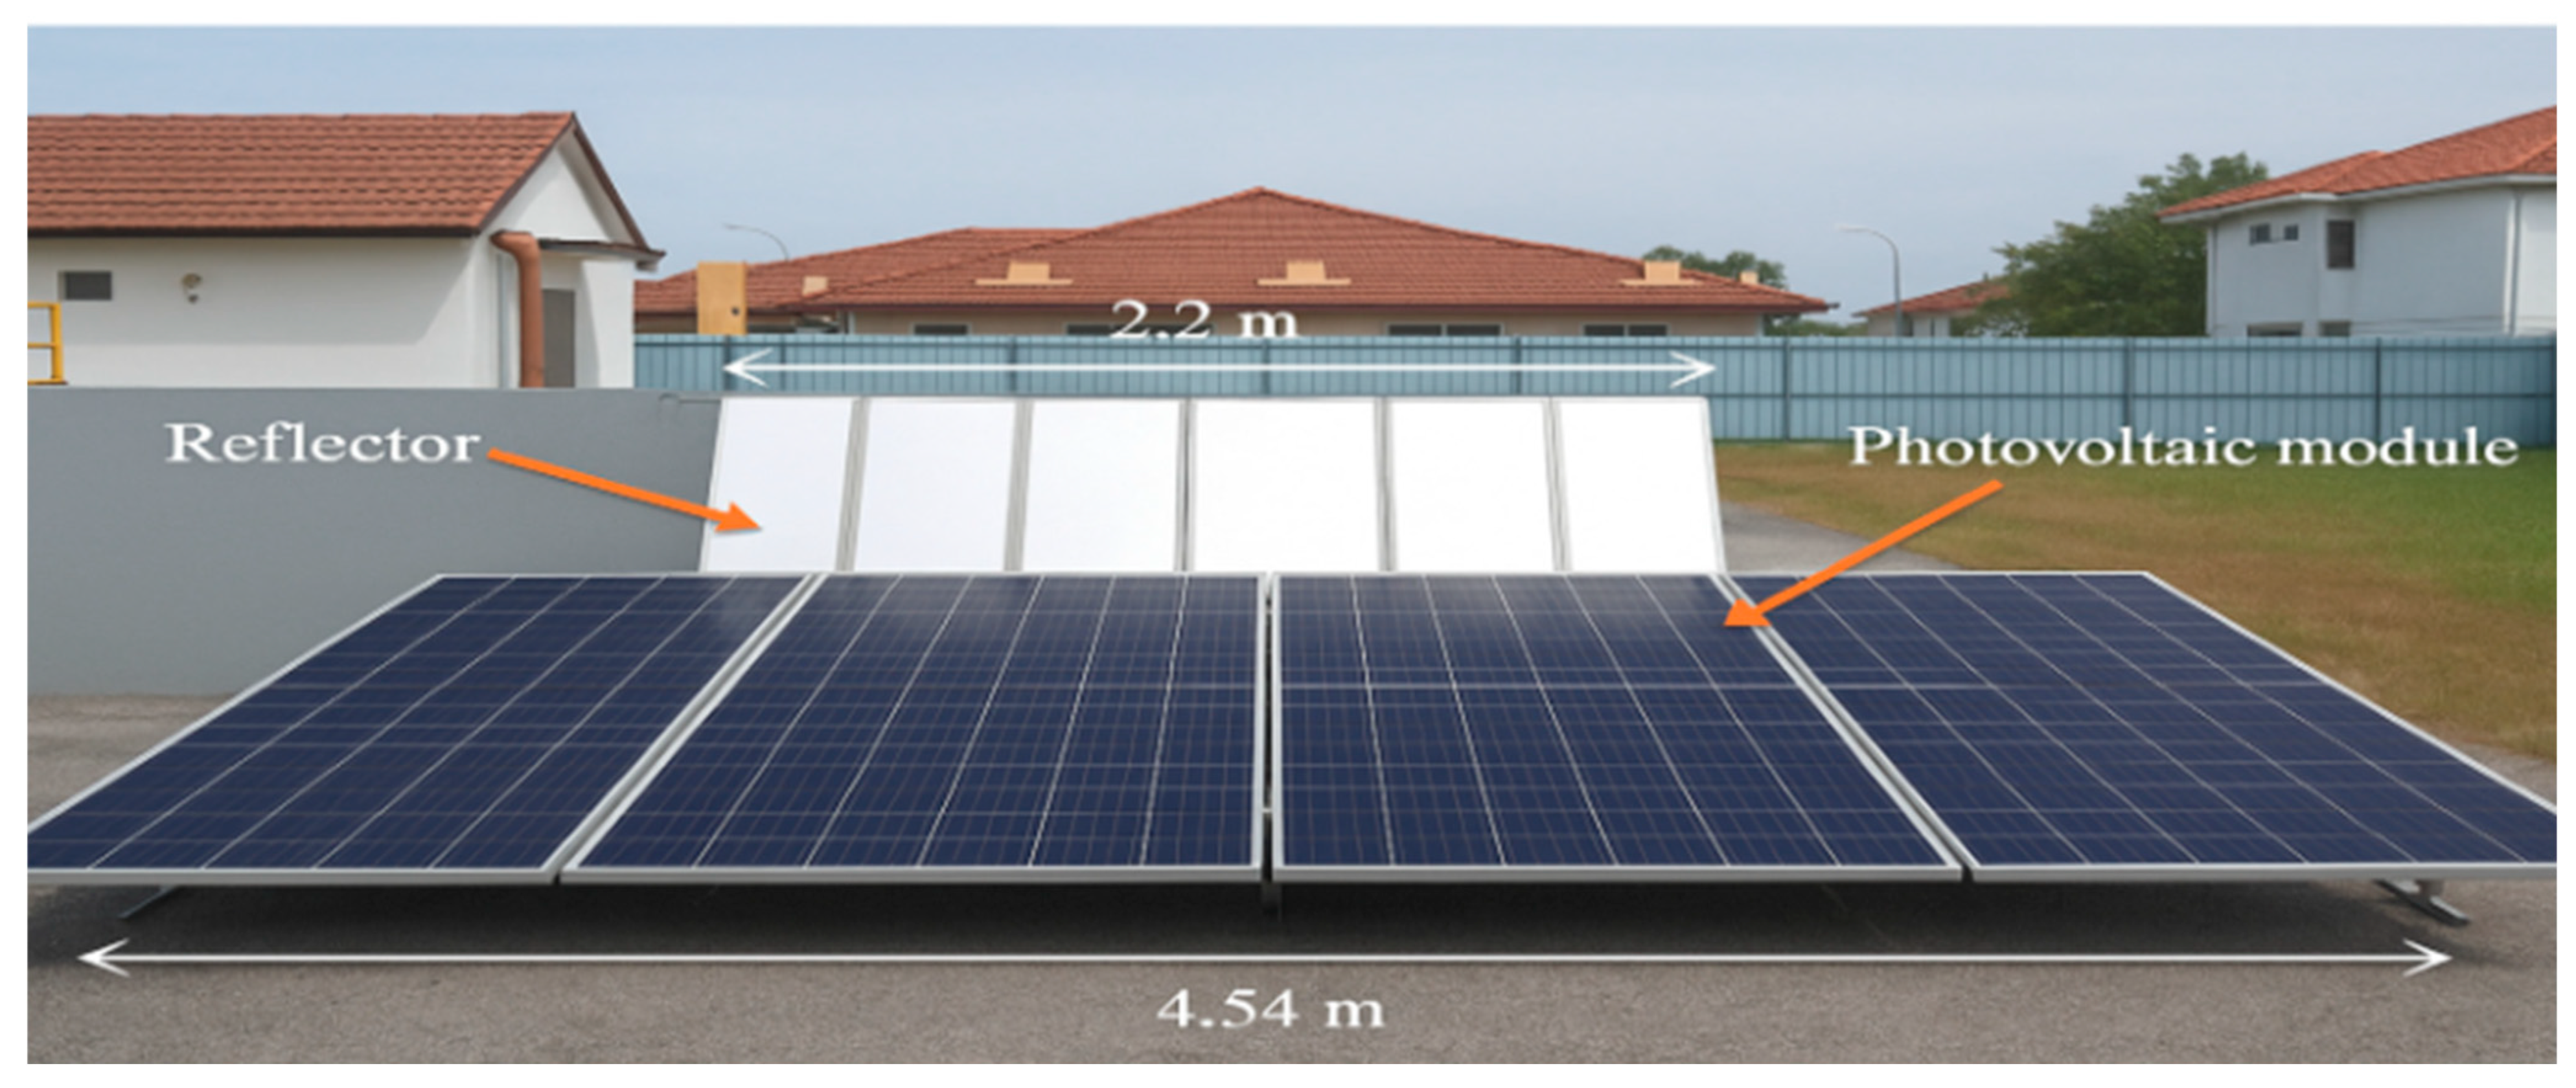
Figure 2 and
Table 2 show the experimental setup and PV specifications, respectively. The PV system was operated in its conventional configuration without a reflector during February, while a reflector was incorporated in April. Key meteorological parameters, including daily solar radiation, ambient temperature, and wind speed, were sourced from the Malaysian Meteorological Department (MMD). These data served as the basis for assessing the energy production, efficiency performance, and economic feasibility of the PV reflector system. In this study, the monthly energy outputs of the PV system without and with a reflector were reported as 106.43 kWh and 121.94 kWh, respectively (see
Table 3). The unit electricity cost was assumed to be 1 RM/kWh, while the manufacturing cost of the reflector was RM 250.
By applying Equation (2), the calculated value was 0.98. Since this value is less than 1, the reflector-enhanced PV system can be classified as cost-effective according to the proposed assessment framework. The result indicates that the additional energy generated by the reflector is sufficient to justify its associated manufacturing cost under the considered operating conditions.
The successful application of to experimentally measured outdoor data demonstrates the practical applicability of the proposed methodology for real photovoltaic enhancement systems. Furthermore, the analysis confirms that can be used to quantitatively assess the balance between energy gain and economic investment, thereby providing a straightforward classification of the cost–energy effectiveness of PV enhancement technologies. Unlike conventional power-based effectiveness indicators, the proposed incorporates cumulative energy generation and is therefore more suitable for evaluating the long-term economic performance of photovoltaic enhancement technologies under actual operating conditions.
3.1.1. The Effects of and on Different PV Enhancers
To demonstrate the application of
and
, the data presented in
Table 4 were developed based on four hypothetical PV enhancer models. It was assumed that the PV enhancers increased the annual energy output of the PV system to 125, 152.66, 195.83, and 204.16 kWh for Models A, B, C, and D, respectively. The corresponding manufacturing costs of the enhancers were assumed to be
$30,
$32,
$35, and
$40, respectively. For comparison purposes, the annual energy output of the reference PV system without an enhancer was fixed at 110 kWh. In addition, the maximum PV output power under standard test conditions was assumed to be 120 W. The unit PV electricity cost was taken as 0.75
$/kWh, while the operating period was assumed to be 8000 h.
Using Equation (2), the calculated values for Models A, B, C, and D were found to be 1.25, 1.00, 0.80, and 0.80, respectively. The minimum Cost–Energy Effectiveness Factor, , was calculated as 0.11. Based on the proposed classification criteria, Model A is considered not cost-effective because its value exceeds unity. Model B represents a neutral case, with an value equal to 1.00. In contrast, Models C and D are classified as cost-effective since their values are below unity. Furthermore, these two models exhibit the most favorable cost–energy performance among the evaluated options because their values are the closest to the minimum benchmark value, = 0.11, indicating superior effectiveness relative to the other models.
3.1.2. The Effect of Changing the Output Energy from a PV System with an Enhancer on
Table 5 summarizes the calculated values of the proposed
for four hypothetical PV enhancer models characterized by different energy outputs and manufacturing costs. The evaluation was conducted based on a PV system energy output of 110 kWh without enhancement, a PV one-unit cost of electricity of 0.75
$/kWh, and a PV module with a maximum power output of 120 W operating for 8000 h. Under these conditions, the minimum effectiveness factor,
, was determined to be 0.115 and subsequently adopted as the reference criterion for assessing performance.
The results indicate that Models B, C, and D can be considered effective, as their values fall within the acceptable range, being greater than but less than 1. Conversely, Model A is classified as ineffective because its value exceeds the threshold value of 1. Among the evaluated models, Model C exhibited the lowest value of 0.715, signifying the most favorable trade-off between additional energy generation and manufacturing cost. This was followed by Model D and Model B, with values of 0.742 and 0.898, respectively. These results suggest that improvements in energy production can substantially enhance the cost–energy effectiveness of PV enhancers, even when such improvements are associated with increased manufacturing costs.
Now, the computed values of the newly proposed were evaluated for four hypothetical PV enhancer configurations operating under low energy yield improvement scenarios. The assessment was conducted using a reference PV system generating 110 kWh of energy without enhancement, a unit PV electricity value of 0.75 $/kWh, a maximum PV power rating of 120 W, and a cumulative operating time of 8000 h. Based on these assumptions, the minimum acceptable effectiveness factor, , was determined to be 0.115 and subsequently used as the benchmark for evaluating the proposed PV enhancers.
The results indicate that all investigated configurations produced values greater than 1, ranging from 1.256 to 1.339. According to the proposed classification criteria, these values indicate that none of the evaluated PV enhancers can be considered economically effective from a cost–energy perspective. Among the investigated configurations, Model D achieved the lowest value of 1.256 due to its comparatively higher energy generation of 130 kWh. Nevertheless, its value remained above the effectiveness threshold and therefore could not be classified as a cost-effective design. Similarly, Models A, B, and C produced values of 1.339, 1.328, and 1.306, respectively, all exceeding the acceptable limit.
These findings demonstrate that modest improvements in energy yield are insufficient to offset the additional manufacturing costs associated with enhancement technologies. As a result, the economic benefits obtained from the increased energy production do not justify the required investment. More generally, the sensitivity analysis reveals that is highly dependent on the magnitude of the additional energy generated. When the energy gain remains limited, even relatively small enhancement costs may lead to values above the effectiveness threshold. This observation highlights the importance of achieving substantial energy output improvements when designing PV enhancement technologies, as minor performance gains alone are unlikely to provide satisfactory cost–energy effectiveness.
3.1.3. The Effect of Changing the Energy Produced from a PV System Without an Enhancer on and
Table 6 summarizes the calculated
values for four PV enhancer models under a scenario where the energy output of the baseline PV system is increased from 110 kWh to 115 kWh. The assessment was performed using a one-unit PV electricity cost of 0.75
$/kWh, a maximum PV power rating of 120 W, and a total operating period of 8000 h. Based on these assumptions, the minimum effectiveness threshold,
, was calculated as 0.120 and subsequently adopted as the reference criterion for evaluating the performance of the PV enhancers.
The results indicate that an increase in the energy production of the reference PV system leads to higher values across all evaluated models. Despite this increase, Models C and D continue to satisfy the effectiveness requirements, recording values of 0.826 and 0.825, respectively. Since these values remain below 1 while exceeding , both models are classified as effective. Conversely, Models A and B produced values of 1.240 and 1.033, respectively, placing them above the acceptable effectiveness limit and leading to their classification as ineffective.
A comparison with the previous case, in which the reference PV system generated 110 kWh, reveals a decline in the cost–energy effectiveness of all investigated enhancers. This trend can be attributed to the improved performance of the unenhanced PV system, which reduces the relative benefit provided by the enhancement technologies. Consequently, the additional energy generated by the PV enhancers contributes a smaller performance advantage, leading to higher values. Nevertheless, Models C and D remain capable of generating sufficient additional energy to offset their manufacturing costs and therefore maintain their effective status.
These observations demonstrate that the proposed metric is highly responsive to variations in the performance of the baseline PV system. As the energy output of the reference PV installation increases, the economic justification for implementing a PV enhancer becomes progressively more demanding. Under such circumstances, larger energy gains are required to compensate for the associated manufacturing costs and preserve favorable cost–energy effectiveness. Therefore, the competitiveness of PV enhancement technology depends not only on its own performance improvement but also on the operating performance of the reference PV system against which it is evaluated.
Compared with the previous scenario in which the reference PV energy output was increased to 115 kWh, the present case with a reduced baseline energy output of 105 kWh resulted in lower values for all investigated models, thereby improving their economic attractiveness. In the 115 kWh scenario, only Models C and D satisfied the effectiveness criterion, while Models A and B remained ineffective with values greater than 1. However, when the baseline energy output was reduced to 105 kWh, Model B became effective, with its value decreasing from 1.033 to 0.967. Similarly, Models C and D exhibited further reductions in , improving from 0.826 and 0.825 to 0.775 and 0.776, respectively. Although Model A also showed an improvement, its value remained above the effectiveness threshold. These results demonstrate that the economic viability of PV enhancement technology depends not only on its own energy gain and manufacturing cost but also on the performance level of the reference PV system.
More generally, the combined results from the 105 kWh, 110 kWh, and 115 kWh scenarios indicate that is positively correlated with the baseline energy output of the unenhanced PV system. As the energy production of the reference PV system increases, the relative contribution of the enhancement technology becomes less significant, leading to higher values and reduced cost–energy effectiveness. Conversely, lower-performing reference systems benefit more from the additional energy generated by the enhancement technology, resulting in lower values and improved economic attractiveness. Therefore, PV enhancement technologies are more likely to achieve favorable classifications when applied to systems with lower baseline energy yields, whereas high-performing PV systems require proportionally greater energy improvements to justify the additional investment.
3.1.4. The Effect of Changing the One-Unit Electricity Cost of PV on
Table 7 summarizes the calculated values of
for four hypothetical PV enhancer models under a scenario where the one-unit PV electricity cost is increased from 0.75 to 0.90
$/kWh. In this analysis, the energy output of the reference PV system was fixed at 110 kWh, whereas the energy outputs of the enhanced PV systems were assumed to be 125, 152.66, 195.83, and 204.16 kWh for Models A, B, C, and D, respectively. The corresponding manufacturing costs of the enhancers were taken as
$30,
$32,
$35, and
$40. The minimum effectiveness threshold,
, remained constant at 0.115 because its value is determined solely by the energy output of the reference PV system, the operating duration, and the maximum PV power under standard test conditions and is therefore unaffected by changes in electricity pricing.
The results indicate that a higher PV electricity cost leads to improved cost–energy effectiveness for all evaluated PV enhancer models. This improvement is reflected by a reduction in the calculated values, which can be attributed to the diminished influence of the cost-related component (Z/U) in the proposed formulation as the unit PV electricity value increases. Consequently, the values decrease to 1.147, 0.953, 0.760, and 0.756 for Models A, B, C, and D, respectively.
Based on the established effectiveness criteria, Models B, C, and D are classified as effective because their values fall below the upper limit of 1 while remaining above . In contrast, Model A continues to be categorized as ineffective since its value remains greater than unity despite the increase in PV electricity cost. This outcome suggests that the additional energy generated by Model A is still insufficient to justify its manufacturing cost under the conditions considered.
Among the four configurations, Model D achieved the lowest value of 0.756, indicating the highest level of cost–energy effectiveness. Model C followed closely with an value of 0.760, demonstrating a nearly equivalent performance. Although Model B also satisfied the effectiveness criterion, its effectiveness was comparatively lower, reflecting a smaller economic benefit relative to the energy gain achieved.
Overall, these findings demonstrate that the economic value assigned to PV electricity plays a significant role in determining the viability of PV enhancement technologies. As PV electricity cost increases, the monetary benefit associated with additional energy generation becomes more substantial, thereby improving the attractiveness of PV enhancers. This effect is particularly pronounced for systems capable of delivering considerable energy gains, highlighting the importance of both energy performance and PV electricity cost when assessing the cost–energy effectiveness of PV enhancement strategies.
Compared with the previous scenario involving higher PV electricity costs, the calculated values are evaluated for the same PV enhancer models under a scenario in which the one-unit PV electricity cost is reduced to 0.50 $/kWh. The assessment was conducted using a baseline PV energy output of 110 kWh, while the enhanced PV systems were assumed to generate 125, 152.66, 195.83, and 204.16 kWh for Models A, B, C, and D, respectively. The corresponding manufacturing costs of the enhancers were $30, $32, $35, and $40. Under these conditions, the minimum effectiveness threshold, , remained unchanged at 0.115 because it depends solely on the reference PV system performance, operating duration, and maximum power output under standard test conditions and is therefore independent of the PV electricity cost.
The results show that reducing the one-unit PV electricity cost adversely affects the cost–energy effectiveness of the investigated PV enhancers. As the PV electricity value decreases, the cost-related term (Z/U) becomes more dominant in the formulation, leading to higher values for all configurations. Consequently, Models A and B produced values of 1.360 and 1.140, respectively, exceeding the effectiveness threshold and therefore being classified as ineffective.
In contrast, Models C and D continued to satisfy the effectiveness criterion, yielding values of 0.919 and 0.931, respectively. Since both values remain below the upper effectiveness limit of 1 while exceeding , these configurations are classified as effective. Among all investigated models, Model C achieved the lowest value and therefore exhibited the highest cost–energy effectiveness, whereas Model D demonstrated slightly lower economic performance despite maintaining an effective classification.
Compared with the previous scenario in which the one-unit PV electricity cost was increased to 0.90 $/kWh, the present case produced higher values for all investigated models. Under the higher PV electricity-cost scenario, Models B, C, and D were classified as effective, whereas in the current scenario, Model B became ineffective as its value increased above the effectiveness threshold. Similarly, Models C and D experienced noticeable increases in , indicating a reduction in their economic attractiveness. These results demonstrate that the economic value assigned to the generated PV electricity plays a critical role in determining the cost–energy effectiveness of PV enhancement technologies.
More generally, the combined results from the low-, baseline-, and high-electricity-cost scenarios reveal that is inversely related to the unit value of PV electricity. Higher PV electricity values increase the economic benefit associated with the additional energy generated by the enhancement technology, thereby reducing and improving cost–energy effectiveness. Conversely, lower electricity values diminish the financial return from energy production and increase the relative impact of manufacturing cost, leading to higher values. Therefore, PV enhancement technologies are more likely to achieve favorable economic performance in regions or applications where the value of generated electricity is relatively high, whereas larger energy gains are required to justify enhancement costs under low electricity-price conditions.
3.1.5. The Effect of Changing the Manufacturing Cost of a PV Enhancer on
Table 8 summarizes the calculated values of the proposed
for four hypothetical PV enhancer models under a scenario where the manufacturing costs of the enhancers are increased while all other parameters remain unchanged. The reference PV system was assumed to generate 110 kWh of energy without enhancement, whereas the enhanced PV systems produced 125, 152.66, 195.83, and 204.16 kWh for Models A, B, C, and D, respectively. The manufacturing costs of the enhancers were increased to
$35,
$36,
$37, and
$41 for Models A, B, C, and D, respectively, while the unit cost of PV electricity was maintained at 0.75
$/kWh. The minimum effectiveness threshold,
, remained constant at 0.115 because it is independent of the manufacturing cost and is governed solely by the reference PV system performance, operating duration, and maximum power output under standard test conditions.
The results show that an increase in manufacturing cost leads to a corresponding increase in the calculated values for all evaluated models. This trend is expected because a higher manufacturing cost increases the magnitude of the economic term (Z/U) within the proposed formulation, thereby reducing the overall cost–energy attractiveness of the PV enhancers. As a result, Models A and B recorded values of 1.253 and 1.035, respectively. Since both values exceed the upper effectiveness limit of 1, these configurations are classified as ineffective under the specified conditions.
In contrast, Models C and D maintained values below unity, with values of 0.814 and 0.807, respectively, and therefore continued to satisfy the effectiveness criterion. Among the four configurations, Model D achieved the lowest value despite possessing the highest manufacturing cost. This outcome highlights the importance of energy yield in determining cost–energy effectiveness, as the substantial increase in energy production provided by Model D was sufficient to offset its higher implementation cost. Model C also demonstrated strong performance, indicating that its energy gain remained economically favorable even after the increase in manufacturing cost.
Relative to the baseline cost scenario, all models experienced a reduction in cost–energy effectiveness as manufacturing costs increased. However, the magnitude of this reduction varied among the models. The deterioration was more pronounced for Models A and B, whose relatively modest energy gains were unable to compensate for the higher investment cost. Conversely, Models C and D exhibited greater resilience to cost increases because of their superior energy generation capabilities.
Overall, these results confirm that the proposed indicator is highly responsive to changes in economic parameters and provides a practical means of quantifying the balance between additional energy production and implementation cost. The findings further suggest that PV enhancement technologies with substantial energy gains can remain economically attractive even when manufacturing costs increase, whereas technologies offering limited performance improvements are considerably more vulnerable to cost escalation.
Compared with the previous scenario involving higher PV enhancer manufacturing costs, the calculated values were evaluated for four hypothetical PV enhancer models under a scenario in which the manufacturing costs of the PV enhancers were reduced while all other parameters remained unchanged. The reference PV system without enhancement was assumed to generate 110 kWh of energy, whereas the enhanced PV systems produced 125, 152.66, 195.83, and 204.16 kWh for Models A, B, C, and D, respectively. The manufacturing costs were reduced to $20, $21, $22, and $23 for Models A, B, C, and D, respectively, while the unit PV electricity value remained at 0.75 $/kWh. Under these conditions, remained unchanged at 0.115 and was used as the benchmark for performance evaluation.
The results demonstrate that reducing the manufacturing cost significantly improves the cost–energy effectiveness of the investigated PV enhancers. The calculated values decreased to 1.093, 0.904, 0.711, and 0.689 for Models A, B, C, and D, respectively. Consequently, Models B, C, and D satisfied the effectiveness criterion and were classified as effective, whereas Model A remained ineffective because its value exceeded unity. Among all evaluated configurations, Model D achieved the lowest value, indicating the highest cost–energy effectiveness, followed by Models C and B.
Compared with the previous case in which higher manufacturing costs were considered ($35, $36, $37, and $41 for Models A, B, C, and D, respectively), all models exhibited lower values and improved economic performance. In the higher-cost scenario, only Models C and D satisfied the effectiveness criterion, whereas Model B remained ineffective with an value above unity. Following the reduction in manufacturing costs, Model B became effective, while Models C and D experienced further improvements in their values. These results clearly demonstrate the strong influence of manufacturing cost on the economic viability of PV enhancement technologies.
More generally, the combined results from the low-, baseline-, and high-cost scenarios indicate that is directly related to the manufacturing cost of the enhancement technology. As the manufacturing cost increases, the cost-related component of the proposed metric becomes more dominant, resulting in higher values and reduced cost–energy effectiveness. Conversely, lowering the manufacturing cost reduces the economic burden associated with the enhancement technology and improves its ability to generate additional energy at a justifiable cost. Therefore, cost reduction is an effective strategy for improving the economic attractiveness of PV enhancement technologies, particularly for configurations that already provide moderate energy gains. These findings further confirm that the proposed indicator is highly sensitive to manufacturing cost and can serve as a useful tool for comparing alternative PV enhancement technologies from both economic and energy-performance perspectives.
3.1.6. The Effect of Changing Pout,max on
Table 9 presents the calculated values of the proposed
for PV enhancer models under a scenario where the maximum output power of the enhanced PV system under standard test conditions is increased from 120 W to 150 W. In this analysis, the reference PV system was assumed to generate 110 kWh of energy without enhancement, while the enhanced systems produced 125, 152.66, 195.83, and 204.16 kWh for Models A, B, C, and D, respectively. The manufacturing costs of the PV enhancers were maintained at
$30,
$32,
$35, and
$40, respectively, whereas the unit cost of PV electricity was fixed at 0.75
$/kWh.
The results indicate that increasing the maximum achievable power output influences only the minimum effectiveness threshold, , which decreases from 0.115 to 0.092. This reduction is expected because the minimum effectiveness factor is inversely related to the maximum output power of the enhanced PV system. Therefore, a higher value of PPVE,outmax lowers the theoretical minimum limit that can be attained by the proposed indicator. In contrast, the calculated values remain unchanged at 1.200, 1.000, 0.800, and 0.800 for Models A, B, C, and D, respectively. This behavior occurs because the formulation is governed by the actual energy output of PV systems, the manufacturing cost of the enhancers, and the unit value of PV electricity, none of which were altered in this scenario.
Based on the established classification framework, Models C and D continue to satisfy the effectiveness criterion, as their values remain below 1 while exceeding the minimum benchmark value. These results indicate that both configurations provide sufficient additional energy generation to justify their associated implementation costs. Model B occupies a neutral position, with an value exactly equal to 1, suggesting that the economic value of the additional energy produced is approximately equivalent to the manufacturing cost of the enhancer. Conversely, Model A remains ineffective because its value exceeds the upper effectiveness limit, indicating an unfavorable balance between energy gain and investment cost.
Among the evaluated configurations, Models C and D exhibit the strongest cost–energy performance and maintain their positions as the most effective alternatives. Their low values reflect a favorable combination of substantial energy enhancement and acceptable manufacturing cost, resulting in superior economic viability relative to the other models.
Overall, the findings demonstrate that increasing the maximum output power of the enhanced PV system primarily affects the theoretical lower bound of the proposed indicator rather than its calculated value. As a result, the minimum benchmark becomes more stringent, while the relative ranking and effectiveness classification of the PV enhancer models remain unchanged. This observation highlights the role of PPVE,outmax as a parameter that defines the ideal performance limit of the metric, whereas the actual effectiveness of a PV enhancer continues to be determined by its realized energy gains and associated economic costs.
Compared with the previous scenario in which the maximum output power of the enhanced PV system under standard test conditions was increased from 120 W to 150 W, the present case with a reduced maximum power output of 115 W produced identical values and effectiveness classifications. In the 150 W scenario, decreased to 0.092, whereas in the present case it increased to 0.120. Despite this variation in the benchmark value, the calculated values remained unchanged at 1.200, 1.000, 0.800, and 0.800 for Models A, B, C, and D, respectively. Consequently, Models C and D remained effective, Model B remained neutral, and Model A remained ineffective. This consistency demonstrates that changes in do not directly influence the economic evaluation of the PV enhancers but only modify the theoretical lower benchmark of the proposed indicator.
More generally, the combined results from the 115 W, 120 W, and 150 W scenarios indicate that has the weakest influence among all investigated sensitivity parameters. Unlike manufacturing cost, PV electricity value, baseline energy output, and enhanced energy generation, variations in do not affect the calculated values because this parameter does not appear directly in the equation. Instead, it influences only the minimum effectiveness benchmark, , which serves as a theoretical reference for evaluating the performance potential of PV enhancement technologies. Therefore, while increasing lowers the theoretical minimum benchmark and decreasing it raises the benchmark, the actual cost–energy effectiveness and ranking of the evaluated technologies remain unchanged. This finding confirms that the proposed metric primarily evaluates practical economic and energy performance rather than theoretical maximum power capability.
3.1.7. Overall Impact of Key Parameters on
The collective sensitivity analyses reveal that is fundamentally controlled by the trade-off between enhancement cost and additional energy generation. Parameters that increase the energy benefit, particularly higher values, consistently reduce and improve cost-effectiveness. Similarly, higher PV electricity values (U) decrease the economic burden associated with the enhancement cost term (Z/U), resulting in lower values. In contrast, increasing enhancement cost (Z) or reducing the additional energy generated by the enhancement technology increases and may shift the system from a cost-effective classification ( < 1) to a non-cost-effective classification ( > 1). Among the investigated parameters, and Z exhibit the strongest influence on , indicating that maximizing energy gain while minimizing enhancement cost is critical for achieving favorable economic performance. Overall, the sensitivity analyses demonstrate that the proposed metric responds consistently to economically meaningful parameter variations and provides a rational basis for preliminary screening of PV enhancement technologies.
3.3. Relationship Between and Established Economic Assessment Methods
The proposed
is intended to complement, rather than replace, established economic assessment approaches such as Net Present Value (NPV), Internal Rate of Return (IRR), Levelized Cost of Electricity (LCOE), and Lifecycle Cost Analysis (LCCA). These methods are widely recognized for evaluating the economic feasibility and financial performance of photovoltaic systems because they incorporate a broad range of economic variables, including capital investment, operation and maintenance costs, discount rates, inflation, financing conditions, project lifetime, and electricity tariffs (see
Table 11). As a result, they provide comprehensive assessments of project profitability and economic viability.
In contrast, was developed to address a different objective. The indicator focuses specifically on evaluating photovoltaic enhancement technologies by integrating energy generation and manufacturing cost into a single dimensionless metric. Unlike NPV, IRR, LCOE, and LCCA, the proposed method requires only a limited number of parameters that are commonly reported in experimental and field studies, namely the energy output of the PV system with and without an enhancer, the manufacturing cost of the enhancer, and the unit value of PV electricity. Consequently, can be applied during the early stages of technology development when detailed economic information is often unavailable.
Another important distinction is that NPV, IRR, LCOE, and LCCA are generally project-level assessment tools, whereas is primarily a technology-level assessment tool. The proposed factor enables rapid comparison of different PV enhancement technologies, such as cooling systems, reflectors, and tracking mechanisms, using a consistent framework based on energy performance and cost. This characteristic is particularly useful because many PV cooling and enhancement studies report improvements in energy generation (kWh) and manufacturing costs but do not provide sufficient information to perform comprehensive NPV, IRR, LCOE, or lifecycle cost analyses. Furthermore, the proposed indicator can serve as a preliminary screening tool before conducting more detailed techno-economic evaluations. Technologies exhibiting unfavorable values may be excluded from further consideration, whereas technologies demonstrating favorable cost–energy performance can subsequently be subjected to comprehensive economic analyses using NPV, IRR, LCOE, or LCCA. Therefore, should be viewed as a complementary indicator that bridges the gap between technical performance assessment and detailed economic evaluation. It should be noted that no universal quantitative relationship exists between and conventional economic indicators such as LCOE, NPV, or IRR because these metrics depend on numerous project-specific financial and operational parameters. Therefore, is intended as a preliminary screening indicator rather than a replacement for comprehensive economic assessment methods. In general, < 1 suggests that the additional energy benefit generated by the enhancement technology is sufficient to justify its manufacturing cost under the assumed electricity value, indicating potential economic viability and suitability for further detailed evaluation. Conversely, > 1 indicates a lower likelihood of favorable economic performance, while = 1 represents the break-even condition. The relationship among these assessment methods can be summarized as follows: provides a rapid technology-level evaluation based on energy generation and manufacturing cost, while NPV, IRR, LCOE, and LCCA provide comprehensive project-level economic assessments. Accordingly, the proposed factor is most suitable for the preliminary evaluation, comparison, and ranking of PV enhancement technologies, whereas final investment and deployment decisions should be based on detailed techno-economic analyses that incorporate lifecycle costs, financing conditions, discount rates, operational expenses, and project-specific economic factors.