Article

Spatiotemporal Evolution of Landscape Ecological Risk and Topographic Gradient Heterogeneity in Huangshan City, China, Based on the intPLUS Model

1
College of Resources and Environment, Yunnan Agricultural University, Kunming 650201, China
2
School of Resources and Environmental Engineering, Hefei University of Technology, Hefei 230009, China
3
Chengdu Center, China Geological Survey, Chengdu 610218, China
4
College of Resources and Environmental Sciences, Nanjing Agricultural University, Nanjing 211800, China
5
College of Water Conservancy, Yunnan Agricultural University, Kunming 650201, China
*
Author to whom correspondence should be addressed.
Sustainability 2026, 18(15), 7852; https://doi.org/10.3390/su18157852
Submission received: 1 July 2026 / Revised: 29 July 2026 / Accepted: 30 July 2026 / Published: 3 August 2026

Abstract

To characterize the spatiotemporal evolution of land use and landscape ecological risk in mountainous tourism cities, this study uses Huangshan City as a representative case. Land use data from 2002 to 2022 are analyzed, and future land use patterns for 2032–2042 are projected using the integrated patch-generating land use simulation (intPLUS) model. Meanwhile, by coupling landscape ecological risk indices with terrain gradient metrics (T1–T5), we identify the spatiotemporal evolution patterns and quantify how terrain constraints shape risk distribution. The results indicate that: (1) From 2002 to 2042, forest land remains dominant and consistently accounts for more than 85% of the area. Nevertheless, strong pressure from future urbanization is expected. Between 2032 and 2042, built-up land is projected to expand sharply from 163.08 km2 to 255.46 km2, increasing encroachment pressure on the extensive forest matrix. (2) Over the past two decades, landscape ecological risk shows a complex “improve-then-rebound” trajectory. In the future, however, it exhibits distinct phase characteristics: risk is relatively stable and improves from 2022 to 2032, but undergoes a sudden reversal and deterioration from 2032 to 2042. This pattern reflects the intensified risk to ecological security resulting from the concentrated release of construction land quotas during the mid-to-late stage of urbanization. Spatially, risk follows a radiation-like pathway, diffusing outward in concentric patterns, with core towns and tourist scenic areas functioning as the source regions. (3) Terrain gradients impose strong constraints on both land use patterns and ecological risk. Anthropogenic disturbance decreases stepwise as terrain gradient increases. The low-gradient zone (T1) is the primary location for built-up expansion and risk enhancement; the mid-gradient zone (T2) represents a highly sensitive ecotone, marked by pronounced tension between human disturbance and natural recovery. In contrast, the high-gradient zones (T4–T5) preserve exceptionally high forest connectivity due to topographic barriers, thereby serving as a crucial natural ecological barrier. Overall, this study clarifies the spatial conflicts among rapid urbanization, tourism development, and ecological conservation in mountainous urban regions, offering actionable insights for differentiated spatial governance and sustainable development.

1. Introduction

Land Use and Cover Change (LUCC) is the most direct manifestation of the interplay between human activities and the natural environment [1,2,3]. As a core driving factor, it shapes changes in regional ecosystem services and drives the evolution of landscape patterns. With the acceleration of global urbanization and industrialization, high-intensity land development has intensified landscape fragmentation and weakened ecosystem connectivity, thereby triggering a cascade of regional ecological security challenges [4,5]. Landscape Ecological Risk (LER), as an important framework for assessing regional ecological security, describes the structure, function, and spatial heterogeneity of landscape patterns. It therefore quantifies the potential severity of ecosystem degradation under both natural disturbances and anthropogenic impacts [6,7,8]. Accordingly, examining the spatiotemporal dynamics and predictive trajectories of regional LER is of considerable theoretical and practical value for maintaining ecological balance and optimizing the spatial configuration of national territory [9].
Meanwhile, extensive studies have provided substantial progress in the evaluation methods, spatiotemporal evolution, and driving mechanisms of LER [6,7]. In terms of methods, frameworks based on landscape pattern indices have gained increasing attention [10,11,12]. In particular, the risk–sampling–grid approach, constructed from landscape disturbance and landscape vulnerability, has been widely applied because it effectively captures spatial heterogeneity [13,14,15]. At the same time, predictive tools—including Cellular Automata (CA), CLUE-S, CA-Markov [16], and the Patch-generating Land Use Simulation (PLUS) model—have been repeatedly used to simulate future LUCC processes and project subsequent ecological risk trends [17,18,19]. However, conventional PLUS models often show limited sensitivity to localized, patch-scale transitions when confronted with refined land-transfer behaviors and complex ecological flow dynamics. To address these issues, the recently developed intPLUS (Integrated PLUS) model introduces more targeted constraints and improved Markov chain settings, allowing a more accurate simulation of patch-scale spatiotemporal land use dynamics [20,21,22]. These developments provide a new methodological route for fine-grained prediction of regional LER.
Located in the southern part of Anhui Province, Huangshan City lies in the core area of the mountainous Southern Anhui region. It serves as a key headwater source for the Xin’an River basin and is designated as a national key ecological function zone. As a result, its ecological condition is both highly important and highly vulnerable to degradation. Huangshan City is also characterized by a complex geomorphological matrix, where mountains, hills, and basins are interwoven and topographic relief is pronounced [23]. Distinct topographic gradients (e.g., elevation, slope, and the Terrain Niche Index) not only constrain the spatial distribution of human production and livelihoods, but also directly determine land use allocation and the evolutionary trajectories of landscape patterns [24]. Although prior studies have combined terrain gradient analysis with landscape ecological risk assessment in mountainous areas or watersheds such as the Yellow River Basin, the Qilian Mountains, and Gele Mountain [25,26,27,28], there remains a gap in studies that integrate tourism-driven urbanization pressure, a refined intPLUS model, and multidimensional terrain gradient effects into a unified analytical framework for mountainous tourism cities such as Huangshan City—shaped by the interaction of its “World Natural and Cultural Heritage” status and “Huizhou culture.” The key mechanism that differentiates this study from existing work is twofold: we adopt a five-level Terrain Niche Index (TNI) classification scheme (T1–T5) and introduce the Distribution Index (Pie) to quantify the topographic dominance of different risk levels. This approach enables a finely resolved identification of the three-level terrain constraint pattern of “low-gradient risk enrichment—medium-gradient sensitive trade-off—high-gradient ecological barrier.” Therefore, the study provides dual contributions in both regional relevance and mechanistic understanding.
Taking Huangshan City as the focal study area and using three land use periods (2002, 2012, and 2022), this research systematically examines the spatiotemporal evolution and transition dynamics of regional land use. Based on this, a Landscape Ecological Risk Index (ERI) is constructed to quantify the spatiotemporal distribution and transfer trajectories of LER. In addition, the Terrain Niche Index (TNI) is introduced to explore the underlying mechanisms governing land use transition characteristics and the spatial differentiation of ERI across TNI gradients. Furthermore, the intPLUS model is employed to simulate and predict land use configurations for 2032 and 2042, thereby revealing future predictive characteristics and spatiotemporal evolutionary trends of LER. Overall, the findings are intended to provide a scientific decision-making framework for strengthening the ecological security barrier of Southern Anhui, promoting differentiated territorial spatial governance, and advancing sustainable development in mountainous regions.

2. Materials and Methods

2.1. Study Area

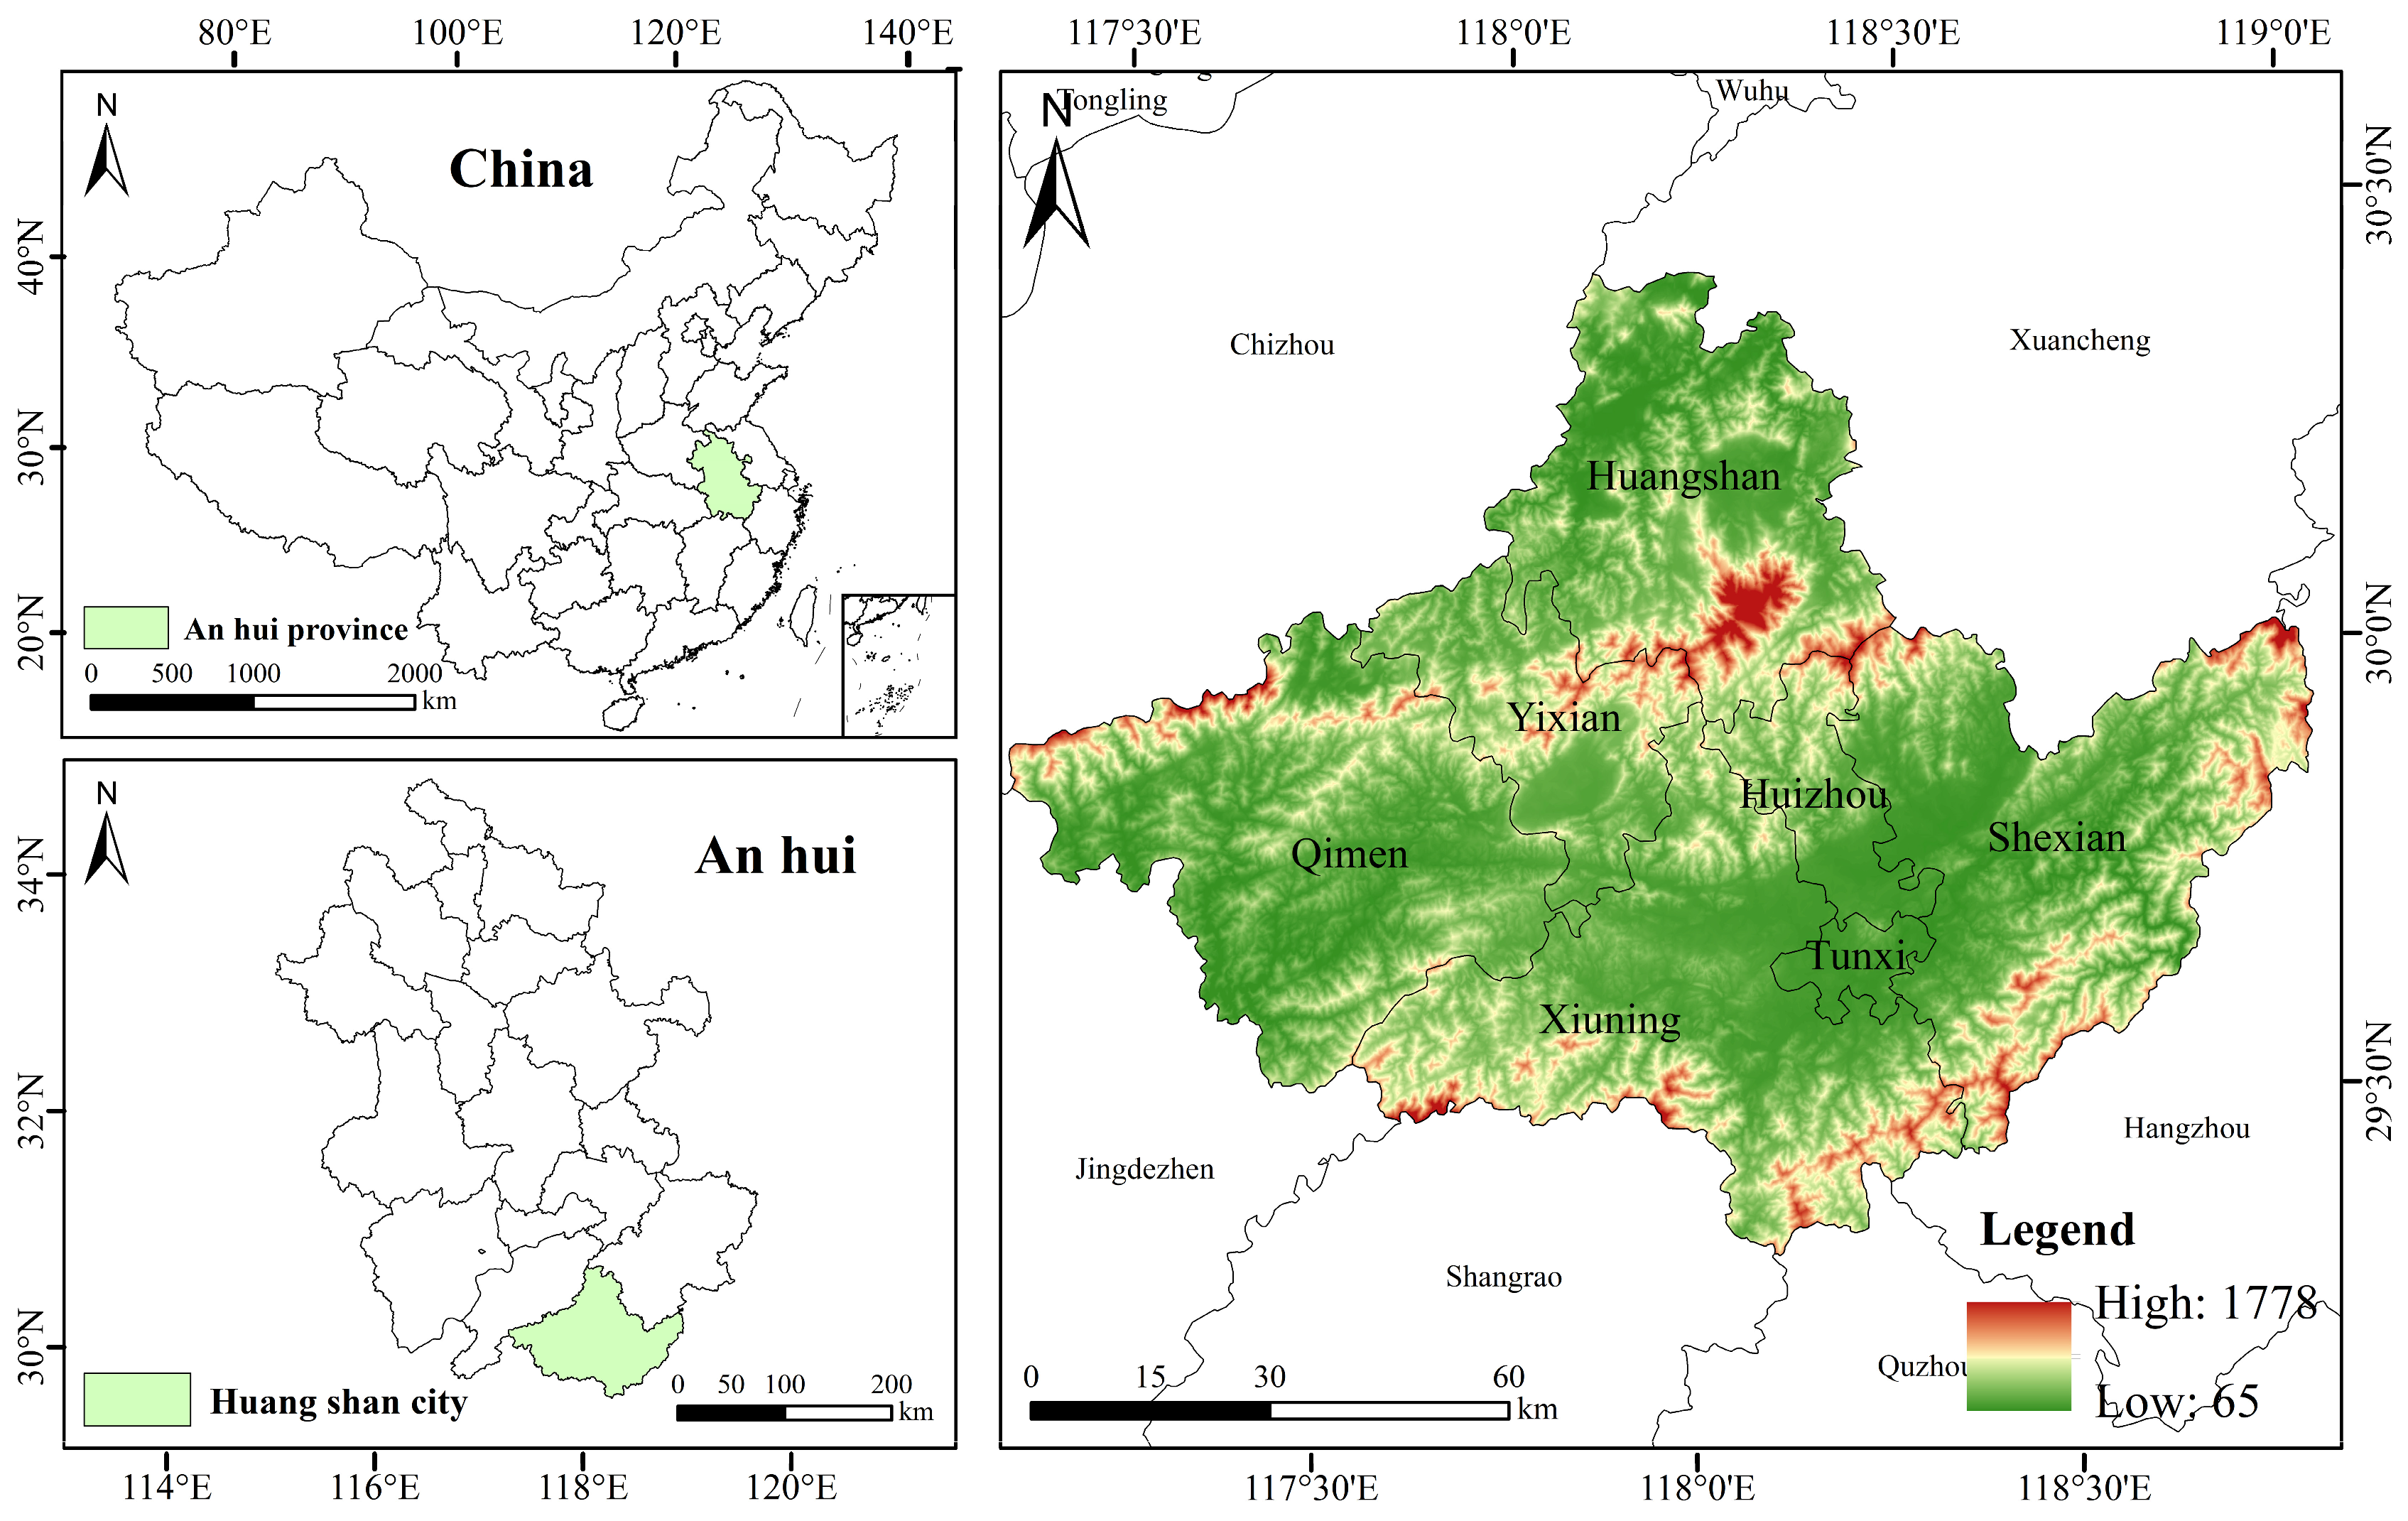
Huangshan City (117°12′–118°53′ E, 29°24′–30°31′ N) is located in the southern region of Anhui Province, China, within the core hinterland of the mountainous area of southern Anhui at the junction of Anhui, Zhejiang, and Jiangxi. It covers an area of approximately 9807 km2 and administers three districts and four counties (Figure 1). The geomorphological pattern is dominated by a typical alternation of medium-low mountains, hills, and basins, with pronounced topographic relief and high habitat heterogeneity. The Xin’an, Qingyi, and Changjiang rivers originate within the territory or flow through it, making Huangshan an important ecological barrier and water conservation area in East China [29]. The regional climate is characterized as a subtropical humid monsoon type, with distinct seasons and abundant precipitation [30]. Due to the dissection of medium-low mountainous terrain and microclimatic effects, the vertical differentiation of hydrothermal conditions is highly evident, which supports a complete vertical vegetation belt spectrum. Specifically, vegetation transitions upward from evergreen broad-leaved forests and evergreen–deciduous broad-leaved mixed forests to mountain coniferous forests (dominated by Pinus huanhsanensis) and alpine dwarf forests, making the area one of the priority biodiversity conservation regions in China [31].
At the socio-ecological system level, Huangshan City is an important component of the Hangzhou Metropolitan Area, the core city of the Southern Anhui International Tourism and Cultural Demonstration Zone, and a national-level cultural ecological protection zone [32,33,34]. The territory includes the Huangshan Scenic Area and the ancient villages of Xidi and Hongcun—both inscribed as World Natural and Cultural Heritage sites—forming a unique “dual heritage–Huizhou culture” integration pattern that is rare among prefecture-level cities nationwide. Against the backdrop of coordinated rapid urbanization and high-intensity tourism urbanization, the mountain–basin ecosystem faces key scientific challenges, including balancing the development needs with the protection of World Heritage sites, assessing ecological impacts under intense anthropogenic disturbances, and promoting the inheritance and innovation of Huizhou culture. These pressures make the system both sensitive and vulnerable [35]. The distinctive coupling mechanism among geomorphology, climate, and culture provides Huangshan with a natural laboratory for clarifying the resilience evolution of socio-ecological systems, the ecological effects of tourism urbanization, and the realization pathways of ecological product value in the mid-subtropical transitional zone. Therefore, it has strong scientific relevance for quantitatively characterizing the synergies and trade-offs among ecological conservation, cultural inheritance, and regional green, high-quality development in southern hilly and mountainous areas [36].
Figure 1. Location of the study area (adapted from Yu et al., 2026 [37]. This paper was first published online in the MDPI journal LAND and complements our group’s previous work).
Sustainability 18 07852 g001

2.2. Data Description

This study integrates three main categories of datasets, including land use, natural environmental factors, and socioeconomic attributes (Table 1). Land use data are obtained from the China Land Cover Dataset (CLCD) [38]—a 30 m resolution annual land-cover product developed by Professors Jie Yang and Xin Huang of Wuhan University using the Google Earth Engine (GEE) platform. The dataset covers three periods (2002, 2012, and 2022) with an overall accuracy of 80% [39]. Because Huangshan City is dominated by mountainous and hilly terrain, has abundant forest resources, and exhibits consistently high vegetation cover with very limited unused land, we reclassified land use types within the study area into five uniform categories according to the National Standard of Current Land Use Classification (GB/T 21010-2017) [40]: cropland, forest land, grassland, water, and built-up land. The natural and socioeconomic driving factors include Digital Elevation Model (DEM) and the Normalized Difference Vegetation Index (NDVI), both downloaded from the Geospatial Data Cloud. Based on the DEM, slope and aspect were subsequently derived. Soil types, annual average temperature, annual average precipitation, and Gross Domestic Product (GDP) were obtained from the Resource and Environmental Science and Data Center of the Chinese Academy of Sciences. Population density data were extracted from the WorldPop platform, and the Visible Infrared Imaging Radiometer Suite (VIIRS) nighttime light index was retrieved from the Earth Observation Group (EOG) website.
To ensure precise pixel-to-pixel correspondence in the subsequent analyses, all driving-factor layers were mosaicked, clipped, or mask-extracted according to the administrative boundary of the study area, followed by spatial standardization through reprojection and resampling. Finally, all datasets were transformed into the WGS-1984-UTM-Zone-50N coordinate system, and the spatial resolution was uniformly standardized to 30 m × 30 m. This provides high-precision and reliable data support for the long-term analysis of land use change and its underlying drivers. It should be noted that slight differences exist in how water-body masks and NoData pixels are handled across different CLCD versions (by year), which leads to minor fluctuations in the total land use area among the periods. In this study, the total area is 9668.25 km2 for 2002 and 2012, whereas it is consistently 9650.14 km2 for 2022 and the projected future years (2032 and 2042), resulting in a difference of approximately 18 km2. This discrepancy is attributed to mask adjustments during dataset updating. The magnitude of this variation is less than 0.2% of the total study area, far smaller than the area changes in individual land use categories. Therefore, it does not substantially affect the results of land use transition analysis or the landscape ecological risk assessment.

2.3. Methods

2.3.1. Land Use Transition Matrix

The land use transition matrix not only delineates the categorical composition of diverse land use types at the inception and termination of the study period, alongside their respective transfer trajectories, but also systematically illuminates the dynamic transformation processes unfolding across distinct temporal intervals [41,42,43]. The mathematical formulation is manifested as follows:
S i j = S 11 S 1 m S m 1 S m m
where Sij denotes the magnitude of variation in land use types from the initial to the final stage of the evaluation period, and m represents the total number of distinct land use classifications.

2.3.2. Demarcation of Ecological Risk Sub-Areas

In accordance with the spatial heterogeneity theory within landscape ecology, the patch area of landscape ecological risk assessment units is conventionally recommended to be configured at 2 to 5 times the mean patch area of the landscape within the study area [44,45,46]. In this study, Fragstats 4.2 was used to analyze three-period land use data of Huangshan City, and the results indicated that the appropriate area range for the evaluation cells should be between 0.57 and 1.72 km2. Based on this scientific evidence and in combination with the actual situation, a 1 km × 1 km grid was ultimately adopted as the evaluation unit, dividing the study area into 10,065 independent risk cells. This scale not only effectively captures the interactions among patches but also accurately identifies the spatial differentiation patterns of ecological risk, thereby scientifically avoiding scale bias.

2.3.3. Landscape Ecological Risk Index Formulation

In alignment with antecedent research frameworks [47,48], a comprehensive landscape ecological risk assessment model was established based upon a structured indicator framework (Table 2). Utilizing numerical derivations across distinct risk units, this approach systematically quantifies the spatiotemporal dynamics and hierarchical configurations of landscape ecological risks inherent to the study area. The governing equation is formulated as follows:
E R I i = i = 1 N A k i A k R i
where ERIi is the composite landscape ecological risk index of the i-th assessment unit; Aki designates the spatial area of landscape type i within the k-th spatial unit; Ak is the aggregate area of the k-th assessment unit; and Ri conceptualizes the landscape loss index characterizing the i-th landscape type.

2.3.4. Kriging Interpolation

Based on the variogram and structural analysis, kriging interpolation is a spatial interpolation technique that achieves linear optimal estimation and can transform quadrat fishing-net data into a continuous spatial distribution surface [50]. In this study, ordinary kriging was employed for spatial prediction, and its basic principle and variogram formula are as follows:
For ordinary Kriging interpolation:
Z x 0 = i = 1 n λ i Z ( x i )
where Z(x0) denotes the predicted value at the target location x0; Z(xi) represents the observed value at the known sampling point xi within the neighborhood of x0; and λ i signifies the weight coefficient allocated to each corresponding observation.
The corresponding ordinary Kriging variogram is defined as:
γ h = 1 2 N ( h ) i = 1 N ( h ) ( x i x i + h ) 2
where N(h) indicates the total number of sample pairs separated by a spatial lag distance h, while xi and xi+h designate the empirical sample values recorded at positions i and i + h, respectively.
In this study, kriging interpolation is used solely for spatial visualization of the discrete sampling points, and no cross-validation statistics are reported.

2.3.5. Topographic Gradient Analysis

The terrain niche index (TNI) is a widely utilized quantitative indicator in topographic analysis. Formulated by computing the differentials between the elevation and slope values of a specific point and their respective regional means, the TNI effectively characterizes the localized spatial positioning of that point relative to the macro-topographic background. Consequently, this index serves as a robust tool for elucidating the spatial differentiation patterns of topographic conditions [51,52]. The mathematical expression is established as follows:
T = ln ( E E ¯ + 1 × U U ¯ + 1 )
where T represents the terrain niche index; E and U denote the elevation and slope of a specific point within the region, respectively; and E ¯ and U ¯ signify the mean elevation and slope across the entire study area. Notably, both elevation and slope values exhibit a positive correlation with the TNI.
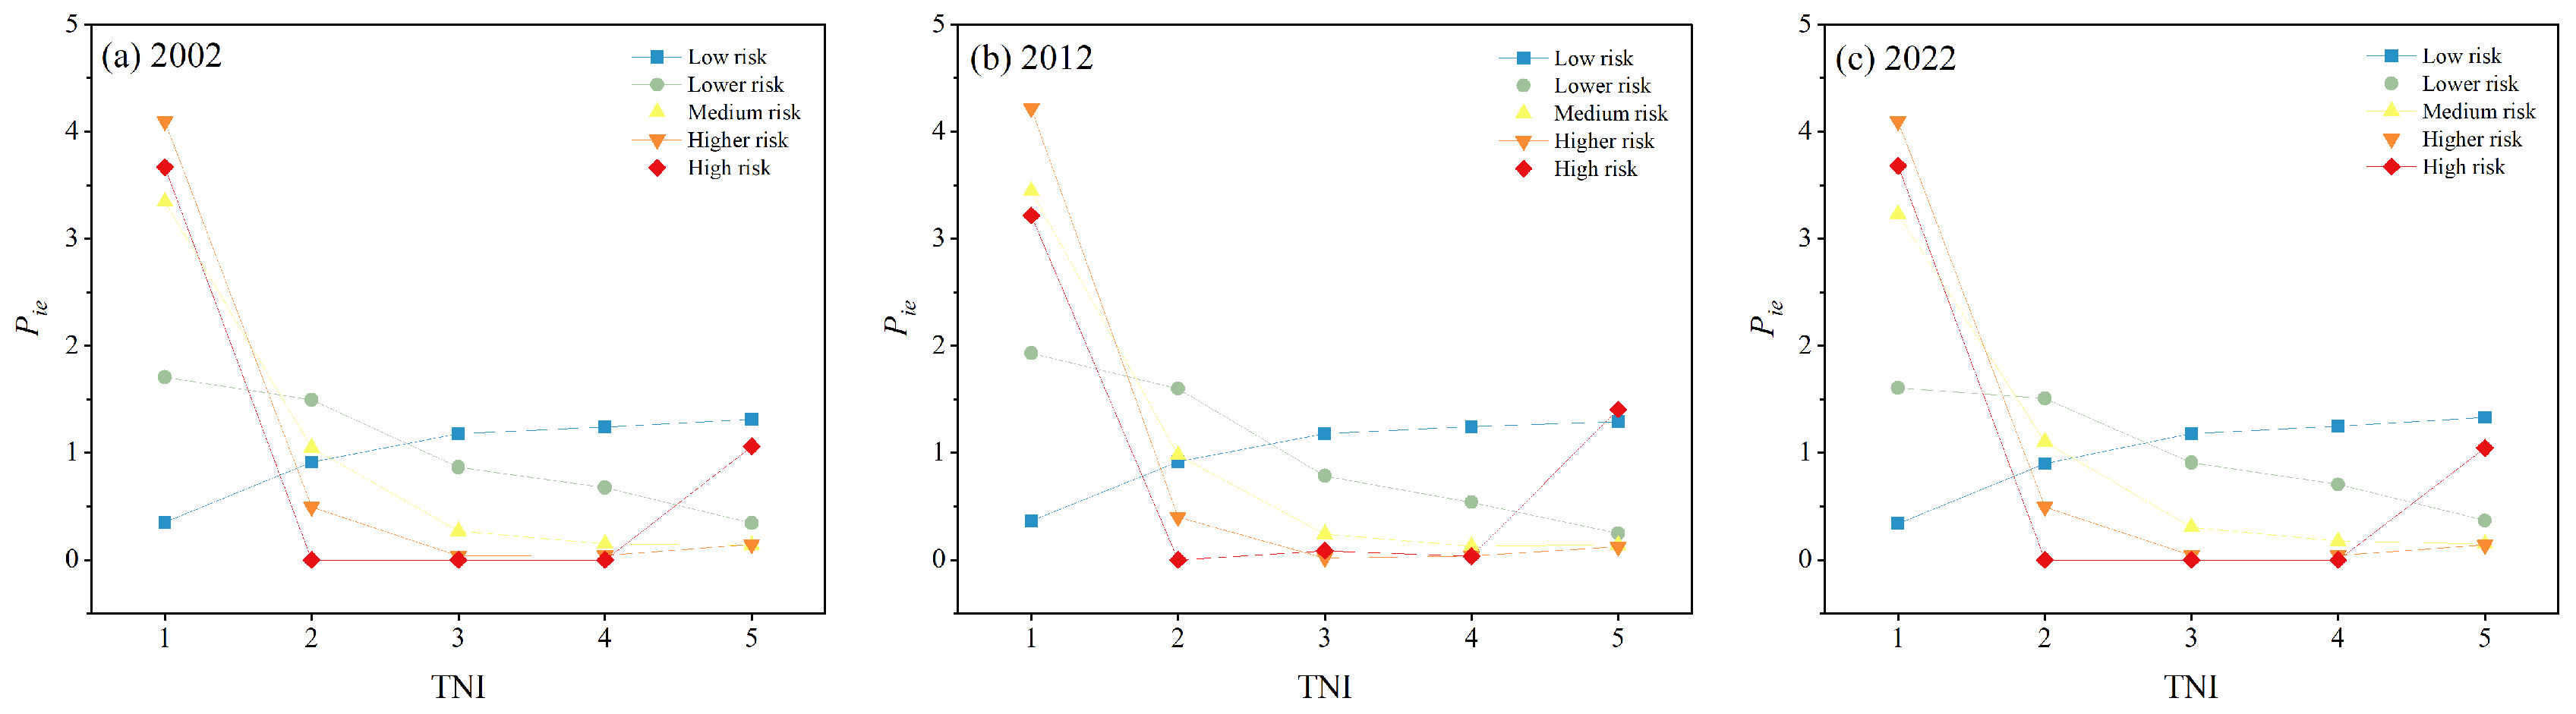
To eliminate scale-dependent variations across different topographic gradients and ecological risk zones, a distribution index (Pie) was introduced to quantitatively evaluate the ecological risk along the topographic gradients. Characterized as a dimensionless standardized index, a value of Pie > 1 signifies that risk type i exhibits a dominant presence within terrain niche e, with higher values indicating a more pronounced dominance [53]; conversely, values below 1 reflect a subdominant or marginal status. The distribution index is formulated as follows:
P i e = ( S i e S i ) ( S e S )
where Sie represents the area of risk type i under terrain niche e; Si denotes the total area of risk type i across the entire study area; Se signifies the total area of terrain niche e within the study region; and S constitutes the total geographic area of the entire study region.
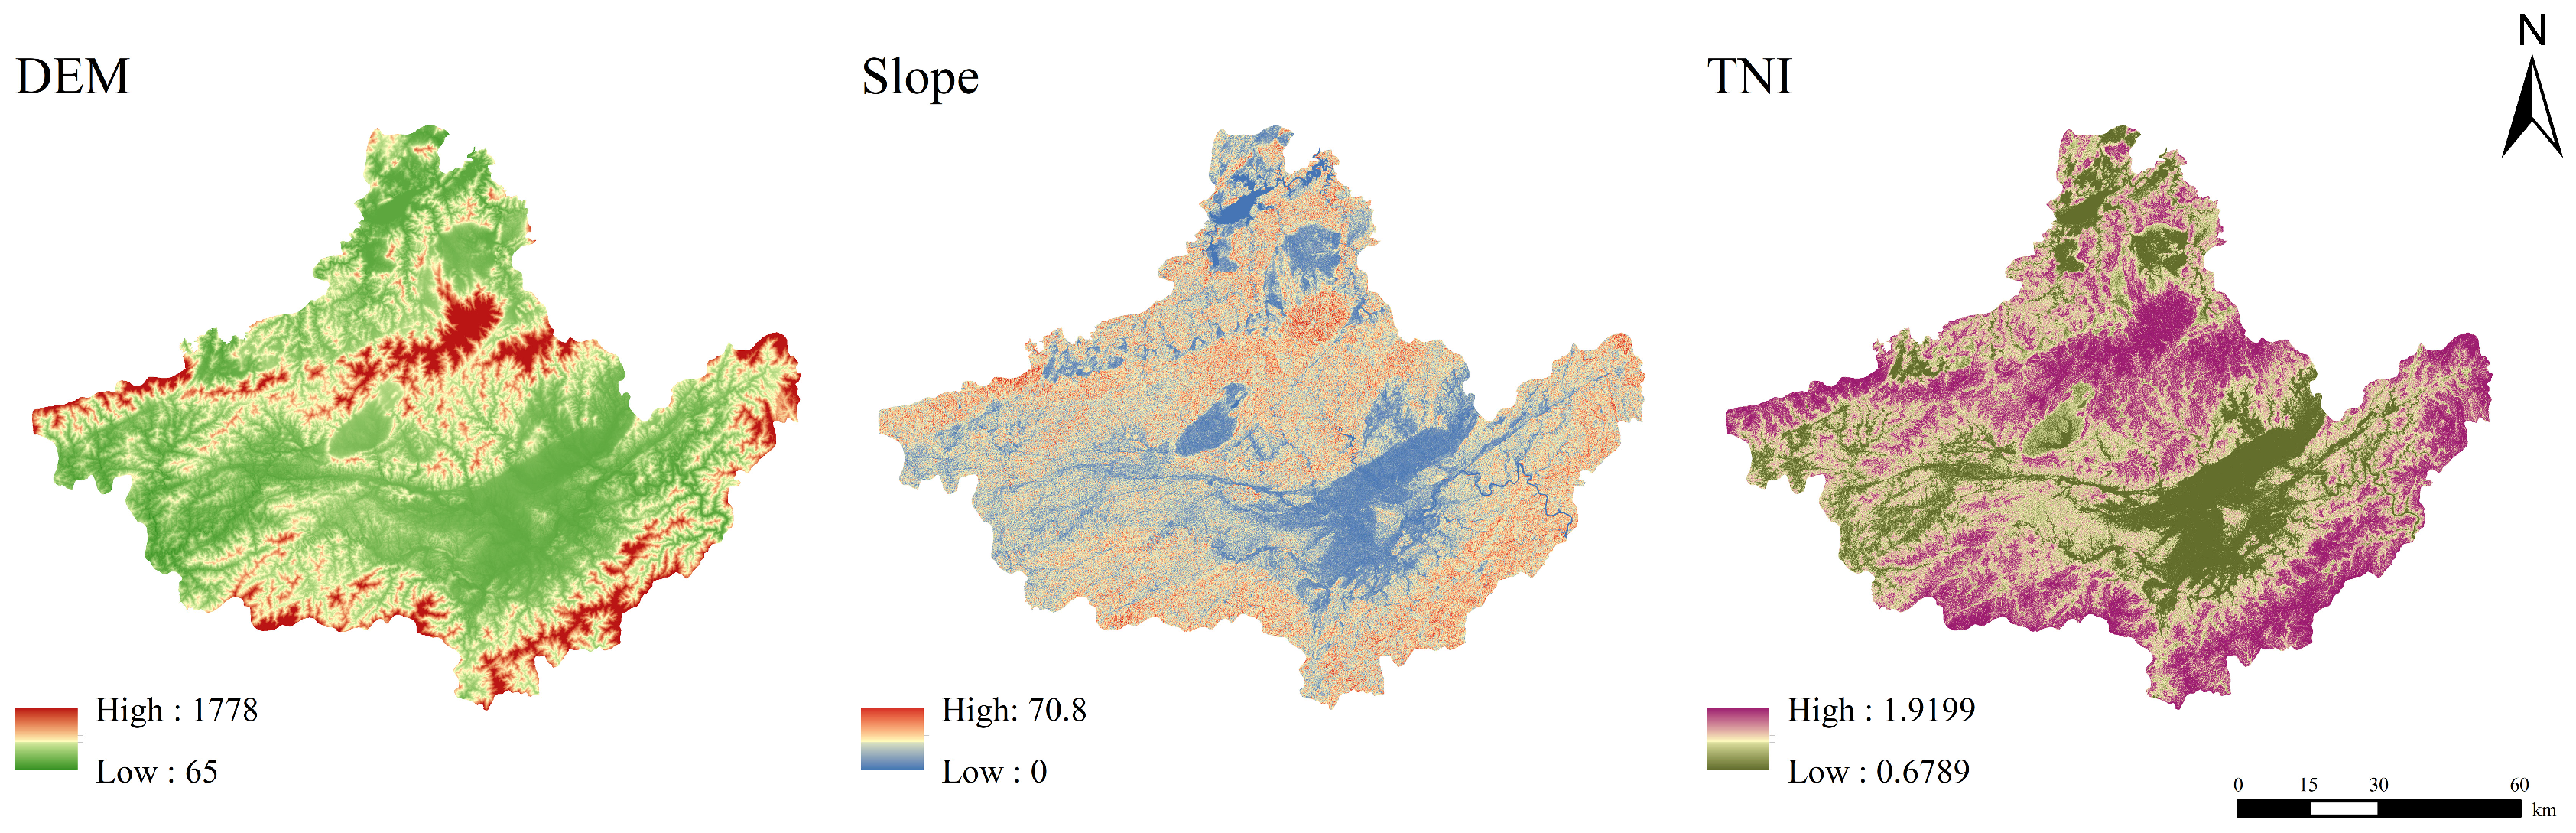
In this research, elevation, slope, and the TNI were selected as the primary topographic factors to systematically analyze the response characteristics of land use patterns and landscape ecological risks along topographic gradients in Huangshan City. Grounded in the specific empirical conditions of the study area, the aforementioned three topographic elements were hierarchically classified utilizing ArcGIS 10.8 software (Figure 2 and Table 3). Specifically, elevation was categorized into four discrete levels based on regional geomorphological features. The classification of slope was likewise structured into four levels, which adhered to the pertinent benchmarks outlined in the Technical Regulations for the Third National Land Survey [54] while concurrently incorporating the localized topographic nuances of Huangshan City. Furthermore, the TNI was stratified into five distinct levels utilizing the natural breaks (Jenks) classification method. In this study, the Terrain Niche Index (TNI) was adopted as the sole operational indicator for terrain gradient classification, with all five classes (T1–T5) directly delineated based on the natural breakpoints of TNI values. The elevation and slope ranges presented in Table 3 are not input variables or classification thresholds for the T1–T5 delineation; rather, they are statistical reference values used for post hoc characterization of the actual terrain combinations corresponding to each TNI class. This approach is designed to objectively capture spatial differentiation under the integrated constraints of terrain conditions, while avoiding the ambiguity of classification criteria that may arise from overlapping multi-indicator grading.

2.3.6. intPLUS Model

The intPLUS model [55] represents an advanced cellular automata (CA) framework integrating multi-type random seeds based on interaction networks (intCARS). The model structurally comprises three core modules:
The LEAS Module: The primary objective is to extract the potential for land expansion. This module identifies spatially expanded units for each land use type based on two-period land use data. Using a random forest algorithm, it is trained with multi-source driving factors as independent variables to calculate the probability of change for each land use category, while simultaneously outputting the relative contribution of each driving factor to expansion. This provides a crucial foundation for subsequent parameter calibration. It should be noted that the NDVI, meteorological, and socioeconomic driving factors used in this study were only available for 2012 and 2022. Since the LEAS module is designed to detect the long-term equilibrium relationship between the spatial differentiation of driving factors and the probability of land expansion over the entire calibration period (2002–2022), the model permits the input of driving factors as a single static baseline layer. In this study, the 2012 driving data are uniformly adopted as the static background baseline layer: during the model validation phase (simulating 2022), this approach avoids the “information leakage” issue that would arise from directly using the 2022 driving data; during the future projection phase (2032–2042), this baseline layer continuously serves as the basis for characterizing spatial differentiation. This processing logic balances methodological rigor with the actual availability of data.
The intCARS-calibration Module: Charged with model parameter calibration, this module centers on the multi-type random-seed CA operating under interaction networks (intCARS). It achieves self-calibration through a two-stage simulation process. In the first stage, a baseline CA simulation is executed to generate simulated maps, which are cross-referenced with observed data to extract the spatial distribution of discrepancies, thereby revealing systematic errors. Based on the discrepancy analysis, the second stage constructs a land-category interaction network and embeds the driver contributions derived from the LEAS module into the CA transition rules as weights for re-simulation. A comparison between the two stages demonstrates that the introduction of the interaction network significantly enhances simulation accuracy and effectively characterizes inter-category competitive dynamics, providing a quantitative basis for model calibration.
The intCARS-prediction Module: Designed for future land use forecasting, the intCARS-prediction module generates future land use pattern data by ingesting specified patch counts, transition matrices, and neighborhood weights.
(1)
Neighborhood Weight Setting
The neighborhood weight is a critical factor influencing land use conversion, reflecting the expansion capacity of each land use type under the influence of various driving factors. Its value ranges from 0 to 1, with values closer to 1 indicating stronger expansion capacity [56]. In this study, based on the land use transfer matrix from 2002 to 2022, the neighborhood weights were iteratively calibrated. By comparing the simulation accuracy of land use under different parameter settings, the final neighborhood weight parameters were determined (Table 4).
(2)
Transition Matrix Setup
The transition matrix is used to constrain the feasibility of conversions among different land use types, where “1” denotes allowed conversion and “0” denotes prohibited conversion. In this study, the transition constraints were established based on the actual land use transition patterns observed in Huangshan City from 2002 to 2022, as well as regional development policy orientations. Specifically, conversions from water bodies and construction land to other land use types were set to 0, so as to enforce the rigid protection of aquatic ecological spaces and to reflect the realistic fact that, once urban construction land is formed, it is difficult to reverse it into ecological land uses. Conversions among the remaining land use types were all set to 1, allowing bidirectional flows (Table 5). This configuration not only respects the historical transition patterns but also incorporates policy constraints related to ecological protection.
(3)
Model Accuracy Validation
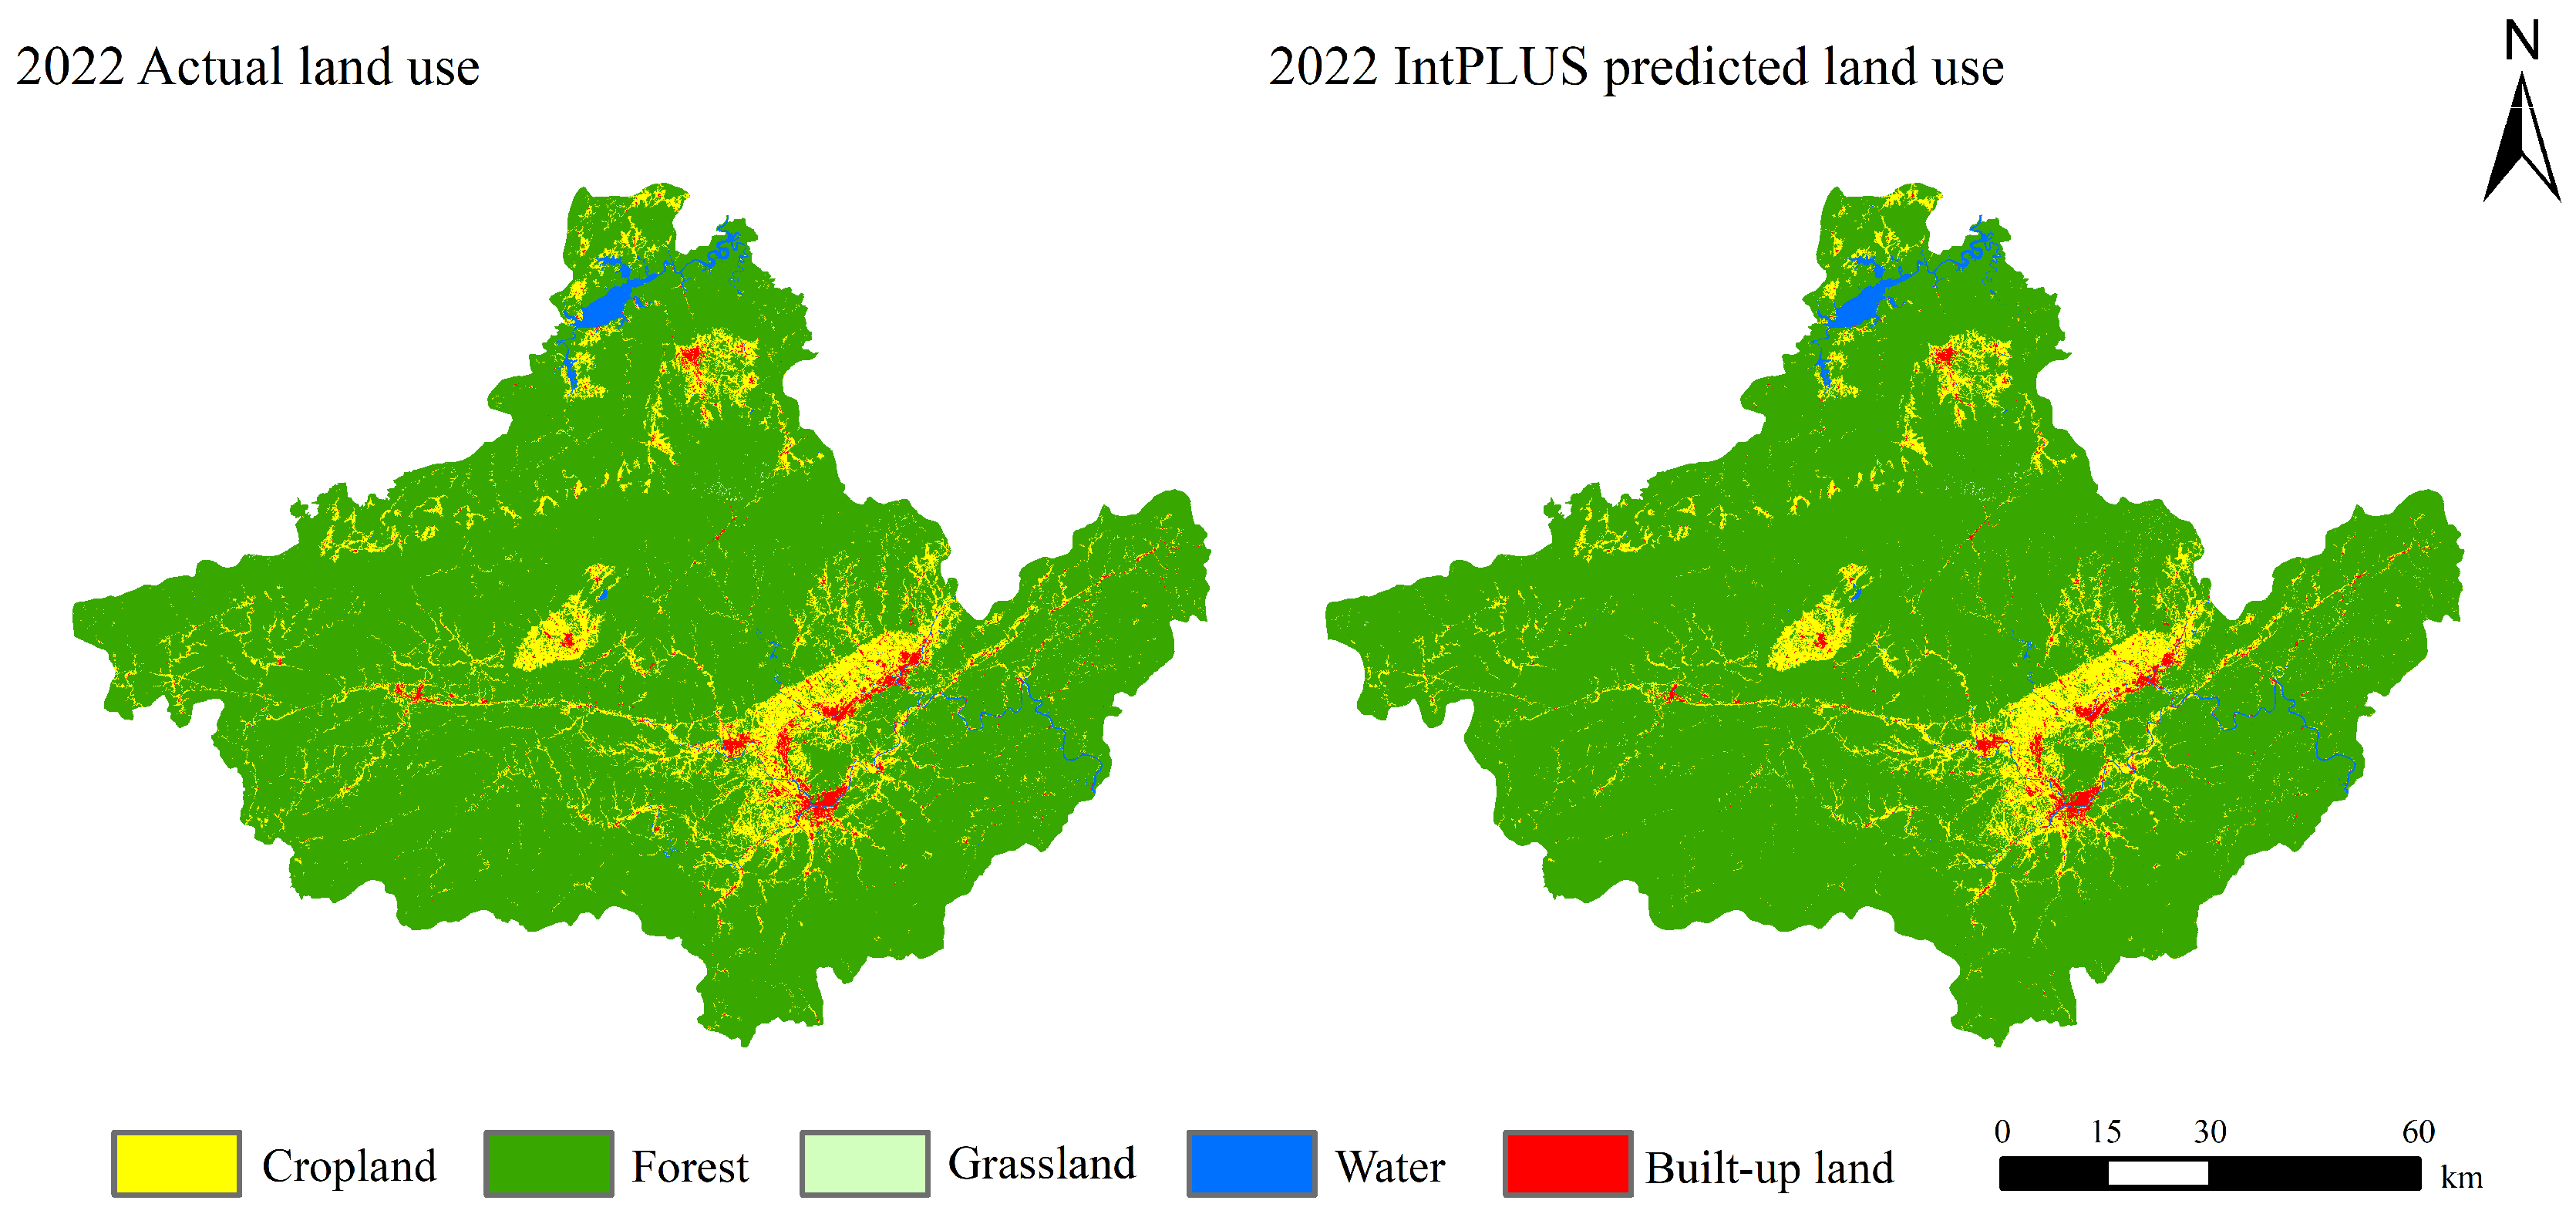
To systematically evaluate the simulation performance of the intPLUS model in Huangshan City, this study employed three metrics for cross-validation: the Kappa coefficient, Overall Accuracy, and the Figure of Merit (FoM). The validation was conducted by simulating the land use pattern for 2022 based on actual land use data from 2002 and 2012, along with baseline driving factors, and then comparing the simulated results with the actual 2022 land use data (Figure 3). The results showed that the Kappa coefficient reached 0.83 and the Overall Accuracy was 0.96, both significantly exceeding the generally accepted validity threshold of 0.75. The FoM value was 0.18, falling within the reasonable range (0.1–0.2) reported in comparable studies. Collectively, these three validation metrics demonstrate that the intPLUS model exhibits reliable simulation capability in Huangshan City and is fully applicable for predicting and analyzing future land use changes.

3. Results

3.1. Land Use Change Analysis

3.1.1. Characteristics of Spatiotemporal Land Use Evolution

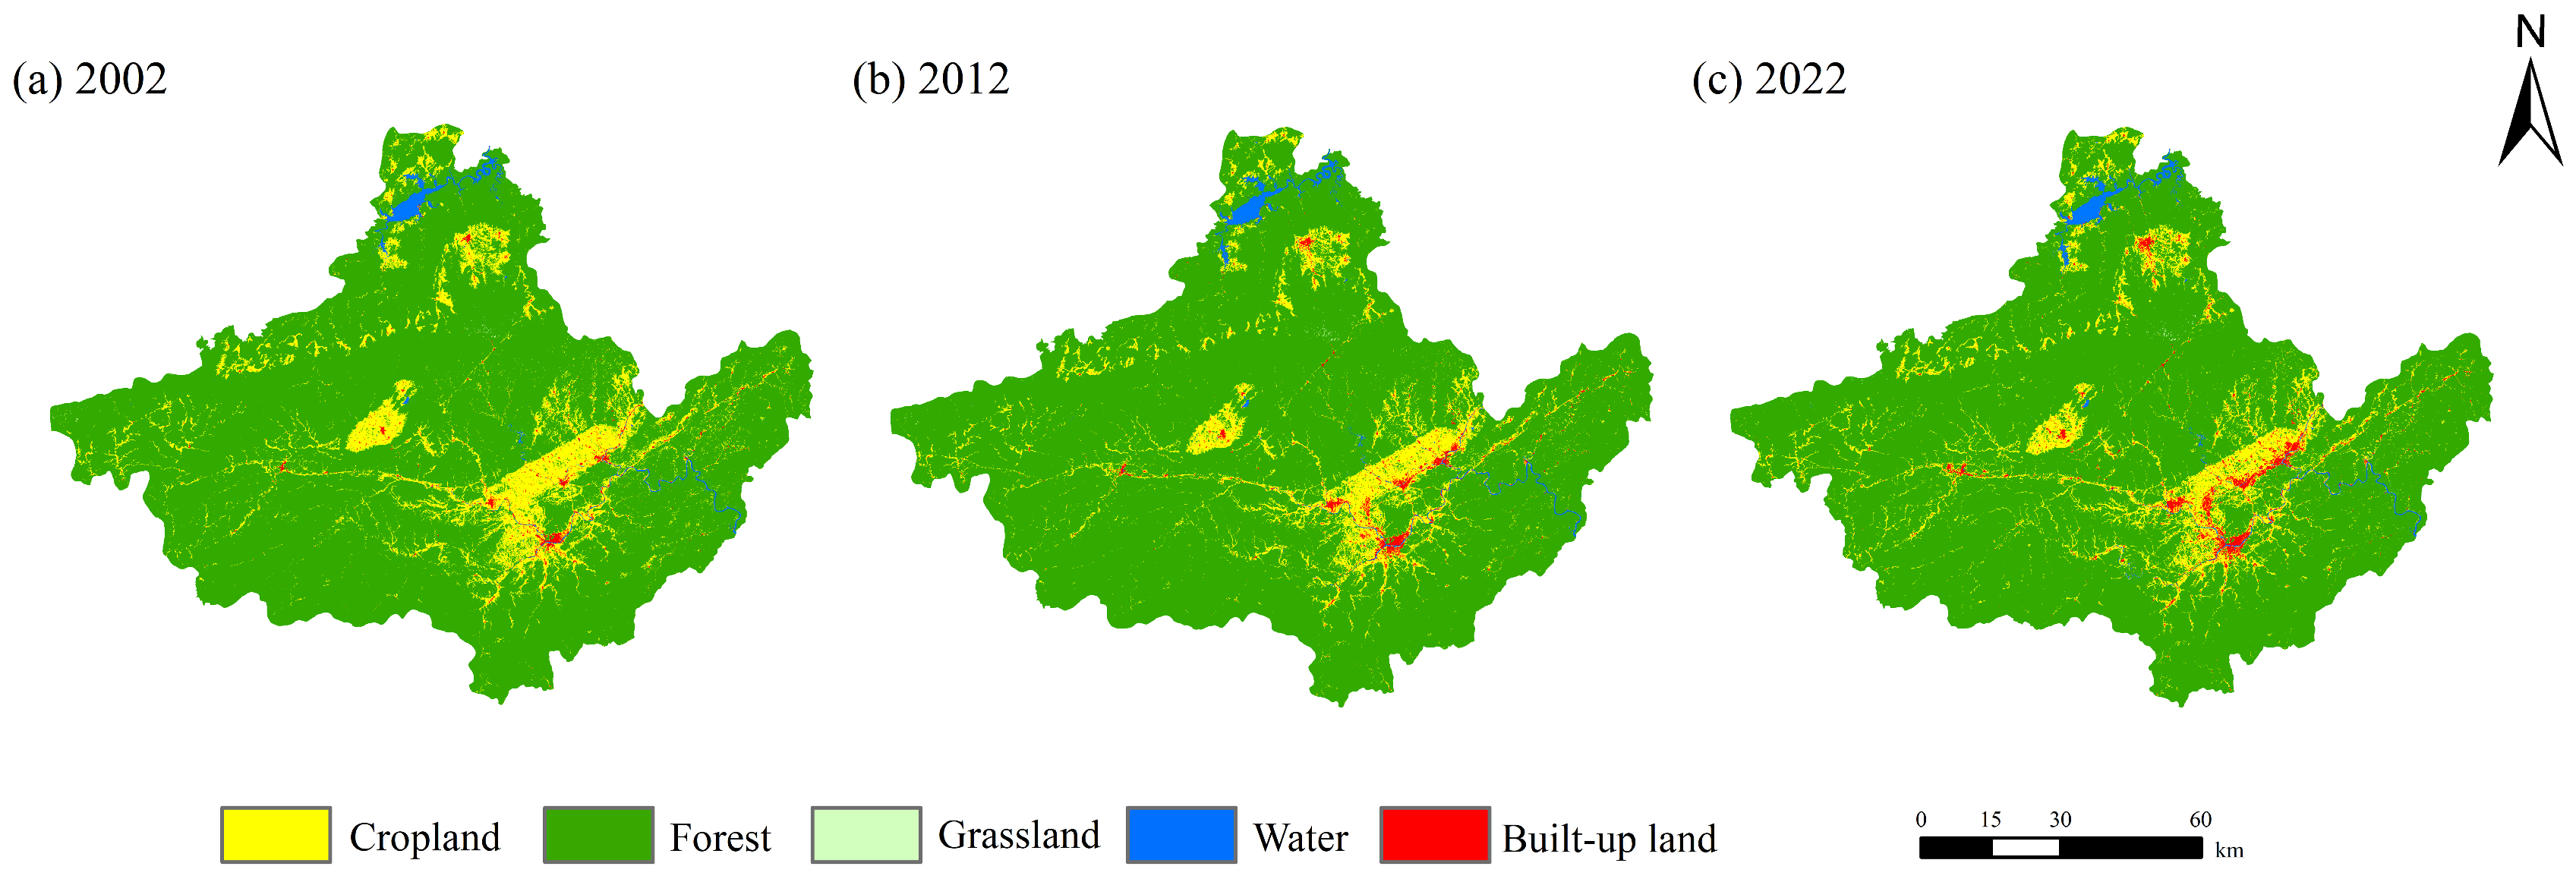
By combining the empirical metrics of area and proportion for major land use types in Huangshan City from 2002 to 2022 (Table 6) with their corresponding spatial distributions (Figure 4), it is clear that the study area has long been dominated by forest land. Forest land accounts for consistently more than 87% of the total geographic area, forming the fundamental ecological background of Huangshan City. In terms of net area trajectories between 2002 and 2022, construction land shows the most pronounced expansion. Its area increases from 65.9142 km2 in 2002 to 152.3655 km2 in 2022, while its share within the study area rises from 0.682% to 1.579%. Meanwhile, forest land—the core ecological asset—maintains strong structural stability with only a slight increase, expanding marginally from 8469.5895 km2 to 8472.6081 km2, and its proportion rises subtly from 87.602% to 87.798%. In contrast, cropland shows a fluctuating but overall decreasing trend, with a cumulative net reduction of 116.9721 km2. Water bodies exhibit a steady growth trajectory, increasing from 86.5728 km2 to 96.9813 km2, accompanied by an increase in their proportion from 0.895% to 1.005%. Grassland, characterized by a very low baseline area, continues to shrink, decreasing from 3.3201 km2 to 2.3067 km2, and its share declines from 0.034% to 0.024%.
From a spatial configuration perspective, forest land forms an extensive dominant matrix throughout the entire study area, characterized by widespread, homogeneous, and contiguous distribution, reflecting an exceptionally high level of forest cover. Cropland is mainly concentrated in the central and eastern river valleys, where it forms continuous linear patches and scattered patchy areas; sparse cropland is also found in the low-elevation northern valleys. With accelerated urbanization, construction land expands continuously, with its main concentration in Huangshan District and its growth nucleus around Tunxi District, from which it gradually extends to surrounding counties and towns. In addition, water bodies are predominantly distributed in Huangshan District and She County. Grassland remains extremely limited, appearing only as isolated, microscopic point-like mosaics embedded within the forest matrix. Overall, over the 2002–2022 period, Huangshan City maintained a land use pattern dominated by forest land, while simultaneously showing dynamic changes, including the contraction of cropland and grassland alongside the substantial expansion of construction land.

3.1.2. Spatiotemporal Transition Characteristics of Land Use Types

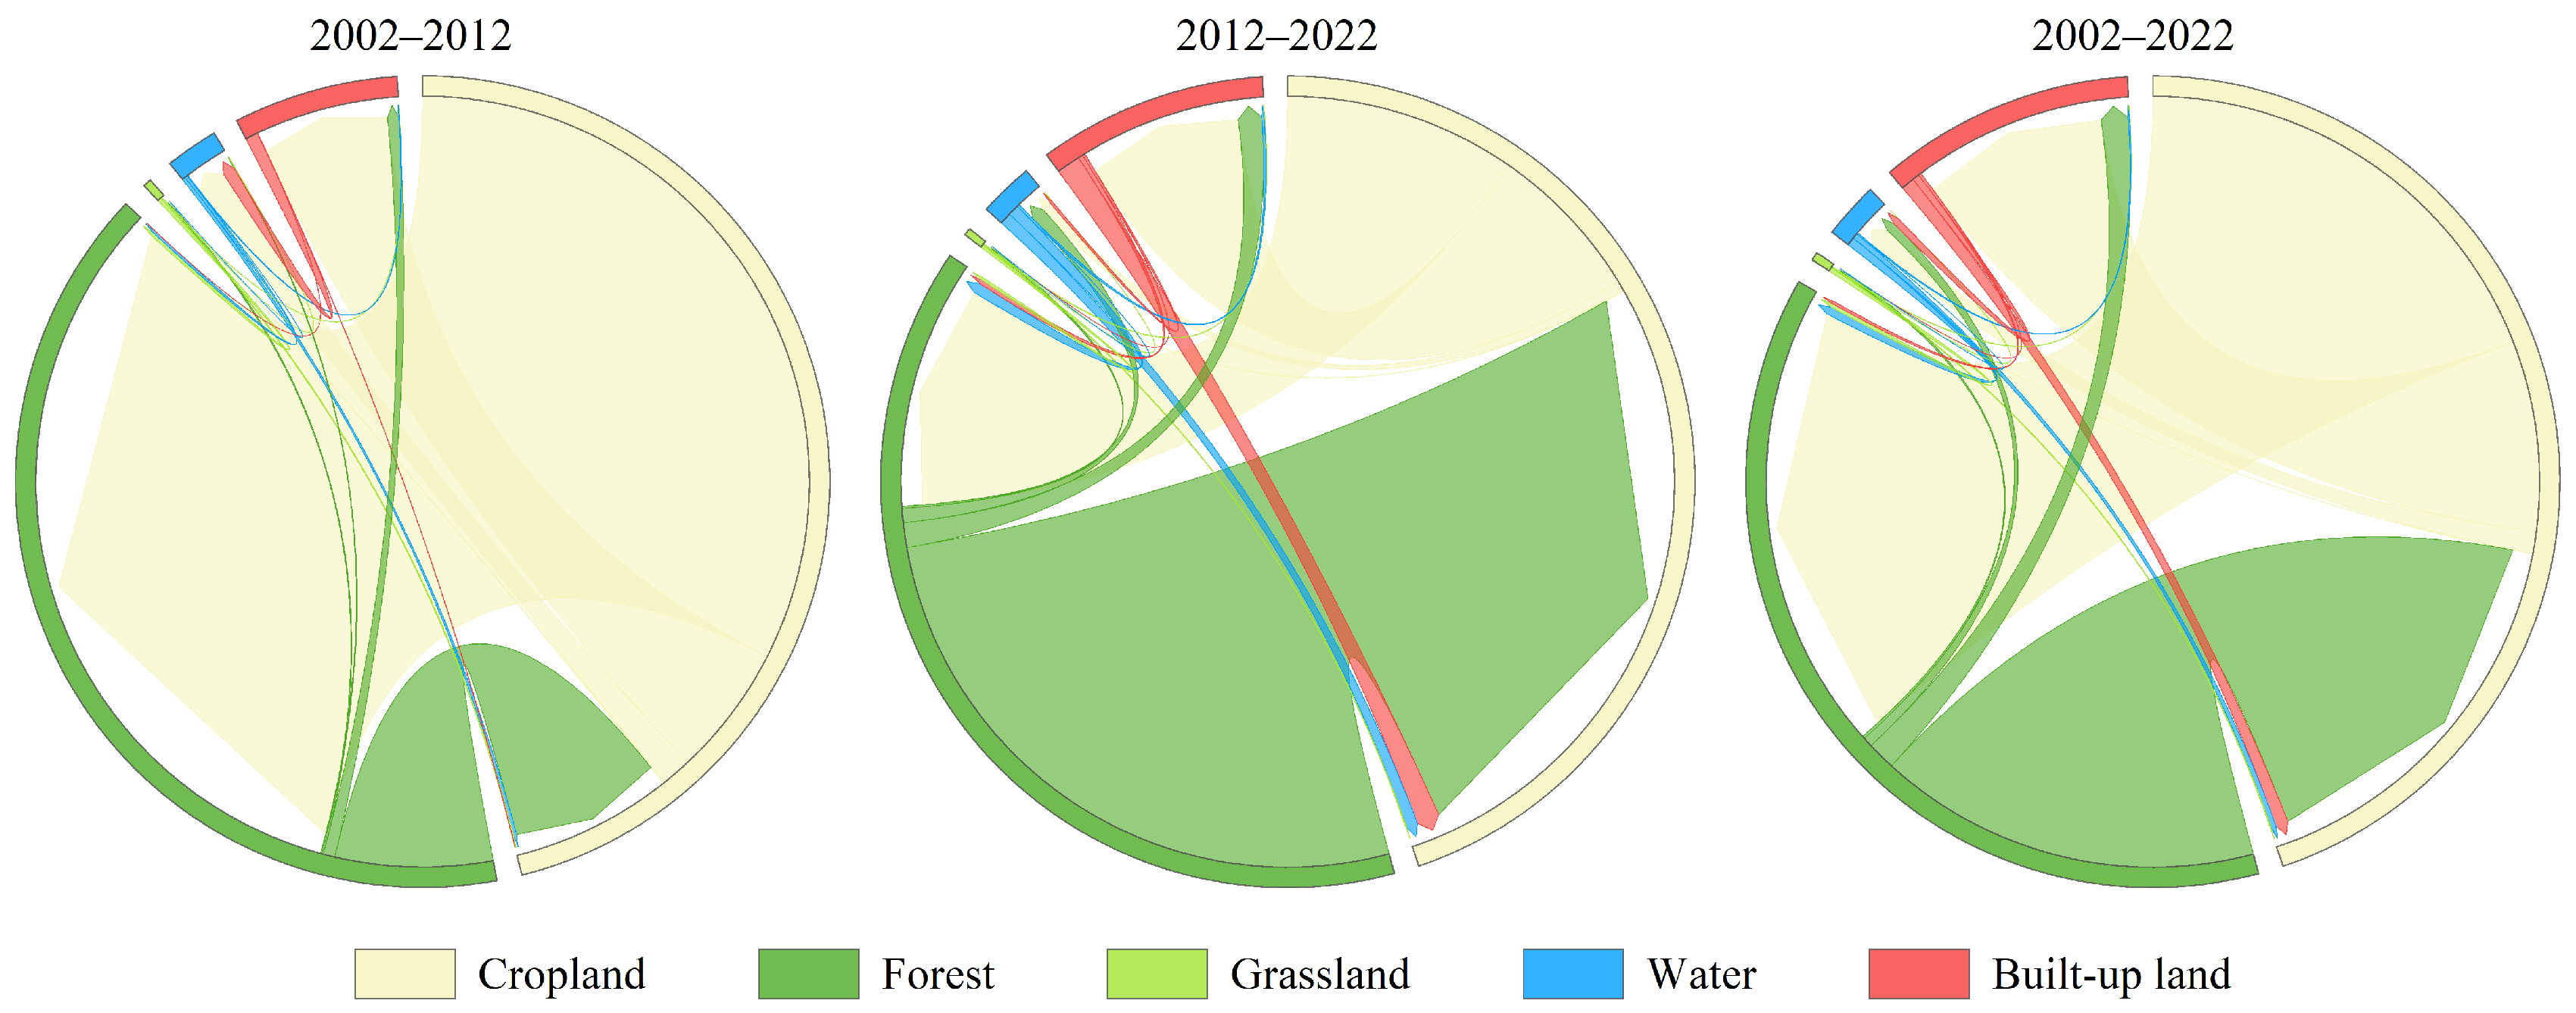
To visualize the conversion dynamics among different land use categories in Huangshan City, we constructed a chord diagram of land use transitions from 2002 to 2022 (Figure 5).
During 2002–2012, land use conversions within Huangshan City were dominated by mutual transfers between cropland and forest land. In this period, cropland exhibited a strong outward transfer to forest land, which served as the main driver of cropland area reduction. By contrast, the internal structure of forest land remained highly stable, with only minor transitions from forest land to cropland and construction land. Meanwhile, construction land expanded primarily by converting cropland, with a smaller contribution from forest land. Transitions involving water bodies and grassland were negligible.
Between 2012 and 2022, the intensity of land-category transitions increased markedly. Bidirectional transfers between cropland and forest land became the central feature. Importantly, the flow from forest land to cropland strengthened substantially, suggesting more active interactions between the two categories. At the same time, construction land expansion intensified further, as indicated by a clear increase in transferred-in area, which mainly came from cropland and forest land. Transitions involving water bodies also increased moderately.
Overall, across 2002–2022, the reciprocal transformation between cropland and forest land consistently dominated the land use change pattern in Huangshan City. Forest land, as the absolute dominant category with the highest share, exhibited substantial bidirectional interactions and a general dynamic equilibrium: it experienced outward flows to cropland and construction land while receiving a large influx from transferred cropland. Cropland served as the primary active category, strongly coupling with forest land and acting as the main source for construction land expansion. Construction land showed a steady, robust growth trajectory characterized by continuous unidirectional net transfer-in. By comparison, transitions of water bodies mainly occurred in the latter decade and remained limited in scale, whereas grassland conversion activities were the weakest throughout the entire period due to its extremely low baseline area.

3.1.3. Contribution Analysis of Driving Factors to Land Use Expansion

To precisely disentangle the differentiated driving mechanisms underlying the expansion of various land use types, this study employed the LEAS module of the intPLUS model and applied the random forest algorithm to calculate the normalized contribution values of ten driving factors to the expansion of five land use types. The results are presented in Table 7.
As shown in Table 7, the contributions of driving factors to the expansion of different land use types exhibit significant spatial heterogeneity. For construction land expansion, NDVI (24.28%) and population density (18.26%) ranked the top two in contribution, followed by DEM (11.66%). The highest contribution of NDVI quantitatively confirms that the rapid expansion of construction land did not occur in bare land or low-vegetation areas, but was mainly achieved by encroaching on forest land and cultivated land with high vegetation coverage, which is fully consistent with the land use transfer results presented above. The high contribution of population density reveals the rigid demand for residential and public service land driven by urban population agglomeration. GDP (8.85%) and nighttime lights (6.78%), as proxies of economic activity, showed relatively moderate contributions, reflecting that the urbanization of Huangshan City, as a tourist city, is a “population-land” synergistic type rather than being driven purely by industrial investment. The combined contribution of DEM and slope (19.65%) indicates that low hills and gentle slopes remain the basic topographic constraints for urban construction site selection.
For cultivated land and forest land, NDVI, DEM, population density, and hydrothermal factors (temperature and precipitation) collectively constituted the dominant driving forces. Among these, DEM exerted strong constraints on both cultivated land (15.75%) and forest land (12.17%), corroborating the traditional vertical differentiation pattern of land use, i.e., “farming on flatlands and afforesting on mountains.” Notably, the contribution of DEM to grassland expansion reached 38.46%, which, together with slope (11.72%) and soil type (12.67%), indicates that grasslands in Huangshan City are not the result of agricultural abandonment and succession, but rather represent primary or secondary natural vegetation patches in high-altitude, steep-slope areas with poor soil fertility and insufficient hydrothermal conditions. This finding is highly consistent with the actual landscape of Huangshan City, where forest cover is extremely high and grasslands are sporadically distributed. In addition, population density showed an exceptionally high contribution to water body expansion (35.41%), followed by mean annual precipitation (17.09%) and DEM (13.39%). This is mainly attributable to the dual control of population distribution and topographic catchment conditions on water conservancy facilities such as reservoirs and ponds within the Xin’an River basin and other watersheds in Huangshan City, and it also partially reflects that the water body category may include some pond surfaces.

3.2. Spatiotemporal Evolution of Landscape Ecological Risk

3.2.1. Spatiotemporal Distribution of Landscape Ecological Risk

To characterize the spatiotemporal evolution of landscape ecological risk in Huangshan City, we applied the natural breaks (Jenks) method to the landscape ecological risk index (ERI) for 2002, dividing it into five risk echelons. The risk classes were defined as follows: low-risk zone (ERI < 0.0321), lower-risk zone (0.0321 ≤ ERI < 0.0531), moderate-risk zone (0.0531 ≤ ERI < 0.0826), higher-risk zone (0.0826 ≤ ERI < 0.1516), and high-risk zone (ERI ≥ 0.1516). To maintain temporal comparability, the same classification thresholds were consistently applied to map the ERI risk levels for 2012 and 2022.
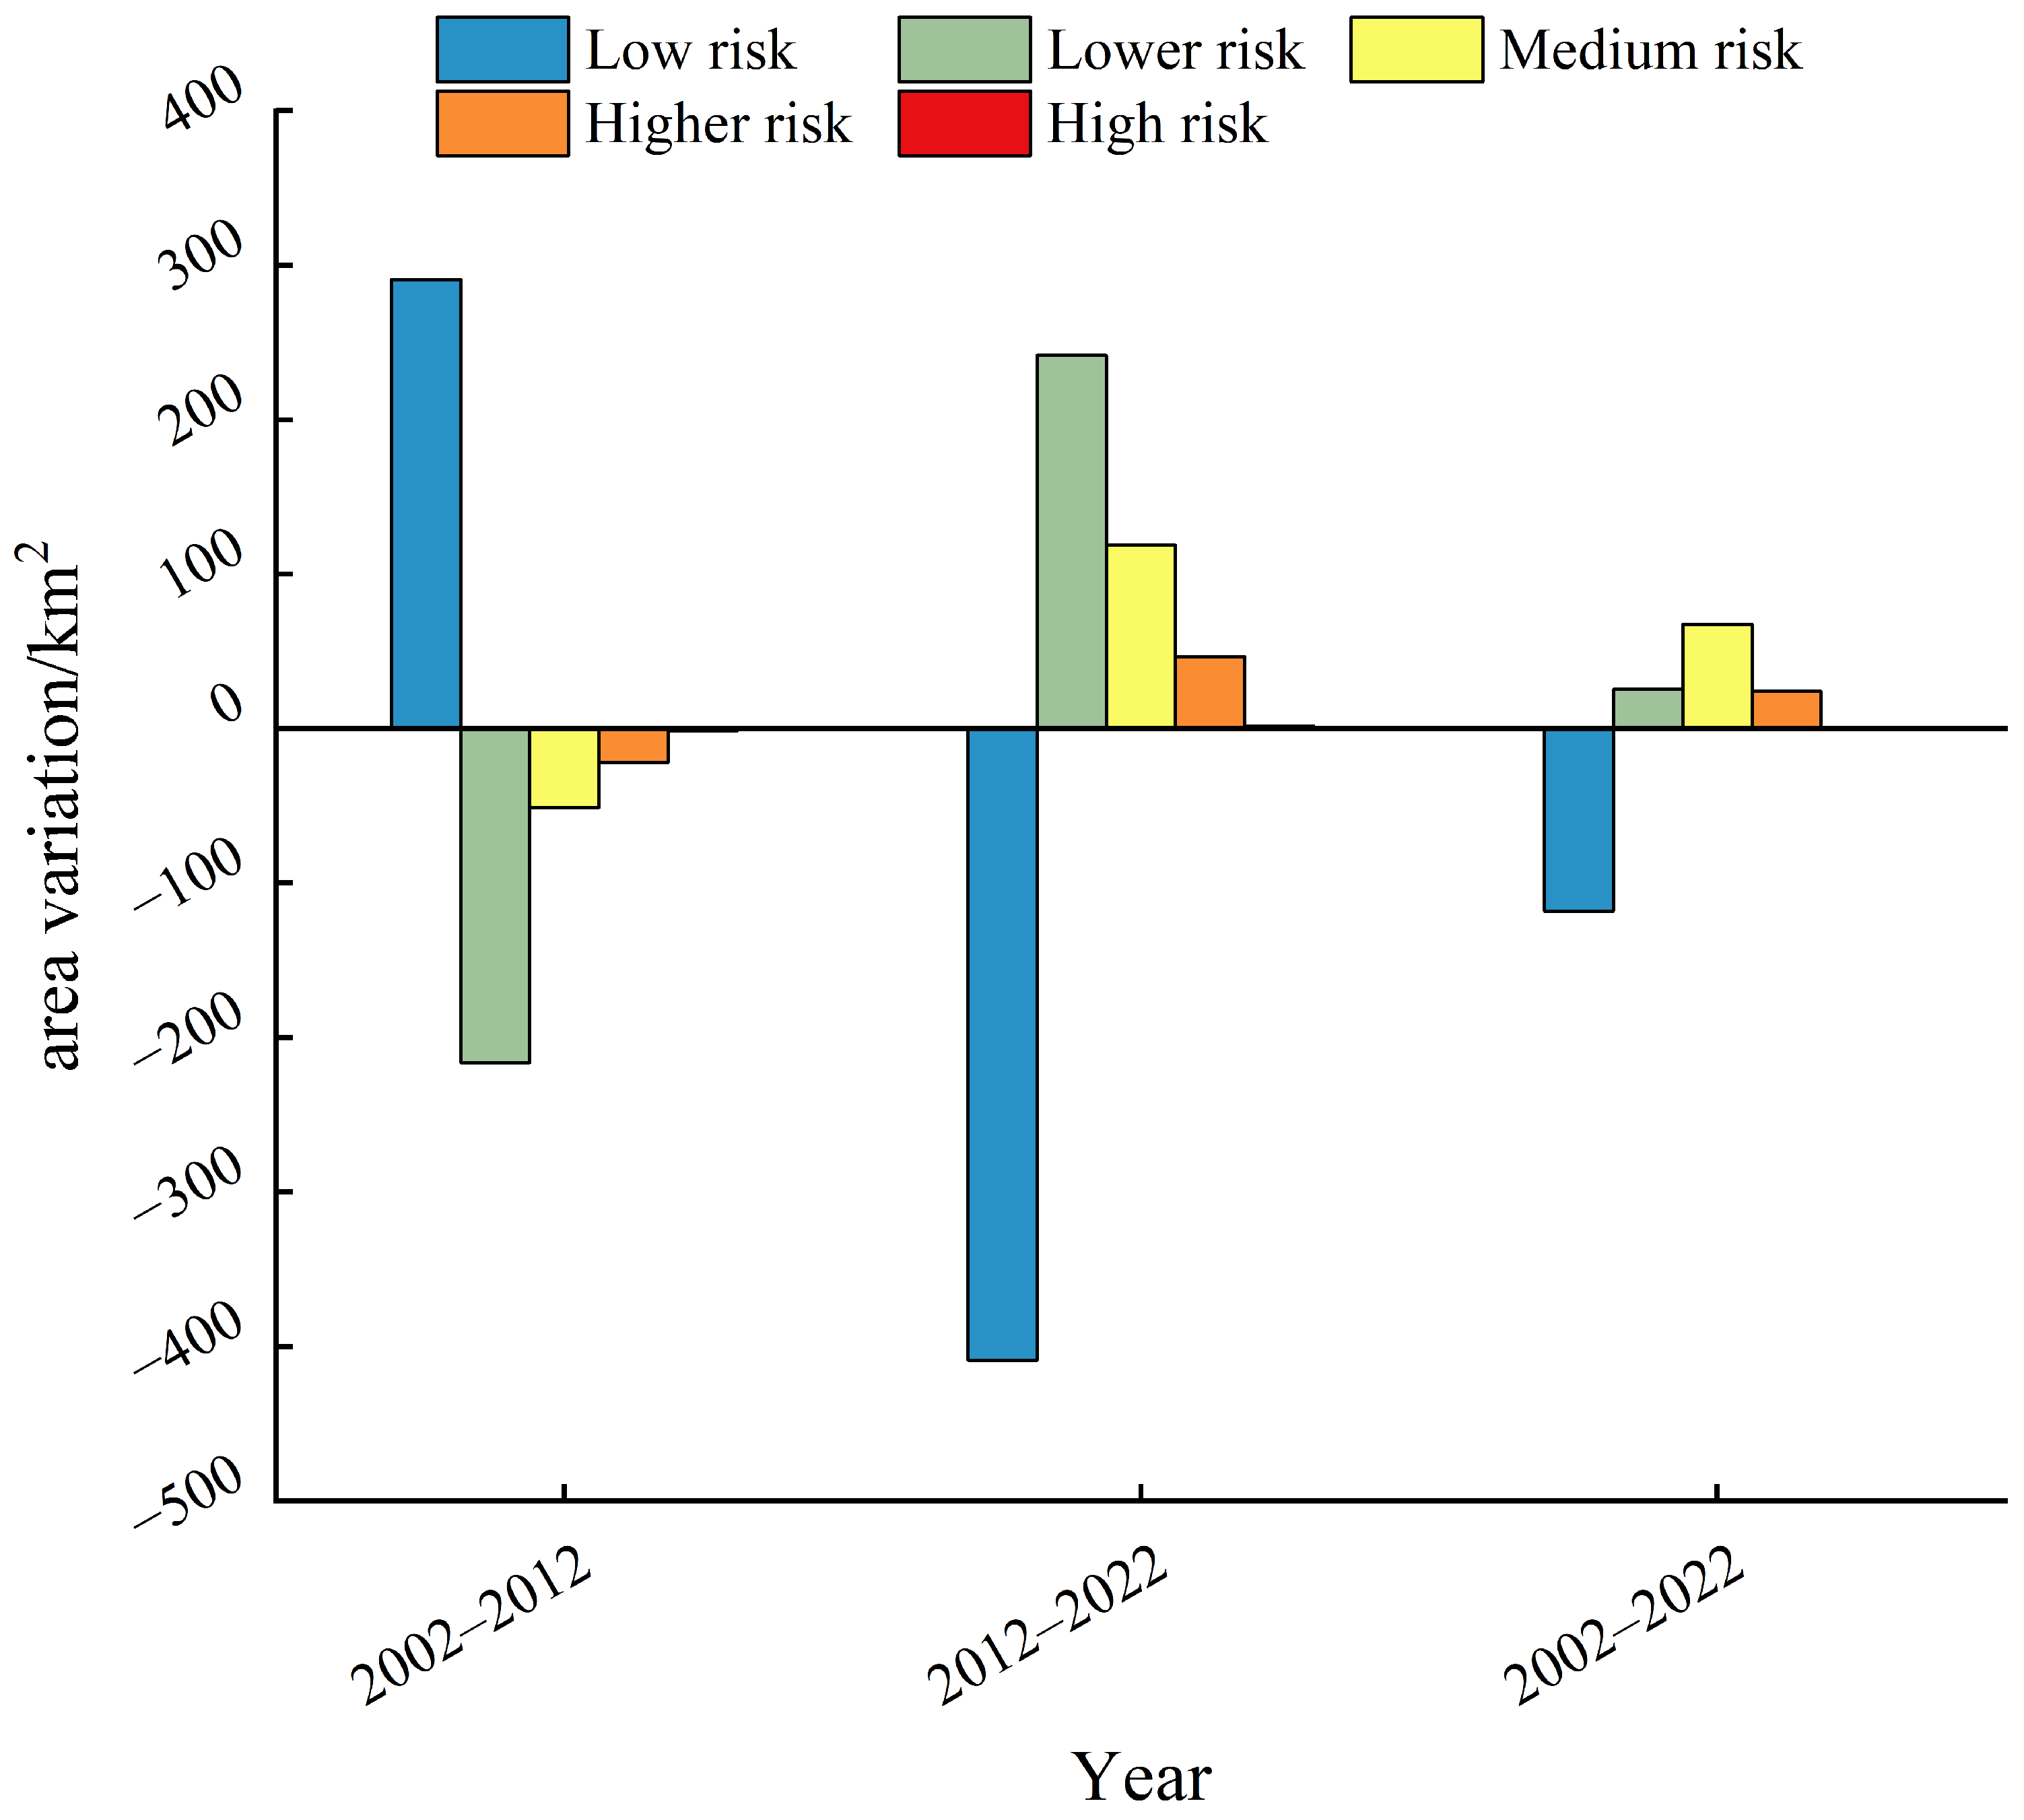
The structural changes in landscape ecological risk area in Huangshan City are summarized in Table 8 and Figure 6. From 2002 to 2022, the landscape ecological risk pattern followed a two-stage evolutionary trajectory of “initial optimization followed by subsequent rebound.” Over the 20-year period, the low-risk zone decreased by a net 118.05 km2, whereas the lower-, moderate-, higher-, and high-risk zones increased by 25.54, 67.70, 24.31, and 0.50 km2, respectively. Overall, this indicates a marginal deterioration trend mainly driven by the conversion of low-risk areas to moderate- and higher-risk echelons. In the first stage (2002–2012), the risk configuration improved markedly. The low-risk zone expanded by a net 290.91 km2, while the other four risk zones all contracted, suggesting a substantial shift in moderate- and high-risk patches toward lower risk levels and an improvement in the regional ecological environment. In contrast, this trend reversed in the second stage (2012–2022), showing clear “risk rebound” characteristics. The low-risk zone shrank sharply by 408.96 km2, while the lower-, moderate-, higher-, and high-risk zones increased by 241.80, 118.79, 46.38, and 1.98 km2, respectively. This reflects a pronounced “backward reflux” of areas that had previously been optimized, accompanied by a renewed concentration of localized ecological pressure.
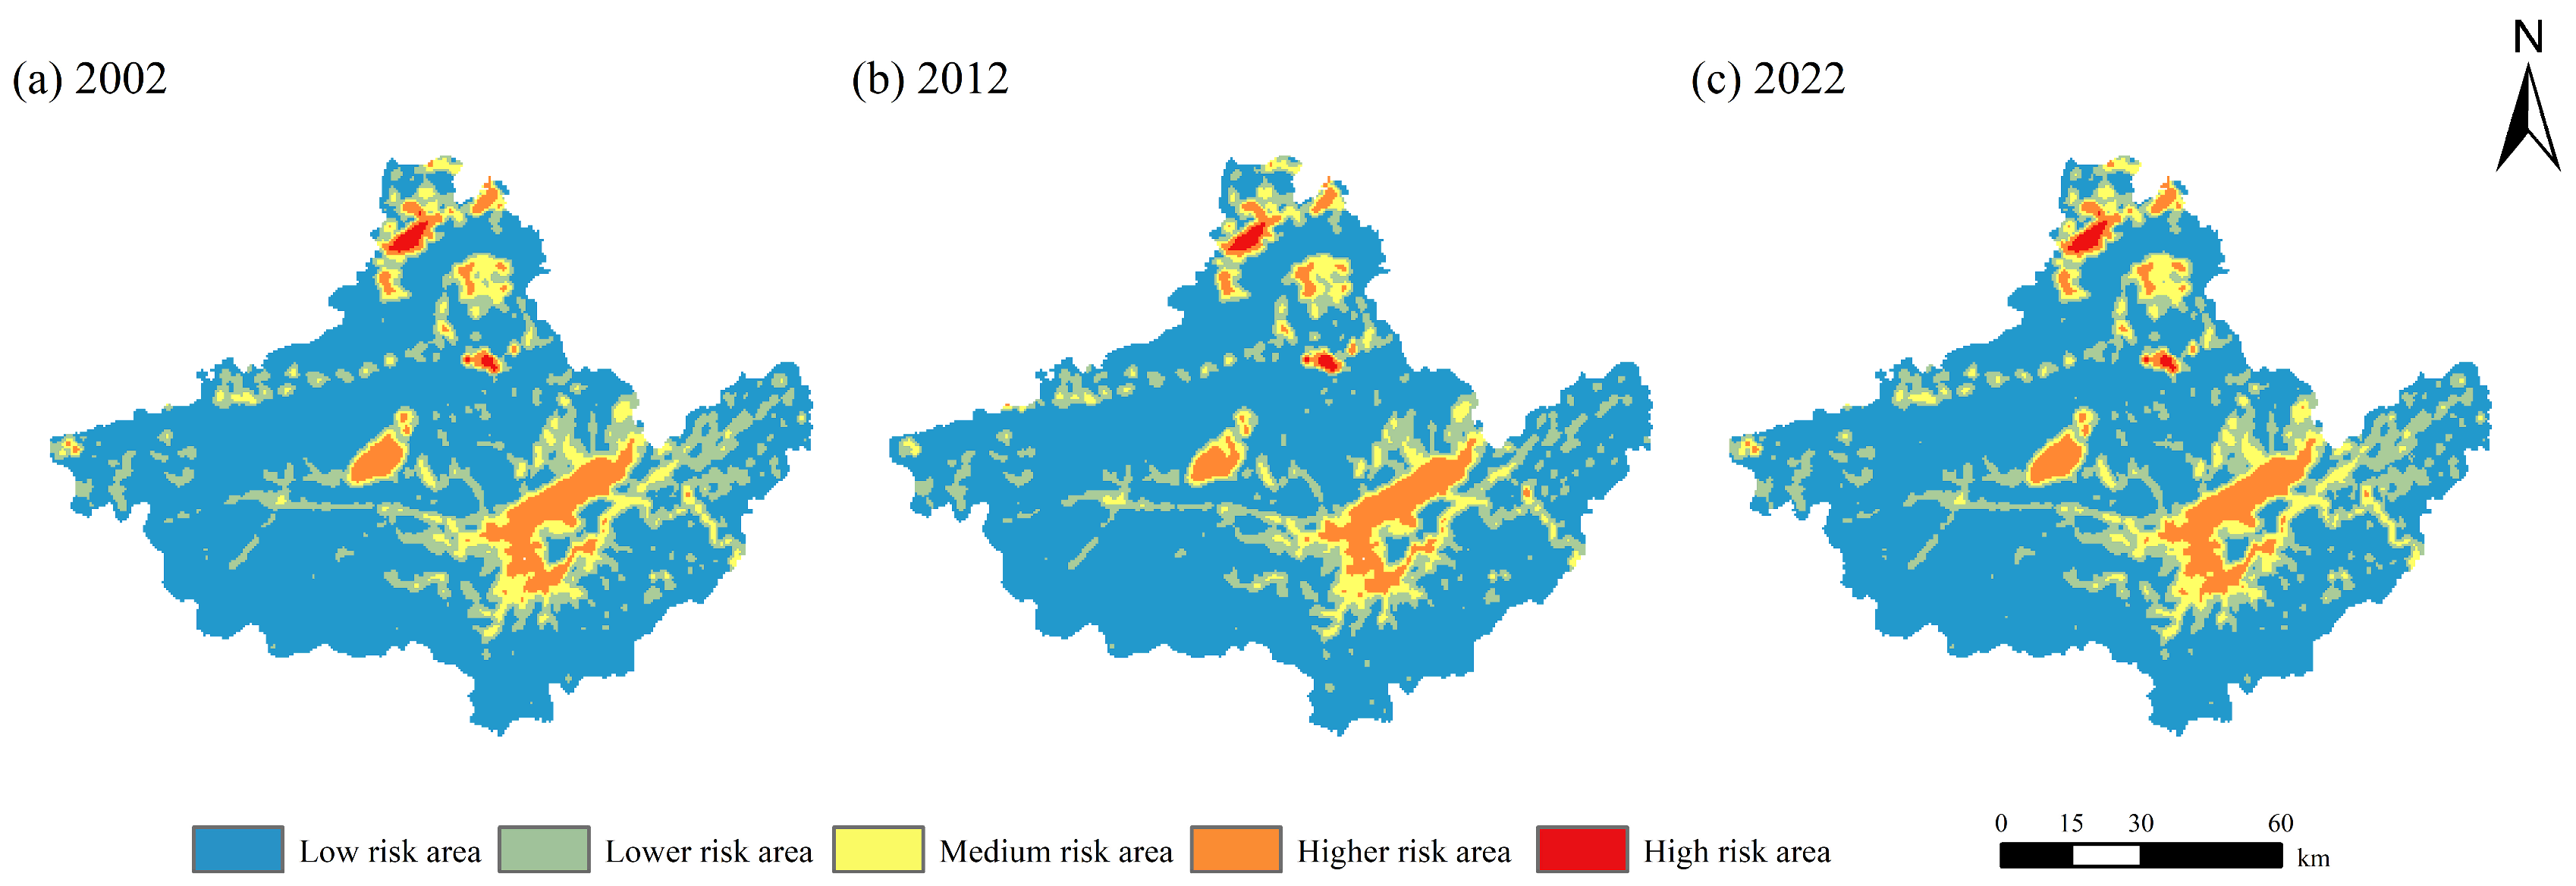
Ordinary Kriging interpolation was used to visualize the multi-temporal landscape ecological risk pattern of Huangshan City (Figure 7). Spatially, landscape ecological risk exhibits strong concentric zoning and patch aggregation, maintaining a relatively stable macro-pattern with substantial local variations. Between 2002 and 2022, the low-risk zone acted as the dominant landscape matrix, continuously and widely distributed across the extensive forested terrains in the southern, western, and central regions, indicating a strong baseline ecological substrate. The lower- and moderate-risk zones formed transitional belts around the matrix boundary. Meanwhile, the higher- and high-risk zones appeared as clustered patches, mainly located in the core scenic areas of Huangshan District and their surrounding areas, within the central–western basin urban agglomeration (the Xiuning–Tunxi–Huizhou contiguous urban belt), and in localized pockets of intense economic activity in the eastern part of the city. During 2002–2012, the spatial pattern was characterized by a “centripetal contraction” of high-risk patches. The northern high-risk core slightly decreased in area; the higher-risk zones surrounding the south-central urban areas contracted; and the lower- and moderate-risk transitional belts shifted inward, further expanding the coverage of the low-risk matrix. Then, during 2012–2022, the dynamics changed to a “stepwise outward expansion.” Both the northern high-risk zone and the central higher-risk zone expanded outward, accompanied by increased patch areas, while the peripheral lower- and moderate-risk transitional belts widened substantially. Overall, from 2002 to 2022, landscape ecological risk in Huangshan City evolved from localized contraction to outward, concentric radiation centered on urban nodes and scenic hotspots. Due to the strong late-stage risk rebound, all risk echelons except the low-risk zone recorded net area increases over the 20-year period, resulting in the contiguous expansion of high-risk zones and pronounced localized ecological degradation. Therefore, differentiated ecological redline regulations targeting high-risk cores and intensified ecological restoration efforts are urgently needed in future spatial planning.

3.2.2. Spatiotemporal Transitions and Variations in Landscape Ecological Risk Areas

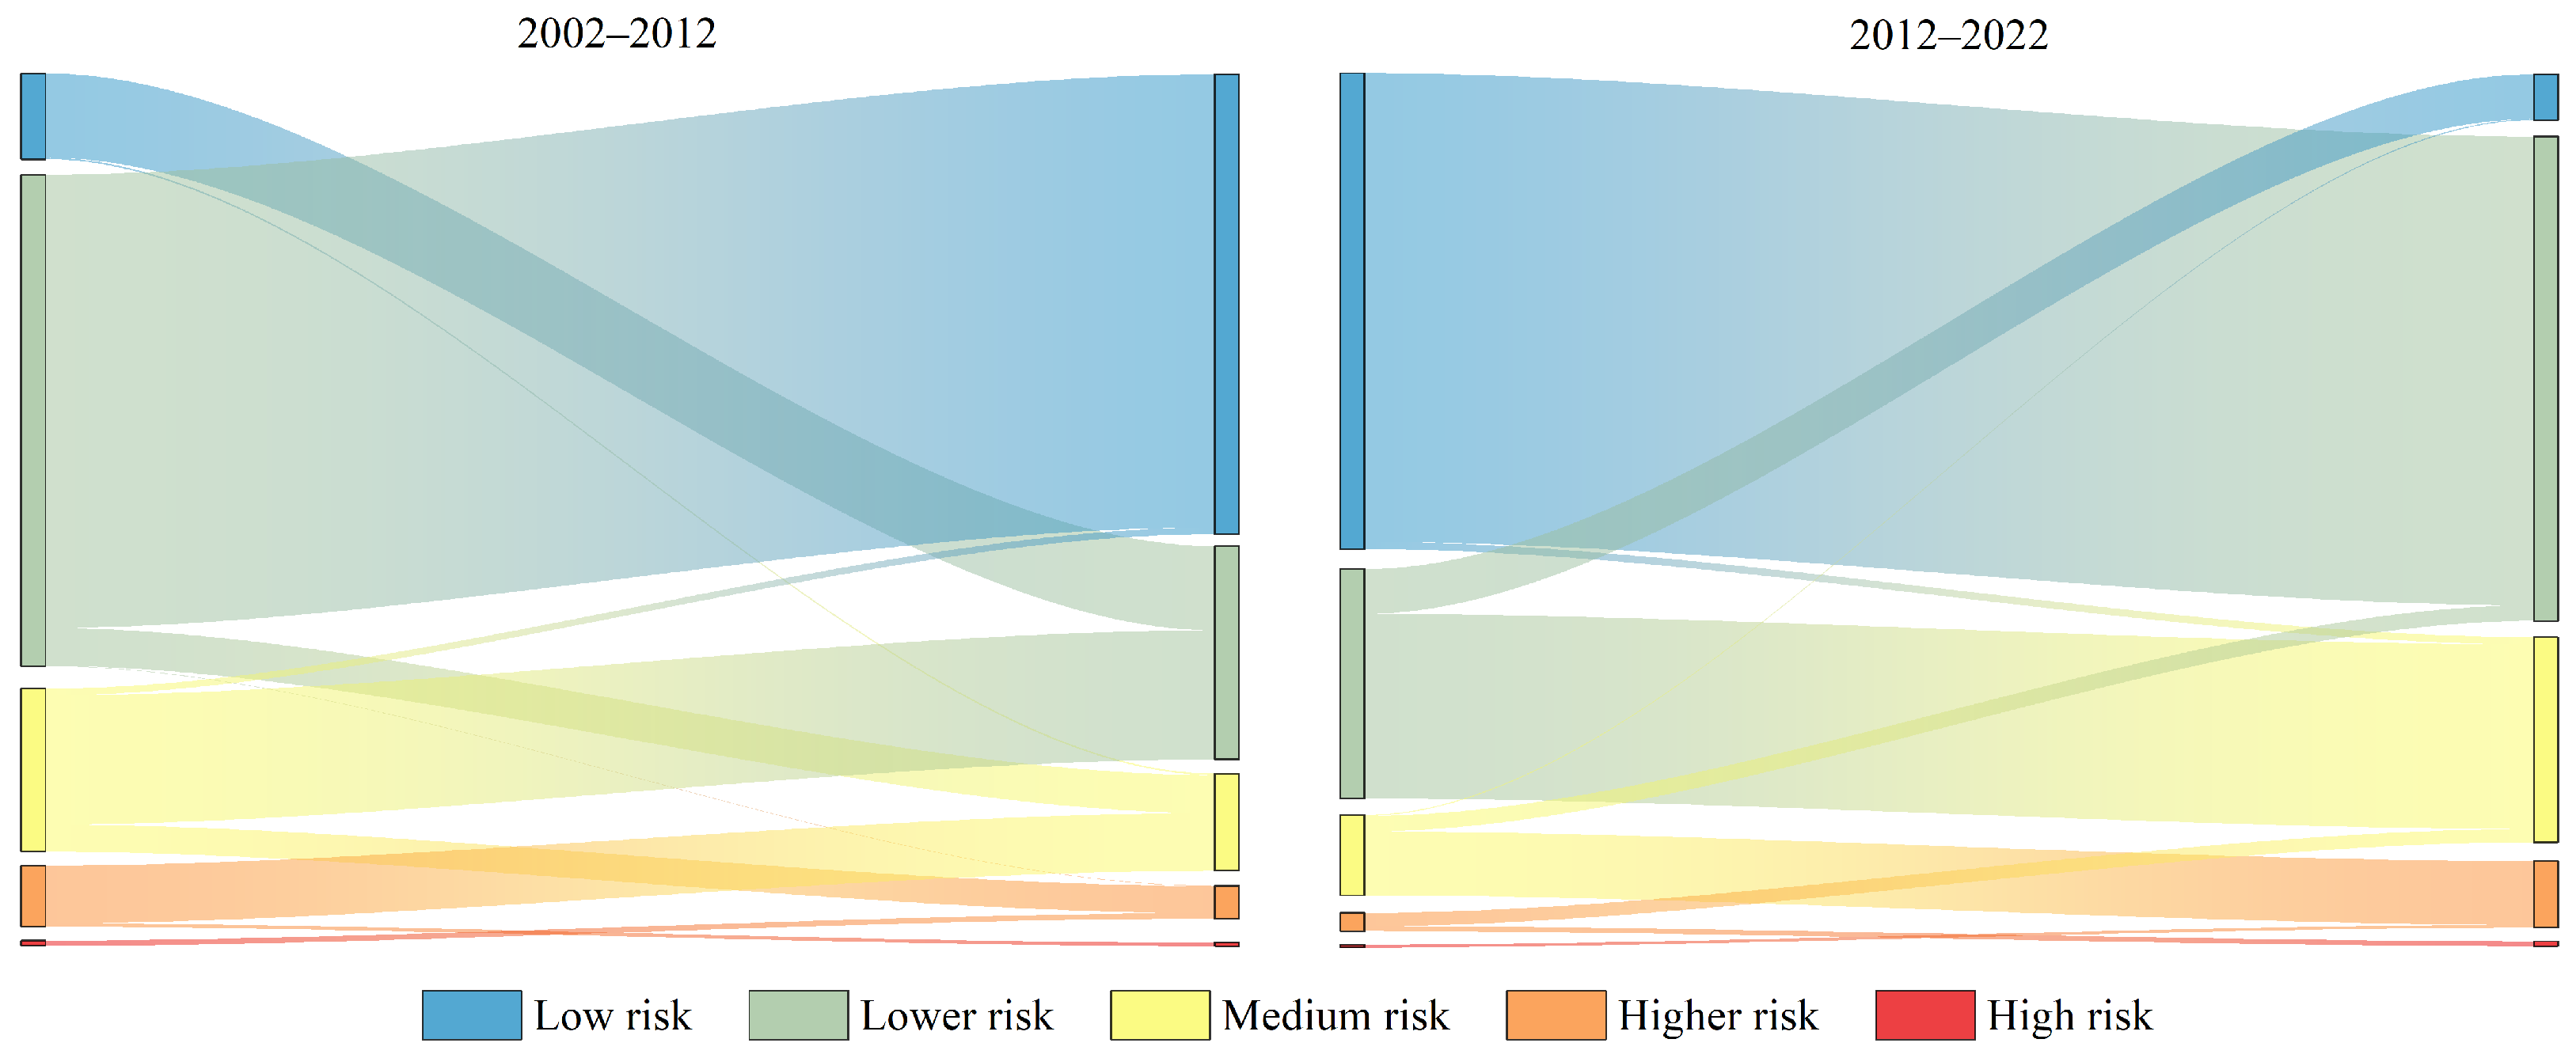
To elucidate the dynamic evolutionary characteristics of landscape ecological risk in Huangshan City, we quantitatively characterized the transition processes among different risk levels across two sequential periods from 2002 to 2022 using Sankey and chord diagrams (Figure 8 and Table 9, Table 10 and Table 11). From 2002 to 2012, a substantial share of lower-risk areas transitioned into low-risk zones, whereas medium-risk zones mainly shifted toward lower-risk categories. At the same time, higher-risk zones showed partial outflow to medium-risk zones. Overall, the dominant trend across all transition pathways was a downward migration toward lower risk levels. As a result, the total area of low-risk zones expanded markedly, while the lower-risk, medium-risk, and higher-risk zones all contracted to varying degrees. Collectively, this indicates an overall decline in landscape ecological risk and clear ecological improvement.
In contrast, between 2012 and 2022, the transition dynamics exhibited a prominent reversal. Large areas of the low-risk zone were converted into lower-risk zones. In addition, there were outflows from lower-risk to medium-risk and from medium-risk to higher-risk, all of which represent an escalation in ecological risk levels. In the second decade, the sharp shrinkage of low-risk zones, together with the concurrent expansion of lower- and medium-risk zones, triggered a resurgence of overall landscape ecological risk. Across the full 20-year period, a strong reciprocal transformation between low-risk and lower-risk zones was observed. The stage-based comparison suggests that ecological conditions improved during the first decade, but then experienced a degenerative reversal and increased risk pressure during the latter decade. Therefore, it is crucial to remain vigilant against the worsening trend in recent years. Targeted ecological conservation and stricter spatial control measures should be strengthened to curb the progression of low-risk areas toward higher-risk categories and to safeguard regional ecological security.

3.3. Analysis of Topographic Gradient Effects

3.3.1. Characteristics of Land Use Transitions Across Different TNI Gradients

Based on the five terrain gradients (T1–T5) delineated using the TNI natural breaks method in the preceding section, this section further examines the spatial differentiation patterns of both land use transfers and landscape ecological risk across these terrain gradients.
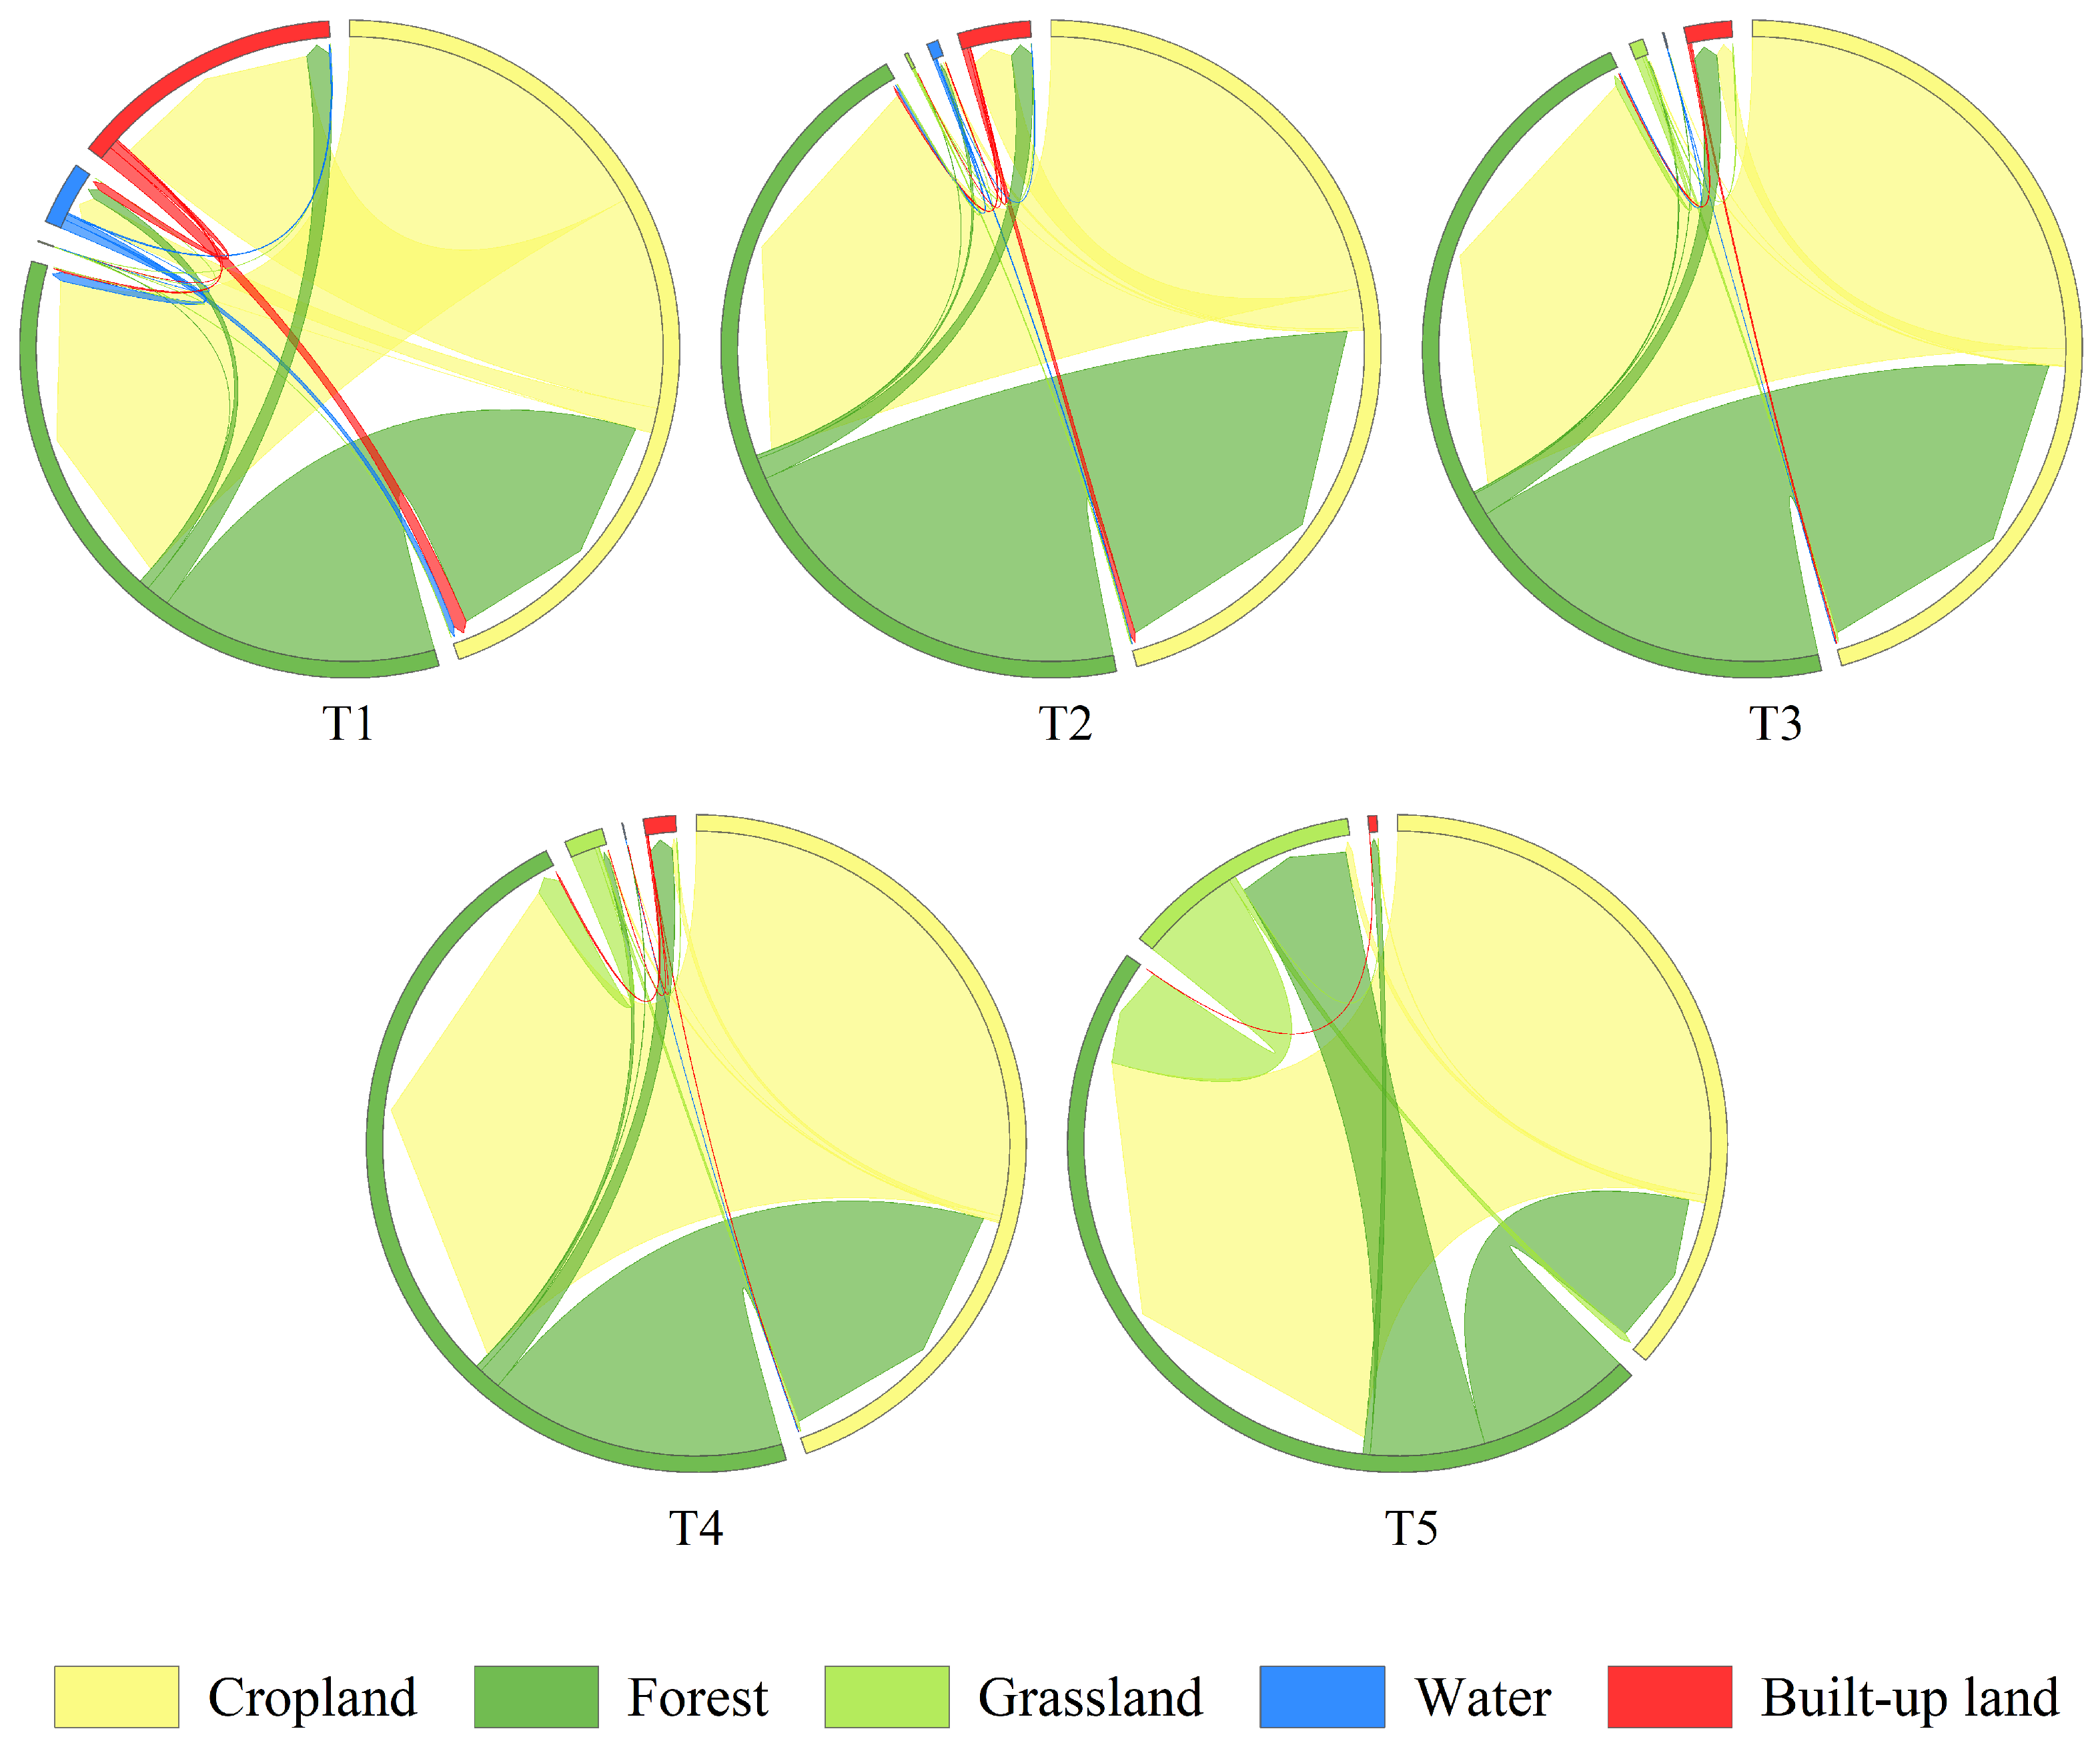
According to the chord diagram analysis of land use transitions across topographic gradients shown in Figure 9, land use conversion dynamics in Huangshan City exhibit clear spatial differentiation among different terrain levels. Overall, the mutual transformation between cropland and forest land is the dominant transition process across the T1–T5 gradients, and this bidirectional flow consistently characterizes the evolutionary pattern at each terrain stage.
More specifically, at lower terrain gradients (T1 and T2), the reciprocal conversion between cropland and forest land is most intense. This mainly reflects the relatively flat terrain and favorable conditions for agricultural production. In parallel, these areas act as core zones for the expansion of urban and rural construction land. Only small proportions of both cropland and forest land are converted into construction land. As elevation increases (from T3 to T5), the conversion into construction land declines progressively, becoming nearly negligible at the T5 level. At higher-terrain gradients, the scale of forest land shifting to cropland decreases substantially. Due to constraints such as complex mountainous topography and limited arable land, anthropogenic agricultural disturbance weakens, leading the land use structure to move toward a more natural and stable state. In addition, as the terrain gradient increases, the expansion of grassland becomes progressively more prominent, with forest land serving as the main source of this transition. This suggests that high-altitude areas, under ecological protection policies and/or driven by natural succession, tend to develop more diverse surface cover. In contrast, the conversion into water bodies shows a gradual downward trend with increasing terrain gradients. This pattern is largely attributable to the relatively stable distribution of water systems and the more stable geomorphological setting of water bodies in higher-elevation areas. Overall, land use transition trajectories in Huangshan City clearly reveal a vertical zonality pattern: land use shifts from a low-altitude “anthropogenic-driven” mode toward a high-altitude “natural-ecology-dominated” regime.

3.3.2. Characteristics of ERI Across Different TNI Gradients

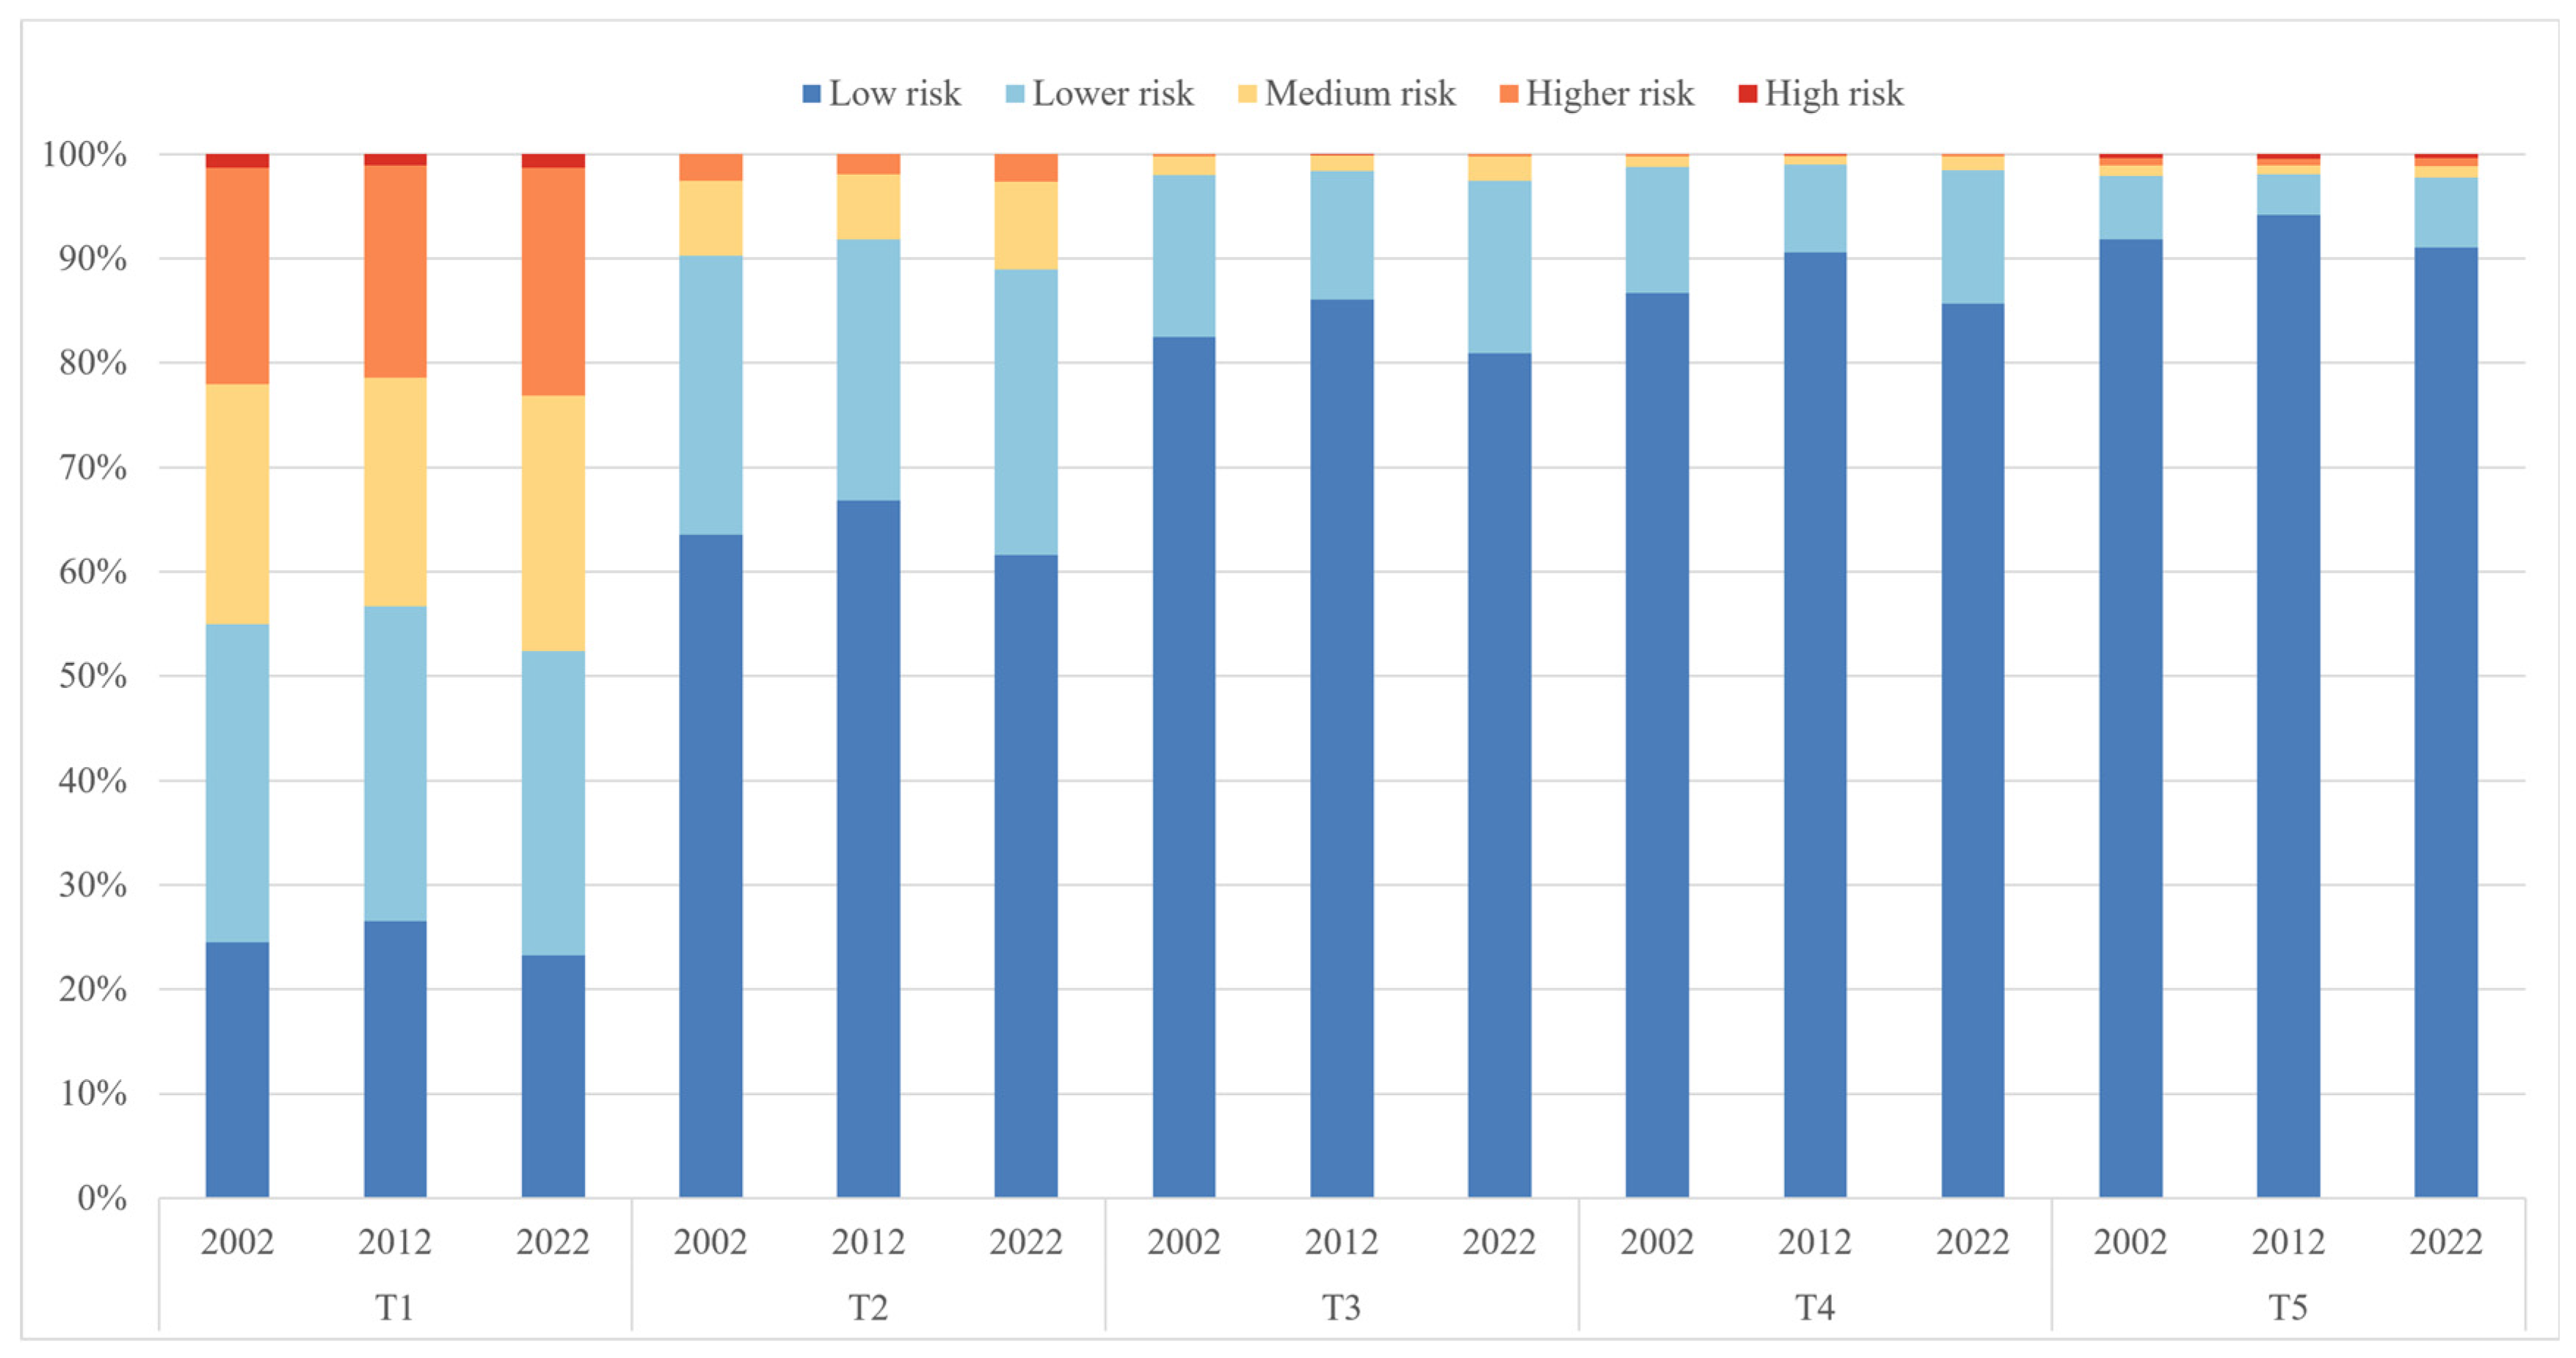
Based on the spatial zonal analysis function in ArcGIS 10.8, we overlaid the landscape ecological risk maps with the TNI zoning maps. This allowed us to derive the area proportions of different landscape ecological risk levels across TNI gradients in Huangshan City from 2002 to 2022 (Figure 10). The results show that, as TNI increases from T1 to T5 over 2002–2022, landscape ecological risk generally exhibits a stepwise declining pattern across all gradients. With respect to the structural composition of risk levels, clear differences emerge. As TNI increases, the spatial extents characterized by high, relatively high, and medium risk gradually shrink, while low-risk zones expand continuously. In the low-gradient T1 areas, the proportions of relatively high, medium, and high risk reach the highest levels, indicating an overall high level of ecological risk. Temporally, although the proportions of low- and relatively low-risk classes show a slight increase from 2002 to 2012, a rebound in the proportions of high, relatively high, and medium risk is observed by 2022. In the medium-gradient zones (T2 and T3), low- and relatively low-risk classes begin to dominate. Specifically, the combined proportion of these two classes remains above 85% in T2. In T3, the proportion of the low-risk class rises markedly to more than 80%, effectively compressing medium-to-high risk into a negligible share. In the high-gradient zones (T4 and T5), ecological risk reaches its minimum level. The low-risk class dominates absolutely: the low-risk proportion in T4 stabilizes above 85%, whereas in T5 it exceeds 90%. Meanwhile, the combined proportion of high and relatively high risk remains below 1%. Overall, landscape ecological risk in Huangshan City displays pronounced spatiotemporal differentiation. High-gradient zones remain consistently stable with minimal risk, whereas low-gradient hills and riparian areas form key clusters of higher risk that should receive priority attention and targeted control in future ecological restoration.
To reduce potential area-related effects and further examine shifts in the dominance of risk types across TNI gradients, we introduced the Distribution Index (Pie) (Figure 11). The Pie results indicate strong spatial differentiation and clear gradient evolution of different risk types from 2002 to 2022. In particular, the relatively high, medium, and high risk types occupy an absolute dominant position in the T1 gradient, with Pie values substantially exceeding 1. This pattern is largely explained by the flat terrain of T1, which serves as the primary carrier for construction land expansion. As a result, intense anthropogenic disturbance and landscape fragmentation have consistently sustained ecological risk at a high level. By contrast, the low-risk type dominates in T3, T4, and T5, where Pie values remain high. Due to ridge topography, these high-gradient areas experience weaker human exploitation and higher forest land connectivity, helping maintain a relatively stable ecological security barrier function.
Notably, the T2 gradient shows a distinct transitional and spatially unstable nature, with frequent fluctuations in dominant risk types over the study period. In 2002, T2 is mainly characterized by relatively low risk (Pie), followed by medium risk. By 2012, the dominance of relatively low risk is slightly strengthened, while low- and medium-risk classes exhibit an interwoven, oscillatory pattern. However, by 2022, the dominance of relatively low risk weakens again. These variations suggest that T2, which functions as an ecotone between plains and hills, is a conflict zone where intense human interference and natural self-recovery compete strongly, making it highly sensitive to external environmental perturbations. In addition, in 2012, the high-risk Pie index within the otherwise ecologically sound T5 high-gradient zone shows an anomalous, abrupt increase, indicating sporadic ecological damage in localized high-altitude areas. Therefore, future ecological restoration should place special emphasis on these transitional and sensitive domains, treating them as critical nodes for risk prevention and control. Establishing ecological buffer zones can help effectively block the outward diffusion of high-risk areas from low-gradient zones.

3.4. Spatiotemporal Projections and Dynamic Transformations of Land Use and Landscape Ecological Risk (2032–2042)

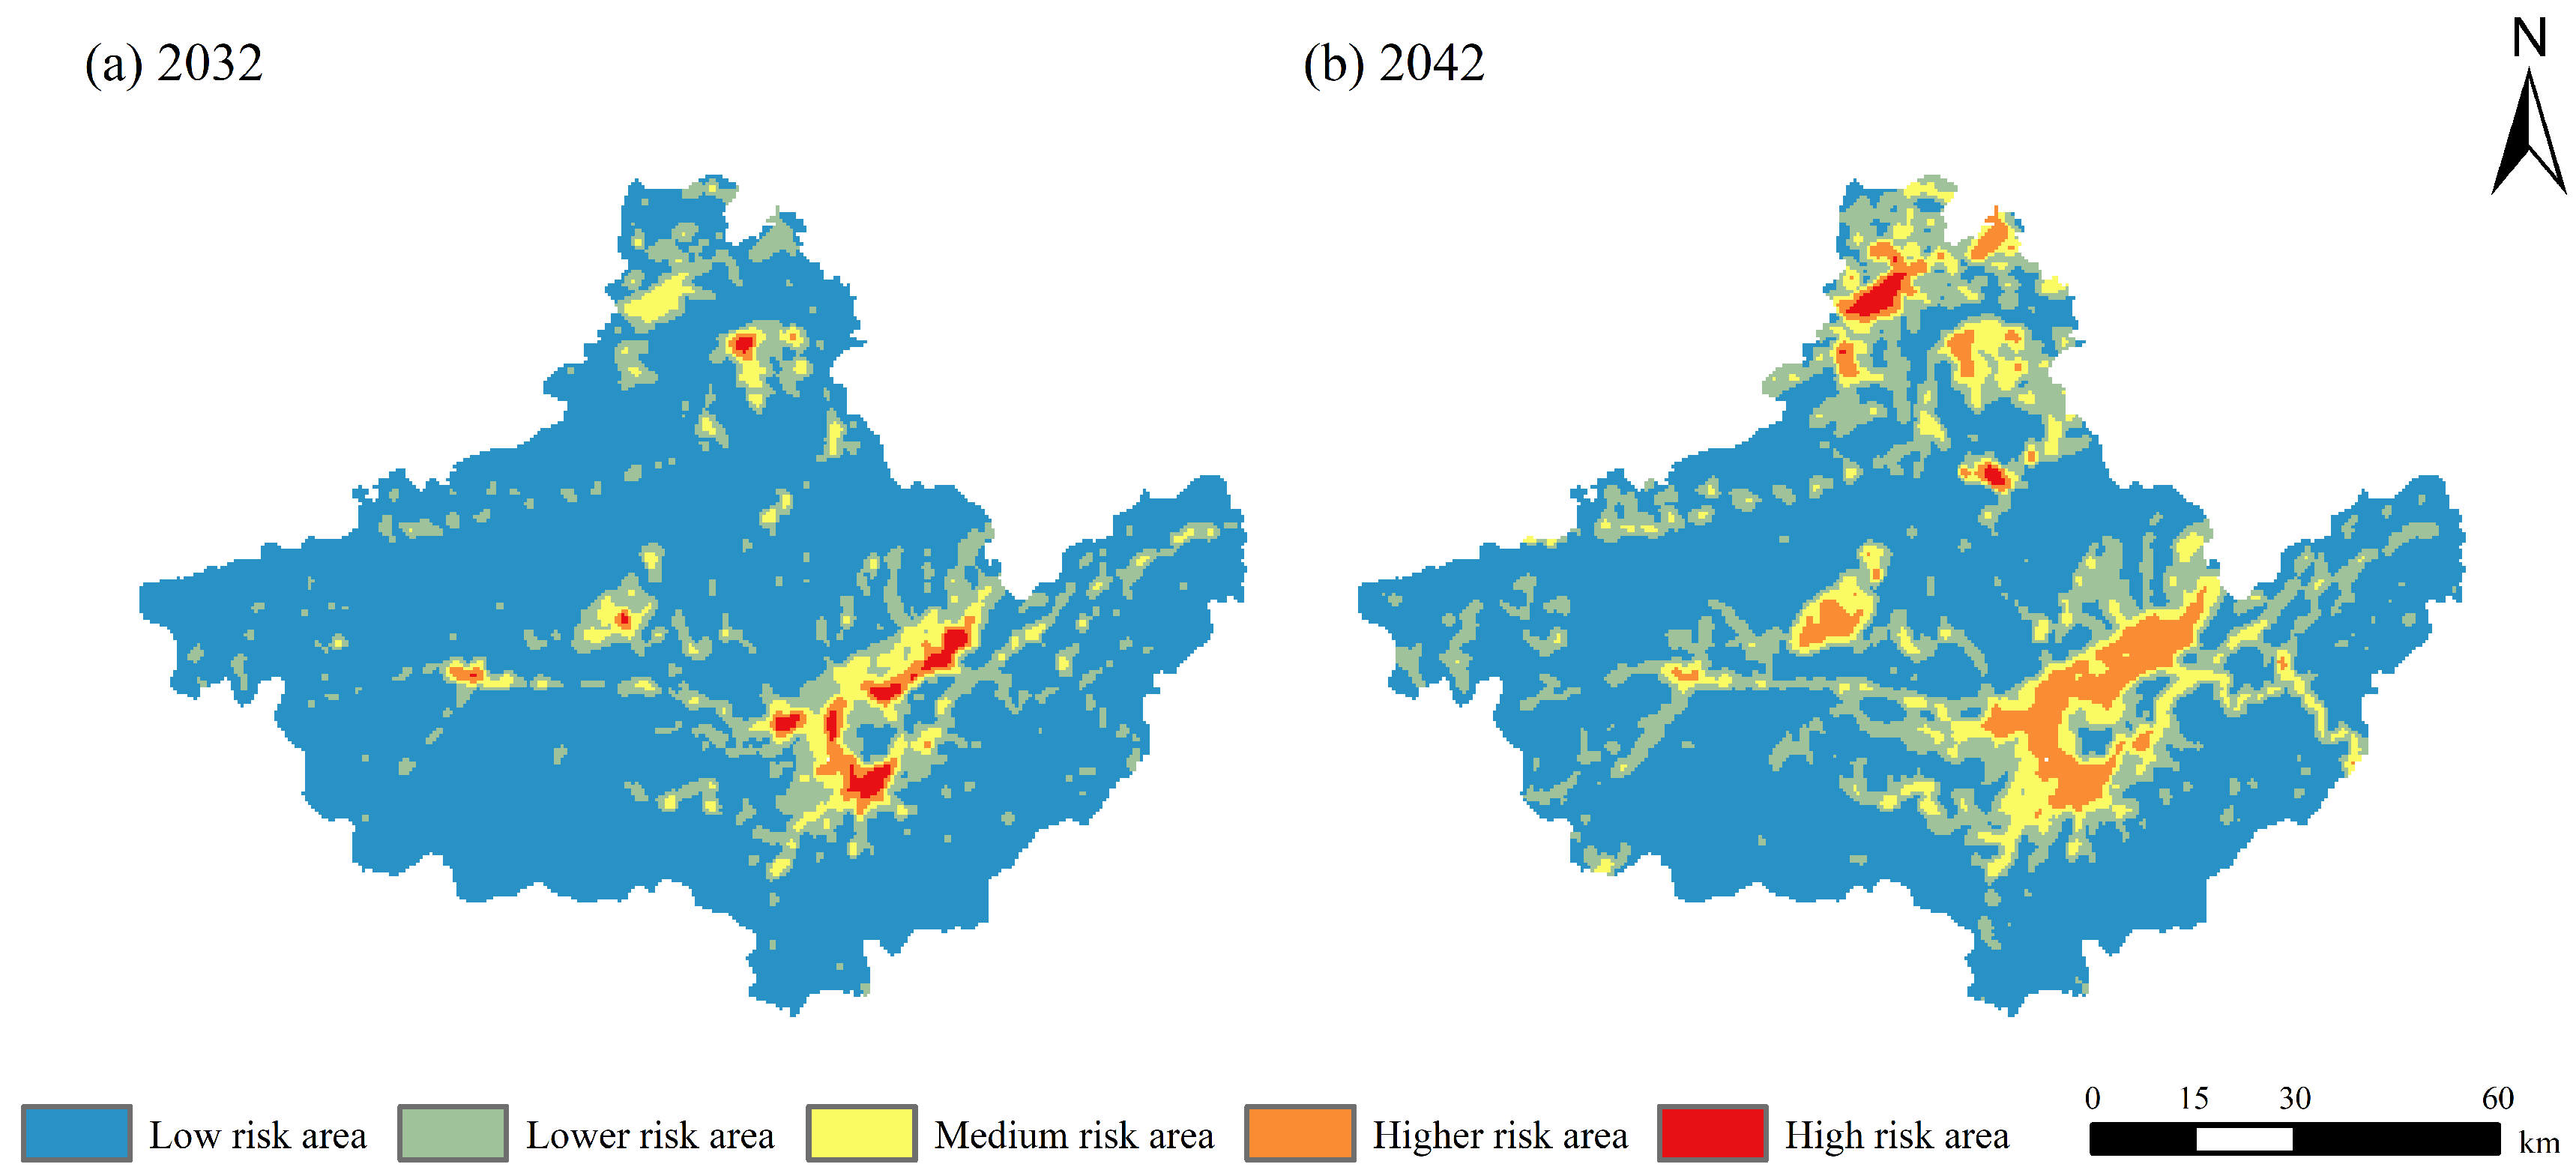
To systematically reveal the evolutionary trajectories of land use and ecological risks in Huangshan City from 2032 to 2042, we generated two sets of projected data for 2032 and 2042 using the calibrated intPLUS model. It is worth noting that these projections do not follow a single linear trend across the entire 2022–2042 period. Instead, they show clear non-monotonic turning characteristics between the two sub-periods (2022–2032 and 2032–2042). The analysis below therefore focuses first on the 2032–2042 sub-period to describe the spatial patterns of land use and risk distribution in that interval.
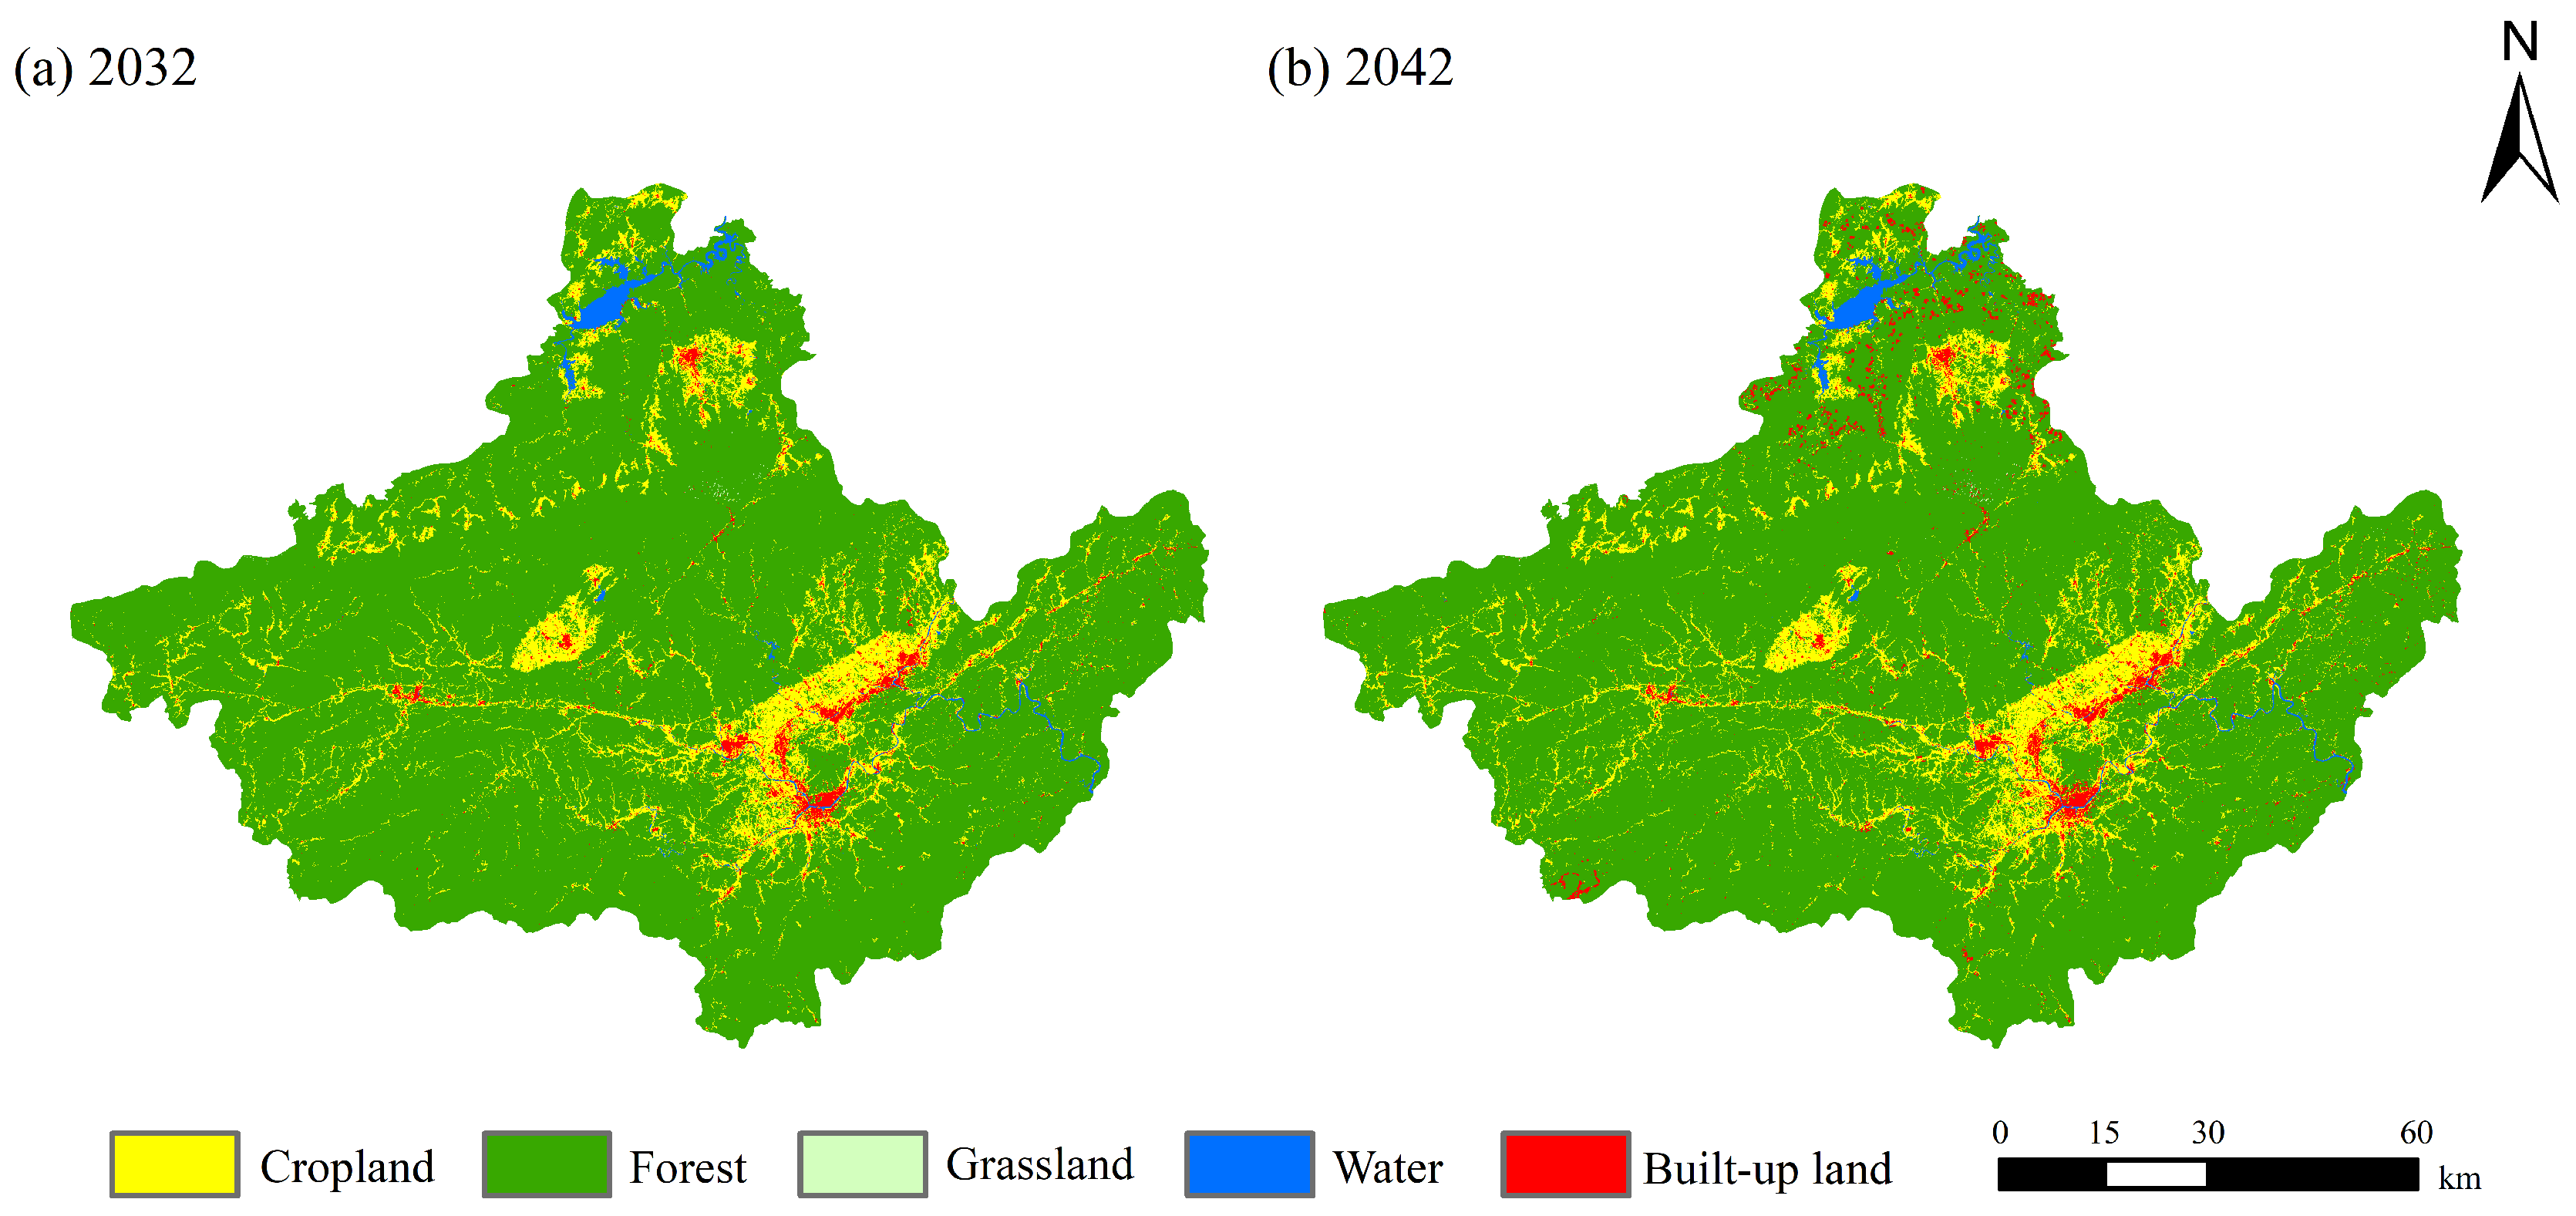
Based on the projected land use area and proportional compositions (Table 12), together with the simulated spatial distributions for Huangshan City from 2032 to 2042 (Figure 12), forest land remains the absolute dominant type throughout the region. Its share consistently exceeds 85%, indicating that it continues to form the ecological matrix of the study area. Over this decade, built-up land shows the most significant expansion, increasing from 163.0827 km2 (1.69%) to 255.4551 km2 (2.647%). By comparison, forest land declines noticeably from 8385.0507 km2 (86.89%) to 8226.2223 km2 (85.245%). Cultivated land increases from 1001.727 km2 (10.38%) to 1066.4775 km2 (11.051%), while water bodies exhibit only a slight increase from 98.1855 km2 (1.017%) to 99.9765 km2 (1.036%). Grassland decreases marginally from 2.0988 km2 (0.022%) to 2.0133 km2 (0.021%).
In spatial terms, forest land is widely and uniformly distributed across the entire territory. Cultivated land concentrates mainly in the east-central river valleys, appearing as distinct linear corridors and contiguous patches. The centroid of built-up land remains in the central urban core, and then gradually radiates toward surrounding counties and major transportation corridors, accompanied by a substantial increase in patch size. Water bodies are mainly located along the major northern water reservoirs and the main channels of primary rivers. Grassland occurs only as sporadic, isolated patches embedded within the forest matrix. Overall, between 2032 and 2042, Huangshan City’s land use configuration is characterized by a forest-dominated baseline, along with coordinated depletion of grassland and forest land, and a robust expansion of built-up and cultivated land.
Given the non-linear trajectory of land use change described above, landscape ecological risk in 2032–2042 is characterized by a phase of sharp deterioration. According to the projected area and proportion of each ecological risk level in Huangshan City for 2032–2042 (Table 13) and their spatial distribution (Figure 13), the low-risk area decreases by a net 1458.76 km2 over this period, and its share falls substantially from 81.29% in 2032 to 66.20% in 2042. The relatively low-risk area increases by 800.81 km2, rising from 12.96% to 21.23%. The moderate-risk area expands by 370.02 km2, with its proportion increasing from 3.95% to 7.78%. The relatively high-risk area grows by 318.93 km2, climbing from 1.16% to 4.46%. Meanwhile, the high-risk area decreases from 62.50 km2 to 32.49 km2, and its share drops from 0.65% to 0.34%, suggesting a localized reverse improvement and indicating that the core high-risk zones contract to some extent. Notably, this rapid deterioration trend contrasts sharply with the phased improvement observed in 2022–2032 (when the low-risk area increased from 6636.09 km2 to 7860.24 km2), forming a distinct “rise-then-fall” reversal. This implies that 2032 may act as a critical turning point in the risk trajectory.
From a spatial perspective, Huangshan City continues to show notable zonal structures and patch clustering. Although reduced substantially, low-risk areas remain broadly contiguous across forested regions in the south, west, and central parts of the city, thereby retaining a relatively solid ecological foundation. From 2032 to 2042, the low- and moderate-risk zones expand outward in a concentric manner. The transition belts of relatively low-risk and moderate-risk areas broaden significantly as they spread outward. Relatively high-risk areas expand primarily through patch-based growth and contiguous development along the urban agglomeration belt and around the northern scenic areas, becoming the main sources of increased risk. In contrast, high-risk patches exhibit centripetal shrinkage, with markedly reduced patch area and core range compared with 2032. Overall, the low-risk background is extensively encroached, and ecological risk shifts distinctly toward intermediate and higher levels. In future planning, it is important to implement stricter spatial access controls for the rapidly expanding relatively high-risk ring zones, while continuing to strengthen differentiated red line governance for the high-risk core areas.


4. Discussion

4.1. Characteristics of Land Use/Cover Change (LUCC) and Topographic Gradient Effects

This study reveals that forest land in Huangshan City maintained a long-term absolute dominance (>85%) from 2002 to 2042, yet construction land is projected to expand dramatically over the forecast period, accompanied by increasingly active two-way conversions between cropland and forest land. This evolution is not a simple unidirectional “returning cropland to forest” process, but rather the result of superimposed forces from policy drivers, tourism-led urbanisation, and topographical constraints. The unidirectional conversion from cropland to forest land during 2002–2012 coincided with the vigorous implementation of the national “Grain-for-Green” programme in the southern hilly regions of China [57], and the relatively moderate growth rate of construction land in this phase indicates that ecological policies dominated the land use pattern. After 2012, however, as Huangshan City was integrated into the Hangzhou metropolitan area and the construction of the international tourism demonstration zone accelerated [33], tourism infrastructure and real estate investment surged, causing the annual growth rate of construction land to jump, with expansion primarily encroaching upon high-quality cropland and peri-urban forest land. Quantitative diagnostics of driving factors show that NDVI (24.28%) contributed the most to construction-land expansion, followed by population density (18.26%), while GDP (8.85%) and nighttime light index (6.78%) made relatively modest contributions. These results robustly confirm, at the modelling level, that the expansion of construction land during this period was essentially realised by encroaching on forest land and cropland with high vegetation coverage, while urban population agglomeration provided rigid demand support. Future projections continue this trend, indicating that urbanisation has surpassed ecological policy as the dominant driving force. It should be noted, however, that according to the future projections derived from the intPLUS model based on historical trends from 2002–2022, the construction-land area in Huangshan City is projected to increase from 163.08 km2 to 255.46 km2 during 2032–2042. This value is an extrapolated projection based on the rapid construction-land expansion trend observed during the historical period (especially 2012–2022), and is intended to reflect the potential pressure that construction-land expansion would exert on ecological land under a scenario of continued historical inertia, rather than to serve as a precise forecast of actual future construction-land increments. In the actual development process, as the rapid urbanisation phase in southern Anhui gradually stabilises and rigid policies such as territorial spatial planning controls and ecological red lines take effect, the actual expansion of construction land may be significantly lower than the model-projected value. Therefore, this projection should be understood as a cautionary scenario analysis, the core value of which lies in revealing the potential risks to ecological land under a sustained urbanization expansion scenario, rather than as a deterministic judgment of future land use changes.
Compared with similar mountainous cities in southern Anhui [58,59], Huangshan City has experienced a faster rate of land use expansion, yet forest land still accounts for the largest share of its total area. This indicates a continuous tension between the tourism-led economic pull of the “World Heritage Site” brand and the constraints imposed by ecological protection red lines. A topographic gradient analysis further quantifies the spatial boundary of this trade-off: at the T1–T2 gradients (low-elevation river valleys), over 85% of construction land conversion and more than 60% of bidirectional cropland–forest land conversions are concentrated, whereas human activities decline sharply above the T3 gradient. This confirms that the terrain niche index (TNI) can serve as an effective proxy variable for the “threshold of human activity intensity” in mountainous regions—specifically, when TNI > 1.2531 (T3 and above), the economic costs of agricultural reclamation and urban construction rise steeply, and natural succession re-dominates. These findings have direct implications for territorial spatial planning: low-gradient zones should be designated as “suitable areas for urban development” but with strict controls on ecological corridors, while high-gradient zones are more appropriately zoned as “core ecological conservation areas,” thereby avoiding a one-size-fits-all regulatory approach.

4.2. Analysis of the Spatiotemporal Evolution of Landscape Ecological Risk

Over the past two decades, landscape ecological risk in Huangshan City has followed a complex trajectory characterized by an initial improvement followed by a subsequent rebound. Predictive modeling further suggests a serious prospect of sustained deterioration in the coming decade (2032–2042). Specifically, during 2002–2012, the regional risk landscape showed considerable amelioration. Low-risk zones increased by a net 290.91 km2, accompanied by a clear directional shift from medium- and high-risk categories toward low-risk areas. This implies that earlier policies—such as ecological restoration initiatives (e.g., the Grain for Green program) and landscape conservation measures—effectively alleviated localized ecological pressures, thereby promoting an overall optimization of the landscape pattern. By contrast, landscape ecological risk intensified dramatically during 2012–2022. Low-risk areas decreased by 408.96 km2, and previously optimized zones underwent a clear “retrograde transition.” Consequently, over the 20-year period, all risk categories—except the low-risk zone—recorded net increases in spatial extent. In the projected period of 2032–2042, the tendency toward continuous deterioration becomes even more evident. The proportion of low-risk areas is expected to shrink substantially from 81.29% to 66.20%, while medium-to-low-risk transitional ecotones are projected to expand outward in a concentric, layered manner.
From the perspective of spatial evolution mechanisms, the landscape ecological risk distribution in Huangshan City exhibits distinct concentric structural configurations and pronounced patch aggregation. As the dominant landscape matrix, low-risk zones are continuously distributed across extensive forested hinterlands in the southern, western, and central regions, thereby maintaining a relatively strong ecological barrier function. In contrast, higher- and high-risk zones show marked spatial clustering, mainly concentrated within and adjacent to the core scenic areas of Huangshan District, as well as along the contiguous urbanized belt spanning Xiuning–Tunxi–Huizhou in the central–western sector [32]. Over the past two decades, the spatial trajectory of these risks has shifted from localized centripetal contraction toward an outward radiation centered on urban built-up areas and tourism destinations. The expansion of high-risk patches has therefore triggered localized ecological degradation. Ultimately, this centrifugal radiation pathway—originating from core urban centers and tourism hotspots—highlights the intensifying spatial conflict among economic development, tourism exploitation, and ecological conservation priorities in Huangshan City.
The underlying drivers of the “improve-then-deteriorate” reversal in landscape ecological risk can be interpreted from two dimensions: policy shifts and urbanization. The improvement phase from 2002 to 2012 closely corresponds to the implementation of large-scale Grain-for-Green efforts in the hilly areas of southern China. During this period, farmland retirement effectively increased forest landscape connectivity and reduced landscape fragmentation. In contrast, the rebound phase from 2012 to 2022 coincides with the accelerated pace of tourism urbanization in Huangshan City. After major transport infrastructure was put into operation—such as the Hangzhou–Huangshan high-speed railway—Huangshan’s integration into the Hangzhou metropolitan area accelerated. Tourism arrivals and construction land demand increased simultaneously, reinforcing anthropogenic disturbance pressures on the landscape. Overall, the evolutionary pattern of “policy-driven improvement followed by urbanization-driven rebound” reveals the structural tensions between ecological conservation and economic development in mountain tourism cities. From a spatial transmission perspective, urban areas and scenic spots act as risk sources and promote an outward concentric diffusion pattern. The transmission pathways are primarily aligned with transportation corridors, forming a three-tier spatial transmission mode of “core agglomeration–axial sprawl–peripheral radiation.”

4.3. The Restrictive Effects of Topographic Gradients on the Spatial Differentiation of Ecological Risks

An overlay analysis incorporating the Terrain Niche Index (TNI) and the Distribution Index (Pie) further clarified the strong restrictive effects and the topological regularities of terrain on ecological risk. In the low-gradient zone (T1), the gentle topography makes this area the main receptacle for construction land expansion and concentrated anthropogenic disturbance. This, in turn, leads to severe landscape fragmentation. Accordingly, the Pie values for the higher-, medium-, and high-risk categories remain substantially greater than 1 throughout the study period, indicating their absolute dominance. By comparison, the medium-gradient zone (T2) shows pronounced transitionality and spatial instability. From 2002 to 2022, the dominant risk types in T2 fluctuate frequently between lower- and medium-risk levels. This pattern suggests that T2, which functions as an ecotone transitioning from plains to hills, is a conflict zone where intensive human interference and natural self-recovery compete strongly. As a result, it exhibits high sensitivity to external environmental changes and policy orientations.
As the terrain gradient increases toward the high-gradient zones (T3–T5), landscape ecological risk declines gradually overall. Constrained by ridgeline topography, the T4 and T5 regions experience low development intensity and maintain very high forest land connectivity. In these zones, the low-risk category dominates absolutely, with its proportion exceeding 90% in T5. Notably, however, an anomalous event appears in 2012 within T5, characterized by an abrupt increase in the high-risk Pie index. This spatial aberration indicates that localized high-altitude areas suffered transient or incidental ecological damage during that period. Overall, these results suggest that topography not only determines the baseline spatial distribution of risk through physical slopes, but also enhances risk enrichment in low-altitude areas by concentrating human activities. At the same time, it reinforces a natural ecological defense barrier in high-altitude regions.
Conceptually, the Terrain Niche Index (TNI) captures the spatial differentiation of human accessibility. Areas with low TNI values, characterized by high accessibility, tend to be disturbance-prone, whereas high-TNI areas act as natural accessibility barriers. This extends the applicability of the “distance-decay” assumption commonly used in landscape ecological risk assessment to strongly terrain-differentiated mountainous regions, indicating that topographic factors can serve as fundamental explanatory variables for spatial risk differentiation. In management practice, these findings support a differentiated governance approach of “zonal classification and gradient-based control.” The low-gradient T1 zone should adopt the strictest access regulations to curb risk accumulation. The T2 transitional zone should be prioritized for risk monitoring and early warning, given its high volatility. The high-gradient T4–T5 zones should mainly rely on ecological conservation with minimal human intervention. Through this approach, terrain constraints can be translated into a hierarchical policy instrument for spatial governance.

4.4. Research Limitations and Future Perspectives

Although this study develops a multidimensional analytical framework to evaluate land use and ecological risk in Huangshan City, several limitations remain. Specifically, the current assessment mainly relies on landscape pattern indices to represent macro-level “structural risks,” while the intrinsic “functional risks” of ecosystems—such as biodiversity maintenance—have not been fully incorporated. This omission may limit the precision needed to capture the micro-heterogeneity of landscape functions. Therefore, future research should focus on the following three aspects.
First, future work should strengthen the coupling mechanisms between structural and functional risks. By integrating comprehensive indicators, such as ecosystem service value (ESV), a unified evaluation system that considers both structure and function can be established, thereby improving the scientific basis for targeted ecological restoration policies.
Second, it is important to enhance multi-scenario dynamic simulation capabilities. Predictive frameworks should embed stringent policy constraints, including “dual-carbon” targets and ecological protection red lines, to conduct multi-path and regulatory risk early-warning analyses. This would improve the proactiveness of responses to policy interventions.
Third, subsequent studies should advance multi-source data fusion and multi-scale association analysis. By integrating multidimensional data—such as high-resolution remote sensing, in situ monitoring, and socioeconomic statistics—and applying machine learning and spatial statistics, we can clarify the transmission patterns of ecological risks across patch, landscape, and regional scales. Such efforts would provide stronger data support for dynamic risk zoning and adaptive management.
In summary, future research should adopt the coordinated evolution of “structure–function–process” as its core conceptual thread. With dual drivers—rigid policy constraints and flexible optimization through intelligent algorithms—this approach aims to shift the ecological risk assessment framework from static diagnosis to dynamic early warning. Ultimately, this would move the methodology beyond macroscopic pattern descriptions toward more precise and actionable regulatory decision-making, offering forward-looking scientific evidence to support sustainable development in typical mountainous tourism cities such as Huangshan.

5. Conclusions

(1) Huangshan City’s land use pattern is fundamentally forest-dominated and generally stable, but it faces increasingly strong future pressure from construction land expansion. From 2002 to 2042, forest land consistently serves as the regional ecological matrix, maintaining a long-term area proportion above 85%. The reciprocal transformation between forest land and cropland, together with the continuous expansion of construction land, indicates a critical shift in regional land use evolution—from an early, mainly unidirectional ecological restoration phase (returning farmland to forest) toward a more active stage driven by accelerated urbanization. The simulations further show that between 2032 and 2042, construction land will increase sharply from 163.08 km2 to 255.46 km2, implying a strong encroachment tendency on forest land.
(2) Terrain gradients impose a strong spatial constraint on land use change, and the intensity of anthropogenic activities decreases stepwise with increasing elevation. Lower terrain gradients (T1–T2) are the core carrier zones for construction land expansion and agricultural cultivation. By contrast, higher terrain gradients (T3–T5) generally remain dominated by natural succession and ecological conservation. This spatial contrast reflects a typical vertical zonality pattern in low-mountain and hilly regions, characterized by a hierarchical attenuation of anthropogenic interference from low to high elevations.
(3) Over the past two decades, landscape ecological risk has followed a reversal trajectory, improving first and deteriorating afterward. Its future evolution is characterized by a turning-point fluctuation, with short-term improvement followed by a long-term surge. From 2002 to 2012, ecological risk improved markedly. However, between 2012 and 2022, the low-risk area shrank sharply by 408.96 km2, substantially offsetting the gains achieved in the earlier period. In the next decade (2022–2032), low-risk areas are projected to recover briefly, but they are expected to contract again sharply from 2032 to 2042. This pattern suggests that short-term ecological stabilization cannot compensate for risk rebound driven by the accumulated construction demand generated during the mid-to-late stage of tourism urbanization. Therefore, 2032 emerges as a critical policy window for ecological security management.
(4) Topographic gradients impose rigid constraints on the spatial differentiation of ecological risk. Low-gradient zones function as risk accumulation areas, whereas high-gradient zones act as ecological security barriers. Higher-risk areas are concentrated in the contiguous urban belt of Tunxi District (covering the Xiuning–Tunxi–Huizhou area) and around the Huangshan Scenic Area, forming a risk radiation pattern driven by two sources: “urban agglomeration and scenic area.” Based on this, differentiated control strategies are proposed. In Tunxi District and the contiguous urban belt, strict regulation of built-up expansion boundaries and strengthened construction of ecological corridors are needed. Within the Huangshan Scenic Area, uncontrolled expansion of tourism facilities should be strictly limited to preserve the ecological integrity of the core scenic zone. In addition, the medium-gradient sensitive belt (T2) should be prioritized as an ecological buffer to prevent high-risk areas from spreading toward low-risk zones.

Author Contributions

Conceptualization, E.Y. and Q.W.; Methodology, E.Y. and Q.W.; Software, E.Y. and Q.W.; Validation, E.Y. and Q.W.; Formal analysis, Q.W.; Investigation, X.L.; Resources, X.L.; Data curation, X.L.; Writing—original draft, E.Y. and H.Z.; Writing—review & editing, E.Y. and H.Z.; Visualization, X.L.; Supervision, H.Z.; Project administration, H.Z.; Funding acquisition, H.Z. All authors have read and agreed to the published version of the manuscript.

Funding

This research was funded by the National Science and Technology Support Program (Grant No. 2015BAD06B04).

Institutional Review Board Statement

Not applicable.

Informed Consent Statement

Not applicable.

Data Availability Statement

Data is contained within the article.

Conflicts of Interest

The authors declare no conflicts of interest.

References

  1. Feng, H.; Wang, S.; Zou, B.; Nie, Y.; Ye, S.; Ding, Y.; Zhu, S. Land use and cover change (LUCC) impacts on Earth‘s eco-environments: Research progress and prospects. Adv. Space Res. 2023, 71, 1418–1435. [Google Scholar] [CrossRef]
  2. Chen, M.L.; Samat, N.; Tilaki, M.J.M.; Duan, L.Y. Land use/cover change simulation research: A systematic literature review based on bibliometric analyses. Ecol. Indic. 2025, 170, 112991. [Google Scholar] [CrossRef]
  3. Foley, J.A.; DeFries, R.; Asner, G.P.; Barford, C.; Bonan, G. Global consequences of land use. Science 2005, 309, 570–574. [Google Scholar] [CrossRef] [PubMed]
  4. Lambin, E.F.; Meyfroidt, P. Global land use change, economic globalization, and the looming land scarcity. Proc. Natl. Acad. Sci. USA 2011, 108, 3465–3472. [Google Scholar] [CrossRef] [PubMed]
  5. Turner, B.L., II; Lambin, E.F.; Reenberg, A. The emergence of land change science for global environmental change and sustainability. Proc. Natl. Acad. Sci. USA 2007, 104, 20666–20671. [Google Scholar] [CrossRef] [PubMed]
  6. Li, Q.; Ma, B.; Zhao, L.; Mao, Z.; Luo, L.; Liu, X. Landscape ecological risk evaluation study under multi-scale grids—A case study of Bailong River Basin in Gansu Province, China. Water 2023, 15, 3777. [Google Scholar] [CrossRef]
  7. Ran, P.L.; Hu, S.G.; Frazier, A.E.; Qu, S.J.; Yu, D. Exploring changes in landscape ecological risk in the Yangtze River Economic Belt from a spatiotemporal perspective. Ecol. Indic. 2022, 137, 108744. [Google Scholar] [CrossRef]
  8. Hu, G.; Guo, Y.; Zhang, C.; Chen, Y.; Lang, Y. Landscape ecological risk assessment of the northern coastal region of China based on the improved ESRISK framework: A case study of Cangzhou City. Ecol. Indic. 2025, 171, 113222. [Google Scholar] [CrossRef]
  9. Cao, Q.W.; Zheng, X.W.; Ma, H.K.; Wu, J.S. Review of landscape ecological risk and an assessment framework based on ecological services: ESRISK. Acta Ecol. Sin. 2018, 73, 843–855. [Google Scholar] [CrossRef]
  10. Li, W.J.; Wang, Y.; Xie, S.Y.; Sun, R.H.; Cheng, X. Impacts of landscape multifunctionality change on landscape ecological risk in a megacity, China: A case study of Beijing. Ecol. Indic. 2020, 117, 106681. [Google Scholar] [CrossRef]
  11. Li, B.J.; Yang, Y.Y.; Jiao, L.M.; Yang, M.Y.; Li, T. Selecting ecologically appropriate scales to assess landscape ecological risk in megacity Beijing, China. Ecol. Indic. 2023, 154, 110780. [Google Scholar] [CrossRef]
  12. Cao, Q.; Zhang, X.; Lei, D.M.; Li, Y.; Sun, X.H. Multi-scenario simulation of landscape ecological risk probability to facilitate different decision-making preferences. J. Clean. Prod. 2019, 227, 325–335. [Google Scholar] [CrossRef]
  13. Hou, M.; Ge, J.; Gao, J.; Meng, B.P.; Li, Y.C. Ecological risk assessment and impact factor analysis of alpine wetland ecosystem based on LUCC and boosted regression tree on the Zoige Plateau, China. Remote Sens. 2020, 12, 368. [Google Scholar] [CrossRef]
  14. Yu, M.L.; Liu, Y.J.; Zhang, Y.J. Multi-scenario prediction of future land use change and landscape ecological risk on the Qingzang plateau. Resour. Environ. Yangtze Basin 2024, 33, 2204–2218. [Google Scholar]
  15. Si, Q.; Fan, H.R.; Dong, W.M.; Liu, X.P. Landscape ecological risk assessment and prediction for the Yarkant River Basin, Xinjiang, China. Arid Zone Res. 2024, 41, 684–696. [Google Scholar] [CrossRef]
  16. Duan, X.; Haseeb, M.; Tahir, Z.; Mahmood, S.A.; Tariq, A. Analyzing and predicting land use and land cover dynamics using multispectral high-resolution imagery and hybrid CA-Markov modeling. Land Use Policy 2025, 157, 107655. [Google Scholar] [CrossRef]
  17. Liang, X.; Guan, Q.; Clarke, K.C.; Liu, S.; Wang, B.; Yao, Y. Understanding the drivers of sustainable land expansion using a patch-generating land use simulation (PLUS) model: A case study in Wuhan, China. Comput. Environ. Urban Syst. 2021, 85, 101569. [Google Scholar] [CrossRef]
  18. Luan, C.X.; Liu, R.Z.; Zhang, Q.Y.; Sun, J.; Liu, J. Multi-objective land use optimization based on integrated NSGA–II–PLUS model: Comprehensive consideration of economic development and ecosystem services value enhancement. J. Clean. Prod. 2024, 434, 140306. [Google Scholar] [CrossRef]
  19. Bai, J.; Jia, Z.; Sun, Y.; Zheng, C.; Wen, M. Multi-Scenario Simulation of Land Use Change Along with Ecosystem Service Value for the Lanzhou–Xining Urban Agglomeration. Land 2025, 14, 860. [Google Scholar] [CrossRef]
  20. Liang, X.; Huang, J.L.; Guan, Q. Unveiling land competition through interaction networks: A consistency-based mining and simulation model that integrates inhibiting effects of land uses. Landsc. Urban Plan. 2025, 263, 105458. [Google Scholar] [CrossRef]
  21. Ji, C.; Shi, G.; Shi, J.; Sun, X.Y.; Sun, L. Spatiotemporal Heterogeneity and Drivers of Habitat Quality with Land-Use Simulation and Projection in Jiangsu Province, China Based on intPLUS–InVEST and GeoDetector. Land 2026, 15, 388. [Google Scholar] [CrossRef]
  22. Dong, P.; Gong, J.; Yi, Y.; Yang, S.T.; He, C.D. Spatiotemporal Dynamics and Multi-Scenario Projections of Habitat Quality in a Karst Cascade-Hydropower Basin: An Integrated InVEST–IntPLUS–OPGD Framework. Land 2026, 15, 363. [Google Scholar] [CrossRef]
  23. Yang, B.; Wang, Z.Q.; Yao, X.W.; Zhang, L.G. Topographic Gradient Effect and Spatial Structure Characteristics of Land Use in Mountain Areas of Northwestern Hubei Province. Resour. Environ. Yangtze Basin 2019, 28, 313–321. [Google Scholar]
  24. Gong, Q.; Sun, P.; Liu, Q.; Mo, J. Topographical gradient characteristics of land-use changes in the Agro-Pastoral Ecotone of Northern China. Land 2022, 11, 2195. [Google Scholar] [CrossRef]
  25. Yan, J.; Qiao, H.; Li, Q.; Song, M.; Yao, X.D. Landscape ecological risk assessment across different terrain gradients in the Yellow River Basin. Front. Environ. Sci. 2024, 11, 1305282. [Google Scholar] [CrossRef]
  26. Zhang, X.; Yu, J.; Feng, H.; Yao, L.; Li, X.; Du, H.; Liu, Y. Landscape ecological risk and drivers of land-use transition under the perspective of differences in topographic gradient. Land 2024, 13, 876. [Google Scholar] [CrossRef]
  27. Liang, L.; Sun, Y.; Guan, Q.; Pan, N.; Du, Q.; Mi, J.; Shan, Y. Projection of landscape ecological risk and exploration of terrain effects in the Qilian Mountains, China. Land Degrad. Dev. 2023, 34, 4575–4593. [Google Scholar] [CrossRef]
  28. Yang, W.; Yan, S.Y.; Cai, L.S. Investigating the Topographic Gradient Effect and Influencing Factors of Landscape Ecological Risk Evolution in the Gele Mountain Area. Environ. Sci. 2026, 1–20. [Google Scholar] [CrossRef]
  29. Yu, T.; Chen, X.F.; Pueppke, S.G.; Qiu, J.X.; Ou, W.X.; Yang, H.B.; Qi, J.G. Redesigning a transboundary and spatially targeted PES scheme to sustain clean water provision across metacoupled systems in the Xin’an River Watershed, China. Ecosyst. Serv. 2025, 73, 101692. [Google Scholar]
  30. Wang, S.Q.; Zhou, Z.H.; Liu, D.Y.; Hu, Q.; Tang, W.H.; Zhou, M. Study on land scape pattern change of Chaohu basin based on land use chang. Agric. Sci. J. Yanbian Univ. 2022, 44, 84–93. [Google Scholar] [CrossRef]
  31. Ding, H.; Fang, Y.M.; Yang, X.H.; Yuan, F.Y.; He, L.Z.; Yao, J.F.; Wu, J.; Chi, B.; Li, Y.; Chen, S.F.; et al. Community characteristics of a subtropical evergreen broad-leaved forest in Huangshan, Anhui Province, East China. Biodiv Sci. 2016, 24, 875–887. [Google Scholar] [CrossRef]
  32. Zhou, Y.Q.; Xu, Y.; Li, D.H.; Jiang, W.F.; Wu, S.M.; Lu, L. Characteristics of Huangshan tourism flow network structure: The comparative analysis of team tour and self-guided tour. J. Cent. China Norm. Univ. (Nat. Sci.) 2022, 56, 853–863. [Google Scholar] [CrossRef]
  33. Chang, J.; Lu, S. A Study on the Spatial-temporal Evolution and Influencing Factors of Homestay in Huangshan City. Tour. Sci. 2022, 36, 147–159. [Google Scholar] [CrossRef]
  34. Lin, Z.L.; Cheng, Z. Study on Efficiency of Tourism Poverty Alleviation and Its Influencing Factors in Western China: A Case Study of Pingliang City, Gansu Province. Areal Res. Dev. 2020, 39, 94–98+110. [Google Scholar] [CrossRef]
  35. Wang, P.J.; Zhang, J.H.; Yang, L.J.; Guo, L.J.; Ma, X.B.; Kan, Y.; Chen, M. Spatio-temporal evolution of cosyslem services in a ypical lourist city and itsinfluencing factors: A case study of Huangshan City. Acta Ecol. Sin. 2024, 44, 3897–3910. [Google Scholar] [CrossRef]
  36. Wang, T.; Zhang, J.; Qian, Z.; Dong, Y.; Ma, X. Conservation Effectiveness and Heterogeneity of the National Park in Promoting Ecosystem Health: Causal Evidence from Huangshan, China. Land 2025, 14, 1948. [Google Scholar] [CrossRef]
  37. Yu, E.; Wang, Q.; Zheng, H.; Pan, Y.; Liu, Y.; Cao, Q.; Gao, Y.; Zhao, X. Analysis of Spatio-Temporal Evolution and Driving Mechanism of Landscape Pattern in Huangshan City Based on Moving Window Method and Geodetector. Land 2026, 15, 503. [Google Scholar] [CrossRef]
  38. Yang, J.; Huang, X. The 30 m annual land cover dataset and its dynamics in China from 1990 to 2019. Earth Syst. Sci. Data 2021, 13, 3907–3925. [Google Scholar] [CrossRef]
  39. Yang, J.; Huang, X. The 30 m Annual Land Cover Dataset and Its Dynamics in China from 1985 to 2025 (Version 1.0.5) [Data Set]. Zenodo. Available online: https://zenodo.org/records/18180184 (accessed on 1 July 2025).
  40. GB/T21010-2017; Current Land Use Classification. China Standard Publishing House: Beijing, China, 2017.
  41. Lv, D.; Gao, G.Y.; Lv, Y.H.; Xiao, F.Y.; Fu, B.J. Detailed land use transition quantification matters for smart land management in drylands: An in-depth analysis in Northwest China. Land Use Policy 2020, 90, 104356. [Google Scholar] [CrossRef]
  42. Lv, X.W.; Wang, C.J.; Chang, L.Y.; Xiang, M.S.; Liu, Y. Multi-scenario Prediction and Driving Factor Analysis of Carbon Storage in the Tibetan Plateau Based on the PLUS-InVEST-GTWR Model. Environ. Sci. 2026, 1–22. [Google Scholar] [CrossRef]
  43. Qi, Y.Z.; Fan, M.; An, M. Multi-scenario Simulation of Land Use Change and Associated Landscape Ecological Risk in Shandong Province. Environ. Sci. 2026, 1–24. [Google Scholar] [CrossRef]
  44. Gao, L.; Zhao, Z.Q.; Song, D.Y.; Pei, X.L. Evolution of landscape ecological risk and its response to natural and anthropogenic factors: A case study of ecological conservation area in Beijing. China Environ. Sci. 2024, 44, 4031–4041. [Google Scholar] [CrossRef]
  45. Lv, H.B.; Yu, J.R.; Sun, J.; Yang, R.J.; Zhang, J. Land Use Change and Landscape Ecological Risk Assessment in the Heihe River Basin. Environ. Sci. 2025, 1–15. [Google Scholar] [CrossRef]
  46. Šímová, P.; Gdulová, K. Landscape indices behavior: A review of scale effects. Appl. Geogr. 2012, 34, 385–394. [Google Scholar] [CrossRef]
  47. Nie, X.Y.; Wang, C.; Li, K.M.; Gao, F.Y.; Huang, W.Z.; Li, X. Spatiotemporal analysis of landscape ecological risk and its influencing factors based on land cover changes in the Hexi Corridor, Northwest China, 2000–2020. Environ. Sustain. Indic. 2025, 28, 100888. [Google Scholar] [CrossRef]
  48. Yang, N.J.; Zhang, T.; Li, J.Z.; Feng, P.; Yang, N. Landscape ecological risk assessment and driving factors analysis based on optimal spatial scales in Luan River Basin, China. Ecol. Indic. 2024, 169, 112821. [Google Scholar] [CrossRef]
  49. Xie, H.L. Regional eco-risk analysis of based on landscape structure and spatial statistics. Acta Ecol. Sin. 2008, 10, 5020–5026. [Google Scholar]
  50. Li, J.X.; Li, C.K.; Yin, Z.H. Kriging interpolation method based on ArcGIS and its application. Bull. Surv. Mapp. 2013, 9, 87–90+97. [Google Scholar]
  51. Guo, B.L.; Tang, X.L.; He, Y.M. Spatiotemporal evolution and influencing factors of terrain gradient effect of carbon storage in Lanzhou. Environ. Sci. 2026, 47, 396–407. [Google Scholar] [CrossRef] [PubMed]
  52. Li, J.J.; Lv, Z.M.; Shi, X.P.; Li, Z. Spatiotemporal variations analysis for land use in Fen River Basin based on terrain gradien. Trans. Chin. Soc. Agric. Eng. 2016, 32, 230–236. [Google Scholar] [CrossRef]
  53. Liu, L.; Wang, Q.R.; Li, Y.B.; Shao, J.A.; Huang, Y. Mountain ecosystem health response to landscape pattern in the Three Gorges Reservoir Area, China. Catena 2025, 260, 109477. [Google Scholar] [CrossRef]
  54. Zhao, L.; Shi, Z.T.; He, G.X.; He, L.; Xi, W.F.; Jiang, Q. Topographic gradient effect analysis of land use landscape pattern in the Yuanmou Basin. Ecol. Sci. 2025, 44, 19–28. [Google Scholar] [CrossRef]
  55. Gao, W.M.; Dong, X.; Liu, J.P. Land Use Prediction and Habitat Quality Study in the Northern Foothills of the Qinling Moun-932 tains in Xi’an City Based on SD-intPLUS-InVEST Model. Environ. Sci. 2026, 1–21. [Google Scholar] [CrossRef]
  56. Lv, B.; Chen, L.; Yang, L.; Han, Q.L.; Liu, L.F.; Wang, Z.X. Multi-scenario simulation of future land use and landscape ecological risk analysis based on PLUS model: A case study of Wuding River Basin. Res. Soil Water Conserv. 2025, 32, 361–369. [Google Scholar] [CrossRef]
  57. Hu, X.Q.; Li, Z.W.; Chen, J.; Nie, X.D. Soil Conservation Benefits of the Grain for Green Program in the Hilly Red Soil Region of Southern China. J. Soil Water Conserv. 2020, 34, 95–100. [Google Scholar]
  58. Zhang, P.; Lu, L.M.; Wang, S.H.; Zhao, M.S. Distribution Characteristics of Land Use Types Under Different Terrain Index Gradients in Southern Anhui Province. Soils 2018, 50, 1041–1045. [Google Scholar] [CrossRef]
  59. Yang, Z.L.; Zhou, Z.H.; Gao, C.Q. Land use change and conflict identification in South Anhui International Cultural Tourism Demonstration Zone using GeoDetector model. Bull. Soil Water Conserv. 2025, 45, 409–420. [Google Scholar] [CrossRef]
Figure 2. Spatial distribution of topographic factors.
Sustainability 18 07852 g002
Figure 3. Comparison between actual and simulated land use distributions in 2022.
Sustainability 18 07852 g003
Figure 4. Spatial distribution of land use in Huangshan City, 2002–2022.
Sustainability 18 07852 g004
Figure 5. Chord diagram of land use transitions in Huangshan City, 2002–2022.
Sustainability 18 07852 g005
Figure 6. Changes in landscape ecological risk areas in Huangshan City, 2002–2022.
Sustainability 18 07852 g006
Figure 7. Spatial distribution of landscape ecological risk levels in Huangshan City, 2002–2022.
Sustainability 18 07852 g007
Figure 8. Sankey diagram of landscape ecological risk changes in Huangshan City, 2002–2022.
Sustainability 18 07852 g008
Figure 9. Chord diagram of land use transitions based on the Terrain Niche Index (TNI).
Sustainability 18 07852 g009
Figure 10. Proportions of landscape ecological risk areas under different TNI in Huangshan City, 2002–2022.
Sustainability 18 07852 g010
Figure 11. Gradient evolution of the Pie Distribution Index (PDI) across different risk levels.
Sustainability 18 07852 g011
Figure 12. Projected spatial distribution of land use in Huangshan City, 2032–2042.
Sustainability 18 07852 g012
Figure 13. Projected spatial distribution of landscape ecological risk levels in Huangshan City, 2032–2042.
Sustainability 18 07852 g013
Table 1. Data and information.
Data NameYearData SourcesGrid Resolution
Land use data2002/2012/2022https://zenodo.org/records/18180184 (accessed on 1 July 2025)30 m
DEM/Geospatial Data Cloud (https://www.gscloud.cn/) (accessed on 1 July 2025)30 m
Slope/Extraction using ArcGIS based on DEM data30 m
Aspect/Extraction using ArcGIS based on DEM data30 m
Normalized Difference Vegetation Index (NDVI)2012/2022Geospatial Data Cloud (https://www.gscloud.cn/) (accessed on 1 July 2025)30 m
Soil types/Resource and Environment Science and Data Center (https://www.resdc.cn/) (accessed on 1 July 2025)30 m
Annual average temperature2012/2022Resource and Environment Science and Data Center (https://www.resdc.cn/) (accessed on 1 July 2025)30 m
Annual average precipitation2012/2022Resource and Environment Science and Data Center (https://www.resdc.cn/) (accessed on 1 July 2025)30 m
Gross domestic product (GDP)2012/2022Resource and Environment Science and Data Center (https://www.resdc.cn/) (accessed on 1 July 2025)30 m
Population density (POP)2012/2022WorldPop (https://hub.worldpop.org/) (accessed on 1 July 2025)30 m
Nighttime lighting index2012/2022VIIRS Nighttime Lights Data (https://eogdata.mines.edu/products/vnl/) (accessed on 1 July 2025)30 m
Note: / does not distinguish between years.
Table 2. Calculation formulas for the landscape ecological risk assessment model.
IndexFormulaMeaning
Landscape Fragmentation (Ci) C i = n i A i Quantifies the degree to which the landscape is dissected and fragmented, reflecting the impact of human activities or natural disturbances on landscape structure
Landscape Separation (Ni) N i = 1 2 × n i A × A A i An indicator used to measure the spatial dispersion of patches of the same landscape type across the study area
Landscape Dominance (Di) D i = Q i + M i 4 × L i 2 An index that measures the extent to which a specific landscape type maintains a dominant position within the overall landscape mosaic
Landscape Disturbance (Ei) E i = a C i + b N i + c D i An indicator that measures the intensity and spatial extent of disturbances caused by natural or anthropogenic factors on landscape structure and function
Landscape Vulnerability (Fi) F i = V i i = 1 n V i Measures the degree of sensitivity and susceptibility of the landscape when subjected to natural or anthropogenic disturbances
Landscape Loss (Ri) R i = E i × F i An indicator that quantifies the degree of area reduction or quality degradation of a specific landscape type over a given period due to natural or human-induced disturbances
Note: Within the formulated mathematical architecture, ni denotes the total abundance of patches corresponding to landscape category i; Ai represents the spatial area of landscape type i (km2); A signifies the aggregate geographical area encompassing the designated landscape ecological risk evaluation unit (km2). Furthermore, Qi characterizes the proportional configuration of sample plots for landscape type i relative to the total sampling pool; Mi manifests the patch abundance ratio, derived from the number of patches in landscape type i divided by the total patch count; Li indicates the areal dominance ratio of landscape type i within the total spatial matrix. The parameters a, b, and c represent the specific weight coefficients allocated to respective dimensions, with predetermined empirical assignments calibrated at 0.5, 0.3, and 0.2, respectively (This set of weights is mainly based on the established expert assignment scheme in the landscape disturbance degree evaluation system proposed in references [47,48] and by Xie Hualin [49], to objectively characterize the differential contributions of various landscape indices to disturbance intensity); Vi is the vulnerability score assigned to each land use type (4 for cropland, 2 for forest, 3 for grassland, 5 for water bodies, and 1 for built-up land), and n is the number of land types.
Table 3. Classification of topographic gradients.
Terrain Gradient ClassificationTNIElevation (m)Slope (°)
T10.6789—0.951465–200
(Low elevation)
0–5 (Flat slope)
T20.9514—1.2531200–400
(Mid-low elevation)
5–15 (Gentle slope)
T31.2531—1.3991400–800
(Mid-high elevation)
15–25 (Moderate slope)
T41.3991—1.5889800–1778
(High elevation)
25–70.8 (Steep slope)
T51.5889—1.9199
Note: Elevation and slope data are used to describe the typical combinations of topographic characteristics within each TNI class and are not involved in the classification process for T1–T5. Since the TNI values for Class T5 already fall within the extremely high range, the corresponding elevation and slope exhibit diverse and discrete distributions; therefore, no single range is reported for this class.
Table 4. Neighborhood weight parameters.
Land Use TypeCroplandForestGrasslandWaterBuilt-Up Land
Neighborhood weight0.2250.4120.0690.1070.186
Table 5. Land transition cost matrix.
CroplandForestGrasslandWaterBuilt-Up Land
Cropland11111
Forest11111
Grassland11111
Water00010
Built-up Land00001
Table 6. Land use area and proportions in Huangshan City, 2002–2022.
Land Use TypeCroplandForestGrasslandWaterBuilt-Up Land
2002Area/km21042.85528469.58953.320186.572865.9142
Percent/%10.78687.6020.0340.8950.682
2012Area/km2836.55548631.79382.771196.4683100.6632
Percent/%8.65389.2800.0290.9981.041
2022Area/km2925.88318472.60812.306796.9813152.3655
Percent/%9.59487.7980.0241.0051.579
Table 7. Contribution of Different Land Use Expansion Drivers Based on the LEAS Model (%).
CroplandForestGrasslandWaterBuilt-Up Land
GDP11.689.911.493.848.85
lighting index2.594.650.001.276.78
NDVI18.7015.085.3411.4824.28
POP12.6413.355.8635.4118.26
precipitation8.7512.505.1817.098.97
temperature9.8813.4817.154.216.78
Aspect4.554.882.135.523.61
DEM15.7512.1738.4613.3911.66
Slope11.0510.8611.724.657.99
Soil types4.413.1112.673.132.83
Table 8. Areas and changes in different landscape ecological risk levels in Huangshan City, 2002–2022 (km2).
Ecological Risk LevelsAreaChange in Risk Area
2002201220222002–20122012–20222002–2022
Low risk area6754.147045.056636.09290.91−408.96−118.05
Lower risk area1728.341512.081753.88−216.26241.8025.54
Medium risk area664.16613.07731.86−51.09118.7967.70
Higher risk area489.06466.99513.37−22.0746.3824.31
High risk area33.4831.9933.98−1.491.990.50
Table 9. Area transition matrix of different landscape ecological risk levels in Huangshan City, 2002–2012 (km2).
Ecological Risk Levels2012
Low Risk AreaLower Risk AreaMedium Risk AreaHigher Risk AreaHigh Risk AreaTotal
2002Low risk area6687.4365.471.240.000.006754.14
Lower risk area352.411346.1729.510.250.001728.34
Medium risk area5.21100.44537.4221.080.00664.15
Higher risk area0.000.0044.89441.452.73489.06
High risk area0.000.000.004.2229.2633.48
Total7045.051512.08613.07466.9931.999669.18
Table 10. Area transition matrix of different landscape ecological risk levels in Huangshan City, 2012–2022 (km2).
Ecological Risk Levels2022
Low Risk AreaLower Risk AreaMedium Risk AreaHigher Risk AreaHigh Risk AreaTotal
2012Low risk area6592.69446.416.940.000.007046.04
Lower risk area42.661292.60175.830.000.001511.09
Medium risk area0.9914.88536.4360.760.00613.07
Higher risk area0.000.0012.65449.634.71466.99
High risk area0.000.000.002.7329.2631.99
Total6636.341753.88731.86513.1233.989669.18
Table 11. Area transition matrix of different landscape ecological risk levels in Huangshan City, 2002–2022 (km2).
Ecological Risk Levels2022
Low Risk AreaLower Risk AreaMedium Risk AreaHigher Risk AreaHigh Risk AreaTotal
2002Low risk area6636.34118.790.000.000.006755.13
Lower risk area0.001635.0992.260.000.001727.35
Medium risk area0.000.00639.6024.550.00664.15
Higher risk area0.000.0044.89441.452.73489.06
High risk area0.000.000.000.0033.4833.48
Total6636.341753.88776.75466.0036.219669.18
Table 12. Projected land use area and proportions in Huangshan City, 2032–2042.
Land Use Type2032 2042
Area/km2Percent/%Area/km2Percent/%
Cropland1001.72710.381066.477511.051
Forest8385.050786.898226.222385.245
Grassland2.09880.0222.01330.021
Water98.18551.01799.97651.036
Built-up land163.08271.69255.45512.647
Table 13. Projected landscape ecological risk areas and changes in Huangshan City, 2032–2042 (km2).
Ecological Risk Levels20322042
Area/km2Percent/%Area/km2Percent/%
Low risk area7860.2481.296401.4866.20
Lower risk area1252.6712.962052.4821.23
Medium risk area381.933.95751.957.78
Higher risk area111.851.16430.784.46
High risk area62.500.6532.490.34
Disclaimer/Publisher’s Note: The statements, opinions and data contained in all publications are solely those of the individual author(s) and contributor(s) and not of MDPI and/or the editor(s). MDPI and/or the editor(s) disclaim responsibility for any injury to people or property resulting from any ideas, methods, instructions or products referred to in the content.