Article

Climate-Driven Range Shifts of Chinese Wolfberry (Lycium chinense Miller) in China: Implications from a Global Niche Model

1
The Research Center of Soil and Water Conservation and Ecological Environment, Chinese Academy of Sciences and Ministry of Education, Yangling 712100, China
2
Institute of Soil and Water Conservation, Chinese Academy of Sciences and Ministry of Water Resources, Yangling 712100, China
3
University of Chinese Academy of Sciences, Beijing 100049, China
4
College of Soil and Water Conservation Science and Engineering, Northwest A&F University, Yangling 712100, China
*
Author to whom correspondence should be addressed.
Sustainability 2026, 18(15), 7802; https://doi.org/10.3390/su18157802 (registering DOI)
Submission received: 24 June 2026 / Revised: 15 July 2026 / Accepted: 21 July 2026 / Published: 2 August 2026
(This article belongs to the Special Issue Afforestation, Vegetation Restoration, and Natural Protection)

Abstract

Chinese wolfberry (Lycium chinense Miller) is a vital medicinal plant and a key species for ecological restoration. While Species Distribution Models (SDMs) are commonly used to predict habitat suitability, they often rely exclusively on native occurrence data, potentially underestimating a species’ climatic niche breadth under assumptions of niche conservatism. This study aims to evaluate the global climatic tolerance of Chinese wolfberry by integrating occurrence data from both native and introduced ranges. We assess the impact of climate change on its potential range shifts in China and determine whether native-only models underestimate the species’ climatic tolerance. We compiled 984 high-quality global distribution points (536 native, 448 introduced). We compared climatic niche breadth derived from native-only data with that from global data. Using MaxEnt modeling, we projected the global niche model onto China under current conditions and under four future Shared Socioeconomic Pathways (SSP126, SSP245, SSP370, and SSP585) for the year 2070 to analyze changes in habitat suitability and centroid migration. The study confirms that relying solely on native data significantly underestimates the climatic tolerance of Chinese wolfberry, particularly for thermal variables (e.g., mean temperature of the warmest/coldest month). The global model, driven primarily by the coldness index, annual biotemperature, and humidity index, showed excellent performance (AUC = 0.952). Currently, highly suitable habitats cover approximately 44% of China’s land area. However, future projections indicate a severe decline in habitat quality. While the total suitable area remains relatively stable, the proportion of highly suitable habitat within the total habitat is projected to drop from 62.6% to as low as 19% under high-emission scenarios. The centroid of highly suitable habitats is expected to migrate multidirectionally at an annual rate of 0.97–2.42 km·a−1, while the altitudinal centroid shows a drastic upward shift of up to 7.24 m·a−1 under the SSP585 scenario. Integrating global occurrence data provides a more robust estimate of the ecological tolerance of Chinese wolfberry. Future climate change poses a significant threat to the quality of suitable habitats in China, necessitating adaptive management strategies such as assisted migration to northern refugia and the implementation of climate-smart agricultural practices to sustain the economic and ecological value of this species.

1. Introduction

Chinese wolfberry (Lycium chinense Miller), a member of the Solanaceae family, is widely recognized to be a vital medicinal plant in traditional Chinese medicine [1,2,3]. Chinese wolfberry has been extensively introduced and cultivated. Notably, it was selected as a key afforestation species for China’s “Grain for Green” Program—the world’s largest ecological restoration initiative—serving the dual purpose of ecological recovery and generating economic benefits for local farmers. Currently, the species is widely planted across the temperate semi-arid regions of northern China and the subtropical hilly areas of the south. Concurrently, other nations such as Japan, South Korea, and various European countries have also introduced Chinese wolfberry for cultivation [4]. To date, it has been introduced to over 40 countries [5], predominantly distributed across temperate and subtropical zones [6], where it has established itself as a significant component of forest ecosystems.
In traditional afforestation practices, species introduction typically adheres to the principle of climatic similarity, assuming that suitable habitats are limited to regions climatically analogous to the native range [7,8,9]. This approach parallels the widespread use of Species Distribution Models (SDMs) to evaluate range shifts, which often rely on the assumption of niche conservatism: a species’ climatic tolerance is static and fully expressed within its native range [10,11,12]. However, this assumption is increasingly challenged. Evidence suggests that relying solely on native occurrence data may underestimate a species’ fundamental niche [11,13,14]. For instance, global analyses of black locust (Robinia pseudoacacia) reveal that introduced populations occupy significantly warmer, colder, and drier climatic spaces than their native counterparts, indicating a substantial expansion of niche width [14]. As subsequent studies argue, data from introduced ranges are critical for defining the fundamental niche, a concept often overlooked in early forestry studies but essential for robust modeling [10,11,15].
The BAM framework, originally proposed by Soberón and Nakamura [16,17], posits that a species’ geographic distribution is determined by the intersection of three fundamental dimensions: biotic interactions, abiotic environmental conditions, and movement (dispersal) capabilities. Within this conceptualization, the fundamental niche is defined solely by abiotic factors, whereas the actual realized distribution is constrained by biotic factors and by the species’ ability to reach suitable habitats. The framework dictates that, to accurately model the potential distribution and realized distribution, one must account for the fullest range of habitat variability. Consequently, a global model that encompasses both native and introduced ranges provides the necessary theoretical rigor to simulate the response of tree species to environmental changes, avoiding the pitfalls of assuming equilibrium in the native range alone.
Nevertheless, climate change is increasingly considered the greatest threat to future global biodiversity [18,19]. Given the current global distribution of Chinese wolfberry and ongoing international introductions, there is a pressing need to move beyond native-centric models. Specifically, accurately predicting the future suitability of Chinese wolfberry in its native China requires the integration of both native and introduced occurrence data. However, recent studies on this species have largely confined SDMs to native data, neglecting global introduction records. For instance, Tang et al. [20] and Liu et al. [21] predicted the climatically suitable habitats of Chinese wolfberry in China using 124 and 216 native presence points, respectively. While both studies assessed the impacts of climate change, they selectively excluded non-native occurrence data despite having access to Global Biodiversity Information Facility datasets. This exclusion risk may underestimate the species’ realized climatic tolerance [11,22]. Crucially, this potential bias remains unexamined, highlighting a significant gap in current research.
Therefore, this study aims to evaluate the global climatic tolerance of Chinese wolfberry by integrating occurrence data from both native and introduced ranges and to assess the impact of climate change on its potential range shifts at the national scale in China. Our specific objectives are to (1) determine whether relying solely on native data underestimates the climatic tolerance of Chinese wolfberry and (2) project how the climatic suitability for this species will evolve under future Shared Socioeconomic Pathways (SSPs). Addressing these questions is critical for understanding the limitations of native-only models, improving the accuracy of species suitability assessments, and formulating robust climate adaptation strategies for Chinese wolfberry.

2. Materials and Methods

2.1. Species Distribution Data

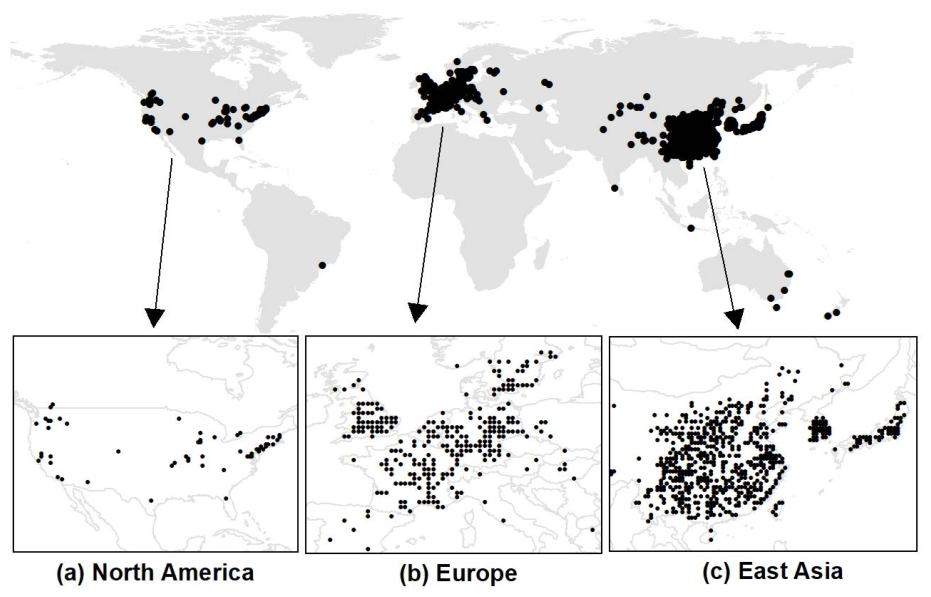
Occurrence data for Chinese wolfberry were obtained from the Global Biodiversity Information Facility (GBIF, http://www.gbif.org; access date 21 October 2024; GBIF Occurrence Download https://doi.org/10.15468/dl.mjcnem; access date 21 October 2024) and the Chinese Virtual Herbarium (CVH, http://www.cvh.ac.cn; access date 10 July 2024). A total of 10,888 initial records were retrieved, comprising 7939 from GBIF and 2949 from CVH. To ensure data quality and mitigate the potential impact of spatial autocorrelation on model predictions, all records were first projected into a unified geographic coordinate system. Subsequently, spatial thinning was performed on a global 0.5° × 0.5° grid (approximately 55 km × 55 km), retaining only one occurrence per grid cell. We aggregated occurrence records to a coarse spatial resolution (0.5° × 0.5°), primarily to mitigate the potential sampling biases and spatial uncertainties inherent in fine-scale GBIF and CVH data, which can otherwise degrade model performance [14]. Furthermore, this resolution aligns with computational constraints and precedents from prior studies, which typically use spatial grains of 50–200 km to ensure efficiency at the global scale [23,24,25]. The process yielded 984 high-quality, spatially independent global distribution points for modeling (536 in native China and 448 in introduced land). The global distribution of Chinese wolfberry is primarily concentrated in East Asia, Europe, and North America (Figure 1).

2.2. Climate Variables

This study selected 13 comprehensive hydrothermal climatic variables (Table 1). These variables were derived from the BIOCLIM, Holdridge life zone, and Kira index systems, providing a comprehensive representation of the key thermal and moisture conditions—and their synergistic effects—influencing plant geographical distribution [26,27,28].
Two sets of climatic variables were constructed in this study: a global dataset at a 0.5° × 0.5° resolution and a China-specific dataset at a 10 arc-minute (~18 km) resolution. The rationale for employing these different resolutions was to ensure that the spatial scale aligned with the specific study area and its corresponding ecological processes. Leveraging the cross-scale capabilities of SDMs, we adopted the finer 10 arc-minute resolution for China. This scale is particularly advantageous for capturing detailed climatic habitats and is highly appropriate for computational simulations.
The global-scale climate data and China-scale climate data were sourced from the WorldClim database (http://www.worldclim.org; access date 10 July 2024). The China-scale climate dataset covered both current (1970–2000) and future (represented by the year 2070) periods [31]. Future climate data for China were based on outputs from five internationally recognized General Circulation Models (GCMs): BCC-CSM2-MR (Beijing Climate Center, China), CMCC-ESM2 (Euro-Mediterranean Center on Climate Change, Italy), GISS-E2-1-G (NASA Goddard Institute for Space Studies, USA), MRI-ESM2-0 (Meteorological Research Institute, Japan), and MPI-ESM1-2-HR (Max Planck Institute for Meteorology, Germany). To reduce the uncertainties associated with individual GCMs, we used the ensemble mean of these five models to represent the general trend of future climate change in China, disregarding inter-model variability—a common strategy for addressing GCM uncertainty [32,33].
Future climate scenarios were selected based on radiative forcing levels under four Shared Socioeconomic Pathways (SSPs): SSP126 (low forcing, corresponding to a sustainable development pathway with low greenhouse gas emissions, representing the most optimistic scenario); SSP245 (intermediate stabilization, with moderate and stabilizing greenhouse gas emissions, representing a relatively optimistic scenario); SSP370 (medium-to-high emissions, reflecting a path of intensified regional rivalry and weaker adaptive capacity, representing a somewhat pessimistic scenario); and SSP585 (high forcing, based on a fossil-fueled development pathway with continued high growth in greenhouse gas emissions, representing the most pessimistic scenario) [34,35,36].

2.3. Experimental Design and Statistical Analysis

2.3.1. Quantifying Climate Tolerance Underestimation

Climate variables were extracted from global and Chinese occurrence points, respectively, to calculate the climate niche breadth (W) for each scale:
W = V m a x V m i n
where Vmax and Vmin denote the maximum and minimum values of a particular climate variable. Based on this, the underestimation ratio (R) of China relative to the global scale was computed as
R = W g W n W g × 100 %
where Wg and Wn denote niche breadth at the global and native Chinese scales, respectively. A one-sample t-test was performed on the resulting R vector (across 13 climate variables) to assess whether its mean differed significantly from zero. A significant result indicates systematic underestimation of climate niche tolerance in China relative to the global scale, i.e., a significant shift in niche breadth [37,38,39].

2.3.2. Model Selection and Evaluation

Species distribution was modeled using MaxEnt (v3.4.3) [9,40], which estimates habitat suitability from environmental covariates at presence locations [41]. Feature types included linear, quadratic, product, threshold, and hinge functions. Parameters were set to a convergence threshold of 10−5, 500 maximum iterations, and 10,000 background points. Logistic output provided the probability of presence (0–1).
Predictive performance was evaluated using the Area Under the Curve (AUC) [42]. Accuracy was categorized as poor (0.5–0.6), fair (0.6–0.7), good (0.7–0.8), very good (0.8–0.9), or excellent (0.9–1.0) [43]. The optimal habitat suitability threshold was determined by the maximum sum of sensitivity and specificity, and key climatic factors were identified by their percentage contribution.

2.3.3. Global Niche Simulation and Projection on China

A global climatic niche model for Chinese wolfberry was developed with MaxEnt (v3.4.3) at 0.5° resolution using 984 thinned records and 13 hydro-thermal variables. For comparison, a native model was calibrated with 536 China-only records. Its extrapolation performance was evaluated against 448 introduced occurrences and 500 background points using AUC. The global model was then projected onto China (10 arc-minute resolution) under the current climate (year 2000) and four future SSP scenarios (SSP126, SSP245, SSP370, SSP585; year 2070) to produce habitat suitability maps.

2.3.4. Detection of Habitat Suitability Changes

To assess habitat dynamics, we used two methods: categorical classification of spatial patterns and continuous subtraction to quantify habitat changes.
First, we classified habitats into four categories: unsuitable (suitability score < threshold), marginal (threshold ≤ score < 0.5), moderately suitable (0.5 ≤ score < 0.7), and highly suitable (0.7 ≤ score ≤ 1.0). The threshold for “unsuitable” was determined using the maximum sum of sensitivity and specificity [44].
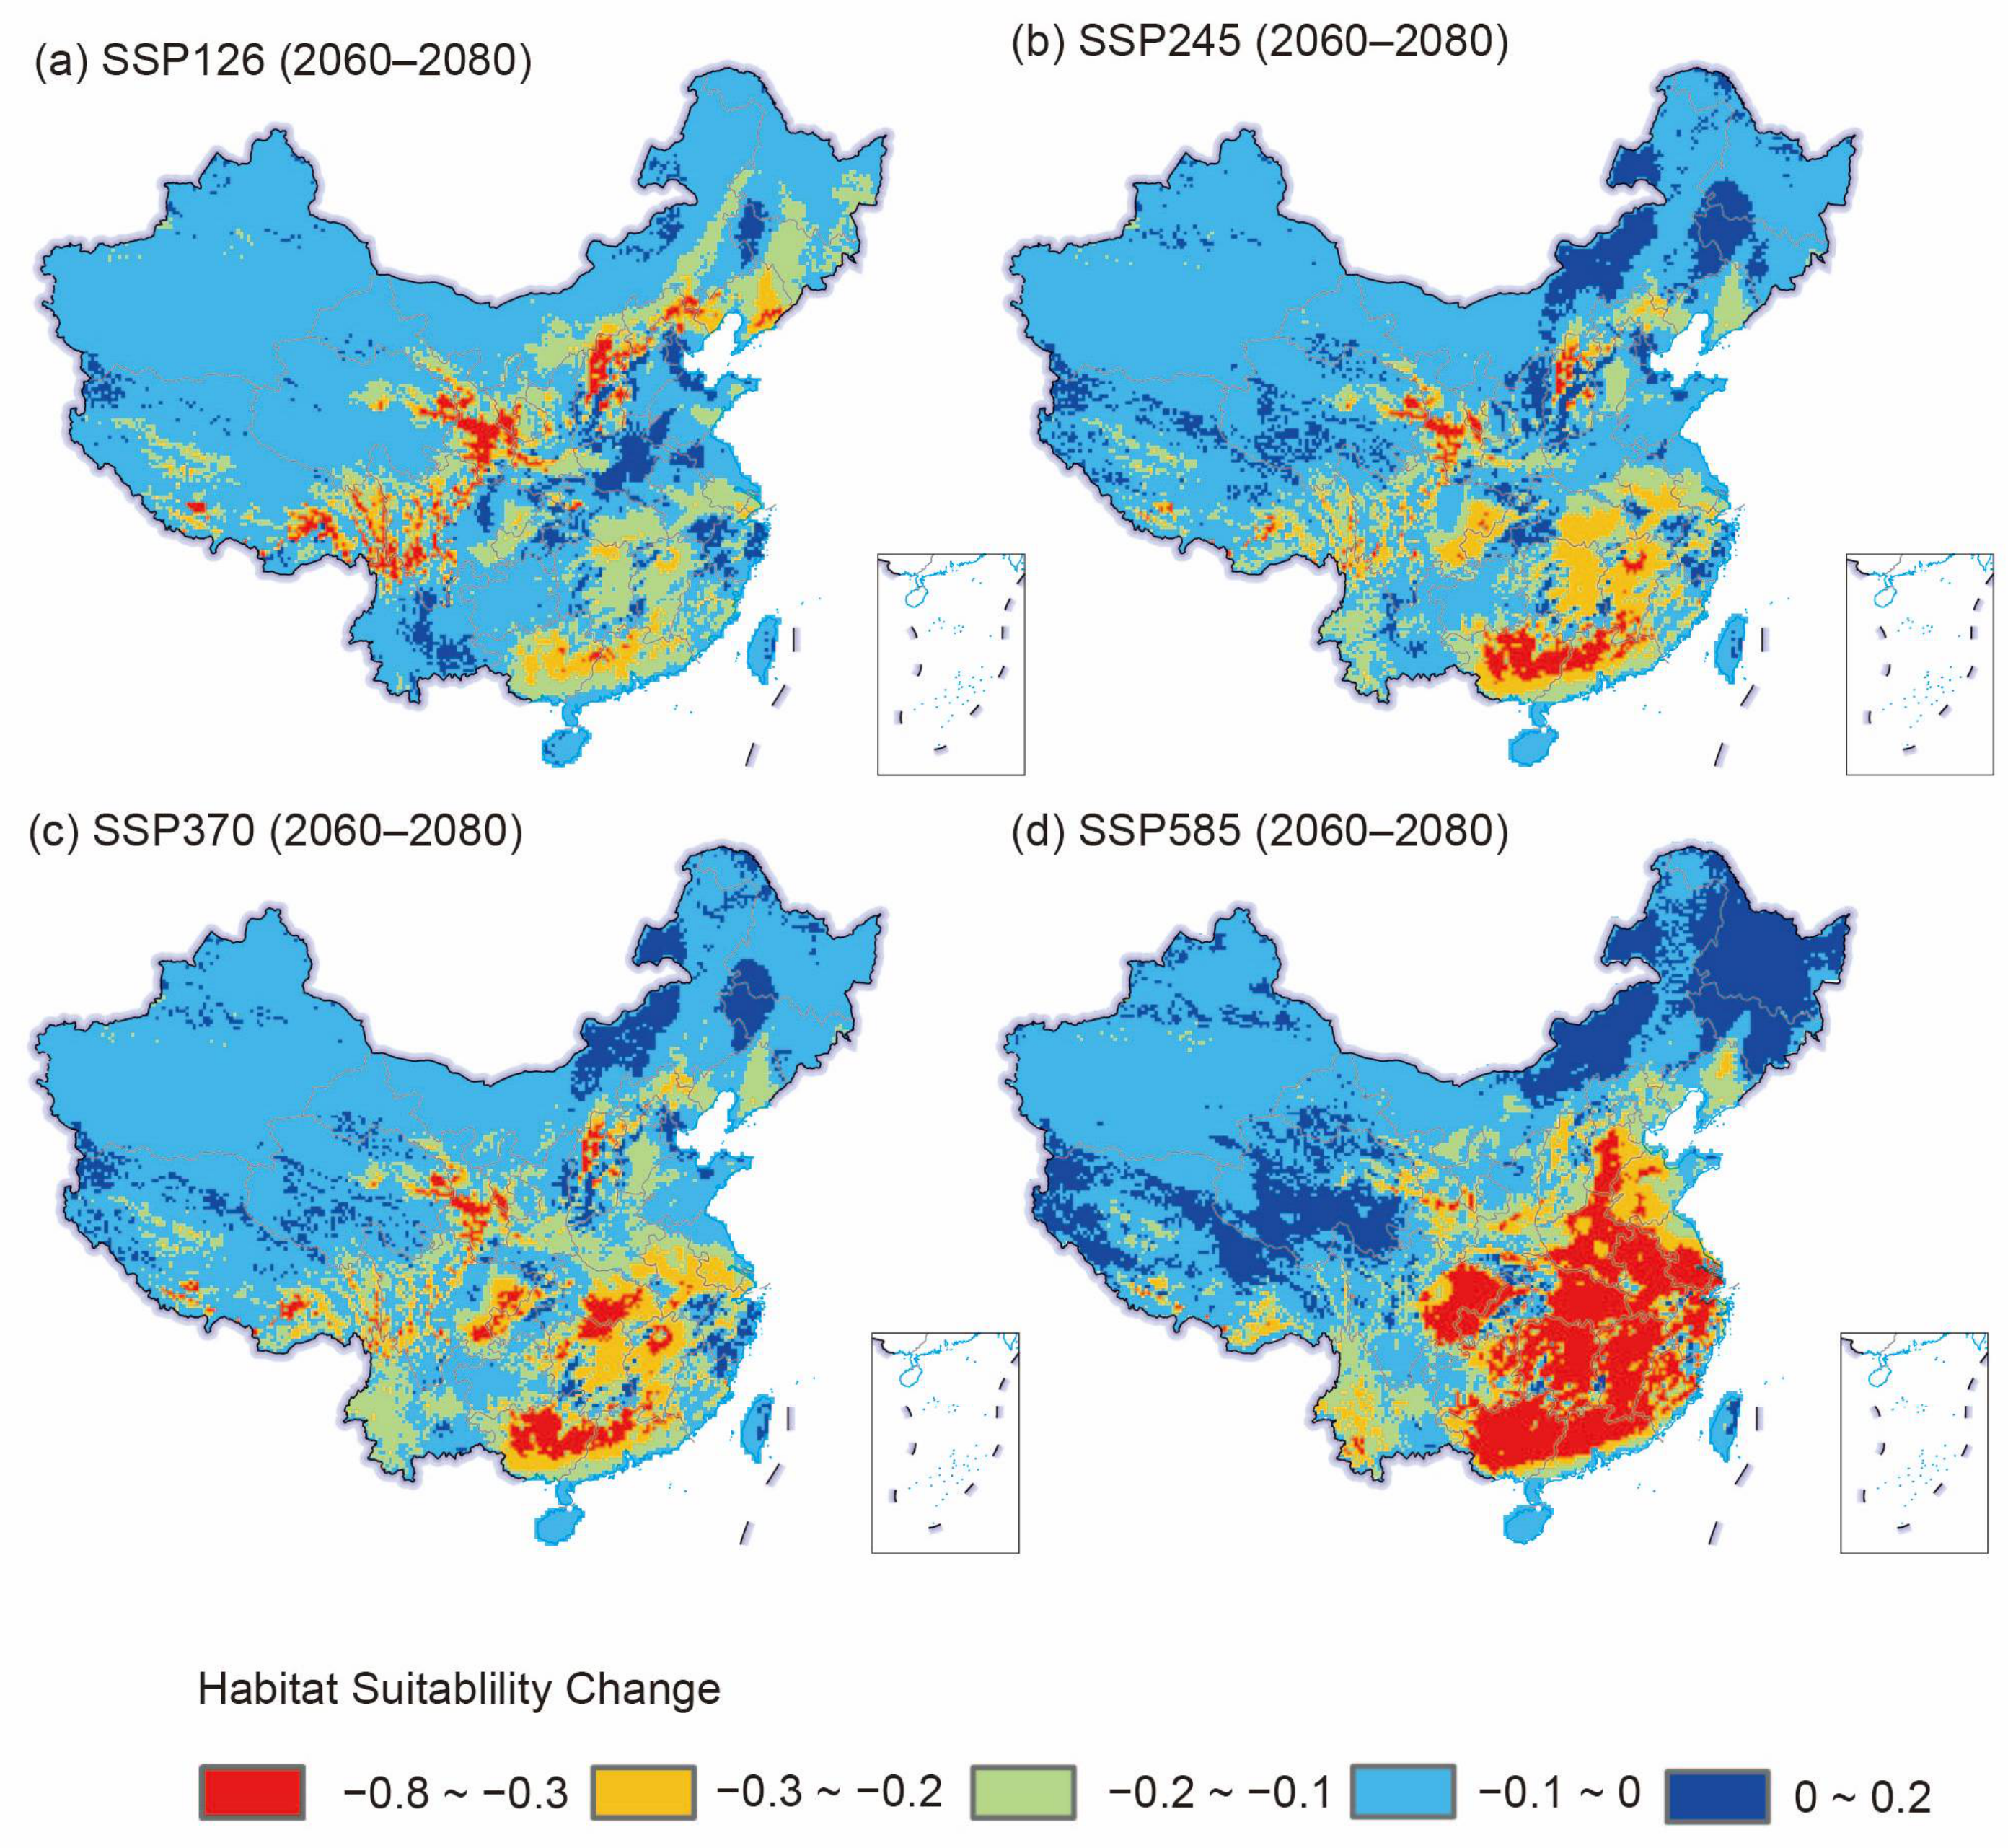
Second, we quantified changes by subtracting current suitability scores from future projections. Based on the observed decline, we categorized changes into five levels: increased (>0), slight decline (−0.1 to 0), moderate decline (−0.2 to −0.1), high decline (−0.3 to −0.2), and severe decline (<−0.3).

2.3.5. Centroid Migration Rate Analysis of the Highly Suitable Area in China

We analyzed centroid migration in three dimensions: longitude, latitude, and altitude.
Horizontal migration: First, we calculated the geographic centroids (weighted centers) of highly suitable areas under current and future climates. We measured the distance between the future and current centroids and divided it by the 70-year time span (2000–2070) to obtain the annual horizontal migration rate (km/year).
Vertical migration: We overlaid the suitability maps with a Digital Elevation Model (DEM) to determine the average elevation of highly suitable areas. The difference between future and current average elevations, divided by 70 years, yielded the annual vertical migration rate (m/year).
Spatial heterogeneity: To analyze elevation changes across space, we divided the map into 1° bands along longitude and latitude. We then calculated the average elevation within each band to assess how the elevational centroid varies along east–west and north–south gradients [45].
All spatial processing and statistical analyses were performed in the R programming environment (version 4.5.1), primarily utilizing the terra, raster, and dismo packages.

3. Results

3.1. Climate Tolerance Change Test: Global vs. China

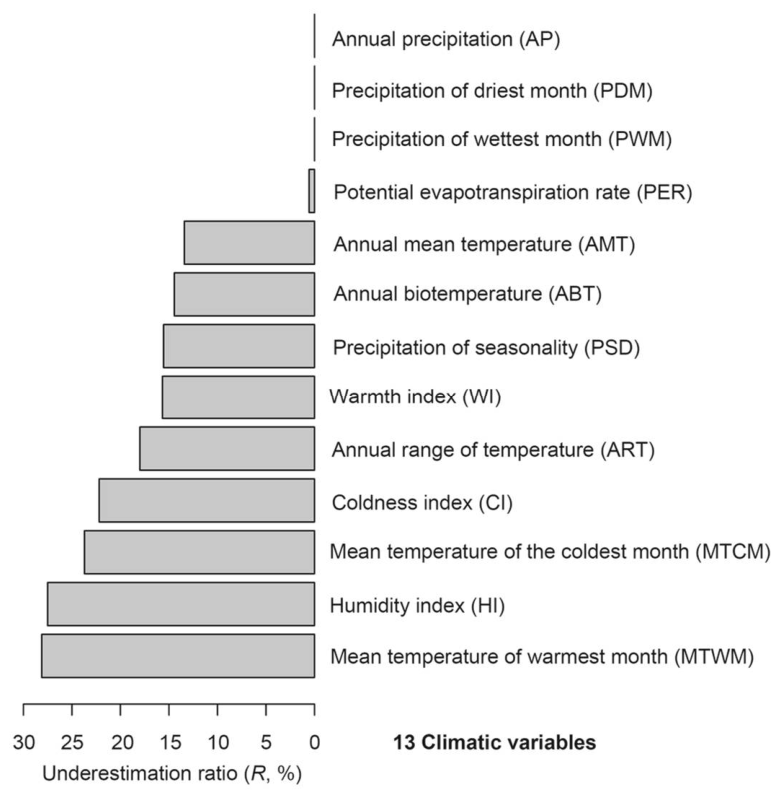
We calculated the underestimation ratio (R) for 13 climatic variables to assess potential niche truncation in China. The results show distinct patterns across climate dimensions (Figure 2). Temperature variables, particularly MTWM and MTCM, had the highest R values (>25%), indicating significant “niche truncation” in thermal adaptability. Conversely, precipitation variables (AP, PDM, PWM) showed R values near zero, suggesting that local moisture regimes adequately encompass the species’ global requirements. Intermediate R values (~15%) were observed for ART, WI, and PSD. A one-sample t-test confirmed that the mean R across all variables was significantly greater than zero (p < 0.05). This demonstrates that the climatic niche observed in China is significantly narrower than the global niche. These findings support the hypothesis that restricting ecological assessments to the native range underestimates the species’ true global potential, especially regarding thermal tolerance.

3.2. Global Niche Model Performance and Key Driving Factors

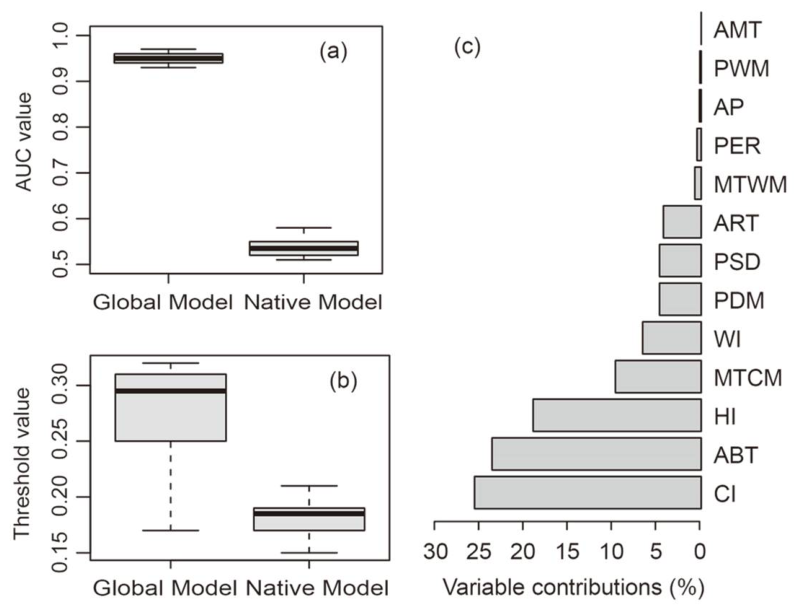
The global ecological niche model for Chinese wolfberry showed an excellent fit, with an average AUC of 0.952, indicating predictive performance significantly better than random (Figure 3a). The optimal threshold, determined by the maximum sensitivity and specificity criterion, was 0.29 (Figure 3b). Conversely, projecting the native Chinese model onto introduced regions yielded a mean AUC of 0.533 and a lower threshold of 0.183, reflecting poor performance. Collectively, these findings demonstrate the global model’s superiority over the native range model.
Among the 13 climatic variables in the global model, the coldness index (CI), annual biotemperature (ABT), humidity index (HI), and minimum temperature of the coldest month (MTCM) were identified as the key drivers of Chinese wolfberry distribution (Figure 3c). Together, these four variables explained 79.5% of the variation in the model. This finding strongly demonstrates that thermal conditions—particularly winter low-temperature limitations and heat accumulation during the growing season—are the primary environmental constraints on the geographical distribution of Chinese wolfberry.

3.3. Current and Future Habitat Suitability Distribution Patterns

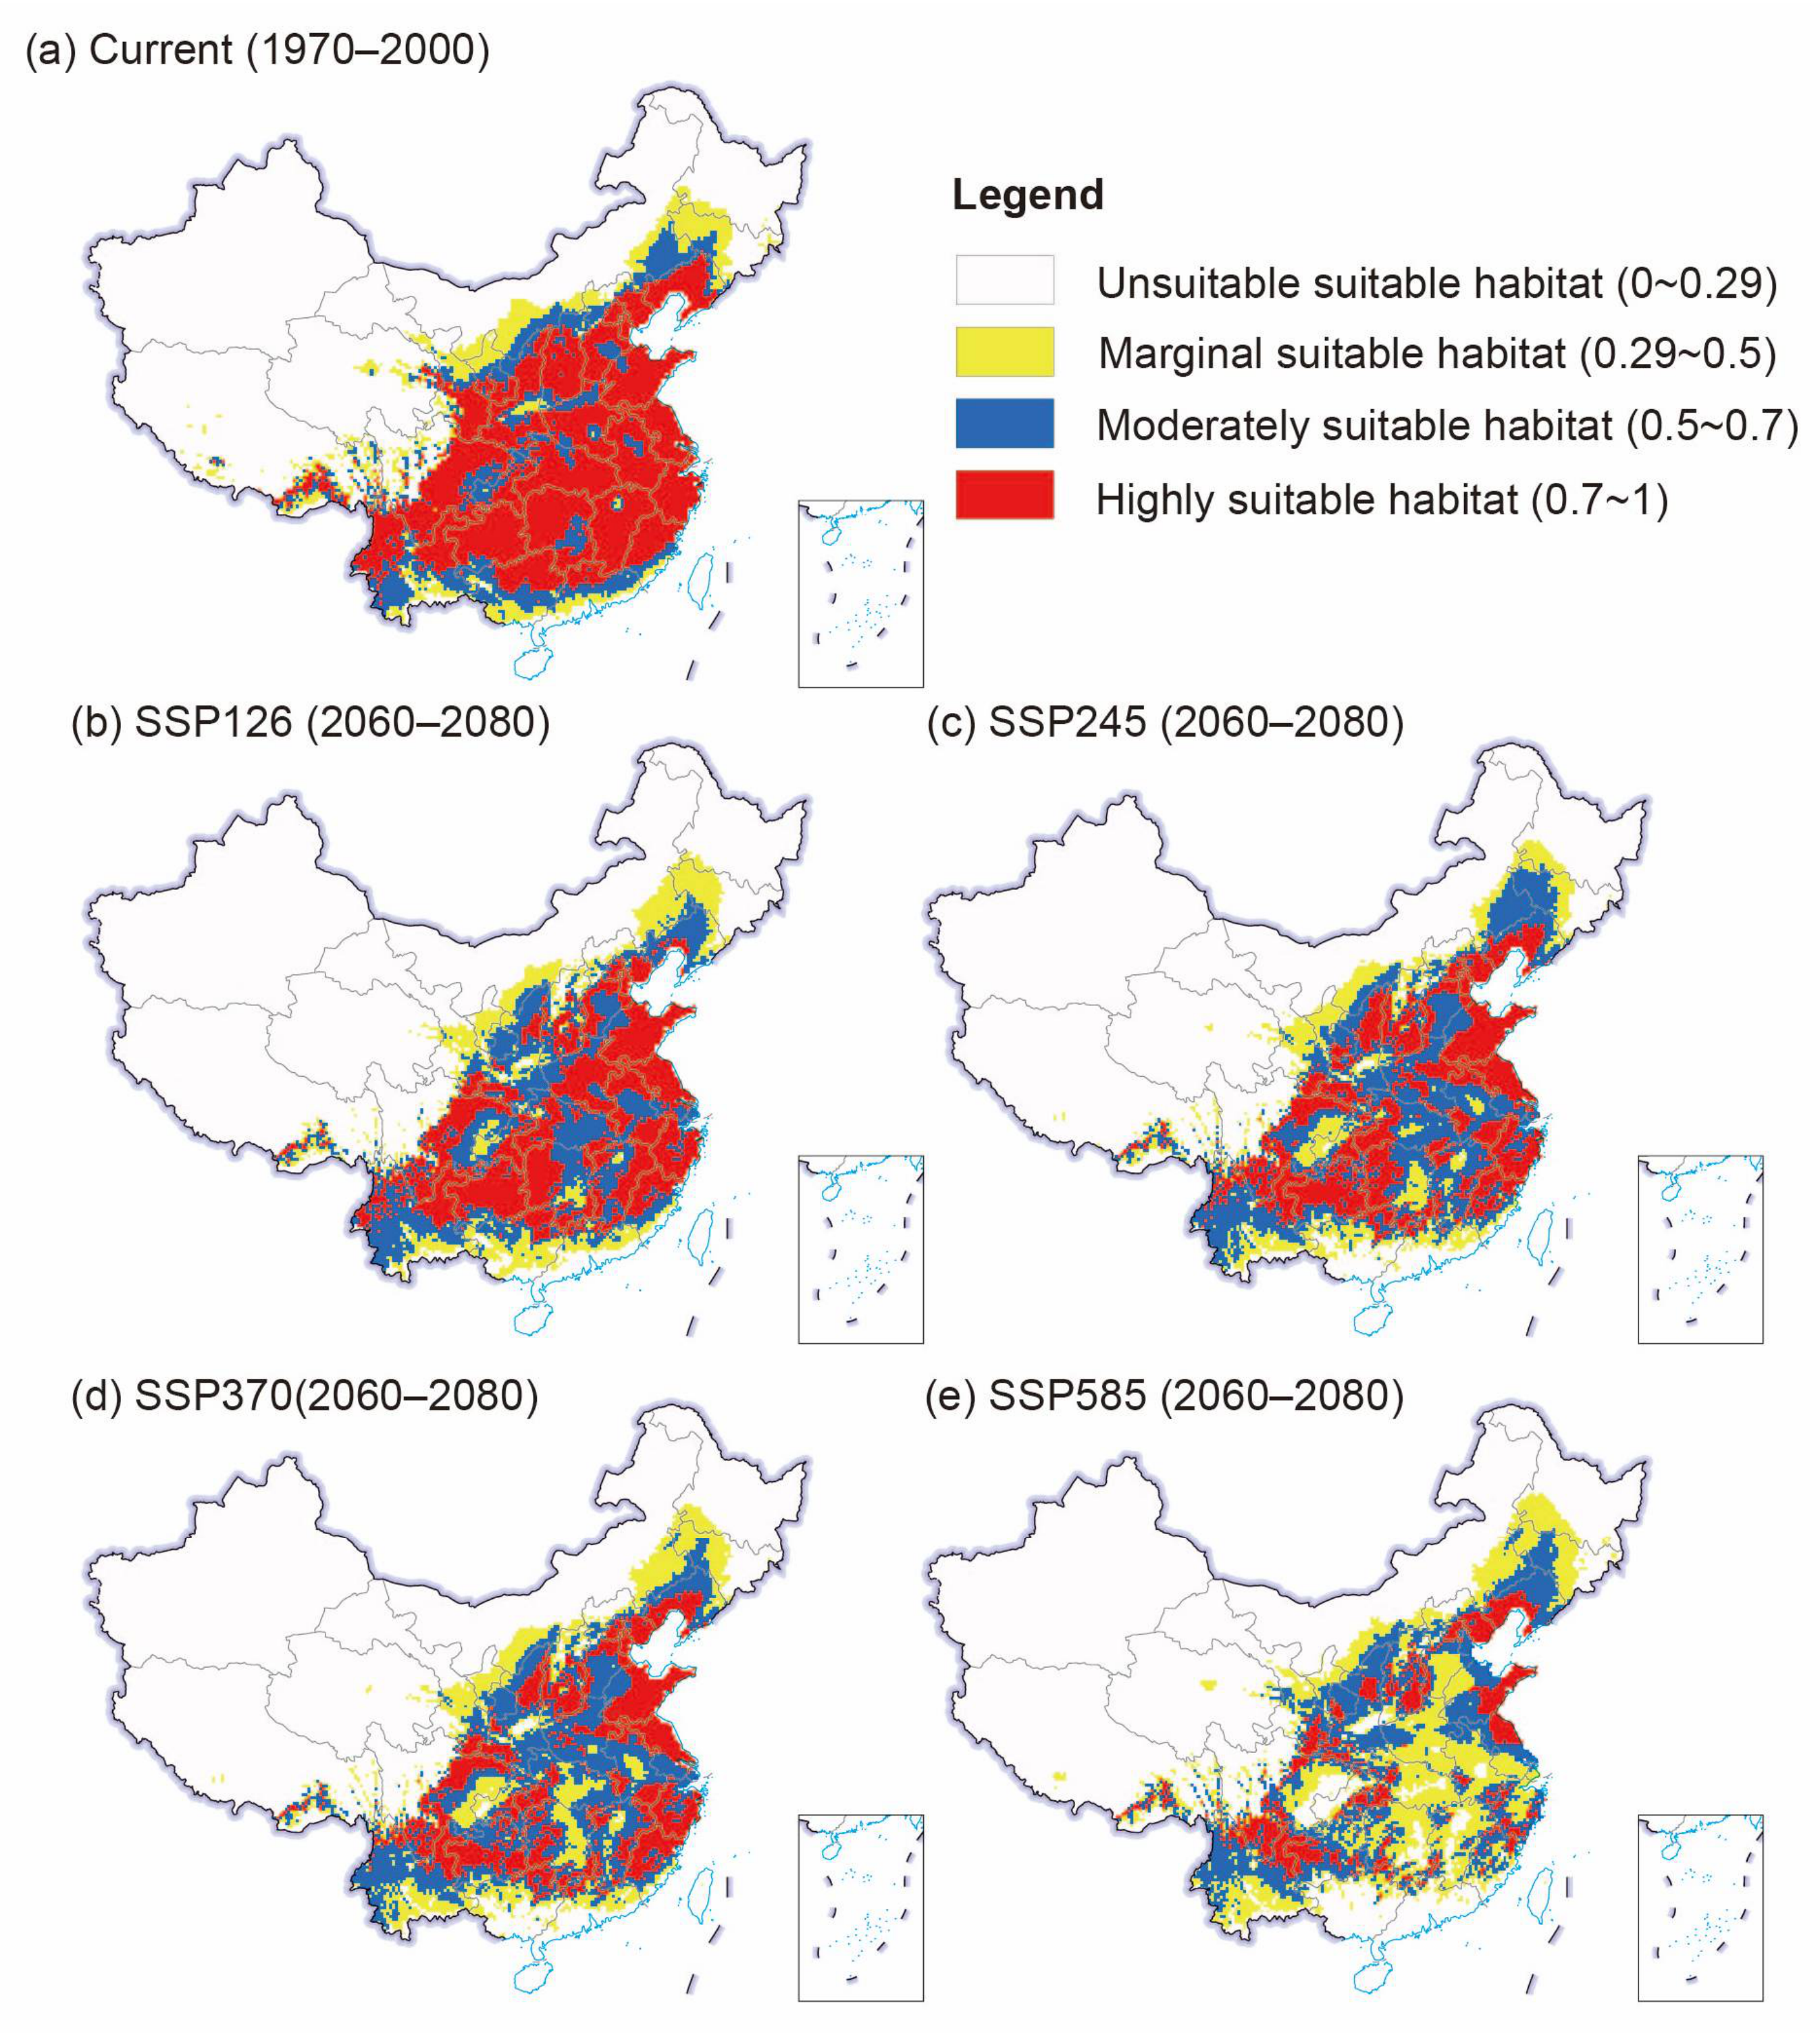
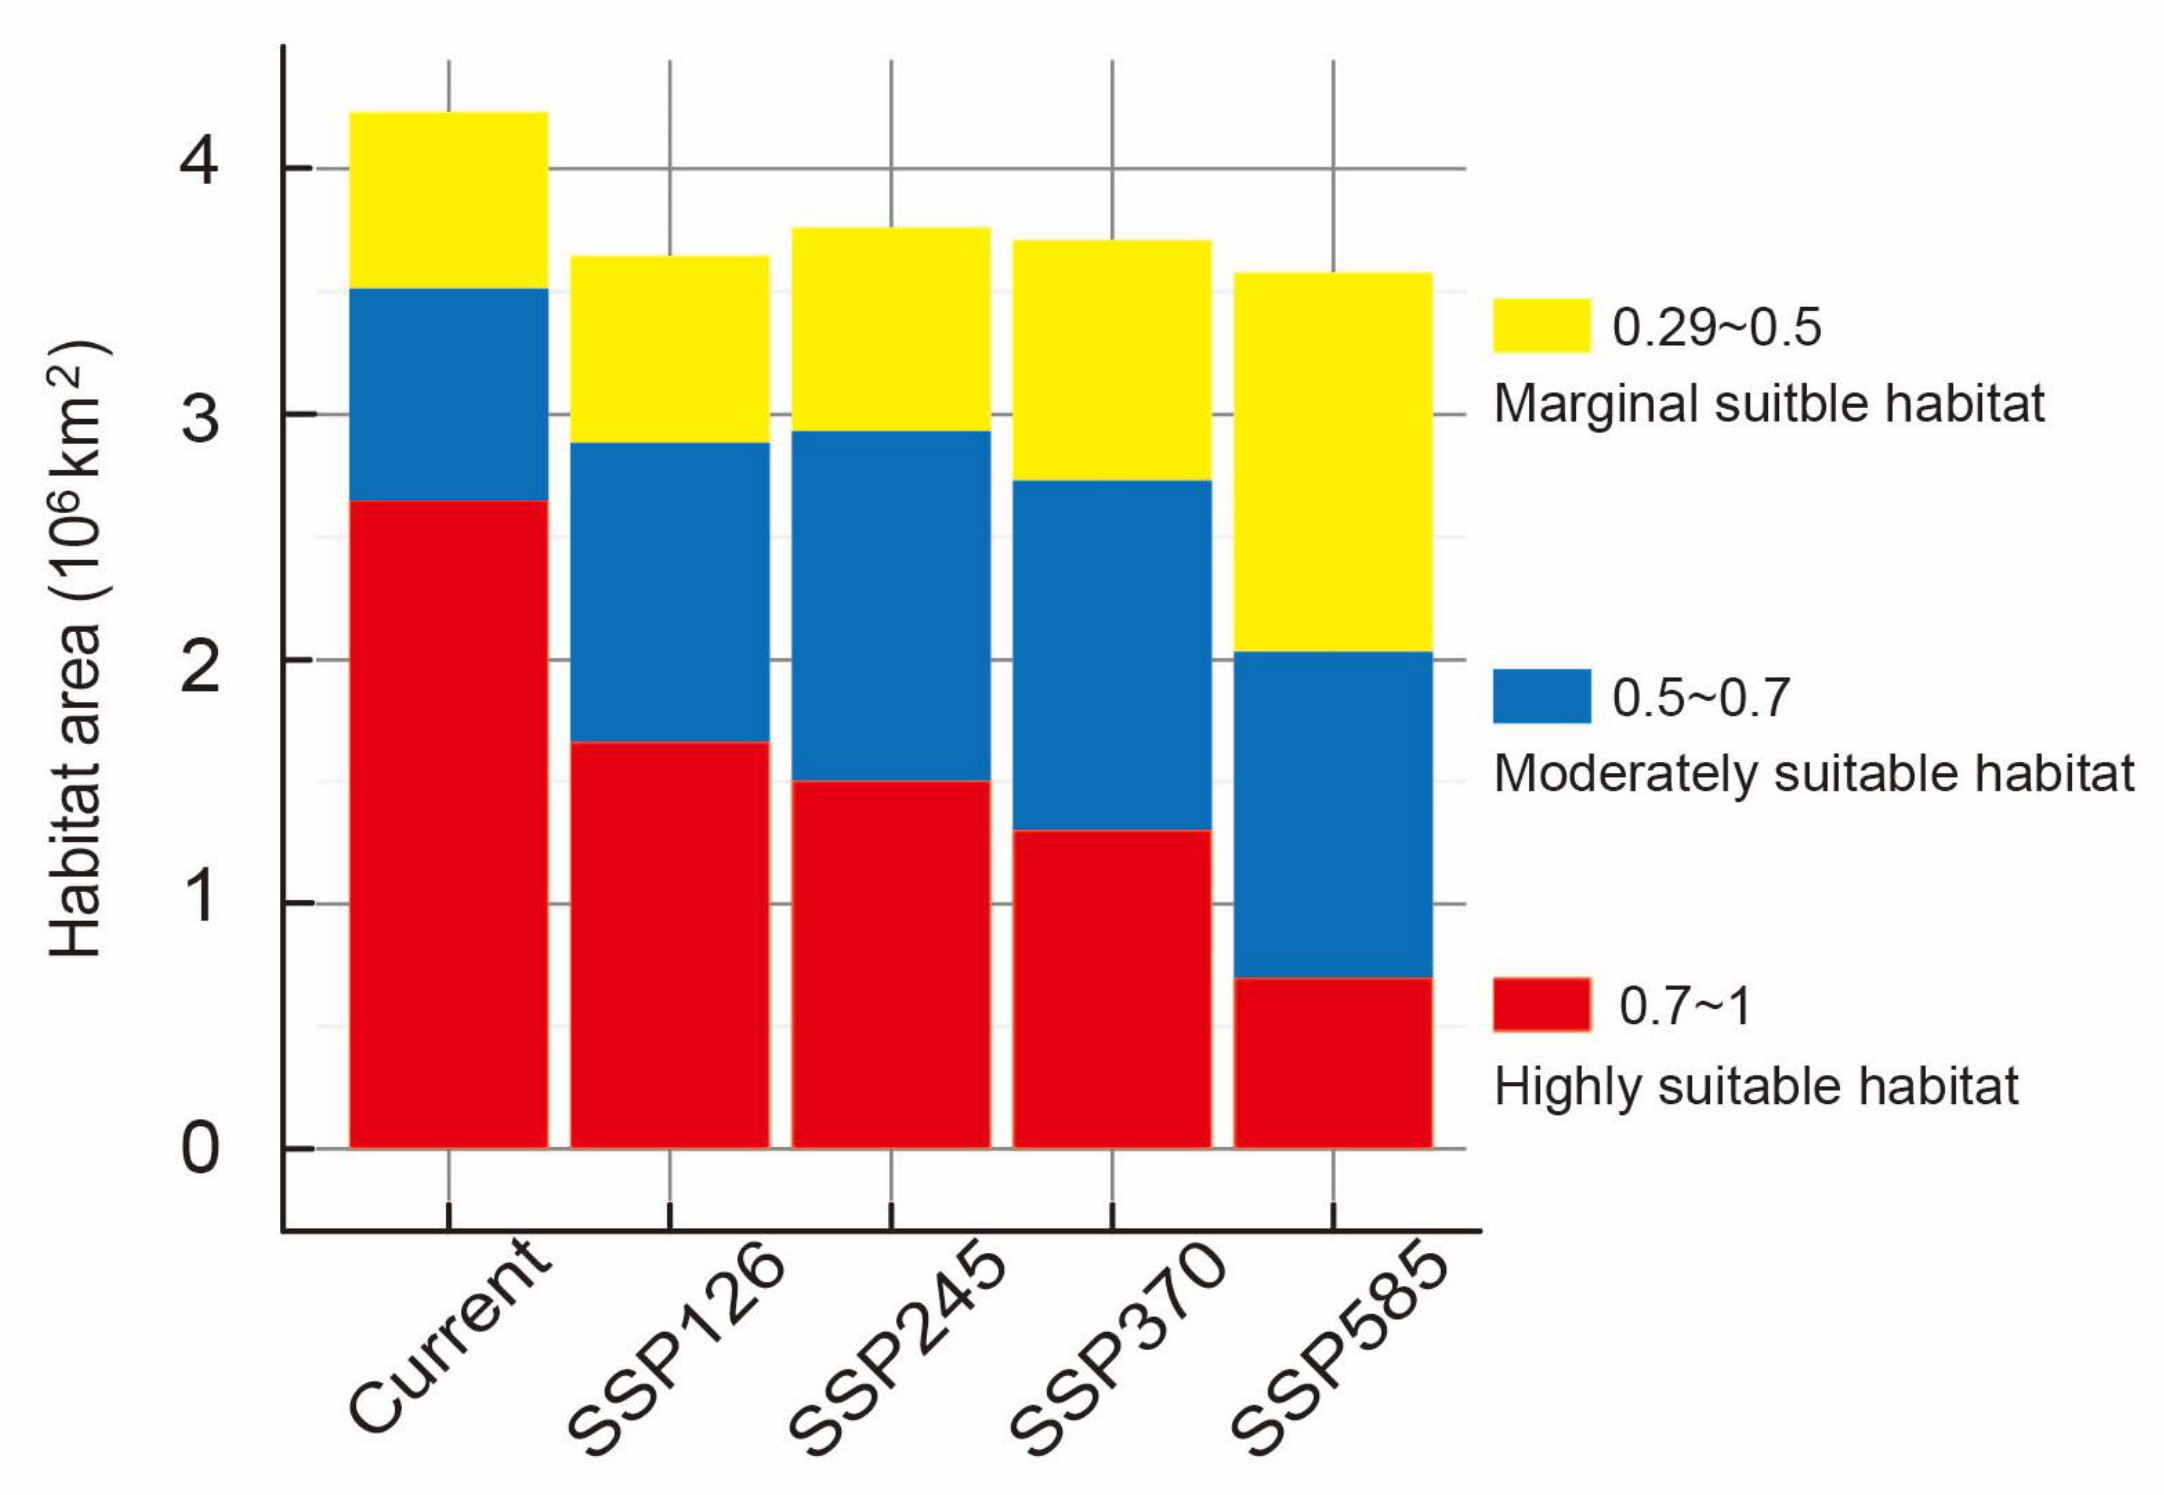
By projecting the global climatic niche model onto China’s current climate (1970–2000), we simulated the habitat suitability grades for Chinese wolfberry (Figure 4a). The results show that the total suitable area for Chinese wolfberry in China is 4.2 × 10⁶ km2, accounting for approximately 44% of the country’s terrestrial land area. These areas are primarily concentrated in the Loess Plateau, Yunnan-Guizhou Plateau, North China Plain, and Southern Hilly Region. Notably, the highly suitable area is 2.6 × 10⁶ km2, representing 62.6% of the total suitable area; the moderately and marginally suitable areas cover 0.86 × 10⁶ km2 (20.4%) and 0.72 × 10⁶ km2 (17.0%), respectively. These data indicate that the current distribution of Chinese wolfberry in China is dominated by highly suitable habitats.
Under the four future climate change scenarios (SSP126, SSP245, SSP370, and SSP585), the total suitable area for Chinese wolfberry is projected to range from 3.6 to 3.8 × 10⁶ km2, covering approximately 37–39% of the national land area (Figure 4b–e). The spatial distribution pattern remains relatively stable, continuing to concentrate in the Loess Plateau, Yunnan-Guizhou Plateau, North China Plain, and Southern Hilly Region, suggesting that the species’ overall distribution range has a certain degree of resilience to climate change. However, habitat quality is expected to undergo significant changes (Figure 5): the highly suitable habitat area will shrink drastically to 0.7–1.7 × 10⁶ km2, with its proportion of the total suitable area dropping to 19–45%—a substantial decline compared to current levels (63%). Meanwhile, the areas classified as moderately and marginally suitable will expand significantly. Notably, under high-emission scenarios (SSP370 and SSP585), the contraction of the highly suitable habitat is particularly severe, reflecting a pronounced negative impact of future climate change on the habitat quality of Chinese wolfberry.
Figure 6 further illustrates the specific impacts of the four future climate scenarios on changes in habitat suitability and quality. The results indicate that, although parts of the Loess Plateau and Yunnan-Guizhou Plateau experience significant impacts under the low-emission SSP126 scenario, most regions remain highly stable across all scenarios. In contrast, vast areas of the Southern Hilly Region will be severely affected by climate change. Under the SSP585 scenario, the suitability index in these regions shows a severe decline (decrease > 0.3), indicating a risk of a transition from suitable to unsuitable habitats under high-emission conditions.

3.4. Migration Rate of the Highly Suitable Habitat Centroid in China

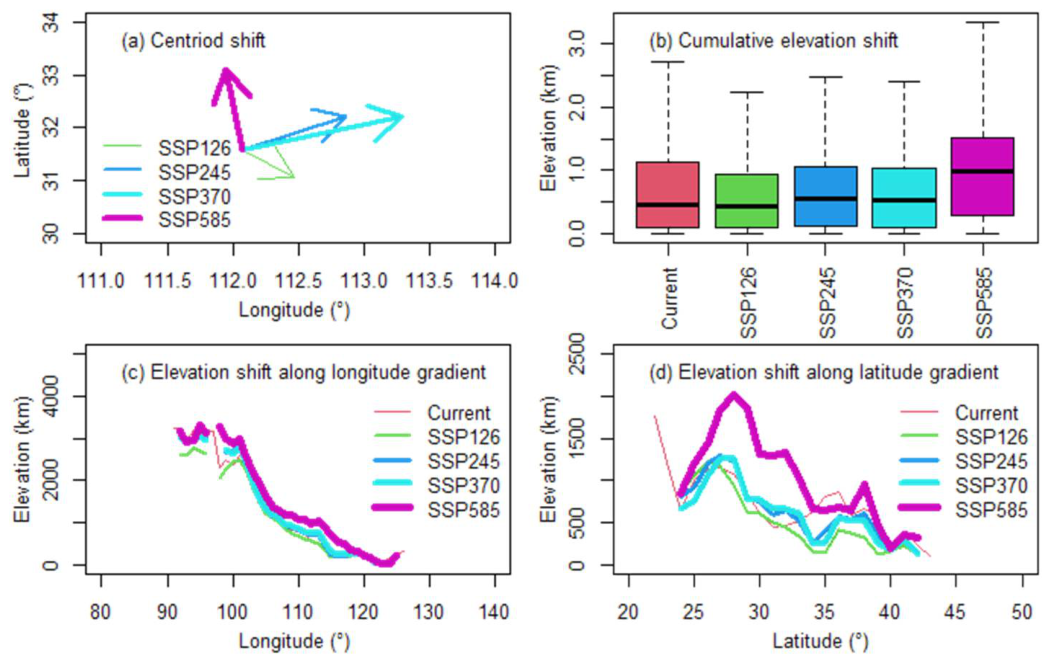
Under different climate change scenarios, the geographic centroid of the Chinese wolfberry’s highly suitable habitat is projected to shift significantly by 2070. The migration distance ranges from 68 to 169 km, corresponding to an annual migration rate of 0.97–2.42 km·a−1 (Figure 7a). The migration direction is multidirectional, and the magnitude of migration increases with higher emission concentrations.
Across scenarios, changes in the altitudinal centroid of the highly suitable habitat are highly scenario-dependent (Figure 7b). Compared with the current climate baseline, the altitudinal centroid under the SSP126 scenario is projected to decrease slightly by 27.3 m by 2070 (an annual change rate of −0.39 m·a−1). Conversely, it is projected to rise by 90.3 m (1.29 m·a−1) and 70.7 m (1.01 m·a−1) under the SSP245 and SSP370 scenarios, respectively. Under the high-emission SSP585 scenario, the altitudinal centroid shifts dramatically upward, with a vertical ascent of 506.8 m, reaching an annual climb rate of up to 7.24 m·a−1.
Further analysis of the altitudinal centroid along longitudinal and latitudinal gradients shows that, under the SSP126, SSP245, and SSP370 scenarios, the spatial pattern of the mean elevation of the highly suitable habitat remains largely consistent with current conditions, indicating limited impacts of low-to-moderate-emission scenarios on vertical distribution (Figure 7c,d). However, under the SSP585 scenario, the altitudinal centroids are significantly higher than current levels across both longitudinal and latitudinal gradients. These findings suggest that the impact of future climate change on the altitudinal distribution of the highly suitable habitat is nonlinear: the effect is relatively weak under low-to-moderate-emission pathways, but triggers a drastic vertical migration response under high-emission pathways.

4. Discussion

4.1. Native-Data Bias and the Broader Climatic Tolerance of Chinese Wolfberry

Our findings confirm that relying solely on native distribution data underestimates Chinese wolfberry’s ecological tolerance, particularly its tolerance to extreme temperatures. By incorporating global occurrence data, we captured a broader climatic envelope consistent with the BAM (Biotic, Abiotic, and Movement) framework [16,17], indicating that the species can tolerate—and potentially adapt to—a wider range of thermal conditions than previously recognized.
This expanded climatic envelope likely reflects the combined effects of intraspecific genetic differentiation and human-mediated dispersal, both of which align with the BAM framework [16]. First, Chinese wolfberry spans a vast latitudinal and elevational gradient across its native range, from continental northwest China, where winter minima can drop below −20 °C, to arid Central Asian and Mediterranean environments, where summer maxima exceed 40 °C. Prolonged divergent selection across these contrasting climates has likely fixed distinct thermal tolerance alleles in regional populations—for example, cold-acclimation pathways in northern genotypes and heat-shock protein regulation in southern ones [46]. Because native-only records predominantly sample the Chinese core of this gradient, they systematically underestimate the species’ full physiological breadth [47]. Second, within the BAM framework, the “Movement” component is critical: centuries of intentional introduction for medicinal, ornamental, and agroforestry purposes have placed Chinese wolfberry in novel thermal environments well beyond its biotic limits at home [48,49]. These introduced populations represent realized niches in climates that native-distribution models never captured, thereby widening the observed climatic envelope. Together, local adaptation and anthropogenic dispersal explain why native-only data truncate the species’ ecological tolerance—a finding with direct implications for forecasting its potential range under future climate scenarios [47].

4.2. Drivers of Habitat Contraction in China

Despite a relatively stable total suitable area, highly suitable areas have contracted sharply (from 62.6% to 19%), indicating a systematic “ratcheting down” of habitat quality. This degradation is driven by three synergistic mechanisms. First, thermal thresholds are increasingly breached. Under SSP585, summer temperatures in southern China frequently exceed 35 °C, triggering flower and fruit abortion through heat stress responses and suppressing photosynthetic efficiency. Southern hilly regions, already at low latitudes, are disproportionately affected: formerly “highly suitable” habitats degrade to marginal or unsuitable conditions. Second, hydrothermal imbalance intensifies. Warming elevates potential evapotranspiration faster than precipitation can replenish soil moisture, inducing physiological drought that impairs root uptake and amplifies reproductive failure [50]. Regions once characterized by moderate moisture availability have become too hot and dry for a species that has adapted to cool, semi-arid conditions. Third, meteorological volatility destabilizes phenology. Increased spring frost risk, combined with more frequent summer heat days, disrupts the phenological window on which Chinese wolfberry depends [51]. Because highly suitable habitat designation requires all of the key thresholds to be met simultaneously, even a single exceeded metric (e.g., peak summer temperature or growing season accumulated heat) instantly downgrades a highly suitable area to moderate suitability. Collectively, these mechanisms explain why highly suitable habitat quality is collapsing faster than total area: climate change is not eliminating the species’ survival space, but is systematically dismantling its optimal niche.

4.3. Mechanisms Underlying Centroid Shift

The projected centroid migration (68–169 km by 2070; 0.97–2.42 km·a−1) shows scenario-dependent, multidirectional patterns that reflect the interplay of thermal and hydrological gradients rather than simple latitudinal isotherm tracking. Under SSP585, the northward shift aligns with the general expectation of poleward range retreat driven by thermal exclusion of southern habitats [52]. Under SSP126, the southeastward migration suggests that, under milder warming, the distribution is governed more by moisture availability and bioclimatic thresholds favoring humid southeastern conditions; here, the signal is hydrothermal optimization rather than thermal escape. Under intermediate scenarios (SSP245, SSP370), the northeastward shift indicates that moderate warming can open previously limited northern areas, provided that precipitation remains adequate. This nonlinear, scenario-divergent response is further modulated by topographic heterogeneity: mountains and elevation gradients create micro-refugia that produce nonlinear centroid trajectories as the species tracks localized suitability pockets.
Vertical migration reveals a critical threshold effect. Under low-to-moderate scenarios, the altitudinal centroid remains stable or shifts marginally (<1.3 m·decade−1), indicating that moderate warming can be accommodated within the current elevational niche. Under SSP585, however, the rate accelerates to 7.24 m·decade−1—a tipping point that may be driven by lethal lowland heat stress and intensified evapotranspiration. This pronounced divergence suggests that, while the species can accommodate moderate climatic variations, severe warming may exert significant upward pressure on its climatic optimum. This spatial trend reflects a potential shift in suitable habitats toward higher elevations [53,54]. However, as Chinese wolfberry is primarily a cultivated species, its actual distribution and survival will also be heavily influenced by human management, dispersal capacity, and biotic interactions. Therefore, while the upward shift of the climatic centroid highlights the spatial impact of warming, the actual risk of local habitat loss depends on multiple complex factors beyond purely climatic suitability [55].

4.4. Implications, Uncertainties, and Management

Several uncertainties should be acknowledged. First, although we used an ensemble of five GCMs, our assessment focused primarily on mean climate projections rather than extreme events; consequently, future emission pathways and their potential for extreme climatic anomalies remain inherently uncertain [56,57]. Second, while the assumption of unlimited dispersal is often considered unrealistic for species in fragmented landscapes, the cultivated nature of the species studied implies that human-mediated introduction and assisted migration may approximate unrestricted dispersal. Third, biotic interactions and edaphic factors were not explicitly modeled, so the projected impacts may underestimate actual vulnerability [58]; thus, future studies should prioritize assessing the influence of these non-climatic determinants. Fourth, several methodological and data-related limitations may further affect model accuracy and transferability. Potential sampling bias in GBIF occurrence data—often skewed toward easily accessible areas such as roads, urban settlements, and rivers—means that the model may reflect uneven survey effort rather than the species’ true environmental suitability [24]. Additionally, the exclusion of land-use and soil variables restricts the model’s ability to capture fine-scale habitat constraints and human-induced landscape changes, which are critical for cultivated species. Finally, the spatial resolution of the input data introduces another layer of uncertainty, as coarser resolutions may obscure microclimatic refugia or local habitat heterogeneity, while finer resolutions may amplify the effects of spatially biased occurrence records [59]. Together, these factors suggest that the projected distribution should be interpreted as a broad-scale climatic envelope rather than a precise prediction of future habitat suitability. Nonetheless, the projected multidirectional centroid shifts and severe contraction of highly suitable habitat pose significant threats to the sustainability of Chinese wolfberry plantations. We recommend three adaptive strategies: (1) assisted migration to northern and northeastern climatic refugia identified under future scenarios; (2) identification of micro-refugia and implementation of climate-smart practices in southern regions facing severe degradation; and (3) recognition that the drastic impacts under SSP585 underscore the urgency of global mitigation to preserve both the ecological and economic value of this species.

5. Conclusions

This study provides a comprehensive assessment of the global climatic tolerance of Chinese wolfberry (Lycium chinense Miller) and projects potential shifts in its distribution in China under future climate change scenarios. By integrating occurrence data from both native and introduced ranges, we demonstrate that relying solely on native data significantly underestimates the species’ fundamental niche, particularly its tolerance to extreme temperatures. This finding underscores the importance of incorporating global introduction records in Species Distribution Models (SDMs) to avoid niche truncation and improve the accuracy of ecological forecasting. Our projections indicate that, while the total suitable area for Chinese wolfberry in China may remain relatively stable, habitat quality is expected to degrade significantly. Under high-emission scenarios (e.g., SSP585), the proportion of highly suitable habitats is expected to contract drastically, with severe declines in the Southern Hilly Region. Furthermore, the geographic centroid of highly suitable habitats will shift multidirectionally, accompanied by pronounced upward migration in elevation, especially under pessimistic climate scenarios. These findings suggest that climate change poses a substantial threat to the sustainability of Chinese wolfberry cultivation and its ecological function. To mitigate these impacts, we recommend implementing assisted migration strategies toward northern and northeastern climatic refugia, identifying and protecting micro-refugia in southern regions facing severe degradation, and recognizing that the severity of habitat loss is directly linked to emission levels, underscoring the urgency of global climate action to preserve the economic and ecological value of this species.

Author Contributions

Conceptualization, L.W., Z.Z., F.S., J.H., S.D. and G.L.; methodology, L.W. and G.L.; formal analysis, L.W. and G.L.; investigation, L.W.; writing—original draft preparation, L.W. and G.L.; writing—review and editing, L.W., Z.Z., F.S., J.H., S.D. and G.L.; supervision, G.L.; project administration, G.L. All authors have read and agreed to the published version of the manuscript.

Funding

This research was funded by the National Natural Science Foundation of China, grant number 31971488.

Institutional Review Board Statement

Not applicable.

Informed Consent Statement

Not applicable.

Data Availability Statement

No new data were created or analyzed in this study. Data sharing is not applicable to this article.

Conflicts of Interest

The authors declare no conflicts of interest. The funders had no role in the design of the study; in the collection, analyses, or interpretation of data; in the writing of the manuscript; or in the decision to publish the results.

References

  1. Yao, R.; Heinrich, M.; Weckerle, C.S. The genus Lycium as food and medicine: A botanical, ethnobotanical and historical review. J. Ethnopharmacol. 2018, 212, 51–66. [Google Scholar] [CrossRef] [PubMed]
  2. Potterat, O. Goji (Lycium barbarum and L. chinense): Phytochemistry, pharmacology and safety in the perspective of traditional uses and recent popularity. Planta Med. 2009, 76, 7–19. [Google Scholar] [CrossRef] [PubMed]
  3. Wetters, S.; Horn, T.; Nick, P. Goji who? Morphological and DNA based authentication of a “superfood”. Front. Plant Sci. 2018, 9, 1859. [Google Scholar] [CrossRef]
  4. Shah, T.; Bule, M.; Niaz, K. Chapter 3.21-Goji berry (Lycium barbarum)—A superfood. In Nonvitamin and Nonmineral Nutritional Supplements; Nabavi, S.M., Silva, A.S., Eds.; Academic Press: London, UK, 2019; pp. 257–264. [Google Scholar] [CrossRef]
  5. Plants of the World Online. Lycium chinense Mill. Available online: http://powo.science.kew.org/taxon/urn:lsid:ipni.org:names:816389-1 (accessed on 18 June 2026).
  6. Jiang, Y.; Fang, Z.; Leonard, W.; Zhang, P. Phenolic compounds in Lycium berry: Composition, health benefits and industrial applications. J. Funct. Foods 2021, 77, 104340. [Google Scholar] [CrossRef]
  7. Franklin, J. Mapping Species Distributions: Spatial Inference and Prediction, 1st ed.; Cambridge University Press: Cambridge, UK, 2010. [Google Scholar] [CrossRef]
  8. Pearson, R.G.; Dawson, T.P. Predicting the impacts of climate change on the distribution of species: Are bioclimate envelope models useful? Glob. Ecol. Biogeogr. 2003, 12, 361–371. [Google Scholar] [CrossRef]
  9. Phillips, S.J.; Anderson, R.P.; Schapire, R.E. Maximum entropy modeling of species geographic distributions. Ecol. Model. 2006, 190, 231–259. [Google Scholar] [CrossRef]
  10. Booth, T.H. Assessing species climatic requirements beyond the realized niche: Some lessons mainly from tree species distribution modelling. Clim. Change 2017, 145, 259–271. [Google Scholar] [CrossRef]
  11. Booth, T.H.; Jovanovic, T. Do Eucalypt species display similar potential niche patterns to North America Trees? Austral Ecol. 2025, 50, e70092. [Google Scholar] [CrossRef]
  12. Pauchard, A.; Milbau, A.; Albihn, A.; Alexander, J.; Burgess, T.; Daehler, C.; Englund, G.; Essl, F.; Evengard, B.; Greenwood, G.B.; et al. Non-native and native organisms moving into high elevation and high latitude ecosystems in an era of climate change: New challenges for ecology and conservation. Biol. Invasions. 2016, 18, 345–353. [Google Scholar] [CrossRef]
  13. Hutchinson, G.E. Concluding remarks. Cold Spring Harb. Symp. Quant. Biol. 1957, 22, 415–427. [Google Scholar] [CrossRef]
  14. Li, G.; Xu, G.; Guo, K.; Du, S. Mapping the global potential geographical distribution of black locust (Robinia pseudoacacia L.) using herbarium data and a maximum entropy model. Forests 2014, 5, 2773–2792. [Google Scholar] [CrossRef]
  15. Booth, T.H.; Nix, H.A.; Hutchinson, M.F. Niche analysis and tree species introduction. For. Ecol. Manag. 1988, 23, 47–59. [Google Scholar] [CrossRef]
  16. Soberón, J. Grinnellian and Eltonian niches and geographic distributions of species. Ecol. Lett. 2007, 10, 1115–1123. [Google Scholar] [CrossRef] [PubMed]
  17. Peterson, A.T.; Soberón, J.; Pearson, R.G.; Anderson, R.P.; Martínez-Meyer, E.; Nakamura, M.; Araújo, M.B. Ecological Niches and Geographic Distributions; Princeton University Press: Princeton, NJ, USA, 2011. [Google Scholar]
  18. Mechler, R.; Bouwer, L.M.; Schinko, T.; Surminski, S.; Linnerooth-Bayer, J. Loss and Damage from Climate Change: Concepts, Methods and Policy Options; Springer: Cham, Switzerland, 2019. [Google Scholar] [CrossRef]
  19. Zhang, W.; Brandt, M.; Penuelas, J.; Guichard, F.; Tong, X.; Tian, F.; Fensholt, R. Ecosystem structural changes controlled by altered rainfall climatology in tropical savannas. Nat. Commun. 2019, 10, 671. [Google Scholar] [CrossRef] [PubMed]
  20. Yan, T.; Runan, Z.; Gang, R.; Fuliang, C.; Zunling, Z. Prediction of potential distribution of Lycium chinense based on MaxEnt model and analysis of its important influencing factors. J. Beijing For. Univ. 2021, 43, 23–32. [Google Scholar] [CrossRef]
  21. Liu, Y.; Lu, Z.; Fu, X.; Wang, C.; Feng, C.; Song, Y.; Gu, X.; Chai, T.; Pei, L.; Ma, D. Predicting the potential habitats of two Lycium species and the quality suitability of Lycium chinense Mill. cortex under climate change. BMC Ecol. Evol. 2025, 25, 74–90. [Google Scholar] [CrossRef] [PubMed]
  22. Boiffin, J.; Badeau, V.; Bréda, N. Species distribution models may misdirect assisted migration: Insights from the introduction of Douglas-fir to Europe. Ecol. Appl. 2017, 27, 446–457. [Google Scholar] [CrossRef] [PubMed]
  23. Jetz, W.; McPherson, J.M.; Guralnick, R.P. Integrating biodiversity distribution knowledge: Toward a global map of life. Trends Ecol. Evol. 2012, 27, 151–159. [Google Scholar] [CrossRef] [PubMed]
  24. Beck, J.; Ballesteros-Mejia, L.; Nagel, P.; Kitching, I.J. Online solutions and the “Wallacean shortfall”: What does GBIF contribute to our knowledge of species’ ranges? Divers. Distrib. 2013, 19, 1043–1050. [Google Scholar] [CrossRef]
  25. Ballesteros-Mejia, L.; Kitching, I.J.; Jetz, W.; Nagel, P.; Beck, J. Mapping the biodiversity of tropical insects: Species richness and inventory completeness of African sphingid moths. Glob. Ecol. Biogeogr. 2013, 22, 586–595. [Google Scholar] [CrossRef]
  26. Li, G.; Xu, G.; Guo, K.; Du, S. Geographical boundary and climatic analysis of Pinus tabulaeformis in China: Insights on its afforestation. Ecol. Eng. 2016, 86, 75–84. [Google Scholar] [CrossRef]
  27. Holdridge, L.R. Determination of world plant formations from simple climatic data. Science 1947, 105, 367–368. [Google Scholar] [CrossRef] [PubMed]
  28. Kira, T. A New Classification of Climate in Eastern Asia as the Basis for Agricultural Geography; Horticultural Institute, Kyoto University: Kyoto, Japan, 1945. [Google Scholar]
  29. Kira, T. On the altitudinal arrangement of climatic zones in Japan—A contribution to the rational land utilization in cool highlands. Kanti-Nougaku 1948, 2, 143–173. [Google Scholar]
  30. Xu, W.D. Kira’s temperature indices and their application in the study of vegetation. Chin. J. Ecol. 1985, 3, 35–39. [Google Scholar] [CrossRef]
  31. Hijmans, R.J.; Cameron, S.E.; Parra, J.L.; Jones, P.G.; Jarvis, A. Very high resolution interpolated climate surfaces for global land areas. Int. J. Climatol. 2005, 25, 1965–1978. [Google Scholar] [CrossRef]
  32. Kumar, D.; Rawat, S.; Joshi, R. Predicting the current and future suitable habitat distribution of the medicinal tree Oroxylum indicum (L.) Kurz in India. J. Appl. Res. Med. Aromat. Plants 2021, 23, 100309. [Google Scholar] [CrossRef]
  33. IPCC. Climate Change 2021: The Physical Science Basis. Contribution of Working Group I to the Sixth Assessment Report of the Intergovernmental Panel on Climate Change; Cambridge University Press: Cambridge, UK, 2023.
  34. O’Neill, B.C.; Kriegler, E.; Ebi, K.L.; Kemp-Benedict, E.; Riahi, K.; Rothman, D.; Ruijven, B.; Vuuren, D.; Birkmann, J.; Kok, K.; et al. The roads ahead: Narratives for shared socioeconomic pathways describing world futures in the 21st century. Glob. Environ. Change 2017, 42, 169–180. [Google Scholar] [CrossRef]
  35. Riahi, K.; Vuuren, D.P.; Kriegler, E.; Edmonds, J.; O’Neill, B.; Fujimori, S.; Bauer, N.; Calvin, K.; Dellink, R.; Fricko, O.; et al. The shared socioeconomic pathways and their energy, land use, and greenhouse gas emissions implications: An overview. Glob. Environ. Change 2017, 42, 153–168. [Google Scholar] [CrossRef]
  36. Lan, Y.; Wu, X.; Xu, M.; Li, K.; Huan, Y.; Zhou, G.; Lun, F.; Shang, W.; Zhang, R.; Xie, Y. High-resolution global distribution projections of 10 rodent genera under diverse SSP-RCP scenarios, 2021–2100. Sci. Data 2025, 12, 1467. [Google Scholar] [CrossRef] [PubMed]
  37. Carscadden, K.A.; Emery, N.C.; Arnillas, C.A.; Cadotte, M.W.; Afkhami, M.E.; Gravel, D.; Livingstone, S.W.; Wiens, J.J. Niche breadth: Causes and consequences for ecology, evolution, and conservation. Q. Rev. Biol. 2020, 95, 179–214. [Google Scholar] [CrossRef]
  38. Rönnfeldt, A.; Holle, V.; Schifferle, K.; Gallien, L.; Knight, T.; Weigelt, P.; Craven, D.; Cabral, J.S.; Zurell, D. Climatic niche conservatism in non-native plants depends on introduction history and biogeographic context. Nat. Commun. 2025, 17, 416. [Google Scholar] [CrossRef] [PubMed]
  39. Lu, W.X.; Wang, Z.Z.; Hu, X.Y.; Rao, G. Incorporating eco-evolutionary information into species distribution models provides comprehensive predictions of species range shifts under climate change. Sci. Total Environ. 2024, 912, 169501. [Google Scholar] [CrossRef] [PubMed]
  40. Elith, J.; Graham, C.H.; Anderson, R.P.; Dudik, M.; Ferrier, S.; Guisan, A.; Hijmans, R.; Huettmann, F.; Leathwick, J.; Lehmann, A.; et al. Novel methods improve prediction of species’ distributions from occurrence data. Ecography 2006, 29, 129–151. [Google Scholar] [CrossRef]
  41. Yost, A.C.; Petersen, S.L.; Gregg, M.; Miller, R. Predictive modeling and mapping sage grouse (Centrocercus urophasianus) nesting habitat using maximum entropy and a long-term dataset from southern Oregon. Ecol. Inform. 2008, 3, 375–386. [Google Scholar] [CrossRef]
  42. Elith, J.; Phillips, S.J.; Hastie, T.; Dudík, M.; Chee, Y.E.; Yates, C.J. A statistical explanation of MaxEnt for ecologists. Divers. Distrib. 2011, 17, 43–57. [Google Scholar] [CrossRef]
  43. Fielding, A.H.; Bell, J.F. A review of methods for the assessment of prediction errors in conservation presence/absence models. Environ. Conserv. 1997, 24, 38–49. [Google Scholar] [CrossRef]
  44. Swets, J. Measuring the accuracy of diagnostic systems. Science 1988, 240, 1285–1293. [Google Scholar] [CrossRef] [PubMed]
  45. Huang, J.; Li, G.; Li, J.; Zhang, X.; Yan, M.; Du, S. Projecting the range shifts in climatically suitable habitat for Chinese sea buckthorn under climate change scenarios. Forests 2017, 9, 9. [Google Scholar] [CrossRef]
  46. Peng, C.; Hua, W.; Liu, J. Unraveling the signaling pathways of plant cold stress: Current insights and future directions. Front. Plant Sci. 2025, 16, 1666852. [Google Scholar] [CrossRef] [PubMed]
  47. Bocsi, T.; Allen, J.M.; Bellemare, J.; Kartesz, J.; Nishino, M.; Bradley, B. Plants’ native distributions do not reflect climatic tolerance. Divers. Distrib. 2016, 22, 615–624. [Google Scholar] [CrossRef]
  48. Soberon, J.; Peterson, A.T. Interpretation of models of fundamental ecological niches and species’ distributional areas. Biodivers. Inform. 2005, 2, 1–10. [Google Scholar] [CrossRef]
  49. Soberón, J.; Nakamura, M. Niches and distributional areas: Concepts, methods, and assumptions. Proc. Natl. Acad. Sci. USA 2009, 106, 19644–19650. [Google Scholar] [CrossRef] [PubMed]
  50. Zhao, Q. Effect of Elevated Temperature and Drought Stress on the Growth and Fruit Quality of Lycium barbarum. Master’s Thesis, Ningxia University, Yinchuan, China, 2015. [Google Scholar] [CrossRef]
  51. Yongning, Z.; Lei, Z.; Guofei, M.; Rui, X.; Fanghong, L.; Xiaofeng, D. Frost index of Lycium barbarum during flowering period based on harmful accumulated temperature. Trans. Chin. Soc. Agric. Eng. 2020, 36, 188–193. [Google Scholar] [CrossRef]
  52. Chen, I.C.; Hill, J.K.; Ohlemüller, R.; Roy, D.B.; Thomas, C.D. Rapid range shifts of species associated with high levels of climate warming. Science 2011, 333, 1024–1026. [Google Scholar] [CrossRef] [PubMed]
  53. Lenoir, J.; Gégout, J.C.; Marquet, P.A.; Ruffray, P.D.; Brisse, H. A significant upward shift in plant species optimum elevation during the 20th century. Science 2008, 320, 1768–1771. [Google Scholar] [CrossRef] [PubMed]
  54. Colwell, R.K.; Brehm, G.; Cardelús, C.L.; Gilman, A.C.; Longino, J.T. Global warming, elevational range shifts, and lowland biotic attrition in the wet tropics. Science 2008, 322, 258–261. [Google Scholar] [CrossRef] [PubMed]
  55. Chen, Y.H.; Lenoir, J.; Chen, I.-C. Limited evidence for range shift–driven extinction in mountain biota. Science 2025, 388, 741–747. [Google Scholar] [CrossRef] [PubMed]
  56. Cheng, Y.; Zhang, W.; Liu, Y.; Cao, M.C.; Song, C.Y.; Li, G.Q. Quantitative decomposition of uncertainty in biodiversity simulation under climate change. J. Soil Water Conserv. 2025, 39, 235–242+253. [Google Scholar] [CrossRef]
  57. Kook, A.; Park, S.U.; Kong, W.S.; Hong, S.; Jang, I.; Seo, C. Potential climate change effects on tree distributions in the Korean Peninsula: Understanding model and climate uncertainties. Ecol. Model. 2017, 353, 17–27. [Google Scholar] [CrossRef]
  58. Li, G.; Liu, C.; Liu, Y.; Yang, J.; Zhang, X.S.; Guo, K. Advances in theoretical issues of species distribution models. Acta Ecol. Sin. 2013, 33, 4827–4835. [Google Scholar] [CrossRef]
  59. Levin, S.A. The Problem of Pattern and Scale in Ecology. In Ecological Time Series; Powell, T.M., Steele, J.H., Eds.; Springer: Boston, MA, USA, 1992. [Google Scholar] [CrossRef]
Figure 1. The global spatial distribution of Chinese wolfberry (Lycium chinense Miller) records.
Sustainability 18 07802 g001
Figure 2. The underestimation ratio of climate tolerance for the 13 climate variables of Chinese wolfberry (Lycium chinense) in China relative to the global scale.
Sustainability 18 07802 g002
Figure 3. Global model and native model of the China fitting evaluation (a), optimal threshold (b), and the global model’s variable contribution (c). The abbreviations are clarified in Table 1. In (a,b), the central line indicates the median, and the whiskers define the normal data boundaries.
Sustainability 18 07802 g003
Figure 4. The distribution pattern of suitable habitats for Chinese wolfberry (Lycium chinense) under different climate scenarios.
Sustainability 18 07802 g004
Figure 5. The area changes in the suitable habitat of Chinese wolfberry (Lycium chinense) under different climate changes.
Sustainability 18 07802 g005
Figure 6. The habitat suitability changes of Chinese wolfberry (Lycium chinense) under different climate change scenarios.
Sustainability 18 07802 g006
Figure 7. The centroid shift of Chinese wolfberry (Lycium chinense) under different climate change scenarios. In (b), the central line indicates the median, and the whiskers define the normal data boundaries.
Sustainability 18 07802 g007
Table 1. Description of 13 climatic factors and their corresponding calculated formulae and references.
VariableAbbreviationUnitFormula and Reference
Annual mean temperatureAMT°C-
Mean temperature of the warmest monthMTWM°C-
Mean temperature of the coldest monthMTCM°C-
Annual range of temperatureART°CMax temperature of warmest month—Min temperature of coldest month
Annual precipitationAPmm-
Precipitation of wettest monthPWMmm-
Precipitation of driest monthPDMmm-
Precipitation of seasonalityPSD-Monthly coefficient of variation
Annual biotemperatureABT°CABT = (∑T)/12 (T is 0 < T < 30 °C mean month temperature) [27]
Warmth indexWI°CWI = ∑(T − 5) (T is >5 °C mean month temperature) [28]
Coldness indexCI°CCI = ∑(T − 5) (T is <5 °C mean month temperature) [29]
Potential evapotranspiration ratePER-PER = 58.93 × ABT/AP (ABT is annual biotemperature, AP is annual precipitation) [27]
Humidity indexHImm/°CHI = AP/WI (AP is annual precipitation, WI is the warmth index) [30]
Disclaimer/Publisher’s Note: The statements, opinions and data contained in all publications are solely those of the individual author(s) and contributor(s) and not of MDPI and/or the editor(s). MDPI and/or the editor(s) disclaim responsibility for any injury to people or property resulting from any ideas, methods, instructions or products referred to in the content.