Article

Predicting the Potential Distribution of Camellia osmantha in Response to Climate Change Using the MaxEnt Model

1
College of Forestry, Henan Agricultural University, Zhengzhou 450046, China
2
Henan Yuanzhi Forestry Planning and Design Co., Ltd., Zhengzhou 450003, China
3
College of Environment and Resources Sciences (College of Carbon Neutrality), Zhejiang Agriculture and Forestry University, Hangzhou 311300, China
4
College of Forestry, Beijing Forestry University, Beijing 100083, China
5
Guangxi Oil-Tea Superior Species Cultivation Research Center of Engineering Technology, Guangxi Forestry Research Institute, Nanning 530002, China
6
Guangxi Key Laboratory of Special Non-Wood Forestry Cultivation and Utilization, Guangxi Forestry Research Institute, Nanning 530002, China
7
Department of Smart Agriculture and Engineering, Wenzhou Vocational College of Science and Technology, Wenzhou 325006, China
*
Authors to whom correspondence should be addressed.
Sustainability 2026, 18(15), 7721; https://doi.org/10.3390/su18157721
Submission received: 15 June 2026 / Revised: 23 July 2026 / Accepted: 24 July 2026 / Published: 30 July 2026

Abstract

Camellia osmantha is an economically valuable woody oil plant with increasing cultivation in southern China, yet its potential distribution under climate change remains poorly understood. Here, we used an optimized MaxEnt model with 27 occurrence points and 11 environmental variables (retained from 27 candidate predictors via correlation filtering and MaxEnt-based contribution and permutation importance) to predict its potential distribution in Guangxi under current and future climate scenarios (2050s, 2090s; SSP126, SSP370, SSP585). The model demonstrated acceptable predictive performance (training AUC = 0.7784, test AUC = 0.6935) with the test AUC falling within the acceptable/fair range (0.6–0.7) according to standard evaluation criteria. The dominant drivers were available water capacity (24.3%), altitude (24.1%), and temperature annual range (21.9%), with suitability declining when AWC exceeded 3.0, altitude exceeded 543 m, or bio7 fell below 23.06 °C. Current suitable habitats cover 18.53 × 10⁴ km2 (89.7% of Guangxi), with high suitability areas concentrated in the northeast and southwest. Under future scenarios, total suitable area remained stable (−1.2% to +3.2%), while high suitability areas expanded under SSP370/SSP585 (+39.0%/+41.1%) and contracted under SSP126 (−30.3%) by 2090s; centroid shifts were limited (2.95–14.93 km), with core habitats remaining in central Guangxi. These findings provide a quantitative basis for conservation and sustainable cultivation strategies for this species under climate change, and highlight the importance of soil water availability alongside topographic and climatic factors in shaping its distribution.

1. Introduction

Camellia osmantha (Theaceae) is an economically valuable woody oil plant native to southern China and northern Vietnam. First identified as a new oil-tea camellia species in Nanning, Guangxi, in 2012 [1], it is distinguished by its aesthetically pleasing tree form, leathery oblong leaves, and white flowers [2] with pale red spots that bloom from autumn to winter (October to December) [2,3]. Compared with common oil-tea camellia, Camellia osmantha produces larger, strongly fragrant flowers [2], earning it the Chinese name “Xianghua Youcha” (Fragrant Oil-Tea Camellia) and highlighting its ornamental value. The species thrives in warm, sunny environments with acidic red soils, preferring elevations below 500 m and mean annual temperatures of 15–20 °C, and exhibits strong stress tolerance, withstanding extreme minimum temperatures above 0 °C [1]. Beyond tea oil production—its seeds are rich in unsaturated fatty acids, making it a high-quality edible oil crop [4]—its wood is suitable for furniture making, and its flowers can be used for essential oil extraction. Ecologically, it contributes to soil and water conservation and air purification. Owing to its rapid growth, early fruiting, and excellent stress resistance, Camellia osmantha has been designated as a nationally promoted oil-tea camellia variety [5]. Its conservation and yield improvement are of strategic importance for the edible oil industry and for sustainable forestry development in southern China.
Since the 20th century, rising greenhouse gas emissions have driven significant increases in global average temperatures [5], triggering a cascade of environmental changes that affect ecosystems, biodiversity, and species distributions [5,6]. Understanding the ecological niche of a species—the combination of environmental conditions under which it can persist—is fundamental for predicting its response to climate change and for guiding sustainable cultivation [7]. As a typical environmentally sensitive species, the geographical distribution of Camellia osmantha is regulated by multiple interacting ecological factors, including climate, topography, and soil properties. Studies indicate that Camellia osmantha predominantly inhabits relatively humid and cool environments in southern China [1]. However, under current warming trends, low-latitude regions such as southern China may face the dual pressures of heat accumulation and increased aridity, potentially threatening the survival of Camellia osmantha [8]. Consequently, its suitable habitat is expected to shift northward along latitudinal gradients and expand vertically to higher elevations [9]. Nevertheless, non-temperature factors, such as water availability and soil development, may impose new constraints on growth in these higher-latitude and higher-altitude regions, making the magnitude and direction of such shifts uncertain. Understanding these potential shifts, particularly the stability of the species’ core suitable areas, is therefore critical for developing long-term conservation and cultivation strategies.
Predicting species’ potential distributions has become a central focus in ecological research, particularly for economically valuable plants facing climate change [8,9]. Species Distribution Models (SDMs) are widely used to project the potential geographical ranges and ecological requirements of species under different climate scenarios [10]. By linking abiotic factors (e.g., climate and topography) with biotic data (species occurrence records), SDMs can identify key environmental drivers and project potential distributions, deepening our understanding of the mechanisms underlying species distributions and their responses to environmental change [11,12]. These models thus provide a scientific foundation for developing effective management and conservation strategies [13]. Among the various SDM algorithms, MaxEnt is one of the most widely adopted, owing to its superior performance in handling data bias, its ability to produce reliable predictions with relatively small sample sizes, and its flexibility in accommodating diverse environmental datasets [14,15]. Compared with other niche models such as GARP and CLIMEX, MaxEnt offers significant advantages in data adaptability: it requires only species presence records and yields robust predictions even when correlations between occurrence points and environmental variables are weak [16]. These characteristics make MaxEnt particularly suitable for modeling species with limited distribution records, and it is now routinely applied in studies predicting species’ potential ranges [17].
In this study, we used Guangxi Zhuang Autonomous Region, the primary cultivation region of Camellia osmantha in China, as a case study to investigate the species’ habitat suitability and ecological niche characteristics under current and future climate scenarios. Integrating field survey data with high-resolution environmental variables, we constructed an optimized MaxEnt model with four specific objectives: (1) to identify the key environmental factors influencing the distribution of Camellia osmantha and quantify their relative contributions; (2) to determine the optimal ranges and limiting thresholds of these factors based on response curves; (3) to characterize changes in suitable habitat area under future climate scenarios (SSP126, SSP370, and SSP585); and (4) to analyze the direction and trajectory of centroid shifts in highly suitable habitats under future conditions compared to the present. The findings are expected to provide a scientific basis for improving Camellia osmantha yield and maximizing its economic benefits, while also offering insights and methodological references for the sustainable management of other woody oil plant species in subtropical regions under global climate change.

2. Data Sources and Methods

2.1. Study Area Overview

Guangxi Zhuang Autonomous Region (20°54′–26°24′ N, 104°26′–112°04′ E) is located in southern China [18]. The region features a stepped terrain descending from northwest to southeast, with widespread karst landforms, a dense river network, and the Xi River system flowing through its central part. Guangxi has a subtropical monsoon climate, with mean annual temperatures of 20–23 °C and annual precipitation of 1200–2000 mm [19]. However, precipitation is seasonally uneven, with hot, humid, and rainy summers contrasting with mild, dry winters. These geographical and climatic conditions support diverse subtropical agriculture and forestry, making Guangxi an ideal region for cultivating Camellia osmantha and for conducting habitat suitability modeling.

2.2. Source and Processing of Camellia osmantha Distribution Data

The plot distribution data for Camellia osmantha in Guangxi were obtained through manual field collection. Investigators employed systematic sampling at regular intervals within the species’ distribution range in Guangxi, collecting a total of 27 occurrence points. Based on the buffer tool functionality in the ArcGIS 10.8 platform, this study applied a 5 km buffer distance to filter these records—a threshold exceeding the 1-km resolution of the environmental data to ensure spatial independence [20]. All 27 collected points satisfied this buffer criterion and were retained for MaxEnt modeling, effectively mitigating spatial autocorrelation and model overfitting. The verified set of distribution points ensured the representativeness of the samples within the study area. The data were saved in .csv format as required by the MaxEnt model for later use [17].

2.3. Environmental Data Acquisition and Preprocess

This study initially compiled 27 environmental variables, comprising 19 climatic variables, 3 topographic variables, and 5 soil variables (Table 1). Climate data for three periods were selected: the baseline period (1970–2000), mid-century (2041–2060), and late-century (2081–2100). Climatic variables were downloaded from the global climate database WorldClim 2.1 (https://www.worldclim.org/) at a resolution of 30 arc-seconds (≈1 km) [21]. For future projections, climate data under three Shared Socioeconomic Pathways (SSP) from the BCC-CSM1-1 model were used [22]: SSP126 (low greenhouse gas emissions concentration), SSP370 (medium greenhouse gas emissions concentration), and SSP585 (high greenhouse gas emissions concentration). Topographic data were derived from a 30 m resolution Digital Elevation Model (DEM) provided by the Geo-spatial Data Cloud platform (http://www.gscloud.cn/) [23]. Derived topographic parameters such as slope and aspect were extracted through spatial analysis. Soil property data were obtained from the Harmonized World Soil Database (https://www.fao.org/) [24], with attributes for the topsoil (0–30 cm) and subsoil (30–100 cm) layers identified by the prefixes “t_” and “s_”, respectively. All environmental variables were processed through uniform projection and resampling to construct a complete spatial dataset for model analysis.
To reduce interference from auto-correlation among environmental factors and avoid over fitting caused by high correlation between variables [25], we conducted a systematic two-step variable screening procedure prior to final model construction:
Step1: Preliminary screening based on percent contribution. All 27 variables were first imported into MaxEnt with default settings to obtain initial percent contribution values. Variables with initial contribution < 1% were excluded due to their negligible explanatory power for the distribution of Camellia osmantha.
Step2: Correlation-based screening using permutation importance. For the remaining variables, a Pearson correlation matrix was calculated. Among variable pairs with |r| > 0.8, the variable with the lower permutation importance was excluded, following the principle of retaining the more ecologically influential predictor.

2.4. MaxEnt Model Construction and Parameter Optimization

The MaxEnt model, based on the principle of maximum entropy, is a widely used species distribution prediction model. Its core advantage lies in its ability to estimate niche parameters without requiring species absence data. This model can not only analyze the potential distribution pattern of a species under current environmental conditions but also predict the dynamic changes in the species’ suitable habitat within the study area under future climate scenarios. For optimizing the MaxEnt model, we used the ENMeval R package [26]. We tested regularization multipliers (RM) from 0.5 to 6.0 (increments of 0.5) and all feature class (FC) combinations. The optimal parameter combination was selected based on the lowest AICc (delta.AICc = 0). Model settings included: 10,000 background points; background extent defined as the Guangxi administrative boundary; no bias file used, as the 5 km spatial thinning adequately minimized spatial clustering [27]; clamping enabled; extrapolation disabled. The final optimized model was run with 10 bootstrap replicates, a 75%/25% training-test split using random partitioning (spatial blocking was not feasible given n = 27) [28], logistic output format, and 5000 maximum iterations [29].

2.5. MaxEnt Model Evaluation and Analysis

Model accuracy was assessed using the Area Under the Curve (AUC) value from Receiver Operating Characteristic (ROC) curve analysis [30]. The AUC value ranges from 0 to 1; generally, a higher AUC value indicates better predictive performance of the MaxEnt model. The model evaluation criteria are as follows: Fail (AUC 0–0.6), Poor (AUC 0.6–0.7), Fair (AUC 0.7–0.8), Good (AUC 0.8–0.9), and Excellent (AUC 0.9–1.0) [31].

2.6. Suitability Classification of Camellia osmantha

This study utilized the spatial analysis tools (Spatial Analyst Tools) in ArcGIS 10.8 to classify the suitability levels of Camellia osmantha habitats generated by the MaxEnt model. The specific workflow was as follows: First, the model’s output in Logistic format was imported into ArcGIS 10.8. Subsequently, the suitability values predicted by MaxEnt were reclassified using the Natural Breaks (Jenks) method, which identifies optimal class boundaries by minimizing within-class variance and maximizing between-class variance [32,33]. This data-driven approach ensures that the classification reflects the natural distribution of suitability values rather than relying on arbitrary thresholds. The resulting suitability map was divided into four categories: non-suitable, low suitability, moderate suitability, and high suitability.

2.7. Centroid Migration Trajectory of Camellia osmantha

This study extracted the spatial centroid coordinates of high suitability areas (suitability probability > 0.8) for both the current period and future scenarios (2050s, 2090s). Using the Mean Center tool in ArcGIS 10.8, the dynamic changes in centroid positions under three emission scenarios (SSP126, SSP370, and SSP585) were compared to analyze the trends in high suitability areas for Camellia osmantha. In brief, the suitability areas of Camellia osmantha were condensed into vector points. By observing the positional changes of these centroids across different periods, the spatial migration trajectory of the species’ suitable habitats over time was delineated [34].

3. Results and Analysis

3.1. Environmental Variable Screening Results

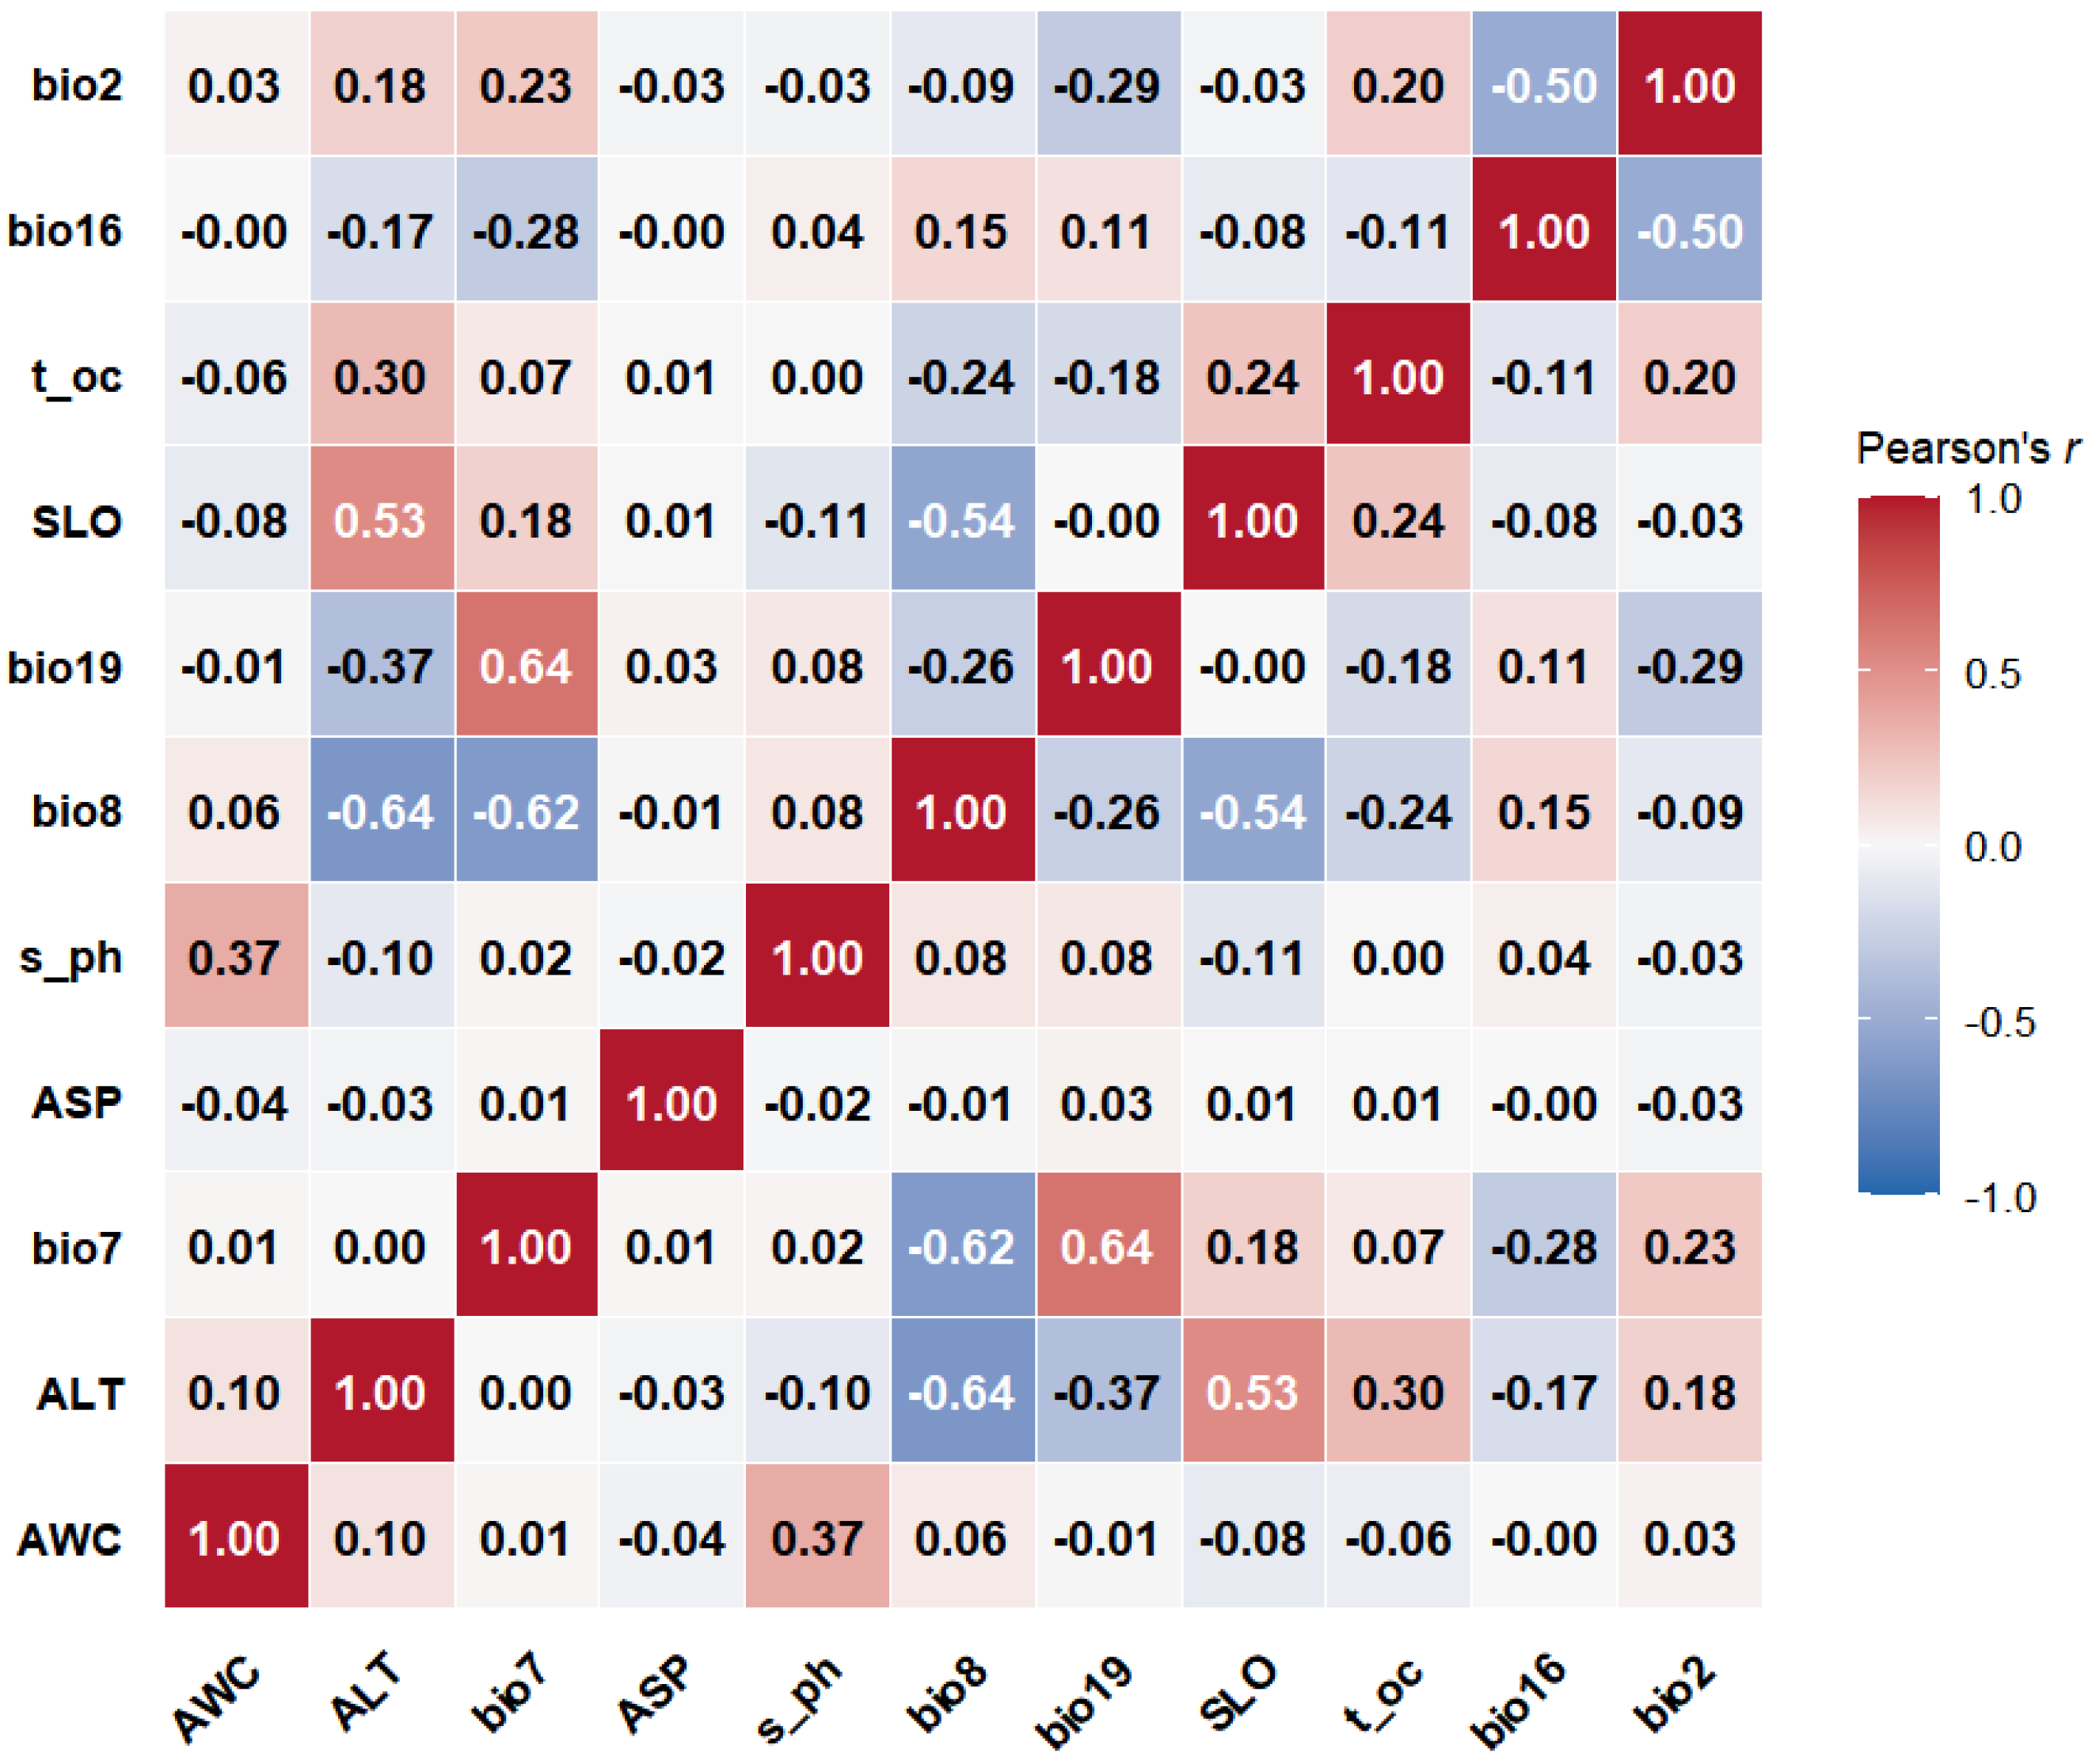
Based on the initial MaxEnt model runs with all 27 environmental variables and the Pearson correlation coefficients among all 27 variables (Figure S1), the initial 27 environmental variables were reduced to a final set of 11 predictors for the optimized MaxEnt model (Table 2) by the two-step screening procedure.
Three variables with initial percent contribution < 1% were excluded: t_ph, s_oc, bio3, bio14, bio10, bio13, bio18, bio12, bio1, bio11, and bio6. For the remaining variables, a Pearson correlation matrix was calculated. Then, among variable pairs with |r| > 0.8, the variable with the lower permutation importance was excluded. This resulted in the removal of five variables: bio5 (with ALT), bio4 (with bio7), bio9 (with bio8), bio15 (with bio19), and bio17 (with bio19). Hence, the 11 retained variables were: altitude (ALT), Temperature Annual Range (bio7), aspect (ASP), Available Water Capacity (AWC), slope (SLO), Precip of Coldest Quarter (bio19),Mean Temp of Wettest Quarter (bio8), Mean Diurnal Range (bio2), Topsoil Organic Carbon (t_oc), Precip of Wettest Quarter (bio16), and Subsoil pH (s_ph). (Table 2) and all retained variables satisfied the collinearity threshold of |r| ≤ 0.8 (Figure 1).

3.2. Model Accuracy Evaluation

Following parameter optimization via ENMeval, the optimal parameter combination selected was RM = 3.5 and FC = LQHPT (delta.AICc = 0). The complete parameter testing results are provided in Table S1 (Supplementary Materials).
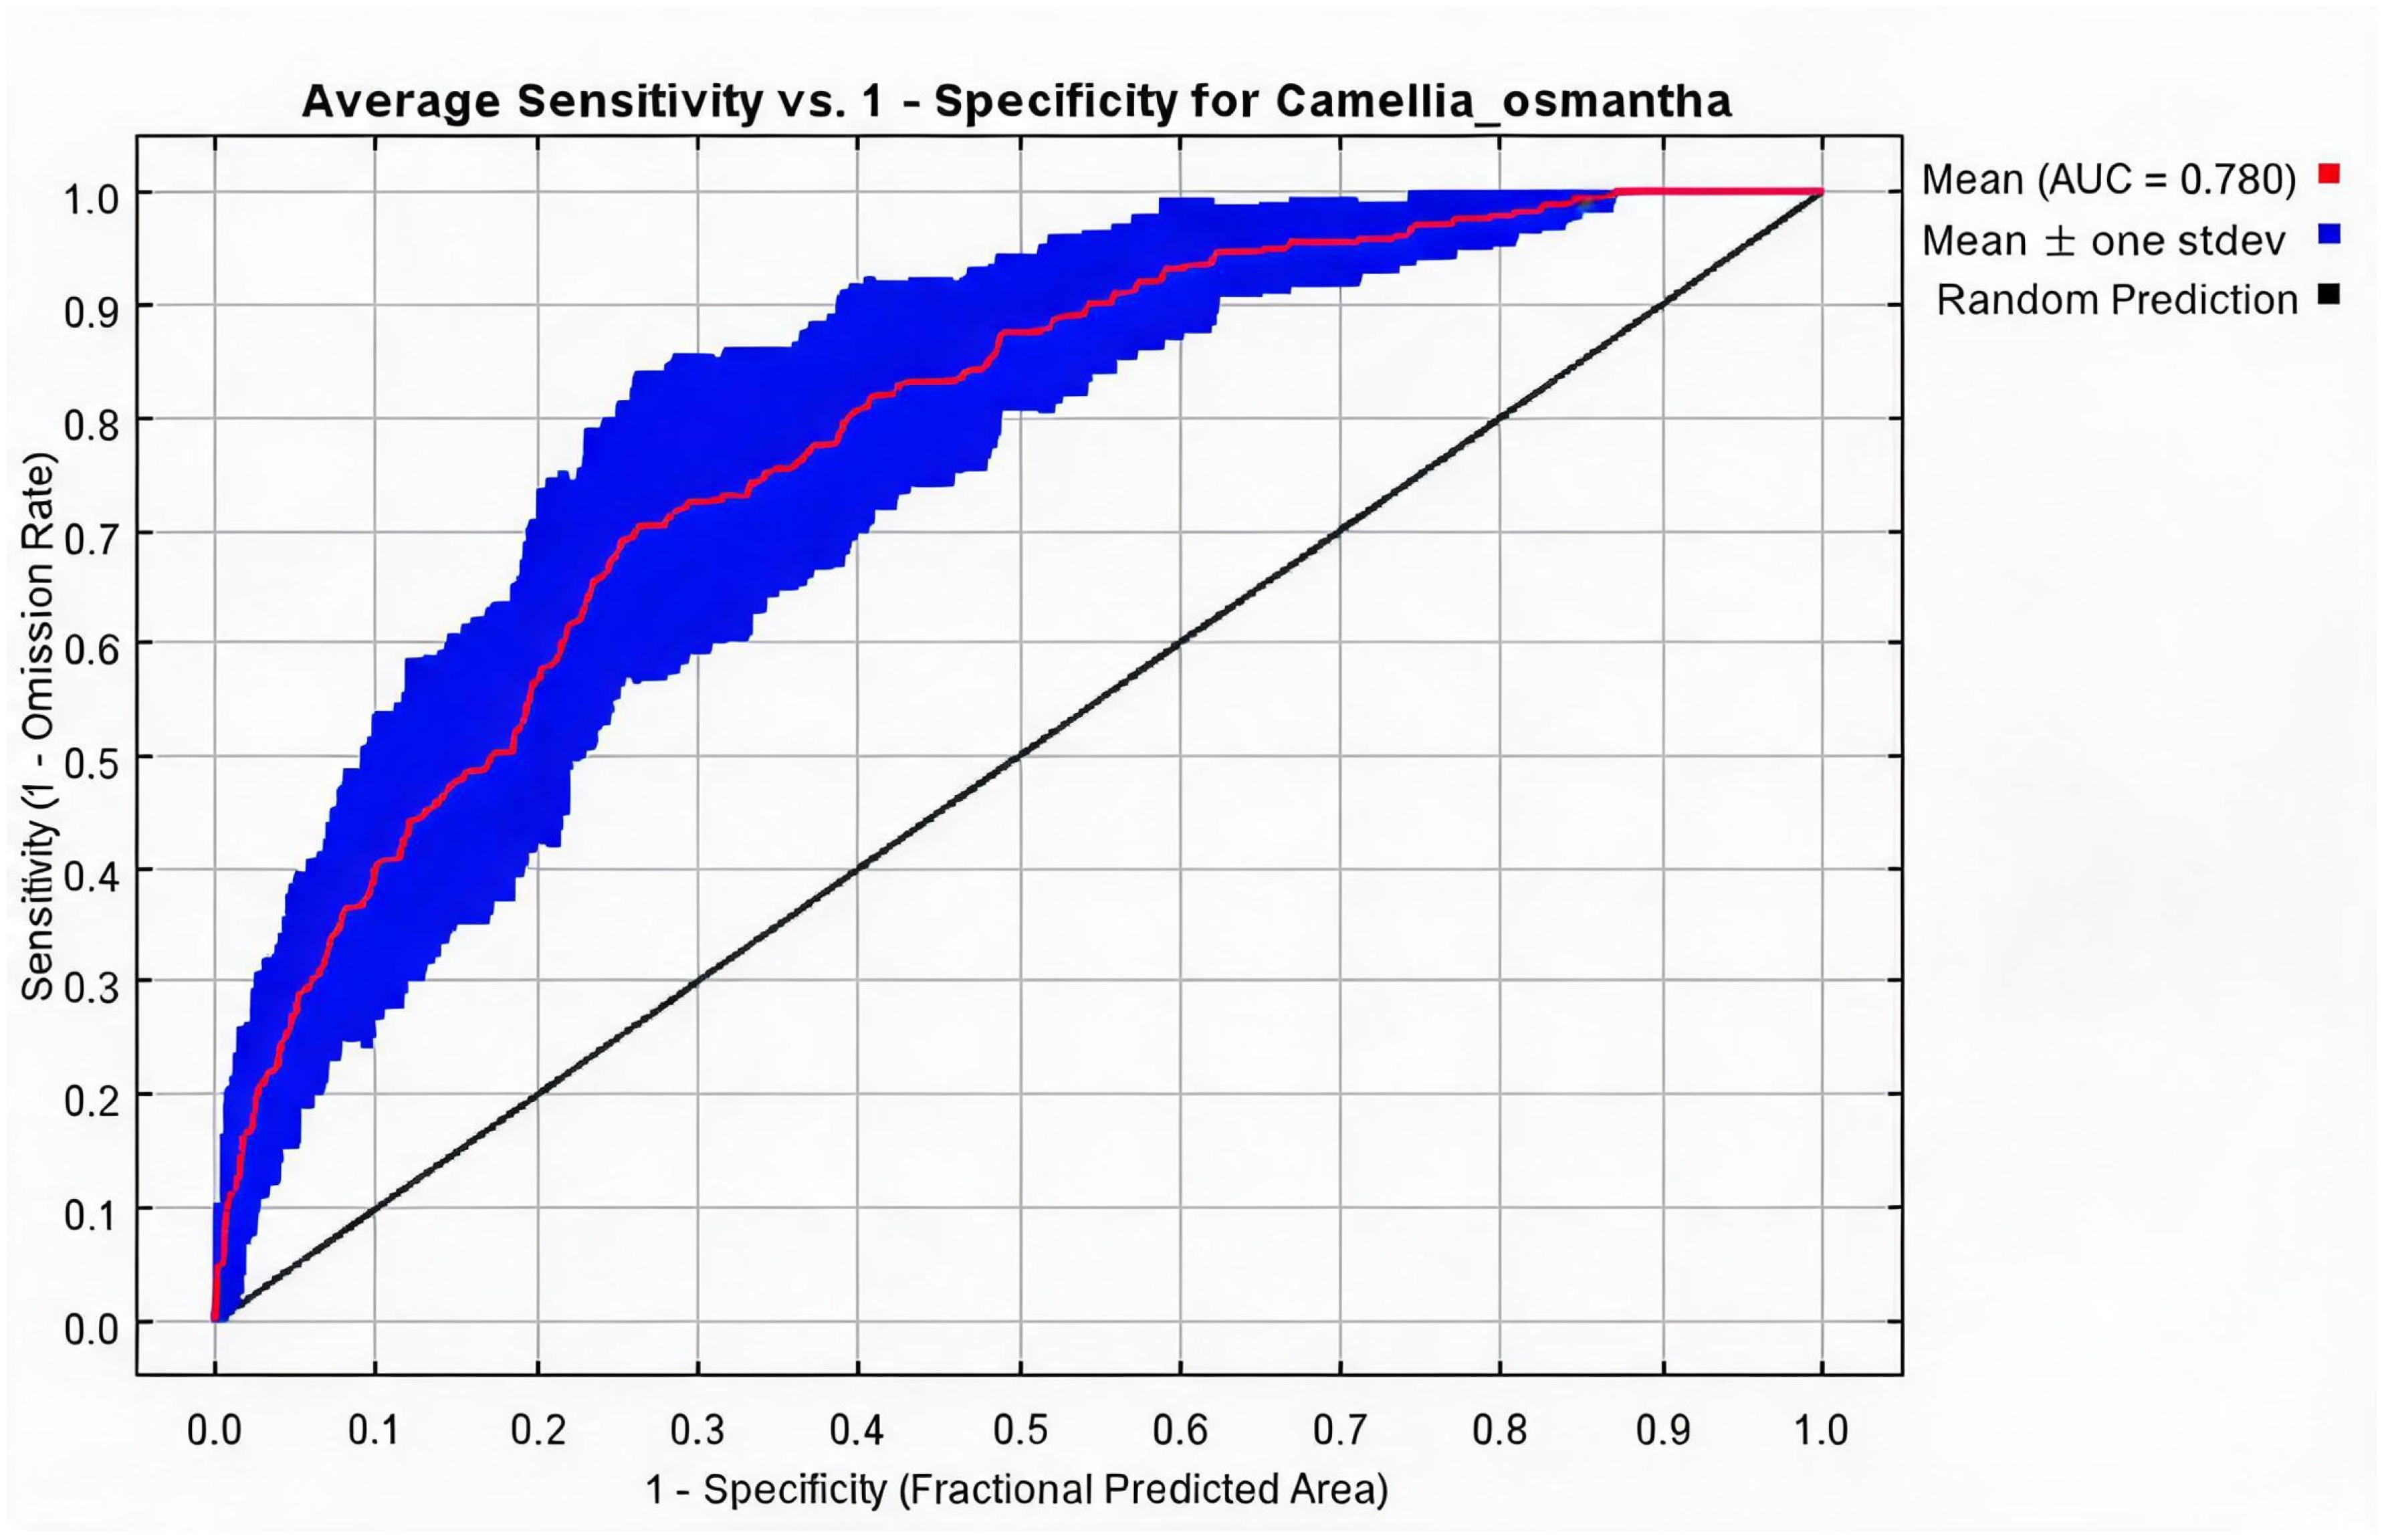
The optimized model achieved a mean training AUC of 0.7784 and a mean test AUC of 0.6935 across 10 bootstrap replicates, falling within the “fair” to “good” range for training AUC (0.7–0.8) and the “acceptable” range for test AUC (0.6–0.7) and indicating satisfactory predictive ability (Figure 2). By comparison, the unoptimized default model (RM = 1.0, FC = LQHPT) produced a training AUC of 0.9131 but with a substantially larger training-test AUC gap (0.1720 vs. 0.0849 for the optimized model) and highly variable contribution patterns across replicates, symptoms characteristic of severe overfitting. The optimized model exhibited a reduced training-test gap and more consistent variable selection, confirming that regularization effectively penalized overly complex response surfaces (Table 3).
Among the 11 retained variables, available water capacity (AWC) showed the highest contribution (24.3%), followed by altitude (ALT) (24.1%) and temperature annual range (bio7) (21.9%) (Table 4). The cumulative contribution of these top three variables reached 70.3%, indicating that soil water availability, topographic elevation, and temperature seasonality were the primary drivers shaping the species’ distribution. ALT and bio7 also exhibited the highest permutation importance (24.1% and 26.7%, respectively), confirming their decisive roles. In contrast, bio2 and bio16 showed negligible contributions (<1%) in the optimized model, suggesting their limited influence on habitat suitability within the study area after accounting for the dominant predictors.

3.3. Threshold Analysis of Key Environmental Variables

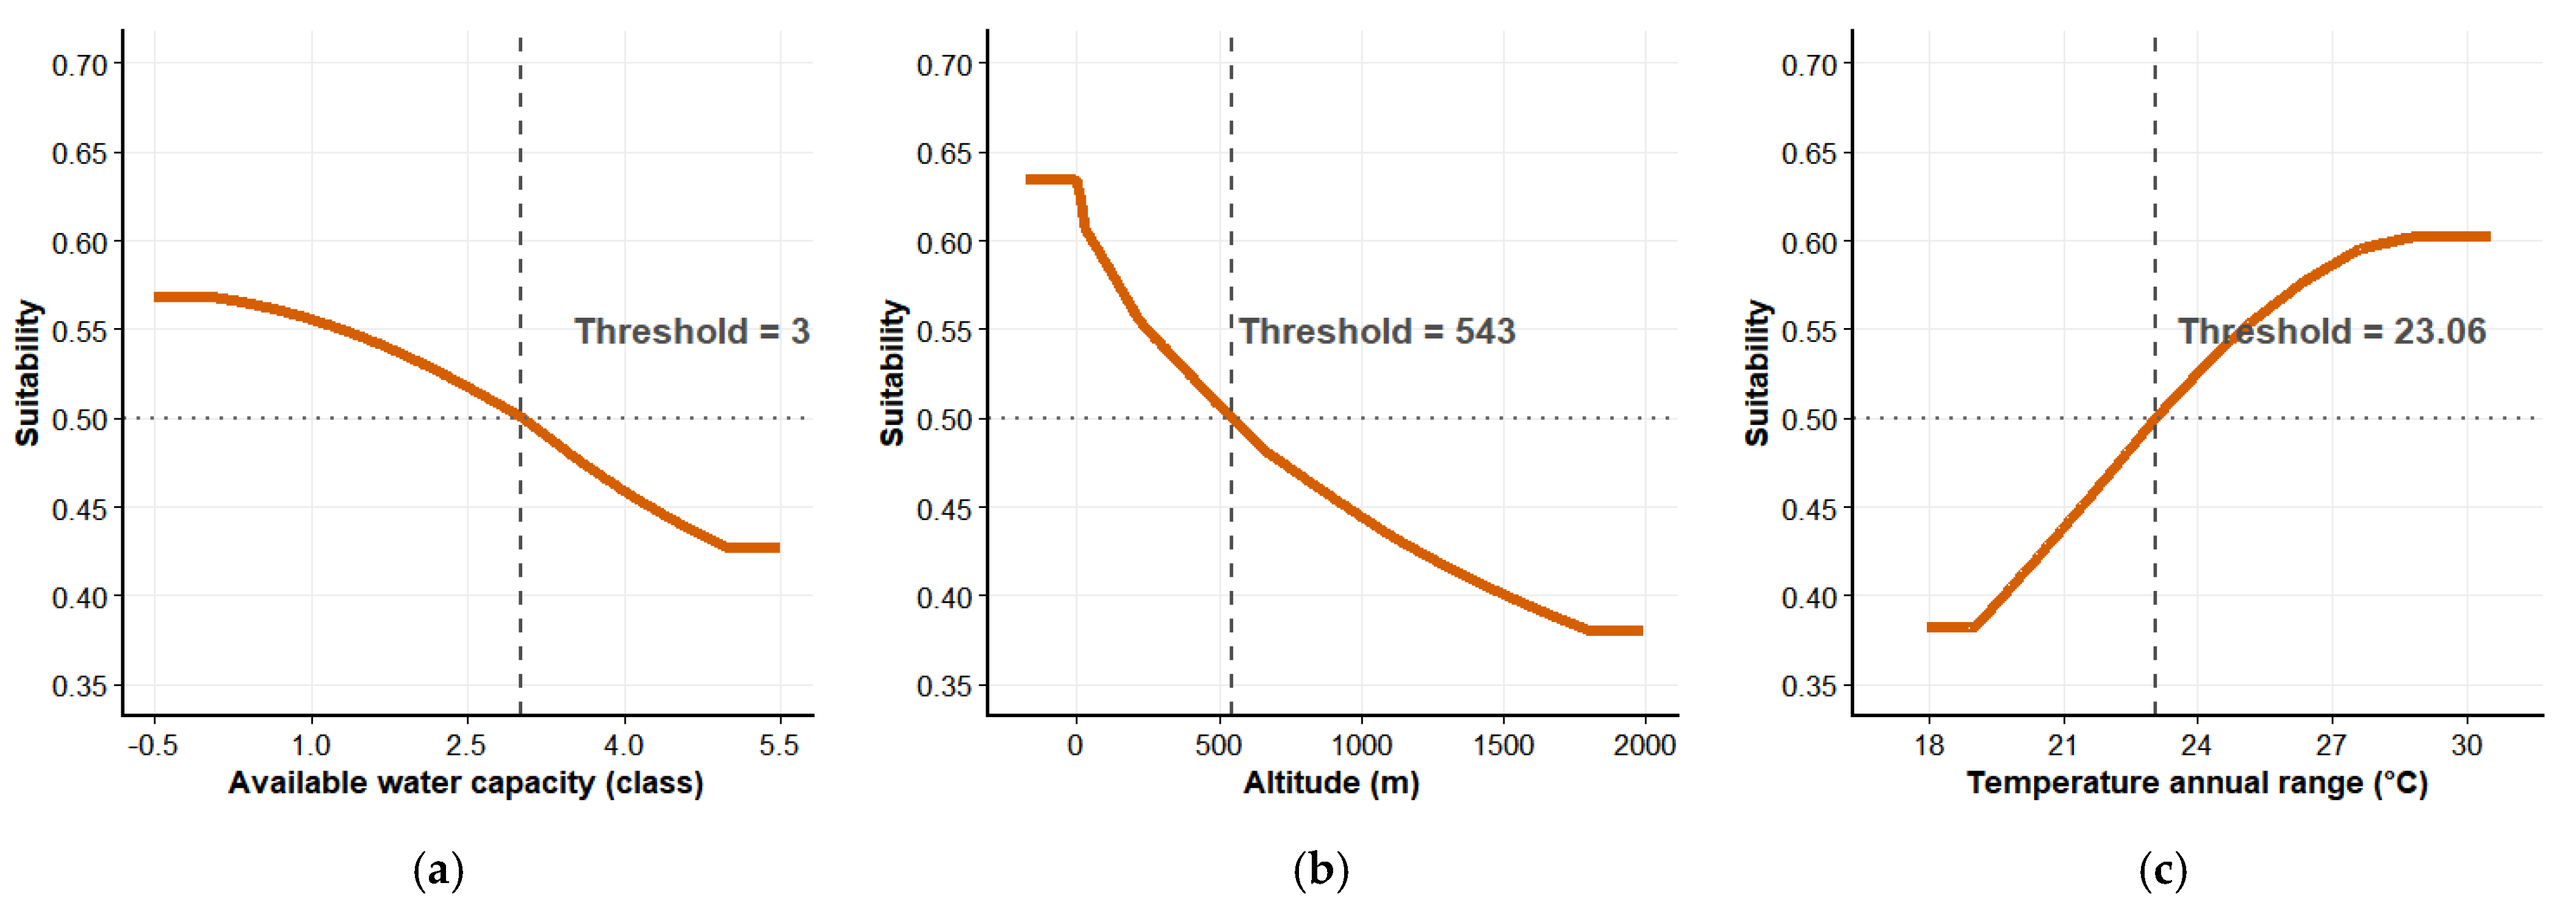
The optimal ranges and limiting thresholds for the top three environmental variables (AWC, ALT, and bio7) are summarized in Table 5 and visualized in Figure 3. Among these, Available water capacity (AWC) exhibited an optimal range of −0.5 to 3.0, with suitability declining above 3.0 (Figure 3a). Altitude (ALT) showed an optimal range of 0–543 m, with suitability falling below 0.5 above 543 m (Figure 3b). Temperature annual range (bio7) displayed a monotonic increasing response, with suitability exceeding 0.5 above 23.06 °C and falling below 0.5 below this threshold(Figure 3c). These threshold values indicate that habitat suitability is primarily constrained by soil water capacity, elevation, and temperature seasonality within the studied range and provide quantitative criteria for identifying potential cultivation areas and for assessing the species’ vulnerability under future climate change.

3.4. Potential Suitable Habitat Distribution Characteristics of Camellia osmantha Under Contemporary Climatic Conditions

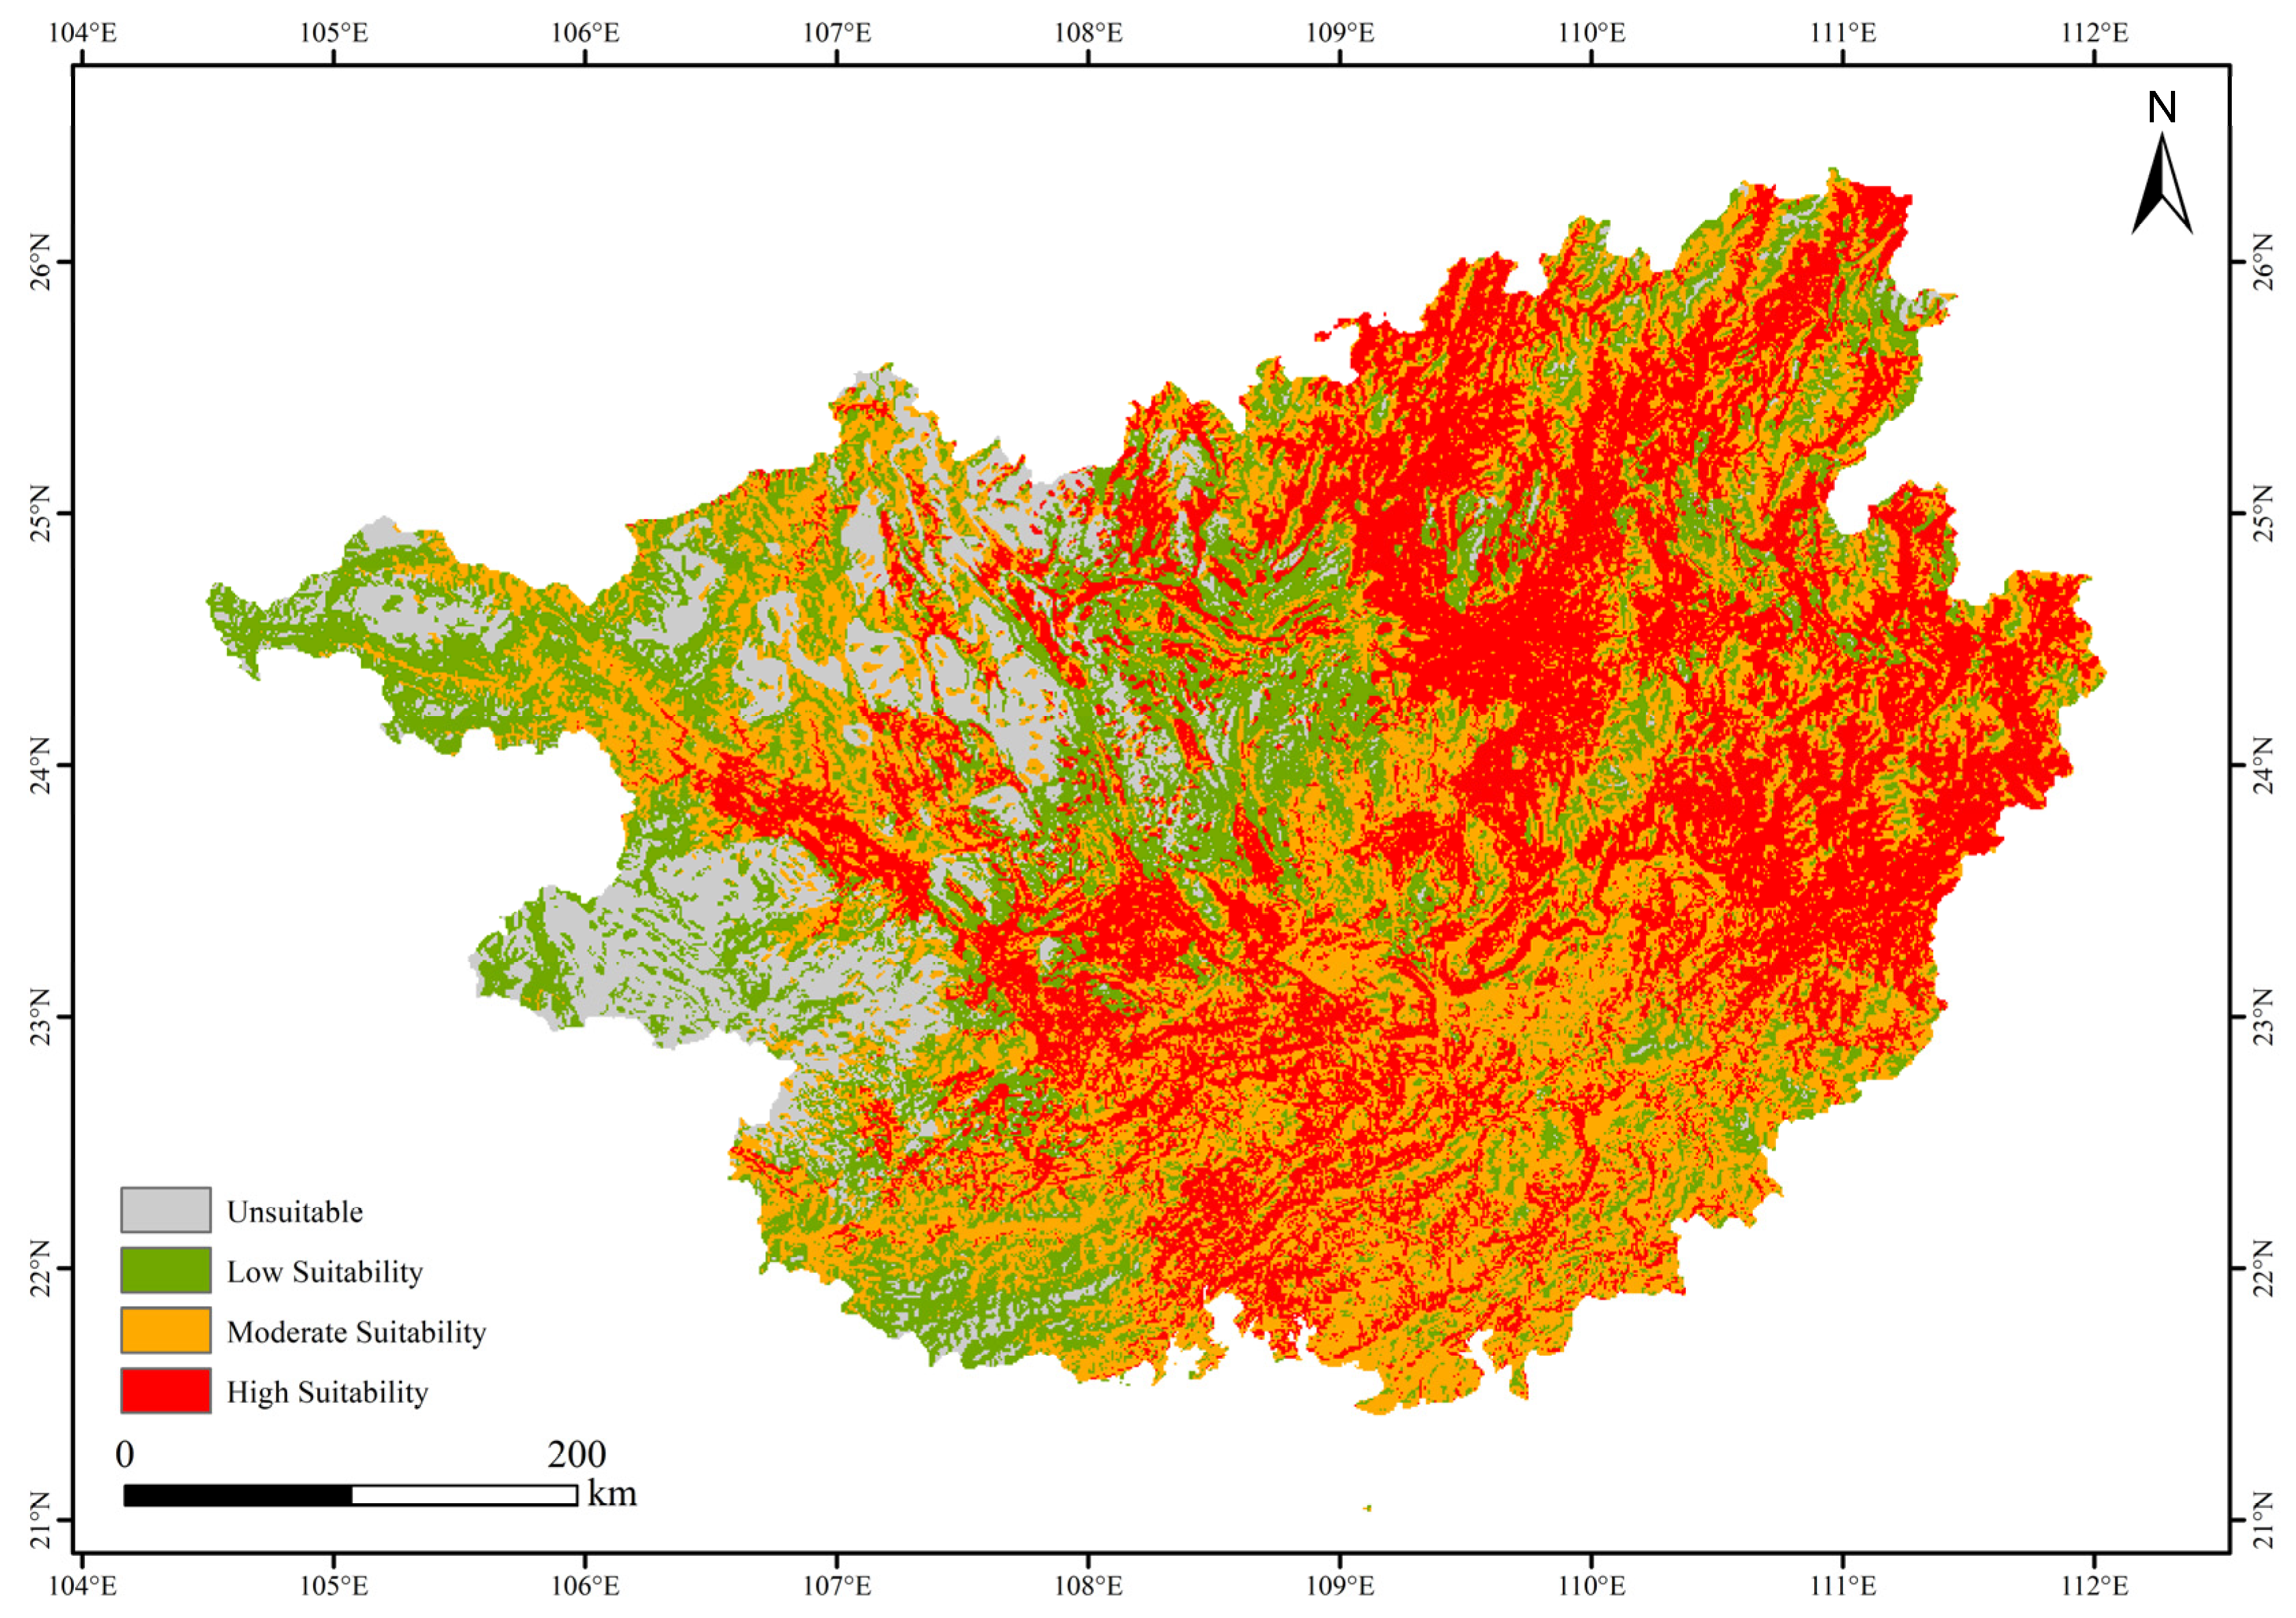
The potential distribution patterns of Camellia osmantha under current climatic conditions, predicted by the optimized MaxEnt model, are shown in Figure 4. Based on the classification thresholds (non-suitable: 0–0.4, low suitability: 0.4–0.6, moderate suitability: 0.6–0.75, high suitability: 0.75–1.0), the area of each suitability class was calculated using ArcGIS 10.8.
Under current climatic conditions, the total suitable habitat area (including low, moderate, and high suitability) is 18.53 × 10⁴ km2. The high suitability areas account for 6.69 × 10⁴ km2, representing 32.4% of the total study area; the moderate suitability areas cover 7.05 × 10⁴ km2 (34.1%); and the low suitability areas comprise 4.79 × 10⁴ km2 (23.2%). The non-suitable areas occupy 2.13 × 10⁴ km2, accounting for 10.3% of the total study area (Table 6).
The distribution of suitable habitats exhibits notable spatial heterogeneity (Figure 4). Spatially, high suitability areas are predominantly distributed in the northeastern and southwestern parts of Guangxi, while moderate suitability areas cover approximately two-thirds of the region, extending across the northern, central, eastern, and southern areas. low suitability areas are scattered throughout Guangxi, and non-suitable areas are mainly concentrated in the western part of the study region (Figure 4). This distribution pattern indicates that Camellia osmantha exhibits a broad potential distribution across Guangxi, with high-quality habitats concentrated in specific sub-regions, reflecting the species’ preference for particular environmental conditions.

3.5. The Evolution Characteristics of Potential Suitable Habitats for Camellia osmantha in Response to Climate Change

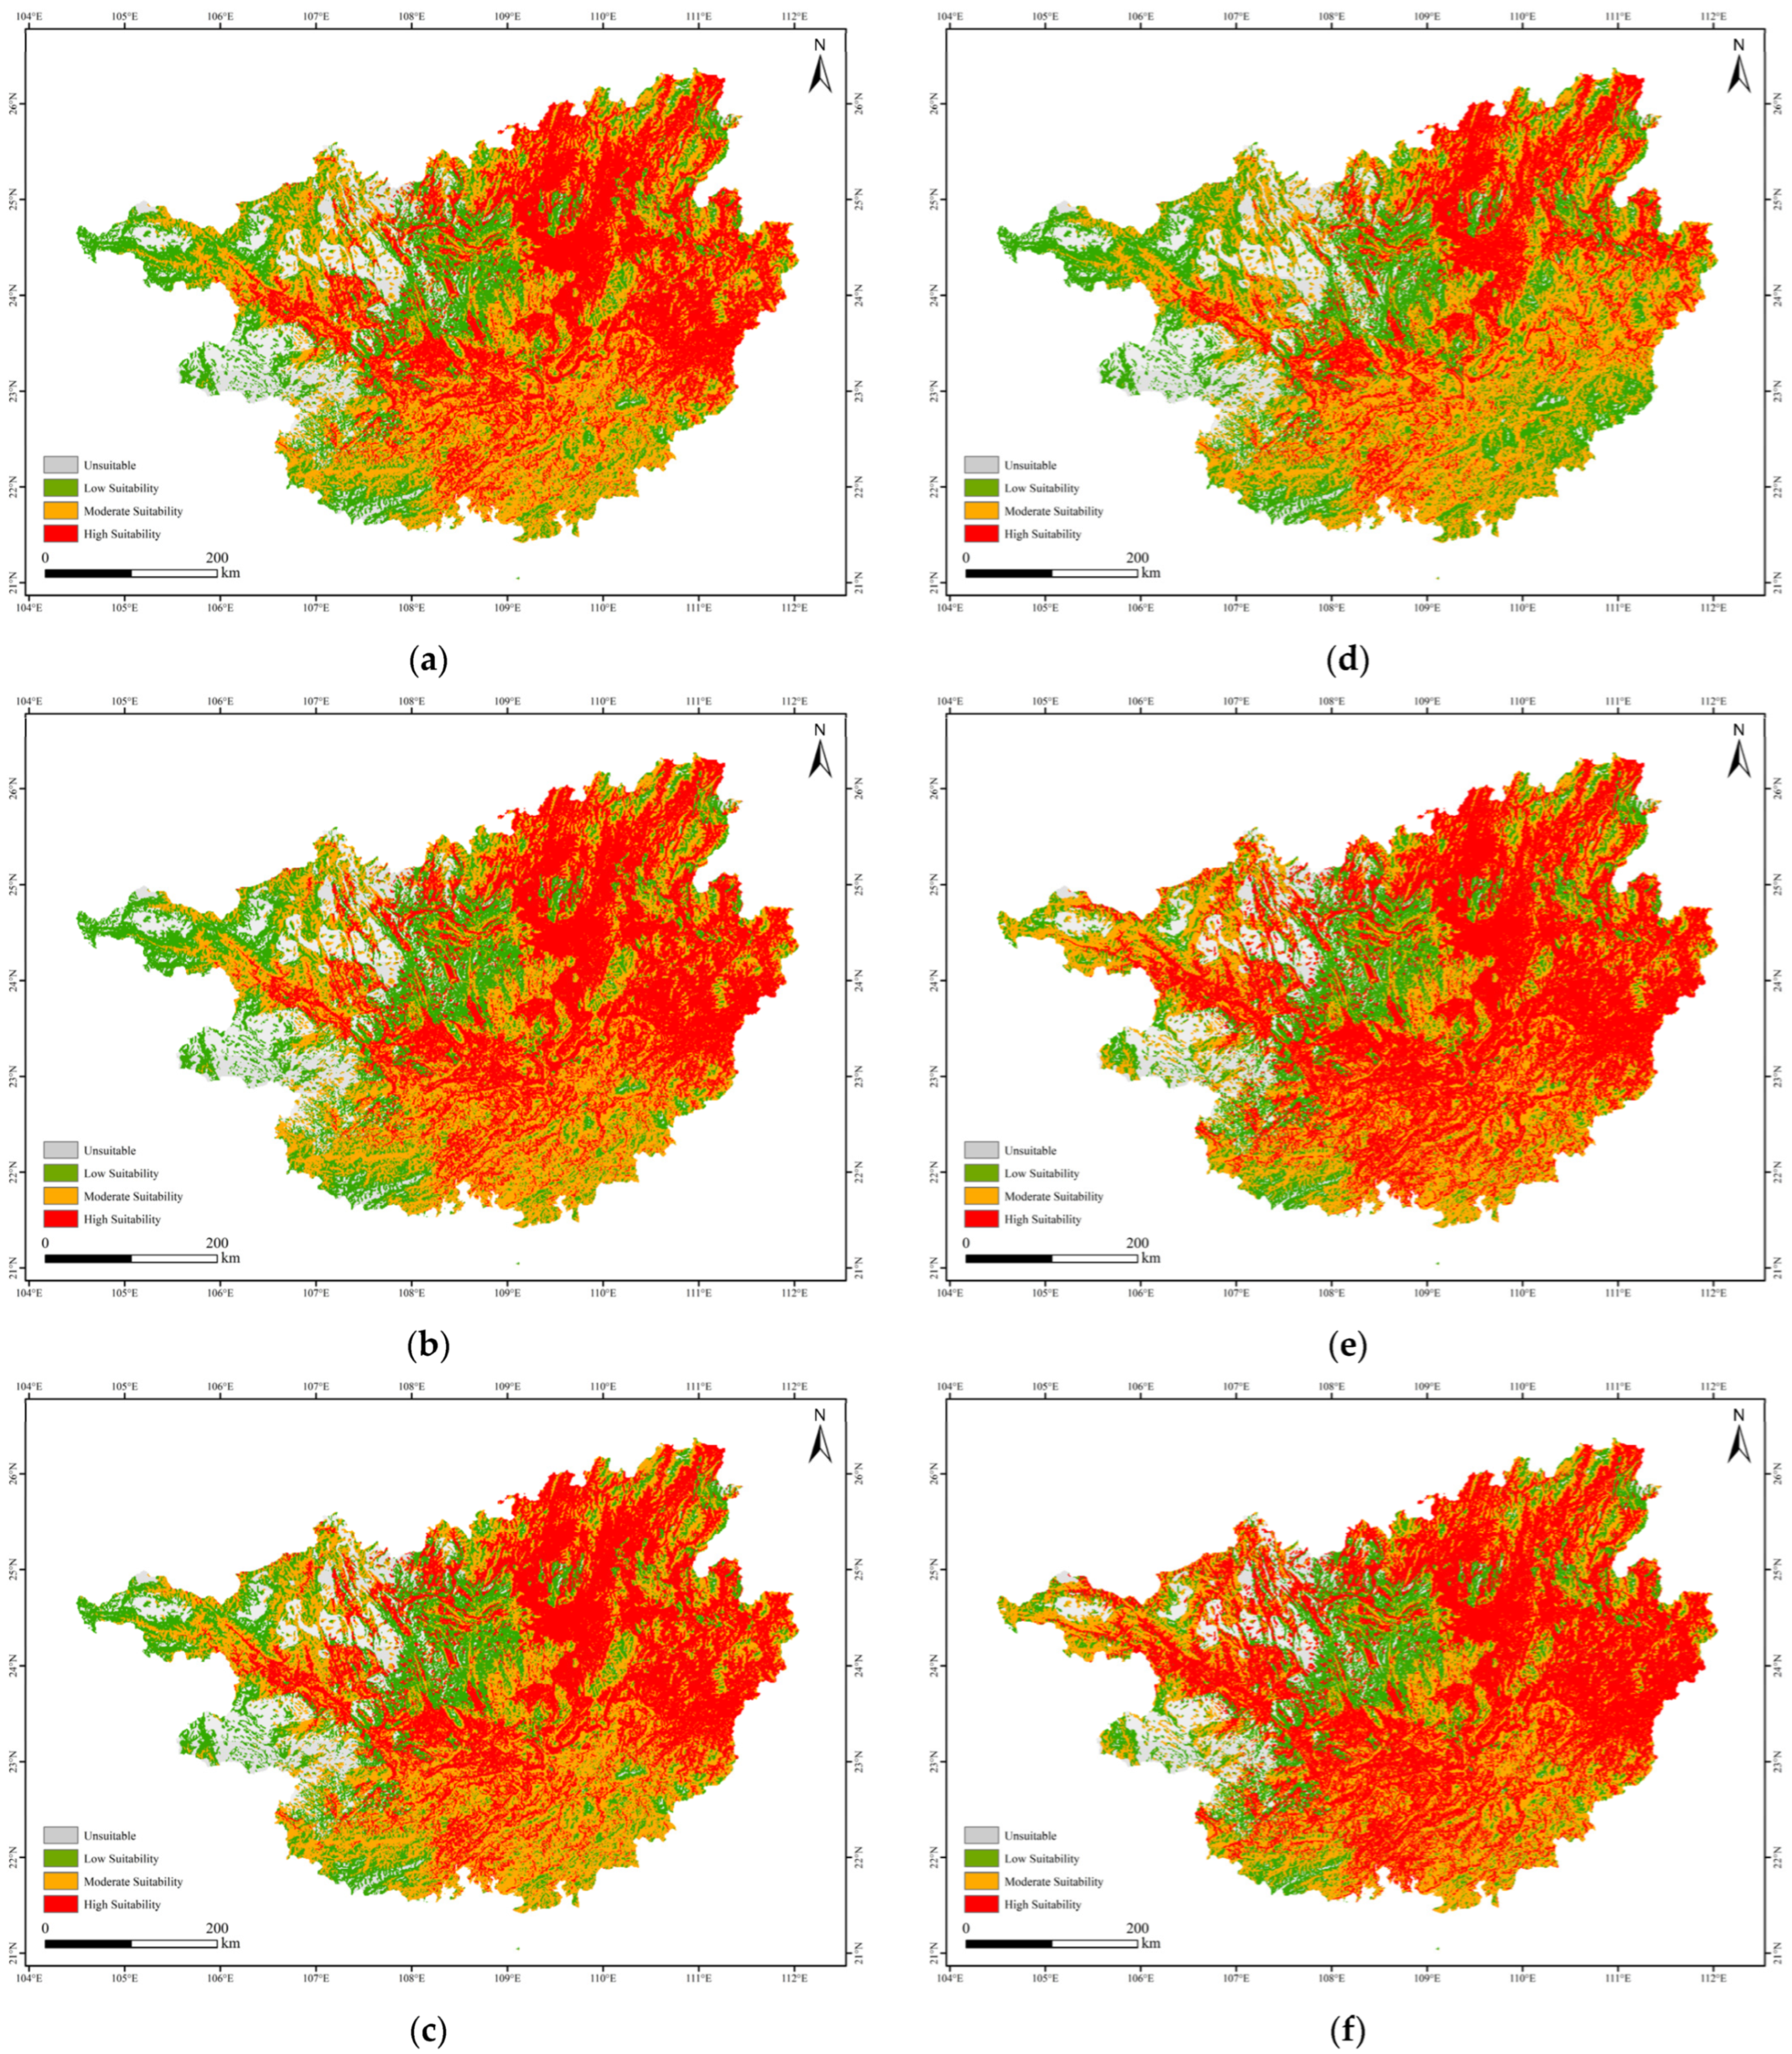
The potential distribution patterns of Camellia osmantha under future climate scenarios (2050s and 2090s; SSP126, SSP370, and SSP585) are shown in Figure 5, with the area of each suitability class summarized in Table 7.
Under the SSP126 scenario, the high suitability area slightly increased in the 2050s (+5.1%) but sharply decreased in the 2090s (−30.3%), while the moderate suitability area increased in both periods (+0.4% and +10.9%, respectively). Under SSP370 and SSP585, the high suitability area exhibited substantial increases in both periods, reaching +39.0% and +41.1% by the 2090s, respectively. In contrast, the moderate suitability area decreased under both scenarios, with reductions of −3.7% to −12.6%. The total suitable habitat area remained relatively stable across all scenarios and periods, with changes ranging from −1.2% to +3.2% relative to the current period. These contrasting trends suggest that future climate change may alter the internal composition of suitable habitats, even when the total area remains relatively stable.

3.6. Centroid Migration Patterns of Highly Suitable Habitats Under Climate Change

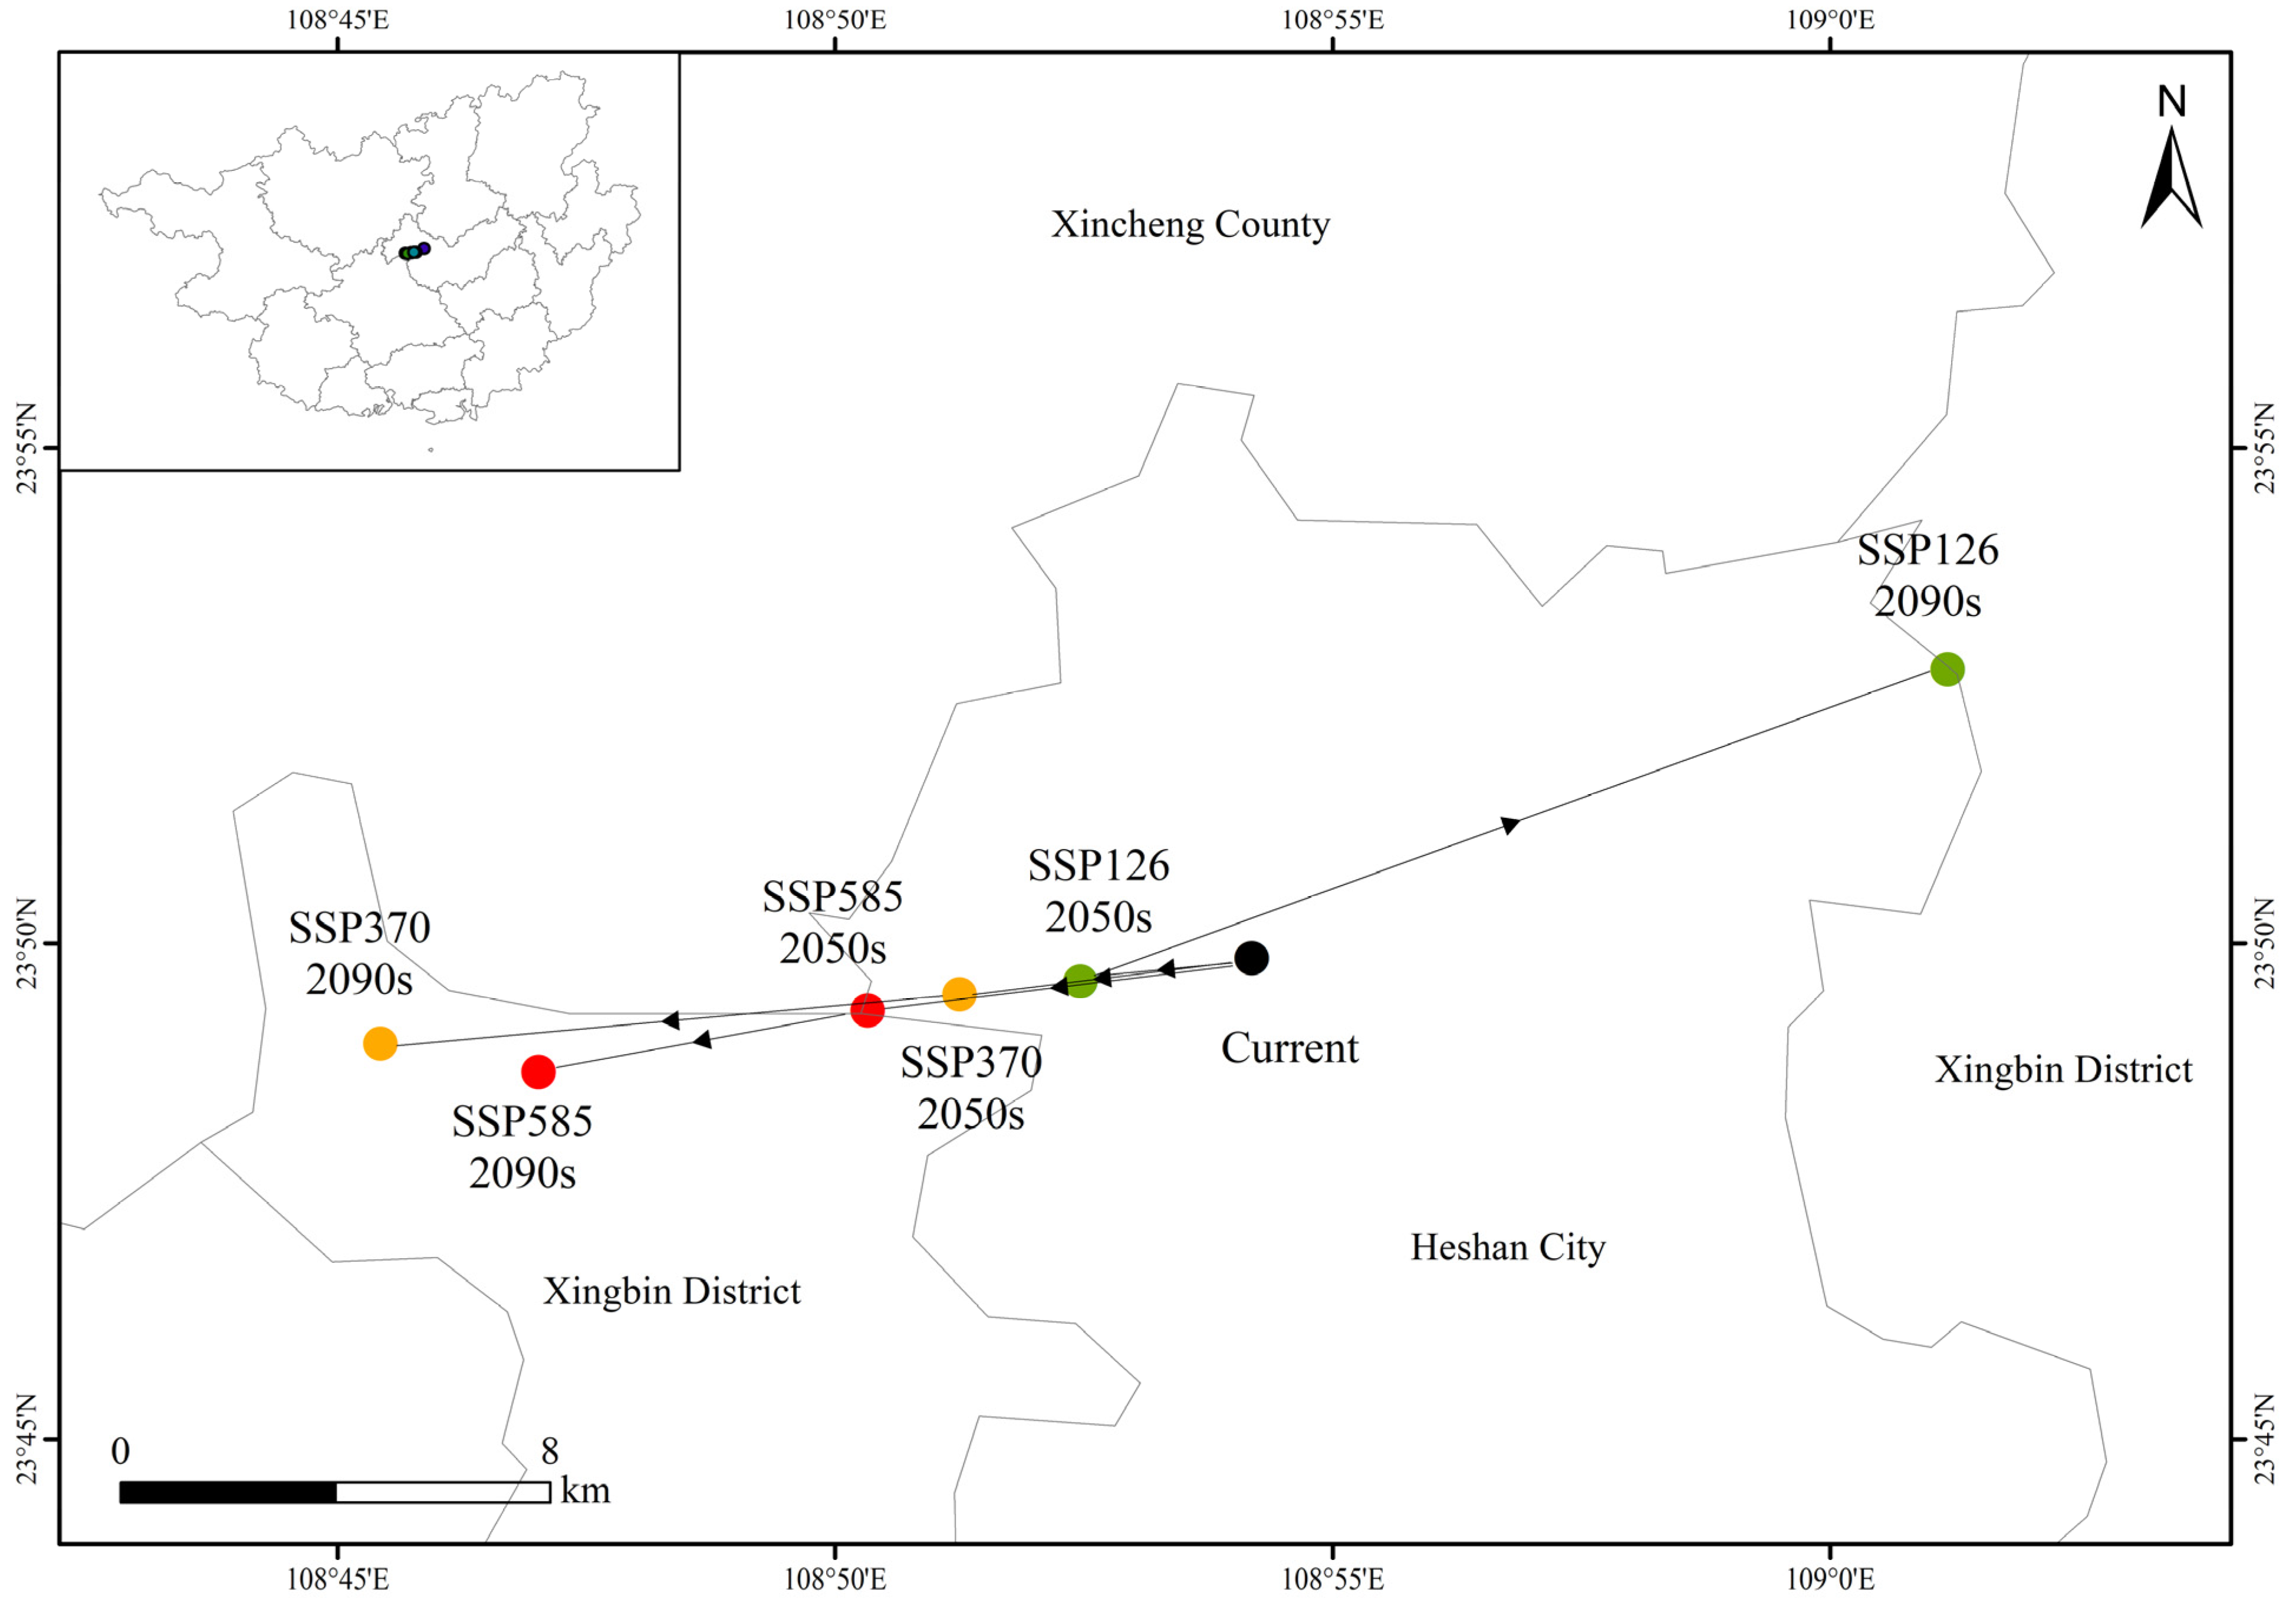
The centroids of highly suitable habitats under current and future climate scenarios are presented in Table 8, with migration trajectories visualized in Figure 6.
Under current conditions, the centroid was located at 108.903° E, 23.831° N in central Guangxi. Under the SSP126 scenario, the centroid shifted slightly southwestward (2.95 km) in the 2050s, then northeastward (13.03 km) in the 2090s. Under the SSP370 scenario, the centroid migrated southwestward in both periods, with distances of 5.02 km (2050s) and 14.93 km (2090s). The SSP585 scenario showed similar southwestward shifts of 6.62 km (2050s) and 12.34 km (2090s).
Overall, all centroids remained within central Guangxi across all scenarios and periods, with migration distances ranging from 2.95 to 14.93 km. This limited spatial shift indicates that the core distribution area of Camellia osmantha exhibits strong spatial stability under future climate change.

4. Discussion

4.1. Model Performance and Variable Screening

The optimized MaxEnt model (RM = 3.5, FC = LQHPT) achieved a training AUC of 0.7784 and a test AUC of 0.6935 (Figure 2), confirming acceptable predictive performance and reliability for habitat suitability prediction [29]. The substantially reduced training-test AUC gap in the optimized model compared with the unoptimized default (0.0849 vs. 0.1720) demonstrates that the regularization effectively mitigated overfitting, a common issue in MaxEnt models with moderate sample sizes [16,30]. Although the test AUC (0.6935) falls within the acceptable rather than good range according to Swets’ classification (0.5–0.7 = low accuracy; 0.7–0.9 = potentially useful) [29], the substantially reduced training-test gap (0.0849 vs. 0.1720) indicates that regularization effectively mitigated overfitting, a more critical concern than the absolute AUC value for models with limited sample sizes. The model’s predictions remain ecologically meaningful and provide a reasonable basis for habitat suitability assessment.
The two-step variable screening procedure reduced the initial 27 environmental variables to 11 predictors, effectively eliminating multicollinearity while retaining ecologically meaningful drivers. The correlation-based exclusion of variables with |r| > 0.8 (e.g., bio5 with altitude, bio4 with bio7, bio15/bio17 with bio19) ensured that redundant predictors did not bias model estimates. This parsimonious approach to variable selection, combined with ENMeval optimization, improved model generalizability and interpretability [30,35].

4.2. Ecological Niche Characteristics and Limiting Factors

Among the 11 retained variables, available water capacity (AWC) showed the highest contribution (24.3%), followed by altitude (ALT) (24.1%) and temperature annual range (bio7) (21.9%), with a cumulative contribution of 70.3%. This indicates that soil water availability, topographic elevation, and temperature seasonality jointly define the ecological niche of Camellia osmantha.
The dominance of available water capacity highlights the critical role of edaphic factors, often overlooked in species distribution modeling (SDM) studies that tend to prioritize climatic variables, in shaping the distribution of woody oil plants in subtropical regions. Soil water availability integrates multiple physical properties (texture, porosity, organic matter content) that determine water retention and supply to plant roots [34]. The optimal range of −0.5 to 3.0 and the sharp decline in suitability above 3.0 suggest that Camellia osmantha favors soils with moderate water retention but is limited by excessive moisture, which may induce root hypoxia or promote fungal pathogens. This sensitivity to soil water availability may be particularly acute during the dry season (October–March), when soil moisture becomes a critical limiting factor for survival and growth.
Altitude maintained strong importance (24.1%), with an optimal range of 0–543 m and suitability declining above 543 m. This confirms the species’ adaptation to low-hill and foothill environments, where warmer temperatures, well-developed acidic soils, and adequate drainage prevail. The decline above 543 m likely reflects the combined effects of lower temperatures, increased cloud cover, and reduced soil development at higher elevations, conditions that fall outside the species’ physiological tolerance. This elevation dependence is consistent with the species’ known distribution in southern China, where it is typically cultivated on low hills and gentle slopes below 500 m [1].
Temperature annual range (bio7) ranked third (21.9%) but displayed a distinct monotonic increasing response across the observed range (17.95–30.55 °C), with suitability exceeding 0.5 above 23.06 °C. This contrasts with the typical unimodal (hump-shaped) responses often assumed for temperature variables in SDM studies. The monotonic pattern suggests that Camellia osmantha benefits from greater seasonal temperature variation within the studied climatic gradient, possibly reflecting adaptation to regions with distinct seasonal temperature patterns that support reproductive development and oil accumulation [36]. Whether this trend continues beyond 30.55 °C remains unknown and warrants further investigation. This finding also highlights the importance of examining response curve shapes rather than assuming predefined functional forms [16].
Among the remaining variables, slope (3.5%) and soil pH (s_ph) (7.0%) also contributed to the model, with Camellia osmantha favoring gentle to moderate slopes (5–15°) and acidic soils (pH 4.5–5.5). This slope preference is consistent with cultivation on well-managed hillside plantations where drainage is favorable and soil depth is sufficient for root development. The edaphic preference for acidic soils reflects adaptation to the red earths and lateritic soils widely distributed in subtropical southern China. Precipitation of the coldest quarter (bio19) (3.6%) contributed modestly, suggesting that adequate moisture during the dry season is relevant but less influential than the top three predictors.
Collectively, these results define the ecological niche of Camellia osmantha as a species adapted to warm, moderately seasonal, low-elevation environments (≤543 m) with moderate soil water availability (−0.5 to 3.0), acidic soils (pH 4.5–5.5), and adequate but not excessive seasonal precipitation. The limiting thresholds, AWC > 3.0, ALT > 543 m, and bio7 < 23.06 °C, provide quantitative criteria for identifying potential cultivation areas beyond Guangxi, such as neighboring provinces (e.g., Yunnan, Guizhou, and Guangdong) and northern Vietnam, where similar environmental conditions may occur.

4.3. Suitable Habitat Distribution Patterns and Climate Change Responses

Under current climatic conditions, the total suitable habitat area for Camellia osmantha is 18.53 × 10⁴ km2 (89.7% of Guangxi), with high suitability areas (32.4%) concentrated in the northeastern and southwestern parts of the region, while non-suitable areas (10.3%) are mainly in the west. This spatial heterogeneity reflects the species’ preference for specific environmental conditions, moderate elevations, suitable temperature regimes, and adequate soil water availability. The broad distribution of moderate suitability areas across two-thirds of Guangxi suggests that Camellia osmantha has a relatively wide potential range, but optimal conditions for cultivation are restricted to specific sub-regions.
Under future climate scenarios, the total suitable habitat area remained relatively stable across most scenarios and periods (changes: −1.2% to +3.2%), but the internal composition shifted considerably. High suitability areas expanded substantially under SSP370 and SSP585 by the 2090s (+39.0% and +41.1%, respectively), while contracting under SSP126 in the 2090s (−30.3%). These contrasting trends highlight the uncertainty in future projections and underscore the importance of considering multiple emission pathways [37]. The expansion under moderate to high emission scenarios may reflect a transient optimal window where moderate warming alleviates cold constraints without yet reaching critical thermal thresholds, a pattern also observed in other subtropical woody oil plants [38]. The contraction under SSP126 in the 2090s suggests that low-emission scenarios do not necessarily benefit all species, as changes in precipitation patterns or seasonal variability may offset potential gains from reduced warming.
The shift in habitat quality, rather than quantity, is a critical finding. Under higher emission scenarios, moderate suitability habitats may be “upgraded” to high suitability as warming proceeds, while under the low-emission scenario, a broader area may remain at moderate suitability due to less pronounced warming. This suggests that the species’ response to climate change is nonlinear and depends on the interplay between temperature and precipitation changes.
Centroid analysis revealed that all centroids remained within central Guangxi across all scenarios, with migration distances of only 2.95–14.93 km. Most centroids shifted southwestward, with the exception of SSP126 in the 2090s shifting northeastward. Several factors may explain this limited shift compared to other subtropical woody species. First, Guangxi’s complex karst topography creates diverse micro-habitats that buffer against broad-scale climatic shifts, providing micro-climatic refugia within the existing distribution [39]; this stability likely reflects the confluence of moderate elevations, suitable temperatures, and favorable soil conditions that maintain habitat suitability. Second, the species’ narrow physiological tolerances, particularly its preferences for elevations below 543 m, moderate soil water capacity (−0.5 to 3.0), and temperature annual range above 23.06 °C, constrain its ability to shift beyond these thresholds. Additionally, our centroid analysis focuses on highly suitable habitats (suitability > 0.8), which are expected to be more stable than marginal habitats [36,40]. The persistence of highly suitable habitats in central Guangxi across all scenarios has important practical implications and this region should be prioritized for conservation and sustainable cultivation investments, and the strong habitat fidelity observed suggests that stable, long-term cultivation strategies are feasible despite ongoing climate change.

4.4. Climate Change Impacts on Suitable Habitat Distribution

Several limitations should be acknowledged. First, predictions are based solely on climatic, topographic, and edaphic variables and do not account for biotic interactions (e.g., competition and pollination) or anthropogenic factors (e.g., land-use change and cultivation practices) that may influence actual distributions [41]. Second, the moderate sample size (27 occurrence points), while adequate for MaxEnt modeling with regularization, limits our ability to capture the full range of the species’ ecological niche. Third, the use of coarse-resolution climate data (≈1 km) may overlook fine-scale habitat heterogeneity and microclimatic refugia in complex terrain [37]. Fourth, extreme climate events (e.g., droughts and heatwaves), expected to increase in frequency under climate change, were not explicitly modeled, yet may pose significant risks to survival and productivity.
Future studies should: (1) expand occurrence records through systematic field surveys; (2) incorporate additional variables, including biotic interactions and land-use change scenarios; (3) employ higher-resolution climate data (<1 km) and downscaled projections; (4) integrate species distribution models with process-based physiological models to account for extreme events; and (5) validate predictions with independent occurrence data when available.
Despite these limitations, our study provides a robust quantitative framework for understanding the ecological niche of Camellia osmantha and for guiding its sustainable management under climate change. The identified limiting thresholds and the spatial stability of the core habitat in central Guangxi offer actionable insights for conservation planning and cultivation strategy development for this economically valuable woody oil species.

5. Conclusions

This study employed an optimized MaxEnt model (RM = 3.5, FC = LQHPT) with 27 field-collected occurrence points and 11 selected environmental variables to predict the potential distribution of Camellia osmantha in Guangxi under current and future climate scenarios.
The optimized model demonstrated acceptable predictive performance (training AUC = 0.7784, test AUC = 0.6935), with a substantially reduced training-test gap compared to the default model (0.0849 vs. 0.1720), confirming that regularization effectively mitigated overfitting. Among the 11 retained variables, available water capacity (24.3%), altitude (24.1%), and temperature annual range (21.9%) were the dominant drivers, with a cumulative contribution of 70.3%. Threshold analysis revealed that suitability declined when AWC exceeded 3.0, altitude exceeded 543 m, or bio7 fell below 23.06 °C (monotonic increasing response within the observed range). Current suitable habitats cover 18.53 × 10⁴ km2 (89.7% of Guangxi), with high suitability areas concentrated in the northeast and southwest. Under future scenarios, the total suitable area remained relatively stable (−1.2% to +3.2%), but high suitability areas expanded under SSP370 and SSP585 by the 2090s (+39.0% and +41.1%) and contracted under SSP126 (−30.3%). Centroid migration distances were limited (2.95–14.93 km), with centroids remaining in central Guangxi, indicating strong spatial stability of the core distribution area.
These findings provide a scientific basis for conservation planning and sustainable cultivation strategies for this economically valuable woody oil species under climate change. Future studies should incorporate biotic interactions, land-use change, and higher-resolution climate data to further refine predictions.


Supplementary Materials

The following supporting information can be downloaded at: https://www.mdpi.com/article/10.3390/su18157721/s1, Figure S1. The Correlation Analysis Result of Environmental Factors. Table S1: ENMeval parameter optimization results (delta.AICc < 10).

Author Contributions

Conceptualization, M.Z. and B.H.; methodology, M.Z. and B.H.; formal analysis, M.Z., N.Z., H.G., and J.C.; investigation, M.Z., N.Z., and F.G.; data curation, H.G., N.Z., and J.C.; writing—original draft preparation, M.Z. and B.H.; writing—review and editing, D.Y. and J.S.; supervision, M.Z., B.H., and J.S. All authors have read and agreed to the published version of the manuscript.

Funding

This work was supported by the Guangxi Forestry Research Institute (Open Project of Key Laboratory of Cultivation and Utilization for Characteristic Economic Forests of Guangxi: “Research on fruit characteristics and seed oil quality of Camellia osmantha across different geographic zones in Guangxi”, Grant No. JB-24-03-02) and the Department of Science and Technology of Guangxi Zhuang Autonomous Region (Guangxi Natural Science Foundation General Program: “Identification of floral volatile constituents and biosynthesis mechanism of Camellia osmantha via multi-omics approaches”, Grant No. 2026GXNSFAA00640979).

Institutional Review Board Statement

Not Applicable.

Informed Consent Statement

Not Applicable.

Data Availability Statement

The data presented in this study are not publicly available due to restrictions related to data confidentiality.

Acknowledgments

We are deeply indebted to all the people who contributed to this study, as well as the reviewers of this manuscript.

Conflicts of Interest

Author Ning Zhang that is employed at Henan Yuanzhi Forestry Planning and Design Co., Ltd, Zhengzhou. The remaining authors declare that the research was conducted in the absence of any commercial or financial relationships that could be construed as a potential conflict of interest.

References

  1. Ye, C.X.; Ma, J.L.; Ye, H. Camellia osmantha—A new species of Camellia sect. Paracamellia. Guihaia 2012, 32, 753–755. [Google Scholar]
  2. Zhang, Z.; Hao, B.; Li, M.; Ma, J.; Yang, J.; Wang, P.; Li, J.; Lian, J.; Ye, H.; Gan, S. Haplotype-resolved chromosome-level genome assembly of an autohexaploid oil camellia tree Camellia osmantha. Sci. Data 2026, 13, 395. [Google Scholar] [CrossRef] [PubMed]
  3. Wu, F.; He, Z.; Zhou, Y.; Ye, H.; Ma, J.; Yang, S.; Zhao, D. Genetic diversity and structure of an oil camellia, Camellia osmantha (section Paracamellia, Theaceae). Genet. Resour. Crop Evol. 2026, 73, 116. [Google Scholar] [CrossRef]
  4. Ma, J.; Ye, H.; Rui, Y.; Chen, G.; Zhang, N. Fatty acid composition of Camellia oleifera oil. J. Verbraucherschutz Leb. 2011, 6, 9–12. [Google Scholar]
  5. IPCC. Climate Change 2021: The Physical Science Basis; Contribution of Working Group I to the Sixth Assessment Report of the Intergovernmental Panel on Climate Change; Masson-Delmotte, V., Zhai, P., Pirani, A., Connors, S.L., Péan, C., Chen, Y., Goldfarb, L., Gomis, M.I., Robin Matthews, J.B., Berger, S., et al., Eds.; Cambridge University Press: Cambridge, UK, 2021. [Google Scholar]
  6. Parmesan, C.; Yohe, G. A globally coherent fingerprint of climate change impacts across natural systems. Nature 2003, 421, 37–42. [Google Scholar] [CrossRef] [PubMed]
  7. Hutchinson, G.E. Concluding remarks. Cold Spring Harb. Symp. Quant. Biol. 1957, 22, 415–427. [Google Scholar] [CrossRef]
  8. Walther, G.R.; Post, E.; Convey, P.; Menzel, A.; Parmesan, C.; Beebee, T.J.C.; Fromentin, J.-M.; Hoegh-Guldberg, O.; Bairlein, F. Ecological responses to recent climate change. Nature 2002, 416, 389–395. [Google Scholar] [CrossRef] [PubMed]
  9. Chen, I.C.; Hill, J.K.; Ohlemüller, R.; Roy, D.B.; Thomas, C.D. Rapid range shifts of species associated with high levels of climate warming. Science 2011, 333, 1024–1026. [Google Scholar] [CrossRef] [PubMed]
  10. Thuiller, W.; Lavorel, S.; Araújo, M.B.; Sykes, M.T.; Prentice, I.C. Climate change threats to plant diversity in Europe. Proc. Natl. Acad. Sci. USA 2005, 102, 8245–8250. [Google Scholar] [CrossRef] [PubMed]
  11. Elith, J.; Leathwick, J.R. Species distribution models: Ecological explanation and prediction across space and time. Annu. Rev. Ecol. Evol. Syst. 2009, 40, 677–697. [Google Scholar] [CrossRef]
  12. Guisan, A.; Zimmermann, N.E. Predictive habitat distribution models in ecology. Ecol. Model. 2000, 135, 147–186. [Google Scholar] [CrossRef]
  13. Phillips, S.J.; Anderson, R.P.; Schapire, R.E. Maximum entropy modeling of species geographic distributions. Ecol. Model. 2006, 190, 231–259. [Google Scholar] [CrossRef]
  14. Phillips, S.J.; Dudík, M. Modeling of species distributions with Maxent: New extensions and a comprehensive evaluation. Ecography 2008, 31, 161–175. [Google Scholar] [CrossRef]
  15. Elith, J.; Graham, C.H.; Anderson, R.P.; Dudík, M.; Ferrier, S.; Guisan, A.; Hijmans, R.J.; Huettmann, F.; Leathwick, J.R.; Lehmann, A.; et al. Novel methods improve prediction of species‘ distributions from occurrence data. Ecography 2006, 29, 129–151. [Google Scholar] [CrossRef]
  16. Merow, C.; Smith, M.J.; Silander, J.A., Jr. A practical guide to MaxEnt for modeling species’ distributions: What it does, and why inputs and settings matter. Ecography 2013, 36, 1058–1069. [Google Scholar] [CrossRef]
  17. Vasconcelos, R.N.; Cantillo-Pérez, T.; Franca Rocha, W.J.S.; Aguiar, W.M.; Mendes, D.T.; de Jesus, T.B.; de Santana, C.O.; de Santana, M.M.M.; Oliveira, R.P. Advances and challenges in species ecological niche modeling: A mixed review. Earth 2024, 5, 963–989. [Google Scholar] [CrossRef]
  18. Liu, Y.; Wang, S.; Chen, Z.; Tu, S. Research on the response of ecosystem service function to landscape pattern changes caused by land use transition: A case study of the Guangxi Zhuang Autonomous Region, China. Land 2022, 11, 752. [Google Scholar] [CrossRef]
  19. Zhou, Q.; Wang, L.; Tang, F.; Zhao, S.; Huang, N.; Zheng, K. Mapping spatial and temporal distribution information of plantations in Guangxi from 2000 to 2020. Front. Ecol. Evol. 2023, 11, 1201161. [Google Scholar] [CrossRef]
  20. Aiello-Lammens, M.E.; Boria, R.A.; Radosavljevic, A.; Vilela, B.; Anderson, R.P. spThin: An R Package for Spatial Thinning of Species Occurrence Records for Use in Ecological Niche Models. Ecography 2015, 38, 541–545. [Google Scholar] [CrossRef]
  21. Fick, S.E.; Hijmans, R.J. WorldClim 2: New 1-km spatial resolution climate surfaces for global land areas. Int. J. Climatol. 2017, 37, 4302–4315. [Google Scholar] [CrossRef]
  22. Wu, T.; Lu, Y.; Fang, Y.; Xin, X.; Li, L.; Li, W.; Jie, W.; Zhang, J.; Liu, Y.; Zhang, L.; et al. The Beijing Climate Center Climate System Model (BCC-CSM): The Main Progress from CMIP5 to CMIP6. Geosci. Model Dev. 2019, 12, 1573–1600. [Google Scholar] [CrossRef]
  23. Computer Network Information Center. Chinese Academy of Sciences. Geospatial Data Cloud. 2011. Available online: http://www.gscloud.cn/ (accessed on 18 July 2026).
  24. FAO; IIASA; ISRIC; ISSCAS; JRC. Harmonized World Soil Database, Version 1.2; FAO: Rome, Italy; IIASA: Laxenburg, Austria, 2012. [Google Scholar]
  25. Muscarella, R.; Galante, P.J.; Soley-Guardia, M.; Boria, R.A.; Kass, J.M.; Uriarte, M.; Anderson, R.P. ENMeval: An R package for conducting spatially independent evaluations and estimating optimal model complexity for Maxent ecological niche models. Methods Ecol. Evol. 2014, 5, 1198–1205. [Google Scholar] [CrossRef]
  26. Kass, J.M.; Muscarella, R.; Galante, P.J.; Bohl, C.L.; Pinilla-Buitrago, G.E.; Boria, R.A.; Soley-Guardia, M.; Anderson, R.P. ENMeval 2.0: Redesigned for customizable and reproducible modeling of species‘ niches and distributions. Methods Ecol. Evol. 2021, 12, 1602–1608. [Google Scholar] [CrossRef]
  27. Kramer-Schadt, S.; Niedballa, J.; Pilgrim, J.D.; Schröder, B.; Lindenborn, J.; Reinfelder, V.; Stillfried, M.; Heckmann, I.; Scharf, A.K.; Augeri, D.M.; et al. The Importance of Correcting for Sampling Bias in MaxEnt Species Distribution Models. Divers. Distrib. 2013, 19, 1366–1379. [Google Scholar] [CrossRef]
  28. Roberts, D.R.; Bahn, V.; Ciuti, S.; Boyce, M.S.; Elith, J.; Guillera-Arroita, G.; Hauenstein, S.; Lahoz-Monfort, J.J.; Schröder, B.; Thuiller, W.; et al. Cross-Validation Strategies for Data with Temporal, Spatial, Hierarchical, or Phylogenetic Structure. Ecography 2017, 40, 913–929. [Google Scholar] [CrossRef]
  29. Swets, J.A. Measuring the accuracy of diagnostic systems. Science 1988, 240, 1285–1293. [Google Scholar] [CrossRef] [PubMed]
  30. Fielding, A.H.; Bell, J.F. A review of methods for the assessment of prediction errors in conservation presence/absence models. Environ. Conserv. 1997, 24, 38–49. [Google Scholar] [CrossRef]
  31. Liu, L.; Zhao, L.J.; Liu, J.Q.; Zhang, H.S.; Zhang, Z.W.; Huang, R.F.; Gao, R.H. Prediction of potential suitable areas for Monochamus alternatus in China under climate change based on optimized MaxEnt model. Sci. Silvae Sin. 2024, 60, 139–148. [Google Scholar]
  32. Jenks, G.F. The data model concept in statistical mapping. Int. Yearb. Cartogr. 1967, 7, 186–190. [Google Scholar]
  33. Jenks, G.F. Optimal Data Classification for Choropleth Maps; Occasional Paper No. 2; Department of Geography, University of Kansas: Lawrence, KS, USA, 1977. [Google Scholar]
  34. Lv, Z.W.; Zhu, X.R.; Ye, X.Z.; Wen, G.; Jiang, T.; Lai, W.; Shi, C.; Huang, Q.; Zhang, G. Impact of climate change on the suitable habitat of Tetraena mongolica and migration patterns of Utetheisa kong. Acta Ecol. Sin. 2024, 44, 1164–1176. [Google Scholar]
  35. Dormann, C.F.; Elith, J.; Bacher, S.; Buchmann, C.; Carl, G.; Carré, G.; Marquéz, J.R.G.; Gruber, B.; Lafourcade, B.; Leitão, P.J.; et al. Collinearity: A review of methods to deal with it and a simulation study evaluating their performance. Ecography 2013, 36, 27–46. [Google Scholar] [CrossRef]
  36. Gu, W.; Xiao, X.; Ran, Z.; Yan, C.; Jiang, D.; Zhou, L.; An, M.; Li, Z. Distribution prediction and adaptability analysis of Section Camellia plants (Camellia genus) in China based on the MaxEnt model. Ecol. Evol. 2025, 15, e71365. [Google Scholar] [CrossRef] [PubMed]
  37. Thuiller, W.; Guéguen, M.; Renaud, J.; Karger, D.N.; Zimmermann, N.E. Uncertainty in ensembles of global biodiversity scenarios. Nat. Commun. 2019, 10, 1446. [Google Scholar] [CrossRef] [PubMed]
  38. Peñuelas, J.; Filella, I. Responses to a warming world. Science 2001, 294, 793–795. [Google Scholar] [CrossRef] [PubMed]
  39. Keppel, G.; Van Niel, K.P.; Wardell-Johnson, G.W.; Yates, C.J.; Byrne, M.; Mucina, L.; Schut, A.G.T.; Hopper, S.D.; Franklin, S.E. Refugia: Identifying and understanding safe havens for biodiversity under climate change. Trends Ecol. Evol. 2012, 27, 219–226. [Google Scholar]
  40. Pulliam, H.R. On the Relationship between Niche and Distribution. Ecol. Lett. 2000, 3, 349–361. [Google Scholar] [CrossRef]
  41. Araújo, M.B.; Guisan, A. Five (or so) challenges for species distribution modelling. J. Biogeogr. 2006, 33, 1677–1688. [Google Scholar] [CrossRef]
Figure 1. Pearson correlation matrix of the 11 retained environmental variables. Color intensity represents the strength and direction of correlations. All pairwise correlations satisfy |r| ≤ 0.8, confirming no multicollinearity among predictors. Variable abbreviations are listed in Table 1.
Sustainability 18 07721 g001
Figure 2. Receiver Operating Characteristic (ROC) curves for the optimized MaxEnt model (RM = 3.5, FC = LQHPT). The red curve represents the mean training AUC (0.7784) with the light red band indicating ± one standard deviation (SD); the blue curve represents the mean test AUC (0.6935) with the light blue band indicating ± one SD. The gray dashed diagonal line indicates the random prediction baseline (AUC = 0.5).
Sustainability 18 07721 g002
Figure 3. Response curves for the top three ranked environmental variables from the optimized MaxEnt model (RM = 3.5, FC = LQHPT): (a) available water capacity, (b) altitude, and (c) temperature annual range (bio7). The red curves represent the mean logistic output. The horizontal dashed line at suitability = 0.5 indicates the reference threshold for habitat classification. The vertical dashed lines indicate the limiting thresholds: awc_class > 3.0, altitude > 543 m, and bio7 < 23.06 °C (monotonic increasing response). Variable abbreviations: AWC = available water capacity; ALT = altitude; bio7 = temperature annual range.
Sustainability 18 07721 g003
Figure 4. Potential suitable habitat distribution of Camellia osmantha under current climatic conditions in Guangxi. High suitability areas are concentrated in the northeast and southwest, moderate suitability areas cover most of the central, northern, eastern, and southern regions, and non-suitable areas are mainly in the west.
Sustainability 18 07721 g004
Figure 5. Potential suitable habitat distribution of Camellia osmantha under future climate scenarios: (ac) SSP126, SSP370, and SSP585 in the 2050s, and (df) SSP126, SSP370, and SSP585 in the 2090s. Suitability levels are classified as non-suitable (0–0.4), low suitability (0.4–0.6), moderate suitability (0.6–0.75), and high suitability (0.75–1.0).
Sustainability 18 07721 g005
Figure 6. Centroid migration of highly suitable areas for the Camellia osmantha. Different colored circles represent sampling sites under different climate scenarios and the arrow indicates the direction of centroid migration of the distribution across scenarios.
Sustainability 18 07721 g006
Table 1. Environmental Factors.
Factor TypeCodeEnvironmental Factor DescriptionUnit
Climatebio1Annual Mean Temperature°C
bio2Mean Diurnal Range°C
bio3Isothermality°C
bio4Temperature Seasonality°C
bio5Max Temperature of Warmest Month°C
bio6Min Temperature of Coldest Month°C
bio7Temperature Annual Range°C
bio8Mean Temp of Wettest Quarter°C
bio9Mean Temp of Driest Quarter°C
bio10Mean Temp of Warmest Quarter°C
bio11Mean Temp of Coldest Quarter°C
bio12Annual Precipitationmm
bio13Precipitation of Wettest Monthmm
bio14Precipitation of Driest Monthmm
bio15Precipitation Seasonality%
bio16Precip of Wettest Quartermm
bio17Precip of Driest Quartermm
bio18Precip of Warmest Quartermm
bio19Precip of Coldest Quartermm
TopographyALTaltitudem
ASPaspect°
SLOslope°
SoilAWCAvailable Water CapacityClass
s_phSubsoil pHpH
s_ocSubsoil Organic Carbon%
t_ocTopsoil Organic Carbon%
t_phTopsoil pHpH
Table 2. Screening results of the 27 initial environmental variables based on the two-step procedure (contribution < 0.5% exclusion; |r| > 0.8 and lower permutation importance exclusion). The 15 retained variables are shown in bold and variable abbreviations are listed in Table 1.
VariablePercent Contribution (%)Permutation Importance (%)Screening OutcomeRetention/Exclusion Criterion
ALT12.512.5RetainedContribution ≥ 1%, |r| ≤ 0.8
bio711.711.5RetainedContribution ≥ 1%, |r| ≤ 0.8
ASP10.13.0RetainedContribution ≥ 1%, |r| ≤ 0.8
AWC9.813.7RetainedContribution ≥ 1%, |r| ≤ 0.8
SLO9.15.4RetainedContribution ≥ 1%, |r| ≤ 0.8
bio197.84.3RetainedContribution ≥ 1%, |r| ≤ 0.8
bio85.05.3RetainedContribution ≥ 1%, |r| ≤ 0.8
bio24.44.3RetainedContribution ≥ 1%, |r| ≤ 0.8
t_oc3.12.1RetainedContribution ≥ 1%, |r| ≤ 0.8
bio162.62.7RetainedContribution ≥ 1%, |r| ≤ 0.8
s_ph2.12.6RetainedContribution ≥ 1%, |r| ≤ 0.8
bio56.410.2Excluded|r| > 0.8 with altitude (12.5)
bio45.99.4Excluded|r| > 0.8 with bio7 (11.5)
bio91.81.4Excluded|r| > 0.8 with bio8 (5.3)
bio152.03.1Excluded|r| > 0.8 with bio19 (4.3)
bio171.92.9Excluded|r| > 0.8 with bio19 (4.3)
t_ph0.71.2ExcludedContribution < 1%
s_oc0.60.5ExcludedContribution < 1%
bio30.51.4ExcludedContribution < 1%
bio140.40.2ExcludedContribution < 1%
bio100.30.2ExcludedContribution < 1%
bio130.31.0ExcludedContribution < 1%
bio180.20.5ExcludedContribution < 1%
bio120.20ExcludedContribution < 1%
bio10.20.7ExcludedContribution < 1%
bio110.20ExcludedContribution < 1%
bio600ExcludedContribution < 1%
Table 3. Performance comparison between default and optimized MaxEnt models.
ModelRMFCTraining AUCTest AUCAUC Gap
Default (unoptimized)1.0LQHPT0.91310.74110.1720
Optimized (selected)3.5LQHPT0.77840.69350.0849
Table 4. Percent contribution and permutation importance of the 11 retained environmental variables from the optimized MaxEnt model (RM = 3.5, FC = LQHPT). Variables are ordered by percent contribution.
VariableCategoryPercent Contribution (%)Permutation Importance (%)
AWCSoil24.316.3
ALTTopography24.124.1
bio7Climate21.926.7
ASPTopography10.613.1
s_phSoil7.05.9
bio8Climate3.97.1
bio19Climate3.61.1
SLOTopography3.53.6
t_ocSoil1.11.9
bio16Climate00.1
bio2Climate00.1
Total100
Table 5. Optimal ranges and limiting thresholds for the top three ranked environmental variables shaping the distribution of Camellia osmantha, derived from optimated MaxEnt response curves.
Environmental VariableUnitOptimal RangeThreshold (Suitability < 0.5)
Available water capacity (AWC)Class−0.5–3.0>3.0
Altitude (ALT)m0–543>543
Temperature annual range (bio7)°C≥23.06<23.06
Table 6. Areas and proportions of different suitability classes for Camellia osmantha under current climatic conditions.
Suitability ClassThreshold RangeArea (×104 km2)Percentage (%)
Non-suitable0–0.42.1310.3
Low suitability0.4–0.64.7923.2
Moderate suitability0.6–0.757.0534.1
High suitability0.75–1.06.6932.4
Total suitable (Low + Moderate + High)-18.5389.7
Total study area-20.66100
Table 7. Areas of different suitability classes for Camellia osmantha under current and future climate scenarios (×104 km2). Values in parentheses indicate percentage change relative to the current period.
ScenarioPeriodNon-SuitableLow SuitabilityModerate SuitabilityHigh SuitabilityTotal Suitable
Current2.134.797.056.6918.53
SSP1262050s1.97 (−7.5%)4.59 (−4.2%)7.08 (+0.4%)7.03 (+5.1%)18.70 (+0.9%)
2090s2.36 (+10.8%)5.83 (+21.7%)7.82 (+10.9%)4.66 (−30.3%)18.31 (−1.2%)
SSP3702050s1.99 (−6.6%)4.52 (−5.6%)6.79 (−3.7%)7.37 (+10.2%)18.68 (+0.8%)
2090s1.57 (−26.3%)3.47 (−27.6%)6.32 (−10.4%)9.30 (+39.0%)19.09 (+3.0%)
SSP5852050s1.83 (−14.1%)4.33 (−9.6%)7.04 (−0.1%)7.46 (+11.5%)18.83 (+1.6%)
2090s1.54 (−27.7%)3.52 (−26.5%)6.16 (−12.6%)9.44 (+41.1%)19.12 (+3.2%)
Table 8. Centroids of highly suitable habitats for Camellia osmantha under current and future climate scenarios.
ScenarioPeriodLongitude (°E)Latitude (°N)Distance from Current (km)Migration Direction
Current108.90323.831
SSP1262050s108.87423.8272.95Southwest
2090s109.02023.87913.03Northeast
SSP3702050s108.85423.8255.02Southwest
2090s108.75723.81614.93Southwest
SSP5852050s108.83923.8226.62Southwest
2090s108.78423.81212.34Southwest
Disclaimer/Publisher’s Note: The statements, opinions and data contained in all publications are solely those of the individual author(s) and contributor(s) and not of MDPI and/or the editor(s). MDPI and/or the editor(s) disclaim responsibility for any injury to people or property resulting from any ideas, methods, instructions or products referred to in the content.