Coupling Coordination Between New-Type Urbanization and Water Use Efficiency: A CAS-Based Feedback Perspective Analysis of Jiangxi and Hunan Provinces, China


Abstract
1. Introduction
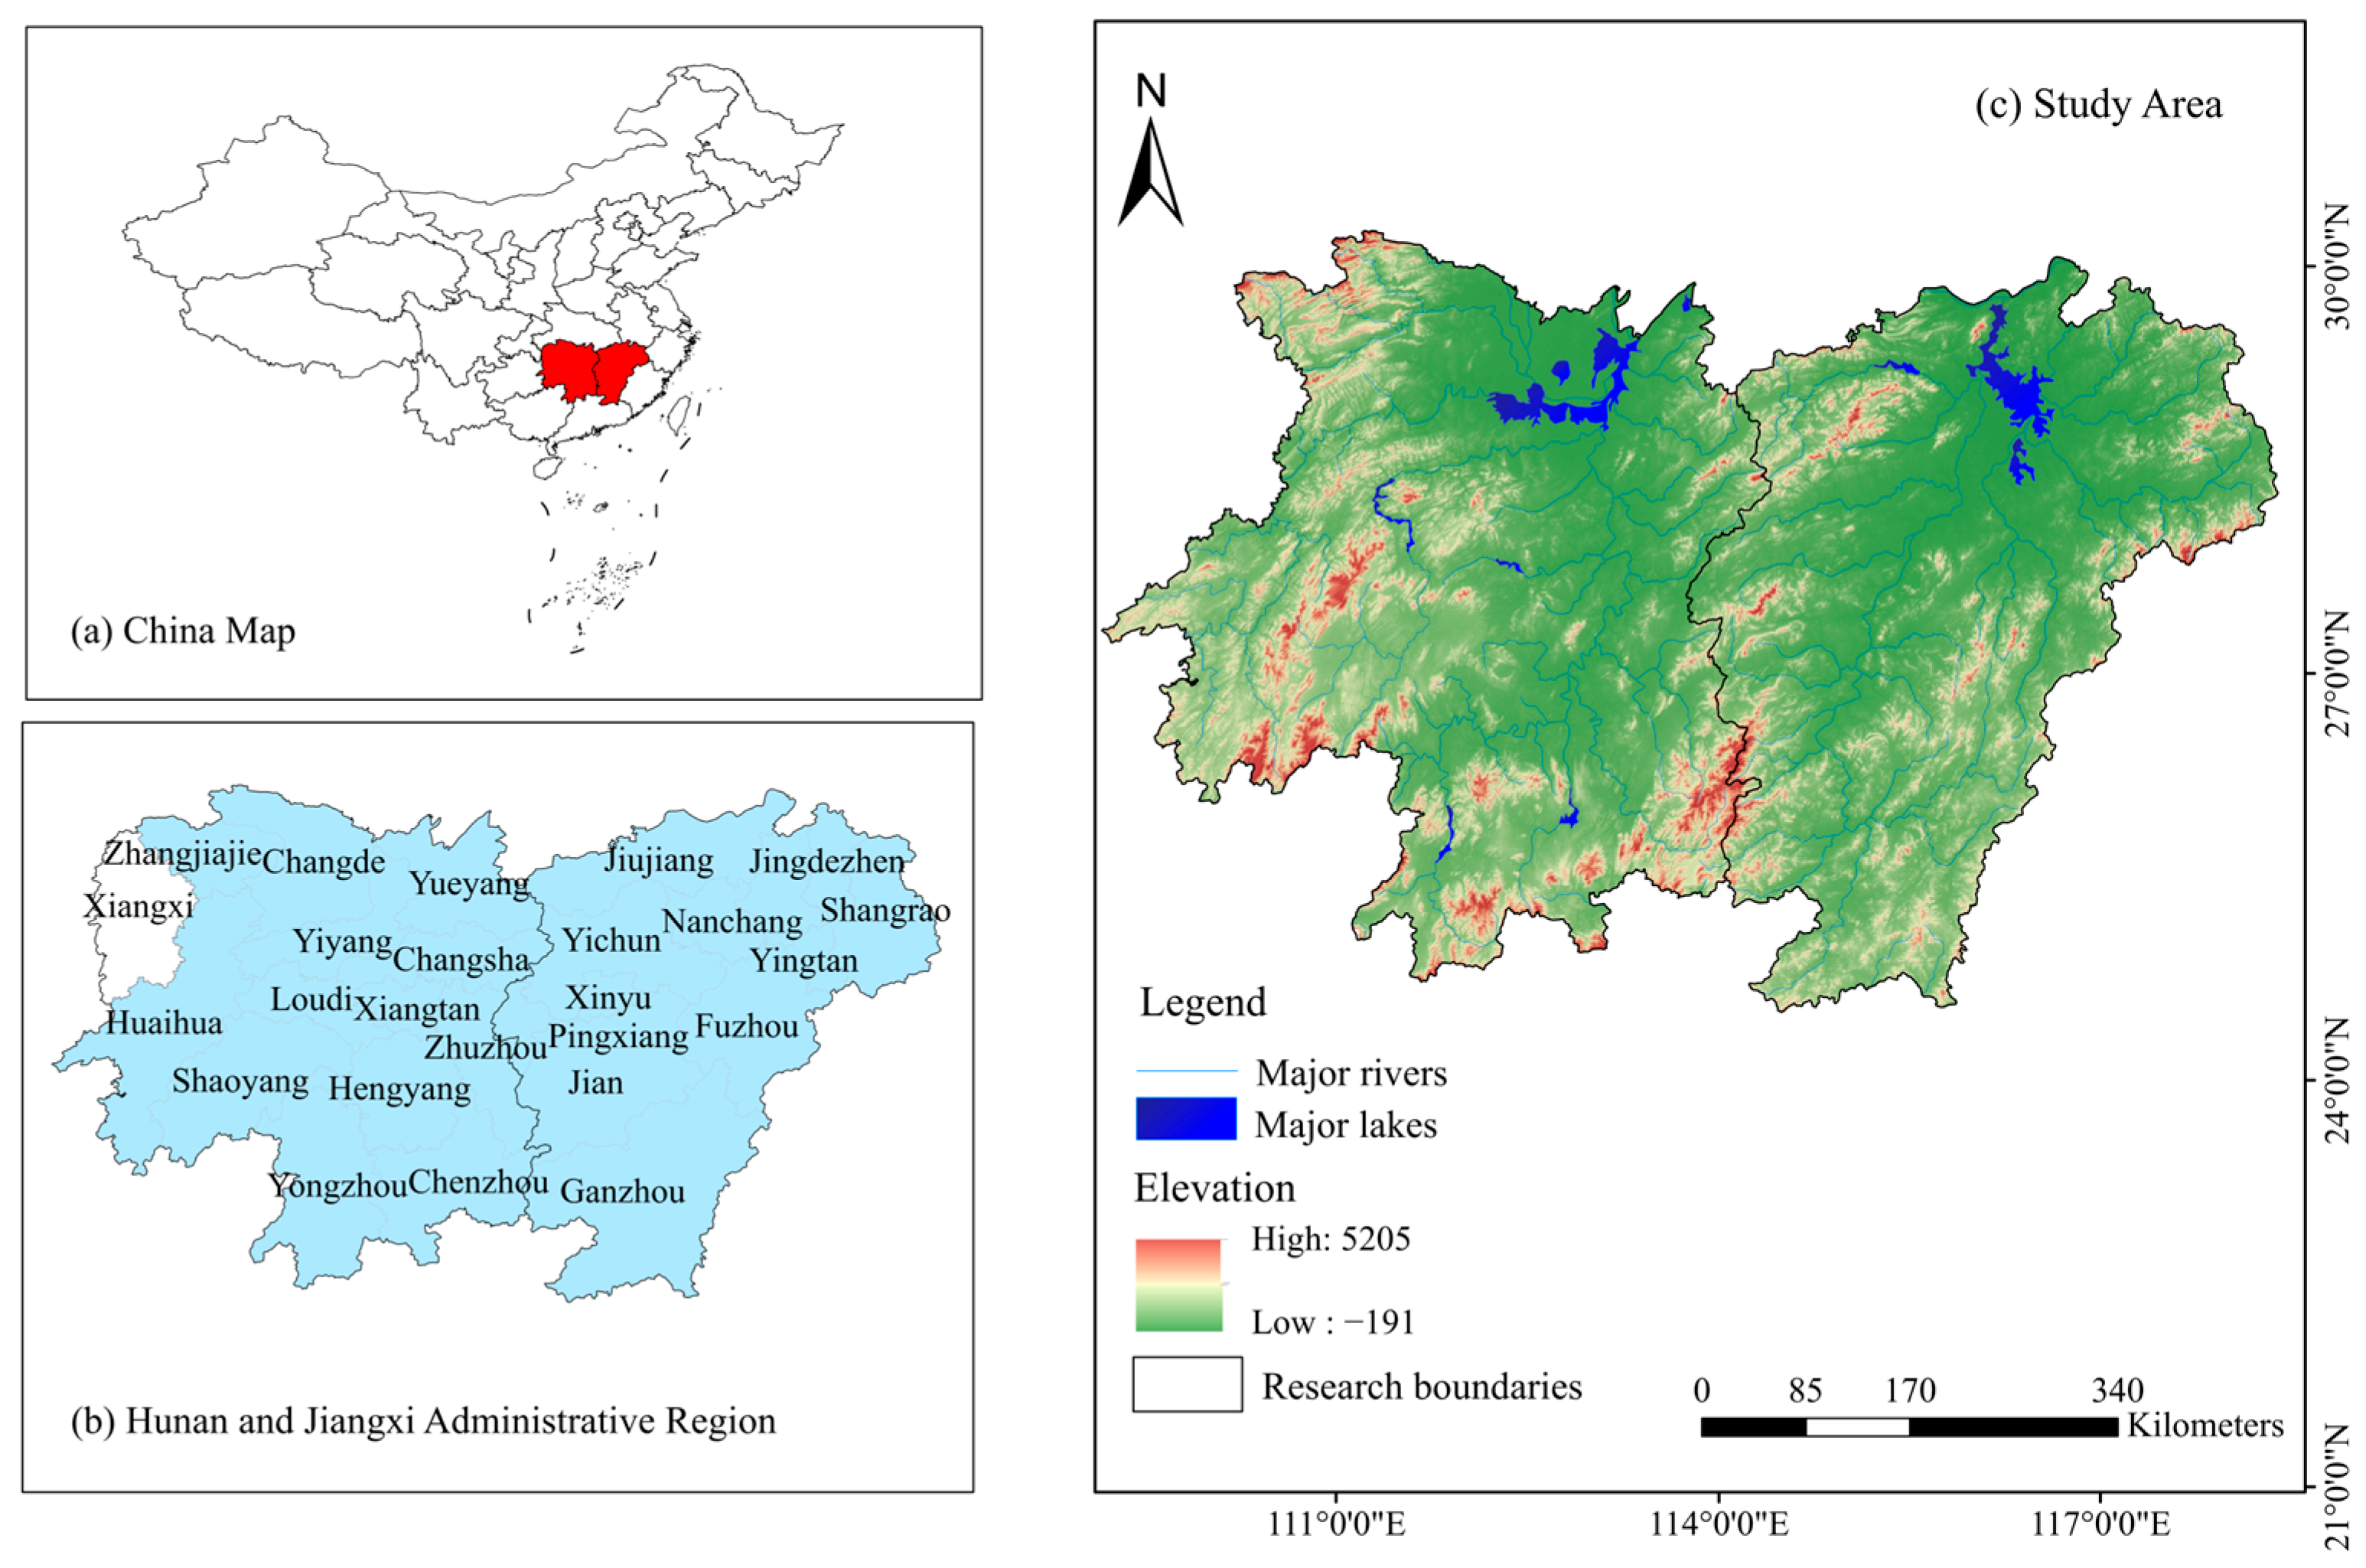
2. Overview of the Study Area and Data Sources
2.1. Overview of the Study Area
2.2. Data Sources
3. Theoretical Framework and Indicator System Construction
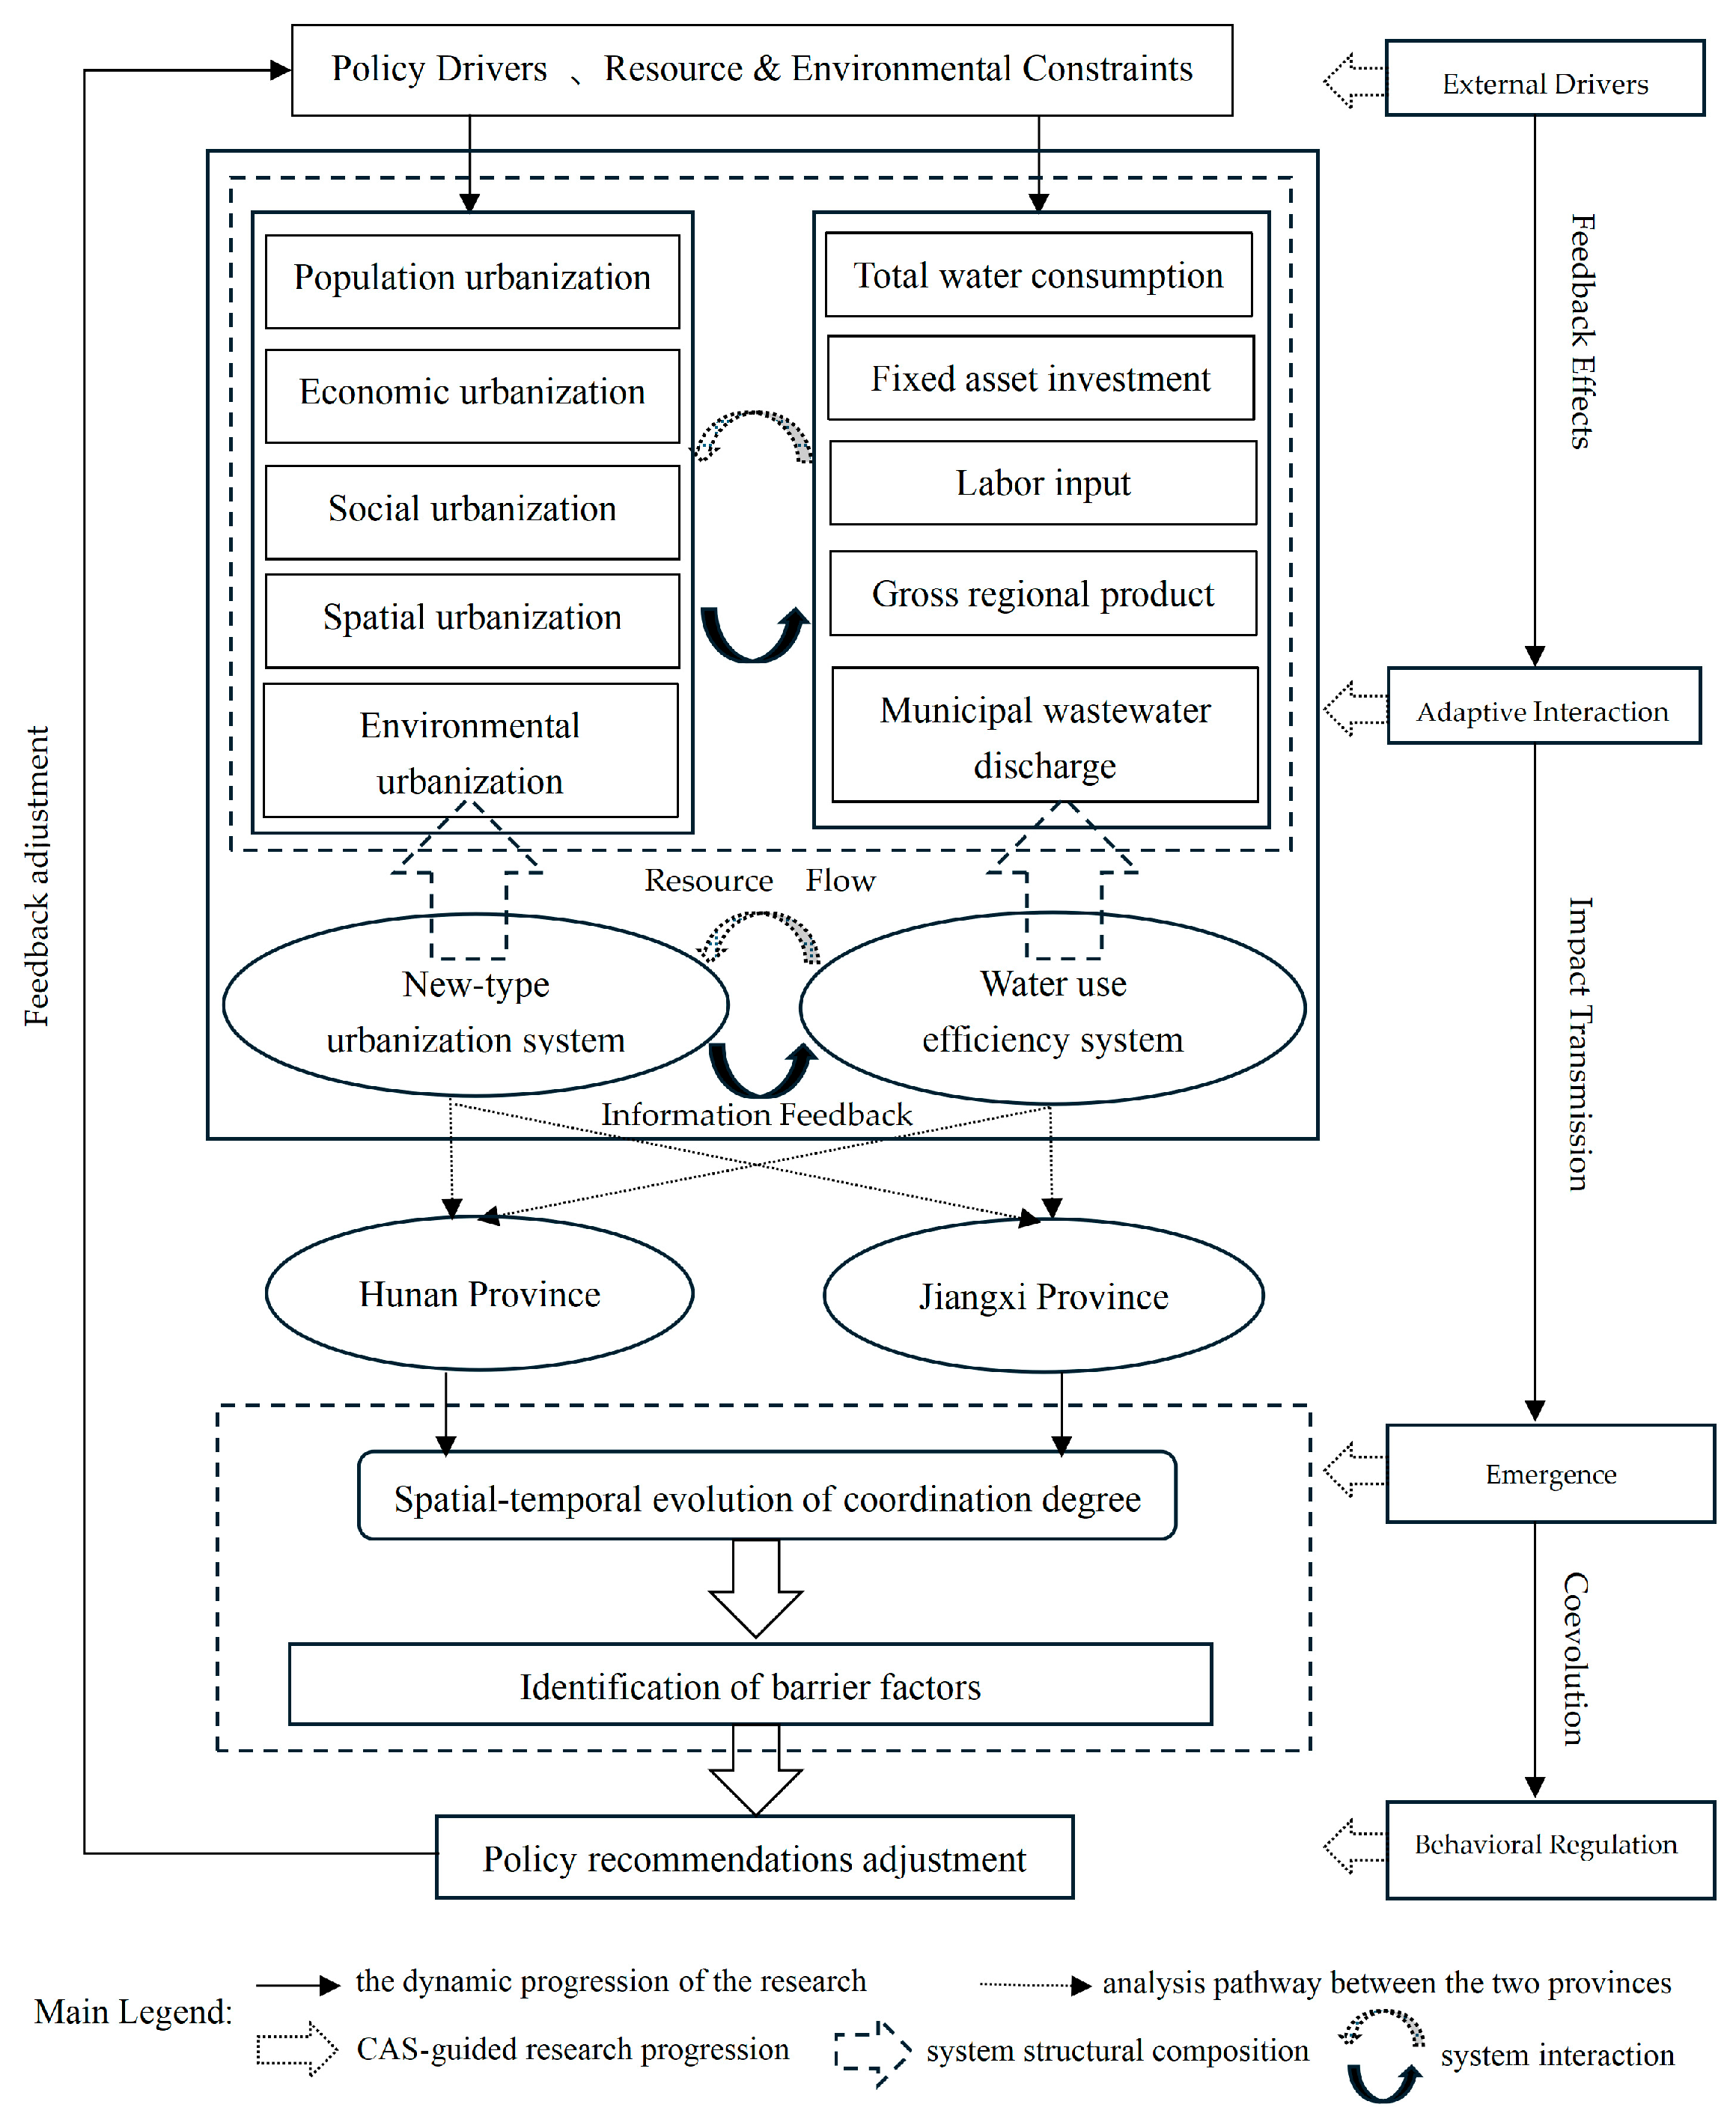
3.1. Theoretical Foundation and Research Framework
3.2. Construction of Indicator System
4. Research Methods
4.1. Entropy Weight Method
4.2. Super-Efficiency SBM Model
4.3. Coupling Coordination Model
4.4. Obstacle Degree Model
5. Analysis of Results
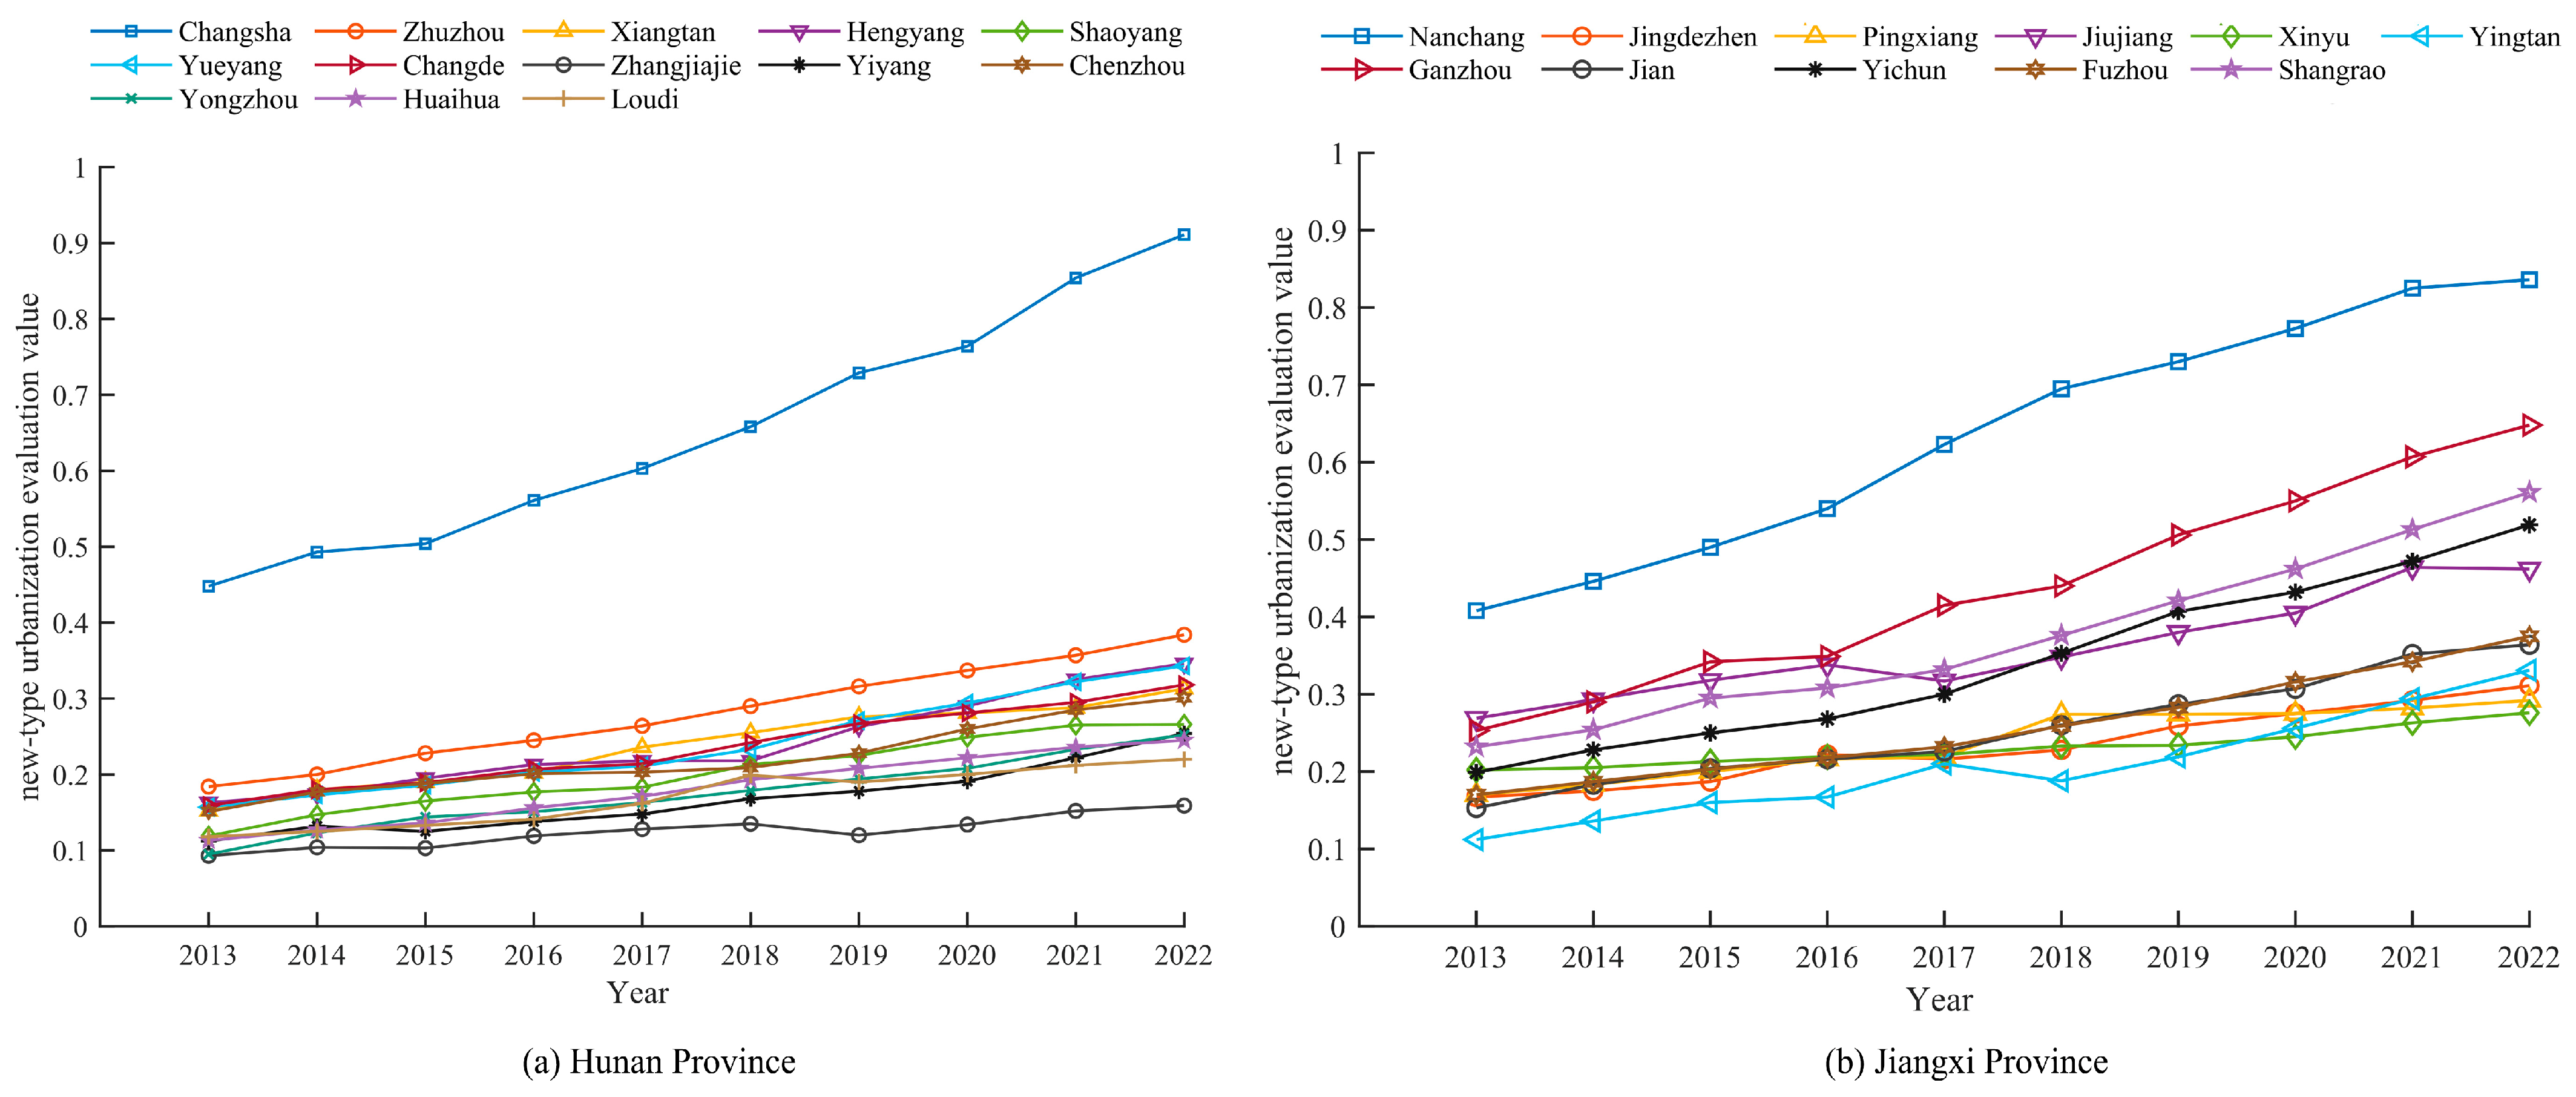
5.1. Time-Series Trends in the Comprehensive Evaluation Index of New-Type Urbanization
- (1)
- Initial Accumulation Stage (2013–2016): The new urbanization evaluation scores of cities across both provinces showed overall slow growth, with a regional gradient pattern beginning to take shape. Within Jiangxi Province, Nanchang’s evaluation score was significantly higher than that of other prefecture-level cities, while cities such as Ganzhou and Jiujiang also demonstrated some growth potential. In Hunan Province, Changsha served as the absolute core, with its evaluation score holding a clear lead. Cities such as Zhuzhou, Xiangtan, and Hengyang formed the second tier, indicating a pronounced imbalance in provincial development.
- (2)
- Accelerated Improvement Phase (2017–2019): Most cities in both provinces entered a period of rapid growth, with the rate of increase in new urbanization evaluation scores expanding significantly. In Jiangxi Province, Nanchang has shown the most remarkable growth momentum, with its polarization effect continuing to manifest; at the same time, cities such as Ganzhou, Fuzhou, Yichun, and Shangrao are gradually accelerating their development, indicating that the provincial capital’s radiating influence is gradually spreading to surrounding areas. A relatively pronounced catch-up trend is emerging among cities across the province, and the overall spatial pattern is moving toward more balanced development. In Hunan Province, Changsha continued its rapid ascent, with cities such as Zhuzhou, Hengyang, Yueyang, and Chenzhou improving in tandem, indicating that Hunan’s new-type urbanization is evolving from single-core leadership toward polycentric development. The differences in the spatial patterns of the two provinces may be related to factors such as the development capacity of central cities, transportation accessibility, and regional coordination policies.
- (3)
- Steady Optimization Phase (2020–2022): The level of new-type urbanization continued to rise across all prefectures and cities in both provinces, but the pace of growth began to diverge, with the overall focus shifting from quantitative expansion to qualitative improvement. The overall level of urbanization in Jiangxi Province has improved, with Nanchang further extending its lead, Ganzhou showing particularly strong growth momentum, and the remaining cities generally exhibiting a steady upward trend. Geographically, this has resulted in a differentiated pattern characterized by “core cities leading the way, with peripheral cities following suit.” In Hunan Province, Changsha’s evaluation score rose significantly, widening the gap with other cities, while Zhuzhou and Hengyang maintained steady growth. In contrast, cities such as Zhangjiajie and Yiyang saw relatively limited improvements, indicating that a distinct gradient differentiation still exists within Hunan Province.
5.2. Temporal Evolution Characteristics of Water Use Efficiency
5.3. Spatiotemporal Evolution of the Coupling Coordination Index Between New-Type Urbanization and Water Use Efficiency
5.3.1. Temporal Changes in the Coupling Coordination Index
5.3.2. Analysis of the Spatial Evolution of Coupling Coordination
Spatial Patterns of Coupling Coordination
Directional Characteristics of Coupling Coordination Distribution
5.4. Analysis of Obstacle Factors Constraining the Coupling Coordination Degree
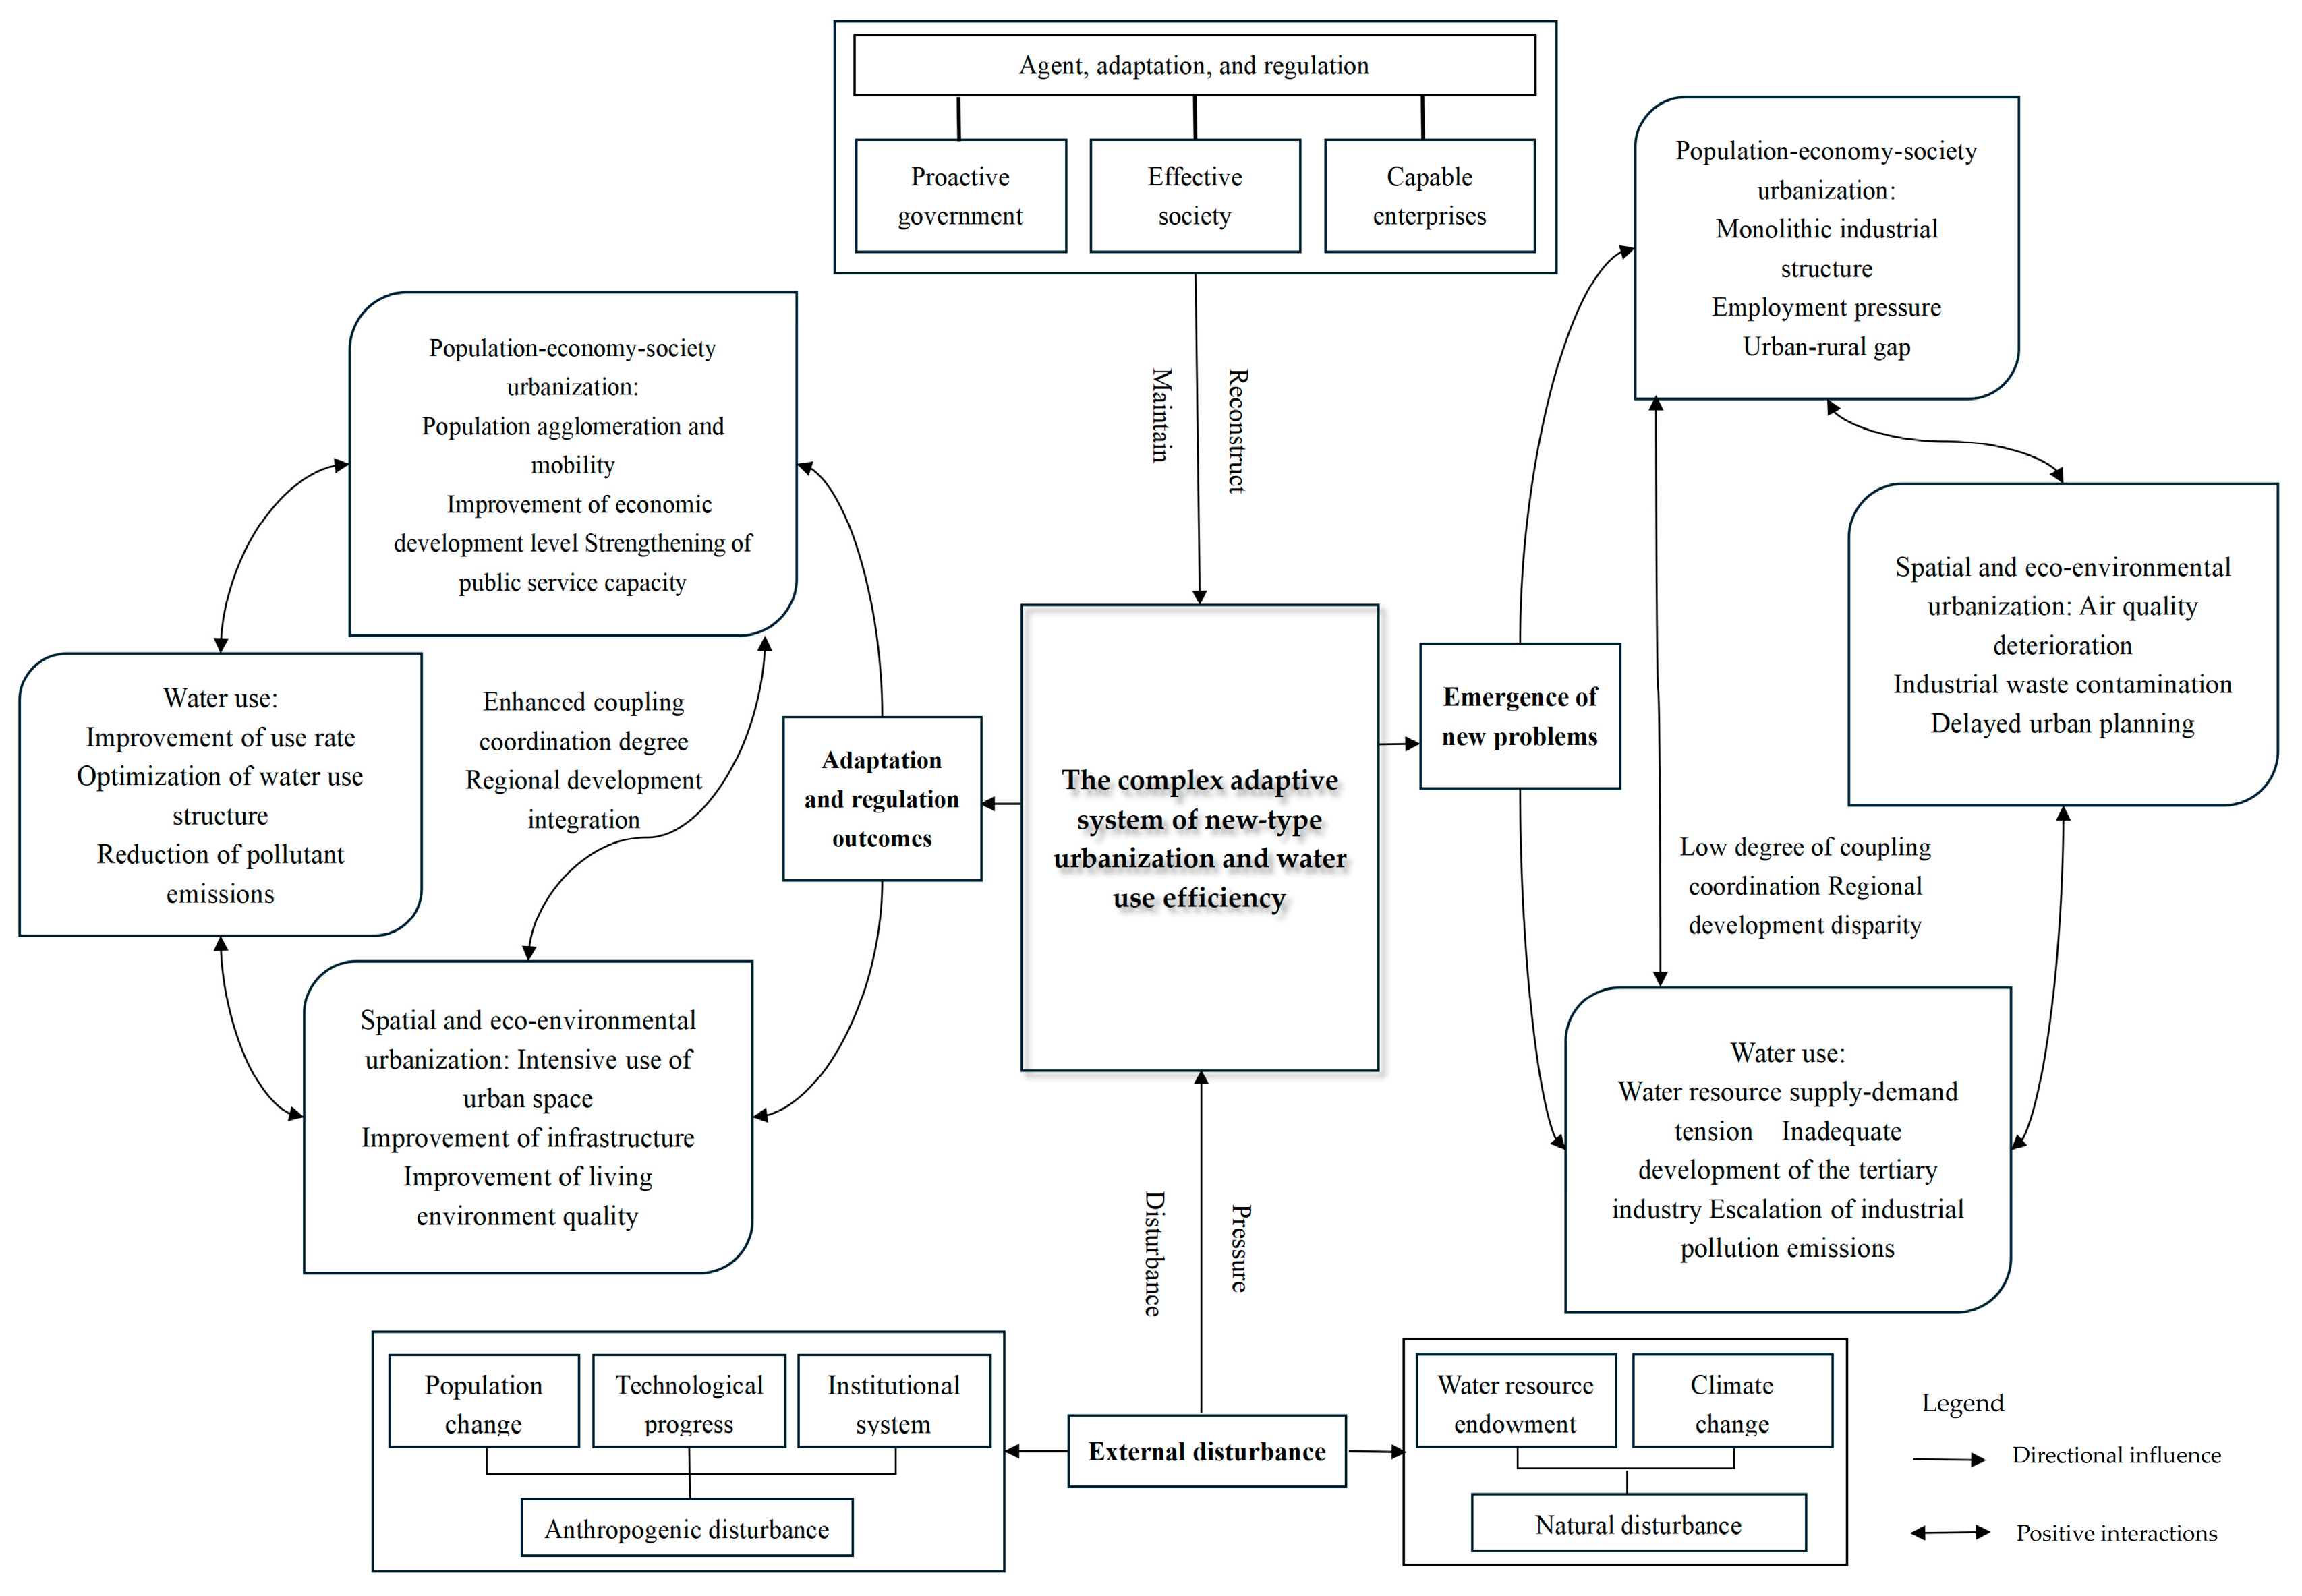
5.5. Analysis of the Mechanisms of Coupled Evolution in Jiangxi and Hunan Provinces
6. Conclusions and Recommendations
6.1. Research Conclusions
- (1)
- Urbanization in the two provinces has transitioned from a phase of accelerated growth to one of steady optimization. While overall urbanization levels continue to rise, imbalances in development within the provinces persist, and there remain significant disparities in the quality of development and the capacity to attract production factors across different regions. The divergence between core and peripheral cities reflects a gradual attenuation of growth momentum as it spreads across different levels; continued structural divergence may exacerbate the risk of weakened development momentum in peripheral cities and widening interprovincial disparities.
- (2)
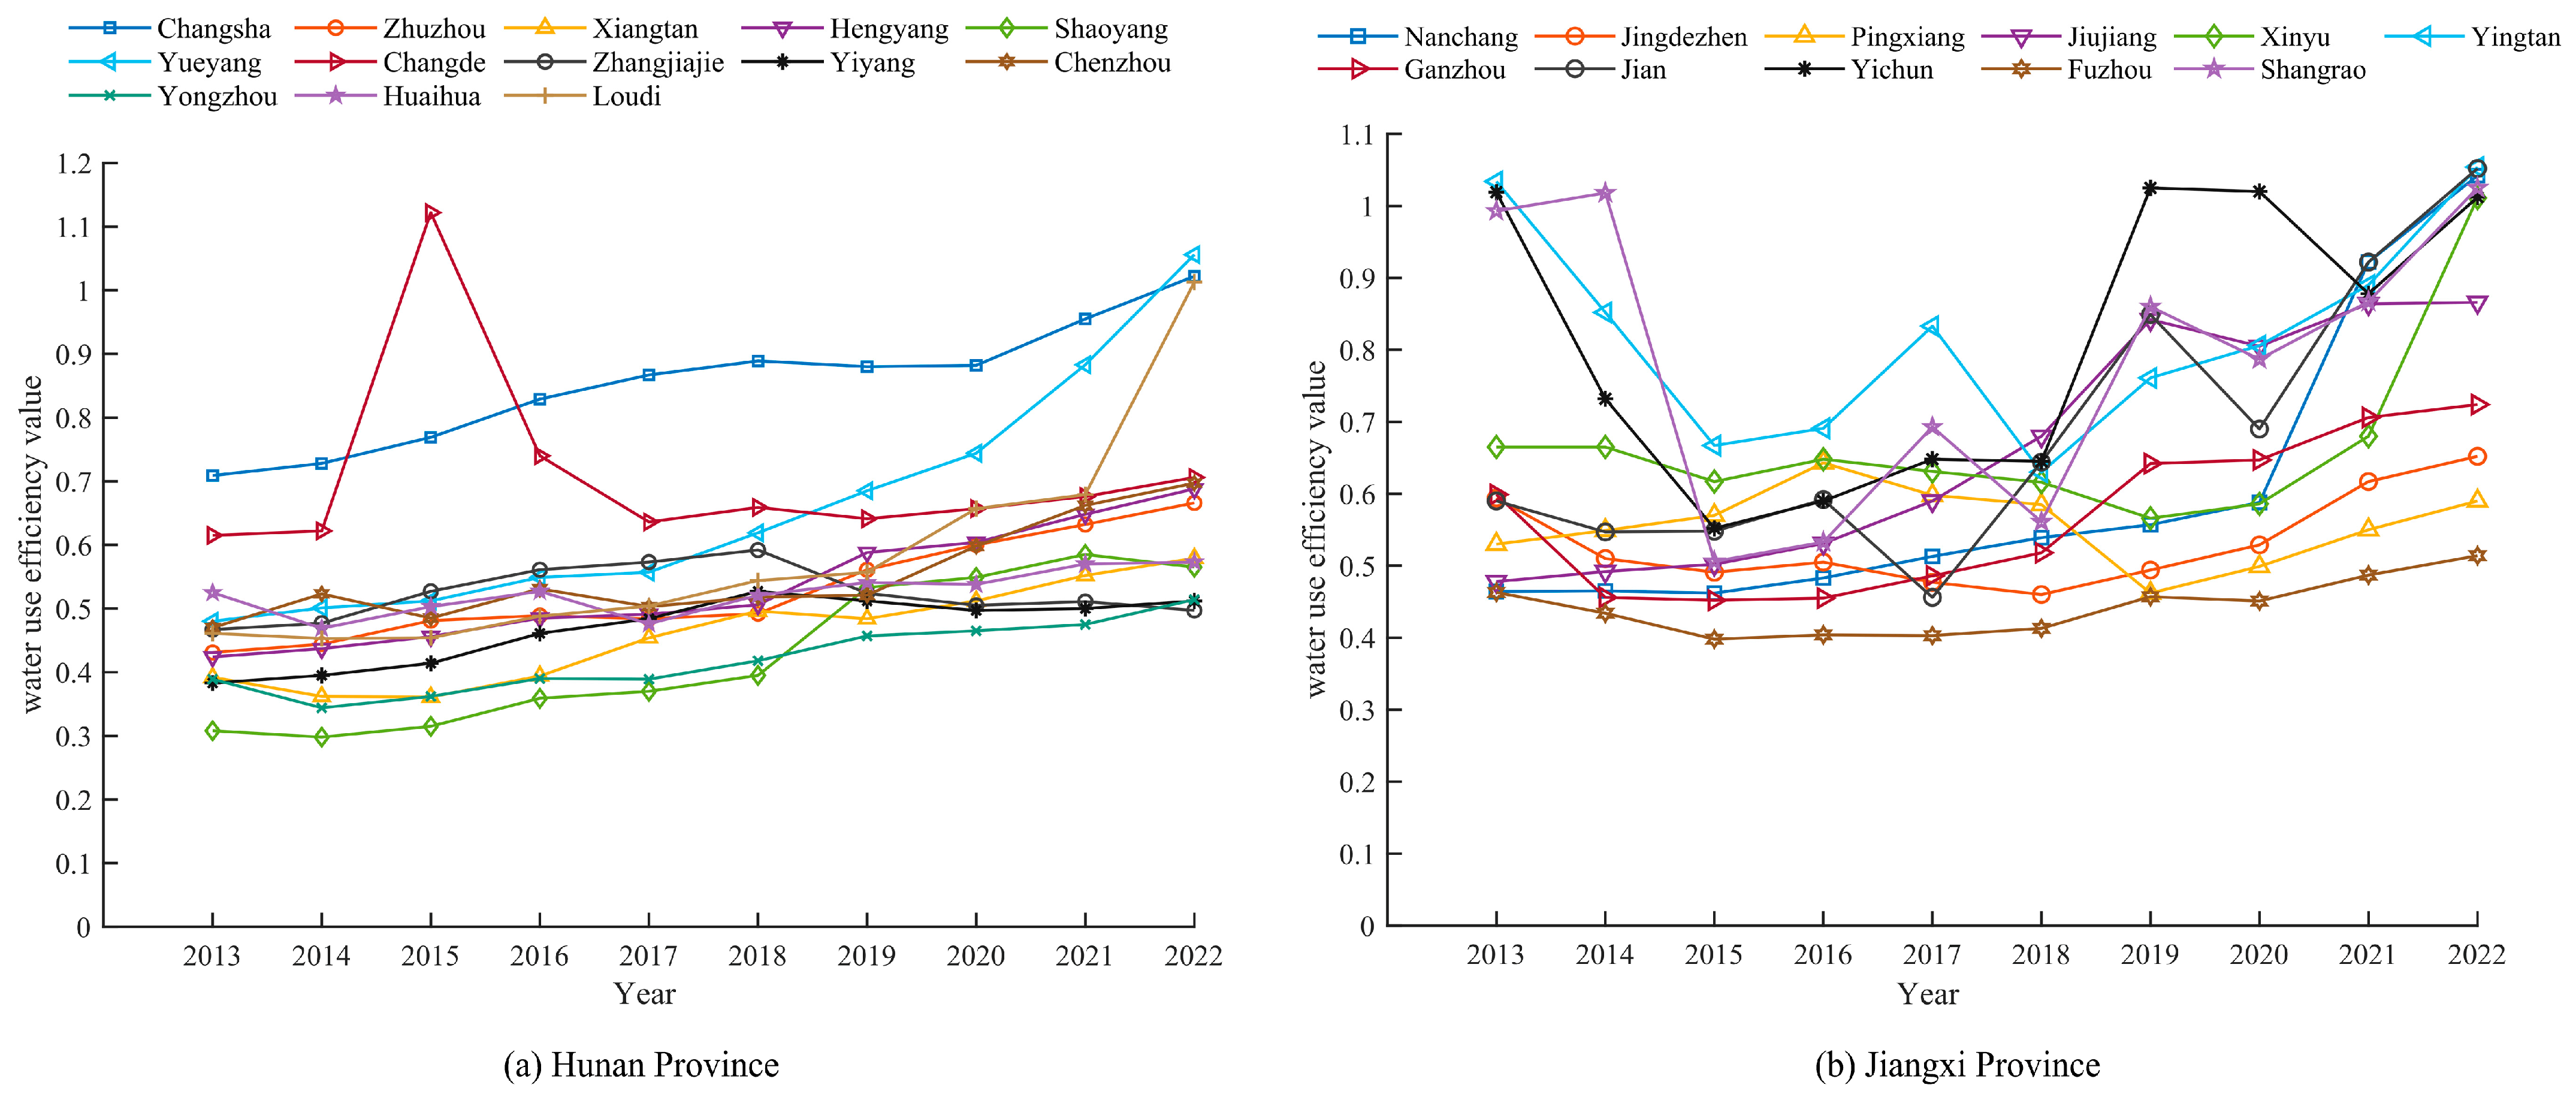
- The water resource utilization efficiency in both provinces showed an improving trend, yet their evolutionary paths differed significantly, with regional imbalance remaining prominent. Jiangxi Province exhibited a clear “decline-first, rise-later” pattern, with relatively large fluctuations during the period. In its early years, the province was dominated by high water-consuming industries and lagged behind in water-saving technologies, which dragged down its efficiency. However, after the National Ecological Civilization Pilot Zone promoted industrial green transformation in 2016, its efficiency gradually recovered. In contrast, Hunan Province demonstrated a more stable and steadily increasing trend. Benefiting from the institutional dividends of the Chang–Zhu–Tan pilot zones, which were released earlier, Hunan achieved more consistent and smoother efficiency improvements, with notable demonstration and spillover effects from its core cities. Nevertheless, intra-provincial disparities remained evident.
- (3)
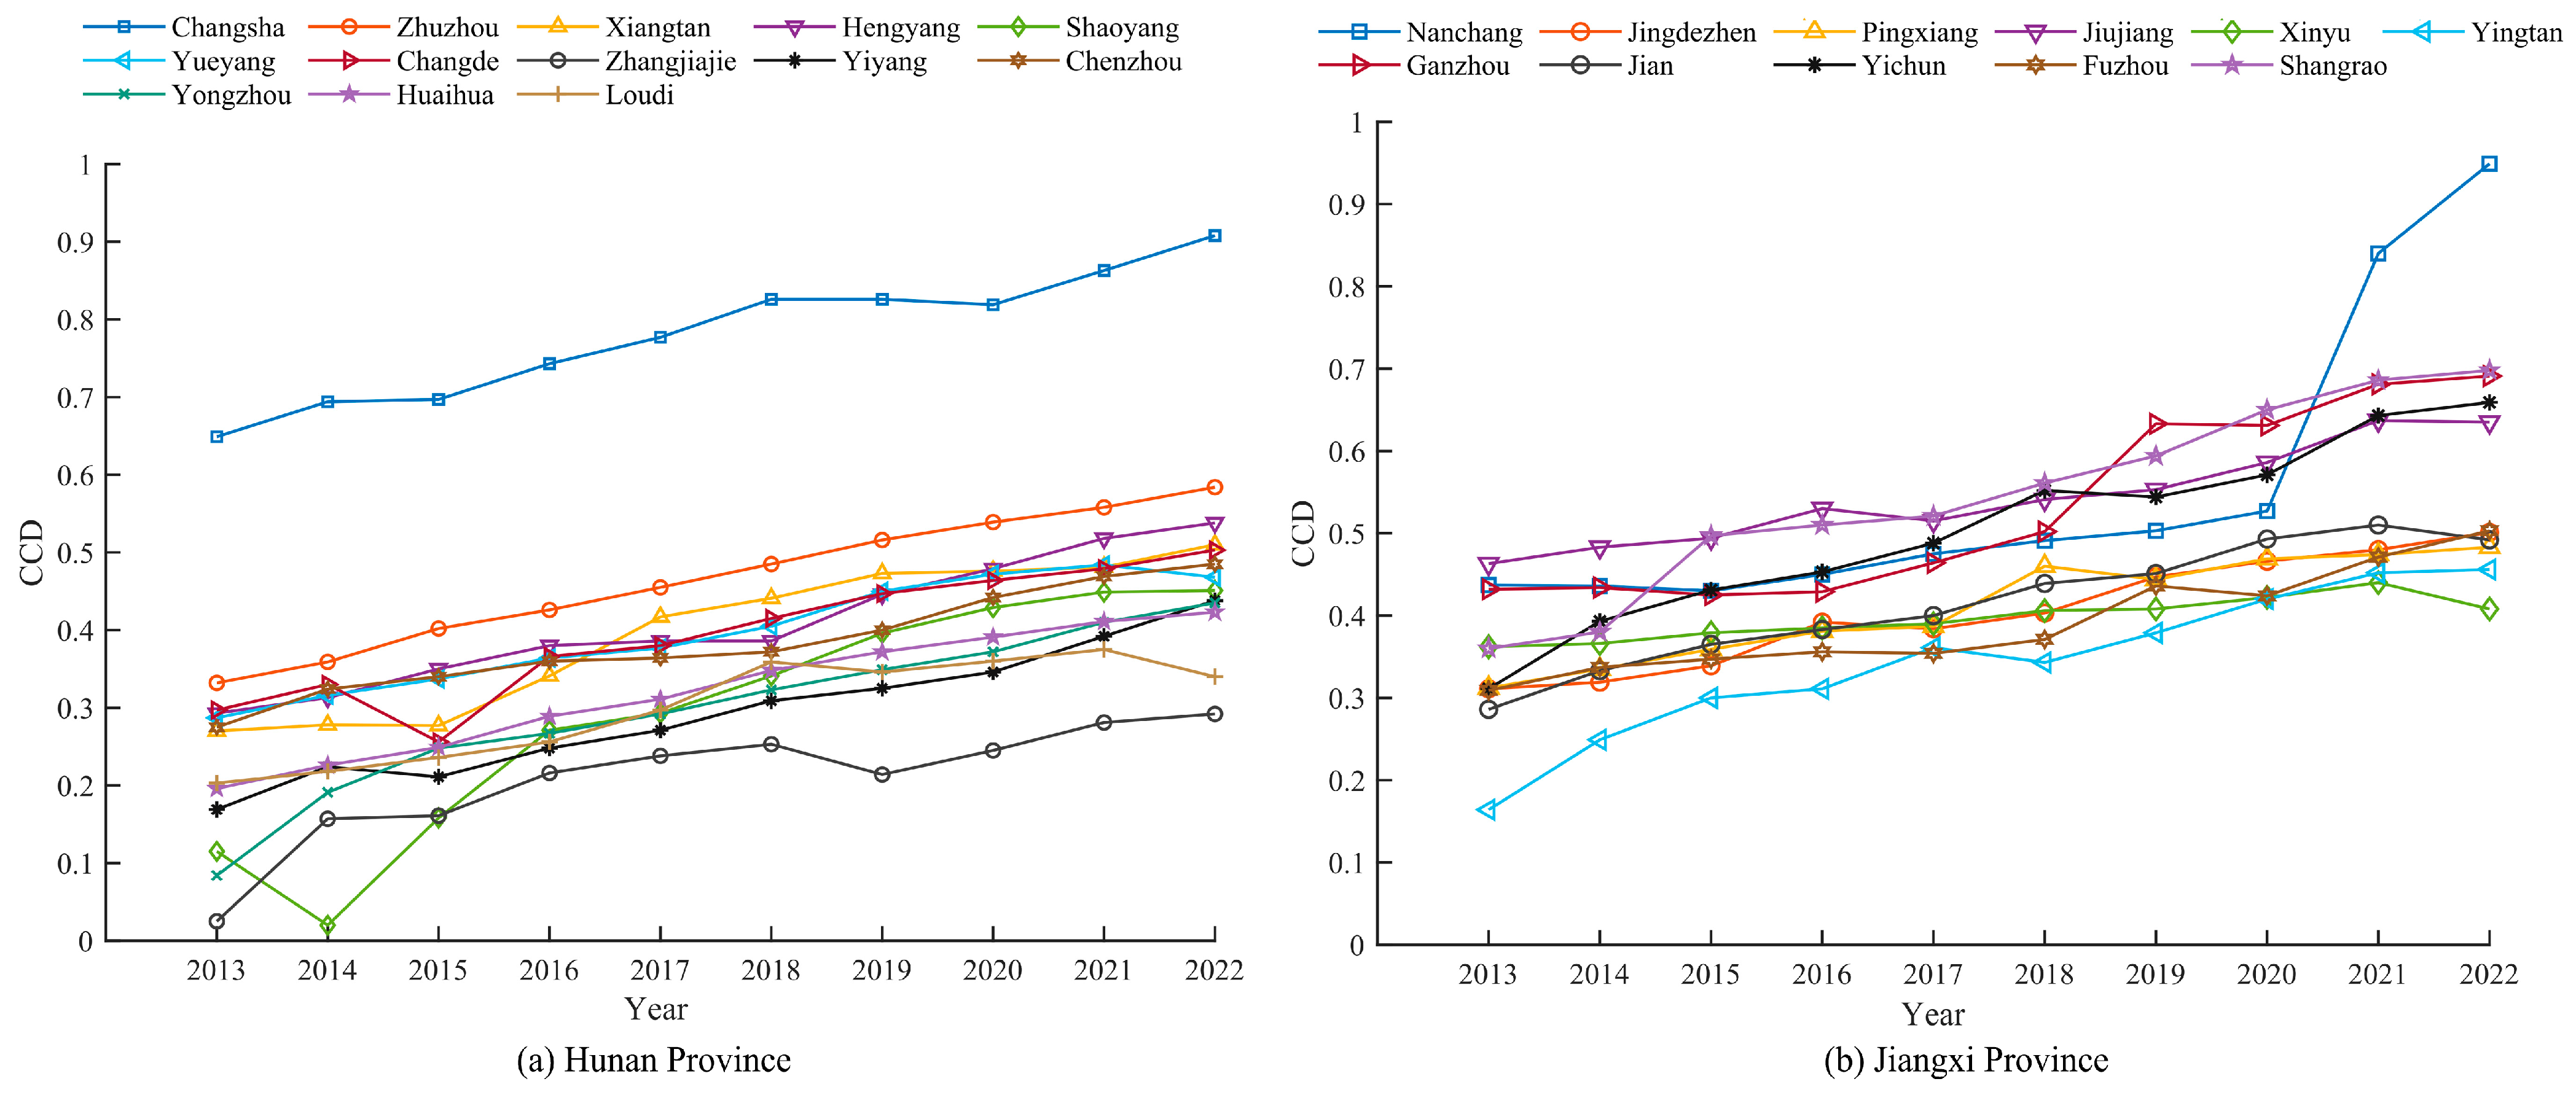
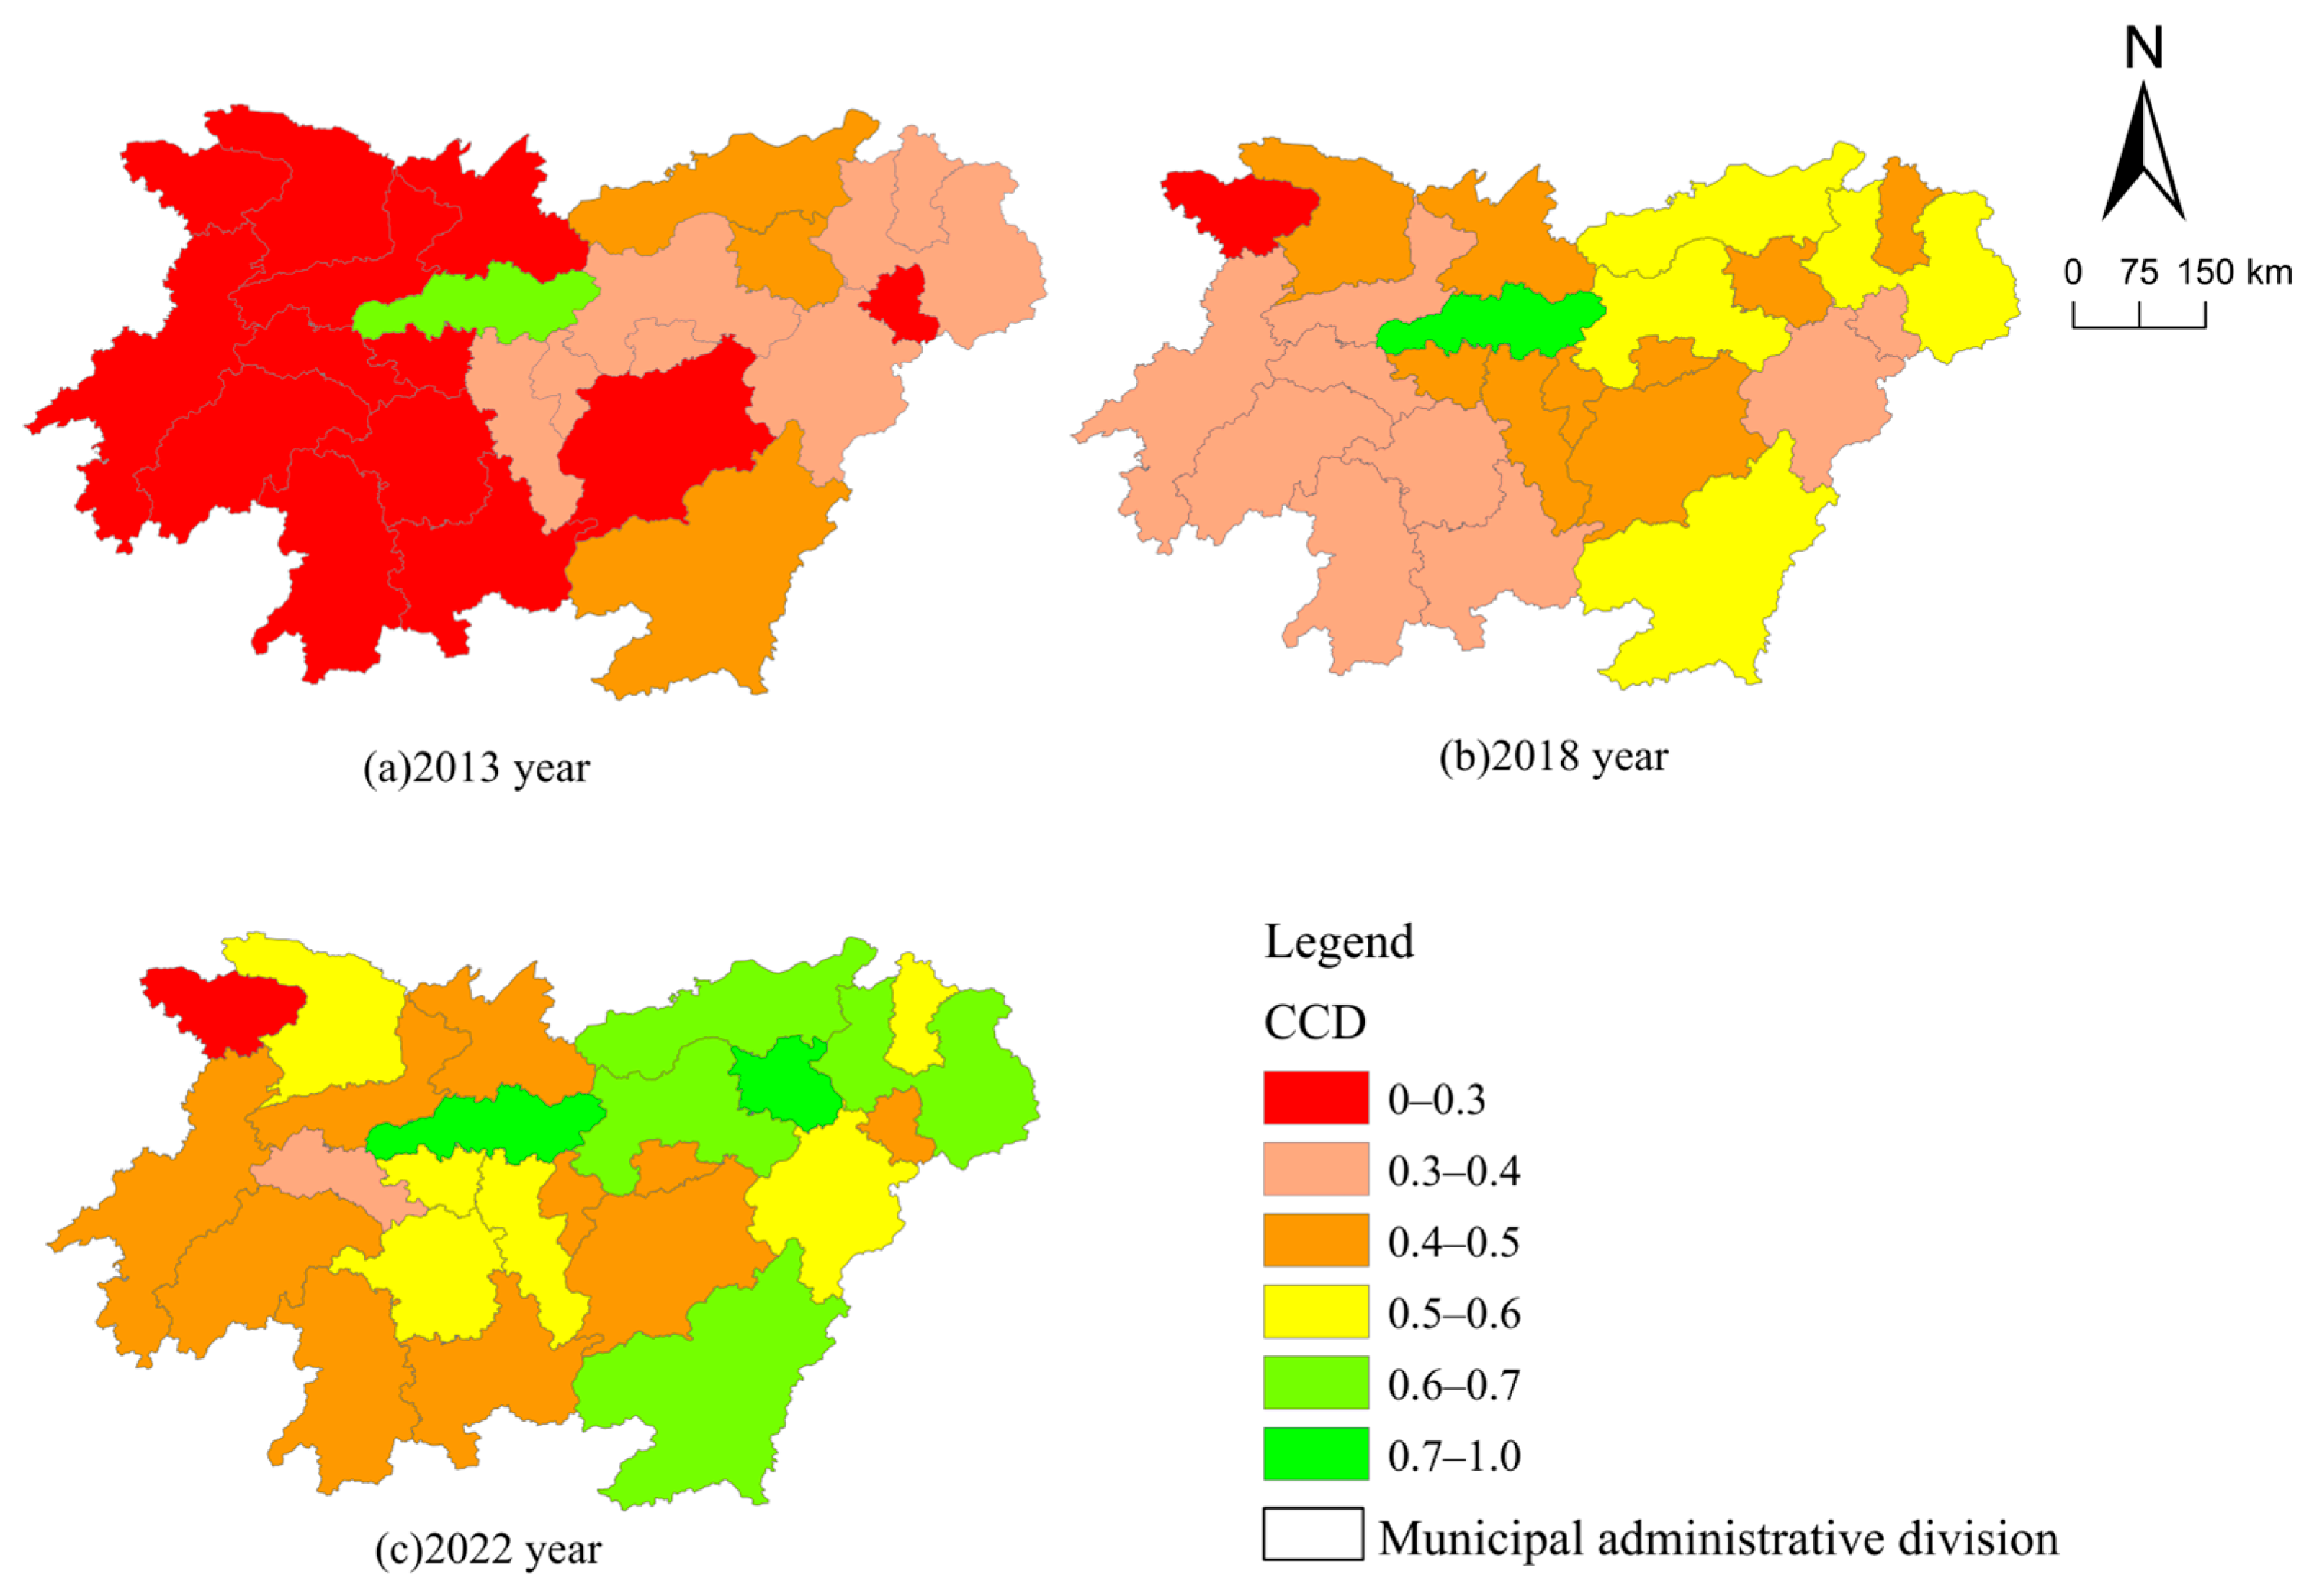
- The degree of coupling and coordination between new-type urbanization and water resource utilization efficiency has generally shown an upward trend, but significant spatial disparities exist, and the two provinces have followed different evolutionary paths. The differences in the spatial evolution paths of the two provinces reflect distinct institutional drivers and spatial transmission mechanisms. Hunan shows a “high-value agglomeration in CZX” pattern, aligned with the integration strategy—policy dividends accumulate in core cities, forming high-value zones. In later stages, some southwestern cities began to follow, supported by abundant water resources. Jiangxi shows a “pioneering breakthroughs in northern and northeastern” pattern, aligned with its spatial development strategy—as the forefront of industrial transfer from the Yangtze River Delta, policy concentration in this region drives gradual southward diffusion to central and southern Jiangxi.
- (4)
- The obstacle factors restricting the improvement of coupling coordination degree in the two provinces present prominent structural characteristics and obvious concentration, and the urbanization expansion pattern and factor allocation efficiency constitute the core. At the urbanization indicator level, completed real estate development investment and total retail sales of consumer goods are the dominant common obstacle factors for both provinces, which demonstrates that current urbanization development still relies heavily on capital expansion and demand-driven growth to a certain extent. Specifically, Jiangxi is more restricted by road infrastructure conditions, whereas Hunan faces greater pressure in terms of population density and clean energy development. From the perspective of water resources utilization efficiency indicators, regional gross domestic product, fixed asset investment and labor input are the most frequent obstacle factors. This reveals that most cities in the two provinces are still in the critical transition period from scale expansion to efficiency improvement, and the economic growth pattern, capital investment orientation, and human resource structure have not yet fully adapted to the constraints of resources and environment. Meanwhile, core cities such as Nanchang and Changsha are additionally confronted with rigid constraints on total water consumption, indicating that these growth pole cities have begun to encounter increasingly prominent resource carrying capacity limits.
6.2. Policy Recommendations
- (1)
- Adhere to region-specific strategies and build a differentiated and coordinated development pattern. Given the pronounced spatial heterogeneity in the coupling coordination level between the two provinces, targeted policy interventions should be formulated in accordance with regional development foundations, resource endowments, and dominant obstacle factors. In Jiangxi Province, greater emphasis should be placed on strengthening the radiating and driving role of Nanchang, while further enhancing the function of secondary growth poles such as Jiujiang, Shangrao, and Ganzhou. Efforts should be made to promote the outward diffusion of high-value areas toward central and southern Jiangxi, thereby facilitating more balanced regional development. In Hunan Province, continued efforts should focus on reinforcing the core leadership role of the CZX urban agglomeration, while simultaneously increasing policy support and capacity-building investment in lower-performing cities such as Zhangjiajie, Shaoyang, Yongzhou, and Huaihua. This approach aims to foster a gradient-coordinated development structure characterized by core cities as drivers, node cities as supports, and lagging regions as complementary catch-up zones.
- (2)
- Transform the factor-driven model and improve water resource utilization efficiency. Based on the obstacle identification results of the water resource utilization efficiency indicator layer, economic scale expansion, capital input intensity, and labor factor allocation are the main constraints on improving water resource utilization efficiency in the two provinces. Therefore, the development model should be shifted from factor-input-driven to technology-innovation- and efficiency-improvement-driven. Nanchang and Ganzhou should optimize the structure of fixed asset investment, accelerate the development of advanced manufacturing, electronic information, new energy, and water-conserving industries, strengthen the cultivation of skilled talents, and improve the efficiency of capital and labor input. Changsha, Zhuzhou, and Xiangtan should leverage their advantages in scientific and technological innovation and advanced manufacturing foundation, promote the digital and green transformation of industries such as construction machinery and rail transit, improve industrial water quota management and smart water affairs construction, and enhance the alignment between capital input and water resource utilization efficiency.
- (3)
- Optimize the urbanization development model and enhance the comprehensive carrying capacity of cities. In response to the main obstacles to urbanization development in the two provinces, urbanization should be promoted to shift from scale expansion to quality improvement. Ganzhou, Yichun, and Shangrao should address the shortcomings in public service facilities such as road transportation and gas pipeline networks, improve the comprehensive carrying capacity of cities, and promote the transformation of real estate investment from incremental development to urban renewal and affordable housing construction. Changsha, Yueyang, and Hengyang should strengthen the interconnection of infrastructure within metropolitan areas and urban agglomerations, optimize the spatial distribution of population and industries, cultivate new growth points such as modern service consumption and digital consumption, and enhance the supporting role of consumption in the development of new-type urbanization.
- (4)
- Cross-regional collaborative governance and dynamic monitoring mechanisms should be improved. Jiangxi and Hunan, both situated in the middle reaches of the Yangtze River, are closely interconnected in terms of resources and the environment. Coupling coordination in this context transcends the internal affairs of individual cities, encompassing instead a broader systematic endeavor that involves urban agglomerations, river basins, and cross-regional factor mobility. Accordingly, collaborative ties between the two provinces should be strengthened in water resource allocation, ecological protection, pollution control, and industrial planning, with a view to gradually institutionalizing cross-regional mechanisms for information sharing, joint governance, and policy coordination. Moreover, building on the coupling coordination degree and obstacle degree models, a regular monitoring and evaluation framework can be established to identify stage- and region-specific constraints in real time, thus informing evidence-based policy adjustments.
6.3. Comparative Analysis and Research Limitation
Author Contributions
Funding
Institutional Review Board Statement
Informed Consent Statement
Data Availability Statement
Conflicts of Interest
Abbreviations
| CCD | Coupling Coordination Degree |
| SDGs | Sustainable Development Goals |
| SFA | Stochastic Frontier Analysis |
| DEA | Data Envelopment Analysis |
| EBM | Epsilon-Based Measure |
| SBM | Slack-based Measure |
| DIF-GMM | Difference Generalized Method of Moments |
| CZX | Changsha–Zhuzhou–Xiangtan |
| DMU | Decision-Making Unit |
References
- Xu, J.R.; Huang, D.C.; Fang, J.M. Regional Total Factor Water Resources Utilization Efficiency and Its Influencing Factors in China. J. Hohai Univ. (Philos. Soc. Sci.) 2021, 23, 77–84. (In Chinese) [Google Scholar]
- Conradie, B.; Piesse, J.; Thirtle, C. District-Level Total Factor Productivity in Agriculture: Western Cape Province, South Africa, 1952–2002. Agric. Econ. 2009, 40, 265–280. [Google Scholar] [CrossRef]
- Watto, M.A.; Mugera, A.W. Econometric Estimation of Groundwater Irrigation Efficiency of Cotton Cultivation Farms in Pakistan. J. Hydrol. Reg. Stud. 2015, 4, 193–211. [Google Scholar] [CrossRef]
- Bindra, S.P.; Muntasser, M.; El Khweldi, M.; El Khweldi, A. Water Use Efficiency for Industrial Development in Libya. Desalination 2003, 158, 167–178. [Google Scholar] [CrossRef]
- Aida, K.; Cooper, W.W.; Pastor, J.T.; Sueyoshi, T. Evaluating Water Supply Services in Japan with RAM: A Range-Adjusted Measure of Inefficiency. Omega 1998, 26, 207–232. [Google Scholar] [CrossRef]
- Kong, Y.; Abliz, A.; Guo, D.; Liu, X.; Li, J.; Nurahmat, B. Coupling Coordination Development between Cultivated Land and Agricultural Water Use Efficiency in Arid Regions: A Case Study of the Turpan–Hami Basin. Agriculture 2025, 15, 1153. [Google Scholar] [CrossRef]
- Zhou, G.; Yu, J.; Yue, Q.; Xu, S.; Chen, X. A Multi-Sectoral Framework for Assessing Water Use Efficiency and Its Drivers: Insights from China. Hydrol. Sci. J. 2026, 71, 216–228. [Google Scholar] [CrossRef]
- Ma, H.L.; Shi, C.L.; Chou, N.-T. China’s Water Utilization Efficiency: An Analysis with Environmental Considerations. Sustainability 2016, 8, 516. [Google Scholar] [CrossRef]
- Zhang, Y.; Gao, C.; Liu, C.; Li, P.; Chen, X.; Liang, Z. Evaluation of Agricultural Water Resources Allocation Efficiency and Its Influencing Factors in the Yellow River Basin. Agronomy 2023, 13, 2449. [Google Scholar] [CrossRef]
- Chen, S.J.; Cao, Y.Y.; Li, J. The Effect of Water Rights Trading Policy on Water Resource Utilization Efficiency: Evidence from a Quasi-Natural Experiment in China. Sustainability 2021, 13, 5281. [Google Scholar] [CrossRef]
- Wang, R.; Wang, F.; Bie, F. Does Green Finance and Water Resource Utilization Efficiency Drive High-Quality Economic Development? Sustainability 2022, 14, 15733. [Google Scholar] [CrossRef]
- Yang, P.Y.; Tang, F.P.; Liu, Z.F.; Mao, J. Influencing mechanisms and spatial effects of water use efficiency on urban economic development. Chin. J. Popul. Resour. Environ. 2025, 35, 176–190. (In Chinese) [Google Scholar]
- Duo, H.; Wang, N.; Qiao, Y.; Li, Z.; Yang, G.; Liu, H.; Chen, G.; Li, F. Industrial Water Consumption Efficiency and Driving Factors Based on the Super-Efficient SBM and Tobit Approach. Sci. Rep. 2025, 15, 12461. [Google Scholar] [CrossRef] [PubMed]
- Yang, T.; Tian, G. Measurement and Improvement Path of Green Configuration Efficiency of Water Resources in the Context of Rapid Urbanization. Sustainability 2026, 18, 2677. [Google Scholar] [CrossRef]
- Dempsey, N.; Brown, C.; Bramley, G. The Key to Sustainable Urban Development in UK Cities? The Influence of Density on Social Sustainability. Prog. Plan. 2012, 77, 89–141. [Google Scholar] [CrossRef]
- Yin, Y.; Chen, T.; Sun, Y.; Deng, Q. The Impact of Economic Transformation and Public Services in New-Type Urbanization on Rural-Urban Income Gaps in Western China. J. Reg. City Plan. 2025, 36, 205–219. [Google Scholar] [CrossRef]
- Węziak-Białowolska, D. Quality of Life in Cities—Empirical Evidence in Comparative European Perspective. Cities 2016, 58, 87–96. [Google Scholar] [CrossRef]
- Yuan, C.; Zhang, B.; Xu, J.; Lyu, D. Impact of New-Type Urbanization Pilot Policy on Public Service Provision: Evidence from China. Cities 2025, 161, 105853. [Google Scholar] [CrossRef]
- Li, M.; Yang, H. Exploring Spatial-Temporal Heterogeneity in New-Type Urbanization’s Impact on Health Expenditure: A GTWR Analysis. Int. J. Health Geogr. 2025, 24, 26. [Google Scholar] [CrossRef] [PubMed]
- Sheng, N.; Tang, U.W. The First Official City Ranking by Air Quality in China—A Review and Analysis. Cities 2016, 51, 139–149. [Google Scholar] [CrossRef]
- Yu, Y.; Zhao, K.; Du, Y. Nexus between New-Type Urbanization, Economic Development, and Haze Pollution in China: A Spatial Analysis. J. Urban Plan. Dev. 2024, 150, 04024043. [Google Scholar] [CrossRef]
- Wang, K.; Fang, C. Revealing the Synergy between Carbon Reduction and Pollution Control in the Process of New-Type Urbanization: Evidence from China’s Five Major Urban Agglomerations. Sustain. Cities Soc. 2025, 120, 106154. [Google Scholar] [CrossRef]
- Godschalk, D.R. Urban Hazard Mitigation: Creating Resilient Cities. Nat. Hazards Rev. 2003, 4, 136–143. [Google Scholar] [CrossRef]
- Liu, N.; Wang, S.; Su, F.; Ye, J. Research on Coupling Coordination of China’s New-Type Urbanization and Urban Resilience—Taking Yangtze River Economic Belt as an Example. Sustainability 2023, 15, 456. [Google Scholar] [CrossRef]
- Batty, M.; Axhausen, K.W.; Giannotti, F.; Pozdnoukhov, A.; Bazzani, A.; Wachowicz, M.; Ouzounis, G.; Portugali, Y. Smart Cities of the Future. Eur. Phys. J. Spec. Top. 2012, 214, 481–518. [Google Scholar] [CrossRef]
- Chen, L.; Zhong, C.; Li, C. Research on the Impact of the Digital Economy on China’s New-Type Urbanization: Based on Spatial and Mediation Models. Sustainability 2022, 14, 14843. [Google Scholar] [CrossRef]
- Zhang, W.W.; Ma, Y.Q.; Li, X.W.; Zhuo, H. China′s New-type Urbanization from the Perspective of Modernization. Urban Dev. Stud. 2021, 28, 8–13. (In Chinese) [Google Scholar] [CrossRef]
- Wu, D.Y.; Zhao, L.; Gao, W.J. Essential Characteristics and Evaluation of New-style Urbanization. J. Beihua Univ. (Soc. Sci.) 2013, 14, 33–37. (In Chinese) [Google Scholar] [CrossRef]
- Fang, C.L. Basic rules and key paths for high-quality development of the new urbanization in China. Geogr. Res. 2019, 38, 13–22. (In Chinese) [Google Scholar]
- Li, X.J.; Luo, Q. The Coordinating Ideas of New-form Urbanization. Chin. J. Popul. Resour. Environ. 2014, 24, 47–53. (In Chinese) [Google Scholar]
- Song, Y.; Gao, Y.; Zhang, S.; Dong, H.; Liu, X. Research on the Coupling Coordination and Driving Mechanisms of New-Type Urbanization and the Ecological Environment in China’s Yangtze River Delta. Sustainability 2024, 16, 5308. [Google Scholar] [CrossRef]
- Li, T.; Liu, Y.; Ouyang, X.; Zhou, Y.; Bi, M.; Wei, G. Sustainable Development of Urban Agglomerations around Lakes in China: Achieving SDGs by Regulating Ecosystem Service Supply and Demand through New-Type Urbanization. Habitat Int. 2024, 153, 103206. [Google Scholar] [CrossRef]
- Li, S.; Yan, J.; Pei, Q.; Sha, J.; Liu, F. Dynamic Relationship between Water Resources and New Urbanization Based on a Vector Autoregressive Model: A Case Study of Hebei Province, China. Front. Environ. Sci. 2022, 10, 941726. [Google Scholar] [CrossRef]
- Li, S.P.; Zhang, D. EKC Research on the Relationship Between Urbanization Development and Environmental Pollution in Hunan Province. Syst. Eng. 2014, 32, 152–158. (In Chinese) [Google Scholar]
- Li, Q.S.; Su, W.C.; Zhang, F.T. Study on the Decoupling Relationship between New Urbanization and Water Resources Utilization Efficiency: Taking Typical Counties in the Chongqing Section of the Three Gorges Reservoir Area as an Example. J. Chongqing Norm. Univ. (Nat. Sci. Ed.) 2023, 40, 47–58. (In Chinese) [Google Scholar]
- Hubacek, K.; Guan, D.; Barrett, J.; Wiedmann, T. Environmental Implications of Urbanization and Lifestyle Change in China: Ecological and Water Footprints. J. Clean. Prod. 2009, 17, 1241–1248. [Google Scholar] [CrossRef]
- Zhang, L.X.; Yan, S.Q.; Shao, Z.G. Analysis on Coordinated Development of Water Resources Utilization Efficiency and New-Type Urbanization of Seven Major River Systems. J. Xi’an Univ. (Nat. Sci. Ed.) 2025, 28, 96–108. (In Chinese) [Google Scholar]
- Ding, X.; Cai, Z.; Fu, Z. Does the New-Type Urbanization Construction Improve the Efficiency of Agricultural Green Water Utilization in the Yangtze River Economic Belt? Environ. Sci. Pollut. Res. 2021, 28, 64103–64112. [Google Scholar] [CrossRef] [PubMed]
- Min, X.; Liu, J.; Liu, Y.; Zhou, J.; Zhao, J. Coupling Patterns between Urbanization and the Water Environment: A Case Study of Neijiang City, Sichuan Province, China. Sustainability 2025, 17, 6993. [Google Scholar] [CrossRef]
- Wang, L.; Zeng, X.; Huang, X. Dynamic Coupling Analysis of New-type Urbanization and Water Resources Security: A System Dynamics-based Empirical Study from China. Land Degrad. Dev. 2026, 37, 81–103. [Google Scholar] [CrossRef]
- Xiong, Y.; Li, C.; Zou, M.; Xu, Q. Investigating into the Coupling and Coordination Relationship between Urban Resilience and Urbanization: A Case Study of Hunan Province, China. Sustainability 2022, 14, 5889. [Google Scholar] [CrossRef]
- Wan, H.; He, G.; Li, B.; Zeng, J.; Cai, Y.; Shen, X.; Yang, Z. Coupling Coordination Relationship between Urbanization and Water Environment in China. J. Clean. Prod. 2024, 472, 143423. [Google Scholar] [CrossRef]
- Tang, L.; Zhou, Z.; Zhao, H.; Qian, Z.; Hou, S.; Liu, B. Spatio-Temporal Evolution and Influencing Factors of the Coupling Coordination between Water Ecological Resilience and New Urbanization: A Case Study of the Yangtze River Economic Belt. J. Nat. Conserv. 2026, 89, 127123. [Google Scholar] [CrossRef]
- Huang, X.; Shen, J.; Sun, F.; Wang, L.; Zhang, P.; Wan, Y. Study on the Spatial and Temporal Distribution of the High–Quality Development of Urbanization and Water Resource Coupling in the Yellow River Basin. Sustainability 2023, 15, 12270. [Google Scholar] [CrossRef]
- Ma, Y.; Yu, Z.; Liu, W.; Ren, Q. Exploring the Coupling Coordination Relationship and Obstacle Factors of Rural Revitalization, New-Type Urbanization, and Digital Economy in China. PLoS ONE 2025, 20, e0313125. [Google Scholar] [CrossRef] [PubMed]
- Holland, J.H. Adaptation in Natural and Artificial Systems: An Introductory Analysis with Applications to Biology, Control, and Artificial Intelligence; The MIT Press: Cambridge, MA, USA, 1992. [Google Scholar]
- Yin, M.; Xu, J. Characterization and grouping analysis of economic resilience of county-level cities in Jiangsu Province from the perspective of complex adaptive systems. Trop. Geogr. 2024, 44, 2001–2014. (In Chinese) [Google Scholar]
- Wang, Y. Urban Land and Sustainable Resource Use: Unpacking the Countervailing Effects of Urbanization on Water Use in China, 1990–2014. Land Use Policy 2020, 90, 104307. [Google Scholar] [CrossRef]
- Li, M.H.; Lu, C. Coupling and Coordination Relationship Between New Urbanization, Economic Development, and Ecological Water Environment in Huaihe River Economic Belt, and Their Driving Factors. Bull. Soil Water Conserv. 2023, 43, 282–293. (In Chinese) [Google Scholar] [CrossRef]
- Ding, X.H.; He, J.H.; Wang, L.Y. Inter-provincial water resources utilization efficiency and its driving factors considering undesirable outputs: Based on SE-SBM and Tobit model. Chin. J. Popul. Resour. Environ. 2018, 28, 157–164. (In Chinese) [Google Scholar]
- Wang, S.J.; Kong, W.; Ren, L.; Zhi, D.-D.; Dai, B.-T. Research on misuses and modification of coupling coordination degree model in China. J. Nat. Resour. 2021, 36, 793–810. (In Chinese) [Google Scholar] [CrossRef]
- Ren, Q.R.; Yu, E.Y. Coupling analysis on coordinated development of ecological environment and social economic system in Gansu Province. Acta Ecol. Sin. 2021, 41, 2944–2953. (In Chinese) [Google Scholar] [CrossRef]
- Zhang, Y.; Khan, S.U.; Swallow, B.; Liu, W.; Zhao, M. Coupling Coordination Analysis of China’s Water Resources Utilization Efficiency and Economic Development Level. J. Clean. Prod. 2022, 373, 133874. [Google Scholar] [CrossRef]
- Bi, Y.; Zheng, L.; Wang, Y.; Li, J.; Yang, H.; Zhang, B. Coupling Relationship between Urbanization and Water-Related Ecosystem Services in China’s Yangtze River Economic Belt and Its Socio-Ecological Driving Forces: A County-Level Perspective. Ecol. Indic. 2023, 146, 109871. [Google Scholar] [CrossRef]




| Indicator | Hunan Province | Jiangxi Province | ||||||||
|---|---|---|---|---|---|---|---|---|---|---|
| Similarities | Geographic Location | As landlocked provinces located in central China, neither of the two provinces borders the sea nor adjoins international frontiers, and consequently they face comparable geographical conditions. | ||||||||
| Policy Background | Both provinces undertake national strategies including new-type urbanization, Yangtze Economic Belt development, and Yangtze River protection, and serve as key ecological function zones. | |||||||||
| History and Culture | Both are old revolutionary base areas with abundant revolutionary heritage. | |||||||||
| Geographic Factors | The two provinces are separated by the Luoxiao Mountains, exhibiting a highly symmetrical, semi-enclosed geomorphological configuration. Both are flanked by mountain ranges on their eastern, western, and southern peripheries, while opening northward toward the Yangtze River. They are both situated within the Jiangnan Hills region and share a common southern border with Guangdong Province. | |||||||||
| Resource Endowment | Water Resources | Both have a mid-subtropical humid monsoon climate with abundant rainfall and water resources. Hunan has Dongting Lake; Jiangxi has Poyang Lake—both are among China’s largest freshwater lakes. The Xiang, Zi, Yuan, and Li rivers flow into Dongting; the Gan, Fu, Xin, Rao, and Xiu rivers flow into Poyang. | ||||||||
| Mineral Resources | Both are famous “nonferrous metal bases” in China, rich in mineral resources. | |||||||||
| Agricultural Resources | Both provinces are well-known as “lands of fish and rice” with abundant produce, and rice serves as the primary staple crop, holding a comparative advantage in their agricultural production. | |||||||||
| Forest Resources | Both have rich forest resources, ranking high nationally in forest biomass, and serve as similar green ecological barriers. | |||||||||
| Heterogeneity | Indicator | Hunan Province | Jiangxi Province | China | ||||||
| 2013 year | 2022 year | 2013 year | 2022 year | 2013 year | 2022 year | |||||
| Urban Population | 32.09 million | 39.83 million | 22.10 million | 28.11 million | 731.11 million | 920.71 million | ||||
| Urbanization Rate | 47.96% | 60.31% | 48.87% | 62.07% | 53.73% | 65.22% | ||||
| GDP per Capita | CNY 36,763 | CNY 73,598 | CNY 31,771 | CNY 70,923 | CNY 41,908 | CNY 85,698 | ||||
| Built-up Area | 1504.95 km2 | 2104.99 km2 | 1151.42 km2 | 1789.49 km2 | 47,855.28 km2 | 63,676.40 km2 | ||||
| Green Coverage | 11.73% | 42.32% | 10.53% | 46.63% | 12.72% | 42.96% | ||||
| Water per Capita | 2373.6 m3/person | 2546.2 m3/person | 3155.3 m3/person | 3441.0 m3/person | 2059.7 m3/person | 1918.2 m3/person | ||||
| Coupled System | Primary Indicators | Secondary Indicators | Unit | Directionality | Weight |
|---|---|---|---|---|---|
| New-type urbanization | population urbanization | urbanization rate of population (U1) | % | + | 0.049 |
| population density (U2) | People/km2 | + | 0.054 | ||
| Share of employment in the tertiary industry (U3) | % | + | 0.007 | ||
| economic urbanization | per capita gross regional product (U4) | CNY | + | 0.032 | |
| local general public budget revenue (U5) | 10,000 CNY | + | 0.041 | ||
| share of secondary and tertiary industry output in Gross Domestic Product (GDP) (U6) | % | + | 0.028 | ||
| social urbanization | number of hospital and health center beds (U7) | number | + | 0.039 | |
| science and technology expenditure (U8) | 10,000 CNY | + | 0.024 | ||
| number of internet users (U9) | number | + | 0.055 | ||
| total retail sales of consumer goods (U10) | 10,000 CNY | + | 0.132 | ||
| gas penetration rate (U11) | % | + | 0.100 | ||
| spatial urbanization | completed real estate development investment (U12) | 10,000 CNY | + | 0.151 | |
| per capita urban road area (U13) | m2/capita | + | 0.110 | ||
| environmental urbanization | green coverage rate of built-up areas (U14) | % | + | 0.068 | |
| per capita park green space area (U15) | m2/capita | + | 0.088 | ||
| comprehensive utilization rate of general industrial solid waste (U16) | % | + | 0.018 | ||
| harmless treatment rate of domestic waste (U17) | % | + | 0.003 | ||
| Water use efficiency | input | total water consumption (X1) | 100 million m3 | + | 0.181 |
| fixed asset investment (X2) | 10,000 CNY | + | 0.224 | ||
| labor input (X3) | person | + | 0.267 | ||
| output | gross regional product (Y1) | 10,000 CNY | + | 0.310 | |
| municipal waste water discharge (Y2) | 100 million m3 | - | 0.019 |
| Stage | CCD (D) | Coupling Coordination Types |
|---|---|---|
| dysfunctional decline stage | (0–0.1] | extreme dysfunction |
| (0.1–0.2] | severe dysfunction | |
| (0.2–0.3] | moderate dysfunction | |
| (0.3–0.4] | mild dysfunction | |
| transitional stage | (0.4–0.5] | on the verge of dysfunction |
| (0.5–0.6] | barely coordinated | |
| coordinated development stage | (0.6–0.7] | primary coordinated stage |
| (0.7–0.8] | intermediate coordinated stage | |
| (0.8–0.9] | good coordination stage | |
| (0.9–1.0] | high-quality coordinated stage |
| Province | District | 2013 | 2014 | 2015 | 2016 | 2017 | 2018 | 2019 | 2020 | 2021 | 2022 |
|---|---|---|---|---|---|---|---|---|---|---|---|
| Hunan | Changsha | 0.448 | 0.493 | 0.504 | 0.561 | 0.603 | 0.658 | 0.729 | 0.764 | 0.854 | 0.911 |
| Zhuzhou | 0.184 | 0.200 | 0.228 | 0.245 | 0.264 | 0.290 | 0.316 | 0.337 | 0.357 | 0.384 | |
| Xiangtan | 0.152 | 0.180 | 0.190 | 0.202 | 0.236 | 0.255 | 0.276 | 0.281 | 0.288 | 0.313 | |
| Hengyang | 0.163 | 0.174 | 0.195 | 0.213 | 0.218 | 0.218 | 0.263 | 0.290 | 0.325 | 0.346 | |
| Shaoyang | 0.119 | 0.147 | 0.165 | 0.177 | 0.183 | 0.213 | 0.225 | 0.249 | 0.265 | 0.266 | |
| Yueyang | 0.157 | 0.173 | 0.186 | 0.203 | 0.211 | 0.233 | 0.271 | 0.294 | 0.322 | 0.343 | |
| Chande | 0.159 | 0.180 | 0.189 | 0.207 | 0.214 | 0.242 | 0.267 | 0.281 | 0.295 | 0.318 | |
| Zhangjiajie | 0.093 | 0.104 | 0.103 | 0.119 | 0.128 | 0.135 | 0.120 | 0.134 | 0.152 | 0.159 | |
| Yiyang | 0.112 | 0.132 | 0.125 | 0.138 | 0.148 | 0.168 | 0.178 | 0.191 | 0.222 | 0.254 | |
| Chenzhou | 0.151 | 0.177 | 0.188 | 0.201 | 0.203 | 0.209 | 0.228 | 0.260 | 0.285 | 0.301 | |
| Yongzhou | 0.095 | 0.123 | 0.144 | 0.151 | 0.163 | 0.179 | 0.194 | 0.208 | 0.233 | 0.252 | |
| Huaihua | 0.113 | 0.127 | 0.136 | 0.156 | 0.171 | 0.193 | 0.208 | 0.222 | 0.236 | 0.245 | |
| Loudi | 0.118 | 0.125 | 0.133 | 0.141 | 0.162 | 0.199 | 0.190 | 0.200 | 0.212 | 0.220 | |
| Jiangxi | Nanchang | 0.408 | 0.446 | 0.490 | 0.540 | 0.623 | 0.695 | 0.730 | 0.773 | 0.825 | 0.836 |
| Jingdezhen | 0.167 | 0.175 | 0.187 | 0.222 | 0.216 | 0.228 | 0.259 | 0.275 | 0.292 | 0.311 | |
| Pingxiang | 0.170 | 0.183 | 0.200 | 0.216 | 0.219 | 0.274 | 0.274 | 0.275 | 0.282 | 0.292 | |
| Jiujiang | 0.269 | 0.293 | 0.318 | 0.338 | 0.317 | 0.348 | 0.380 | 0.405 | 0.464 | 0.462 | |
| Xinyu | 0.202 | 0.205 | 0.213 | 0.219 | 0.222 | 0.233 | 0.234 | 0.245 | 0.263 | 0.276 | |
| Yingtan | 0.112 | 0.136 | 0.160 | 0.167 | 0.210 | 0.188 | 0.219 | 0.256 | 0.294 | 0.331 | |
| Ganzhou | 0.253 | 0.290 | 0.342 | 0.349 | 0.415 | 0.440 | 0.506 | 0.550 | 0.607 | 0.648 | |
| Ji an | 0.153 | 0.183 | 0.204 | 0.216 | 0.226 | 0.260 | 0.287 | 0.307 | 0.352 | 0.364 | |
| Yichun | 0.199 | 0.228 | 0.250 | 0.268 | 0.300 | 0.353 | 0.407 | 0.432 | 0.472 | 0.519 | |
| Fuzhou | 0.170 | 0.187 | 0.203 | 0.218 | 0.232 | 0.259 | 0.283 | 0.316 | 0.342 | 0.375 | |
| Shangrao | 0.232 | 0.254 | 0.295 | 0.308 | 0.332 | 0.376 | 0.421 | 0.462 | 0.513 | 0.561 |
| Province | District | 2013 | 2014 | 2015 | 2016 | 2017 | 2018 | 2019 | 2020 | 2021 | 2022 |
|---|---|---|---|---|---|---|---|---|---|---|---|
| Hunan | Changsha | 0.709 | 0.728 | 0.769 | 0.829 | 0.867 | 0.889 | 0.880 | 0.882 | 0.955 | 1.022 |
| Zhuzhou | 0.431 | 0.444 | 0.481 | 0.489 | 0.484 | 0.492 | 0.561 | 0.600 | 0.632 | 0.666 | |
| Xiangtan | 0.392 | 0.362 | 0.361 | 0.394 | 0.454 | 0.496 | 0.484 | 0.512 | 0.552 | 0.579 | |
| Hengyang | 0.424 | 0.437 | 0.456 | 0.485 | 0.491 | 0.506 | 0.588 | 0.604 | 0.648 | 0.688 | |
| Shaoyang | 0.308 | 0.298 | 0.315 | 0.359 | 0.370 | 0.395 | 0.533 | 0.549 | 0.585 | 0.565 | |
| Yueyang | 0.480 | 0.501 | 0.512 | 0.549 | 0.557 | 0.619 | 0.685 | 0.744 | 0.883 | 1.056 | |
| Chande | 0.615 | 0.622 | 1.122 | 0.740 | 0.636 | 0.659 | 0.641 | 0.657 | 0.676 | 0.706 | |
| Zhangjiajie | 0.467 | 0.477 | 0.527 | 0.561 | 0.573 | 0.592 | 0.524 | 0.505 | 0.511 | 0.497 | |
| Yiyang | 0.383 | 0.395 | 0.414 | 0.461 | 0.484 | 0.527 | 0.512 | 0.497 | 0.500 | 0.512 | |
| Chenzhou | 0.470 | 0.523 | 0.485 | 0.531 | 0.503 | 0.518 | 0.521 | 0.598 | 0.662 | 0.697 | |
| Yongzhou | 0.389 | 0.344 | 0.362 | 0.390 | 0.389 | 0.418 | 0.457 | 0.465 | 0.475 | 0.514 | |
| Huaihua | 0.525 | 0.469 | 0.503 | 0.527 | 0.476 | 0.521 | 0.541 | 0.538 | 0.570 | 0.573 | |
| Loudi | 0.461 | 0.453 | 0.454 | 0.488 | 0.504 | 0.544 | 0.557 | 0.657 | 0.679 | 1.013 | |
| Jiangxi | Nanchang | 0.464 | 0.465 | 0.462 | 0.483 | 0.513 | 0.539 | 0.557 | 0.588 | 0.922 | 1.042 |
| Jingdezhen | 0.594 | 0.510 | 0.491 | 0.505 | 0.477 | 0.460 | 0.494 | 0.529 | 0.617 | 0.652 | |
| Pingxiang | 0.530 | 0.549 | 0.570 | 0.643 | 0.598 | 0.585 | 0.462 | 0.499 | 0.550 | 0.590 | |
| Jiujiang | 0.478 | 0.492 | 0.502 | 0.531 | 0.590 | 0.680 | 0.842 | 0.805 | 0.864 | 0.866 | |
| Xinyu | 0.665 | 0.665 | 0.617 | 0.648 | 0.631 | 0.616 | 0.566 | 0.586 | 0.680 | 1.011 | |
| Yingtan | 1.034 | 0.852 | 0.667 | 0.691 | 0.833 | 0.630 | 0.761 | 0.806 | 0.890 | 1.054 | |
| Ganzhou | 0.599 | 0.456 | 0.452 | 0.455 | 0.486 | 0.518 | 0.642 | 0.647 | 0.706 | 0.724 | |
| Ji an | 0.590 | 0.547 | 0.548 | 0.592 | 0.456 | 0.644 | 0.849 | 0.690 | 0.922 | 1.052 | |
| Yichun | 1.019 | 0.732 | 0.552 | 0.590 | 0.648 | 0.645 | 1.025 | 1.020 | 0.878 | 1.012 | |
| Fuzhou | 0.463 | 0.434 | 0.398 | 0.404 | 0.403 | 0.413 | 0.457 | 0.451 | 0.487 | 0.514 | |
| Shangrao | 0.993 | 1.018 | 0.506 | 0.533 | 0.693 | 0.561 | 0.860 | 0.787 | 0.867 | 1.025 |
| Province | District | 2013 | 2014 | 2015 | 2016 | 2017 | 2018 | 2019 | 2020 | 2021 | 2022 |
|---|---|---|---|---|---|---|---|---|---|---|---|
| Hunan | Changsha | 0.649 | 0.694 | 0.697 | 0.743 | 0.777 | 0.826 | 0.826 | 0.819 | 0.863 | 0.908 |
| Zhuzhou | 0.332 | 0.359 | 0.402 | 0.426 | 0.455 | 0.485 | 0.516 | 0.539 | 0.558 | 0.584 | |
| Xiangtan | 0.270 | 0.278 | 0.277 | 0.341 | 0.417 | 0.441 | 0.473 | 0.476 | 0.481 | 0.510 | |
| Hengyang | 0.293 | 0.313 | 0.350 | 0.380 | 0.386 | 0.386 | 0.446 | 0.479 | 0.518 | 0.538 | |
| Shaoyang | 0.115 | 0.020 | 0.158 | 0.271 | 0.293 | 0.341 | 0.396 | 0.429 | 0.449 | 0.451 | |
| Yueyang | 0.287 | 0.316 | 0.337 | 0.364 | 0.377 | 0.405 | 0.450 | 0.472 | 0.484 | 0.468 | |
| Chande | 0.297 | 0.330 | 0.256 | 0.366 | 0.380 | 0.415 | 0.447 | 0.464 | 0.479 | 0.503 | |
| Zhangjiajie | 0.025 | 0.157 | 0.161 | 0.216 | 0.238 | 0.253 | 0.214 | 0.245 | 0.281 | 0.292 | |
| Yiyang | 0.169 | 0.224 | 0.211 | 0.248 | 0.271 | 0.309 | 0.325 | 0.346 | 0.392 | 0.438 | |
| Chenzhou | 0.275 | 0.324 | 0.340 | 0.360 | 0.364 | 0.372 | 0.400 | 0.442 | 0.469 | 0.485 | |
| Yongzhou | 0.084 | 0.191 | 0.248 | 0.267 | 0.292 | 0.323 | 0.349 | 0.372 | 0.410 | 0.435 | |
| Huaihua | 0.196 | 0.226 | 0.249 | 0.289 | 0.311 | 0.348 | 0.372 | 0.391 | 0.411 | 0.423 | |
| Loudi | 0.203 | 0.218 | 0.236 | 0.256 | 0.297 | 0.359 | 0.346 | 0.360 | 0.375 | 0.340 | |
| Jiangxi | Nanchang | 0.437 | 0.436 | 0.430 | 0.450 | 0.475 | 0.491 | 0.503 | 0.527 | 0.840 | 0.949 |
| Jingdezhen | 0.311 | 0.319 | 0.339 | 0.392 | 0.384 | 0.403 | 0.447 | 0.466 | 0.480 | 0.501 | |
| Pingxiang | 0.312 | 0.335 | 0.359 | 0.381 | 0.387 | 0.460 | 0.444 | 0.469 | 0.474 | 0.483 | |
| Jiujiang | 0.463 | 0.483 | 0.494 | 0.530 | 0.515 | 0.541 | 0.553 | 0.586 | 0.637 | 0.635 | |
| Xinyu | 0.362 | 0.366 | 0.379 | 0.385 | 0.390 | 0.406 | 0.408 | 0.422 | 0.440 | 0.408 | |
| Yingtan | 0.164 | 0.249 | 0.300 | 0.311 | 0.361 | 0.343 | 0.379 | 0.420 | 0.452 | 0.456 | |
| Ganzhou | 0.432 | 0.434 | 0.425 | 0.429 | 0.464 | 0.502 | 0.633 | 0.631 | 0.681 | 0.691 | |
| Ji an | 0.286 | 0.333 | 0.365 | 0.383 | 0.400 | 0.439 | 0.451 | 0.493 | 0.510 | 0.492 | |
| Yichun | 0.311 | 0.393 | 0.431 | 0.453 | 0.488 | 0.552 | 0.544 | 0.571 | 0.643 | 0.659 | |
| Fuzhou | 0.309 | 0.337 | 0.347 | 0.356 | 0.354 | 0.371 | 0.436 | 0.424 | 0.471 | 0.503 | |
| Shangrao | 0.360 | 0.380 | 0.497 | 0.510 | 0.521 | 0.561 | 0.594 | 0.650 | 0.686 | 0.698 |
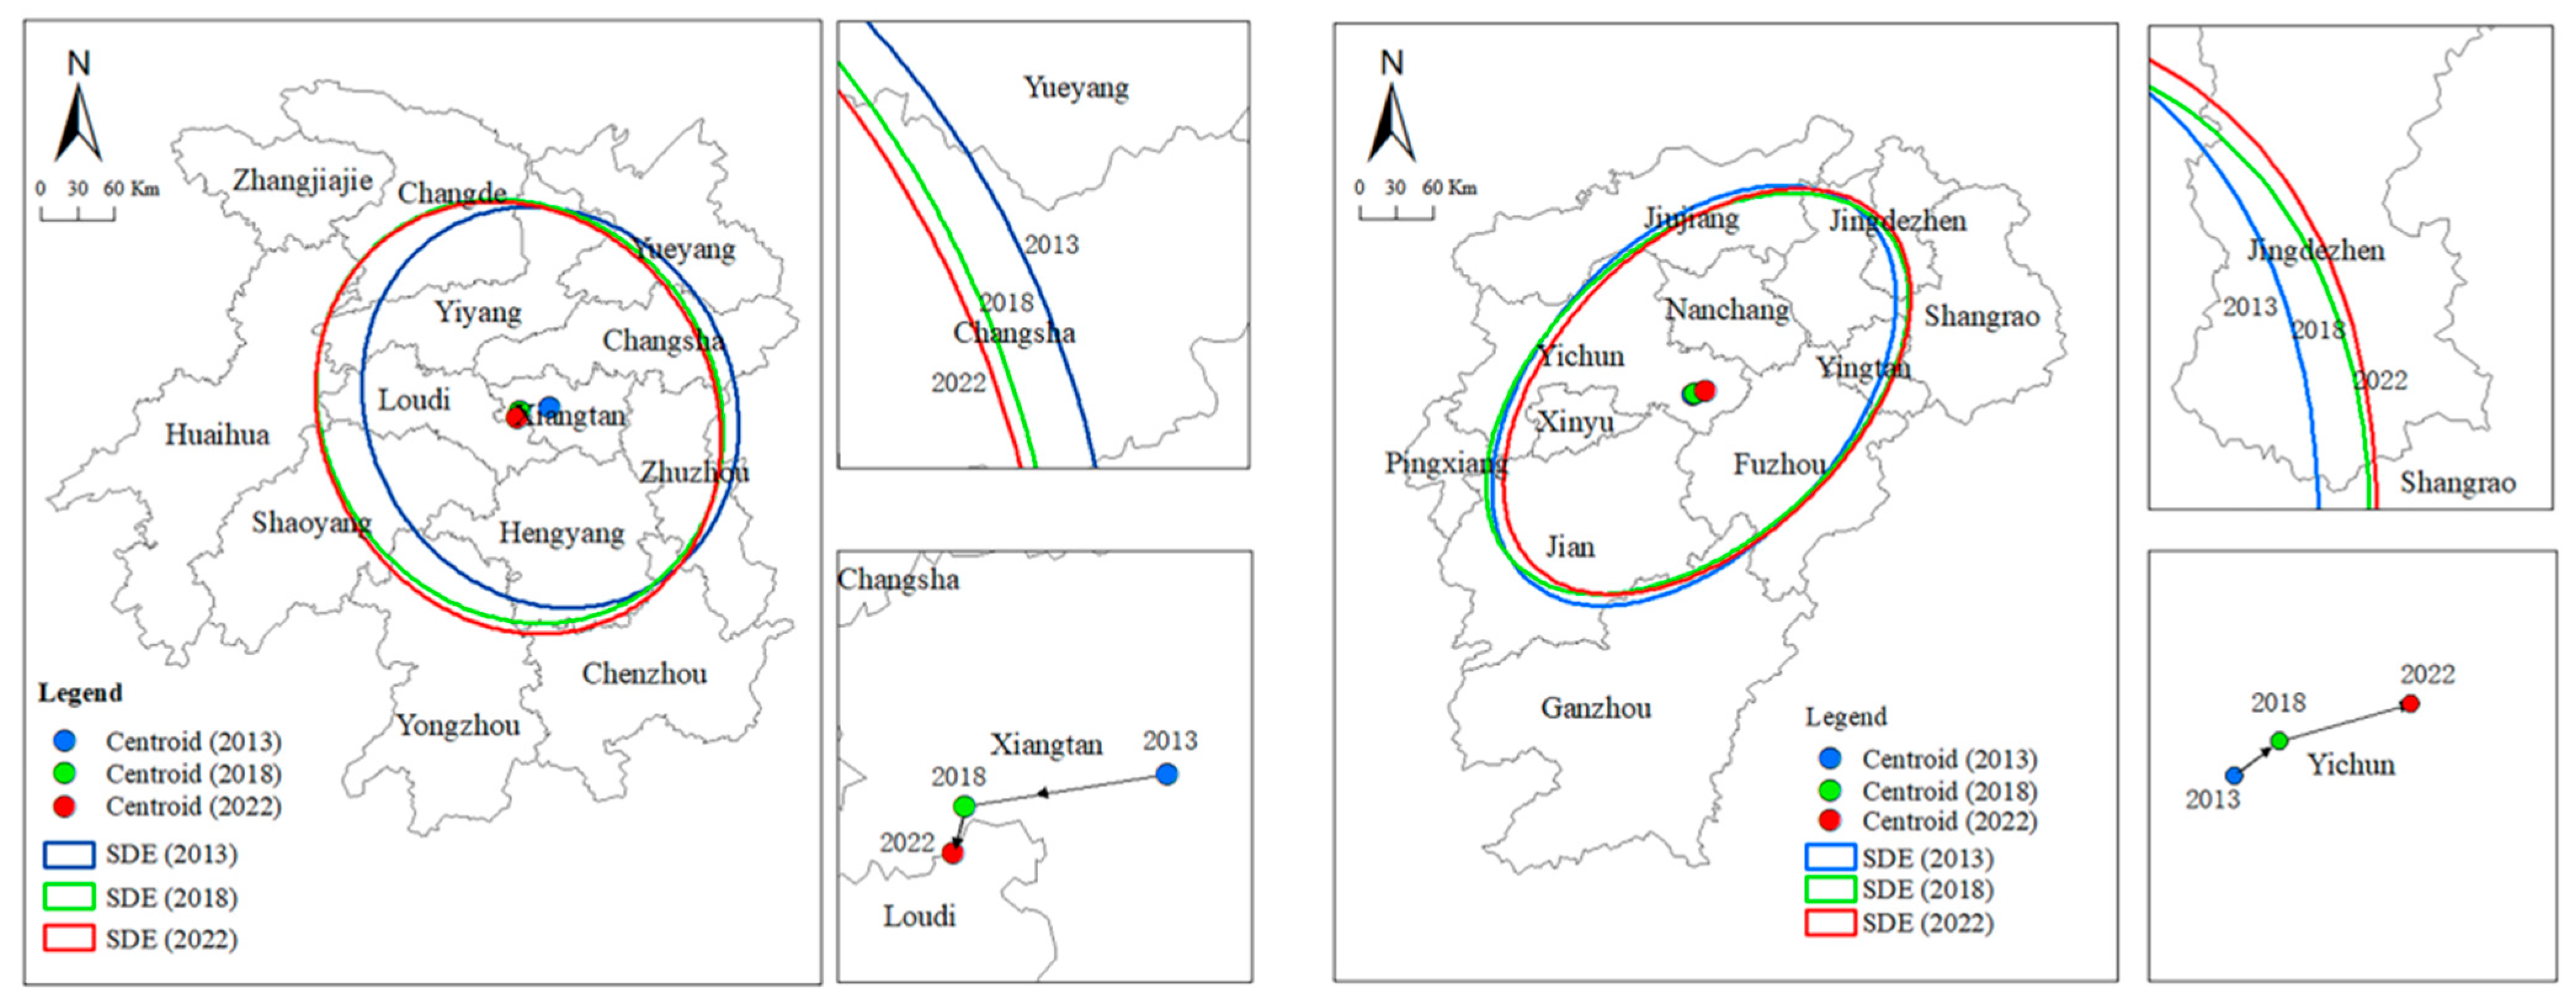
| Year | Province | Ellipse Area (104 km2) | Major Axis Length (km) | Minor Axis Length (km) | Azimuth (°) | Axis Ratio (Major/Minor) |
|---|---|---|---|---|---|---|
| 2013 | Jiangxi | 7.12 | 194.48 | 116.59 | 33.07 | 1.67 |
| Hunan | 6.82 | 163.28 | 132.89 | 164.65 | 1.23 | |
| 2018 | Jiangxi | 7.05 | 193.12 | 116.25 | 38.75 | 1.66 |
| Hunan | 7.78 | 173.07 | 143.14 | 162.18 | 1.21 | |
| 2022 | Jiangxi | 6.88 | 191.33 | 114.48 | 35.80 | 1.67 |
| Hunan | 7.90 | 176.32 | 142.65 | 163.53 | 1.24 |
| No. | Nanchang | Jingdezhen | Pingxiang | Jiujiang | Xinyu | Yingtan | Ganzhou | Ji’an | Yichun | Fuzhou | Shangrao |
|---|---|---|---|---|---|---|---|---|---|---|---|
| 1 | U12/ 0.167 | U12/ 0.183 | U12/ 0.182 | U12/ 0.190 | U12/ 0.186 | U12/ 0.179 | U12/ 0.186 | U12/ 0.180 | U12/ 0.183 | U12/ 0.180 | U12/ 0.189 |
| 2 | U10/ 0.153 | U10/ 0.157 | U10/ 0.152 | U10/ 0.155 | U10/ 0.159 | U10/ 0.150 | U10/ 0.141 | U10/ 0.142 | U10/ 0.135 | U10/ 0.145 | U10/ 0.158 |
| 3 | U11/ 0.113 | U13/ 0.129 | U13/ 0.130 | U13/ 0.124 | U13/ 0.132 | U13/ 0.129 | U13/ 0.122 | U13/ 0.123 | U13/ 0.128 | U13/ 0.127 | U13/ 0.125 |
| No. | Changsha | Zhuzhou | Xiangtan | Hengyang | Shaoyang | Yueyang | Changde | Zhangjiajie | Yiyang | Chenzhou | Yongzhou | Huaihua | Loudi |
|---|---|---|---|---|---|---|---|---|---|---|---|---|---|
| 1 | U10/ 0.158 | U12/ 0.175 | U12/ 0.176 | U12/ 0.179 | U12/ 0.175 | U12/ 0.184 | U12/ 0.174 | U12/ 0.166 | U12/ 0.172 | U12/ 0.176 | U12/ 0.174 | U12/ 0.172 | U12/ 0.173 |
| 2 | U2/ 0.139 | U10/ 0.136 | U10/ 0.152 | U10/ 0.163 | U10/ 0.161 | U10/ 0.155 | U10/ 0.158 | U10/ 0.151 | U10/ 0.151 | U10/ 0.152 | U10/ 0.149 | U10/ 0.154 | U10/ 0.155 |
| 3 | U12/ 0.107 | U13/ 0.123 | U13/ 0.127 | U11/ 0.116 | U11/ 0.119 | U11/ 0.119 | U11/ 0.115 | U11/ 0.114 | U11/ 0.116 | U11/ 0.112 | U11/ 0.113 | U11/ 0.117 | U11/ 0.116 |
| No. | Nanchang | Jingdezhen | Pingxiang | Jiujiang | Xinyu | Yingtan | Ganzhou | Ji’an | Yichun | Fuzhou | Shangrao |
|---|---|---|---|---|---|---|---|---|---|---|---|
| 1 | Y1/ 0.475 | Y1/ 0.324 | Y1/ 0.325 | Y1/ 0.358 | Y1/ 0.319 | Y1/ 0.319 | Y1/ 0.384 | Y1/ 0.374 | Y1/ 0.403 | Y1/ 0.358 | Y1/ 0.371 |
| 2 | X2/ 0.188 | X3/ 0.272 | X3/ 0.275 | X3/ 0.282 | X3/ 0.281 | X3/ 0.275 | X3/ 0.275 | X3/ 0.293 | X3/ 0.307 | X3/ 0.271 | X3/ 0.283 |
| 3 | X1/ 0.175 | X2/ 0.222 | X2/ 0.211 | X2/ 0.212 | X2/ 0.217 | X2/ 0.224 | X2/ 0.241 | X2/ 0.235 | X2/ 0.258 | X2/ 0.238 | X2/ 0.240 |
| No. | Changsha | Zhuzhou | Xiangtan | Hengyang | Shaoyang | Yueyang | Changde | Zhangjiajie | Yiyang | Chenzhou | Yongzhou | Huaihua | Loudi |
|---|---|---|---|---|---|---|---|---|---|---|---|---|---|
| 1 | X1/ 0.315 | Y1/ 0.354 | Y1/ 0.347 | Y1/ 0.370 | Y1/ 0.362 | Y1/ 0.358 | Y1/ 0.368 | Y1/ 0.315 | Y1/ 0.345 | Y1/ 0.351 | Y1/ 0.353 | Y1/ 0.335 | Y1/ 0.334 |
| 2 | Y1/ 0.300 | X3/ 0.279 | X3/ 0.273 | X3/ 0.278 | X3/ 0.277 | X3/ 0.292 | X3/ 0.307 | X3/ 0.274 | X3/ 0.287 | X3/ 0.286 | X3/ 0.282 | X3/ 0.275 | X3/ 0.269 |
| 3 | X2/ 0.162 | X2/ 0.205 | X2/ 0.223 | X2/ 0.245 | X2/ 0.240 | X2/ 0.259 | X2/ 0.248 | X2/ 0.226 | X2/ 0.236 | X2/ 0.215 | X2/ 0.236 | X2/ 0.234 | X2/ 0.229 |
Disclaimer/Publisher’s Note: The statements, opinions and data contained in all publications are solely those of the individual author(s) and contributor(s) and not of MDPI and/or the editor(s). MDPI and/or the editor(s) disclaim responsibility for any injury to people or property resulting from any ideas, methods, instructions or products referred to in the content. |
© 2026 by the authors. Licensee MDPI, Basel, Switzerland. This article is an open access article distributed under the terms and conditions of the Creative Commons Attribution (CC BY) license.
Share and Cite
He, H.; Cheng, D.; Zheng, K.; Xiong, W. Coupling Coordination Between New-Type Urbanization and Water Use Efficiency: A CAS-Based Feedback Perspective Analysis of Jiangxi and Hunan Provinces, China. Sustainability 2026, 18, 7684. https://doi.org/10.3390/su18157684
He H, Cheng D, Zheng K, Xiong W. Coupling Coordination Between New-Type Urbanization and Water Use Efficiency: A CAS-Based Feedback Perspective Analysis of Jiangxi and Hunan Provinces, China. Sustainability. 2026; 18(15):7684. https://doi.org/10.3390/su18157684
Chicago/Turabian StyleHe, Haifang, Dandan Cheng, Kan Zheng, and Wei Xiong. 2026. "Coupling Coordination Between New-Type Urbanization and Water Use Efficiency: A CAS-Based Feedback Perspective Analysis of Jiangxi and Hunan Provinces, China" Sustainability 18, no. 15: 7684. https://doi.org/10.3390/su18157684
APA StyleHe, H., Cheng, D., Zheng, K., & Xiong, W. (2026). Coupling Coordination Between New-Type Urbanization and Water Use Efficiency: A CAS-Based Feedback Perspective Analysis of Jiangxi and Hunan Provinces, China. Sustainability, 18(15), 7684. https://doi.org/10.3390/su18157684