Article

Why Willing Farmers Don’t Adopt: An Extended UTAUT Analysis of Smart Agriculture Technology in Shanghai

School of Economics, Shanghai University, Shanghai 200444, China
*
Author to whom correspondence should be addressed.
Sustainability 2026, 18(15), 7553; https://doi.org/10.3390/su18157553
Submission received: 6 June 2026 / Revised: 17 July 2026 / Accepted: 22 July 2026 / Published: 24 July 2026
(This article belongs to the Special Issue Smart Agriculture, Ecological Resources and Environment)

Abstract

Smart agriculture technologies are poised to transform farming, yet their adoption remains uneven even in well-resourced peri-urban settings. This study examines the factors shaping both adoption intention and actual use behavior among 206 suburban farmers across nine Shanghai districts via an extended UTAUT framework that incorporates hedonic motivation, trust, and perceived risk alongside the original constructs. To address a common but underexamined limitation in adoption research, both OLS path analysis and full Maximum Likelihood Structural Equation Modeling with latent variables were estimated and compared through systematic specification-sensitivity analysis. Three categories of findings emerged. Performance expectancy and perceived risk were robust predictors of behavioral intention across all model specifications, while facilitating conditions consistently dominated in terms of actual use behavior. By contrast, social influence and hedonic motivation proved unstable: their effects traded off across specifications because of high shared variance, indicating that these constructs may represent overlapping facets of a broader social–hedonic motivational factor rather than independent predictors. Most notably, the intention-to-behavior path weakened to non-significance in the latent variable model, revealing a substantial gap between farmers’ willingness and their actual adoption. This gap was bridged almost entirely by facilitating conditions, i.e., the availability of infrastructure, technical support, and implementation resources. Geographic analysis further revealed significant inter-district variation in trust, suggesting that local institutional context shapes technological confidence. Alternative mediation analysis showed that effort expectancy, trust, and hedonic motivation influenced intention indirectly through performance expectancy rather than acting as independent drivers. These findings suggest that promoting smart agriculture requires shifting policy emphasis from attitude change to developing the infrastructural and service conditions that enable willing farmers to adopt smart agricultural systems.

1. Introduction

1.1. Background: Smart Agriculture

The rapid development of digital technologies is reshaping agricultural production systems worldwide. Technologies and systems such as the Internet of Things (IoT), remote sensing, drones, big data analytics, farm management information systems, and intelligent decision-support tools have become increasingly important for improving precision, efficiency, and sustainability in farming [1,2,3]. Under the broader agenda of agricultural modernization, smart agriculture is widely regarded as an important pathway for addressing multiple structural challenges, including labor shortages, rising production costs, resource constraints, and the need for environmentally sustainable production practices [4,5]. Compared with traditional production modes, smart agriculture enables farmers to monitor production processes more accurately, optimize input allocation, improve management decisions, and enhance the responsiveness of farming systems to changing conditions [1,2].
Although smart agriculture’s technological potential is widely recognized, its practical diffusion remains uneven. The existence of advanced technologies does not automatically result in their widespread use in real farming contexts [6,7]. Earlier studies on precision agriculture showed that adoption is influenced by farm size, operator characteristics, management style, access to knowledge, and perceived profitability rather than by technical feasibility alone [8,9,10,11]. More recent studies indicate that the adoption of digital tools is further shaped by behavioral, social, and institutional conditions, especially when technologies require data interpretation, digital literacy, platform dependence, and continuous service support [12,13,14].
This challenge is particularly salient because smart agriculture is more than a simple technical upgrade. In contrast to conventional farm equipment, digital agricultural technologies often require farmers not only to acquire a device or service but also to learn how to operate it, interpret outputs, integrate the device/system into existing routines, and depend on external technical ecosystems for maintenance and updates. Therefore, the adoption of smart agriculture should be considered a socio-technical process rather than a purely technical or economic choice [6,15]. Farmers assess such technologies in terms of expected performance gains, ease of use, social approval, institutional support, trust in the technology, and perceived uncertainty. Thus, the adoption of smart agriculture requires a behavioral framework capable of capturing both individual perceptions and contextual constraints.
China has made substantial strides in promoting agricultural digitalization as part of its broader rural modernization strategy. Shanghai, as a national leader in urban–rural integration, provides an instructive case study. Its suburban farming districts combine relatively advanced infrastructure with diverse production systems, creating conditions wherein adoption of smart agriculture is both feasible and yet unevenly realized. Understanding why some farmers in this comparatively well-resourced environment still do not adopt—or only partially adopt—smart technologies can yield insights applicable to the broader challenge of digital agricultural transformation across China and other rapidly developing economies [13].

1.2. Research on Technology Adoption Among Farmers

A substantial body of research has attempted to explain technology adoption behavior using established behavioral theories. The Technology Acceptance Model (TAM) posits that perceived usefulness and perceived ease of use are the primary determinants of technology acceptance [16]. In agricultural contexts, the TAM remains relevant because farmers often evaluate technologies according to whether they can increase productivity and simplify operations. However, the TAM mainly focuses on individual cognitive evaluations and pays less attention to social and institutional conditions. The Theory of Planned Behavior (TPB) argues that behavior is predicted by behavioral intention, which, in turn, is shaped by attitude, subjective norms, and perceived behavioral control [17]. The TPB provides a broader perspective by explicitly recognizing social expectations, but it was not specifically designed for technology adoption.
To overcome these limitations, Venkatesh et al. [18] proposed the Unified Theory of Acceptance and Use of Technology (UTAUT), which integrates key constructs from several earlier models. The UTAUT identifies performance expectancy, effort expectancy, social influence, and facilitating conditions as the main determinants of behavioral intention and use behavior. The extended UTAUT2 model [19] added hedonic motivation, price value, and habits. The relevance of the UTAUT to adoption of agricultural technology is supported by a growing body of empirical research. Reviews of precision agriculture consistently show that perceived usefulness, complexity, social learning, and support conditions are central factors [20,21]. Recent studies have applied the UTAUT to smart agriculture, IoT-based farming, drones, and blockchain applications [22,23,24,25,26,27].
At the same time, the literature suggests that the original UTAUT framework may not fully capture the complexity of smart agriculture adoption. First, digitalization has increased the importance of user experience, making hedonic motivation relevant even in traditionally utilitarian domains [19,25,28]. Second, smart agriculture relies on data-intensive systems and digital platforms, making trust in technology a critical issue [2,29]. Third, farmers may worry about investment costs, uncertain returns, technical failures, and incompatibility with existing practices, making perceived risk a key barrier [20,21,30,31]. Fourth, previous research has suggested that behavioral intention should be distinguished from actual use behavior since positive intention does not always translate into real adoption in agricultural settings [8,11,14,32]. This distinction is especially important in smart agriculture, where technology use often requires continuous access to digital services, maintenance ecosystems, and external support systems that go beyond the initial adoption decision.
The literature on farmers’ adoption of smart technologies has expanded rapidly in recent years, encompassing diverse geographic and technological contexts. Studies on farmers in Indonesia [12], rice farmers in Malaysia [33], and vegetable farmers in China [14] support the applicability of UTAUT-based models. In South Korea, recent work has examined motivational factors for smart-farm-technology adoption [34], while studies pertaining to Ecuador and the Czech Republic have investigated IoT adoption and precision agriculture barriers, respectively [35,36]. In the Chinese context, research has examined digital technology services and farmers’ willingness in Sichuan [13], IoT adoption through UTAUT-TOE frameworks [27], and the role of digital financial inclusion in shaping adoption willingness [37]. These diverse applications confirm the relevance of the UTAUT while also revealing the need for context-specific extensions.

1.3. Research Gap

Although the literature on farmers’ adoption of smart technologies has expanded rapidly, several important gaps remain. First, existing evidence shows that adoption is highly sensitive to local institutional arrangements and farmers’ digital abilities, yet these dimensions are not always examined in an integrated manner [6,13,14]. Second, many studies rely on limited UTAUT extensions; hedonic motivation, trust in technology, and perceived risk are often examined separately rather than within a unified framework, limiting explanatory power. Third, many studies focus on behavioral intention, while fewer explicitly examine how intention transforms into actual use—a critical limitation given the well-documented intention–behavior gap in agricultural settings [11,14,38]. Fourth, most UTAUT studies rely on a single estimation method—typically OLS regression with composite scores—without examining specification sensitivity. This tendency is problematic because highly correlated UTAUT constructs can produce unstable coefficient estimates when entered simultaneously [39,40]. Recent methodological reviews have highlighted that social influence, facilitating conditions, hedonic motivation, and trust frequently exhibit high inter-construct correlations in applied UTAUT studies, yet few authors have tested whether their substantive conclusions change when problematic constructs are removed or when different estimation methods are used. This oversight creates a risk that published findings may overstate certain effects while understating others, depending on the model specification chosen (an arbitrary decision).

1.4. Research Objective and Contributions

This study examines farmers’ adoption of smart agriculture technologies through an extended UTAUT framework incorporating performance expectancy, effort expectancy, social influence, facilitating conditions, hedonic motivation, trust in technology, and perceived risk to explain behavioral intention and further investigates behavioral intention’s influence on actual use behavior. The study makes three contributions. First, it extends the literature by applying an expanded UTAUT framework to Chinese peri-urban smart agriculture. Second, it integrates both enabling and constraining factors—including hedonic motivation, trust, and perceived risk—into a single analytical model. Third, it employs a multi-method strategy (OLS composite, ML-SEM with latent variables, and robustness modeling) with comprehensive specification-sensitivity analysis, classifying all findings by cross-method robustness. By focusing on suburban Shanghai—a comparatively well-resourced peri-urban setting where smart-agriculture adoption nevertheless remains uneven—this study provides context-specific evidence of why favorable intentions do not always translate into actual use. More importantly, it shows that facilitating conditions, rather than behavioral intention alone, are central to explaining actual use, thereby extending UTAUT research from intention formation to the implementation constraints underlying the intention–behavior gap. The remainder of this paper is organized as follows: Section 2 presents the theoretical framework and research hypotheses. Section 3 describes the materials and methods used, including questionnaire design, variable measurement, data collection, and the analytical strategy. Section 4 reports the empirical results, and Section 5 discusses the findings and their implications. Finally, Section 6 provides the main conclusions, practical recommendations, limitations, and directions for future research.

2. Theoretical Framework and Hypotheses

2.1. Theoretical Framework

We have developed an extended UTAUT framework suitable for smart agriculture. The framework retains four core UTAUT constructs—performance expectancy, effort expectancy, facilitating conditions, and social influence—and incorporates hedonic motivation, trust in technology, and perceived risk as extended variables [18,19]. The model distinguishes between behavioral intention (BI) and actual use behavior (UB), capturing both motivational and behavioral dimensions of adoption.
This framework is theoretically appropriate for three reasons. First, adoption of smart agriculture is inherently utility-driven: farmers adopt technologies when they believe these tools can improve production efficiency and farm performance. Second, smart agriculture involves digital interfaces, automation systems, and data-based tools, making ease of use an important adoption condition. Third, use of technology in farming is shaped by local social networks, extension services, resource access, and confidence in technology’s reliability [6,15]. Because agricultural production is vulnerable to environmental and market uncertainty, farmers’ decisions are influenced not only by expected benefits but also by trust and perceived risk [30,31]. At the same time, the growing digitalization of agriculture means that technology use may induce enjoyment and empowerment, especially among younger operators [19,25]. This study therefore proposes an extended UTAUT model that retains the four core constructs (PE, EE, SI, and FC) while adding hedonic motivation from UTAUT2 and further incorporating trust in technology and perceived risk as domain-specific extensions that reflect the unique characteristics of smart agriculture as a digitally mediated, service-dependent, and uncertainty-prone form of innovation.
The framework also distinguishes between behavioral intention and actual use behavior, thereby capturing both the motivational and behavioral dimensions of adoption. This distinction is theoretically important because intention formation and behavioral realization may be governed by different mechanisms in agricultural contexts. While PE, HM, and social–hedonic factors may shape willingness, actual use appears to be governed primarily by implementation feasibility—a pattern that has been increasingly recognized in the digital agriculture literature [6,7,15]. By modeling both stages, the framework provides a more complete explanation of the adoption process than models that focus exclusively on behavioral intention.

2.2. Hypothesis Development

Performance expectancy refers to the degree to which farmers believe smart agriculture technologies will improve production outcomes [18]. The agricultural literature has consistently shown that farmers are more willing to adopt technologies when they expect clear and tangible benefits [4,8,13].
H1. 
Performance expectancy positively influences behavioral intention.
This hypothesis reflects the fundamental logic of technology adoption: farmers are pragmatic decision-makers who evaluate technologies primarily through the lens of practical utility. In peri-urban settings where land is scarce and production efficiency is critical, performance-related evaluations may become even more central. Early precision agriculture research confirmed that expected profitability and yield improvement are among the strongest adoption predictors [8,9], and this pattern has been replicated in recent IoT and smart-farming studies [13,27,41].
Effort expectancy refers to the perceived ease of learning and using smart-agriculture technologies [18]. If farmers perceive technologies to be overly complex or cognitively demanding, willingness to adopt may decline [16,42,43].
H2. 
Effort expectancy positively influences behavioral intention.
In agricultural contexts where many operators have limited experience with digital interfaces, the cognitive burden of learning new systems can create significant resistance. However, effort expectancy effects may diminish as farmers gain experience or when the sample is relatively well-educated, as suggested by the UTAUT’s original moderation hypotheses [18]. The degree to which effort expectancy matters is therefore expected to depend on the educational and technological profiles of the farming population being studied.
Facilitating conditions are the perceived availability of resources, infrastructure, and support necessary for using smart agriculture [18]. Because smart technologies depend on both hardware and service support, facilitating conditions are important for both intention formation and implementation [1,13,15].
H3a. 
Facilitating conditions positively influence behavioral intention.
H3b. 
Facilitating conditions positively influence use behavior.
Social influence is the extent to which farmers perceive that other people close to them—family, peers, and extension agents—believe they should adopt smart agriculture [18]. In agricultural communities, peer examples and encouragement from trusted actors can significantly shape adoption [12,17,44].
H4. 
Social influence positively influences behavioral intention.
Agricultural decision-making is deeply embedded in social contexts. Farmers observe neighbors’ adoption outcomes, receive advice from extension workers, and respond to community expectations. In the Chinese agricultural system, village-level officials and agricultural extension stations play particularly important roles in technology promotion [13,41]. Moreover, the visibility of smart agriculture technologies—such as drones, sensor arrays, and digital monitoring screens—may amplify social influence by making adoption decisions publicly observable within farming communities.
Hedonic motivation refers to the enjoyment, interest, and pleasure derived from using smart agriculture technologies [19]. Beyond purely functional value, digital monitoring platforms, drones, and intelligent devices may provide novelty and satisfaction [25,28].
H5. 
Hedonic motivation positively influences behavioral intention.
Trust in technology refers to farmers’ confidence in the reliability, accuracy, and credibility of smart agriculture technologies and their providers [2,29]. In agricultural production, where the consequences of technical failure can be severe, trust is a central adoption condition.
H6. 
Trust positively influences behavioral intention.
Perceived risk refers to concerns about the negative consequences of using smart agriculture, including investment failure, technical problems, and uncertain returns [20,21,30]. These concerns can weaken behavioral intention even when a technology is perceived as useful [31,45].
H7. 
Perceived risk negatively influences behavioral intention.
Behavioral intention is the most direct antecedent of actual behavior in both the TPB and UTAUT [17,18]. Farmers with stronger adoption intentions are generally more likely to make concrete adoption efforts [14,32,46].
H8. 
Behavioral intention positively influences use behavior.
However, the agricultural adoption literature has repeatedly demonstrated that the intention–behavior link is weaker than in consumer technology contexts. Production constraints, seasonal timing, financial barriers, and infrastructure limitations can prevent willing farmers from translating their favorable attitudes into actual technology use [8,11,32], creating what the literature terms an ‘intention–behavior gap,’ which may be particularly pronounced for smart agriculture technologies that require continuous digital infrastructure and service access [14,32,38].

3. Materials and Methods

3.1. Participants and Data Collection

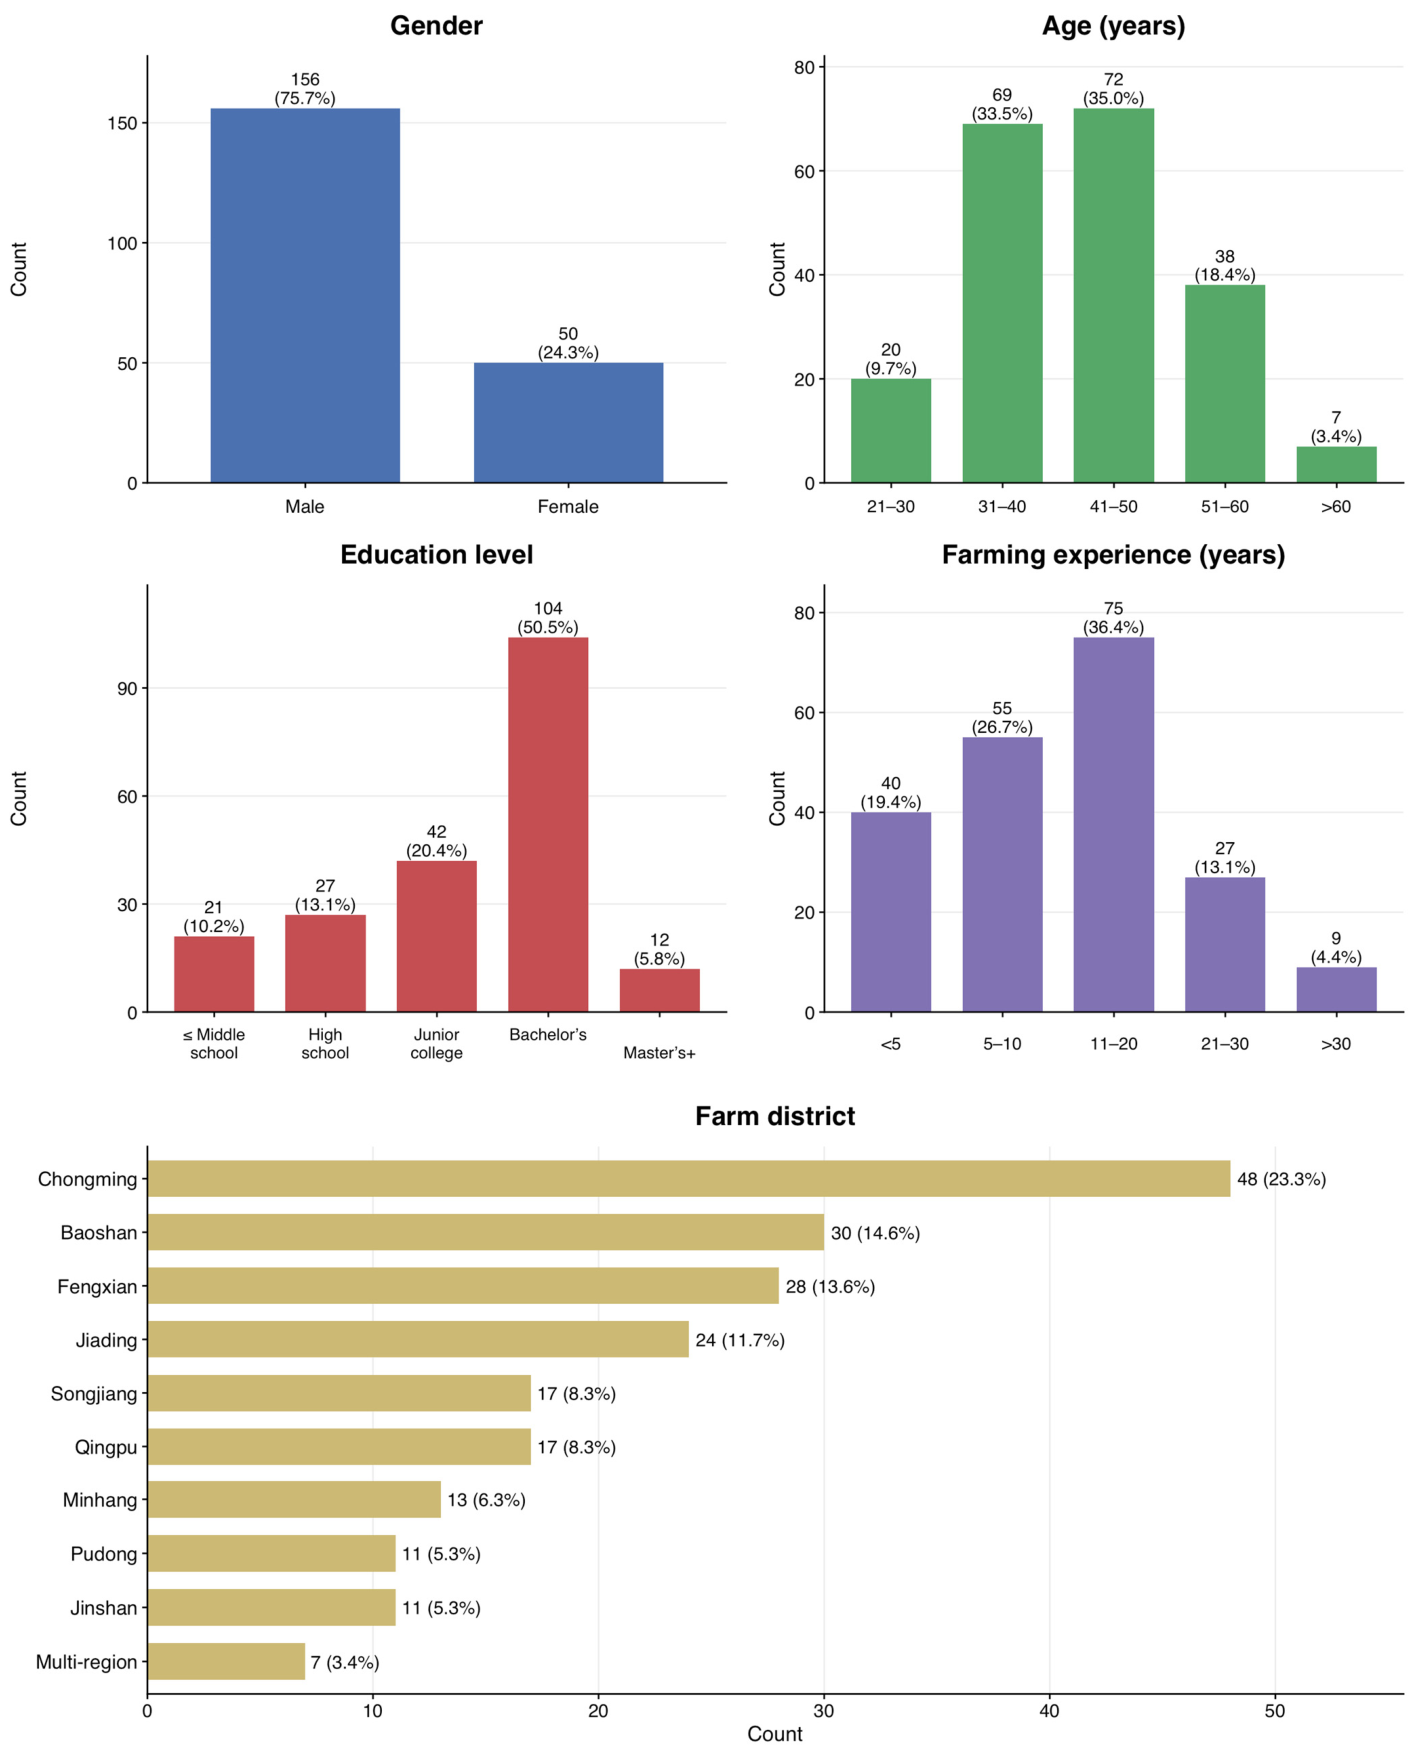
Data were collected from 25 December 2025 to 30 January 2026 through a structured questionnaire survey (Appendix A) conducted across nine suburban districts of Shanghai. The survey was carried out in cooperation with the agricultural authorities of the participating districts, which assisted in distributing the questionnaire link to local farmers via WeChat. A total of 211 questionnaires were returned. After data quality screening, 206 valid responses were retained, yielding a valid response rate of 97.6%. Figure 1 shows the composition of the sample: Chongming (n = 48), Baoshan (n = 30), Fengxian (n = 28), Jiading (n = 24), Songjiang (n = 17), Qingpu (n = 17), Minhang (n = 13), Pudong (n = 11), Jinshan (n = 11), and multi-region (n = 7). Among the respondents, 156 were male (75.7%), and 50 were female (24.3%). The majority were aged 31–50 (68.5%), held at least a junior college degree (76.7%), and had 5–20 years of farming experience (63.1%). Shanghai is a relevant setting because it combines advanced infrastructure, strong policy attention to digital agriculture, and diverse production systems [6,15]. The composition of the sample—predominantly experienced, middle-aged farmers with moderate to high levels of education—is suitable for examining adoption of smart agriculture because both education and farming experience have been shown to shape farmers’ understanding and evaluation of new agricultural technologies [8,22,43]. The geographic diversity across nine districts also allows examination of whether adoption patterns vary with local infrastructure and institutional conditions.

3.2. Measures

Nine latent constructs were measured using 26 items on 5-point Likert scales (1 = Strongly Disagree, 5 = Strongly Agree). PE (3 items), EE (3), SI (3), and FC (3) were adapted from the UTAUT [18]; HM (3) was adapted from UTAUT2 [19]; TR (3) and PR (3) were employed as domain-specific extensions [29,30]; and BI (3) and UB (2) were employed as endogenous variables. This approach is consistent with prior empirical work on digital agriculture and smart-farming adoption [22,24,27]. The specific wording for items was adapted to reflect the Shanghai smart-agriculture context. For example, PE items referred to improving agricultural production efficiency, crop yield and quality, and overall usefulness for farming activities. EE items assessed the perceived ease of learning, effort required, and clarity of operational processes. SI items captured influence from family, extension workers, and peer farmers. FC items measured availability of equipment, knowledge, and technical support. HM items assessed interest, enjoyment, and fun associated with smart-agriculture use. TR items measured perceived reliability, data trustworthiness, and institutional credibility. PR items captured concerns about performance failure, economic risk, and technical malfunctions. BI items measured future adoption intention, and UB items captured current use frequency.

3.3. Analytical Strategy

A multi-method strategy was adopted following recommendations for rigorous SEM practices, and all analyses were performed using R (v4.5.3) and RStudio (v2026.01.1). [39,40]. The measurement model specified each construct as a latent variable with its indicators via CFA:
x   =   Λ η   +   ε , ε   ~   N ( 0 ,   Θ )
The structural model specified the following:
B I   =   γ 1 P E   +   γ 2 E E   +   γ 3 S I   +   γ 4 F C   +   γ 5 H M   +   γ 6 T R   +   γ 7 P R   +   ζ B I
U B = β 1 B I + γ 8 F C + ζ U B
The model-implied covariance matrix is
Σ ( θ ) = Λ ( I B ) 1 Ψ ( I B ) T Λ T + Θ
Parameters were estimated by minimizing the ML fitting function:
F M L   =   l n | Σ ( θ ) |   +   t r ( S Σ ( θ ) 1 )     l n | S |     p
where S is the sample covariance matrix (26 × 26), p = 26, and T = (N − 1)·FMLχ2(df), with df = 351 − 82 = 269. Model fit was assessed using CFI, TLI, RMSEA, and SRMR [47]:
C F I   =   1     m a x ( χ m 2     d f m ,   0 ) m a x ( χ 0 2     d f 0 ,   χ m 2     d f m ,   0 )
R M S E A = m a x ( χ 2 d f 1 , 0 ) N 1
Convergent validity was assessed through AVE and CR [48]:
A V E j   =   1 k j i   =   1 k j ( λ i j ) 2
C R j = ( i = 1 k j λ i j ) 2 ( i = 1 k j λ i j ) 2 + i = 1 k j ( 1 ( λ i j ) 2 )
Discriminant validity was evaluated using both the Fornell–Larcker criterion [48] and the HTMT ratio [49]. To assess robustness, five OLS model specifications were compared alongside a robustness ML-SEM excluding SI. VIF, condition indices, and HTMT ratios were used for multicollinearity diagnostics [39].
Path stability was classified according to four rules. A path was classified as “stable” when it retained the same substantive direction and statistical conclusion across the OLS, full-ML-SEM, and no-SI robustness specifications, with the coefficient range remaining below 0.10. A path was classified as “stable non-significant” when it was non-significant across all specifications and the coefficients remained small in magnitude. A path was classified as “model-dependent” or “unstable” when its sign, significance, or magnitude changed substantially across specifications, including cases where the coefficient range exceeded 0.20. A path was classified as “weakening” when it retained the same direction but changed from significant in the OLS composite model to non-significant in the latent-variable specifications. For H7, “stable” refers only to cross-specification stability; because the coefficient was positive rather than negative, the hypothesis was rejected.
Moderation effects were examined using composite-score OLS interaction models rather than multi-group SEM or latent product indicators, because the sample size was insufficient for stable subgroup SEM estimation. Age and education were coded as ordered variables and mean-centered before construction of interaction terms. Each interaction model included the focal predictor, the moderator, their interaction term, and the remaining UTAUT predictors. The reported moderation coefficients therefore represent standardized OLS interaction effects and should be interpreted as exploratory evidence of heterogeneity.

4. Results

4.1. Measurement Model

The measurement model satisfied all reliability and convergent-validity criteria. All constructs demonstrated excellent internal consistency (α: 0.787–0.957) and composite reliability (CR: 0.816–0.958). All standardized ML-CFA loadings exceeded 0.70 (range: 0.720–0.967), and all AVE values surpassed 0.50 (range: 0.598–0.902), confirming convergent validity (Table 1). The Fornell–Larcker criterion was satisfied for all pairs.
The Fornell–Larcker criterion was satisfied for all construct pairs. However, the HTMT results provide a more stringent test and indicate a discriminant-validity concern for SI–FC and a near-threshold concern for SI–HM. Therefore, discriminant validity should be regarded as mixed for the social–contextual constructs rather than fully unproblematic.

4.2. Multicollinearity Diagnostics

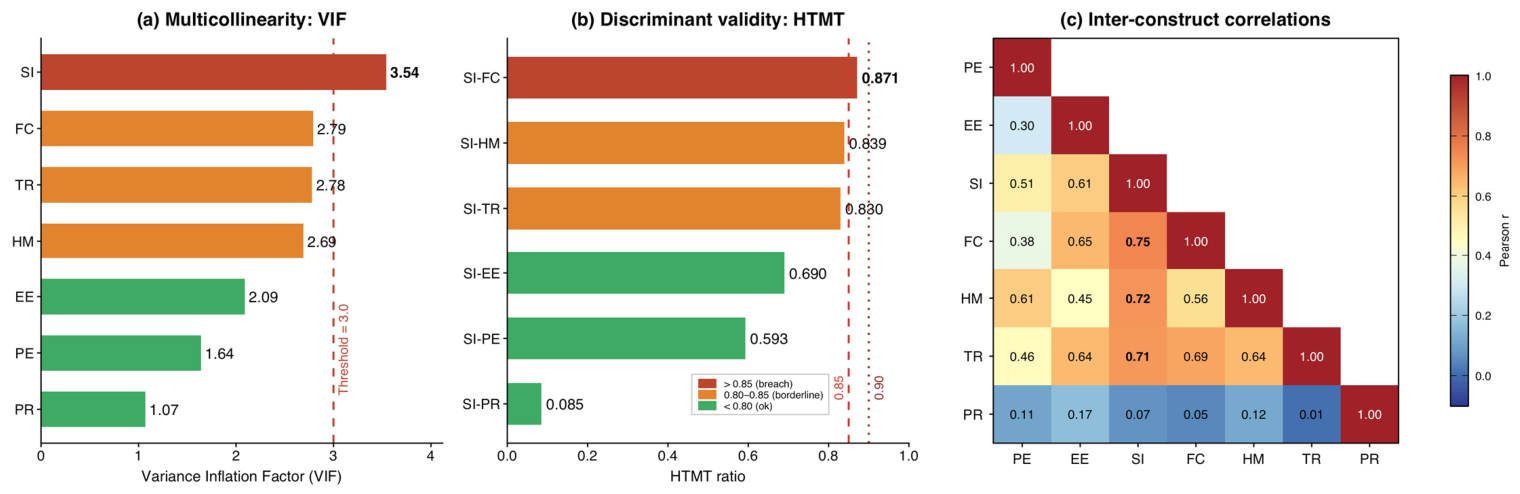
Social influence exhibited the highest VIF (3.54), exceeding the 3.0 concern threshold, driven by correlations with FC (r = 0.747), HM (r = 0.723), and TR (r = 0.715). The HTMT ratio between SI and FC (0.871) exceeded the conservative 0.85 threshold [49], and SI–HM (0.839) approached it. The maximum condition index (4.42) remained below 15.0 (Figure 2) [39]. These diagnostics signal that SI’s unique effect may be unstable.
These high correlations are substantively plausible in the Shanghai agricultural context. The same actors—particularly agricultural extension personnel, village cadres, cooperatives, and neighboring farmers—often perform multiple roles simultaneously: they encourage adoption, organize demonstrations, provide technical training, and connect farmers with equipment and after-sales support. Farmers who perceive stronger social encouragement may therefore also report better facilitating conditions and greater trust in both the technology and its providers. In addition, peer demonstrations and collective training can increase familiarity with smart agriculture technologies and make their use appear more interesting and enjoyable, helping to explain the strong association between SI and HM. Shared district-level infrastructure and service environments may further cause these perceptions to shift in unison. A limited portion of the covariance may also arise from the use of self-reported measures collected using the same Likert scale at a single point in time. Thus, the high correlations do not necessarily indicate that the constructs are conceptually identical; rather, they suggest that their unique statistical effects are difficult to separate in this sample, thereby justifying the subsequent specification-sensitivity analysis [6,13,15,44].

4.3. Model Fit

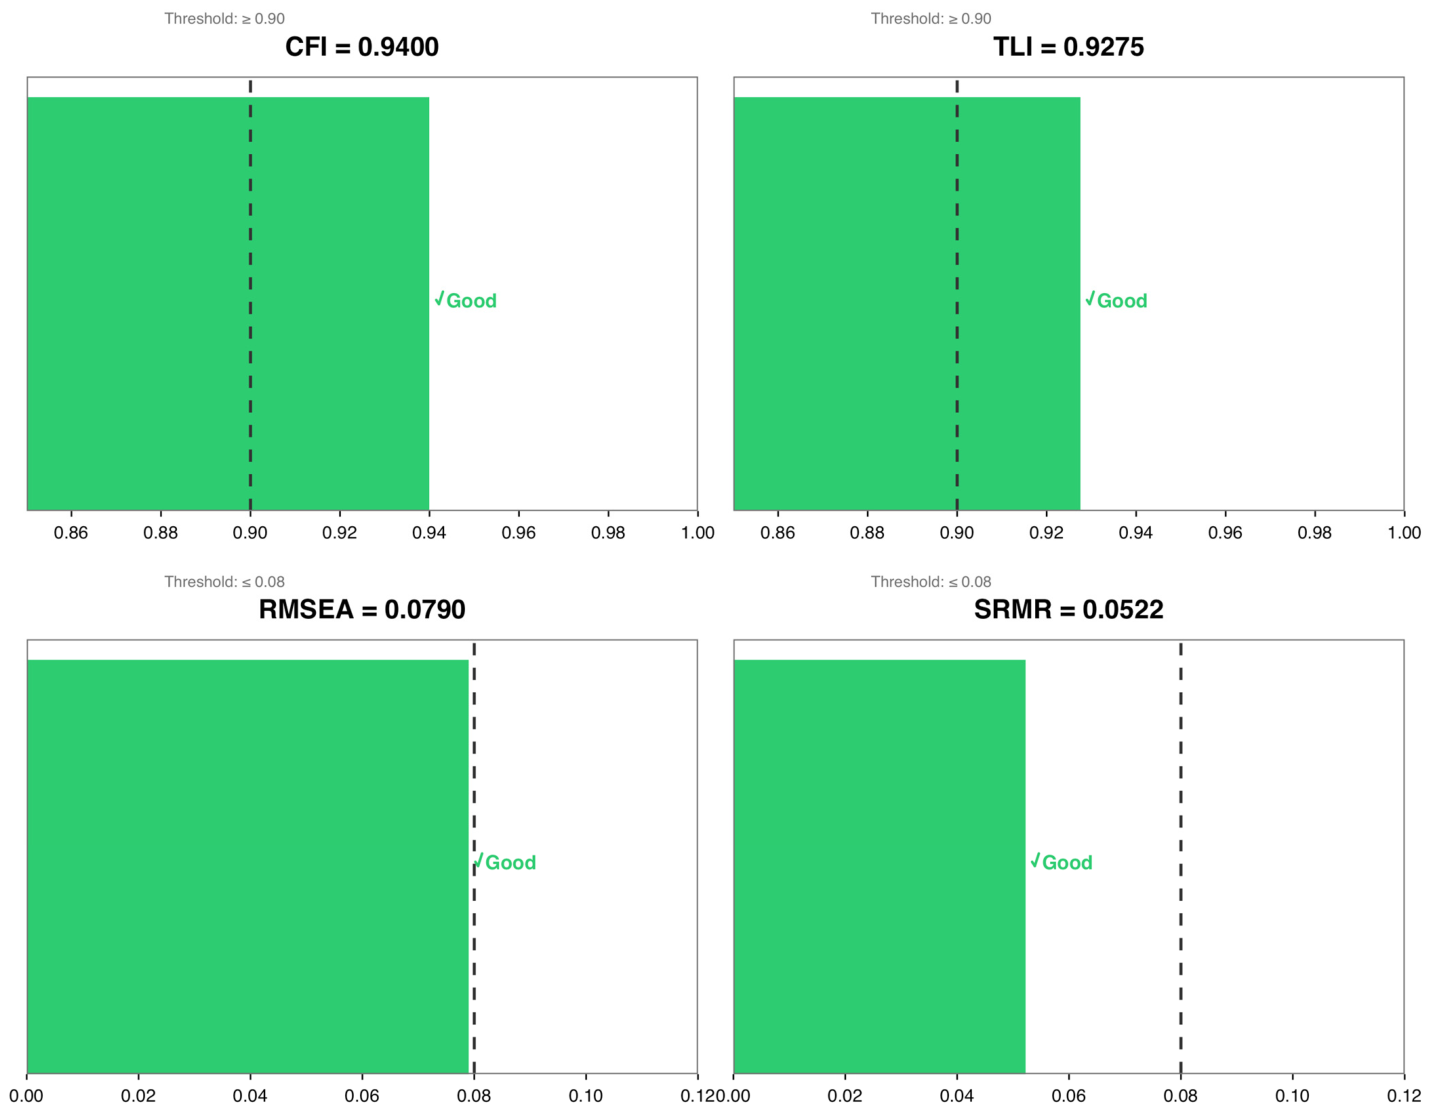
Both latent-variable specifications achieved acceptable fit, with the reduced model showing improved fit after the most overlapping construct was removed. The ML-SEM demonstrated acceptable fit: χ2(269) = 613.54, p < 0.001, χ2/df = 2.281, CFI = 0.940, TLI = 0.928, RMSEA = 0.079 [90% CI: 0.071–0.087], and SRMR = 0.052 [47]. The robustness model excluding SI showed improved fit: χ2(207) = 422.32, χ2/df = 2.040, CFI = 0.958, TLI = 0.949, RMSEA = 0.071 [90% CI: 0.061–0.081], and SRMR = 0.044 (Figure 3).

4.4. Structural Model and Hypothesis Testing

The structural results can be summarized into three patterns: stable effects, specification-dependent effects, and a weakening intention–behavior path. Table 2 presents structural path coefficients from three specifications with cross-method stability classifications.
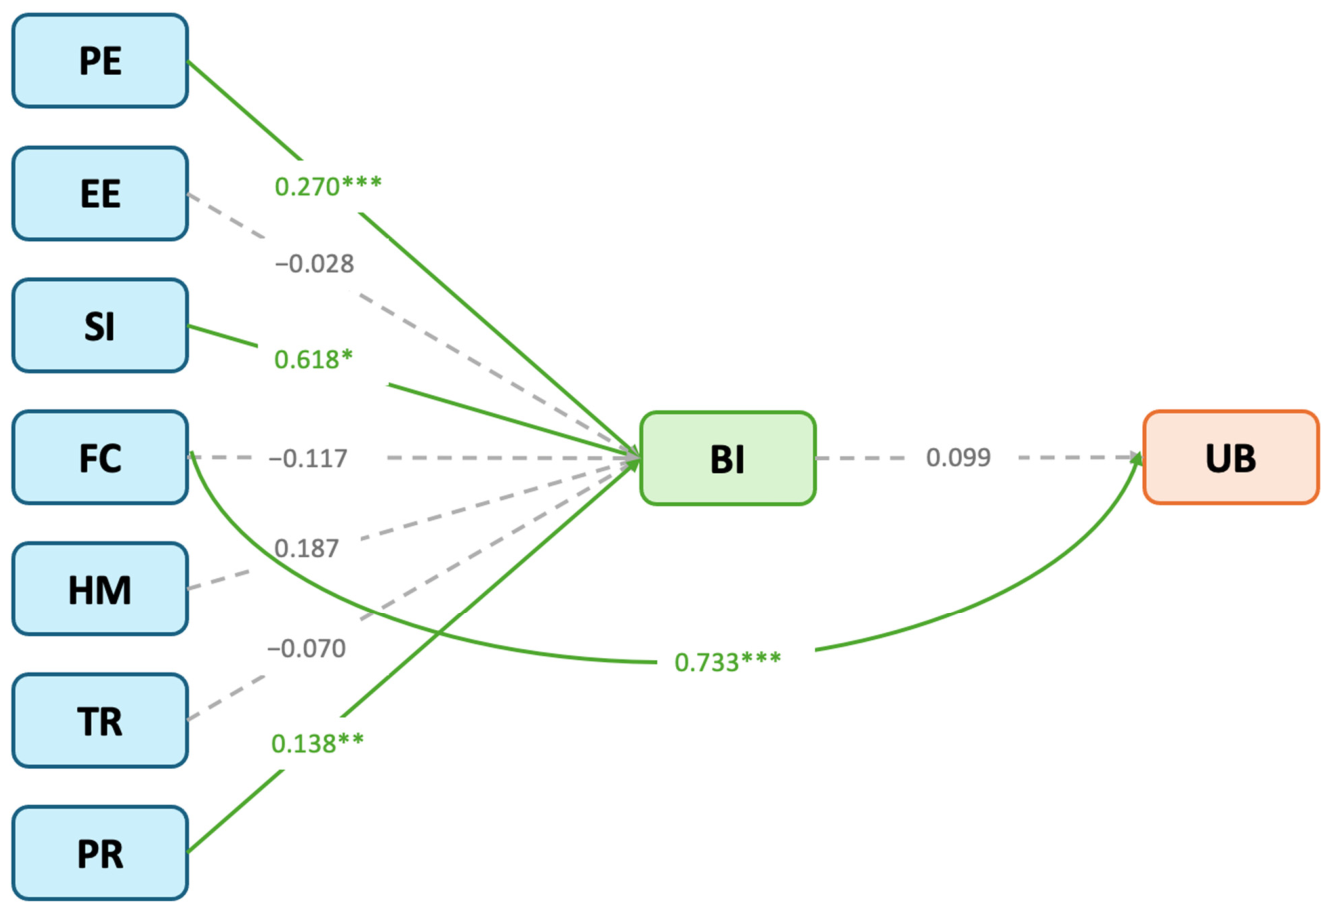
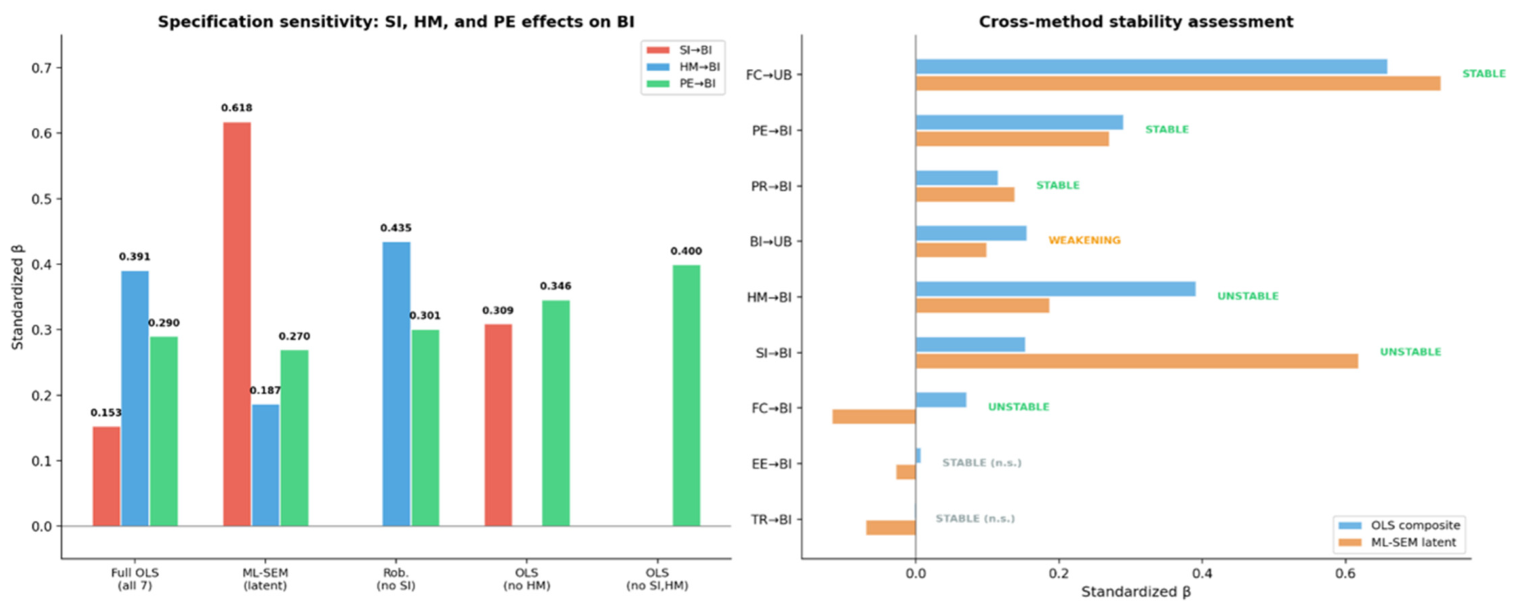
Cross-specification comparisons are reported in Table 2 and Figure 4, while Figure 5 presents the results of the full ML-SEM specification. Three categories emerged. First, PE → BI (β ≈ 0.27–0.30) and FC → UB (β ≈ 0.66–0.74) were stable across all specifications. PR → BI (β ≈ 0.12–0.14) was positive and significant across all specifications. Although this result is stable in statistical terms, it is opposite to the direction predicted by H7. Therefore, H7 must be rejected. EE and TR on BI were stably non-significant. Second, SI and HM exhibited a suppression–enhancement tradeoff: SI ranged from β = 0.153 (OLS) to 0.618 (ML-SEM), while HM ranged from 0.187 (ML, n.s.) to 0.435 (robustness, p < 0.001). Third, the BI → UB path weakened, turning from significant (OLS: β = 0.155) to non-significant (ML: β = 0.099).
Based on the full ML-SEM estimates, the standardized structural equations can be written as follows:
B I = 0.618 S I + 0.270 P E + 0.187 H M + 0.138 P R 0.117 F C 0.070 T R 0.028 E E + ζ B I
U B = 0.733 F C + 0.099 B I + ζ U B

4.5. Moderating Effects and Regional Variation

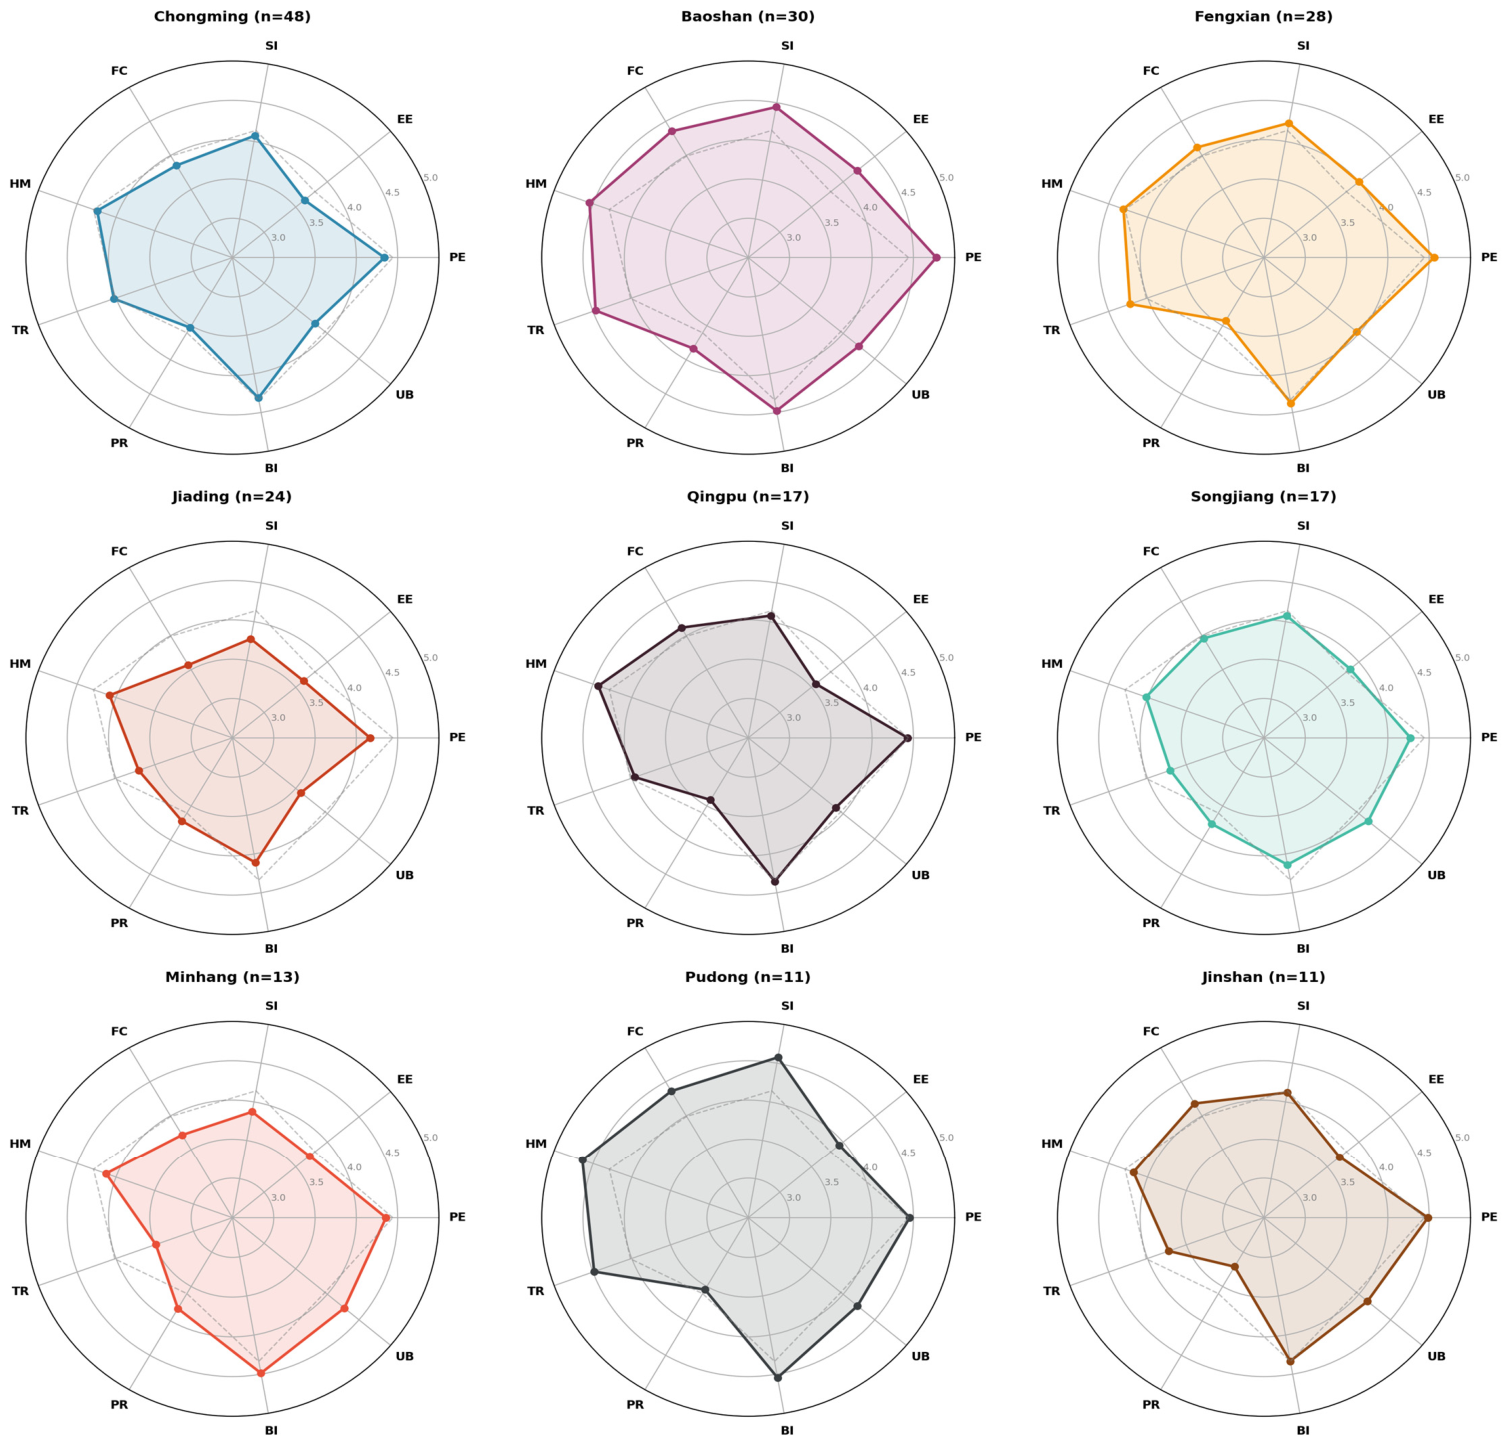
The moderation and regional analyses indicated that contextual heterogeneity was concentrated in trust and enabling conditions rather than in intention alone. Education negatively moderated SI → BI (β = −0.176, p = 0.001), TR → BI (β = −0.168, p = 0.007), PE → BI (β = −0.136, p = 0.021), HM → BI (β = −0.118, p = 0.016), and FC → BI (β = −0.126, p = 0.027). Age positively moderated SI → BI (β = 0.127, p = 0.016) and FC → BI (β = 0.144, p = 0.023), a finding consistent with UTAUT predictions [18]. Younger farmers reported significantly higher PE and PR, suggesting greater sensitivity to both the potential benefits and uncertainties of smart agriculture [41,43]. Regional ANOVA identified trust (η2 = 0.145, p < 0.001), SI (η2 = 0.091), and FC (η2 = 0.085) as constructs with significant inter-district variation (Figure 6). Baoshan ranked the highest, while Jiading ranked the lowest. This geographic pattern suggests that adoption outcomes are not solely a function of individual farmer characteristics but also a reflection of district-level differences in extension service quality, technology demonstration programs, infrastructure investment, and institutional support for digital agriculture. The composite adoption score (0.5 × BI + 0.5 × UB) ranged from 3.85 (Jiading) to 4.36 (Baoshan), a meaningful gap that has practical implications for geographically targeted intervention design.
In Figure 6, the district profile extending beyond the dashed line indicates an above-average score for that construct, whereas a contracted profile indicates a localized weakness. Baoshan shows the most consistently above-average profile and the highest composite adoption score, while Jiading displays a smaller profile, particularly for trust and facilitating conditions. The figure therefore identifies different district-level bottlenecks rather than merely reporting numerical differences: high-readiness districts require scaling and peer diffusion, whereas low-trust and low-facilitating-condition districts first require reliable services, infrastructure, and institutional confidence.
The district-level results should be interpreted as exploratory because several districts have small sample sizes. The Baoshan–highest and Jiading–lowest pattern is therefore reported as a sample-specific descriptive pattern rather than as a definitive district ranking. Similarly, the η2 values should be understood as exploratory effect-size indicators of possible inter-district variation. Larger and more balanced district samples are needed to confirm these geographic patterns.

4.6. Mediation Analysis

The mediation analyses revealed two distinct mechanisms: behavioral intention only partially transmits antecedent effects to actual use, whereas performance expectancy operates as a broader cognitive gateway to intention. Two mediation analyses were conducted: a standard test of whether BI mediated the effects of antecedent variables on UB, and an alternative test of whether PE mediated the effects of other constructs on BI.

4.6.1. Standard Mediation

The standard mediation analysis demonstrated only weak and specification-dependent evidence that BI transmits antecedent effects to actual use behavior. In the OLS composite specification, PE → BI → UB and HM → BI → UB showed significant indirect effects. However, when the same latent-variable specifications were used, the BI → UB segment was not significant. Therefore, these indirect effects should not be interpreted as robust evidence of mediation. The results reinforce the central conclusion that actual use behavior is explained more directly by facilitating conditions than by behavioral intention.

4.6.2. Alternative Mediation

The alternative mediation analysis examined whether performance expectancy mediates the effects of other constructs on behavioral intention. This test was carried out because of the observation that EE, TR, and HM did not directly predict BI in the full model, yet these constructs are theoretically expected to influence adoption. The results revealed that PE significantly mediated the effects of hedonic motivation (indirect = 0.184, z = 4.898, p < 0.001), trust (indirect = 0.138, z = 4.390, p < 0.001), effort expectancy (indirect = 0.092, z = 3.509, p < 0.001), facilitating conditions (indirect = 0.113, z = 3.977, p < 0.001), and social influence (indirect = 0.152, z = 4.579, p < 0.001) on BI. Only perceived risk did not show a significant indirect effect through PE (indirect = 0.033, p = 0.135).
Bootstrap confidence intervals (5000 replications) confirmed these findings. The 95% bias-corrected CIs for the three key indirect effects were HM → PE → BI [0.091, 0.321], TR → PE → BI [0.068, 0.254], and EE → PE → BI [0.035, 0.175], all excluding zero and confirming significant mediation.
These results indicate that effort, trust, and enjoyment do not directly strengthen adoption intention; rather, they influence intention by shaping farmers’ perceptions of the usefulness and benefits of smart agriculture. In other words, farmers translate technical qualities—ease of operation, system reliability, and enjoyable interaction—into adoption willingness only when these qualities are perceived to improve actual farm outcomes. This mechanism is consistent with the TAM logic that perceived usefulness serves as a primary cognitive gateway through which other technology evaluations are filtered [16] and with research showing that farmers’ adoption decisions are fundamentally outcome-oriented [44,50].

5. Discussion

5.1. The Central Role of Performance Expectancy

The first important finding is the central role of performance expectancy. Farmers were more willing to adopt smart agriculture when they believed it would improve productivity, management quality, or operational outcomes. This is consistent with the TAM and UTAUT as well as a broad body of the agricultural adoption literature showing that expected economic and managerial benefits remain the most stable predictors of uptake [16,18,20]. Similar evidence has been reported in precision agriculture, IoT, and digital farming research across different contexts [8,9,51]. The implication is that even in highly digitalized agricultural settings, farmers remain strongly outcome-oriented. Technology developers and extension services should therefore emphasize demonstrable performance gains—through field trials, case studies, and visible productivity improvements—rather than technology features per se.

5.2. The Model-Dependent Role of Hedonic Motivation

A second notable result is the significant role of hedonic motivation in the robustness model. This suggests that smart agriculture differs from more conventional farm technologies because it often involves interactive and data-rich user experiences. This finding aligns with UTAUT2 and recent studies on agricultural IoT and drones showing that enjoyment, novelty, and positive engagement can encourage adoption [19,25,28]. While agriculture is production-oriented, digital technologies such as apps, dashboards, drones, and data-based interfaces may create a more engaging experience, especially for younger or better-educated operators. In practical terms, this means that the design of digital agricultural tools matters: systems that are useful but difficult, unattractive, or frustrating to operate may fail to generate sustained user interest [3,50]. This finding is particularly relevant because many existing smart agriculture platforms prioritize technical functionality. However, insufficient attention is often paid to interface quality, visual appeal, and interaction design. Service providers should therefore adopt user-centered design methods. Farmer feedback should be incorporated early in the development process. Demonstration projects that allow farmers to experience the interactive and enjoyable aspects of smart agriculture—as opposed to merely hearing about productivity benefits—may be more effective in stimulating initial interest and trial behavior [22,50].

5.3. Facilitating Conditions Serve as the Dominant Driver of Actual Use

The most important finding of this study is the dominant role of facilitating conditions in explaining actual use behavior (β = 0.66–0.74, stable across all specifications). Smart agriculture does not operate like a simple consumer app that can be adopted on the basis of positive attitude alone. It requires infrastructure, network connectivity, technical knowledge, advisory support, maintenance, and often institutional coordination. This interpretation is strongly supported by the digital agriculture literature, which argues that adoption depends heavily on the surrounding service and knowledge ecosystem [6,13,15]. This result also explains why behavioral intention did not significantly predict actual use: willingness is insufficient when farmers lack the conditions required for implementation [1,2].
This finding has direct policy implications. Government and agricultural agencies should prioritize strengthening digital and physical infrastructure—including connectivity, data access, compatible devices, and farm-level technical equipment—as the single highest-impact intervention. Infrastructure deficits remain a major barrier to digital agriculture adoption across diverse contexts [1,2,36]. Policymakers should also expand technical support and extension services since smart agriculture requires training, troubleshooting, and ongoing assistance rather than one-time equipment delivery [7,15,52]. The geographic analysis in this study reinforces this point: districts with stronger agricultural support infrastructure (e.g., Baoshan and Pudong) showed consistently higher adoption metrics, while districts with weaker infrastructure (e.g., Jiading) lagged behind. The significant inter-district variation in trust (η2 = 0.145) suggests that local institutional context—including extension service quality, prior technology experiences, and community networks—significantly shapes technological confidence. This indicates that geographically targeted interventions may be more effective than uniform policy approaches, with different districts requiring different combinations of infrastructure investment, trust-building, and technical training [3,6,15,53]. In Baoshan, where facilitating conditions and trust scores are already high, the priority should be scaling up existing smart agriculture programs and promoting peer-to-peer knowledge exchange. In Jiading, where both FC and trust are low, foundational infrastructure investment and institutional trust-building through demonstration farms and reliable after-sales support are needed before attitudinal interventions can be effective.

5.4. The Intention–Behavior Gap

The BI → UB path weakened, shifting from significant (OLS: β = 0.155) to non-significant (ML-SEM: β = 0.099), revealing a substantial intention–behavior gap. In the TPB and UTAUT, intention is generally assumed to be the immediate predictor of behavior [17,18]. Yet in this study, that relationship was not significant in the latent variable model. One interpretation of this finding is that agriculture is a high-constraint environment: production timing, risk exposure, labor availability, cost burdens, and compatibility with existing systems can all prevent intended adoption from becoming actual behavior. This interpretation is consistent with studies showing that positive attitudes often coexist with slow or partial implementation in precision and digital agriculture [32,36,38]. The clear implication is that promoting smart agriculture requires more than encouraging positive attitudes; it requires building the infrastructural, advisory, and institutional environments that allow farmers to translate willingness into real adoption.
The weak BI → UB path should be interpreted cautiously because BI items measured future-oriented intention, whereas UB items measured current or prior use. Therefore, part of the weak association may reflect a built-in temporal mismatch rather than only a substantive implementation gap. In this cross-sectional design, the result is best understood as a current intention–use disconnect. Longitudinal research is needed to test whether farmers with strong current intentions subsequently adopt smart agriculture technologies.

5.5. The Positive Association Between Perceived Risk and Behavioral Intention

The positive coefficient for perceived risk is unusual but meaningful. In many studies, risk discourages adoption [30,31,45]. Here, however, higher perceived risk was associated with stronger behavioral intention across all three model specifications (β ≈ 0.12–0.14). Importantly, this positive association should not be interpreted as evidence that perceived risk itself directly promotes technology adoption. Rather, farmers who are seriously considering adopting smart agriculture may evaluate potential costs, technical failures, and uncertain returns more carefully. Their higher risk perceptions may therefore reflect greater cognitive involvement and sensitivity to uncertainty during the adoption decision process rather than a motivational effect of risk. This interpretation is compatible with research suggesting that smart agriculture decisions involve complex trade-offs rather than simple acceptance or rejection [30,45]. The age heterogeneity results support this view since younger farmers reported both higher performance expectancy and higher perceived risk, indicating that risk awareness and innovation awareness can co-evolve [41,43]. Future research should investigate this mechanism through qualitative methods and longitudinal designs. Understanding whether this positive association reflects genuine risk tolerance, information richness, or a selection effect has important implications for how risk communication is framed in smart-agriculture promotion programs. If risk awareness is indeed a marker of cognitive engagement, then attempting to minimize farmers’ risk perceptions may be counterproductive; instead, providing accurate, balanced information about both benefits and risks may be more effective in supporting informed adoption decisions [31,45].

5.6. Social Influence and Hedonic Motivation: Construct Overlap and Specification Dependence

Another critical methodological finding is the instability of SI and HM effects across model specifications. These constructs share 52% of their variance (r = 0.723) and exhibit HTMT values approaching or exceeding discriminant validity thresholds (SI–HM: 0.839; SI–FC: 0.871) [49]. In the OLS model, HM dominated (β = 0.391), while SI was marginally non-significant; in the ML-SEM, SI absorbed the shared variance and emerged as dominant (β = 0.618), while HM became non-significant; in the robustness model without SI, HM resurged (β = 0.435). This is a classic suppression–enhancement tradeoff caused by multicollinearity [39].
We therefore advise against interpreting either SI or HM as the sole “primary driver” of adoption intention. Instead, there exists a broad social–hedonic motivational factor encompassing peer influence, extension worker encouragement, enjoyment of technology use, and social identity, which collectively drive intention, yielding a combined effect of β ≈ 0.35–0.50. The non-significance of social influence may reflect its overlap with facilitating conditions, especially in agricultural contexts where peer encouragement and extension support are intertwined [12,44]. In the future, researchers should consider modeling SI and HM as a higher-order factor or employing formative measurement to resolve this concern [49]. This finding also has important implications for how the UTAUT is applied in agricultural research more broadly. Many agricultural technology adoption studies report the effects of individual UTAUT constructs without examining whether these constructs can be empirically distinguished from one another. The high correlation between SI, HM, FC, and TR in this study—forming what we term the ‘social–hedonic–institutional cluster’—suggests that these constructs may represent overlapping facets of a broader dimension of social–contextual support rather than genuinely independent predictors. This interpretation is consistent with agricultural sociology perspectives that emphasize the deeply embedded nature of farming decisions within social, institutional, and technological networks [3,6,44].

5.7. Non-Significant Effects and Methodological Implications

The weak role of effort expectancy may reflect the characteristics of this sample, which was relatively well-educated and therefore less likely to regard digital complexity as a major obstacle. As for trust in technology, it may still matter but more indirectly. The mediation results suggest that trust may influence intention by improving performance expectancy rather than by acting as an independent predictor [29]. The comparison between OLS and ML-SEM demonstrates that neither method should be interpreted in isolation [39,40]. OLS benefits from stability but conflates measurement error with structural effects; ML-SEM properly models error but amplifies multicollinearity. We recommend that researchers conducting UTAUT studies report both approaches, conduct specification-sensitivity analysis, and classify findings by robustness—a practice that addresses a gap identified in reviews of agricultural technology adoption research [6,7]. The cross-method stability classification presented in Table 2 provides a practical template that can be adopted in future studies. By explicitly labeling each finding as “stable,” “model-dependent,” or “weakening,” researchers can help readers—and policymakers who rely on research evidence—distinguish between findings that can confidently inform intervention design and those that require further investigation before being acted upon. This transparency is especially important in applied agricultural research, where findings often feed directly into policy recommendations and extension programming [1,7,21].

5.8. Alternative Mediation: PE as a Cognitive Gateway

The alternative mediation analysis reveals an important mechanism that is not captured by standard UTAUT path diagrams. Rather than directly influencing adoption intention, constructs such as effort expectancy, trust, and hedonic motivation operate through performance expectancy as a cognitive gateway. Farmers appear to evaluate whether technologies are easy to use, trustworthy, and enjoyable not as ends in themselves but as signals of whether production outcomes will ultimately be improved. This finding is consistent with the TAM’s original emphasis on perceived usefulness being the primary driver of acceptance [16] and with agricultural adoption research showing that farmers are fundamentally pragmatic in their technology evaluations [8,9,50].
This mediation pattern has practical implications. Technology promotion strategies that emphasize ease of use, system reliability, or enjoyable interfaces in isolation may be less effective than strategies that explicitly connect these attributes to tangible production benefits. For example, rather than marketing a drone system as ‘easy to operate,’ extension programs should demonstrate how the drone’s ease of operation translates into faster, more accurate crop monitoring and ultimately higher yields. This ‘usefulness translation’ mechanism aligns with recent discrete-choice-experiment evidence from China showing that visualization systems that make productivity benefits tangible significantly increase farmers’ willingness to adopt smart agriculture practices [50].

6. Conclusions

This study examined farmers’ adoption of smart agriculture technologies in Shanghai using an extended UTAUT framework, full ML-SEM with latent variables, and comprehensive specification-sensitivity analysis. Three main conclusions can be drawn, each with distinct theoretical and practical implications.
Overall, the evidence suggests that the main challenge in smart-agriculture adoption is not simply persuading farmers that technologies are desirable but ensuring that farmers have the capacity, support, and conditions required to use them effectively in real production contexts. Smart-agriculture adoption is constrained less by willingness than by implementation feasibility. This finding has important implications for how governments, technology providers, and extension services approach the promotion of agricultural digitalization.
First, farmers’ adoption intention is influenced primarily by perceived benefits and experiential factors. Performance expectancy was found to significantly promote behavioral intention, a finding consistent with the long-standing argument that perceived usefulness is a core driver of technology acceptance [16,18]. Hedonic motivation also showed a significant positive effect when specification overlap was resolved, suggesting that enjoyment and user experience matter even in a production-oriented setting [19,25]. These findings imply that technological solutions should not only be effective but also intuitive, interactive, and clearly connected to farm performance.
Second, actual use behavior is shaped mainly by facilitating conditions, not behavioral intention. This finding indicates that adoption of smart agriculture depends heavily on infrastructure, access to services, technical support, and implementation capacity. Similar conclusions have been reached in digital agriculture research emphasizing the importance of advisory networks, connectivity, and service ecosystems [7,13,15]. The intention–behavior gap confirms that adoption of smart agriculture cannot be explained solely through attitudinal readiness; real implementation depends on whether farmers can operationalize technologies within actual production systems [32,38].
Third, this study demonstrates the value of specification-sensitivity analysis in UTAUT research. The SI–HM suppression–enhancement tradeoff would not have been detected without comparing multiple model specifications. We recommend that future adoption studies (a) report both OLS and ML-SEM results; (b) classify findings by cross-method stability; (c) assess discriminant validity using HTMT; and (d) acknowledge model-dependent findings transparently [39,49].
Based on these findings, we recommend four context-sensitive actions.
First, Shanghai should establish a district-level adoption-support matrix based on facilitating conditions and trust. Districts with weaker infrastructure and lower trust, such as Jiading in this sample, require basic connectivity, local maintenance capacity, demonstration farms, and reliable after-sales support. Districts with stronger enabling conditions, such as Baoshan, can focus on scaling successful applications and organizing peer-to-peer diffusion.
Second, public support should shift from one-time equipment subsidies to life-cycle service provision. Service vouchers, equipment-sharing platforms, rapid-repair centers, seasonal technical assistance, and minimum response-time commitments would directly address the implementation constraints identified by the FC → UB path.
Third, governments and technology providers should make usefulness verifiable and trust institutionally supported. Local field trials, transparent cost–benefit records, interoperability standards, technology certification, performance warranties, and clear data-governance rules can convert abstract claims into credible evidence [50].
Fourth, extension services should create a staged pathway from intention to sustained use by combining low-cost trials or leasing, on-farm onboarding, crop-cycle-specific training, peer mentors, and post-adoption follow-up. Consistent with configurational research in other digital-governance settings [54], these interventions should be combined according to local bottlenecks rather than applied as a uniform citywide package.
This study’s limitations include its cross-sectional design, which precludes causal inference; the moderate sample size (N = 206), which limits statistical power for multi-group analysis; and the Shanghai-specific context, which may limit generalizability to less urbanized agricultural regions. Future research should employ longitudinal designs to track how adoption evolves over time, larger samples enabling multi-group SEM across demographic subgroups, and cross-regional comparisons to test whether the dominance of facilitating conditions can be generalized beyond peri-urban settings [36,38,45]. It would also be valuable to incorporate farm-level economic variables (farm size, income, and profitability), organizational participation (cooperative membership), and policy exposure, all of which have been shown to affect agricultural technology adoption [8,43,55]. Finally, qualitative or mixed-methods approaches would help unpack the mechanisms underlying the positive perceived risk effect and the intention–behavior gap, providing richer explanations than survey-based quantitative analysis alone. Despite these limitations, the study makes a clear contribution to both the UTAUT literature and our practical understanding of smart-agriculture adoption [56,57]. It shows that adoption follows a dualistic logic: intention is shaped mainly by perceived value and experience, whereas actual use depends mainly on enabling conditions. This distinction is important both theoretically and practically. It suggests that promoting smart agriculture requires more than encouraging positive attitudes; it also requires building the infrastructural, advisory, and institutional environments that allow farmers to translate willingness into real and sustained adoption.

Author Contributions

Conceptualization, S.L. and Y.N.; methodology, S.L.; software, S.L.; validation, S.L. and Y.N.; formal analysis, S.L.; investigation, Y.N.; resources, Y.N.; data curation, S.L.; writing—original draft, S.L.; writing—review and editing, Y.N.; visualization, Y.N.; supervision, Y.N.; project administration, Y.N.; funding acquisition, Y.N. All authors have read and agreed to the published version of the manuscript.

Funding

This research was funded by the Shanghai Municipal Office of Philosophy and Social Sciences Planning (Project No. 2025EJB003).

Institutional Review Board Statement

IRB approval obtained (approved by the Ethics Committee of Shanghai Municipal People’s Government Development Research Center (Project identification code: 2025-JD-36) on 1 May 2026).

Informed Consent Statement

Informed consent was obtained from all subjects involved in the study.

Data Availability Statement

The data presented in this study are available from the corresponding author upon request.

Conflicts of Interest

The authors declare no conflicts of interest.

Appendix A. English Version of the Questionnaire

Appendix A.1. Introductory Statement

Dear Respondent,
We are a research team from the Shanghai University. Commissioned by relevant authorities, this survey was conducted to explore pathways for deepening reforms in agricultural science and technology systems and to investigate the current development of smart agriculture in Shanghai. The questionnaire is designed to understand farmers’ perceptions of and use of smart agriculture technologies.
Your responses will be kept strictly confidential and used for academic research purposes only. Please complete the questionnaire according to your actual situation. Thank you very much for your participation.

Appendix A.2. Demographic Information

  • Gender
    Male
    Female
  • Age
    Under 20
    21–30
    31–40
    41–50
    51–60
    61 and above
  • Highest level of education
    Primary school or below
    Junior middle school
    High school/technical secondary school
    Junior college
    Bachelor’s degree
    Master’s degree
    Doctoral degree or above
  • Years engaged in agricultural planting
    Less than 5 years
    5–10 years
    11–20 years
    21–30 years
    More than 30 years
  • Location of farm/workplace
    Chongming
    Pudong
    Fengxian
    Jinshan
    Qingpu
    Songjiang
    Jiading
    Baoshan
    Minhang
    Other

Appendix A.3. Definition of Smart Agriculture

In this questionnaire, smart agriculture refers to a new form of agriculture that uses modern technologies such as mobile applications, sensors, automated control equipment, and satellite positioning to monitor, analyze, and manage farming activities such as planting, breeding, irrigation, fertilization, and pest and disease control, with the aim of helping farmers save labor, reduce costs, and improve yield and efficiency.
Examples include using sensors to monitor soil moisture, remotely controlling irrigation through a mobile application, using drones to spray pesticides, and using digital records to manage farm crops.

Appendix A.4. Measurement Items

For Items 6–14, responses were recorded on a five-point Likert scale:
1 = Strongly disagree; 2 = Disagree; 3 = Neutral; 4 = Agree; 5 = Strongly agree.

Appendix A.4.1. Performance Expectancy (PE)

6.1. Using smart agriculture technology can improve my agricultural production efficiency.
6.2. Using smart agriculture technology can improve crop yield and quality.
6.3. I believe smart agriculture technology is useful for my farming activities.

Appendix A.4.2. Effort Expectancy (EE)

7.1. Learning how to use smart agriculture technology is easy.
7.2. I think using smart agriculture technology does not require much effort.
7.3. The operating procedures of smart agriculture technology are clear and easy to understand.

Appendix A.4.3. Facilitating Conditions (FC)

8.1. I have the equipment, network access, and other resources required to use smart agriculture technology.
8.2. I possess the basic knowledge and skills needed to use smart agriculture technology.
8.3. When I encounter difficulties in using smart agriculture technology, I can obtain help and support from others.

Appendix A.4.4. Social Influence (SI)

9.1. My family members or friends think that I should use smart agriculture technology.
9.2. Agricultural extension personnel or village cadres encourage me to adopt smart agriculture technology.
9.3. Many nearby farmers are using smart agriculture technology, and this influences my decision.

Appendix A.4.5. Hedonic Motivation (HM)

10.1. I think using smart agriculture technology is interesting.
10.2. I feel pleased when using smart agriculture technology.
10.3. Smart agriculture technology adds enjoyment to my farming activities.

Appendix A.4.6. Trust (TR)

11.1. I believe that smart agriculture technology systems are reliable and stable and are not prone to malfunction.
11.2. I trust the data or recommendations provided by smart agriculture technology.
11.3. Overall, I trust smart agriculture technology and the institutions providing it.

Appendix A.4.7. Perceived Risk (PR)

12.1. I worry that smart agriculture technology may fail to achieve the expected effect and may instead negatively affect my production.
12.2. I believe there are economic risks in using smart agriculture technology (e.g., the investment may not generate returns).
12.3. I worry that I may encounter difficult problems or technical failures when using smart agriculture technology.

Appendix A.4.8. Behavioral Intention (BI)

13.1. I intend to use smart agriculture technology in future agricultural production.
13.2. If given the opportunity, I will try to use smart agriculture technology.
13.3. In future planting and farm management activities, I will make every effort to adopt smart agriculture technology.

Appendix A.4.9. Use Behavior (UB)

14.1. I have already used smart agriculture technology in agricultural production.
14.2. I frequently use smart agriculture technology in farming activities.

Appendix A.5. Additional Questions on the Promotion of Smart Agriculture in Shanghai

15. What is your view on the current promotion of smart agriculture in Shanghai?
A. It has important strategic significance and should be accelerated to create demonstration effects.
B. The direction is correct, but greater emphasis should be placed on application scenarios and practical effectiveness.
C. The concept is advanced, but practical implementation still faces substantial constraints.
D. Promotion should be approached cautiously to avoid formalism and duplicated investment.
E. Other: _________
16. In your view, which aspects of smart agriculture promotion in Shanghai need improvement? (multiple choice)
A. The maturity and stability of key technologies need improvement. (Technology)
B. The fit between technological applications and actual agricultural production scenarios is insufficient. (Technology)
C. Technical service and maintenance support systems are not yet adequate. (Service)
D. Training and guidance for agricultural operators are insufficient. (Service)
E. The cost of smart agriculture equipment is relatively high. (Equipment)
F. The standardization and suitability of equipment need improvement. (Equipment)
G. Agricultural operators’ digital application capabilities are insufficient. (Human capacity)
H. There is a shortage of interdisciplinary smart agriculture talent. (Human capacity)
I. The precision and relevance of policy support need improvement. (Policy)
J. Policy continuity and coordination need to be strengthened. (Policy)
K. Other: _________

Appendix A.6. Closing Statement

Thank you very much for taking the time to participate in this survey. Your responses will provide valuable support for the future development of smart agriculture in Shanghai. If you are interested in the final findings of this study or would like to exchange further information related to smart agriculture in Shanghai, please contact: nyy2000@163.com.

References

  1. Wolfert, S.; Ge, L.; Verdouw, C.; Bogaardt, M.-J. Big Data in Smart Farming—A Review. Agric. Syst. 2017, 153, 69–80. [Google Scholar] [CrossRef]
  2. Fountas, S.; Sorensen, C.G.; Tsiropoulos, Z.; Cavalaris, C.; Vatsanidou, A.; Liakos, B.; Canavari, M.; Wiebensohn, J.; Tisserye, B. Farm Management Information Systems: Current Situation and Future Perspectives. Comput. Electron. Agric. 2015, 115, 40–50. [Google Scholar] [CrossRef]
  3. Rose, D.C.; Wheeler, R.; Winter, M.; Lobley, M.; Chivers, C.-A. Agriculture 4.0: Making It Work for People, Production, and the Planet. Land Use Policy 2021, 100, 104933. [Google Scholar] [CrossRef]
  4. Finger, R.; Swinton, S.M.; El Benni, N.; Walter, A. Precision Farming at the Nexus of Agricultural Production and the Environment. Annu. Rev. Resour. Econ. 2019, 11, 313–335. [Google Scholar] [CrossRef]
  5. Arunmetha, S.; Praghash, K.; Reddy, M.G.; Nirmala, S. Arming Farmers with Smart Farming. In Proceedings of the 2022 IEEE INDICON; IEEE: Piscataway, NJ, USA, 2022; pp. 1–5. [Google Scholar] [CrossRef]
  6. Klerkx, L.; Jakku, E.; Labarthe, P. A Review of Social Science on Digital Agriculture, Smart Farming and Agriculture 4.0. NJAS-Wagening. J. Life Sci. 2019, 90–91, 100315. [Google Scholar] [CrossRef]
  7. El Bilali, H.; Ben Hassen, T.; Bottalico, F.; Berjan, S.; Capone, R. Acceptance and Adoption of Technologies in Agriculture. AGROFOR 2021, 6, 135. [Google Scholar] [CrossRef]
  8. Daberkow, S.G.; McBride, W.D. Farm and Operator Characteristics Affecting Precision Agriculture Technology Awareness and Adoption. Precis. Agric. 2003, 4, 163–177. [Google Scholar] [CrossRef]
  9. Adrian, A.M.; Norwood, S.H.; Mask, P.L. Producers’ Perceptions and Attitudes toward Precision Agriculture Technologies. Comput. Electron. Agric. 2005, 48, 256–271. [Google Scholar] [CrossRef]
  10. Robertson, M.J.; Llewellyn, R.S.; Mandel, R.; Lawes, R.; Bramley, R.G.V.; Swift, L.; Metz, N.; O’Callaghan, C. Adoption of Variable Rate Fertiliser Application in Australian Grains. Precis. Agric. 2012, 13, 181–199. [Google Scholar] [CrossRef]
  11. Isgin, T.; Bilgic, A.; Forster, D.L.; Batte, M.T. Using Count Data Models to Determine Factors Affecting Precision Farming Technology Adoption. Comput. Electron. Agric. 2008, 62, 231–242. [Google Scholar] [CrossRef]
  12. Agussabti, A.; Rahmaddiansyah, R.; Hamid, A.H.; Zakaria, Z.; Munawar, A.A.; Abu Bakar, B. Farmers’ Perspectives on the Adoption of Smart Farming Technology to Support Food Farming in Aceh Province, Indonesia. Open Agric. 2022, 7, 857–870. [Google Scholar] [CrossRef]
  13. Gong, W.; Ma, R.; Zhang, H. Digital Agricultural Technology Services and Farmers’ Willingness to Choose Digital Production Technology in Sichuan Province, China. Front. Sustain. Food Syst. 2024, 8, 1401316. [Google Scholar] [CrossRef]
  14. Li, L.; Zhang, M.; Chandio, A.A.; Liu, Y. Investigating Vegetable Farmers’ Intention and Behavior to Adopt IoT Technology. Front. Sustain. Food Syst. 2024, 8, 1340874. [Google Scholar] [CrossRef]
  15. Fielke, S.; Taylor, B.M.; Jakku, E. Digitalisation of Agricultural Knowledge and Advice Networks: A State-of-the-Art Review. Agric. Syst. 2020, 180, 102763. [Google Scholar] [CrossRef]
  16. Davis, F.D. Perceived Usefulness, Perceived Ease of Use, and User Acceptance of Information Technology. MIS Q. 1989, 13, 319–340. [Google Scholar] [CrossRef] [PubMed]
  17. Ajzen, I. The Theory of Planned Behavior. Organ. Behav. Hum. Decis. Process. 1991, 50, 179–211. [Google Scholar] [CrossRef]
  18. Venkatesh, V.; Morris, M.G.; Davis, G.B.; Davis, F.D. User Acceptance of Information Technology: Toward a Unified View. MIS Q. 2003, 27, 425–478. [Google Scholar] [CrossRef]
  19. Venkatesh, V.; Thong, J.Y.L.; Xu, X. Consumer Acceptance and Use of Information Technology: Extending the Unified Theory of Acceptance and Use of Technology. MIS Q. 2012, 36, 157–178. [Google Scholar] [CrossRef]
  20. Tey, Y.S.; Brindal, M. Factors Influencing the Adoption of Precision Agricultural Technologies: A Review for Policy Implications. Precis. Agric. 2012, 13, 713–730. [Google Scholar] [CrossRef]
  21. Pierpaoli, E.; Carli, G.; Pignatti, E.; Canavari, M. Drivers of Precision Agriculture Technologies Adoption: A Literature Review. Procedia Technol. 2013, 8, 61–69. [Google Scholar] [CrossRef]
  22. Chuang, J.-H.; Wang, J.-H.; Liou, Y.-C. Farmers’ Knowledge, Attitude, and Adoption of Smart Agriculture Technology in Taiwan. Int. J. Environ. Res. Public Health 2020, 17, 7236. [Google Scholar] [CrossRef] [PubMed]
  23. Chung, B.-G.; Kang, D.B. Factors Affecting Acceptance of Smart Farming Technology. Glob. Bus. Adm. Rev. 2020, 17, 54–80. [Google Scholar] [CrossRef]
  24. Shi, Y.; Siddik, A.B.; Masukujjaman, M.; Zheng, G.; Hamayun, M.; Ibrahim, A.M. The Antecedents of Willingness to Adopt and Pay for the IoT in the Agricultural Industry: An Application of the UTAUT 2 Theory. Sustainability 2022, 14, 6640. [Google Scholar] [CrossRef]
  25. Michels, M.; von Hobe, C.-F.; Weller von Ahlefeld, P.J.; Musshoff, O. The Adoption of Drones in German Agriculture: A Structural Equation Model. Precis. Agric. 2021, 22, 1728–1748. [Google Scholar] [CrossRef]
  26. Xie, K.; Zhu, Y.; Ma, Y.; Chen, Y.; Chen, S.; Chen, Z. Willingness of Tea Farmers to Adopt Ecological Agriculture Techniques Based on the UTAUT Extended Model. Int. J. Environ. Res. Public Health 2022, 19, 15351. [Google Scholar] [CrossRef] [PubMed]
  27. Li, L.; Min, X.; Guo, J.; Wu, F. The Influence Mechanism Analysis on the Farmers’ Intention to Adopt Internet of Things Based on UTAUT-TOE Model. Sci. Rep. 2024, 14, 15016. [Google Scholar] [CrossRef] [PubMed]
  28. Kowsalya, S.; Venkatesa Palanichamy, N.; Rohini, A.; Kalpana, M.; Murugananthi, D.; Parimalarangan, R. Farmers’ Intention to Adopt Drone Technology: A Structural Equation Modelling Approach. Plant Sci. Today 2025, 12, 9539. [Google Scholar] [CrossRef]
  29. Shih, S.; Chiu, B.-H. Willingness of Farmers to Adopt Blockchain Technology in Smart Agriculture. J. Econ. Financ. Account. Stud. 2023, 5, 24–34. [Google Scholar] [CrossRef]
  30. Jaroenwanit, P.; Phuensane, P.; Sekhari, A.; Gay, C. Risk Management in the Adoption of Smart Farming Technologies by Rural Farmers. Uncertain Supply Chain Manag. 2023, 11, 533–546. [Google Scholar] [CrossRef]
  31. Adnan, N.; Rehman, H.M.; Alam, M.N. Exploring Agricultural Innovation: An Empirical Investigation of Factors Influencing the Adoption and Non-Adoption of Smart Fertilizer Technology among Farmers in Developing Countries. Agric. Food Secur. 2025, 14, 11. [Google Scholar] [CrossRef]
  32. Paustian, M.; Theuvsen, L. Adoption of Precision Agriculture Technologies by German Crop Farmers. Precis. Agric. 2017, 18, 701–716. [Google Scholar] [CrossRef]
  33. Kamarul Zaman, N.B.; Abdul Raof, W.N.A.; Saili, A.R.; Aziz, N.N.; Fatah, F.A.; Vaiappuri, S.K.N. Adoption of Smart Farming Technology Among Rice Farmers. J. Adv. Res. Appl. Sci. Eng. Technol. 2023, 29, 268–275. [Google Scholar] [CrossRef]
  34. Bang, J.; Han, J.W. Factors Influencing Farmers’ Motivation to Adopt Smart Farm Technology in South Korea. arXiv 2025, arXiv:2504.01795. [Google Scholar] [CrossRef]
  35. Peña-Holguín, R.R.; Vaca-Coronel, C.A.; Farías-Lema, R.M.; Zapatier-Castro, S.V.; Valenzuela-Cobos, J.D. Smart Agriculture in Ecuador: Adoption of IoT Technologies by Farmers in Guayas to Improve Agricultural Yields. Agriculture 2025, 15, 1679. [Google Scholar] [CrossRef]
  36. Žáková Kroupová, Z.; Rumánková, L.; Bajan, B.; Čechura, L.; Hloušková, Z.; Aulová, R.; Šimek, P.; Jarolímek, J. Drivers and Barriers to Precision Agriculture Adoption in Czech Agriculture. Precis. Agric. 2026, 27, 17. [Google Scholar] [CrossRef]
  37. Zhou, Z.; Zhang, Y.; Yan, Z. Will Digital Financial Inclusion Increase Chinese Farmers’ Willingness to Adopt Agricultural Technology? Agriculture 2022, 12, 1514. [Google Scholar] [CrossRef]
  38. Nguyen, L. Behavioral Intention to Adopt Precision Agriculture—A Study of Vietnamese Smallholder Rice Farmers. Ph.D. Thesis, RMIT University, Melbourne, Australia, 2025. [Google Scholar] [CrossRef]
  39. Grewal, R.; Cote, J.A.; Baumgartner, H. Multicollinearity and Measurement Error in Structural Equation Models. Mark. Sci. 2004, 23, 519–529. [Google Scholar] [CrossRef]
  40. Kline, R.B. Principles and Practice of Structural Equation Modeling, 4th ed.; Guilford Press: New York, NY, USA, 2016. [Google Scholar]
  41. Li, F.; Zang, D.; Chandio, A.A.; Yang, D.; Jiang, Y. Farmers’ Adoption of Digital Technology and Agricultural Entrepreneurial Willingness: Evidence from China. Technol. Soc. 2023, 73, 102253. [Google Scholar] [CrossRef]
  42. Aker, J.C. Dial “A” for Agriculture: A Review of Information and Communication Technologies for Agricultural Extension in Developing Countries. Agric. Econ. 2011, 42, 631–647. [Google Scholar] [CrossRef]
  43. Mittal, S.; Mehar, M. Socio-Economic Factors Affecting Adoption of Modern ICT by Farmers in India. J. Agric. Educ. Ext. 2016, 22, 199–212. [Google Scholar] [CrossRef]
  44. Kuehne, G.; Llewellyn, R.; Pannell, D.J.; Wilkinson, R.; Dolling, P.; Ouzman, J.; Ewing, M. Predicting Farmer Uptake of New Agricultural Practices. Agric. Syst. 2017, 156, 115–125. [Google Scholar] [CrossRef]
  45. Erekalo, K.T.; Gemtou, M.; Kornelis, M.; Pedersen, S.M.; Christensen, T.; Denver, S. Understanding the behavioral factors influencing farmers’ future adoption of climate-smart agriculture: A multi-group analysis. J. Clean. Prod. 2025, 510, 145632. [Google Scholar] [CrossRef]
  46. Kumari, S.; Jeble, S.; Patil, Y.B. Barriers to Technology Adoption in Agriculture-Based Industry and Its Integration into Technology Acceptance Model. Int. J. Agric. Resour. Gov. Ecol. 2018, 14, 338–351. [Google Scholar] [CrossRef]
  47. Hu, L.; Bentler, P.M. Cutoff Criteria for Fit Indexes in Covariance Structure Analysis. Struct. Equ. Model. 1999, 6, 1–55. [Google Scholar] [CrossRef]
  48. Fornell, C.; Larcker, D.F. Evaluating Structural Equation Models with Unobservable Variables. J. Mark. Res. 1981, 18, 39–50. [Google Scholar] [CrossRef]
  49. Henseler, J.; Ringle, C.M.; Sarstedt, M. A New Criterion for Assessing Discriminant Validity in Variance-Based Structural Equation Modeling. J. Acad. Mark. Sci. 2015, 43, 115–135. [Google Scholar] [CrossRef]
  50. Tang, S.; Sato, T.; Kawasaki, K.; Suzuki, N. Farmers’ Willingness to Adopt Smart Agriculture Practices: Evidence from a Discrete Choice Experiment on the Visualization System in China. Agriculture 2026, 16, 438. [Google Scholar] [CrossRef]
  51. Schimmelpfennig, D. Farm Profits and Adoption of Precision Agriculture; AgEcon Search; United States Department of Agriculture: Washington, DC, USA, 2016. [Google Scholar] [CrossRef]
  52. Siregar, Z.A.; Anggoro, S.; Irianto, H.E.; Purnaweni, H. A Systematic Literature Review: UTAUT Model Research for Green Farmer Adoption. Int. J. Adv. Sci. Eng. Inf. Technol. 2022, 12, 2485–2490. [Google Scholar] [CrossRef]
  53. Yu, J.; Li, J.; Lo, K.; Huang, S.; Li, Y.; Zhao, Z. Farmers’ Adoption of Smart Agricultural Technologies for Black Soil Conservation in China. Front. Sustain. Food Syst. 2025, 9, 1561633. [Google Scholar] [CrossRef]
  54. Zhou, C. Toward Human-AI Collaboration for Sustainable Development: Unveiling the Drives of Artificial Intelligence Adoption in Environmental Governance. Sustain. Dev. 2026, 1–14. [Google Scholar] [CrossRef]
  55. Wu, F. Adoption and Income Effects of New Agricultural Technology on Family Farms in China. PLoS ONE 2022, 17, e0267101. [Google Scholar] [CrossRef] [PubMed]
  56. Lan, J.; Ban, Q. The Farm-Level Economic and Environmental Benefits of Precision Agriculture Technology Adoption: A Meta-Analysis of Global Evidence. Sustainability 2025, 17, 11223. [Google Scholar] [CrossRef]
  57. Yeung, L.; Fang, Y.; Xu, T. An Empirical Study on the Adoption Determinants of Permissioned Blockchain as Decentralized Inter-organizational Systems. FinTech Sustain. Innov. 2026, 2, A6. [Google Scholar] [CrossRef]
Figure 1. Demographic profile of the respondents (N = 206).
Sustainability 18 07553 g001
Figure 2. Multicollinearity diagnostics: VIF, HTMT ratios, and inter-construct correlations (Bold values in panel (c) denote strong correlations (∣r∣ ≥ 0.70)).
Sustainability 18 07553 g002
Figure 3. Model fit indices with recommended thresholds.
Sustainability 18 07553 g003
Figure 4. Specification sensitivity: trade-off of SI and HM effects across models (left); cross-method stability (right) (n.s. = not significant).
Sustainability 18 07553 g004
Figure 5. Full ML-SEM path diagram. Solid and dashed lines indicate statistically significant and non-significant paths, respectively. *** p < 0.001, ** p < 0.01, * p < 0.05.
Sustainability 18 07553 g005
Figure 6. District-level radar profiles (dashed = overall sample mean).
Sustainability 18 07553 g006
Table 1. Measurement model: reliability and convergent validity (ML estimation).
CodeConstructkαCRAVELoading Range A V E
PEPerformance Expectancy30.9460.9480.8580.864–0.9640.926
EEEffort Expectancy30.9150.9200.7940.847–0.9260.891
SISocial Influence30.7870.8160.5980.720–0.8320.773
FCFacilitating Conditions30.8970.9040.7590.864–0.8820.871
HMHedonic Motivation30.9560.9570.8800.911–0.9560.938
TRTrust30.9100.9200.7930.842–0.9280.891
PRPerceived Risk30.9260.9270.8090.886–0.9090.899
BIBehavioral Intention30.9570.9580.8840.922–0.9500.940
UBUse Behavior20.9480.9480.9020.932–0.9670.950
Note: All values exceed recommended thresholds (α ≥ 0.70, CR ≥ 0.70, AVE ≥ 0.50, loadings ≥ 0.70) [40,48].
Table 2. Structural path coefficients across three model specifications with stability assessment.
Hyp.PathOLSML-SEMRobust. (No SI)R2Stability
H1PE → BI0.290 ***0.270 ***0.301 ***BI: 0.64/0.70/0.67Stable
H2EE → BI0.007−0.0280.002 Stable (n.s.)
H3aFC → BI0.071−0.1170.159 Unstable
H3bFC → UB0.659 ***0.733 ***0.735 ***UB: 0.57/0.63/0.63Stable
H4SI → BI0.153 0.618 *excluded Unstable
H5HM → BI0.391 ***0.1870.435 *** Unstable
H6TR → BI−0.002−0.0700.025 Stable (n.s.)
H7PR → BI0.115 *0.138 **0.127 * Stable
(opposite to H7)
H8BI → UB0.155 **0.0990.100 Weakening
Note: *** p < 0.001, ** p < 0.01, * p < 0.05, and  p < 0.10. R2 indicates OLS/ML/Robustness (n.s. = not significant).
Disclaimer/Publisher’s Note: The statements, opinions and data contained in all publications are solely those of the individual author(s) and contributor(s) and not of MDPI and/or the editor(s). MDPI and/or the editor(s) disclaim responsibility for any injury to people or property resulting from any ideas, methods, instructions or products referred to in the content.