1. Introduction
Logistics firms are increasingly expected to improve operational efficiency while responding to sustainability-related pressures. In China, the logistics industry plays an important role in production, circulation, e-commerce, manufacturing integration, and regional development. At the same time, the sector faces pressure from energy use, delivery intensity, carbon emissions, and the need for low-carbon transformation. Prior studies have linked China’s logistics development to carbon emissions, energy eco-efficiency, regional logistics efficiency, and low-carbon constraints [
1,
2,
3,
4,
5,
6,
7,
8,
9,
10]. Studies on artificial intelligence and sustainable supply chains also suggest that artificial intelligence may support eco-efficient logistics, supply chain performance prediction, low-carbon decision support, and sustainability-oriented operations [
11,
12,
13,
14,
15,
16,
17,
18]. However, these studies do not imply that the use of AI automatically leads to improvements in environmental performance. Such claims require direct indicators such as carbon emissions, energy use, fuel consumption, or waste reduction. Logistics performance has also been linked to green logistics performance, service quality, and triple-bottom-line outcomes [
19,
20,
21]. For logistics firms, sustainability is therefore closely related to resource-efficient operations, reduced process waste, reliable service delivery, and improved coordination. However, operational efficiency should not be treated as direct evidence of environmental performance unless carbon emissions, energy use, waste reduction, or other environmental indicators are directly measured.
Artificial intelligence is increasingly used to support logistics operations. In this study, AI utilization refers to managers’ assessments of the extent to which their firms use or invest in logistics-oriented AI applications in operational and managerial processes. Consistent with the broader operational scope described in the questionnaire, these applications include cargo transportation, dispatching and routing support, inventory forecasting, warehouse management, customer demand forecasting, order allocation, customer service support, AI infrastructure, operational data analysis, and managerial decision support. This definition distinguishes AI utilization from routine digital tools, descriptive reporting systems, and purely rule-based information systems that do not learn from data or generate prediction or optimization outputs. Therefore, the study examines perceived logistics-oriented AI utilization across transportation, warehousing, inventory, dispatching, customer-related operations, and managerial decision-making, rather than direct technical audits of AI systems, physical assets, data infrastructure, or objective system performance. Prior research has shown that artificial intelligence, machine learning, automation, predictive analytics, and smart logistics systems may support logistics planning, supply chain resilience, and operational coordination [
22,
23,
24,
25,
26,
27]. More specific logistics studies have examined warehouse optimization, inventory forecasting, routing, automation, smart logistics systems, and applications of artificial intelligence in supply chain operations [
28,
29,
30,
31,
32,
33,
34,
35,
36].
Prior AI–logistics research can be broadly distinguished at two levels. Application- and task-level studies examine how specific AI systems support sustainable logistics optimization, human–AI collaboration in truck operations, and AI-enabled reverse logistics [
37,
38,
39]. These studies provide detailed evidence on particular tasks and process outcomes. Still, they do not by themselves explain how AI utilization across multiple logistics processes becomes associated with firm-level performance. In contrast, firm-level studies examine AI and machine learning as organizational capabilities or strategic enablers associated with strategic performance measurement, supply chain consistency, logistics capabilities, and firm performance [
40,
41]. This stream provides an organizational perspective but often treats AI utilization as an aggregate resource. The present study is positioned primarily within the firm-level stream: it examines managers’ perceptions of firm-level AI use or investment across multiple logistics processes rather than the application-specific performance of individual AI systems.
Application-level research further indicates that different AI functions may support different logistics processes. Predictive analytics and demand forecasting have been applied to demand and inventory planning; routing and optimization systems to transportation and dispatching; warehouse analytics and automation to storage, picking, and material handling; and AI-based decision-support tools to operational coordination and managerial decision-making [
37,
38,
39]. These application–process relationships provide operational context for the firm-level AI utilization construct examined in this study. However, because the questionnaire did not include separate multi-item measures for each application domain, the present study does not empirically compare the individual effects of these domains.
Despite this potential, the business value of artificial intelligence is not automatic. The information technology business value perspective argues that digital technologies are linked to performance when they are embedded in organizational routines and combined with complementary resources and capabilities [
42,
43]. This view is consistent with the artificial intelligence productivity paradox, which suggests that the benefits of artificial intelligence may depend on organizational adaptation, process redesign, and complementary investments [
44,
45,
46]. Dynamic capabilities theory further suggests that firms must sense opportunities, seize technological possibilities, and reconfigure resources to transform technological inputs into performance outcomes [
47,
48]. In this study, AI utilization is viewed as a technological input that may support sensing through richer operational information, seizing through new service or process opportunities, and transforming through the redesign of logistics routines. In logistics firms, AI utilization may therefore be associated with perceived firm performance when it is connected with innovation capability and logistics efficiency.
Innovation capability and logistics efficiency are two important mechanisms in this process. Artificial intelligence may support innovation capability by improving information processing, opportunity recognition, knowledge recombination, service development, and business model adjustment [
49,
50,
51,
52,
53,
54]. Firm-level studies also suggest that artificial intelligence and digital transformation may be linked to industrial innovation, product innovation, organizational learning, strategic agility, and ambidextrous innovation [
55,
56,
57,
58,
59,
60,
61,
62,
63,
64,
65,
66,
67]. For logistics firms, this capability is important because logistics services increasingly require rapid responses to demand variability, smart warehousing, platform-based competition, and customer-specific operational requirements. Logistics efficiency is more directly connected to daily operations. Artificial intelligence may support logistics efficiency through better forecasting, routing, order allocation, inventory control, warehouse operations, and real-time decision support. These improvements may reduce delays, lower costs, improve responsiveness, and support more reliable service delivery [
68,
69,
70,
71,
72,
73,
74]. At the same time, efficiency gains do not automatically mean sustainability gains. If improved efficiency leads to expanded delivery volume, higher service frequency, or increased resource use, the environmental benefits may be weakened. Therefore, this study treats logistics efficiency as a sustainability-relevant operational pathway rather than a direct measure of environmental sustainability.
Managerial support may also influence how artificial intelligence is implemented. Artificial intelligence projects often require resource allocation, employee training, data governance, system integration, process redesign, and cross-functional coordination. From an upper echelons perspective, managerial attention and strategic priorities shape how technologies are interpreted and implemented within organizations [
75]. Prior studies on digital transformation, top management support, predictive analytics, human–artificial intelligence complementarity, informatization support, technological change, and organizational change suggest that managerial and organizational conditions can affect whether digital technologies become embedded in work routines [
76,
77,
78,
79,
80,
81,
82,
83,
84,
85]. Therefore, this study examines whether managerial support strengthens the relationship between AI utilization and innovation capability. Because managerial support is measured as a general support construct, this moderating role is treated as an empirical question rather than assumed to be effective in all artificial intelligence implementation contexts.
Although prior studies have examined artificial intelligence, logistics performance, digital transformation, and sustainability, three gaps remain. First, application- and task-level studies identify how specific AI systems support particular logistics activities, but they offer a limited explanation of how AI use across multiple processes is associated with firm-level performance [
37,
38,
39]. Second, recent firm-level studies have linked AI and machine learning to strategic performance measures, logistics capabilities, supply chain consistency, and firm performance [
40,
41]. Accordingly, the research gap does not concern whether AI utilization is generally associated with positive organizational outcomes; rather, it concerns the organizational mechanisms through which perceived AI utilization across multiple logistics processes becomes associated with firm-level performance. In particular, limited attention has been paid to whether innovation capability and logistics efficiency operate as complementary organizational mechanisms and whether an additional capability-to-process pathway, in which innovation capability is associated with logistics efficiency, is also empirically plausible. Third, the sustainability relevance of AI in logistics is often discussed conceptually or through application-specific outcomes. Empirical studies, therefore, need to distinguish operational efficiency from direct environmental performance when emissions, energy use, fuel consumption, and waste are not objectively measured. General managerial support is examined in this study as an additional boundary condition rather than as the central explanatory mechanism.
To address these gaps, this study investigates how managers’ perceptions of firm-level AI use or investment across multiple logistics processes are associated with perceived firm performance among Chinese logistics firms. The research model examines multiple organizational pathways through which perceived cross-process AI utilization may be associated with perceived firm performance. Specifically, innovation capability and logistics efficiency are examined as complementary mediating mechanisms, together with an additional sequential capability-to-process pathway linking innovation capability to logistics efficiency. Managerial support is examined as an additional potential boundary condition in the relationship between AI utilization and innovation capability. The study does not identify which individual AI application is technically superior, nor does it estimate objective improvements in delivery time, inventory accuracy, energy use, carbon emissions, or other operational and environmental outcomes. The application examples used to describe AI utilization clarify the content domain of the firm-level construct measured in the questionnaire; they are not separate latent variables or additional paths in the research model. China provides a relevant empirical context because its logistics sector is large, rapidly digitalizing, and affected by e-commerce growth, manufacturing–logistics integration, platformization, regional network expansion, and low-carbon transformation pressures [
1,
2,
6,
7,
8,
9,
10,
86,
87,
88,
89].
This study makes three main contributions. First, it clarifies the relationship between application-level and firm-level AI logistics research by using prior application-specific studies to define the operational content of a firm-level AI utilization construct. This positioning recognizes the process specificity emphasized in studies of logistics optimization, truck operations, and reverse logistics [
37,
38,
39], while examining the organizational-level pathway emphasized in recent performance and capability research [
40,
41]. Second, the study contributes to the business value of artificial intelligence by examining multiple organizational mechanisms through which perceived AI utilization may become associated with firm performance. The principal novelty does not lie in proposing isolated positive relationships; rather, it lies in distinguishing a capability-based pathway through innovation capability, a process-based pathway through logistics efficiency, and an additional sequential capability-to-process pathway. In this way, the study avoids assuming a single direct or exclusively ordered AI–performance mechanism and instead evaluates whether these mechanisms operate in complementary ways. This pathway links the information technology business value perspective with the dynamic capabilities theory. Third, the study contributes to sustainable logistics research by clarifying an efficiency-based operational pathway without equating perceived logistics efficiency with direct environmental improvement. Because the study does not directly measure carbon emissions, energy consumption, fuel use, waste reduction, or objective environmental performance, its sustainability contribution is operational and efficiency-based. The non-significant moderating effect of general managerial support is treated as a secondary boundary finding rather than the model’s central contribution.
Based on this background, the study addresses three research questions. First, how is perceived firm-level AI utilization across multiple logistics processes associated with perceived firm performance in logistics-related firms? Second, do innovation capability and logistics efficiency mediate this association as complementary mechanisms, and is an additional sequential capability-to-process pathway also empirically supported? Third, does general managerial support strengthen the relationship between AI utilization and innovation capability? By answering these questions, the study provides an organizational-level explanation of how perceived cross-process AI utilization is associated with capability development, logistics process efficiency, and perceived firm performance, while explicitly distinguishing this purpose from application-specific technical evaluation.
2. Materials and Methods
2.1. Research Design and Research Model
This study uses a quantitative, cross-sectional survey design to examine the associations between perceived firm-level AI utilization across multiple logistics processes and perceived firm performance in logistics-related firms. Survey-based organizational research is useful for examining managers’ assessments of technological utilization, organizational capabilities, operational processes, and multidimensional firm-level outcomes when externally audited technical and performance data are not uniformly available [
40,
41,
90,
91]. However, because the data are cross-sectional and self-reported, the estimated relationships represent statistical associations among the constructs rather than established temporal or causal effects.
In this study, logistics-oriented AI utilization refers to managers’ assessments of the extent to which their firms use or invest in AI applications related to logistics operations and managerial decision-making. Consistent with the measurement items, these applications include cargo transportation, inventory forecasting, warehouse management, customer demand forecasting, order allocation, AI infrastructure, data analysis, and decision support. Prior studies indicate that AI, machine learning, predictive analytics, automation, and optimization systems are applied across transportation, routing, inventory planning, warehousing, supply chain coordination, and operational decision-making [
22,
23,
24,
25,
26,
27,
28,
29,
30,
31,
32,
33,
34,
35,
36]. Application-level studies have also examined sustainable logistics optimization, human–AI collaboration in truck operations, and AI-enabled reverse logistics [
37,
38,
39]. In contrast, firm-level studies have treated AI and machine learning as broader organizational resources or strategic enablers associated with logistics capabilities and firm performance [
40,
41]. Accordingly, the construct used in this study captures perceived firm-level AI utilization across multiple logistics processes rather than direct technical audits of physical assets, data infrastructure, specific software systems, algorithms, or objective system performance.
Perceived firm performance is treated as the outcome variable. Innovation capability and logistics efficiency are conceptualized as distinct yet connected mediating mechanisms. Innovation capability represents a capability-building mechanism through which firms may recognize AI-enabled opportunities, recombine information and knowledge, develop new service or process ideas, and redesign organizational routines. Prior research has associated AI and digital transformation with innovation capability, service innovation, business model innovation, organizational learning, agility, and knowledge recombination [
49,
50,
51,
52,
53,
54,
55,
56,
57,
58,
59,
60,
61,
62,
63,
64,
65,
66,
67]. Logistics efficiency represents a process-level mechanism through which AI-related and capability-based changes may become associated with cost efficiency, responsiveness, service reliability, operational coordination, and continuous process improvement. This positioning is consistent with prior logistics research that links digital innovation, predictive analytics, smart logistics, technological innovation, and process redesign to logistics efficiency and operational performance [
22,
23,
24,
25,
26,
27,
28,
29,
30,
31,
32,
33,
34,
35,
36,
68,
69,
70,
71,
72,
73,
74].
The theoretical structure of the model draws on the information technology business value perspective and dynamic capabilities theory. The information technology business value perspective suggests that technological resources are more likely to become performance-relevant when they are embedded in organizational routines and combined with complementary capabilities and process-level changes [
42,
43,
44,
45,
46]. Dynamic capabilities theory further explains how firms may sense technological and operational opportunities, seize them through innovation and resource mobilization, and transform routines and processes in response to changing conditions [
47,
48]. These perspectives support the distinction between AI utilization as a technological resource, innovation capability as an organizational capability mechanism, logistics efficiency as a process-level mechanism, and perceived firm performance as the organizational outcome.
Managerial support is examined as a secondary boundary condition in the association between AI utilization and innovation capability, rather than as the model’s central explanatory mechanism. Previous studies suggest that managerial attention, resource provision, project evaluation, employee support, and organizational coordination may influence digital transformation and technology implementation [
75,
76,
77,
78,
79,
80,
81,
82,
83,
84,
85]. However, the effects of managerial support may depend on the specificity of the support provided. Broad managerial encouragement may differ from implementation-specific mechanisms such as data governance, technical training, system integration, process redesign, and cross-functional coordination [
76,
77,
78,
79,
80,
81,
82,
83,
84,
85]. Therefore, the model treats general managerial support as a potential moderator whose empirical relevance requires direct testing.
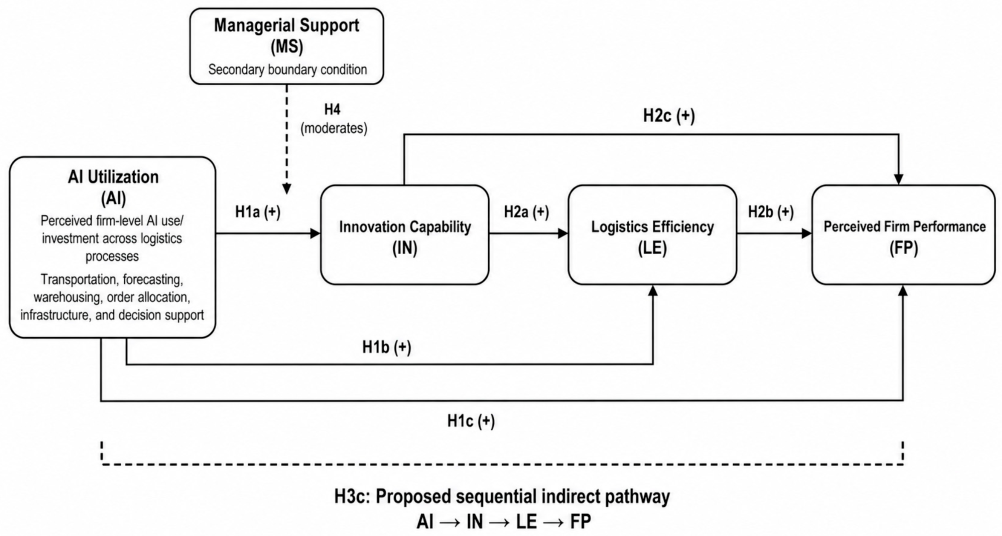
As shown in
Figure 1, the research model includes three baseline associations from AI utilization to innovation capability (H1a), logistics efficiency (H1b), and perceived firm performance (H1c). These paths reflect prior evidence that AI and related digital technologies may be associated with organizational innovation, logistics process efficiency, and firm-level performance [
22,
23,
24,
25,
26,
27,
28,
29,
30,
31,
32,
33,
34,
35,
36,
37,
38,
39,
40,
41,
49,
50,
51,
52,
53,
54,
55,
56,
57,
58,
59,
60,
61,
62,
63,
64,
65,
66,
67,
68,
69,
70,
71,
72,
73,
74,
92,
93,
94,
95,
96,
97,
98,
99,
100,
101,
102,
103,
104]. The model also includes the relationship from innovation capability to logistics efficiency (H2a), reflecting the expectation that firms with stronger innovation capabilities are better positioned to translate technological information and opportunities into redesigned logistics routines and operational improvements [
47,
48,
63,
64,
65,
66,
67,
68,
69,
70,
71,
72,
73,
74,
105,
106]. Logistics efficiency is associated with perceived firm performance (H2b), as cost efficiency, responsiveness, reliability, and process coordination are central to the competitiveness and performance of logistics-related firms [
19,
20,
21,
68,
69,
70,
71,
72,
73,
74]. Innovation capability is also directly associated with perceived firm performance (H2c), consistent with prior research that links innovation capability, innovation performance, organizational agility, and business model development to broader firm-level outcomes [
49,
50,
51,
52,
53,
54,
55,
56,
57,
58,
59,
60,
61,
62,
63,
64,
65,
66,
67,
92,
93,
94,
95,
96,
97,
98,
99,
100,
101,
102,
103,
104,
105,
106].
The indirect hypotheses are represented by combinations of these structural paths rather than by separate causal arrows. H3a concerns the indirect association between AI utilization and perceived firm performance through innovation capability. H3b concerns the indirect association through logistics efficiency. These hypotheses are consistent with the information technology business value argument that technological resources become performance-relevant through complementary organizational and process mechanisms [
42,
43,
44,
45,
46]. H3c concerns the sequential indirect association in which perceived AI utilization is associated first with innovation capability, innovation capability is subsequently associated with logistics efficiency, and logistics efficiency is associated with perceived firm performance. This ordering reflects a capability-to-process interpretation derived from dynamic capabilities theory, in which firms first develop or mobilize organizational capabilities and then apply those capabilities to the redesign and improvement of operational processes [
47,
48].
Nevertheless, innovation capability and logistics efficiency are not assumed to operate only through a single exclusive sequence. Innovation capability may be directly associated with perceived firm performance, while logistics efficiency may independently mediate the AI utilization–performance association. The research model, therefore, permits capability-based, process-based, and sequential indirect pathways.
Appendix A comparisons with reverse-sequence and parallel-mediation models are conducted to evaluate the relative structural plausibility of these alternative explanations. These alternative models are treated as robustness analyses rather than as additional formal hypotheses.
The proposed sequence places innovation capability before logistics efficiency because it concerns the organizational ability to recognize and develop AI-enabled opportunities. In contrast, logistics efficiency concerns the operational application of AI-related and capability-based changes to logistics activities. This ordering is theoretically consistent with the distinction between capability development and process-level value realization in the information technology business value and dynamic capabilities literatures [
42,
43,
44,
45,
46,
47,
48]. However, because the study uses cross-sectional data, the proposed ordering is theoretically specified and statistically evaluated but should not be interpreted as establishing temporal precedence or causality.
The examples listed within the AI utilization construct in
Figure 1 clarify the measure’s operational scope. Prior research shows that predictive analytics may support demand and inventory planning, optimization algorithms may support routing and dispatching, warehouse analytics and automation may support storage and material handling, and AI-based decision tools may support coordination and managerial decision-making [
22,
23,
24,
25,
26,
27,
28,
29,
30,
31,
32,
33,
34,
35,
36,
37,
38,
39]. Nevertheless, the examples in
Figure 1 do not represent separate latent variables, validated application-specific dimensions, or additional causal paths. The study, therefore, does not estimate or compare the technical effectiveness of individual AI applications. Application-specific differentiation is examined only through supplementary exploratory item-level analyses, which should be interpreted with caution because a single questionnaire item represents each application domain.
The model is most relevant to logistics-related firms that have begun using or investing in AI applications and seek to improve organizational capabilities and logistics operations. It is not designed to determine whether the initial adoption of AI causes objective improvements in delivery time, inventory accuracy, warehouse productivity, fuel consumption, carbon emissions, energy use, or other operational and environmental outcomes. Prior sustainability research indicates that AI and logistics efficiency may be relevant to resource-efficient and sustainability-oriented operations [
11,
12,
13,
14,
15,
16,
17,
18,
19,
20,
21]. Still, direct environmental claims require objective measures of emissions, energy consumption, fuel use, mileage, and waste reduction.
The five constructs are defined as follows. AI utilization refers to managers’ perceived firm-level use of or investment in logistics-oriented AI applications in transportation, forecasting, warehousing, order allocation, infrastructure, data analysis, and decision support [
22,
23,
24,
25,
26,
27,
28,
29,
30,
31,
32,
33,
34,
35,
36,
37,
38,
39,
40,
41]. Innovation capability refers to the firm’s perceived ability to encourage new ideas, support innovation activities, identify market opportunities, transform AI-related outputs into new services or business models, and maintain innovation management systems [
49,
50,
51,
52,
53,
54,
55,
56,
57,
58,
59,
60,
61,
62,
63,
64,
65,
66,
67,
105,
106]. Logistics efficiency refers to managers’ perceptions of the operational efficiency of logistics activities, including cost efficiency, service satisfaction, responsiveness, continuous process improvement, and AI-enabled efficiency improvement [
19,
20,
21,
22,
23,
24,
25,
26,
27,
28,
29,
30,
31,
32,
33,
34,
35,
36,
68,
69,
70,
71,
72,
73,
74]. Managerial support refers to the perceived extent to which managers encourage the use of AI, provide resources, evaluate AI-related projects, support employee experimentation, and promote organizational learning [
75,
76,
77,
78,
79,
80,
81,
82,
83,
84,
85]. Firm performance refers to perceived organizational performance in profitability, employee satisfaction and cohesion, customer satisfaction, operational efficiency, and social responsibility or sustainability-related performance [
90,
91].
Because firm performance encompasses both financial and non-financial dimensions, it is treated as a subjective, multidimensional organizational performance construct rather than as an objective financial, operational, or environmental performance measure. Prior research supports the use of subjective performance measures that integrate financial and non-financial organizational outcomes, particularly when knowledgeable managers serve as key informants [
90,
91]. Nevertheless, the findings should be interpreted as associations among managerial perceptions rather than as objective evidence of financial, operational, or environmental performance change.
2.2. Research Hypotheses
The hypotheses are developed from the perspective of information technology business value and dynamic capabilities theory. The central theoretical question is not simply whether perceived AI utilization is positively associated with organizational outcomes. Such associations are theoretically plausible and have received increasing attention in prior research. Rather, this study examines the organizational mechanisms through which managers’ perceptions of AI utilization across multiple logistics processes become associated with perceived firm performance.
AI utilization is treated as a logistics-oriented technological resource, innovation capability as a capability-building mechanism, logistics efficiency as a process-level mechanism, and perceived firm performance as the organizational outcome. The information technology business value perspective explains why the use of technology is more likely to become performance-relevant when it is embedded in organizational routines and linked to complementary capabilities and operational processes [
42,
43,
44,
45,
46]. Dynamic capabilities theory explains how firms sense technological and operational opportunities, seize them through capability development, and transform organizational routines and processes [
47,
48].
Accordingly, the proposed model distinguishes baseline constituent associations from the indirect mechanisms through which perceived AI utilization may become associated with perceived firm performance. The direct relationships establish the structural components of the broader model, but they are not presented as the principal theoretical novelty of the study. Innovation capability and logistics efficiency are conceptualized as complementary mechanisms that may operate independently and sequentially. The model, therefore, accommodates capability-based, process-based, and capability-to-process pathways rather than assuming a single exclusive mechanism.
2.2.1. Baseline Associations of AI Utilization
AI utilization may be positively associated with innovation capability by supporting information processing, opportunity recognition, knowledge recombination, and service redesign. These functions are particularly relevant to logistics firms because managers must respond to changes in customer demand, delivery uncertainty, inventory fluctuations, and service-specific operational requirements. AI-based information and analytical outputs may help firms identify operational problems, assess alternative service solutions, and redesign logistics routines.
From a dynamic capabilities perspective, these functions are related to sensing, as AI can help firms identify operational problems and changes in customer and market conditions. They are related to seizing because firms may use AI-generated information to develop new services, process solutions, or adjust their business models. They are related to transforming because firms may redesign organizational routines and decision processes around AI-enabled information. Prior studies also indicate that AI and digital transformation are associated with innovation capability, service innovation, business model innovation, organizational agility, and knowledge recombination [
49,
50,
51,
52,
53,
54,
55,
56,
57,
58,
59,
60,
61,
62,
63,
64,
65,
66,
67,
92,
93,
94,
95,
96]. Therefore, the following hypothesis is proposed:
H1a. Perceived AI utilization is positively associated with innovation capability.
AI utilization may also be positively associated with logistics efficiency. Logistics operations require timely and accurate decisions in demand forecasting, routing, inventory management, warehouse operations, transportation scheduling, order allocation, and exception handling. Learning-based prediction, algorithmic optimization, and AI-supported analysis may reduce information delays, improve resource allocation, and support more responsive logistics processes. For example, demand forecasting may support inventory planning, routing algorithms may assist vehicle dispatching, and warehouse analytics may help identify avoidable operational delays. This argument is consistent with prior research on smart logistics, automation, predictive analytics, machine learning, inventory forecasting, warehouse optimization, and supply chain optimization [
22,
23,
24,
25,
26,
27,
28,
29,
30,
31,
32,
33,
34,
35,
36]. Thus, this study proposes:
H1b. Perceived AI utilization is positively associated with logistics efficiency.
AI utilization may also be positively associated with perceived firm performance when it is linked to decision quality, process coordination, operational responsiveness, and resource allocation. However, the information technology business value perspective suggests that the use of technology alone does not guarantee performance improvement. Technology is more likely to become performance-relevant when it is integrated into organizational routines and combined with complementary resources and capabilities [
42,
43,
44,
45,
46].
Recent studies have linked AI capability, digital technologies, AI-driven decision-making, and AI adoption with organizational or firm performance [
40,
41,
97,
98,
99,
100,
101,
102,
103,
104]. In logistics firms, AI applications may become performance-relevant when they are connected with operational activities such as forecasting, transportation planning, warehousing, order fulfillment, and customer response. The following baseline hypothesis is therefore proposed:
H1c. Perceived AI utilization is positively associated with perceived firm performance.
2.2.2. Capability, Process, and Performance Associations
Innovation capability and logistics efficiency represent conceptually distinct but potentially connected aspects of AI-related value realization. Innovation capability reflects a firm’s ability to recognize opportunities, recombine knowledge, develop new service ideas, improve processes, and redesign organizational routines. Logistics efficiency reflects the perceived operational condition of logistics activities, including cost efficiency, responsiveness, coordination, service reliability, and continuous process improvement.
Innovation capability is expected to be positively associated with logistics efficiency because firms with stronger innovation capabilities may be better able to redesign workflows, introduce new service methods, adjust operational routines, and apply technological information to operational problems. From a dynamic capabilities perspective, innovation capability helps firms reconfigure resources and translate technological opportunities into organizational and process changes [
47,
48].
In logistics firms, this relationship is important because operational efficiency often depends on the firm’s ability to convert data-based insights into practical improvements in transportation planning, warehouse operations, inventory control, order fulfillment, and customer response. Prior research also suggests that technological innovation and logistics innovation are associated with supply chain efficiency and operational performance [
63,
64,
65,
66,
67,
68,
69,
70,
71,
72,
73,
74,
100,
101]. Thus, the following hypothesis is proposed:
H2a. Innovation capability is positively associated with logistics efficiency.
Logistics efficiency is expected to be positively associated with perceived firm performance because efficient logistics operations may be associated with lower costs, more reliable services, higher customer satisfaction, shorter response times, and more stable operations. Customers commonly evaluate logistics services based on delivery reliability, service accuracy, response speed, and cost control.
Logistics efficiency is also relevant to sustainability-oriented operations because efficient transportation, warehousing, inventory management, and order allocation may reduce unnecessary resource consumption and process waste [
19,
20,
21,
107,
108,
109,
110]. However, logistics efficiency is not treated as direct evidence of environmental sustainability, as this study does not measure carbon emissions, fuel consumption, energy use, or waste reduction. Therefore, this study proposes:
H2b. Logistics efficiency is positively associated with perceived firm performance.
Innovation capability may also be directly associated with perceived firm performance. Firms with stronger innovation capability may be better able to identify market opportunities, recombine technological and organizational knowledge, develop differentiated logistics services, improve existing processes, and adjust their business models in response to changing customer and operational requirements. These capabilities may be associated with perceived firm performance through improved adaptability, service differentiation, customer value creation, and more effective use of technological resources.
Prior studies have linked AI-enabled innovation capability, service innovation, business model innovation, organizational agility, and innovation performance with broader organizational outcomes [
49,
50,
51,
52,
53,
54,
55,
56,
57,
58,
59,
60,
61,
62,
63,
64,
65,
66,
67,
92,
93,
94,
95,
96,
97,
98,
99,
100,
101,
102,
103,
104,
105,
106]. Accordingly, the following hypothesis is proposed:
H2c. Innovation capability is positively associated with perceived firm performance.
2.2.3. Complementary Indirect and Sequential Mechanisms
The indirect effects clarify whether innovation capability and logistics efficiency function as complementary intervening mechanisms in the association between perceived AI utilization and perceived firm performance. The model allows these mechanisms to operate independently through separate indirect pathways and jointly through a sequential capability-to-process pathway.
Innovation capability may translate AI-related operational information into new services, process improvements, business model adjustments, and organizational routines. Through this capability-building mechanism, perceived AI utilization may become associated with perceived firm performance rather than remaining a stand-alone technological resource. This argument is consistent with the information technology business value perspective, which emphasizes the role of complementary organizational capabilities in converting technological resources into organizational outcomes [
42,
43,
44,
45,
46]. Therefore, the following hypothesis is proposed:
H3a. Innovation capability mediates the association between perceived AI utilization and perceived firm performance.
Logistics efficiency may also function as an intervening process-level mechanism. AI applications in forecasting, routing, warehouse management, inventory control, order allocation, and operational decision support are closely connected with logistics processes. Improvements in logistics efficiency may subsequently be associated with perceived firm performance through lower costs, stronger responsiveness, greater service reliability, and more coordinated logistics operations [
23,
24,
25,
27,
28,
35,
36,
37,
38,
39,
40,
41,
42,
68,
69,
70,
71,
72,
73,
74]. Thus, this study proposes:
H3b. Logistics efficiency mediates the association between perceived AI utilization and perceived firm performance.
In addition to these two specific indirect pathways, innovation capability and logistics efficiency may operate sequentially. Perceived AI utilization may first be associated with innovation capability by supporting information processing, opportunity recognition, knowledge recombination, and service redesign. Innovation capability may then help firms apply AI-related information to logistics workflows, operational routines, and service processes. These capability-based changes may subsequently be associated with logistics efficiency, which is more proximally related to perceived firm performance.
This ordering reflects a capability-to-process logic. Innovation capability concerns the organizational ability to identify and develop AI-enabled opportunities. In contrast, logistics efficiency concerns the operational application of capability-based changes to cost control, coordination, responsiveness, and continuous process improvement. The sequential pathway, therefore, provides an additional explanation of how perceived AI utilization may become associated with perceived firm performance [
43,
44,
45,
47,
48,
49,
68,
69,
70,
71,
72,
73,
74].
Because the study uses cross-sectional data, the proposed ordering is theoretically specified and statistically evaluated, but should not be interpreted as establishing temporal or causal precedence. Accordingly, the following hypothesis is proposed:
H3c. Innovation capability and logistics efficiency sequentially mediate the association between perceived AI utilization and perceived firm performance, such that perceived AI utilization is first associated with innovation capability, innovation capability with logistics efficiency, and logistics efficiency with perceived firm performance.
Although the proposed model specifies a capability-to-process sequence, innovation capability and logistics efficiency may also operate as parallel mechanisms. An alternative sequence in which logistics efficiency precedes innovation capability is also theoretically conceivable, because operational improvements may generate organizational learning, information, and resources that support subsequent innovation. Therefore, parallel-mediation and reverse-sequence models are examined as supplementary alternative models rather than formulated as additional hypotheses. Because the data are cross-sectional, these comparisons assess relative structural plausibility rather than temporal or causal precedence.
2.2.4. Managerial Support as a Secondary Boundary Condition
Managerial support is examined as a secondary boundary condition rather than as the model’s central explanatory mechanism. AI implementation may require managerial attention, resource allocation, employee training, data integration, process redesign, and cross-functional coordination. From an upper echelons perspective, managers influence how technological initiatives are interpreted, prioritized, resourced, and implemented within organizations [
75].
Prior studies on digital transformation, top management support, predictive analytics, human–AI complementarity, informatization support, technological change, and organizational change also suggest that managerial and organizational conditions may influence technology implementation and employee engagement [
76,
77,
78,
79,
80,
81,
82,
83,
84,
85]. General managerial support may therefore strengthen the association between perceived AI utilization and innovation capability by encouraging experimentation, allocating resources, and supporting the organizational use of AI-related information.
At the same time, the moderating role of managerial support remains an empirical question. The construct used in this study captures broad managerial encouragement and resource support rather than specific implementation mechanisms such as data governance, technical training, system integration, process redesign, or cross-functional coordination. The following hypothesis is therefore proposed as a secondary boundary-condition hypothesis:
H4. General managerial support positively moderates the association between perceived AI utilization and innovation capability, such that the association is stronger when managerial support is higher.
2.3. Sample and Data Collection
Data were collected from middle- and senior-level managers working in logistics-related firms in China through the Tencent Questionnaire platform and WeChat-based distribution. The survey was administered between 30 November 2025 and 7 December 2025. Participants were recruited through logistics-industry professional networks and organizational contacts. The study used purposive, non-probability sampling because the research required respondents with sufficient knowledge of their firms’ logistics operations, use of AI or digital technology, innovation activities, and overall organizational performance.
Before accessing the main questionnaire, respondents were asked to confirm that they worked in a logistics-related firm and held a middle- or senior-level managerial position. They were also asked whether they had sufficient knowledge of the firm’s logistics operations and AI or digital technology use. A separate item identified whether the respondent was directly involved in AI- or digital transformation-related activities within the firm. These eligibility checks and respondent-information items were used to improve the relevance of the respondents as key informants for firm-level constructs.
A total of 300 questionnaires were returned. Of these, 12 were excluded for incomplete responses, 10 for failing to meet eligibility or screening criteria, and 24 for invalid response patterns. The final analytic sample comprised 254 valid responses, corresponding to an 84.7% usable-response rate. The specific exclusion criteria were established before the main statistical analyses and were applied consistently across all responses.
Among the 254 respondents, 194 (76.4%) reported direct involvement in AI- or digital transformation-related activities. This subgroup was used in a supplementary robustness analysis to assess whether the main direct, indirect, and moderation results remained stable among respondents with more direct exposure to AI-related organizational activities. Direct involvement was self-reported and was used to strengthen key-informant relevance; it did not constitute an independent technical verification of implemented AI systems, algorithms, infrastructure, or objective operational outcomes.
The final sample included managers from third-party logistics, manufacturing logistics, e-commerce logistics, and cold-chain logistics firms of different sizes. Middle- and senior-level managers were selected as key informants because they were expected to have broader knowledge of technology investment, operational processes, innovation activities, resource allocation, and firm-level outcomes than employees without managerial responsibilities. This respondent selection is consistent with the study’s organizational-level focus.
The final sample size was considered adequate for the planned reliability and validity assessments, PROCESS Model 83 analysis, bootstrap tests of indirect and conditional indirect effects, and supplementary structural and robustness analyses. Nevertheless, because the sampling strategy was purposive and network-based, the sample should not be interpreted as statistically representative of all logistics firms in China.
2.4. Measures
All core constructs were measured using five-point Likert scales ranging from 1 = strongly disagree to 5 = strongly agree. The measurement items were adapted from prior studies and adjusted to the context of logistics-oriented AI utilization in Chinese logistics-related firms. Because the study used a survey design, the measures capture managers’ perceptions of firm-level AI use or investment, organizational capabilities, logistics processes, managerial support, and firm performance rather than externally audited technical, operational, financial, or environmental records.
AI utilization was measured using five items reflecting perceived firm-level AI use or investment across multiple logistics-related activities. The items covered AI use in cargo transportation, inventory forecasting and warehouse management, customer demand forecasting and order allocation, investment in AI infrastructure, and AI-based data analysis and decision-making. These items were combined to represent an aggregate, cross-process AI utilization construct. They were not designed as separate multi-item subdimensions for transportation AI, warehousing AI, demand-forecasting AI, AI infrastructure, or decision-support AI. Accordingly, the main analysis evaluates managers’ overall perceptions of firm-level AI utilization rather than the technical effectiveness of individual AI applications.
To provide additional differentiation within this broad construct, supplementary exploratory analyses examined the five AI items separately and simultaneously. However, because a single item represented each application domain, these analyses were treated as exploratory diagnostics rather than as tests of validated application-specific latent variables. The results should therefore not be interpreted as definitive comparisons of the technical or causal effects of individual AI applications.
Innovation capability was measured using five items reflecting the firm’s perceived ability to encourage new ideas, provide support for innovation activities, recognize market opportunities, convert AI-related outputs into new services or business models, and maintain innovation management systems. The construct was operationalized as a perceived organizational capability rather than as an objective count of innovations, patents, new services, or implemented business models.
Logistics efficiency was measured using five items reflecting perceived cost efficiency, customer satisfaction with logistics services, responsiveness to market demand, continuous evaluation and improvement of logistics operations, and AI-enabled efficiency improvement. The construct was operationalized as a perceived process-level measure. It does not provide objective evidence of delivery time, routing efficiency, warehouse productivity, inventory accuracy, fuel consumption, energy use, carbon emissions, or waste reduction.
Firm performance was measured using five subjective items covering profitability, employee satisfaction and cohesion, customer satisfaction, operational efficiency, and social responsibility or sustainability-related performance. The items were combined to represent a multidimensional managerial assessment of firm performance rather than separate financial, employee-related, customer-related, operational, and environmental outcome models. This approach is consistent with prior research supporting subjective measures that integrate financial and non-financial organizational outcomes [
90,
91]. Because the construct includes heterogeneous performance dimensions, supplementary analyses examined alternative scoring procedures and reduced-item specifications to assess whether the main findings depended on the inclusion of operational-efficiency or sustainability-related items.
Managerial support was measured using five items reflecting managerial encouragement of AI use, the provision of resources, the evaluation of AI-related projects, support for employee experimentation, and the promotion of organizational learning. The scale captures broad managerial support rather than implementation-specific mechanisms. It does not separately measure data governance, technical training quality, system integration, process redesign, or cross-functional coordination. This distinction is important because the hypothesized moderating effect concerns general managerial support rather than specific AI implementation practices.
Construct scores were calculated by averaging the corresponding items after data screening and reliability assessment. Higher scores indicated higher perceived AI utilization, innovation capability, logistics efficiency, managerial support, and firm performance. The complete measurement items and their original or adapted sources are presented in Appendix
Table A1.
2.5. Common Method Bias
Because the predictor, mediator, moderator, and outcome variables were collected from the same respondents at a single point in time, common method bias was considered a potential threat. Several procedural remedies were applied during questionnaire design and data collection. Participation was voluntary and anonymous; respondents were informed that there were no right or wrong answers, and the questionnaire used neutral wording. In addition, measurement items were organized into separate construct blocks to reduce respondents’ tendency to infer the proposed relationships among the variables.
Common method bias was assessed using several statistical diagnostics. First, Harman’s single-factor test was conducted by entering all measurement items into an unrotated exploratory factor analysis. The first factor accounted for 35.528% of the total variance, below the commonly used 50% criterion. This result indicates that a single factor did not account for the majority of the observed variance. However, Harman’s test is only a preliminary diagnostic and cannot by itself rule out common method bias.
Second, full-collinearity variance inflation factor diagnostics were conducted by regressing each focal construct on the remaining constructs. The resulting VIF values ranged from 1.432 to 1.652, which were below the conservative threshold of 3.3. The detailed results are reported in Appendix
Table A2. These values do not indicate severe construct-level collinearity or a dominant common method component. Nevertheless, full-collinearity VIF diagnostics should be interpreted as supplementary evidence rather than as definitive proof that common method bias is absent.
Third, a single-factor confirmatory factor analysis was estimated by loading all measurement items onto one common latent factor. The single-factor model showed poor fit: χ
2 = 1201.529, df = 275, χ
2/df = 4.369, GFI = 0.654, AGFI = 0.592, NFI = 0.610, TLI = 0.636, CFI = 0.667, and RMSEA = 0.115. These fit indices were substantially poorer than those of the proposed five-factor measurement model. The detailed comparison is reported in Appendix
Table A3. This result suggests that a single common latent factor does not adequately represent the covariance among the measurement items.
A marker-variable test or latent method-factor model was not conducted because the original questionnaire did not include a theoretically unrelated marker construct or dedicated method indicators. Taken together, the procedural remedies, Harman’s single-factor test, full-collinearity VIF diagnostics, and single-factor CFA provide no evidence that a single common method factor dominated the results. However, because all core variables were measured using self-reported data from the same respondents at a single point in time, common method bias cannot be entirely ruled out. The findings should therefore be interpreted cautiously, and this issue is acknowledged in the limitations section.
2.6. Reliability and Validity Assessment
Reliability and construct validity were assessed using Cronbach’s alpha, exploratory factor analysis, confirmatory factor analysis, composite reliability, average variance extracted, the Fornell–Larcker criterion, and heterotrait–monotrait ratios. Cronbach’s alpha values for all constructs exceeded 0.80, indicating satisfactory internal consistency. The Kaiser–Meyer–Olkin value was 0.921, and Bartlett’s test of sphericity was statistically significant, supporting the suitability of the dataset for factor analysis.
Exploratory factor analysis extracted five factors consistent with the proposed measurement structure. The cumulative variance explained was 63.298%, and the factor loadings ranged from 0.673 to 0.799. These results provided preliminary support for the distinctiveness of AI utilization, innovation capability, logistics efficiency, perceived firm performance, and managerial support.
Confirmatory factor analysis was conducted using AMOS 29. The five-factor measurement model showed good fit: CMIN/DF = 1.056, GFI = 0.918, CFI = 0.995, NFI = 0.909, TLI = 0.994, SRMR = 0.037, and RMSEA = 0.015. Standardized factor loadings ranged from 0.664 to 0.811. Composite reliability values ranged from 0.837 to 0.871, exceeding the recommended threshold of 0.70. Average variance extracted values ranged from 0.507 to 0.576 and therefore exceeded the recommended threshold of 0.50. These results supported convergent validity.
Discriminant validity was assessed using the Fornell–Larcker criterion and HTMT ratios. The square root of the average variance extracted for each construct exceeded its correlations with the other constructs. In addition, the HTMT values ranged from 0.451 to 0.616, which were below the conservative threshold of 0.85. Taken together, these results supported the discriminant validity of the five constructs.
Additional analyses were conducted to examine the robustness of the multidimensional subjective firm performance measure. First, an equal-weighted firm performance score was compared with a CFA loading-weighted score. The two scores were almost perfectly correlated, and the substantive PROCESS results remained unchanged. Second, item-removal sensitivity analyses were conducted using a reduced firm performance score that excluded the operational-efficiency and social-responsibility/sustainability items. The principal direct and indirect effects remained significant. Third, multi-group confirmatory factor analysis was conducted across middle- and senior-management respondents. The configural and metric models showed acceptable fit, and the chi-square difference test was not significant, supporting metric invariance across respondent positions.
These supplementary checks indicate that the main findings were not dependent on a particular scoring method, on the inclusion of operational-efficiency and sustainability-related performance items, or on differences between middle- and senior-level respondents. The detailed results are reported in Appendix
Table A4,
Table A5,
Table A6 and
Table A7. Nevertheless, these analyses support the stability of the subjective performance measure and do not convert it into an objective financial, operational, or environmental performance indicator.
2.7. Control Variables
Firm size, firm type, respondent position, and direct involvement in AI- or digital transformation-related activities were included as control variables in the main regression and conditional process analyses. The same set of controls was entered consistently across the innovation capability, logistics efficiency, and perceived firm performance equations.
Firm size was controlled because larger firms may possess greater financial, technological, and human resources for AI investment, innovation activities, and logistics process improvement. Firm size was measured using ordered employee-count categories: fewer than 50 employees, 50–199 employees, 200–499 employees, and 500 or more employees.
Firm type was controlled because third-party logistics, manufacturing logistics, e-commerce logistics, and cold-chain logistics firms may differ in operational structure, customer requirements, supply chain roles, technology intensity, and AI application priorities. Firm type was entered using dummy variables, with third-party logistics firms serving as the reference category. The dummy variables represented firms in manufacturing logistics, e-commerce logistics, and cold-chain logistics.
Respondent position was controlled because middle- and senior-level managers may differ in their access to strategic information, operational knowledge, and assessments of firm-level performance. Respondent position was coded as middle management or senior management, with middle management used as the reference category in the regression analyses.
Direct involvement in AI- or digital transformation-related activities was also controlled. This binary variable indicated whether respondents reported direct participation in AI implementation, digital transformation, or related organizational initiatives. It was included because directly involved respondents may possess more detailed knowledge of the firm’s AI use, innovation activities, and operational changes. In addition to its role as a control variable in the full-sample analyses, this variable was used to identify the 194 directly involved respondents for a supplementary subsample robustness analysis.
The inclusion of these controls helps reduce potential confounding associated with organizational resources, logistics business context, managerial perspective, and direct exposure to AI-related activities. However, control variables cannot eliminate omitted-variable bias or establish causal inference in a cross-sectional observational study. Accordingly, the controlled coefficients should be interpreted as adjusted statistical associations rather than causal effects.
2.8. Analytical Strategy
The analyses were conducted using SPSS 27, AMOS 29, and PROCESS macro version 4.2. SPSS was used for descriptive statistics, reliability and validity assessment, correlation analysis, common method bias diagnostics, and supplementary regression analyses. AMOS was used to assess the measurement model and compare alternative structural models. PROCESS was used as the primary tool for testing the direct, indirect, sequential indirect, moderation, and conditional indirect associations specified in the research model [
111].
PROCESS Model 83 was estimated using 5000 bootstrap samples. Perceived AI utilization was specified as the independent variable; innovation capability and logistics efficiency as sequential mediators; perceived firm performance as the dependent variable; and managerial support as the moderator of the association between AI utilization and innovation capability. Firm size, firm type, respondent position, and direct involvement in AI- or digital transformation-related activities were included as control variables. Indirect effects were considered statistically significant when the 95% bootstrap confidence interval did not include zero. Model explanatory power and block-level effect sizes, including R
2, adjusted R
2, model-level f
2, ΔR
2, and incremental f
2, are reported in Appendix
Table A8.
Several supplementary analyses were conducted to examine the robustness and interpretation of the findings. First, the five AI utilization items were entered separately and simultaneously into regression models predicting innovation capability, logistics efficiency, and perceived firm performance, with the same control variables used in the main analysis. Because multiple coefficients were tested, the Benjamini–Hochberg false discovery rate adjustment was applied. Second, the main PROCESS model was re-estimated using the 194 respondents who reported direct involvement in AI- or digital transformation-related activities. Third, bootstrap contrasts were used to compare the magnitudes of the three specific indirect effects. Fourth, the proposed sequential model was compared with a reverse-sequence model, a parallel-mediation model, and a restricted direct-effects model using CFI, TLI, RMSEA, SRMR, AIC, and BIC.
Additional measurement robustness checks included full-collinearity VIF diagnostics, alternative firm performance scoring, item-removal sensitivity analysis, and multi-group CFA. These supplementary analyses were conducted to examine construct breadth, respondent knowledge, indirect-effect heterogeneity, measurement robustness, and structural plausibility. They were not used to formulate additional hypotheses.
Because the study is based on cross-sectional, self-reported data, all estimated relationships were interpreted as statistical associations rather than causal or temporal effects.
3. Results
3.1. Sample Characteristics and Description
After data screening, 254 valid responses were retained for analysis. The final sample consisted of middle- and senior-level managers working in logistics-related firms in China.
Table 1 presents the main sample characteristics, including firm type, firm size, respondent position, and direct involvement in AI- or digital transformation-related activities.
As shown in
Table 1, the sample included several types of logistics-related firms. Third-party logistics firms accounted for the largest share, followed by e-commerce, manufacturing, and cold-chain logistics firms. The sample, therefore, reflects multiple logistics-related business contexts rather than a single logistics subsector.
Firm size also varied across the sample. Most respondents worked in firms with fewer than 200 employees, although medium-sized and larger firms were also represented. All respondents held middle- or senior-level managerial positions. These respondents were selected because their organizational roles were expected to provide relevant knowledge of firm-level technology use, innovation activities, logistics operations, and perceived organizational performance.
Among the 254 respondents, 194 (76.4%) reported direct involvement in AI- or digital transformation-related activities. This subgroup was subsequently used in a supplementary robustness analysis to examine whether the main findings remained stable among respondents with more direct exposure to AI-related organizational activities. However, direct involvement was self-reported and does not constitute independent technical verification of AI systems or their operational performance.
The sample should not be interpreted as statistically representative of the entire Chinese logistics industry because purposive, non-probability sampling was used. Accordingly, the findings are appropriate for evaluating the hypothesized associations within the study sample, but their broader generalizability should be interpreted cautiously.
3.2. Preliminary Analyses
Before hypothesis testing, preliminary analyses were conducted to assess internal consistency, distributional characteristics, factorability, and potential common method bias. Detailed results for normality, exploratory factor analysis, and Harman’s single-factor test are reported in Appendix
Table A9.
Cronbach’s alpha values ranged from 0.836 to 0.870, exceeding the recommended threshold of 0.70. Skewness values ranged from −0.218 to −0.098, and kurtosis values ranged from −0.915 to −0.491. These values indicated no serious univariate departures from normality.
The data were suitable for factor analysis. The Kaiser–Meyer–Olkin value was 0.921, and Bartlett’s test of sphericity was statistically significant. Exploratory factor analysis extracted five factors consistent with the proposed measurement structure. The cumulative variance explained was 63.298%, and factor loadings ranged from 0.673 to 0.799.
Several diagnostics were used to assess potential common method bias. Harman’s single-factor test showed that the first unrotated factor accounted for 35.528% of the total variance, below the commonly used 50% criterion. Full-collinearity VIF values ranged from 1.432 to 1.652, below the conservative threshold of 3.3. The detailed VIF results are reported in Appendix
Table A2.
A single-factor confirmatory factor analysis also showed poor fit: χ
2 = 1201.529, df = 275, χ
2/df = 4.369, GFI = 0.654, AGFI = 0.592, NFI = 0.610, TLI = 0.636, CFI = 0.667, and RMSEA = 0.115. This model fit was substantially poorer than that of the proposed five-factor measurement model. The single-factor CFA results are reported in Appendix
Table A3.
Taken together, the preliminary analyses supported the suitability of the data for subsequent measurement and hypothesis testing. The common method diagnostics provided no evidence that a single common method component dominated the observed covariance. Nevertheless, because all core variables were collected via a cross-sectional, self-report questionnaire, common method bias cannot be entirely ruled out.
3.3. Measurement Model
The measurement model was assessed using reliability, convergent validity, and discriminant validity.
Table 2 reports the descriptive statistics, Cronbach’s alpha values, standardized loading ranges, composite reliability, and average variance extracted for the five constructs.
As shown in
Table 2, all Cronbach’s alpha values were above 0.80, indicating good internal consistency. The standardized factor loadings were all above 0.60, and the composite reliability values were all above 0.70. The average variance extracted values were all above 0.50. These results indicate acceptable convergent validity. The full standardized factor loadings from the confirmatory factor analysis are reported in Appendix
Table A10.
The confirmatory factor analysis also showed good model fit. The fit indices were as follows: CMIN/DF = 1.056, GFI = 0.918, CFI = 0.995, NFI = 0.909, TLI = 0.994, SRMR = 0.037, and RMSEA = 0.015. These results suggest that the five-factor measurement model fits the data well.
Table 3 reports the correlations among the constructs, the Fornell–Larcker discriminant validity results, and the HTMT assessment.
All interconstruct correlations were positive and statistically significant. The largest correlation was between AI utilization and innovation capability (r = 0.525, p < 0.01). For every construct, the square root of AVE exceeded its correlations with the other constructs, satisfying the Fornell–Larcker criterion. In addition, the HTMT ratios ranged from 0.451 to 0.616 and were all below the conservative threshold of 0.85. These results supported discriminant validity.
Appendix A analyses were conducted to assess the robustness of the multidimensional measure of subjective firm performance. First, the equal-weighted firm performance score was compared with a CFA loading-weighted score. The two scoring methods produced highly consistent scores, and re-estimation of the main model yielded substantively unchanged results, as reported in Appendix
Table A4.
Second, a reduced three-item firm performance measure was estimated by excluding the operational efficiency and social responsibility/sustainability items. The retained items represented profitability, employee satisfaction and cohesion, and customer satisfaction. The main direct and indirect results remained stable. These sensitivity results are reported in Appendix
Table A5.
Third, multi-group CFA was conducted across middle- and senior-management respondents. Both the configural and metric models showed acceptable fit, and the chi-square difference test was not statistically significant. These results supported metric invariance across respondent positions. The detailed results are reported in Appendix
Table A6 and
Table A7.
Taken together, the results supported the internal consistency, convergent validity, and discriminant validity of the five constructs. The supplementary analyses also indicated that the substantive findings were not dependent on the firm performance scoring method, the inclusion of operational-efficiency and sustainability-related items, or respondent position.
3.4. Hypothesis Testing with PROCESS Model 83
The hypotheses were tested using PROCESS Model 83 with 5000 bootstrap samples. Perceived AI utilization was specified as the independent variable; perceived firm performance as the dependent variable; innovation capability as the first mediator; logistics efficiency as the second mediator; and managerial support as the moderator of the association between AI utilization and innovation capability. Firm size, firm-type dummy variables, respondent position, and direct involvement in AI- or digital-transformation-related activities were included as control variables.
Table 4 presents the direct and interaction effects corresponding to H1a–H2c and H4.
As shown in
Table 4, perceived AI utilization was positively associated with innovation capability (b = 0.4770,
p = 0.0392), logistics efficiency (b = 0.2797,
p < 0.001), and perceived firm performance (b = 0.2293,
p < 0.001). Therefore, H1a, H1b, and H1c were supported.
Innovation capability was positively associated with logistics efficiency (b = 0.2297, p < 0.001) and perceived firm performance (b = 0.2522, p < 0.001). Logistics efficiency was also positively associated with perceived firm performance (b = 0.2769, p < 0.001). Thus, H2a, H2b, and H2c were supported.
The interaction between AI utilization and managerial support was not statistically significant in predicting innovation capability (b = −0.0241, p = 0.7143). Accordingly, H4 was not supported. General managerial support did not significantly alter the strength of the association between perceived AI utilization and innovation capability in the present sample.
The mediation hypotheses were evaluated using 95% bootstrap confidence intervals.
Table 5 presents the three specific indirect effects and the moderated mediation indices.
The indirect association between AI utilization and perceived firm performance, mediated by innovation capability, was statistically significant, supporting H3a. The indirect association through logistics efficiency was also significant, supporting H3b. In addition, the sequential indirect association through innovation capability and logistics efficiency was significant, supporting H3c.
The conditional indirect effects involving innovation capability were significant at low, mean, and high levels of managerial support. However, both indices of moderated mediation included zero. Therefore, the magnitude of the indirect effects did not differ significantly across levels of managerial support.
Overall, H1a–H1c, H2a–H2c, and H3a–H3c were supported, whereas H4 was not supported. The results indicate that perceived AI utilization was associated with perceived firm performance through both innovation capability and logistics efficiency, individually and sequentially. However, these findings should not be interpreted as demonstrating that the sequential pathway is the only or dominant mechanism. The relative magnitudes of the indirect effects and the alternative-model comparisons are examined in the subsequent analyses. The explanatory power and block-level effect sizes for the three regression equations are reported in Appendix
Table A8.
3.5. AI Item-Level Exploratory Analysis
To examine whether the broad AI utilization construct contained differentiated application-level associations, supplementary regression analyses were conducted for AI1–AI5. Each item was entered first separately and then simultaneously into models predicting innovation capability, logistics efficiency, and perceived firm performance, using the same control variables as in the main analysis.
When entered separately, all five AI items were positively associated with innovation capability, logistics efficiency, and perceived firm performance. The complete separate-entry results for AI1–AI5 are reported in Appendix
Table A13. However, when all five items were entered simultaneously and the Benjamini–Hochberg false discovery rate correction was applied, only three associations remained statistically significant.
As shown in
Table 6, the simultaneous-entry results indicated differentiated associations across the AI application items. The demand forecasting and order allocation item was uniquely associated with logistics efficiency after accounting for the other AI items, whereas the AI infrastructure investment item was uniquely associated with innovation capability and perceived firm performance. However, these findings remain exploratory because each application domain was represented by a single item and the items may share substantial conceptual variance. Therefore, the results should not be interpreted as definitive comparisons of the technical or causal effects of specific AI applications.
3.6. AI-Involved Subsample Robustness Analysis
The main PROCESS Model 83 analysis was re-estimated using the 194 respondents who reported direct involvement in AI- or digital transformation-related activities. The purpose was to examine whether the main findings remained stable among respondents with more direct exposure to AI-related organizational activities.
The main direct associations remained significant in the AI-involved subsample. Perceived AI utilization was positively associated with innovation capability, logistics efficiency, and perceived firm performance. Innovation capability was positively associated with logistics efficiency and perceived firm performance, and logistics efficiency was, in turn, positively associated with perceived firm performance. The three specific indirect effects through innovation capability, logistics efficiency, and their sequential pathway were also significant.
In contrast, the interaction between AI utilization and managerial support remained nonsignificant, and both indices of moderated mediation included zero. The full direct, indirect, interaction, and moderated mediation results for the AI-involved subsample are reported in Appendix
Table A15.
These results indicate that the main pattern was not driven solely by respondents without direct involvement in AI- or digital transformation-related activities. Nevertheless, the subgroup analysis was based on self-reported involvement and does not provide independent technical verification of implemented AI systems or objective operational outcomes.
3.7. Bootstrap Contrasts of Indirect Effects
Pairwise bootstrap contrasts were conducted to compare the magnitudes of the three specific indirect effects. The difference between the indirect effects through innovation capability and through logistics efficiency was not statistically significant. However, both individual indirect effects were significantly larger than the sequential indirect effect. The full bootstrap contrast results are reported in Appendix
Table A16.
These findings indicate that innovation capability and logistics efficiency provide comparable independent indirect pathways, whereas the sequential indirect pathway is statistically significant but smaller. Accordingly, the sequential pathway should be interpreted as an additional mechanism rather than as the only or dominant mechanism.
3.8. Alternative-Model Comparisons
Four structural models were compared in AMOS: the proposed sequential model, a reverse-sequence model, a parallel-mediation model, and a restricted direct-effects model. The proposed sequential, reverse-sequence, and parallel-mediation models produced identical global fit indices, including χ
2, df, CFI, TLI, RMSEA, SRMR, AIC, and BIC. Therefore, these three models could not be differentiated based on global model fit alone. In contrast, the restricted direct-effects model showed comparatively weaker fit. The structural specifications and complete fit indices for the four models are reported in Appendix
Table A17.
These findings indicate that the data support models incorporating innovation capability and logistics efficiency more strongly than a model containing only the direct effects of AI utilization. However, the relative ordering of innovation capability and logistics efficiency cannot be determined from global fit indices. Accordingly, the sequential capability-to-process interpretation should be treated as theoretically specified rather than empirically superior to the reverse-sequence or parallel alternatives. Because the data are cross-sectional, these model comparisons assess structural plausibility rather than temporal or causal precedence.
3.9. Supplementary Structural Equation Modeling Results
AMOS-based structural equation modeling was conducted as a supplementary check of the main direct relationships. The model corresponded to the proposed sequential specification reported in Appendix
Table A17 and included paths from perceived AI utilization to innovation capability, logistics efficiency, and perceived firm performance; from innovation capability to logistics efficiency and perceived firm performance; and from logistics efficiency to perceived firm performance. The model showed good fit: χ
2 = 168.756, df = 164, χ
2/df = 1.029, CFI = 0.998, TLI = 0.997, RMSEA = 0.011, and SRMR = 0.036. The principal structural paths were positive and statistically significant, broadly supporting the pattern observed in the PROCESS analysis. However, as reported in
Section 3.8, the proposed sequential, reverse-sequence, and parallel-mediation models produced identical global fit indices. Therefore, the SEM results support the structural plausibility of models incorporating innovation capability and logistics efficiency but do not establish that the proposed capability-to-process ordering is empirically superior to the reverse-sequence or parallel alternatives. This SEM analysis did not estimate the managerial-support interaction or the conditional indirect effects. PROCESS Model 83 therefore remained the primary basis for testing the mediation, sequential mediation, moderation, and moderated mediation hypotheses.
3.10. Summary of Results
Perceived AI utilization was positively associated with innovation capability, logistics efficiency, and perceived firm performance. Innovation capability was positively associated with logistics efficiency and perceived firm performance, and logistics efficiency was positively associated with perceived firm performance. Thus, H1a–H1c and H2a–H2c were supported.
The three indirect effects were significant, supporting H3a–H3c. However, managerial support did not moderate the relationship between AI utilization and innovation capability, and the indices of moderated mediation were not significant. Therefore, H4 was not supported.
Appendix A analyses showed that the main results remained stable in the 194-person AI-involved subsample. The individual indirect effects through innovation capability and logistics efficiency were larger than the sequential indirect effect. Overall, the results indicate that innovation capability and logistics efficiency function as complementary intervening mechanisms, while the significant but smaller sequential pathway represents an additional capability-to-process mechanism. However, the relative ordering of the two mediators could not be determined from the alternative-model comparisons.
4. Discussion
4.1. Interpretation of the Findings
This study examined how perceived logistics-oriented AI utilization is associated with perceived firm performance through innovation capability and logistics efficiency, and whether managerial support strengthens the association between AI utilization and innovation capability. The main results showed that perceived AI utilization was positively associated with innovation capability, logistics efficiency, and perceived firm performance. Innovation capability was positively associated with both logistics efficiency and perceived firm performance, while logistics efficiency was positively associated with perceived firm performance. The indirect effects through innovation capability, through logistics efficiency, and through the sequential pathway were all significant. However, managerial support did not significantly moderate the association between AI utilization and innovation capability, and the indices of moderated mediation were not significant.
These findings should be interpreted at the firm level. The study did not directly compare the technical effectiveness of individual AI systems. Rather, it examined managers’ perceptions of firm-level AI use or investment across multiple logistics processes, including transportation, forecasting, warehousing, order allocation, infrastructure, data analysis, and decision support. Accordingly, the results indicate associations among perceived AI utilization, organizational capabilities, logistics processes, and perceived firm performance rather than objective or causal effects of specific AI technologies.
The first major finding is that the performance relevance of AI utilization appears to depend on complementary organizational and process mechanisms rather than on technology use alone. Managers who reported greater AI utilization also tended to report stronger innovation capability, greater logistics efficiency, and better perceived firm performance. This interpretation is consistent with the information technology business value perspective, which argues that digital technologies become performance-relevant when they are integrated with organizational capabilities and operational routines [
42,
43,
44,
45,
46]. It is also consistent with dynamic capabilities theory, because firms must identify technological opportunities, mobilize resources, and reconfigure organizational processes before technology use becomes associated with performance [
47,
48].
The positive association between AI utilization and innovation capability suggests that AI-related information and analytical resources may support opportunity recognition, knowledge recombination, service redesign, and business model adjustment. This finding is consistent with prior studies linking AI and digital transformation with innovation capability, service innovation, organizational agility, and innovation performance [
49,
50,
51,
52,
53,
54,
55,
56,
57,
58,
59,
60,
61,
62,
63,
64,
65,
66,
67,
92,
93,
94,
95,
96]. The present study extends this literature by showing that perceived cross-process AI utilization is associated with innovation capability in logistics-related firms, where technological information may be applied to transportation, warehousing, forecasting, order allocation, and customer-response problems.
The positive association between AI utilization and logistics efficiency indicates that AI use is also linked to process-level logistics outcomes. Forecasting, routing, warehouse management, inventory control, and order allocation may support more timely information processing, better resource coordination, and more responsive logistics operations [
22,
23,
24,
25,
26,
27,
28,
29,
30,
31,
32,
33,
34,
35,
36,
37,
38,
39]. This result is consistent with prior research on smart logistics, predictive analytics, automation, machine learning, and supply chain optimization. It extends this literature by positioning logistics efficiency as a distinct process mechanism linking perceived AI utilization to perceived firm performance.
The exploratory item-level analyses provide additional differentiation. When examined separately, all five AI utilization items were significantly associated with innovation capability, logistics efficiency, and perceived firm performance. However, after simultaneous entry and FDR correction, only demand forecasting and order allocation remained significantly associated with logistics efficiency. In contrast, AI infrastructure remained significantly associated with innovation capability and perceived firm performance. These findings suggest that different AI application areas may have differentiated organizational associations. Nevertheless, they should be interpreted with caution because each item represented a single application domain, and the items may share substantial conceptual variance. The results, therefore, do not establish that these applications are universally more important than the others.
The relationships among innovation capability, logistics efficiency, and perceived firm performance provide the central organizational interpretation of the results. Innovation capability was positively associated with logistics efficiency and perceived firm performance, while logistics efficiency was positively associated with perceived firm performance. These findings suggest that innovation capability may support both direct organizational value creation and the redesign of logistics processes. Logistics efficiency, in turn, represents a more operational mechanism through which AI-related resources and organizational capabilities may become associated with performance [
63,
64,
65,
66,
67,
68,
69,
70,
71,
72,
73,
74,
100,
101,
102,
103,
104,
105,
106].
The indirect-effect results indicate that innovation capability and logistics efficiency function as complementary intervening mechanisms. The indirect effects through innovation capability and logistics efficiency were both significant, and there was no statistically significant difference between their magnitudes. Both individual indirect effects were significantly larger than the sequential indirect effect. These results suggest that innovation capability and logistics efficiency each provide meaningful and comparably important pathways linking perceived AI utilization with perceived firm performance.
The sequential indirect pathway through innovation capability and logistics efficiency was also statistically significant. This finding is consistent with a capability-to-process interpretation in which AI-related resources are associated with innovation capability, innovation capability is associated with logistics efficiency, and logistics efficiency is subsequently associated with perceived firm performance. However, the sequential pathway was smaller than the two individual indirect pathways and should therefore be interpreted as an additional mechanism rather than as the only or dominant mechanism.
The alternative model comparisons require further caution in interpreting the relative ordering of innovation capability and logistics efficiency. The proposed sequential, reverse-sequence, and parallel-mediation models produced identical global fit indices, whereas the restricted direct-effects model showed comparatively weaker fit. Accordingly, the data support the inclusion of innovation capability and logistics efficiency as intervening organizational mechanisms. Still, the global model fit does not favor the proposed sequential ordering over the reverse sequence or parallel alternatives. Because the data are cross-sectional, the temporal ordering of innovation capability and logistics efficiency cannot be established empirically. The proposed capability-to-process sequence is therefore theoretically grounded and supported by the significant sequential indirect effect. Still, it should not be interpreted as structurally superior to the alternative specifications.
The robustness analysis using the 194 respondents directly involved in AI- or digital transformation-related activities produced a similar pattern. The main direct and indirect effects remained significant, whereas the interaction between AI utilization and managerial support and the moderated mediation indices remained nonsignificant. This suggests that the primary findings were not driven solely by respondents without direct involvement in AI-related activities. However, direct involvement was self-reported and does not provide independent verification of specific AI systems or objective operational outcomes.
The nonsignificant moderating effect of managerial support requires cautious interpretation. It does not demonstrate that management is unimportant for AI implementation. Rather, the broad managerial support measure used in this study may not capture the specific implementation mechanisms needed to strengthen AI-enabled innovation. Such mechanisms may include data governance, technical training, system integration, process redesign, and cross-functional coordination. The result, therefore, differs from studies that emphasize top management support as a major condition for digital transformation [
75,
76,
77,
78,
79,
80,
81,
82,
83,
84,
85], but it does not necessarily contradict them. Instead, it suggests that future research should distinguish general managerial encouragement from implementation-specific forms of support.
The sustainability implications should also remain limited to the operational level. Logistics efficiency may be relevant to resource use, process waste, responsiveness, and service reliability, and prior studies have linked AI and logistics efficiency with sustainable supply chain operations [
11,
12,
13,
14,
15,
16,
17,
18,
19,
20,
21,
107,
108,
109,
110]. However, the present study did not directly measure carbon emissions, fuel consumption, energy use, waste reduction, or other objective environmental outcomes. The findings, therefore, support an efficiency-based interpretation of sustainability rather than direct evidence of environmental improvement.
Overall, the findings indicate that perceived logistics-oriented AI utilization is associated with perceived firm performance through multiple organizational mechanisms. Innovation capability and logistics efficiency each provide significant independent indirect pathways, while the smaller sequential indirect effect is consistent with an additional capability-to-process mechanism. However, because the sequential, reverse-sequence, and parallel-mediation models showed identical global fit, the relative ordering of innovation capability and logistics efficiency cannot be determined from the present data. Accordingly, these relationships should be interpreted as theoretically specified statistical associations rather than causal or temporally established effects.
4.2. Theoretical Implications
This study contributes to research on AI business value, dynamic capabilities, and logistics management by explaining how perceived logistics-oriented AI utilization is associated with perceived firm performance through multiple organizational mechanisms. The contribution does not lie in showing a simple positive AI–performance relationship, but in identifying capability-based, process-based, and sequential pathways through which AI utilization may become performance-relevant.
First, the study clarifies the relationship between application-level and firm-level AI research. Prior studies have examined specific AI applications in forecasting, transportation, warehousing, routing, reverse logistics, and operational decision-making [
37,
38,
39]. Other studies have treated AI and machine learning as broader organizational resources associated with logistics capabilities and firm performance [
40,
41]. The present study connects these two streams by examining firm-level AI utilization across multiple logistics processes while using application-level research to clarify the operational content of the construct. However, it does not claim to identify the technical effect of each application.
Second, the study extends the information technology business value perspective by identifying innovation capability and logistics efficiency as complementary mechanisms linking perceived AI utilization with perceived firm performance [
42,
43,
44,
45,
46]. Innovation capability represents a capability-building pathway through which firms may recognize opportunities, recombine knowledge, and redesign services or processes. Logistics efficiency represents a process-level pathway through which AI-related resources may become associated with operational responsiveness, coordination, and cost efficiency.
Third, the findings refine dynamic capabilities theory by showing that AI-related information may be associated with both organizational capability development and operational reconfiguration [
47,
48]. Innovation capability reflects the firm’s ability to sense and seize AI-enabled opportunities, whereas logistics efficiency reflects the transformation of resources and routines at the process level. The significant path from innovation capability to logistics efficiency supports this capability-to-process logic.
Fourth, the study shows that innovation capability and logistics efficiency should not be treated as a single strictly ordered mechanism. The indirect effects through innovation capability and logistics efficiency were both significant and larger than the sequential indirect effect. In addition, the proposed sequential, reverse-sequence, and parallel-mediation models produced identical global fit indices. Accordingly, the main theoretical contribution lies in demonstrating that AI utilization may become performance-relevant through multiple complementary mechanisms. At the same time, the relative ordering of innovation capability and logistics efficiency remains unresolved. The sequential capability-to-process pathway remains theoretically meaningful, but it should be interpreted as an additional mechanism rather than as the only or empirically superior structure.
Fifth, the nonsignificant moderating effect of managerial support provides a secondary boundary implication. General managerial support did not strengthen the association between AI utilization and innovation capability. This finding suggests that broad managerial encouragement may be less important than implementation-specific mechanisms such as data governance, technical training, system integration, process redesign, and cross-functional coordination [
75,
76,
77,
78,
79,
80,
81,
82,
83,
84,
85]. Future studies should distinguish these more specific forms of support from general managerial support.
Finally, the theoretical interpretation is bounded by the study’s measurement design. Firm performance was measured as a multidimensional subjective construct rather than as objective financial, operational, or environmental performance [
90,
91]. Likewise, the sustainability contribution is limited to an operational-efficiency pathway. Because emissions, energy use, fuel consumption, and waste reduction were not directly measured, the findings should not be interpreted as direct evidence of environmental improvement [
11,
12,
13,
14,
15,
16,
17,
18,
19,
20,
21,
107,
108,
109,
110].
Overall, the theoretical contribution lies in showing that perceived AI utilization may be associated with firm performance through complementary capability and process mechanisms, with an additional but smaller sequential capability-to-process pathway.
4.3. Practical and Sustainability Implications
The findings provide several practical implications for logistics-related firms. First, managers should avoid treating AI investment as a stand-alone technology project. The results indicate that perceived AI utilization is associated with perceived firm performance through both innovation capability and logistics efficiency. Firms should therefore develop these two mechanisms in parallel while also establishing processes to translate innovation activities into operational improvements.
Second, AI implementation should begin with clearly defined logistics problems. These may include inaccurate demand forecasting, inefficient inventory planning, delayed dispatching, poor warehouse coordination, ineffective order allocation, or limited use of operational data. AI applications should then be aligned with specific process objectives and evaluated using operational indicators such as inventory accuracy, delivery reliability, response time, vehicle utilization, warehouse productivity, order failure, and operating cost.
The exploratory item-level results also suggest that AI applications may have differentiated organizational associations. Demand forecasting and order allocation were uniquely associated with logistics efficiency, while AI infrastructure was uniquely associated with innovation capability and perceived firm performance after simultaneous entry and FDR correction. These findings should be used with caution because each application domain was measured with a single item. Still, they suggest that firms may benefit from distinguishing among application-specific implementation goals.
Third, firms should strengthen innovation capability by encouraging employees to identify operational problems, generate AI-enabled service ideas, and redesign logistics routines. At the same time, logistics efficiency should be managed as an independent implementation target rather than only as a downstream outcome of innovation capability. The results indicate that both mechanisms contribute separately to perceived firm performance.
Fourth, the nonsignificant moderating effect of managerial support suggests that general managerial encouragement alone may be insufficient. More specific forms of implementation support may be needed, including data governance, employee training, system integration, process redesign, and cross-functional coordination. Firms should therefore connect managerial support with concrete implementation routines and responsibilities.
Finally, sustainability implications should be interpreted at the operational-efficiency level. More efficient logistics processes may support better resource use, lower process waste, improved service reliability, and fewer operational failures. However, this study did not directly measure carbon emissions, energy consumption, fuel use, mileage, loading rates, or waste reduction. Firms seeking to evaluate environmental benefits should link AI projects to objective environmental and operational indicators.
4.4. Limitations and Future Research
This study has several limitations. First, the cross-sectional and self-reported design does not establish temporal or causal relationships. Reverse causality is possible, and future studies should use longitudinal, multi-wave, panel, or quasi-experimental designs.
Second, common method bias cannot be completely ruled out because all focal variables were collected from the same respondents. Future research should use multi-source data, multiple respondents within each firm, and objective operational records.
Third, the purposive, non-probability sample of logistics-related firms in China limits generalizability. Future research should use broader samples and compare logistics sectors, firm sizes, and national contexts.
Fourth, AI utilization was measured as a broad firm-level construct. The exploratory AI1–AI5 analysis partially addressed this breadth, but a single item represented each application domain. Future studies should develop multi-item measures for specific AI applications and compare their effects across transportation, warehousing, forecasting, inventory, order fulfillment, and decision support.
Fifth, firm performance was measured as a multidimensional subjective construct. Although sensitivity analyses supported measurement stability, future studies should examine financial, operational, employee-related, customer-related, and sustainability-related outcomes separately and use objective indicators where possible.
Sixth, the AI-involved subsample analysis strengthened respondent relevance but did not independently verify implemented AI systems or operational outcomes. Future research should combine survey responses with system records, project documentation, and technical audits.
Seventh, the proposed sequential, reverse-sequence, and parallel-mediation models produced identical global fit indices. Accordingly, the present cross-sectional data could not distinguish whether innovation capability and logistics efficiency operate sequentially, in reverse order, in parallel, or reciprocally over time. Longitudinal and multi-wave research is needed to examine their temporal ordering more directly.
Finally, managerial support was measured broadly. Future studies should distinguish general managerial encouragement from implementation-specific support, including data governance, technical training, system integration, process redesign, and cross-functional coordination. Objective environmental measures should also be included to assess whether AI-enabled logistics efficiency results in measurable reductions in emissions, fuel use, energy consumption, mileage, or waste.
4.5. Conclusions
This study examined how perceived logistics-oriented AI utilization is associated with perceived firm performance through innovation capability and logistics efficiency in logistics-related firms in China. The findings showed positive associations between AI utilization and innovation capability, logistics efficiency, and perceived firm performance. Innovation capability and logistics efficiency were also positively associated with perceived firm performance.
The indirect effects through innovation capability, through logistics efficiency, and through their sequential pathway were significant. However, the two individual indirect effects were larger than the sequential indirect effect. The proposed sequential, reverse-sequence, and parallel-mediation models produced identical global fit indices, whereas the restricted direct-effects model showed comparatively weaker fit. These results indicate that innovation capability and logistics efficiency function as complementary intervening mechanisms, while the sequential capability-to-process pathway represents an additional, smaller association. Nevertheless, the relative ordering of the two mediators cannot be determined from the present cross-sectional data.
The moderating effect of general managerial support was not supported, and the moderated mediation indices were not significant. This suggests that implementation-specific support may be more relevant than broad managerial encouragement.
The study contributes by showing that the performance relevance of perceived AI utilization is associated with multiple organizational pathways rather than with a single direct or strictly sequential mechanism. Nevertheless, because the evidence is cross-sectional and self-reported, the results should be interpreted as associations among managerial perceptions rather than as objective causal effects of AI systems on financial, operational, or environmental performance.