1. Introduction
Municipal waste management is one of the major challenges of sustainable development, being closely influenced by population growth, urbanization, economic development, and changing consumption patterns. International assessments indicate that, without integrated management policies and reliable monitoring systems, municipal waste generation will continue to increase, intensifying environmental and public health pressures. Consequently, international organizations emphasize the need for robust quantitative analyses, continuous monitoring, and evidence-based decision making in waste management systems [
1,
2,
3,
4].
Municipal solid waste (MSW) represents a priority field of analysis due to its direct relationship with population behavior, living standards, and the organization of local public services. Previous studies have shown significant differences among regions and countries regarding waste generation rates, composition, and management performance, influenced by economic, institutional, and administrative factors [
2,
5]. At the same time, growing concerns regarding resource losses and plastic pollution have strengthened international commitments supporting the transition towards a circular economy and more efficient material recovery systems [
6,
7,
8,
9,
10,
11,
12,
13,
14].
At the European Union level, municipal waste management is regulated through a harmonized legislative framework centered on the Waste Framework Directive and its subsequent amendments [
15,
16]. The implementation of these policies is monitored through statistical systems coordinated by Eurostat and the European Environment Agency, which support the assessment of waste-generation and recycling trends across Member States [
17,
18,
19,
20]. Although recent data indicate slight reductions in municipal waste generation at the European level, substantial differences in waste-management performance continue to exist among countries and regions [
17,
21,
22].
A recurring finding in both scientific literature and institutional reports is the seasonal nature of municipal waste generation and composition. Numerous studies have shown that waste quantities and fractions vary throughout the year as a consequence of climatic conditions, consumption patterns, tourism activities, and other seasonal selected socioeconomic indicator [
23,
24,
25,
26,
27]. These variations directly affect collection, transport, treatment, and recovery operations, making seasonality a relevant factor for planning and optimizing municipal waste-management systems [
17,
20,
27,
28,
29,
30].
In the literature (
Table 1), the evaluation of municipal waste management systems is carried out using a wide range of quantitative, statistical, and multivariate analyses, tailored to the study’s objectives and the type of data available. Approaches range from descriptive analyses and seasonal assessments, used as exploratory tools, to advanced statistical methods, such as nonparametric tests, principal component analysis (PCA), or cluster analyses, which allow for the identification of latent structures and complex relationships between variables. European and international methodological documents emphasize the need to correlate these quantitative methods with operational and institutional analyses to ensure the relevance of the results in the decision-making process [
4,
17].
To illustrate the global relevance of municipal waste management and the diversity of analytical approaches used worldwide, representative case studies from recent international literature were reviewed. Covering urban, regional, national, and pan-European contexts, these studies show that waste-management challenges are widespread, while methodological and institutional responses vary according to local conditions.
The diversity of studies confirms that municipal waste analysis is a global and multidisciplinary research field, addressed through methods adapted to data availability and local objectives. Recent literature includes studies focused on waste characterization and seasonal variability based on descriptive analyses and field observations [
47], as well as forecasting approaches using artificial intelligence, machine learning techniques, and neural networks to estimate future waste-generation trends and support waste-management planning [
48,
49,
50]. Other investigations have examined the spatial, socioeconomic, economic, and policy-related determinants of waste generation through spatial regression, decomposition analyses, and econometric models [
51,
52,
53,
54], while additional research has explored the impact of external events on waste flows using system dynamics and scenario-based approaches [
55]. Environmental assessment and management planning have also been addressed through Life Cycle Assessment (LCA), Material Flow Analysis (MFA), carbon-footprint evaluation, multicriteria decision-making methods, GIS-based analyses, and logistics optimization models aimed at improving waste-treatment infrastructure and collection efficiency [
56,
57,
58,
59].
In this context, this study focuses on a detailed statistical analysis of the seasonality and composition of municipal waste at the county level, using actual operational data, thereby contributing to the existing body of research through a case study from Eastern Europe based on monthly administrative data.
In Romania, municipal waste management faces persistent challenges, particularly with regard to meeting recycling targets and reducing landfilling, issues highlighted in EEA reports and country profiles [
14]. Strategic documents and national assessments underscore the crucial role of organizing public services at the county level and the functioning of Integrated Waste Management Systems (IWMS) in improving operational performance [
4,
17,
20,
29,
39,
60,
61,
62,
63,
64,
65,
66,
67,
68].
Bacău County serves as a relevant case study in this context, having implemented an integrated county-wide system coordinated by the Bacău Intermunicipal Development Association for Sanitation (ADIS Bacău), with dedicated infrastructure and publicly available documentation, such as the 2020–2025 County Waste Management Plan and the SMID expansion projects [
42,
43,
44,
45,
46]. Information published by the Bacău County Council and ADIS Bacău regarding operational flows, transfer, treatment, and disposal infrastructure, as well as the schedule for special collection campaigns, provides a documented framework for analyzing the seasonal dynamics of municipal waste [
42,
43,
44,
45,
46].
Although numerous studies have investigated municipal waste generation using approaches focused on waste characterization, predictive modeling, spatial analysis, or policy evaluation, relatively few have examined how seasonal variability manifests in integrated county-level waste management systems characterized by low separate collection performance and a dominant residual waste stream. Beyond providing empirical evidence from an underrepresented Eastern European context, this study contributes to the literature by demonstrating that seasonal variability is primarily expressed through changes in waste volumes rather than through substantial modifications in waste composition. The results suggest that temporal and selected socioeconomic indicator exhibit stronger associations with municipal waste generation than climatic conditions, suggesting that operational planning should focus primarily on activity-related drivers of waste generation. These findings provide additional empirical evidence from an Eastern European county-level waste management system and may serve as a basis for future comparative studies conducted in other regional contexts.
Against the backdrop of global concerns regarding municipal waste management and the need to base public policies on robust quantitative analyses, the main objective of this article is to systematically assess the seasonality and quantitative structure of municipal waste streams at the county level, using actual operational data and advanced statistical methods.
The study aims to contribute to the existing literature by providing a detailed analysis based on monthly time series data, that will shed light on how seasonal variations influence both the total volume of municipal waste and its composition by waste stream, within a specific institutional context in Eastern Europe.
Although improving recycling and recovery rates remains a major objective of European waste management policies, the present study focuses on the analysis of seasonality because seasonal fluctuations directly influence the quantities of waste collected and, consequently, the operational planning of collection, transfer, treatment and disposal activities. Understanding how waste generation varies throughout the year is essential for the efficient allocation of resources and the optimization of waste management services. Therefore, this study addresses a complementary research perspective, centered on the temporal dynamics of municipal waste generation rather than on the determinants of recycling performance.
To address the overall objective, the study is guided by the following research questions:
Does municipal waste generation in Bacău County exhibit statistically significant seasonal variations?
Does the composition of municipal waste remain stable across seasons despite fluctuations in total waste volumes?
To what extent are seasonal variations in municipal waste associated with socioeconomic, calendar-related, and climatic factors?
Which variables show the strongest statistical associations with municipal waste generation patterns at the county level?
Based on the literature review and the characteristics of the analyzed waste management system, the following hypotheses were formulated:
Municipal waste generation in Bacău County during the study year presents significant seasonal variations, with higher quantities during the warm season and lower quantities during the cold season.
The composition of municipal waste remains relatively stable throughout the year despite seasonal fluctuations in total waste volume.
Socioeconomic and temporal variables are expected to show stronger statistical associations with municipal waste variability than the climatic variables considered in this study.
Recyclable waste streams are expected to exhibit closer statistical associations with the socioeconomic indicator considered in this study than with the climatic variables analyzed.
Although the seasonal variability of municipal waste has been analyzed in numerous international studies, most of the research has been conducted in mature waste management systems, characterized by high rates of separate collection and superior recycling performance. In contrast, Bacău County represents a different operational context, typical of many regions in Eastern Europe that are in the process of consolidating integrated waste management systems. The analysis allows for an assessment of how seasonality manifests itself in a system where the residual fraction remains dominant and separate collection has a low capture rate. From this perspective, the study complements existing literature by providing empirical evidence from an institutional and operational context that has been underrepresented at the international level.
To achieve this overall goal, the specific objectives of the study are:
To characterize the seasonal dynamics of municipal waste volumes collected in Bacău County by analyzing monthly time series and estimating seasonal indices;
To analyze the compositional structure of municipal waste, identifying the dominant waste streams and the stability of the structure throughout the year;
To statistically test seasonal differences between periods of the year using nonparametric methods appropriate for the observed data distributions;
To identify relationships between waste quantity dynamics and explanatory factors of a socioeconomic, calendar-related, and climatic nature, using exploratory multivariate techniques;
To position the study’s results within an international comparative framework, highlighting the local relevance of the analysis in relation to the global trends and challenges illustrated in the specialized literature.
By addressing these objectives, the article provides scientific support for understanding the seasonal patterns of municipal waste and for optimizing operational planning and management decisions at the local and regional levels, in line with the objectives of European waste management policies.
2. Methodology
2.1. Study Area and Data Sources
The study area of this article is Bacău County, an administrative–territorial unit in eastern Romania, where municipal waste management services are organized through an Integrated Waste Management System (SMID) at the county level. The coordination of collection, transport, transfer, treatment, and disposal activities is ensured by the Bacău Intermunicipal Development Association for Sanitation (ADIS Bacău), based on delegation contracts with sanitation operators and in accordance with the strategies approved by the Bacău County Council [
44,
46].
Bacău County represents a relevant case study because it combines urban and rural settlements, significant seasonal socioeconomic variability, and a fully operational Integrated Waste Management System. These characteristics make it representative of many medium-sized counties in Romania and Eastern Europe that face similar waste management challenges.
The present study is based on monthly operational data collected during 2021 from the Integrated Waste Management System of Bacău County. Although the dataset covers a single calendar year, it captures the complete annual operational cycle and enables the identification of intra-annual seasonal variations in municipal waste generation. The objective of the research is not to establish long-term trends but rather to explore seasonal patterns and their associations with selected socioeconomic, climatic, and calendar-related variables at the county level. Accordingly, the study should be interpreted as an analysis of intra-annual seasonality within a complete operational year rather than as an assessment of persistent long-term seasonal behavior. The dataset was used to identify operational seasonal fluctuations and their associations with selected explanatory variables under the conditions observed during the study period.
The data used in this study are derived from the monthly reports submitted by waste management operators serving the administrative-territorial units of Bacău County. These reports are centralized and validated at the county level by ADIS Bacău, within the institutional framework of the SMID and the SMID Bacău Expansion Project [
42]. The time series are structured on a monthly basis, in accordance with the official reporting method used by operators and the European Waste Catalogue (EWC) [
69].
Before conducting the statistical analyses, the database was checked for completeness and consistency of the monthly records. The analysis examined the consistency of the reported quantities, the presence of any missing values, and the agreement between the total quantities and those reported by waste category. The dataset used for 2021 was complete and did not require any imputation procedures or corrections to the reported values.
Public documents prepared by the Bacău County Council and ADIS Bacău, such as the 2020–2025 County Waste Management Plan, environmental reports, and documentation related to SMID projects, were used to define operational flows, collection zones, and the institutional framework for the analysis. This framework ensures methodological consistency and the comparability of results with assessments conducted at the national and European levels.
2.2. Data Set Structure and Variable Definitions
The primary dependent variable analyzed in this study is the monthly amount of municipal waste collected in 2021, expressed in tons, both in total and broken down by the main waste categories, according to the EWC codes reported by operators [
69,
70].
For exploratory and explanatory purposes, a series of independent variables were included, selected in accordance with the relevant literature and European methodological guidelines [
34,
49,
71,
72,
73,
74,
75,
76,
77,
78]. These include:
Temporal and calendar variables: calendar month, season, and number of monthly working days;
Socioeconomic variables: average net monthly wage;
Climatic variables: average monthly air temperature and total monthly precipitation.
The average monthly net wage was used as a proxy indicator for local economic activity and the population’s purchasing power. This indicator was chosen because of the availability of monthly data compatible with the temporal resolution of the waste dataset. Although this indicator does not capture all aspects of the socioeconomic context, it provides an aggregate measure of short-term economic fluctuations that can influence consumption levels and, consequently, the quantities of municipal waste generated.
The selection of this indicator was mainly driven by the availability of monthly data compatible with the temporal resolution of the waste dataset. Other potentially relevant socioeconomic variables, such as population structure, household consumption indicators, service coverage or characteristics of the separate collection infrastructure, were not available at monthly resolution and therefore could not be consistently integrated within this study.
Including these variables allows for an analysis of the relationships between variations in the volume of municipal waste generated in 2021 and explanatory factors of an economic, calendar-related, and climatic nature, as recommended in recent studies on the seasonality of waste streams [
23,
24,
25,
26,
27,
32,
69,
79].
2.3. Methods of Statistical and Exploratory Analysis
The data analysis initially involved descriptive and exploratory statistical methods, which were used to characterize the level, variability, and monthly distribution of municipal waste volumes. Time-series graphs, bar charts, line charts, and box plots were generated to identify seasonal patterns and outliers.
To formally assess seasonal differences between groups (seasons or time intervals), nonparametric statistical tests were applied. The dataset consisted of monthly municipal waste observations aggregated into four seasonal groups, resulting in a relatively limited number of observations per group. Under these conditions, the assumptions required for parametric analysis of variance (ANOVA), particularly normality and homogeneity of variances, could not be reliably ensured. Therefore, the Kruskal–Wallis test was selected as an appropriate nonparametric alternative for comparing more than two independent groups [
37]. This approach is frequently recommended for environmental and waste-management datasets characterized by small sample sizes and non-normal distributions. When the global Kruskal–Wallis test indicated statistically significant differences, pairwise seasonal comparisons were performed using Dunn’s post hoc test, with statistical significance evaluated at
p < 0.05.
2.4. Assessment of the Seasonality
The seasonality of municipal waste generation was analyzed by estimating seasonal indices using a multiplicative model and by calculating monthly ratios relative to the annual average. These indicators allow for the identification of months and seasons characterized by systematic deviations from the annual average, providing a quantitative basis for interpreting the seasonality of waste flows and for planning operational collection and treatment capacities.
Heatmap visualizations were also used to simultaneously display monthly variations and the structure by EWC codes, in accordance with the exploratory approaches recommended in the scientific literature [
53,
54,
61].
2.5. Multivariate Analysis
To investigate the relationships between variables and reduce the dimensionality of the dataset, Principal Component Analysis (PCA) was applied. This method allows for the identification of the main directions of seasonal variation and the latent structures that characterize the dynamics of municipal waste volumes [
38]. The number of principal components retained was determined based on an analysis of scatter plots, relative contributions, and the correlation matrix, in accordance with existing methodological recommendations [
52].
Prior to the multivariate analyses, no additional data transformations, normalization procedures, or logarithmic transformations were applied. Because the variables were expressed in different measurement units and exhibited different numerical ranges, PCA was performed using the correlation matrix and HCA was conducted using correlation-based distance measures. This approach allows the variables to be compared on a common scale and reduces the influence of differences in measurement units on the multivariate results.
To complement the PCA, a Hierarchical Cluster Analysis (HCA) was performed, using correlation-based distance and the “group average” agglomeration method. This analysis is exploratory in nature and was used to identify clusters of variables with similar behavior, as well as to assess the degree of association between temporal, socioeconomic, and climatic factors and municipal waste streams.
The multivariate analyses used in this study are exploratory in nature and were applied to identify patterns of association and statistical relationships among variables. These methods do not allow for the demonstration of direct causal relationships between the factors analyzed and the amounts of waste generated, but they do provide a basis for formulating hypotheses and identifying directions for further analysis.
2.6. Software Tools and the Reproducibility of Analysis
All data processing, statistical analyses, and graphical representations were performed using OriginPro 2019 software v.9.6.5.169 (OriginLab, Northampton, MA, USA) [
80]. The software’s native functions were used for time series analysis, descriptive statistics, nonparametric tests, PCA, HCA, and the generation of heatmaps.
To ensure the reproducibility and traceability of the results, all figures, tables, and statistics were generated through automatic recalculation, and the workflows were saved as analysis templates. This approach is in line with current requirements regarding transparency and reproducibility in waste management research [
4,
14,
17].
3. Results
3.1. Seasonal Trends and Composition of Municipal Waste
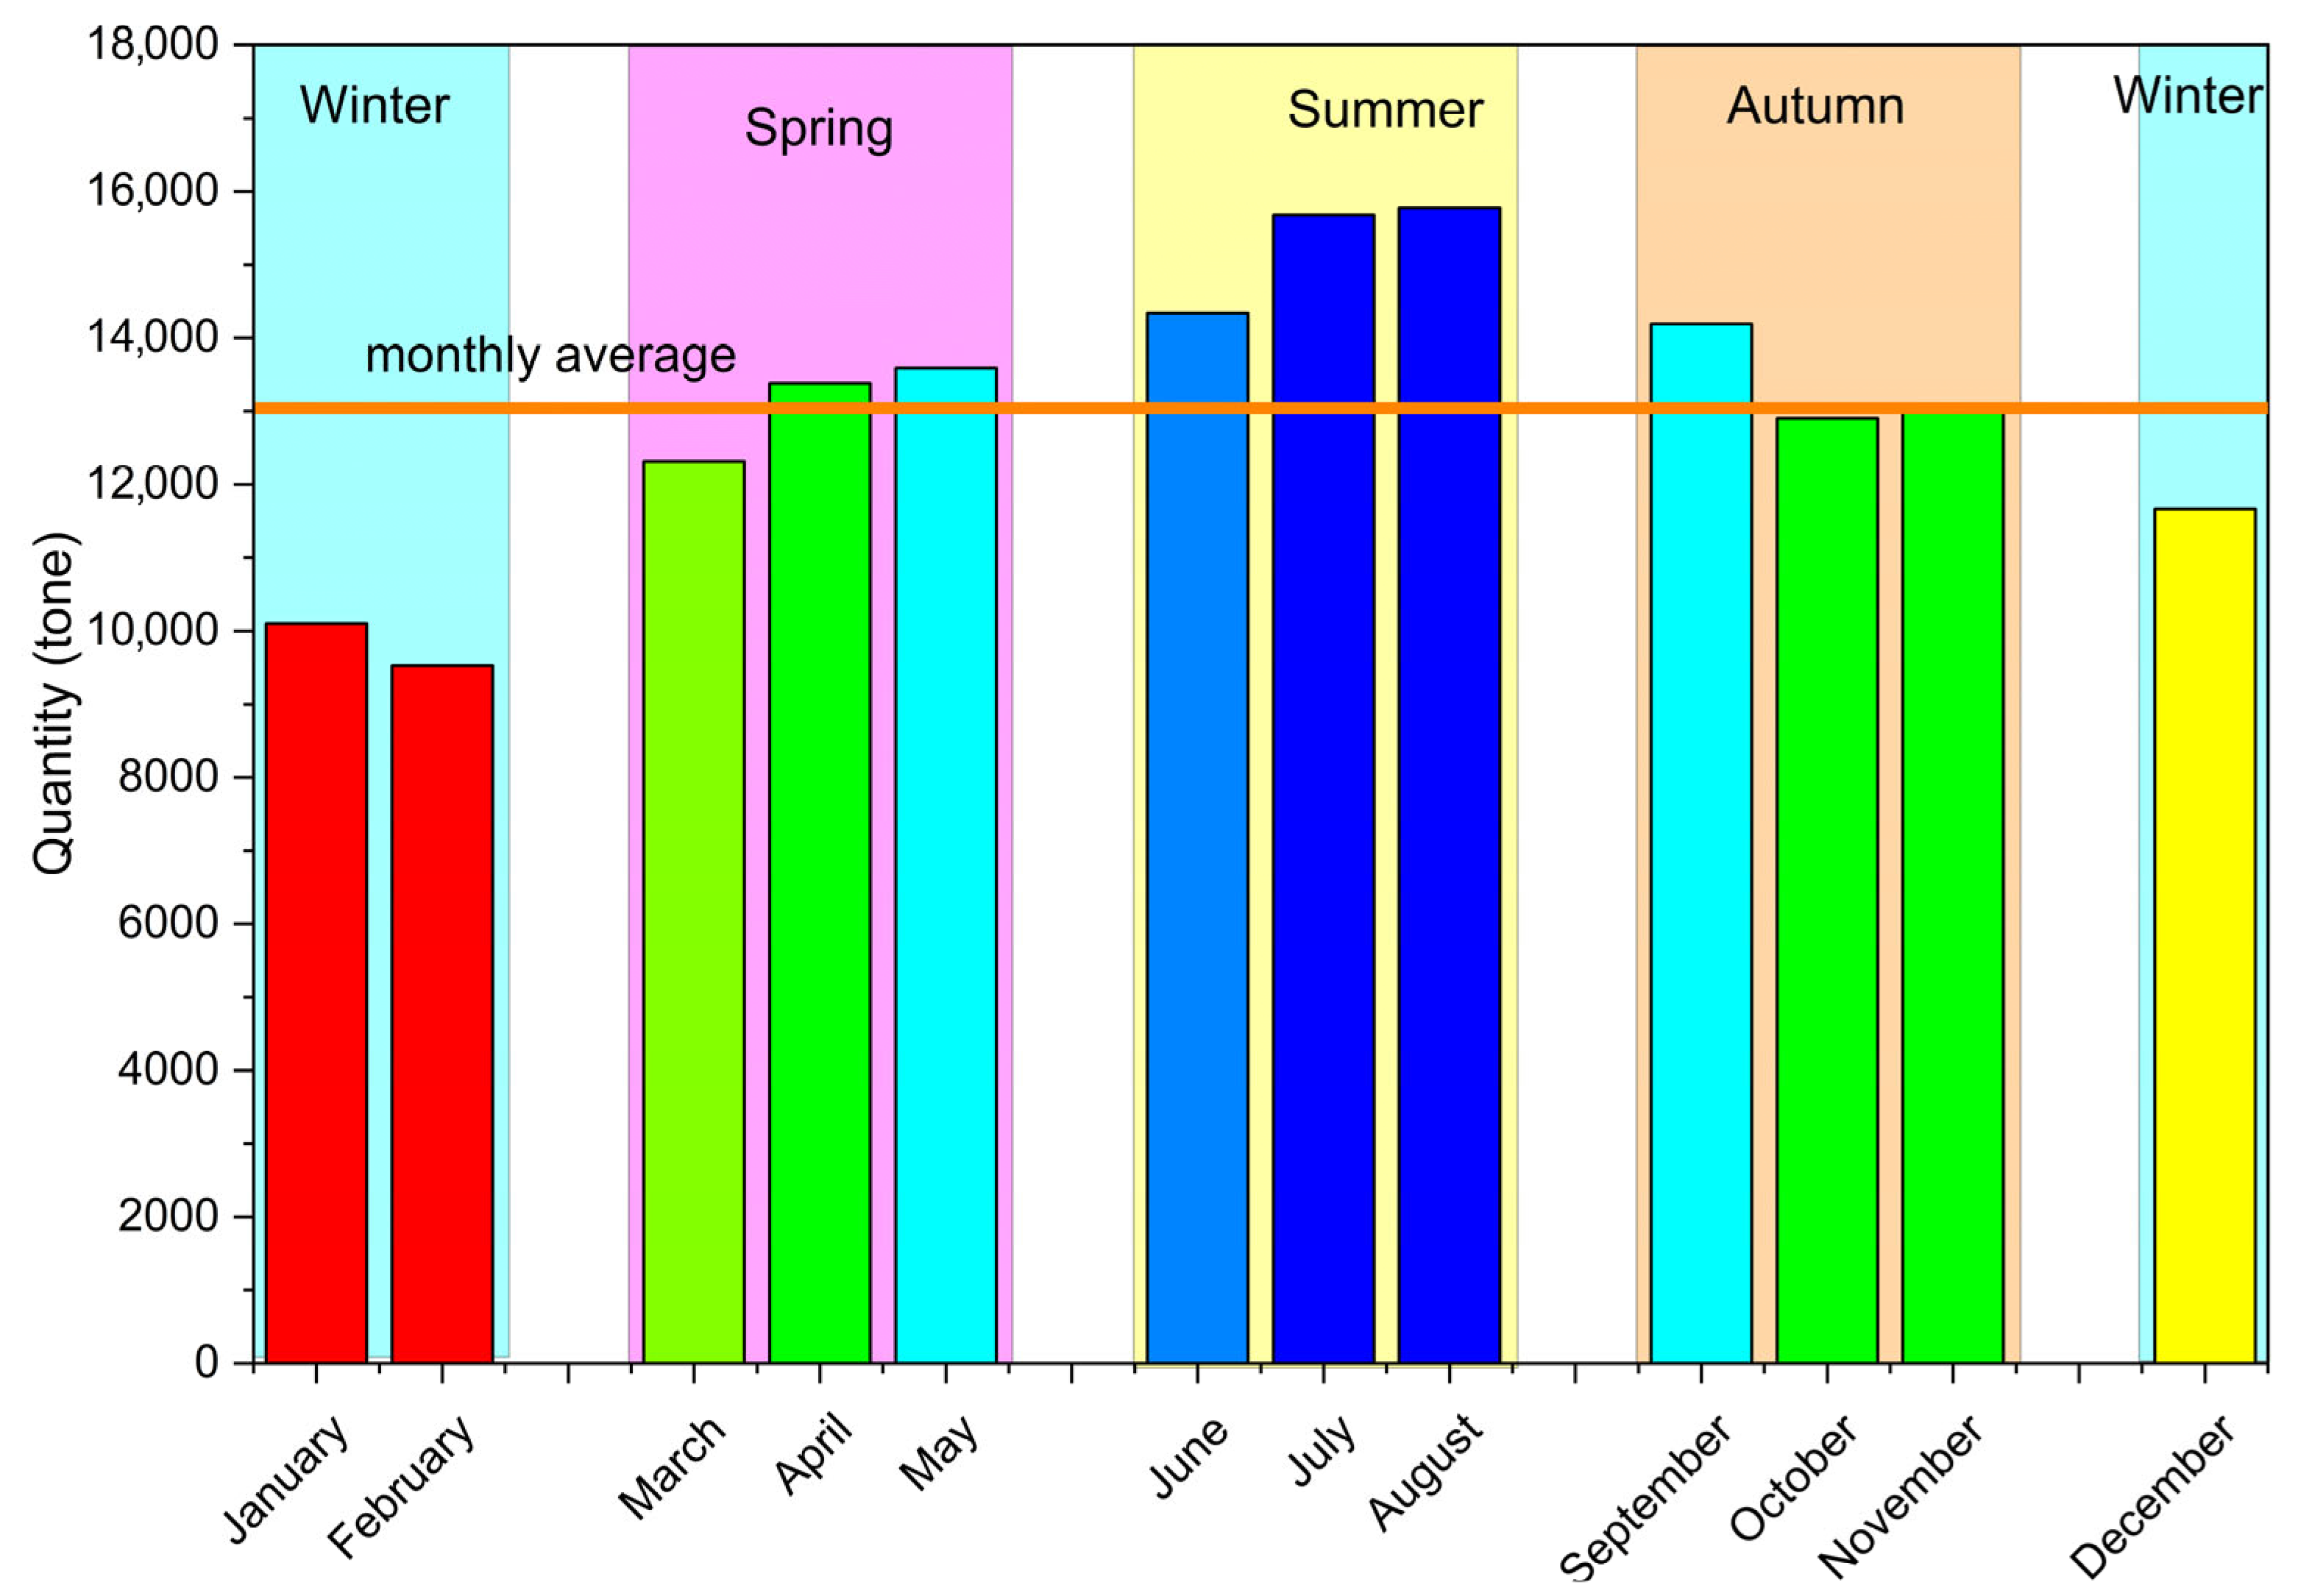
Figure 1 illustrates the monthly variation in the total amount of municipal waste collected in Bacău County throughout 2021, showing a clear, unimodal seasonal pattern, with minimum values during the cold season and maximum values during the summer months.
The total annual amount of municipal waste was 156,444 tons, corresponding to a monthly average of approximately 13,037 tons. However, deviations from this average were substantial and systematic, indicating a pronounced seasonality in waste generation.
The lowest monthly volumes are recorded during the winter months, with an annual low in February (≈9529 t), followed by January (≈10,102 t) and December (≈11,666 t). Calculated seasonal indices confirm this relative underperformance compared to the annual average, with values ranging between 0.73 and 0.89, corresponding to quantities 10–27% below the monthly average. This period is characterized by reduced economic activity, low population mobility, and limited outdoor activities, factors that contribute to a decrease in municipal waste flows.
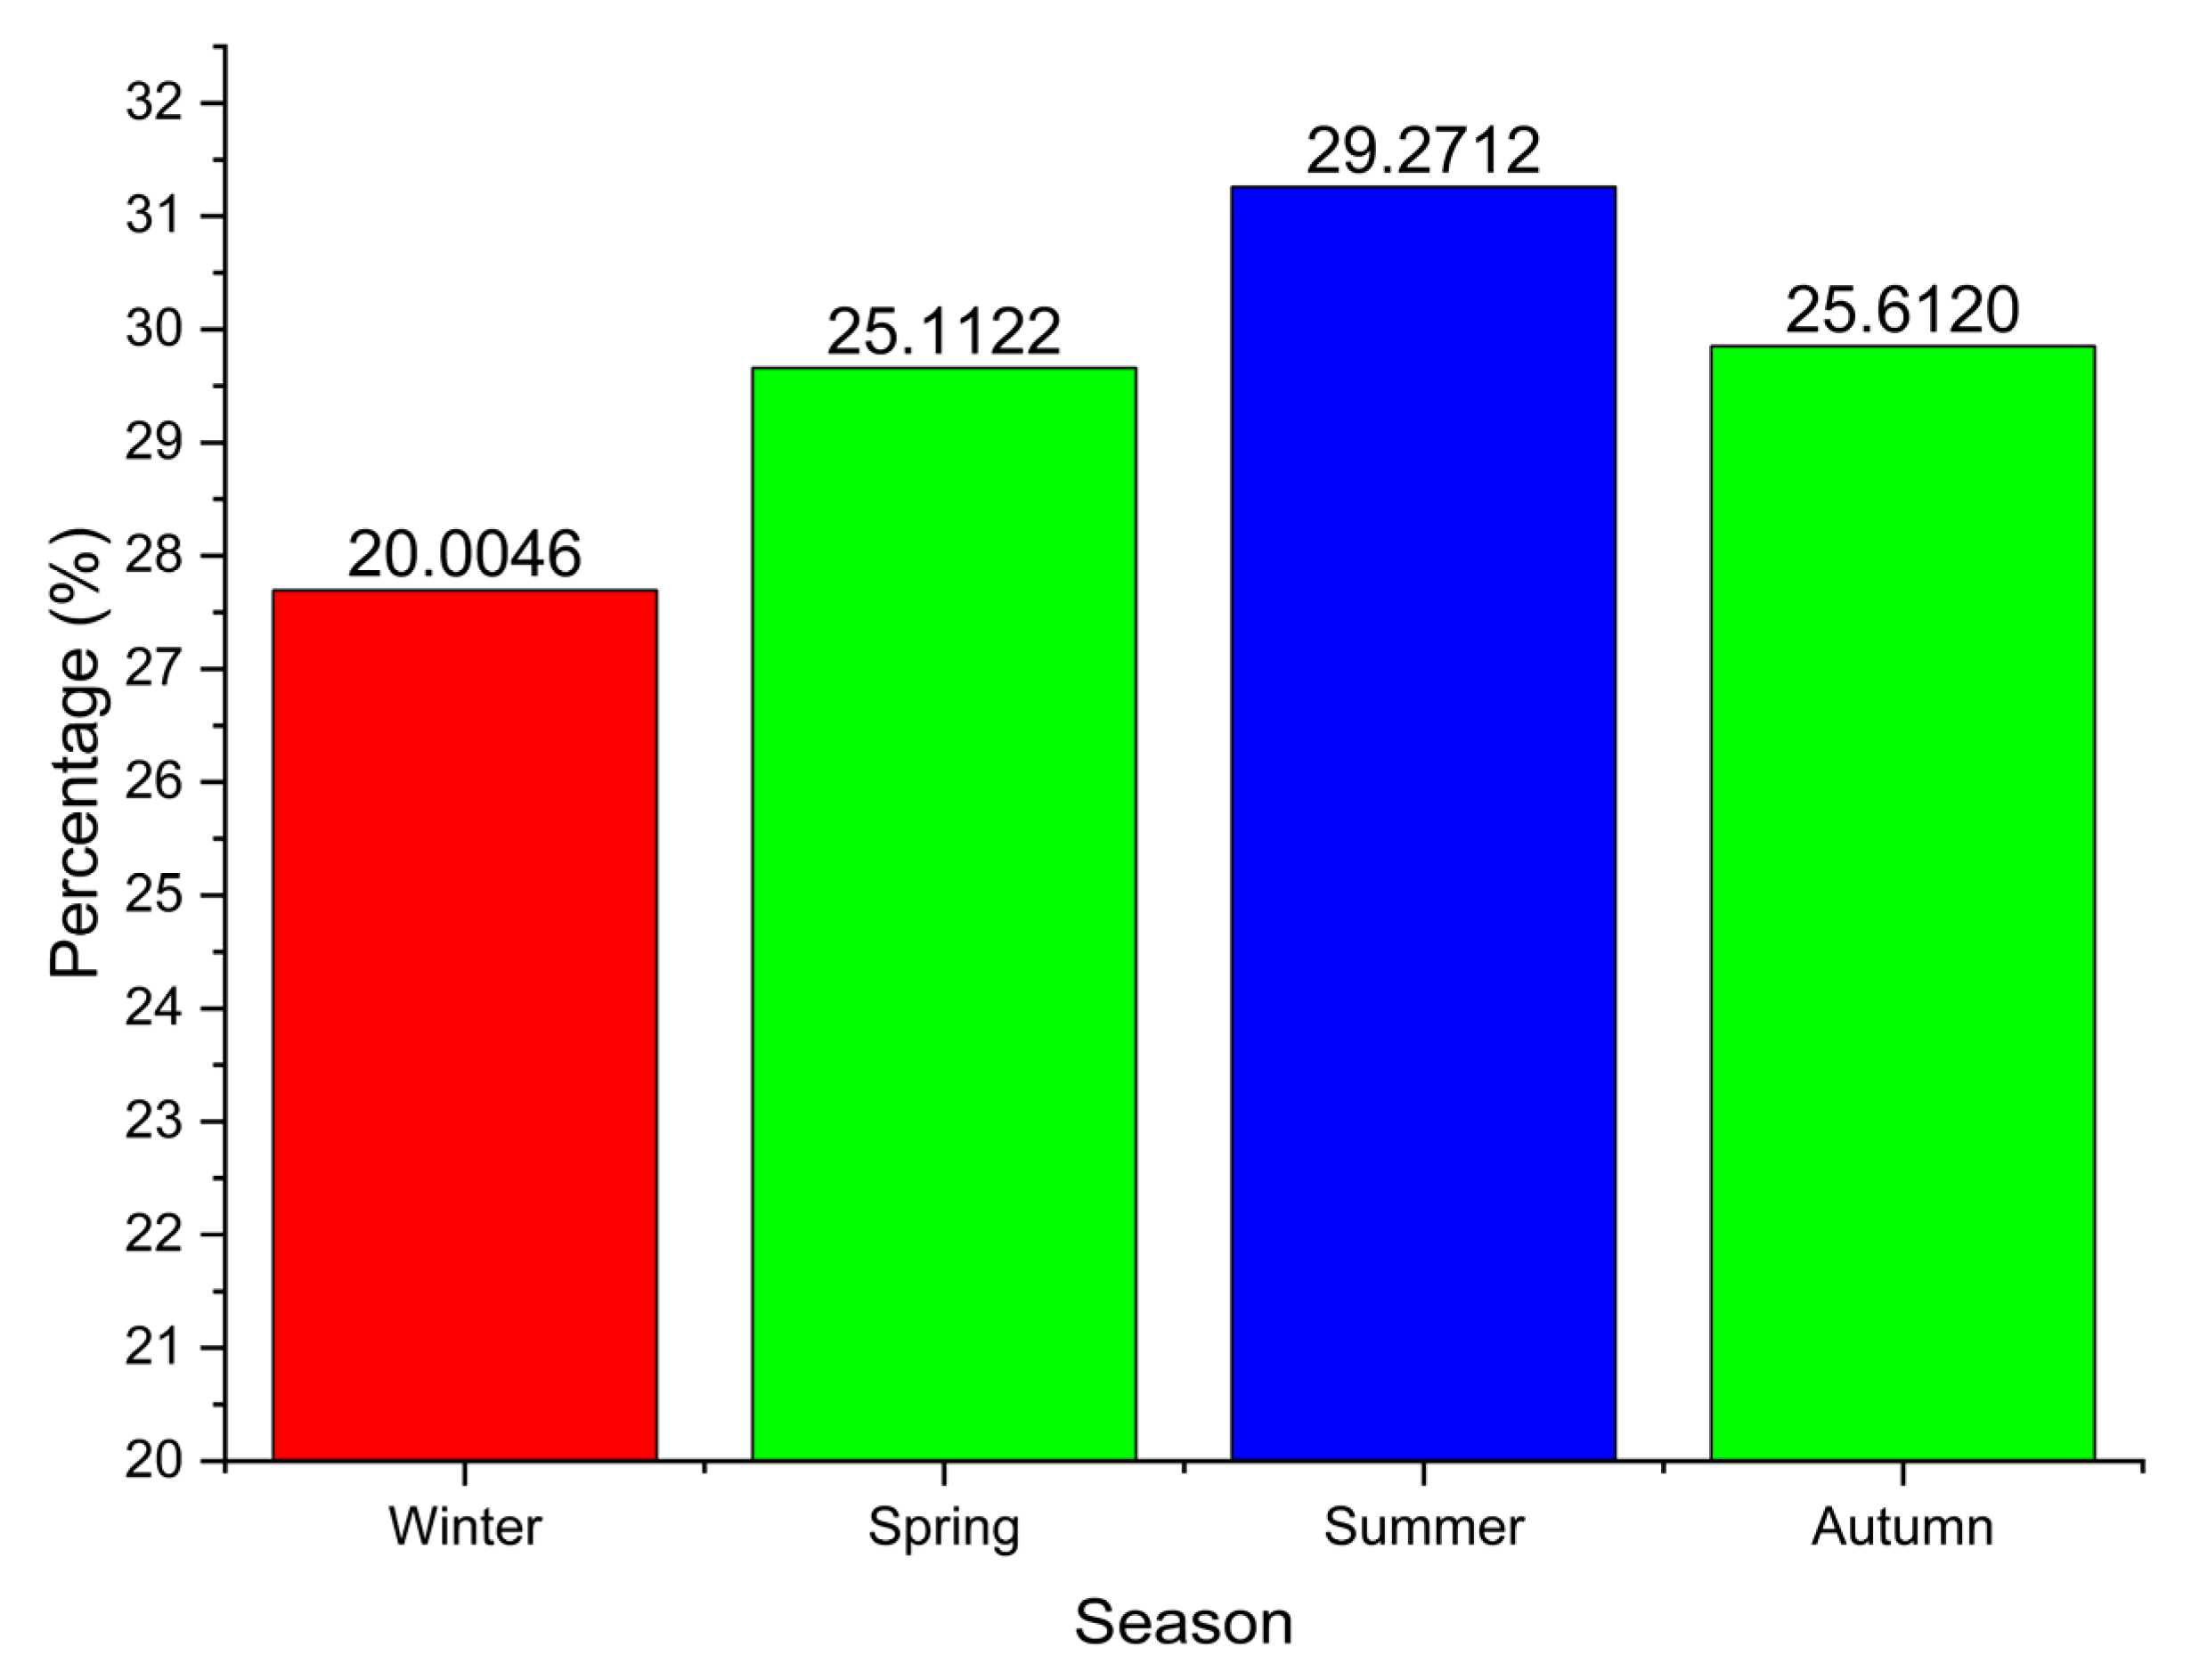
Starting in March, the recorded quantities increase progressively, exceeding the annual average beginning in April–May. Peak values are reached in July (≈15,678 t) and August (≈15,774 t), months for which seasonal indices are highest (1.20–1.21), corresponding to exceedances of the annual average by ≈20–21%. Such concentration of waste generation during the warm season is typical of temperate regions and reflects the intensification of household, commercial, and recreational activities, as well as increased consumption of short-lived goods. In quantitative terms, approximately 29–30% of the annual total of municipal waste is generated during the summer months (June–August), while the cold season (December–February) accounts for only ≈20% of the total, accentuating the seasonal polarization of the waste stream.
During the autumn months, there is a gradual decrease in the quantities collected, with values close to the annual average in October (≈12,904 t) and November (≈12,974 t), followed by a more pronounced decline in December. The seasonal indices for these months are close to one (≈0.99), indicating a transition phase between the summer maximum and the winter minimum.
From an operational perspective, the results shown in
Figure 1 indicate the need for seasonal calibration of collection, transfer, and treatment capacities, with increased capacity requirements during the summer and the use of the winter months for maintenance, logistical optimization, and planning. Furthermore, the reduced amplitude of the “adjusted series” suggests that the annual variation is explained primarily by the seasonal component rather than by structural changes in the analyzed system.
Figure 2 illustrates the percentage distribution of the total amount of municipal waste by season, highlighting how annual waste generation is distributed seasonally. The values for each season are clearly identified and labeled directly on the graph, allowing for a direct comparative analysis.
Figure 2 confirms the seasonal concentration of municipal waste generation, with the warm season accounting for the largest share of annual waste quantities and the cold season for the lowest. The intermediate values recorded during spring and autumn support the gradual seasonal transition identified in the monthly time-series analysis.
The graph in
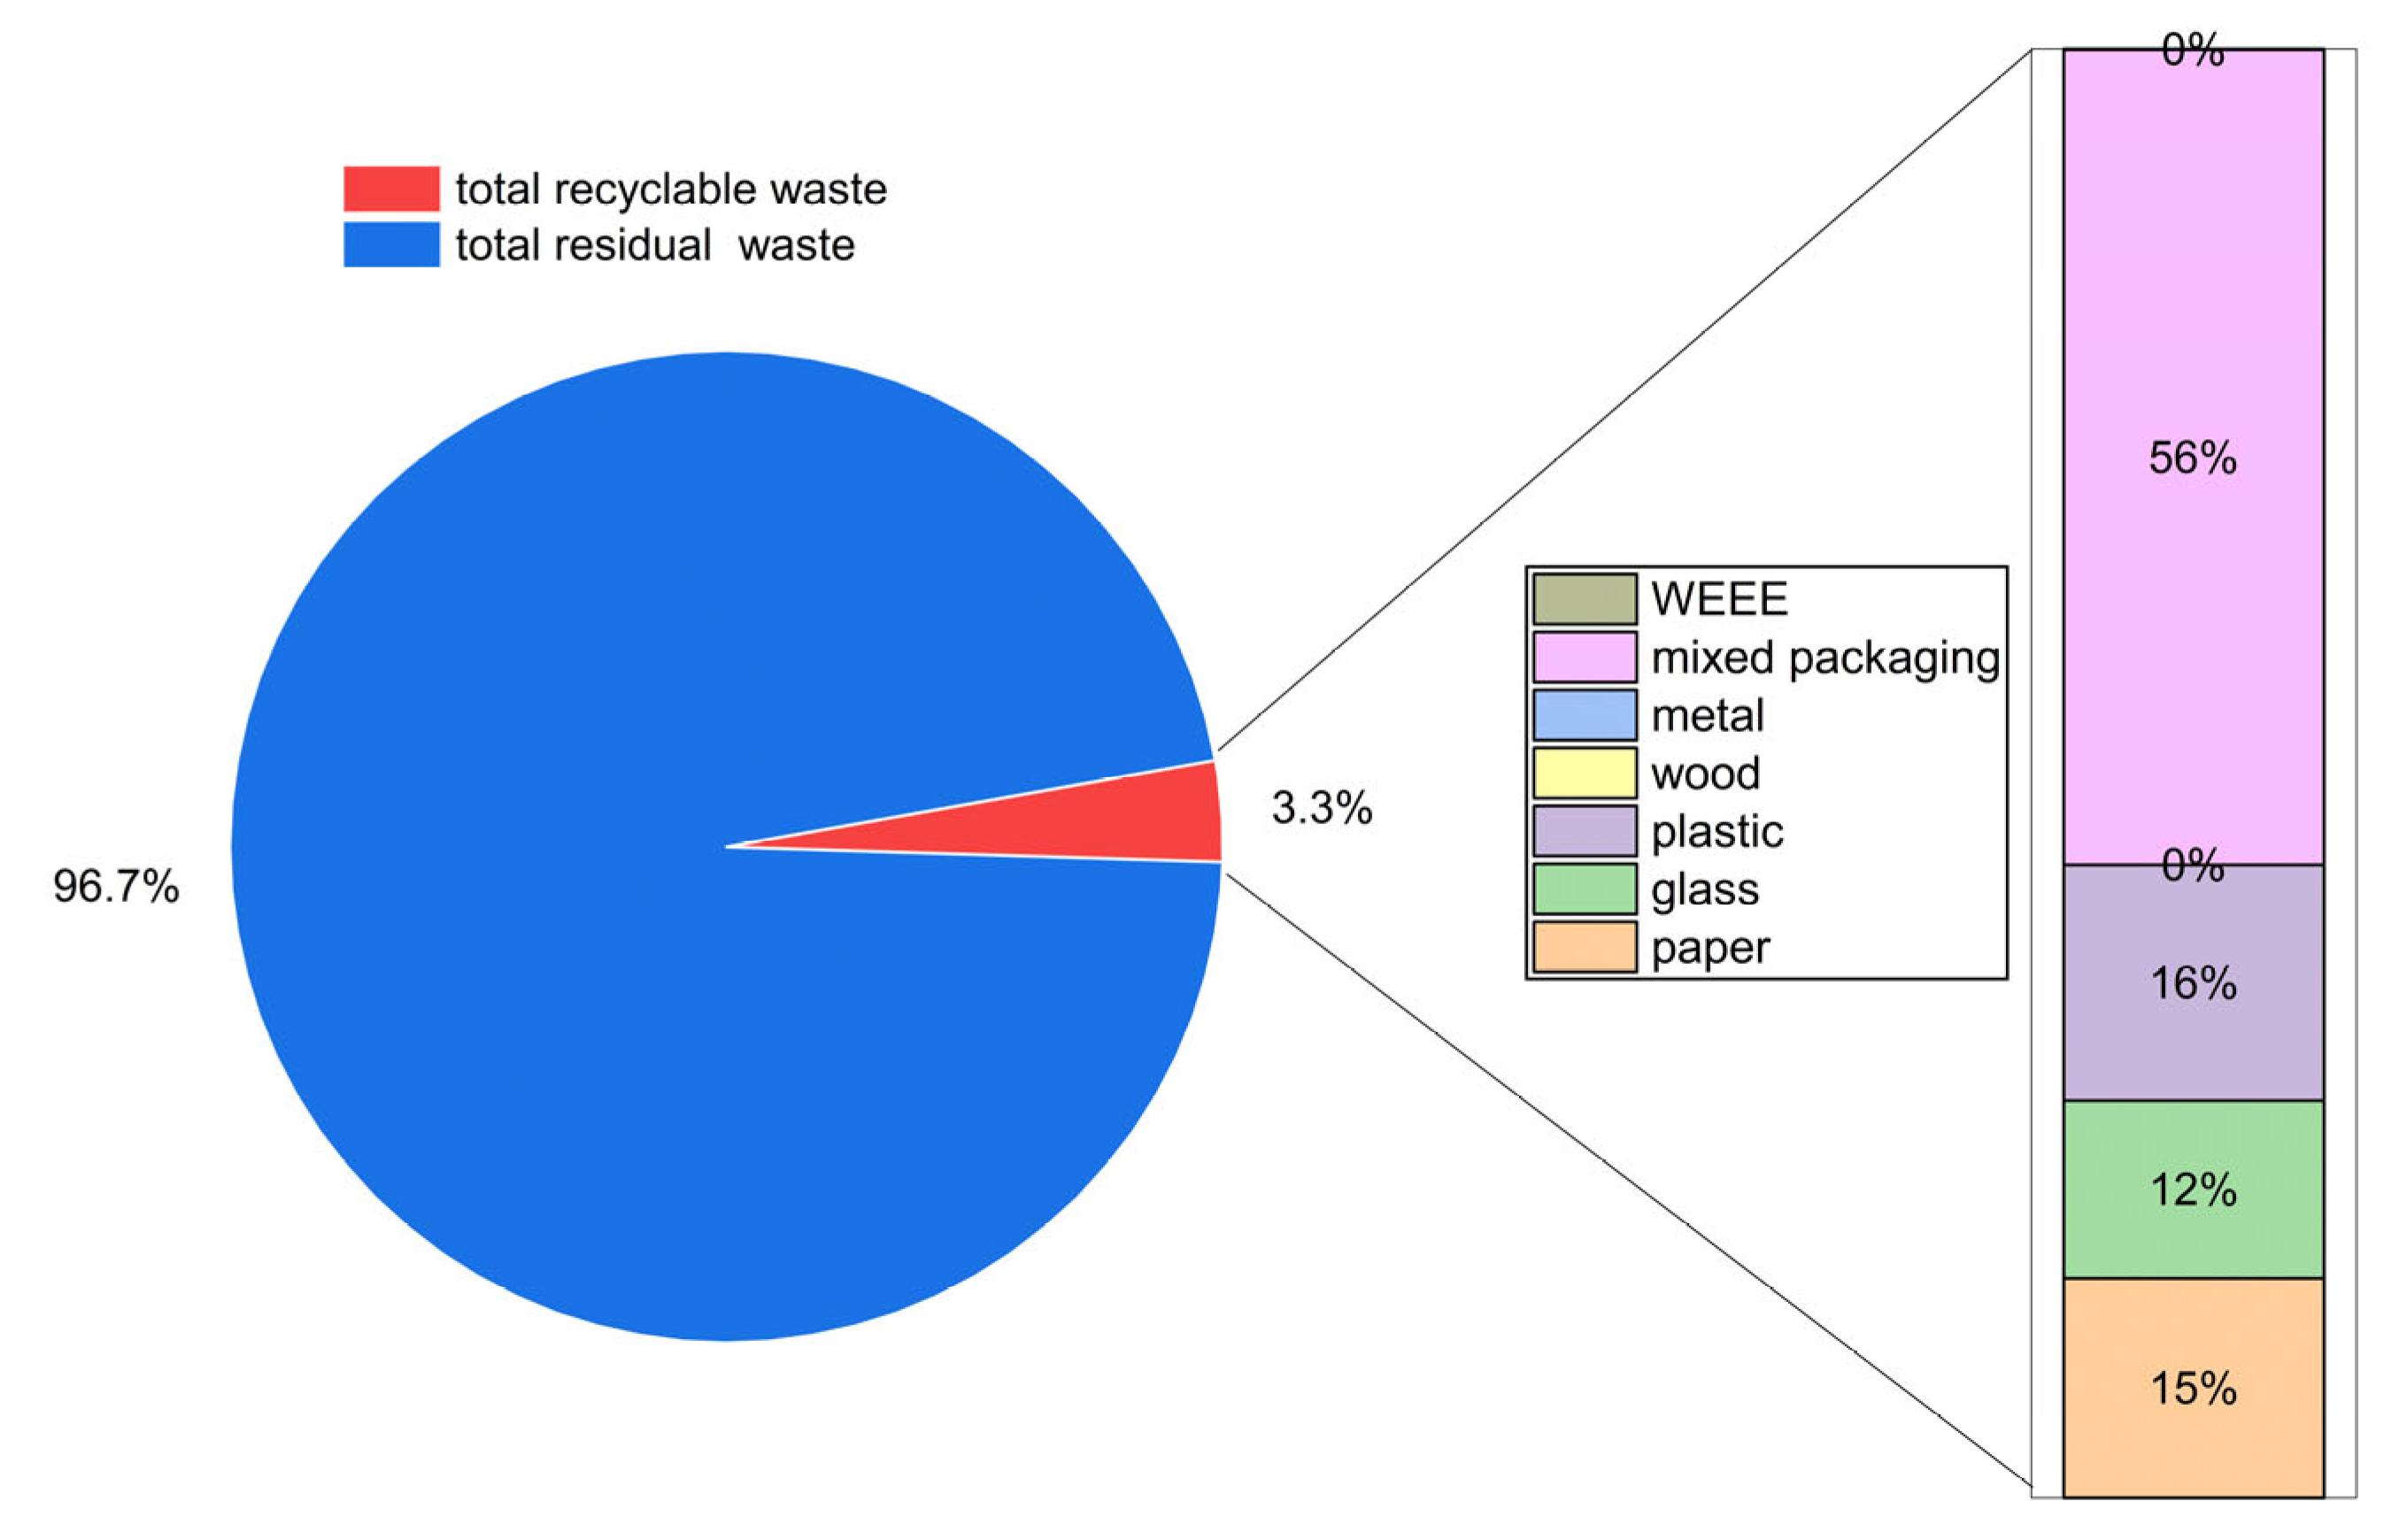
Figure 3 shows the breakdown of the total amount of municipal waste collected during the year under study, highlighting the ratio between residual waste and separately collected recyclable waste, as well as the internal composition of the separately collected recyclable fraction. The representation combines a pie chart to delineate the two major categories and a graphical breakdown of the recyclable sub-fractions.
According to the data summarized in the graph in
Figure 3, residual waste accounts for 96.7% of the total annual volume, while separately collected recyclable waste accounts for only 3.3%. This significant difference indicates a clear dominance of residual waste in the overall municipal waste stream and highlights the marginal nature of separate collection during the period analyzed.
The value of 3.3% represents the share of separately collected recyclable waste within the total municipal waste stream managed by the Integrated Waste Management System in Bacău County, and not the physical composition of the municipal waste generated. Therefore, this indicator reflects the performance of separate collection and the degree to which recyclable fractions are captured, not the actual proportion of recyclable materials in total waste mass. The low proportion of separately collected recyclable waste highlights a significant gap between European circular economy goals and current performance in selective collection at the local level. This result suggests that a significant portion of potentially recoverable materials continue to be diverted to the residual waste stream, thereby reducing the efficiency of resource recovery and increasing pressure on waste treatment and disposal infrastructure.
A breakdown of the separately collected recyclable fraction reveals a highly polarized internal structure. The largest contribution comes from mixed packaging, which accounts for 56% of total recyclable waste, making it the dominant fraction within this subgroup. This is followed by plastics, accounting for 16%, paper/cardboard packaging at 15%, and glass at 12%. These four fractions account for virtually the entire amount of separately collected recyclable waste.
The chart also shows zero or near-zero shares for certain waste streams, such as waste electrical and electronic equipment (WEEE), metal, and wood, which are listed in the legend but do not account for a measurable portion of the total recyclables. This absence confirms that these streams were either not collected separately during the period analyzed or were present in negligible quantities compared to the other fractions.
From an internal structure perspective, the results show that the vast majority of separately collected recyclable waste is concentrated in packaging fractions, particularly mixed packaging, plastic, and paper. At the same time, the very low share of recyclable waste relative to total municipal waste highlights the structural imbalance of the system, in which residual waste overwhelmingly dominates.
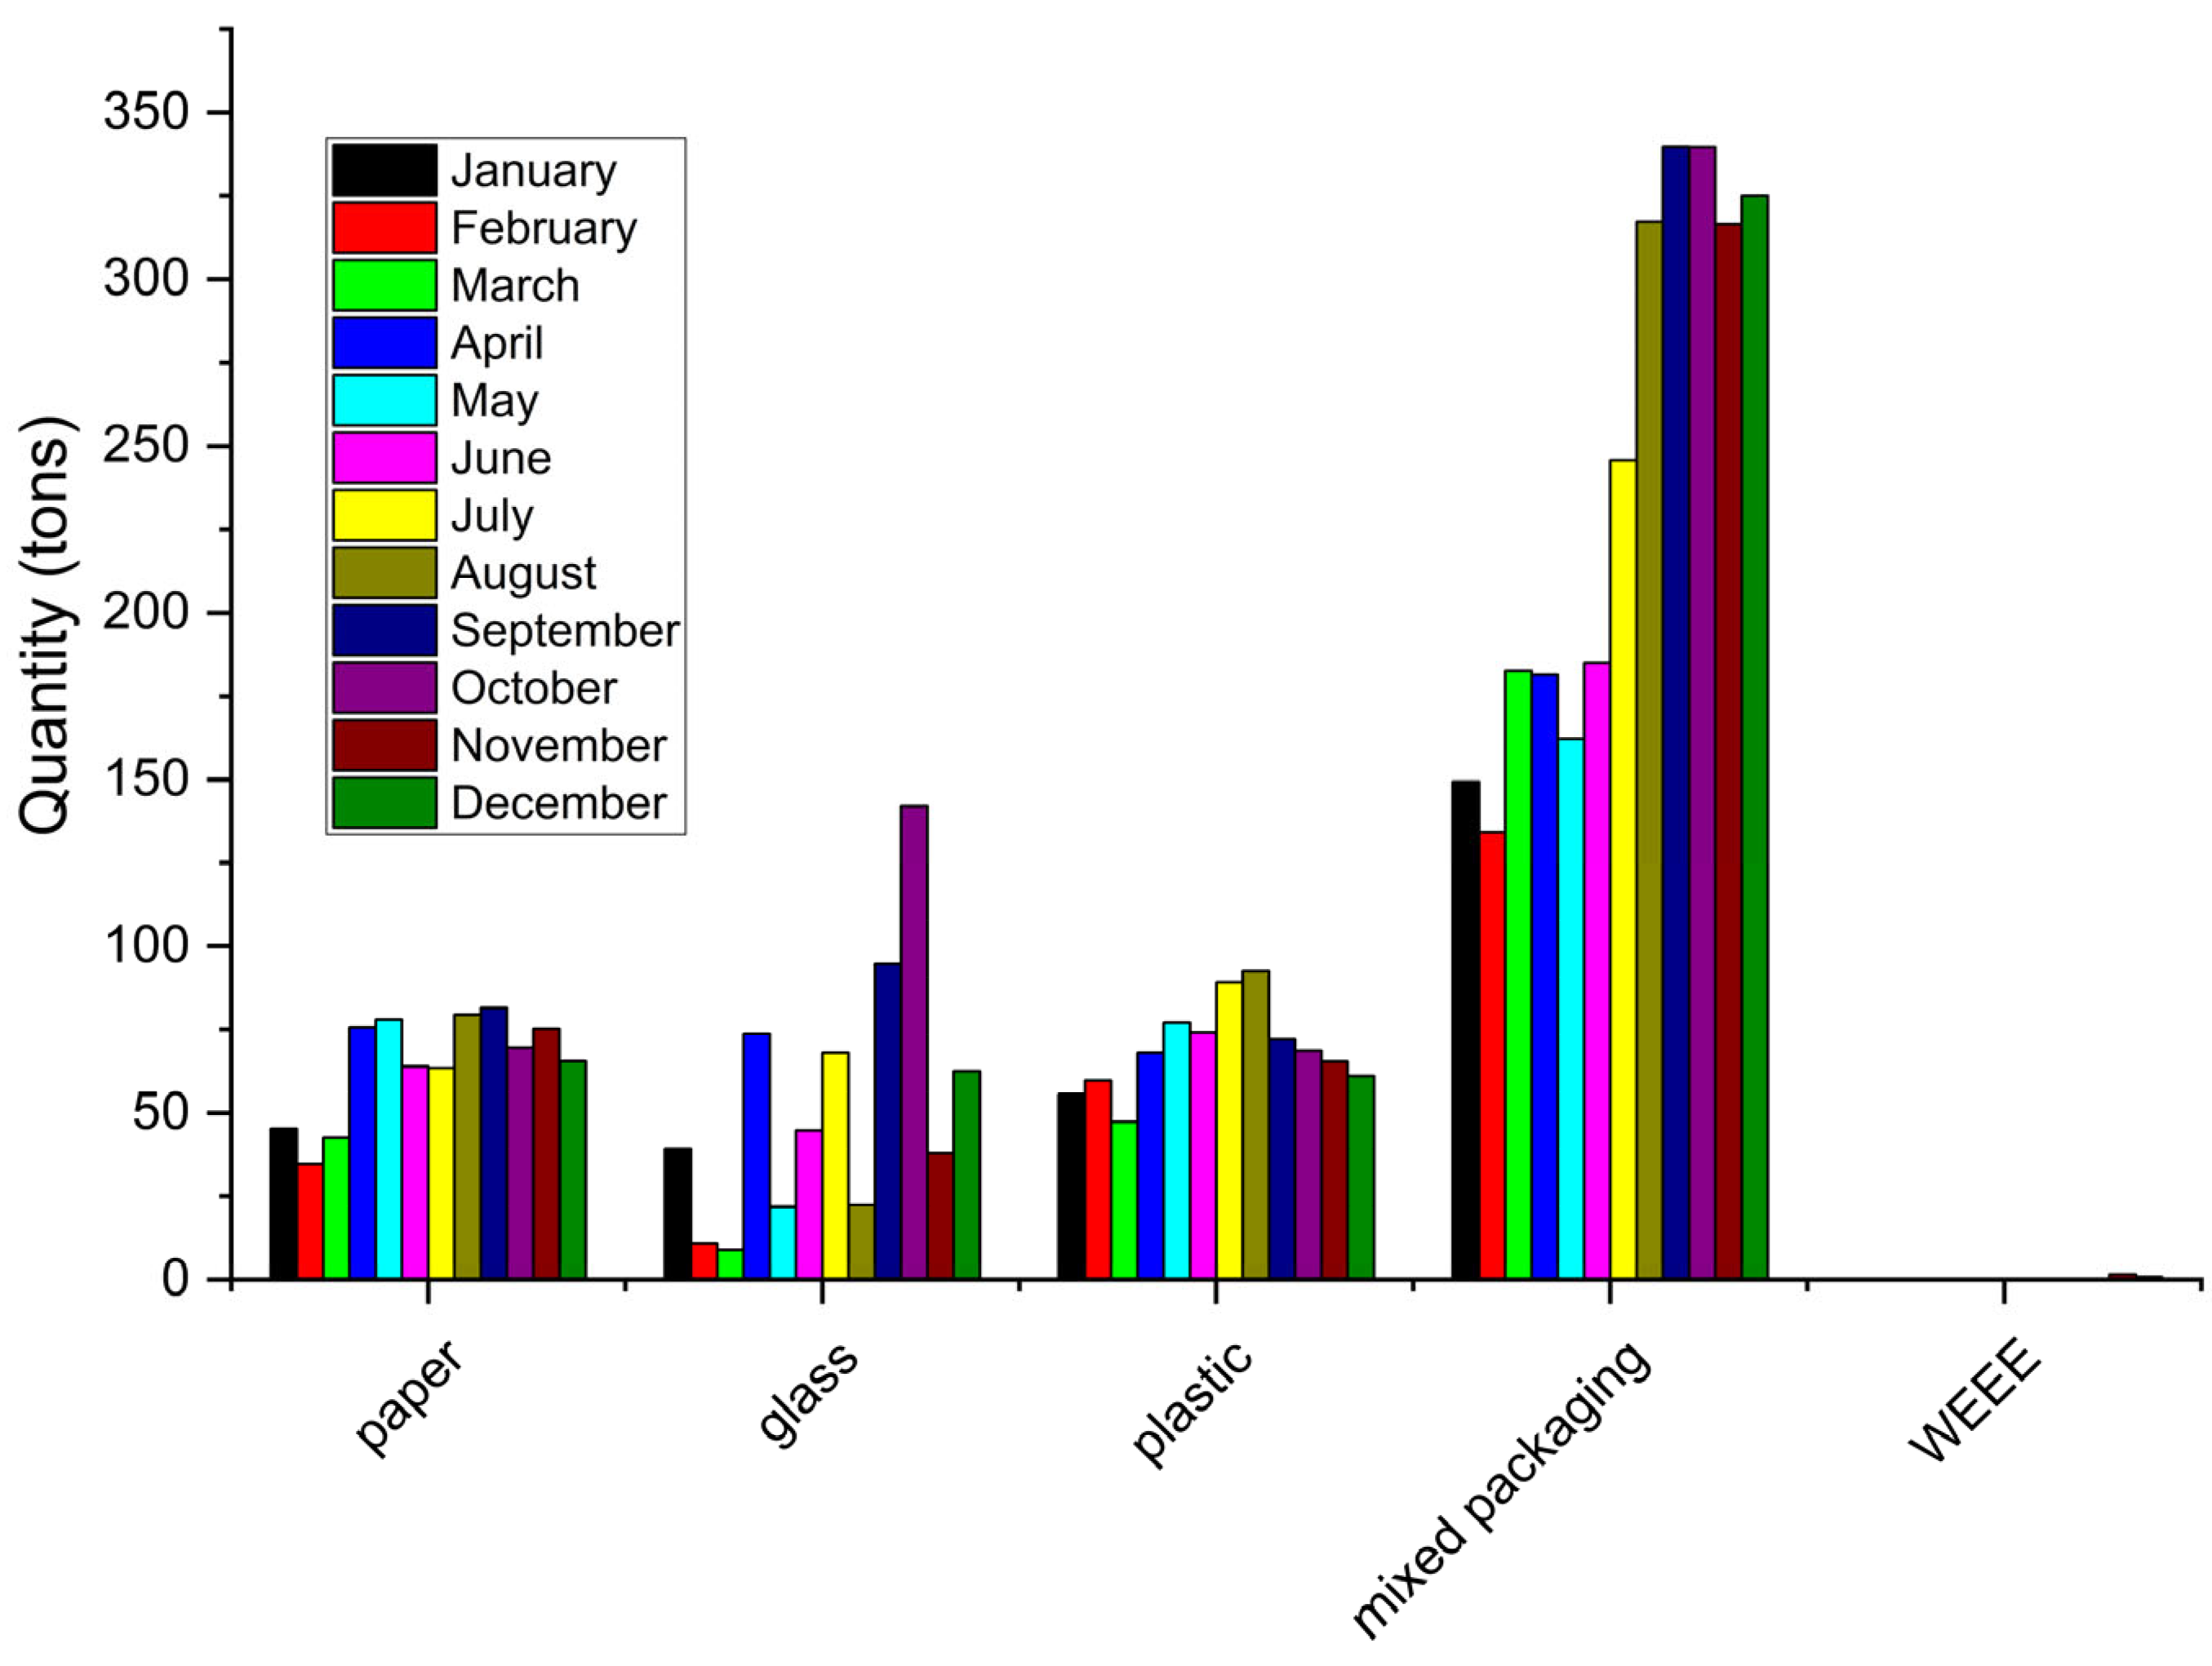
Figure 4 shows the variation in the monthly volume of the main types of recyclable waste, expressed in tons, over the course of the year analyzed. The graph compares five recyclable fractions—paper, glass, plastic, mixed packaging, and WEEE—for each month, highlighting both the differences between fractions and seasonal variability.
Figure 4 highlights a stable hierarchy among recyclable waste streams throughout the year. Mixed packaging consistently represents the largest fraction, followed by plastics, paper/cardboard and glass, while WEEE contributes only marginally. Despite differences in magnitude, most recyclable fractions exhibit a common seasonal pattern, with higher quantities recorded during the warm months and lower values during winter.
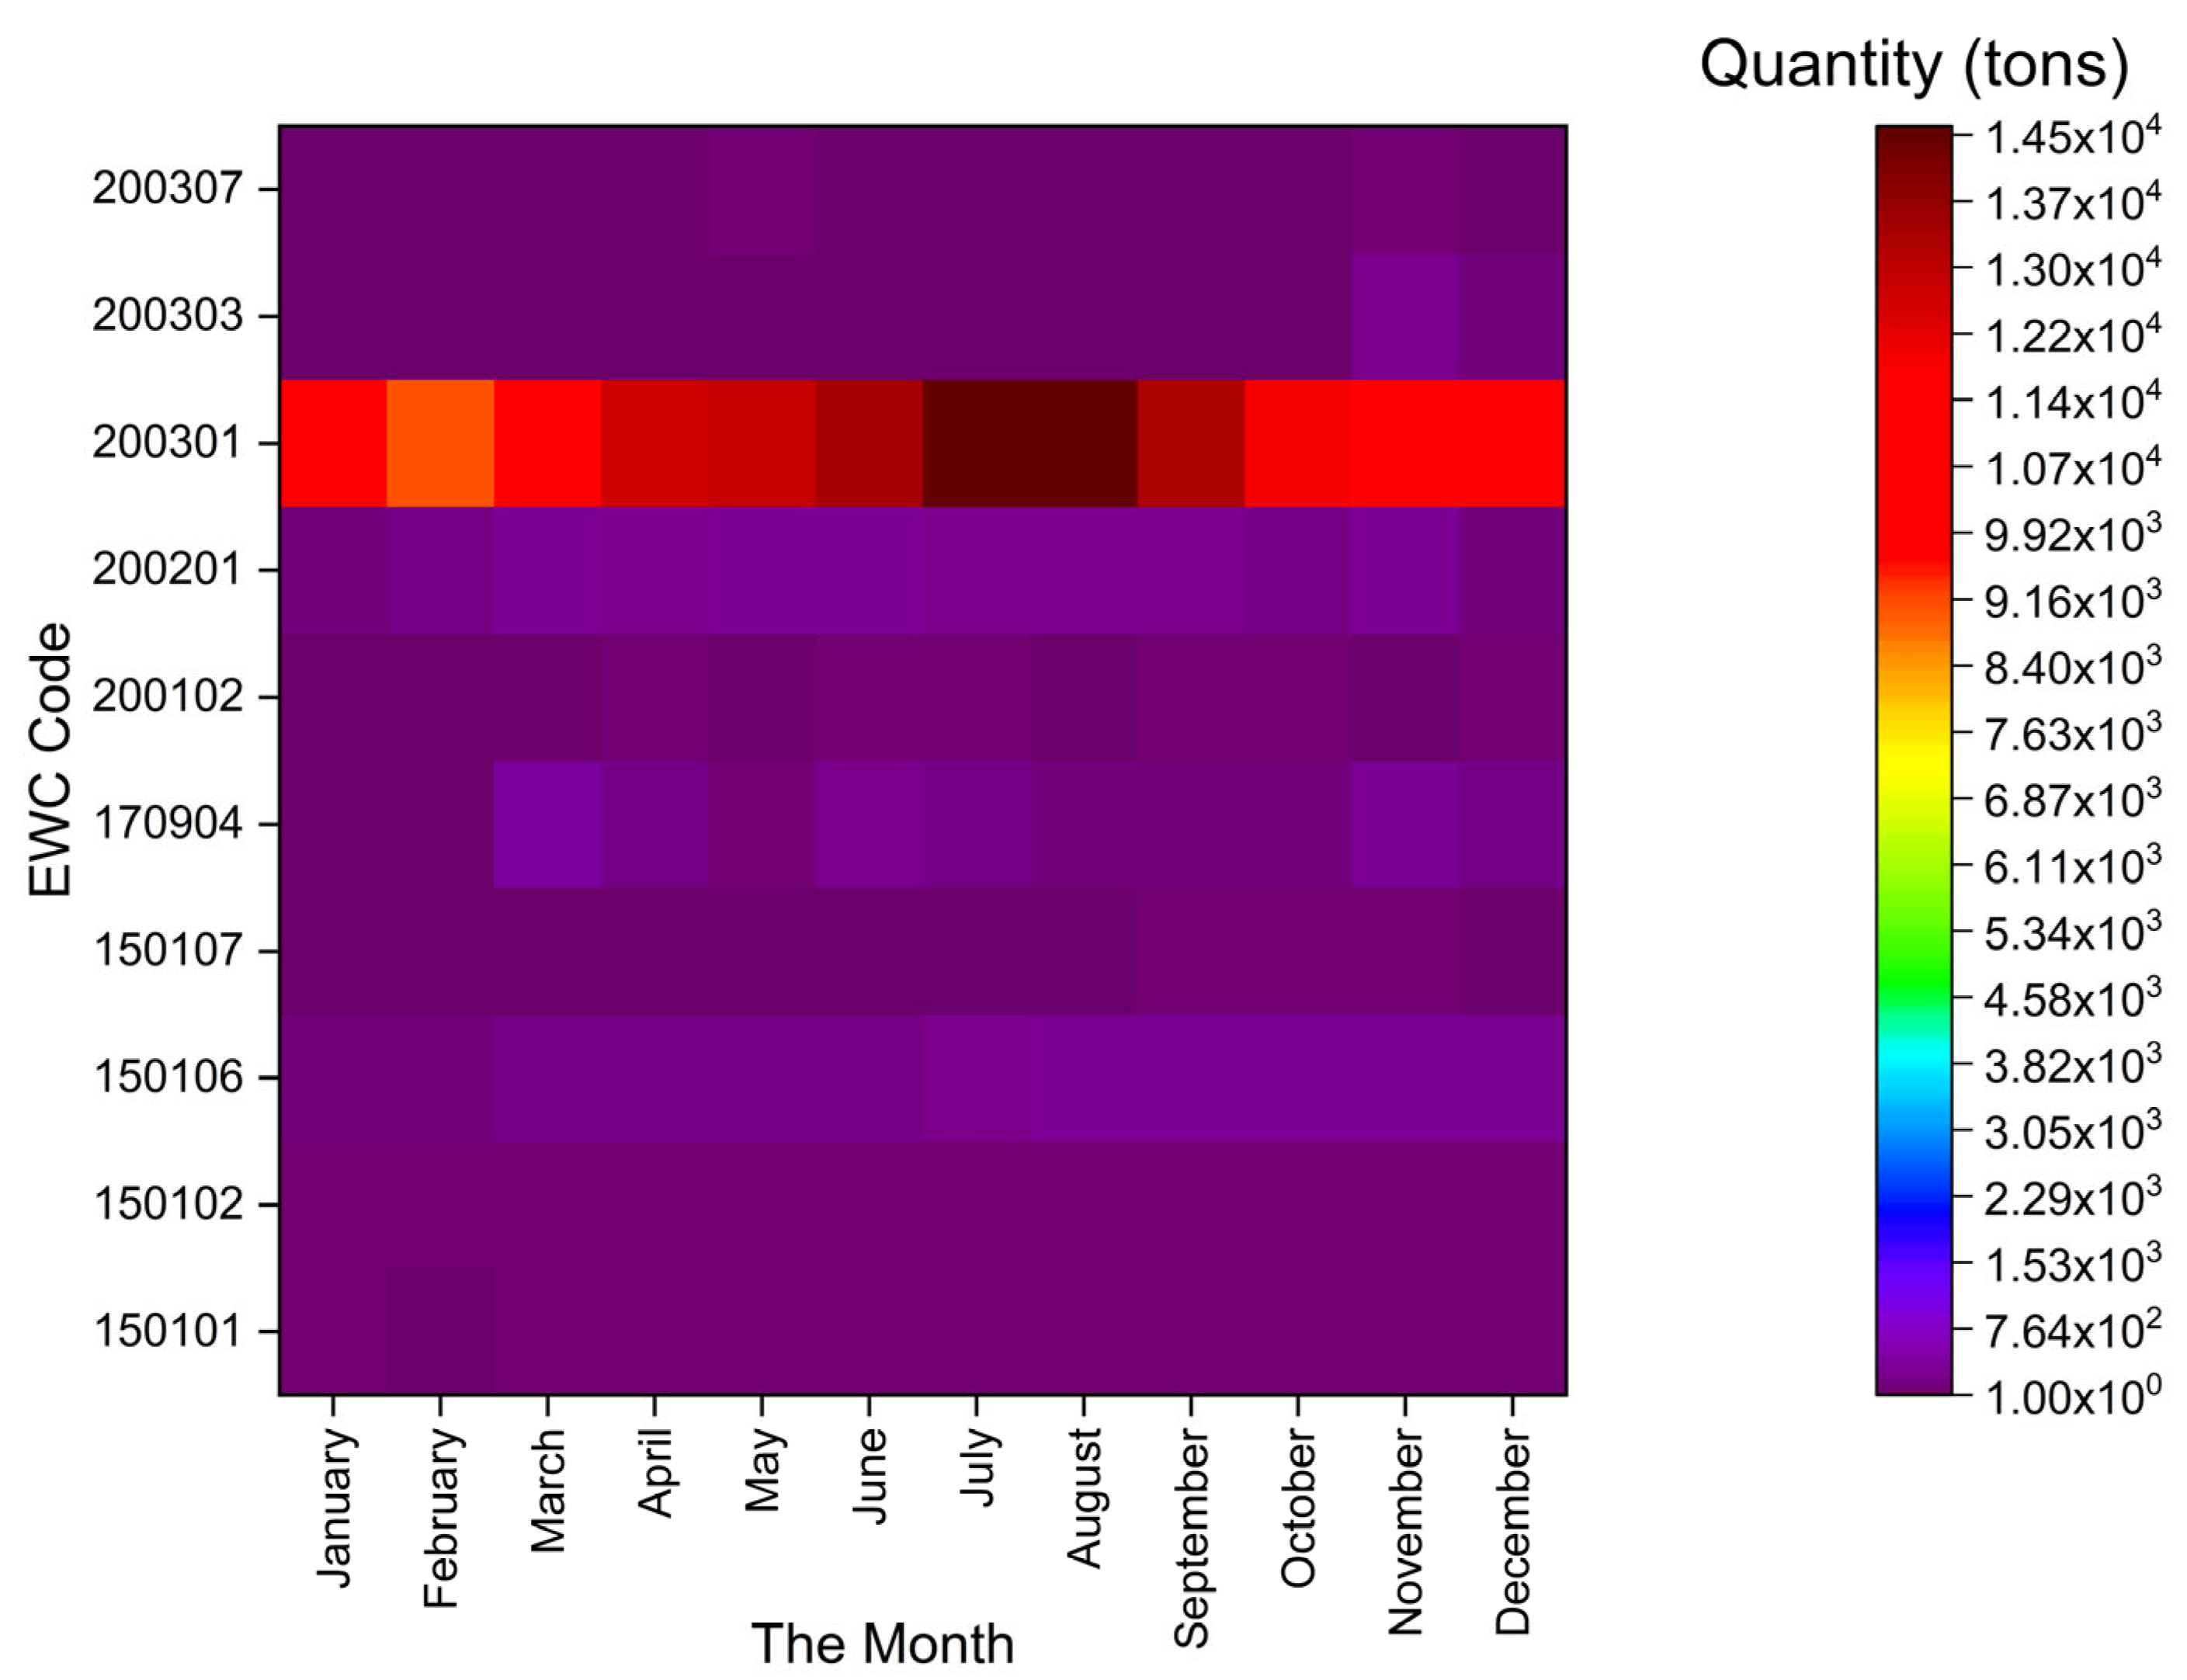
Figure 5 illustrates the monthly distribution of municipal waste quantities, broken down by EWC codes, using a month–fraction matrix, in which color intensity indicates the magnitude of the collected quantities. This type of visualization is frequently used in the literature to analyze seasonal variations and the structure of waste streams, as it allows for the simultaneous highlighting of temporal dynamics and differences between fractions [
48,
81,
82].
The results presented in
Figure 5 indicate a clear predominance of EWC code 20 03 01 (residual municipal waste), which is characterized by the highest chromatic intensities in all the months analyzed. The quantities associated with this stream increase progressively from the spring season and reach maximum values in the summer months (June–August), followed by a slight decrease toward the end of the year. This seasonal pattern of the residual waste stream is consistent with the results reported in previous studies on monthly municipal waste generation [
83,
84].
The other EWC codes are characterized by much lower chromatic intensities, indicating limited quantitative contributions relative to the dominant stream. For certain fractions, discrete monthly variations are observed, with occasional increases during the warm season; however, these changes do not lead to significant structural changes in the overall composition. This distribution is similar to that described in studies analyzing the separate collection and temporal evolution of recyclable fractions, where seasonal variations are secondary to the dominance of the residual fraction [
82,
85].
Figure 5 also highlights a high degree of structural stability in waste streams throughout the year, with the order of magnitude of the quantities associated with the various EWC codes remaining constant, despite monthly variations in absolute values. This characteristic suggests that seasonality primarily affects the total volume of waste generated, without significantly altering the composition by waste stream, a finding also reported in other analyses based on monthly time series of municipal waste [
48,
83].
By using a matrix representation,
Figure 5 facilitates the rapid identification of the months with the highest load on the waste management system, as well as the most significant waste streams in terms of volume, providing a robust visual overview of the relationship between seasonality and the typological structure of municipal waste [
48,
82].
3.2. Economic, Calendar, and Climate Indicators Relevant to Seasonal Analysis
A quantitative and descriptive analysis of the monthly and structural distribution of municipal waste reveals clear seasonal variations in the quantities generated, as well as the consistent predominance of residual waste. However, an adequate interpretation of these dynamics requires advanced analytical methods capable of capturing the complex relationships between the temporal and typological variables of waste streams.
The literature indicates that analyses based solely on mean values or univariate comparisons are insufficient for characterizing waste management systems; instead, multivariate and exploratory statistical approaches are recommended, as they allow for the identification of latent structures, multiple correlations, and seasonal patterns [
24,
25,
41,
48,
74,
86,
87,
88,
89]. Such methods are frequently used to inform decisions regarding the optimization of collection systems and the sizing of infrastructure [
48,
83,
90].
Recent studies indicate that seasonality primarily affects the magnitude of waste flows, while the composition by waste fraction remains relatively stable—a hypothesis that requires validation through appropriate statistical analyses [
18,
31,
69,
88,
91,
92]. In this context, multivariate analyses allow for the assessment of similarities between months, the identification of common seasonal patterns, and the support of graphical interpretations through objective statistical tools.
It is widely accepted in the literature that variations in the volume of municipal waste cannot be fully described solely by temporal dynamics; rather, it is necessary to correlate them with socioeconomic, seasonal, and climatic factors, which simultaneously influence consumer behavior, the intensity of economic activities, and operational collection processes [
23,
24,
25,
26,
27,
34,
41,
48,
49,
51,
73,
74].
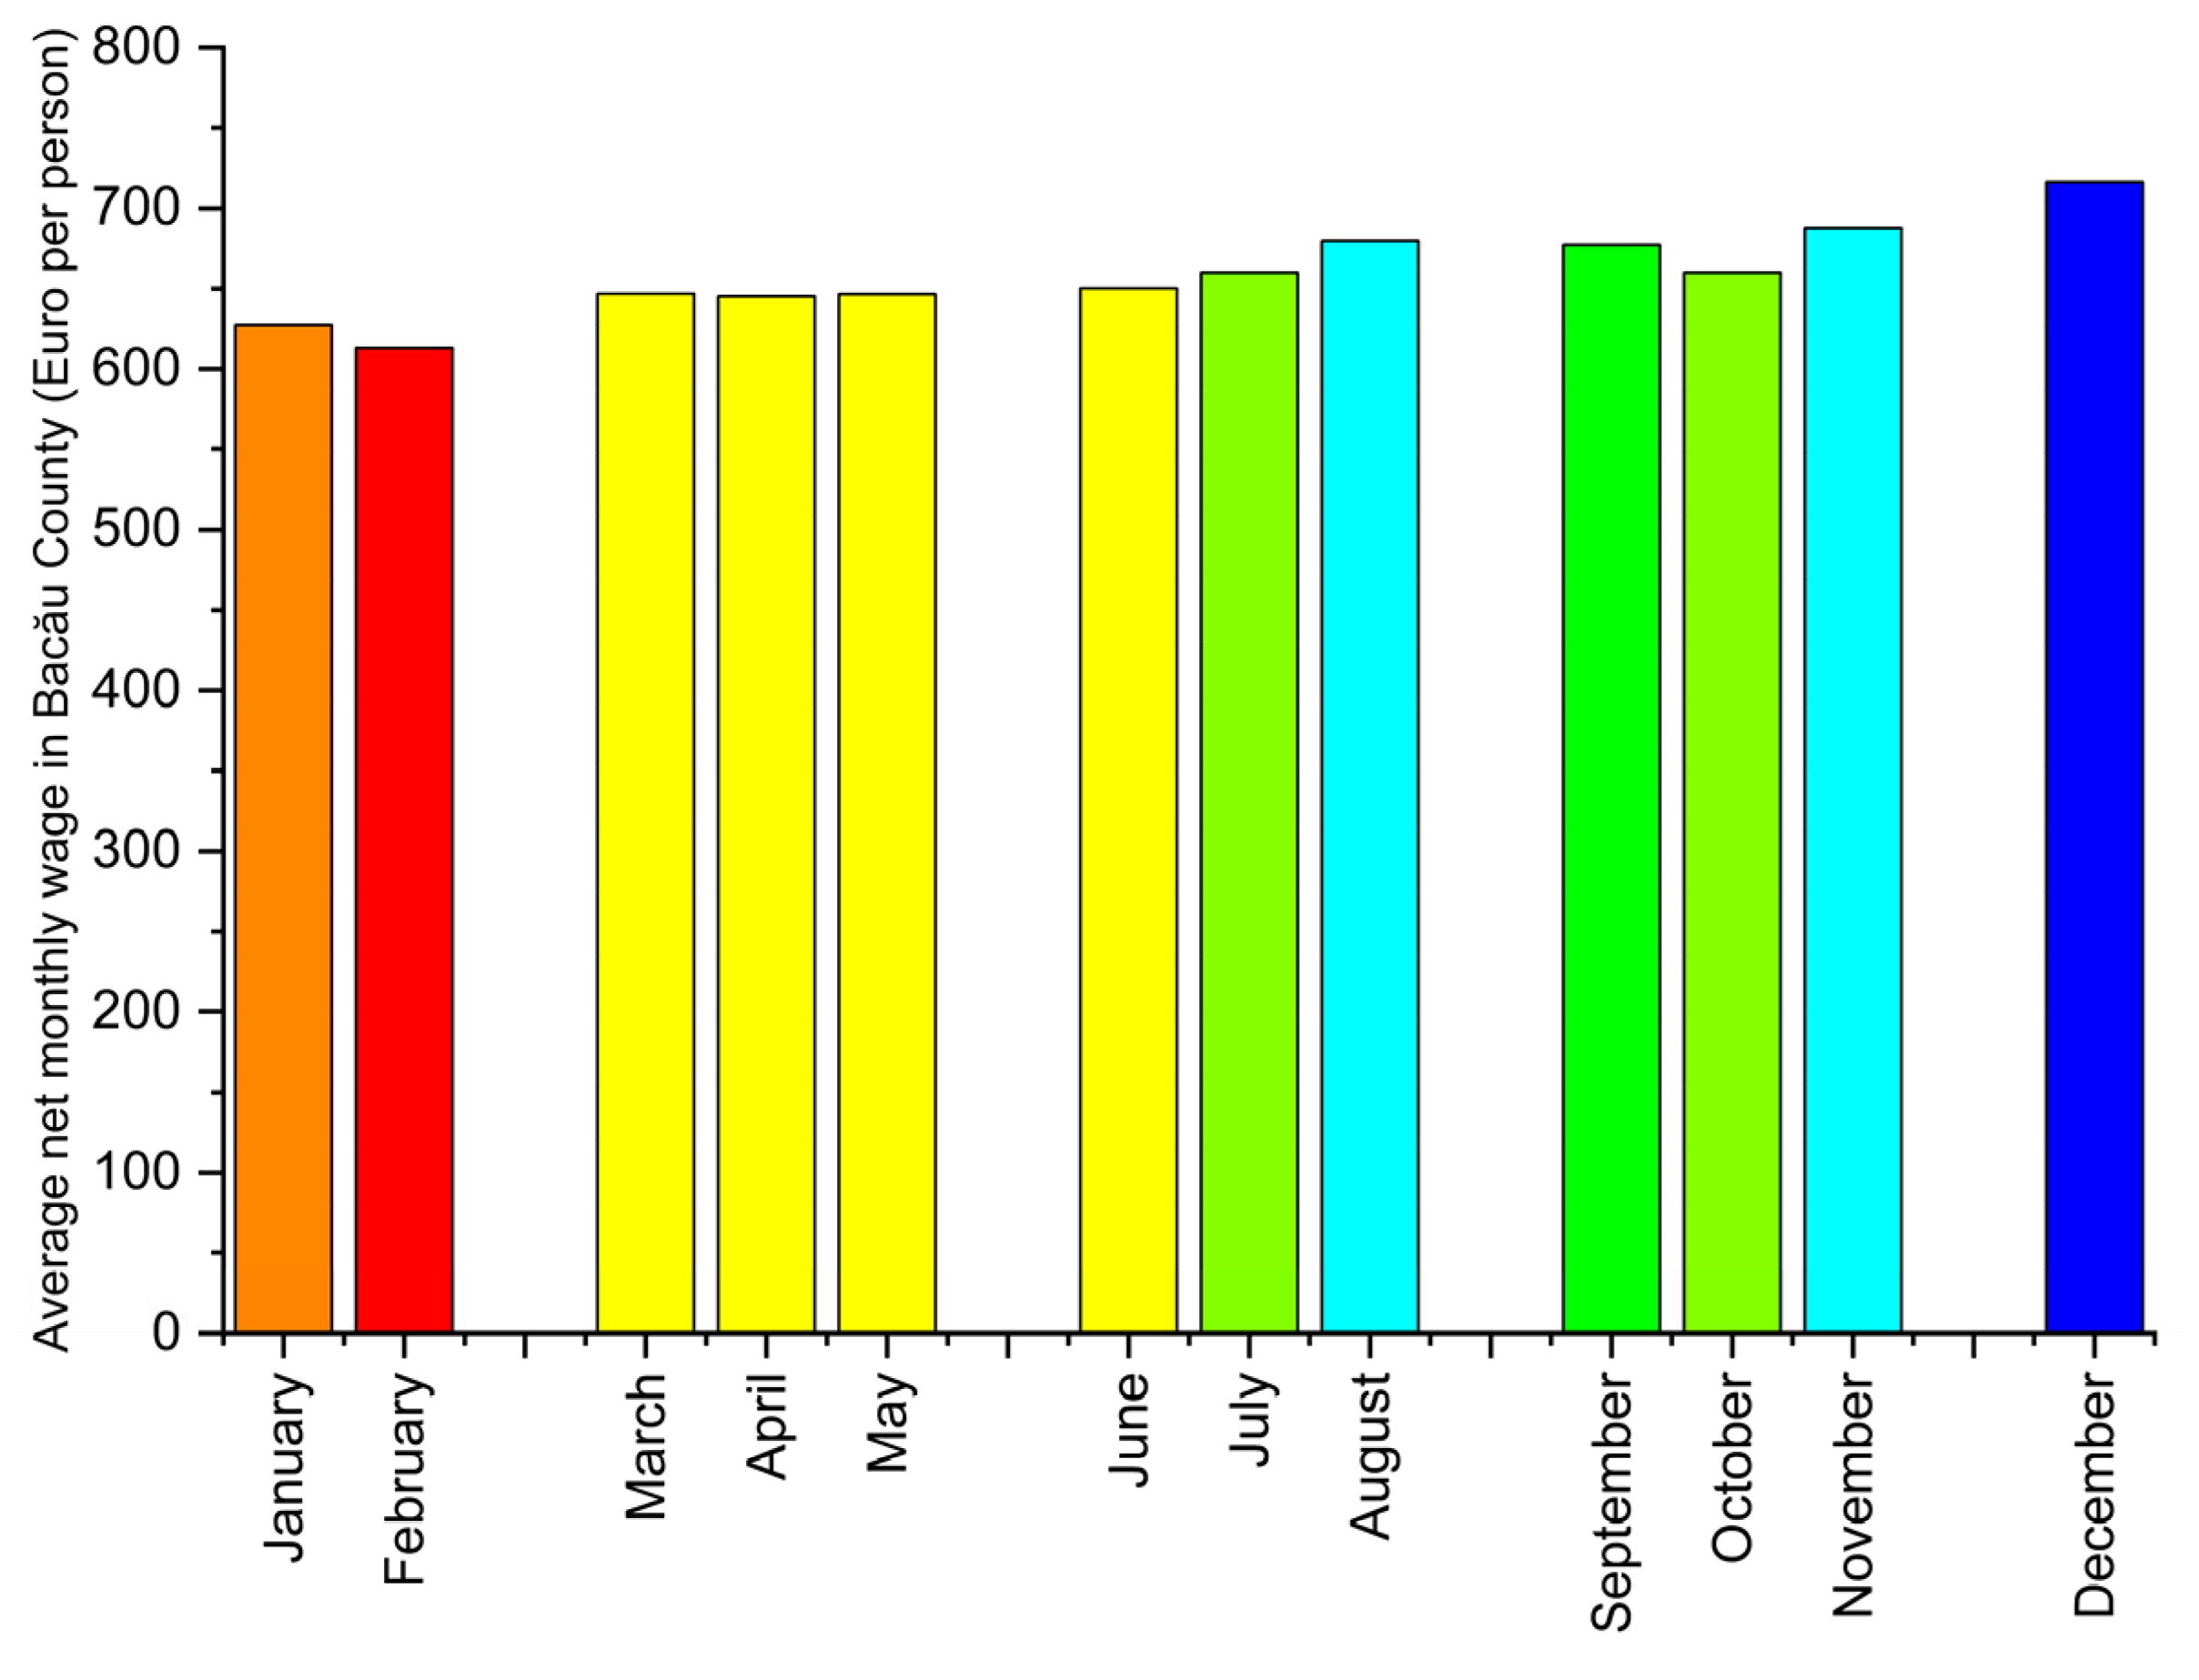
Figure 6 shows the trend in the average net monthly wage in Bacău County, expressed in euros per person, over the course of a calendar year. The bar chart highlights monthly variations in the population’s income level, providing a relevant socioeconomic indicator for interpreting municipal waste generation patterns.
Figure 6 indicates a general increase in average monthly net wages throughout 2021, with the highest values recorded at the end of the year. As a socioeconomic indicator, this variable was included in the analysis to explore its association with municipal waste generation patterns.
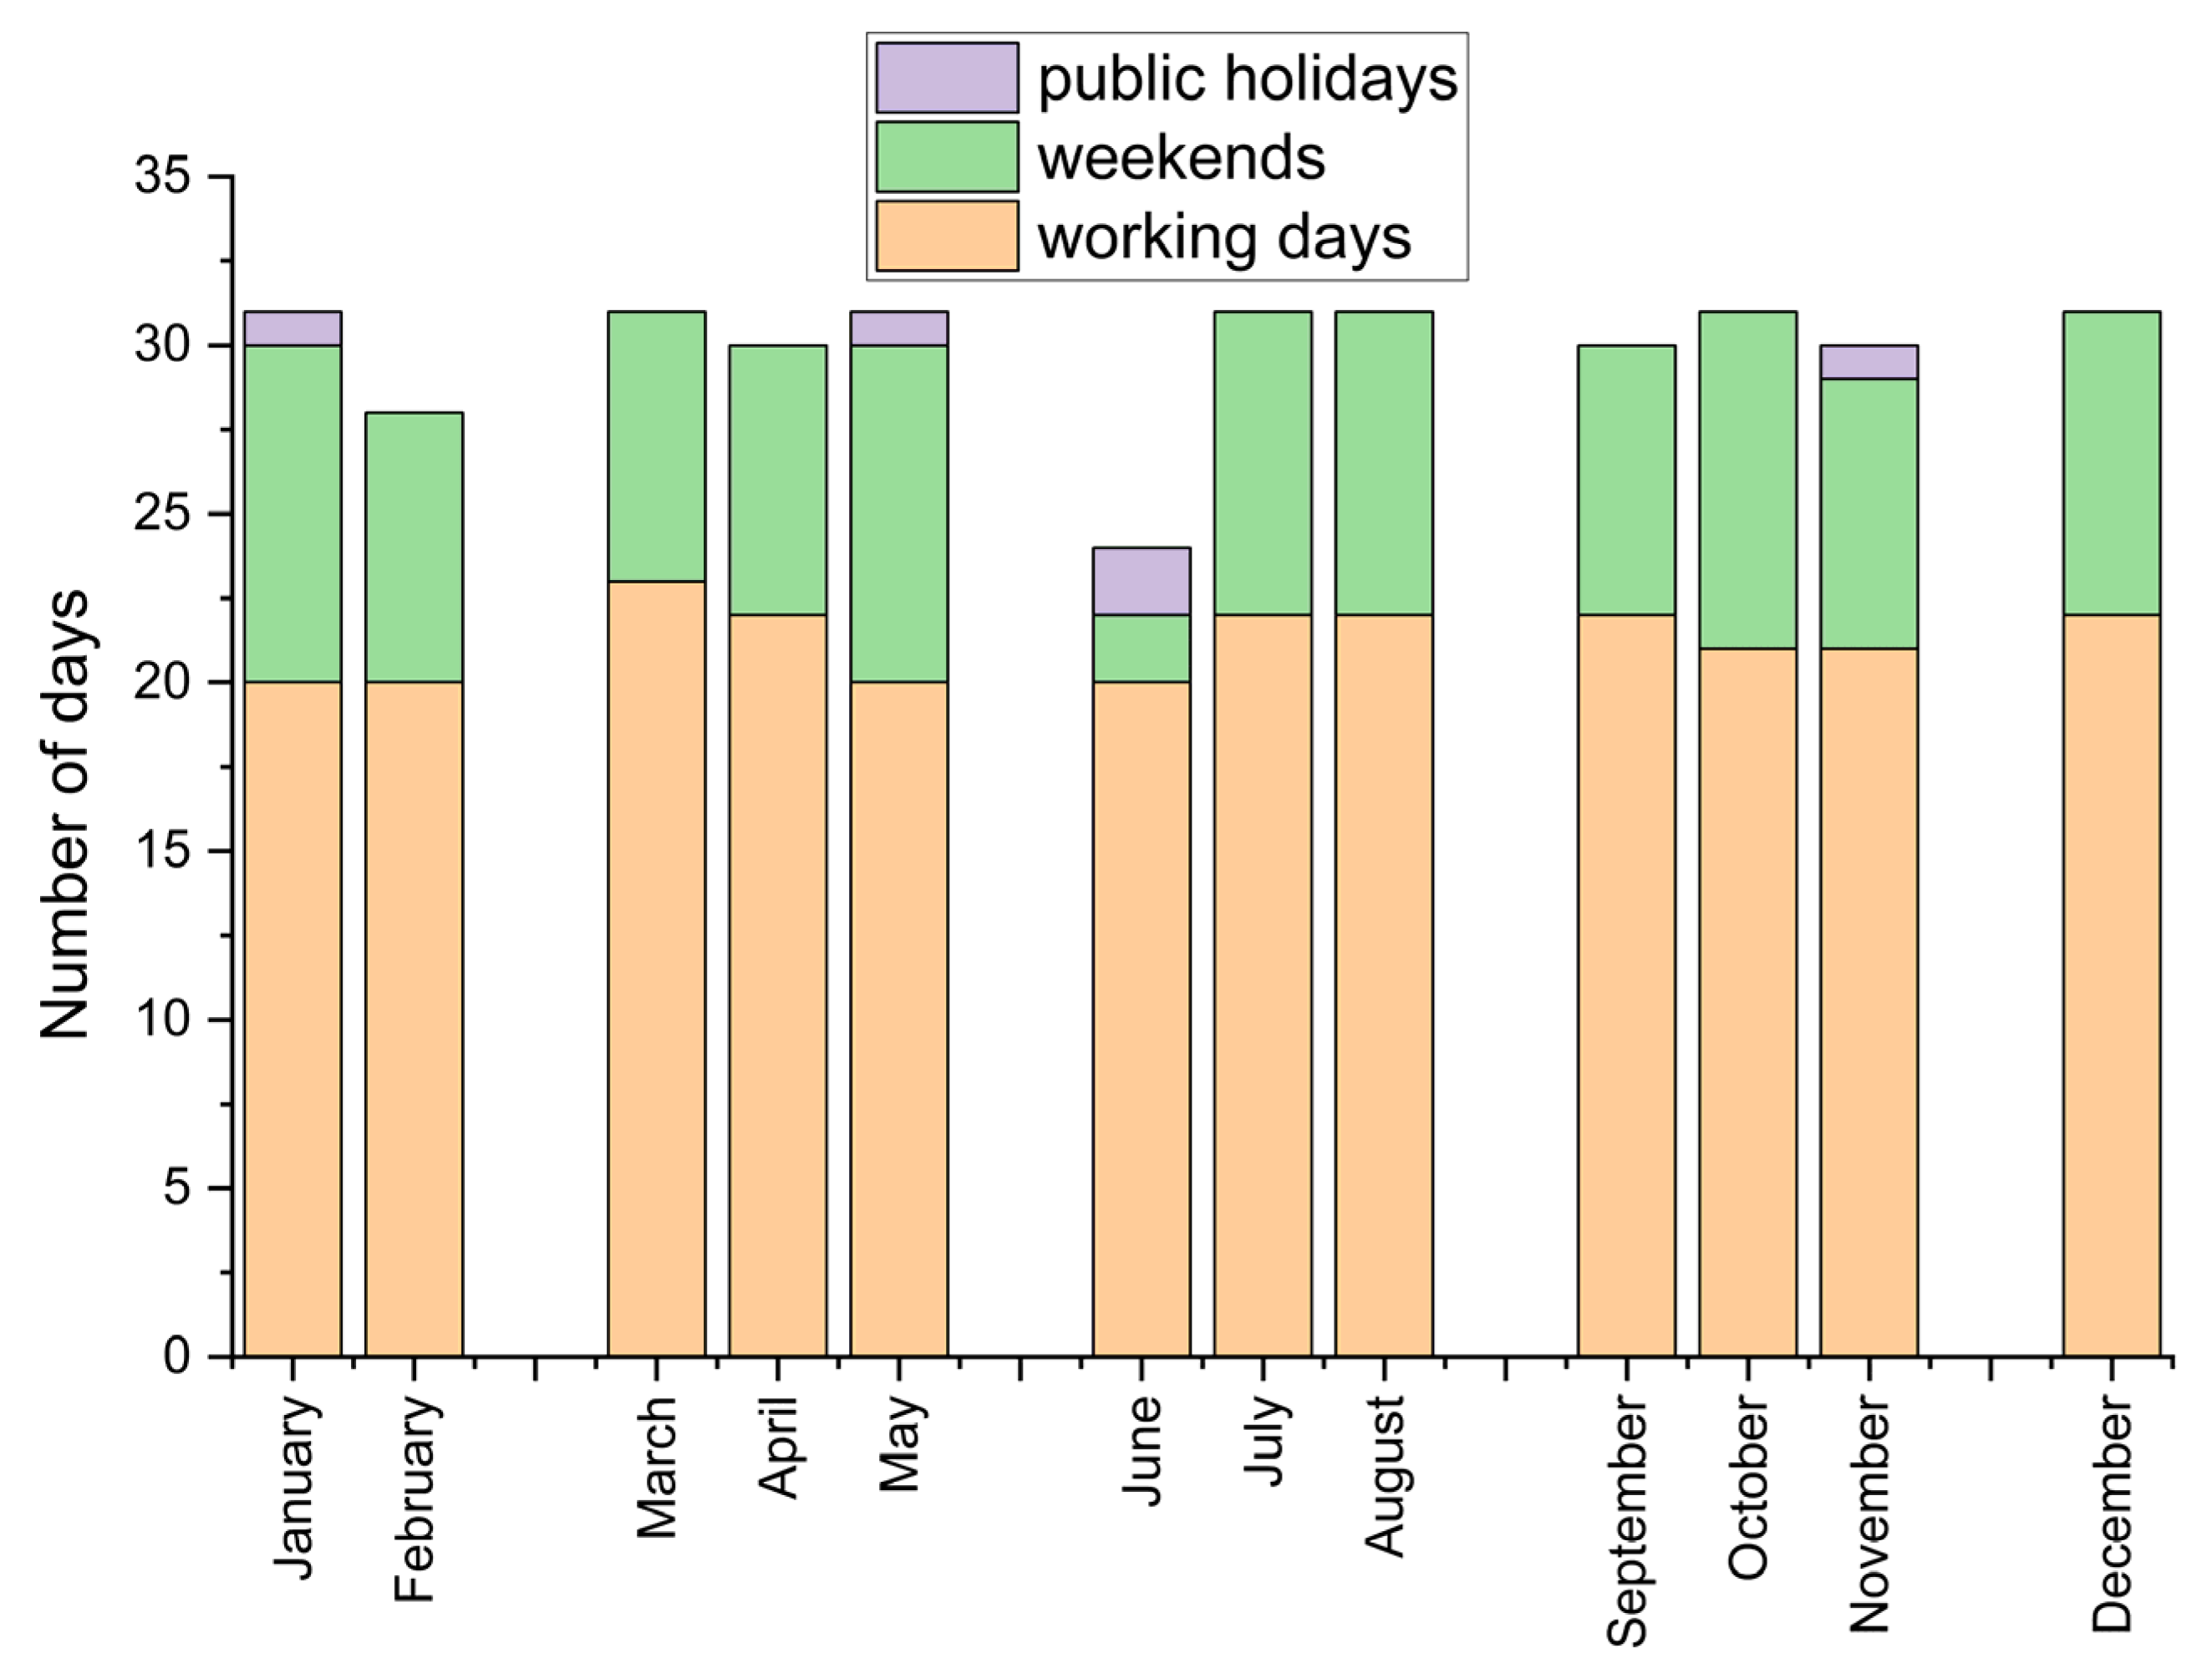
Figure 7 illustrates the monthly distribution of working days, weekends, and public holidays throughout 2021. The observed variations in the calendar structure of individual months provide a relevant temporal context for analyzing seasonal patterns in municipal waste generation and evaluating the effects of socio-economic activity on waste management indicators.
From the perspective of municipal waste analysis, the structure presented in
Figure 7 is relevant because the type of day directly influences both the quantity and the composition of the waste generated. Weekdays are generally associated with sustained economic activity, increased mobility, and a higher volume of waste generated by the commercial and institutional sectors. In contrast, weekends and public holidays are characterized by an increase in domestic and recreational activities, which can lead to changes in the composition of the waste fractions collected.
Therefore,
Figure 7 provides essential calendar-based support for the detailed analyses presented in this subsection, justifying the inclusion of temporal variables in the interpretation of municipal waste seasonality. Correlating the number of working days, weekends, and holidays with the monthly trend in waste volumes allows for an integrated approach, in which the observed variations are not attributed exclusively to economic or demographic factors, but are also analyzed in relation to the actual structure of the calendar.
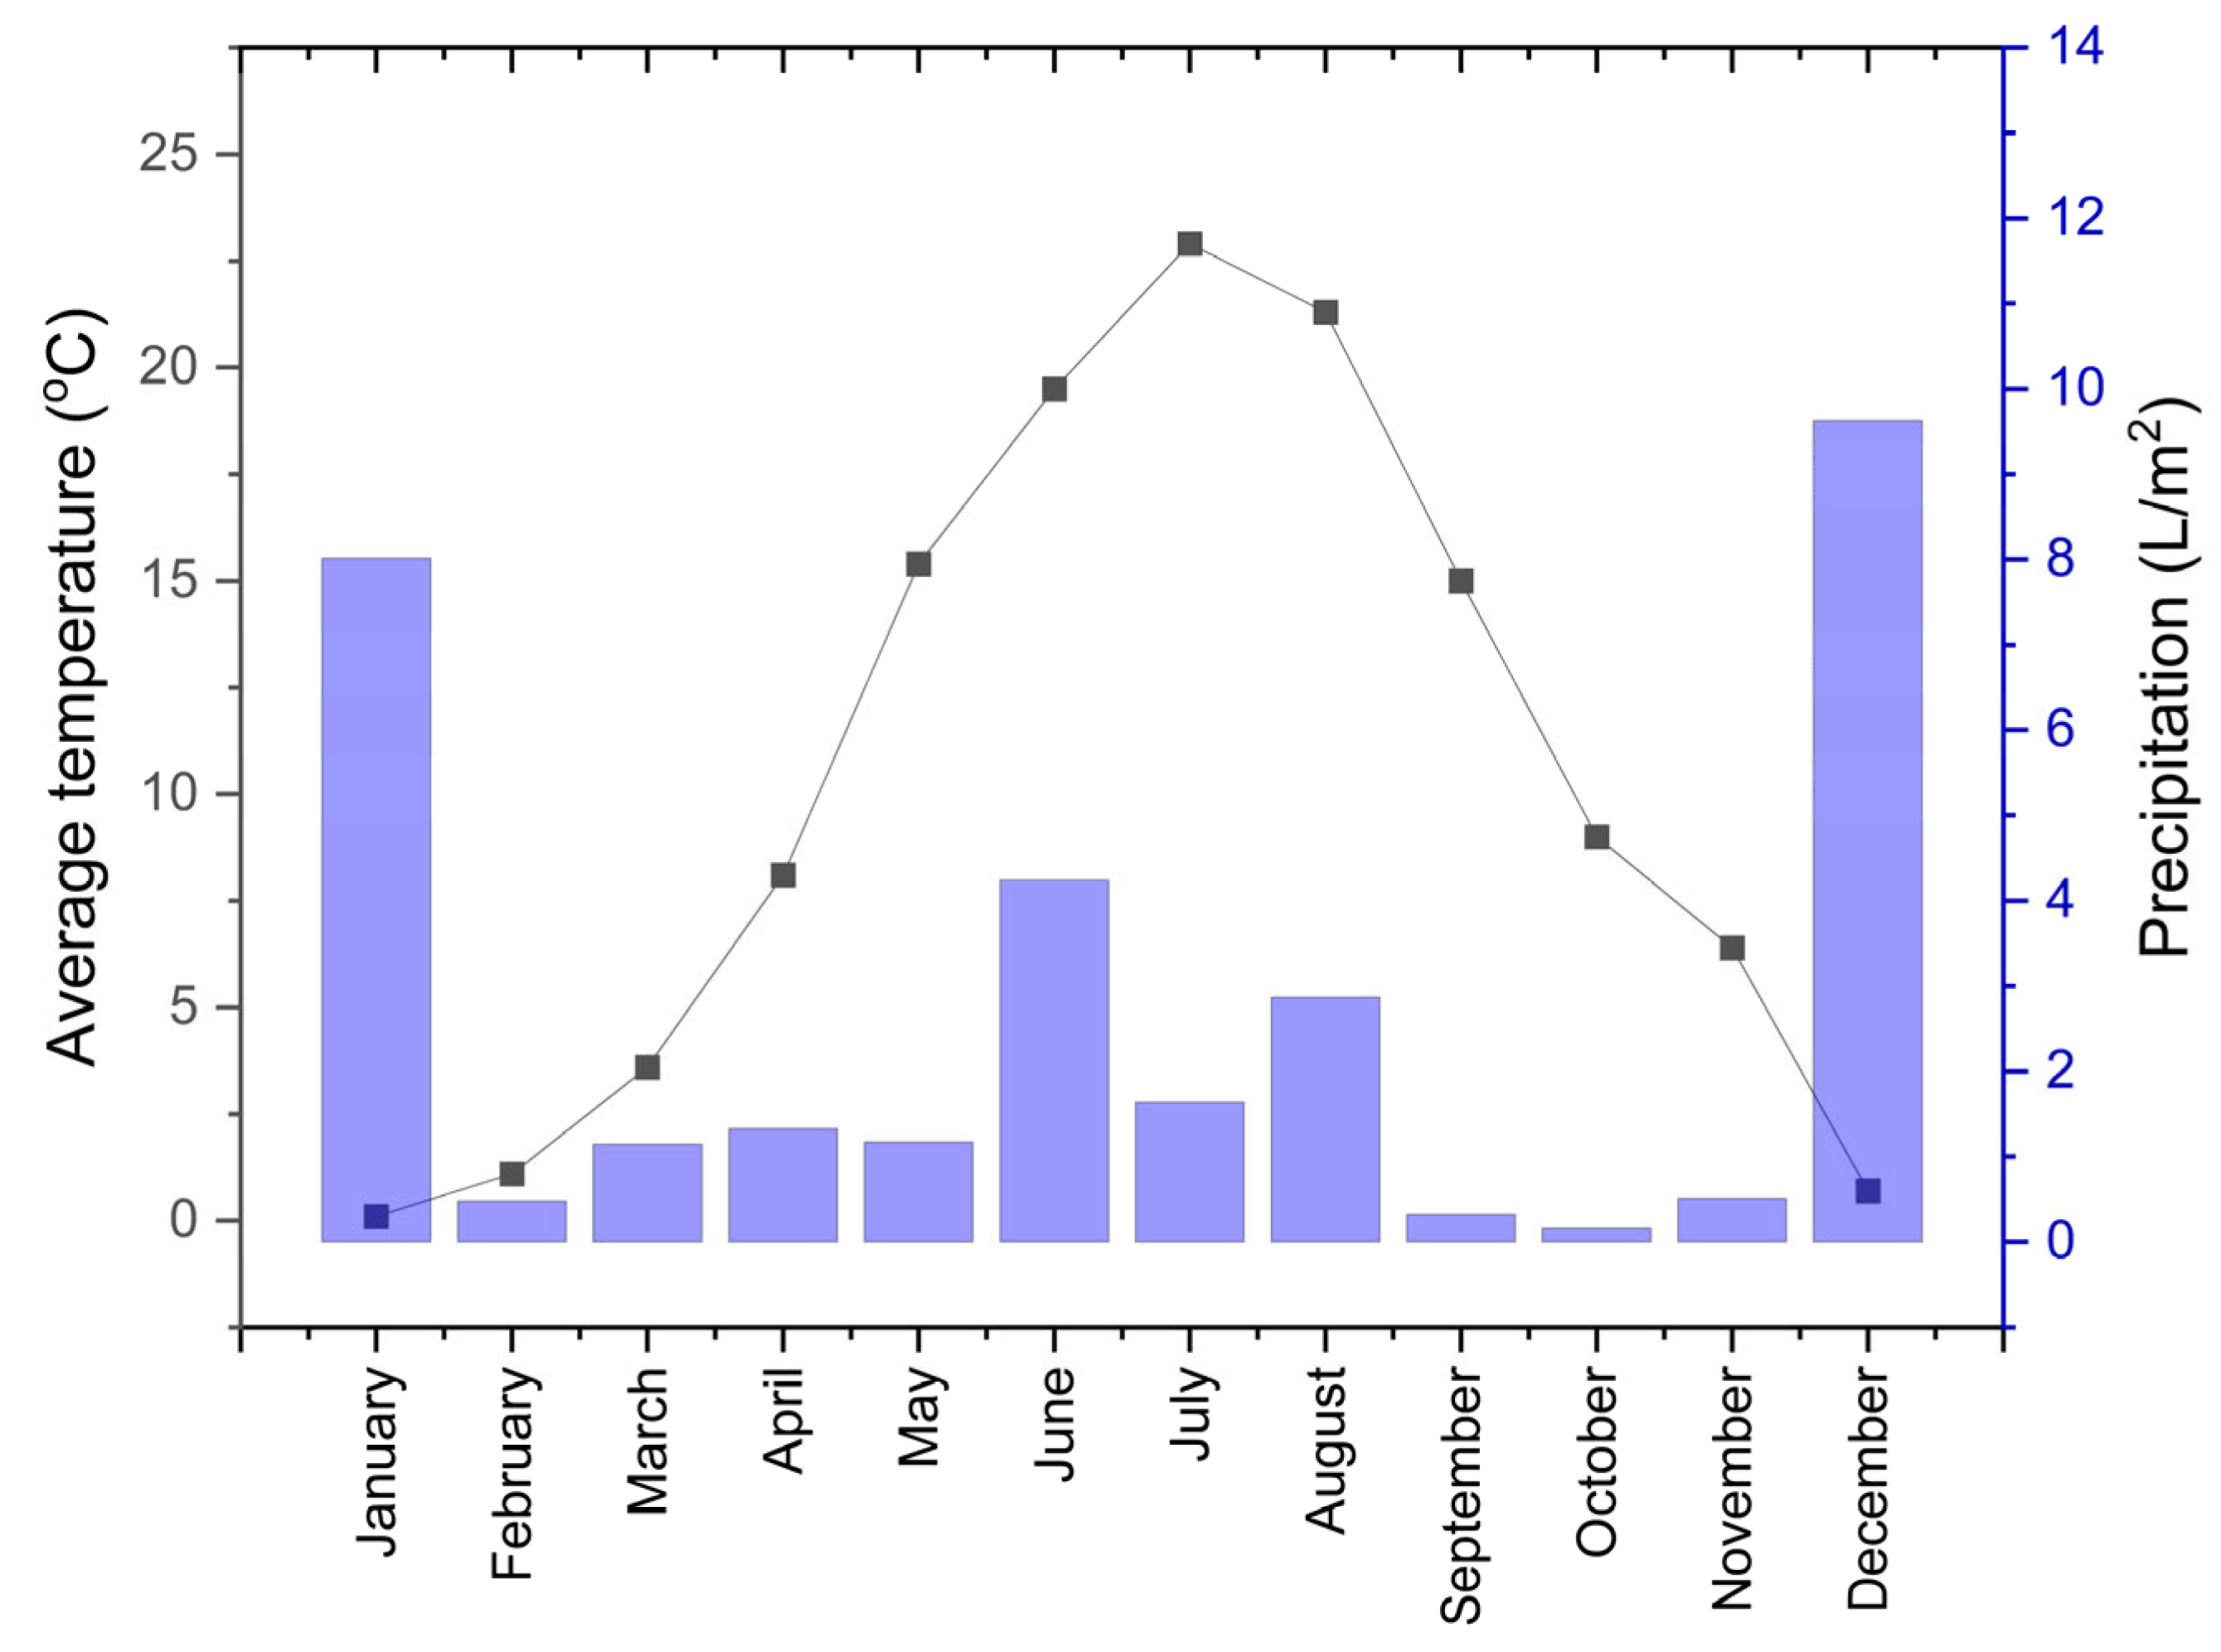
Figure 8 shows the monthly trends in average air temperature and precipitation recorded in Bacău County throughout 2021. The combined representation, which uses a curve for temperature and bars for precipitation, allows for the simultaneous highlighting of the two main climate parameters, providing a relevant climatological framework for analyzing the seasonality of human activities and, implicitly, the generation of municipal waste.
Figure 8 provides the climatic context of the study period by presenting monthly temperature and precipitation patterns. The data indicate a transition from cold-season to warm-season conditions, while precipitation exhibits greater monthly variability. These climatic indicators were included as explanatory variables in the subsequent statistical analyses.
The descriptive and exploratory analyses presented in the previous chapters highlight the existence of recurring patterns and potential relationships between the dynamics of municipal waste volume and temporal, socioeconomic, calendar, and climatic factors. The pronounced seasonal variability in collected quantities, correlated with the calendar structure of the months and the evolution of the average net wage, suggests a significant dependence of waste generation on the intensity of socioeconomic activities and the consumption behavior of the population. At the same time, the analysis of climatic indicators points to a weaker but consistent association between weather conditions and the level of waste generated, particularly during the warm season.
Although these relationships are visible and supported by graphical representations and structural analyses, their statistical assessment requires methods capable of identifying patterns of association and similarities among variables. In this context, the following chapter is dedicated to the formal statistical analysis of the relationships between municipal waste quantities and the explanatory factors considered in the study.
4. Statistical Analyses
The previous descriptive and graphical analyses have highlighted clear seasonal variations in the volume of municipal waste, as well as visual correlations with calendar, socioeconomic, and climatic factors. However, interpretations based solely on visual observations may be limited, and it is necessary to validate them using rigorous statistical methods capable of quantifying the relationships between variables and reducing the uncertainty associated with subjective interpretation.
The literature indicates that municipal waste generation is associated with temporal, economic, and climatic variables, although the nature and strength of these relationships may vary among regions and datasets. Thus, simple descriptive models are insufficient to capture the complex relationships among these variables, and the use of statistical and multivariate analyses is recommended to identify latent patterns and significant correlations [
88,
91,
92].
Several studies have shown that incorporating socioeconomic indicators, such as household income, into advanced statistical analyses contributes to a more realistic understanding of waste generation behavior, particularly in urban and regional contexts [
34,
49,
73,
74,
76]. Similarly, climatic variables, such as temperature and precipitation, are recognized as factors with an indirect impact on consumption, seasonal activities, and waste collection processes, justifying their integration into a formal analytical framework [
93,
94].
In this context, the statistical analysis presented in this chapter is justified by the need to:
Quantify the relationships between waste quantities and the explanatory factors analyzed;
Assess the degree of dependence and seasonal variation in waste streams;
Identify common patterns and significant differences between periods of the year;
Support the study’s conclusions with objective and reproducible results, comparable with those reported in the specialized literature.
By applying these statistical analyses, the study goes beyond a descriptive level and offers an integrated approach to the relationship between seasonality, selected socioeconomic indicator, and climatic factors in the generation of municipal waste. Thus, the results obtained contribute to strengthening the scientific basis of the study and increasing its relevance for the evaluation and optimization of waste management systems at the local and regional levels.
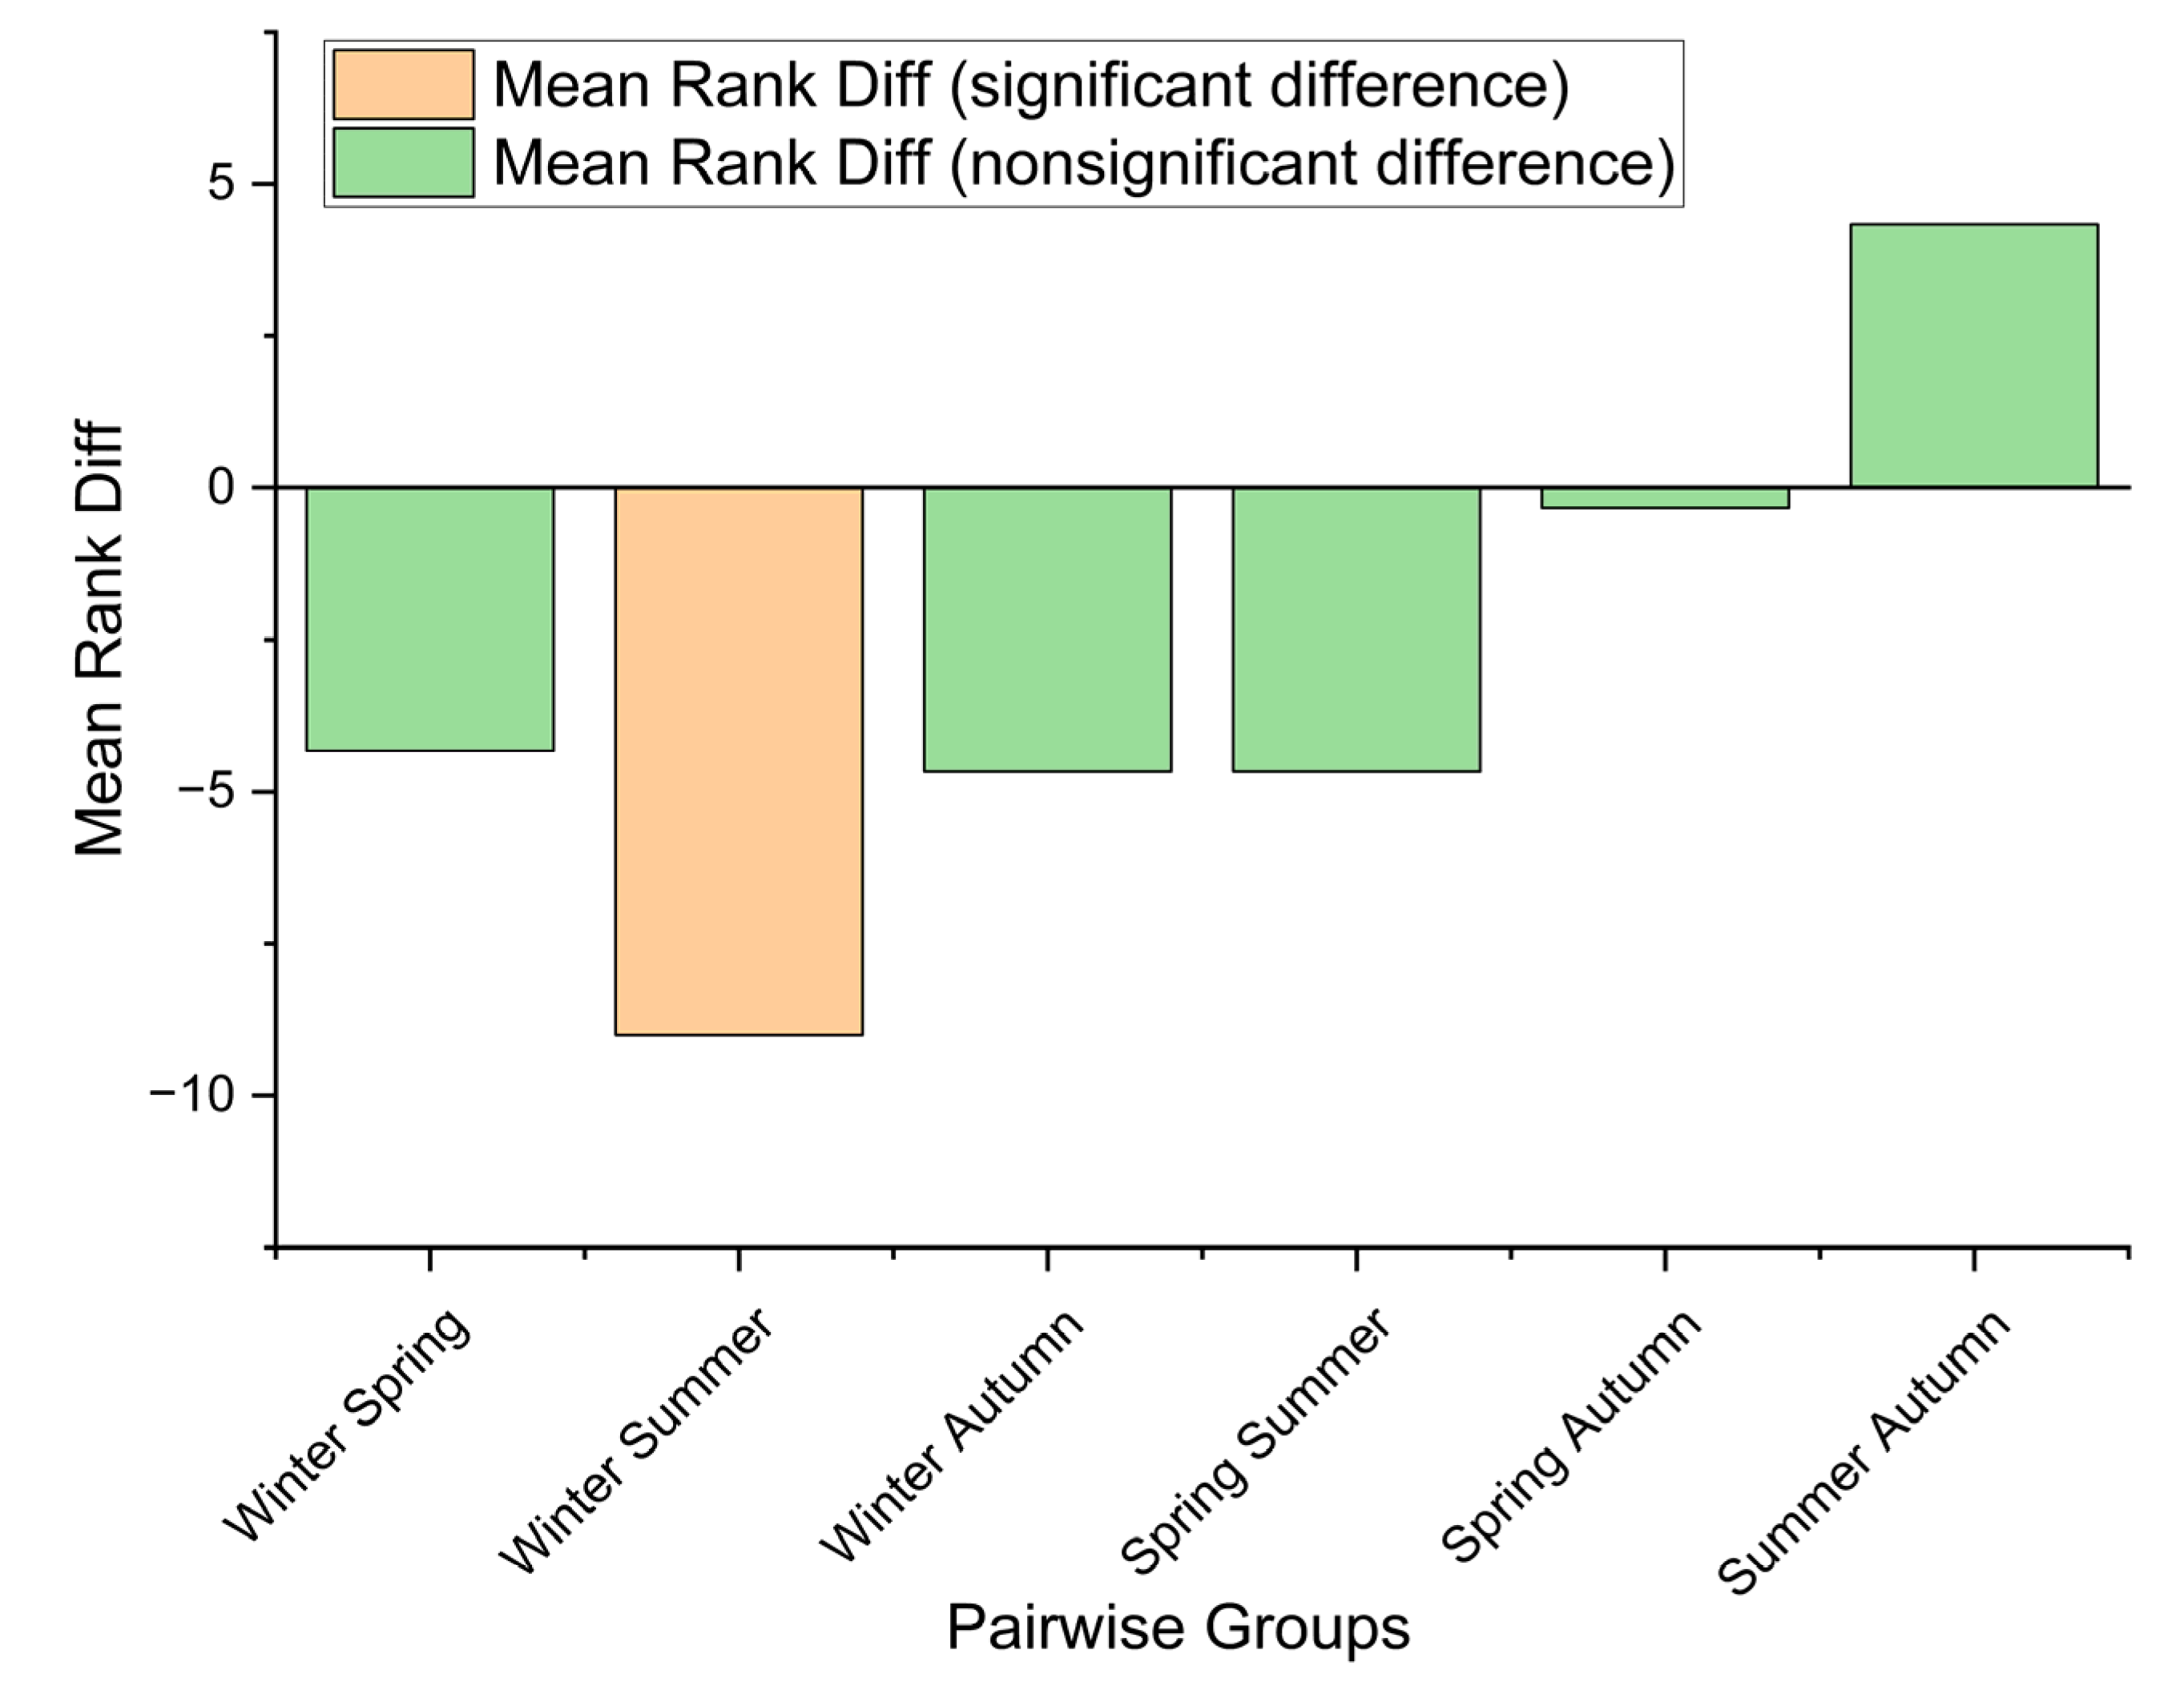
Figure 9 illustrates the results of the pairwise seasonal comparisons obtained from Dunn’s post hoc test following the Kruskal–Wallis analysis. The detailed statistical results are presented in
Table 2. Among all pairwise seasonal comparisons, only the winter–summer comparison showed a statistically significant difference (
p = 0.013), whereas all other comparisons were not statistically significant (
p > 0.05).
The horizontal axis shows pairwise comparisons between seasons obtained from Dunn’s post hoc test following the Kruskal–Wallis analysis (winter–spring, winter–summer, winter–autumn, spring–summer, spring–autumn, and summer–autumn), while the vertical axis indicates the magnitude of the difference between the mean ranks. The differently colored bars allow for visual distinction of the results: statistically significant differences are clearly marked as distinct from insignificant ones, based on the adopted significance threshold (p < 0.05).
An analysis of the data presented in
Figure 9 shows that the difference between the winter and summer seasons is the most pronounced and is statistically significant, indicating a clear seasonal variation in waste volumes between these two periods, which contrast in terms of climate and socioeconomic conditions. Negative mean-rank differences indicate that the first season in the comparison tends to have lower ranks than the second season.
In contrast, comparisons between winter–spring, winter–autumn, spring–summer, spring–autumn, and summer–autumn show small differences in mean ranks, which are classified as statistically insignificant. This result indicates a relative continuity in waste generation patterns across these seasons, with no major structural changes in the distribution of values.
From a statistical perspective,
Figure 9 confirms that seasonality influences municipal waste generation in a differentiated manner, with a clear contrast between the cold and warm seasons. At the same time, the results support the hypothesis that the variations observed in the descriptive analyses are not uniform across all seasonal transitions, but are concentrated primarily between seasons with distinct climatic and behavioral characteristics.
The detailed results reported in
Table 2 confirm that only the winter–summer comparison is statistically significant (
p = 0.013), whereas all other pairwise seasonal comparisons are not statistically significant (
p > 0.05). These findings support the conclusion that the strongest seasonal contrast in municipal waste generation occurs between the cold and warm seasons, while transitions between adjacent seasons are comparatively gradual.
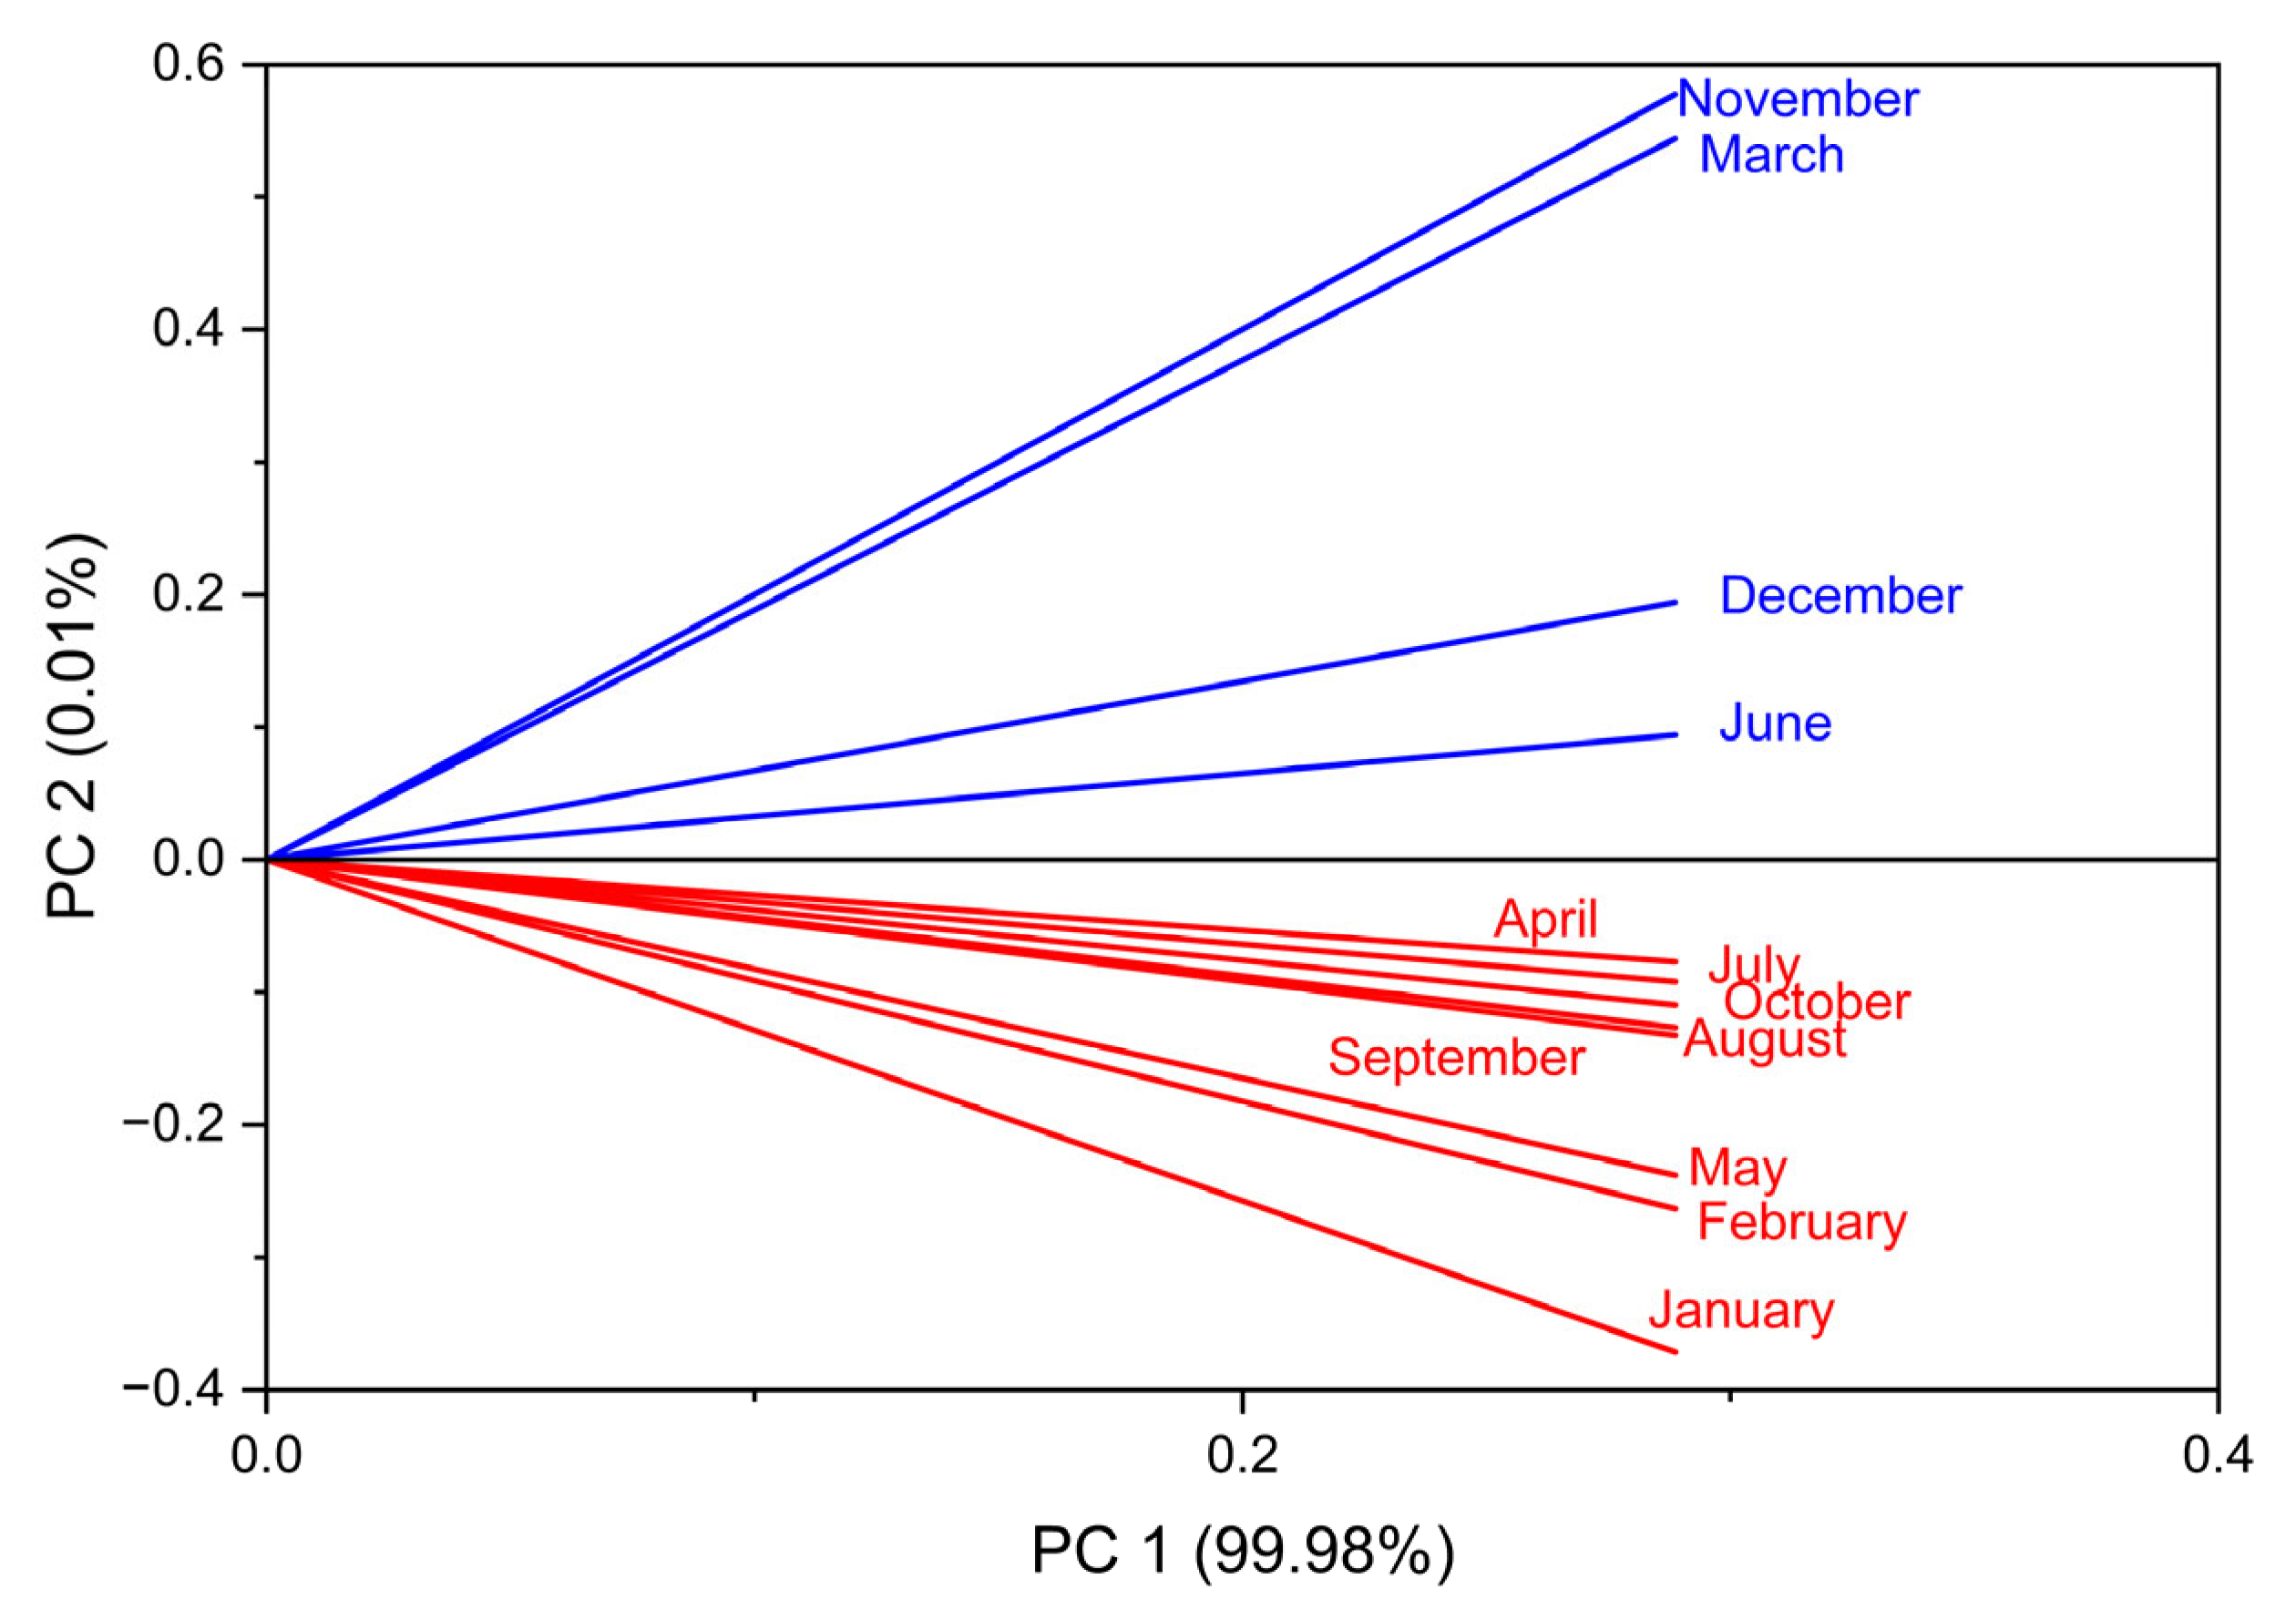
Figure 10 presents the results of the Principal Component Analysis (PCA) applied to the monthly data used in this study, with the aim of reducing dimensionality and identifying the main patterns of seasonal variation. The two-dimensional representation is defined by the first principal component (PC1) and the second principal component (PC2), which together describe the structure of the analyzed data.
The first principal component, PC1, accounts for a very high percentage of the total variation in the dataset (99.98%), indicating that the differences between months are primarily driven by a common dominant factor. This component can be interpreted as reflecting the overall magnitude of the analyzed flows, associated with the general level of activity and waste generation on a monthly basis. The distribution of months along the PC1 axis suggests the existence of a clear gradient, from lower values at the beginning of the year to higher values in certain months of the warm and transitional seasons. The extremely high percentage of variance explained by PC1 suggests the existence of a dominant variation common to most of the analyzed variables. This result can be attributed both to the pronounced seasonal nature of the data series and to the small number of available observations. Under these conditions, the first principal component primarily reflects the overall variation of the system, while the secondary components capture only marginal differences between months.
The second principal component, PC2, accounts for a very small percentage of the total variation (0.01%), but it allows the identification of subtle differences between months related to seasonal patterns. The separation of months along the PC2 axis indicates secondary variations that may be associated with specific factors such as the calendar structure, climatic conditions, or local behavioral patterns.
Graphically, the months are coherently grouped according to their relative positions in the PC1–PC2 plane. The winter months (e.g., January and February) are distinctly positioned relative to the summer and transitional months, suggesting different seasonal behavior of the analyzed variables. The months of the warm season (June, July, August) are clustered in a relatively close area, indicating structural similarities in the data during this period. The transitional months (March, April, September, October, November) occupy intermediate positions, reflecting the gradual nature of seasonal changes.
The observed distribution confirms that seasonality plays a decisive role, not through the emergence of completely distinct patterns for each month, but through gradual variations in the same principal factor captured by PC1. The low contribution of PC2 indicates a high structural stability of the analyzed phenomenon, consistent with the results obtained through the Kruskal–Wallis test, which revealed significant differences only between contrasting seasons.
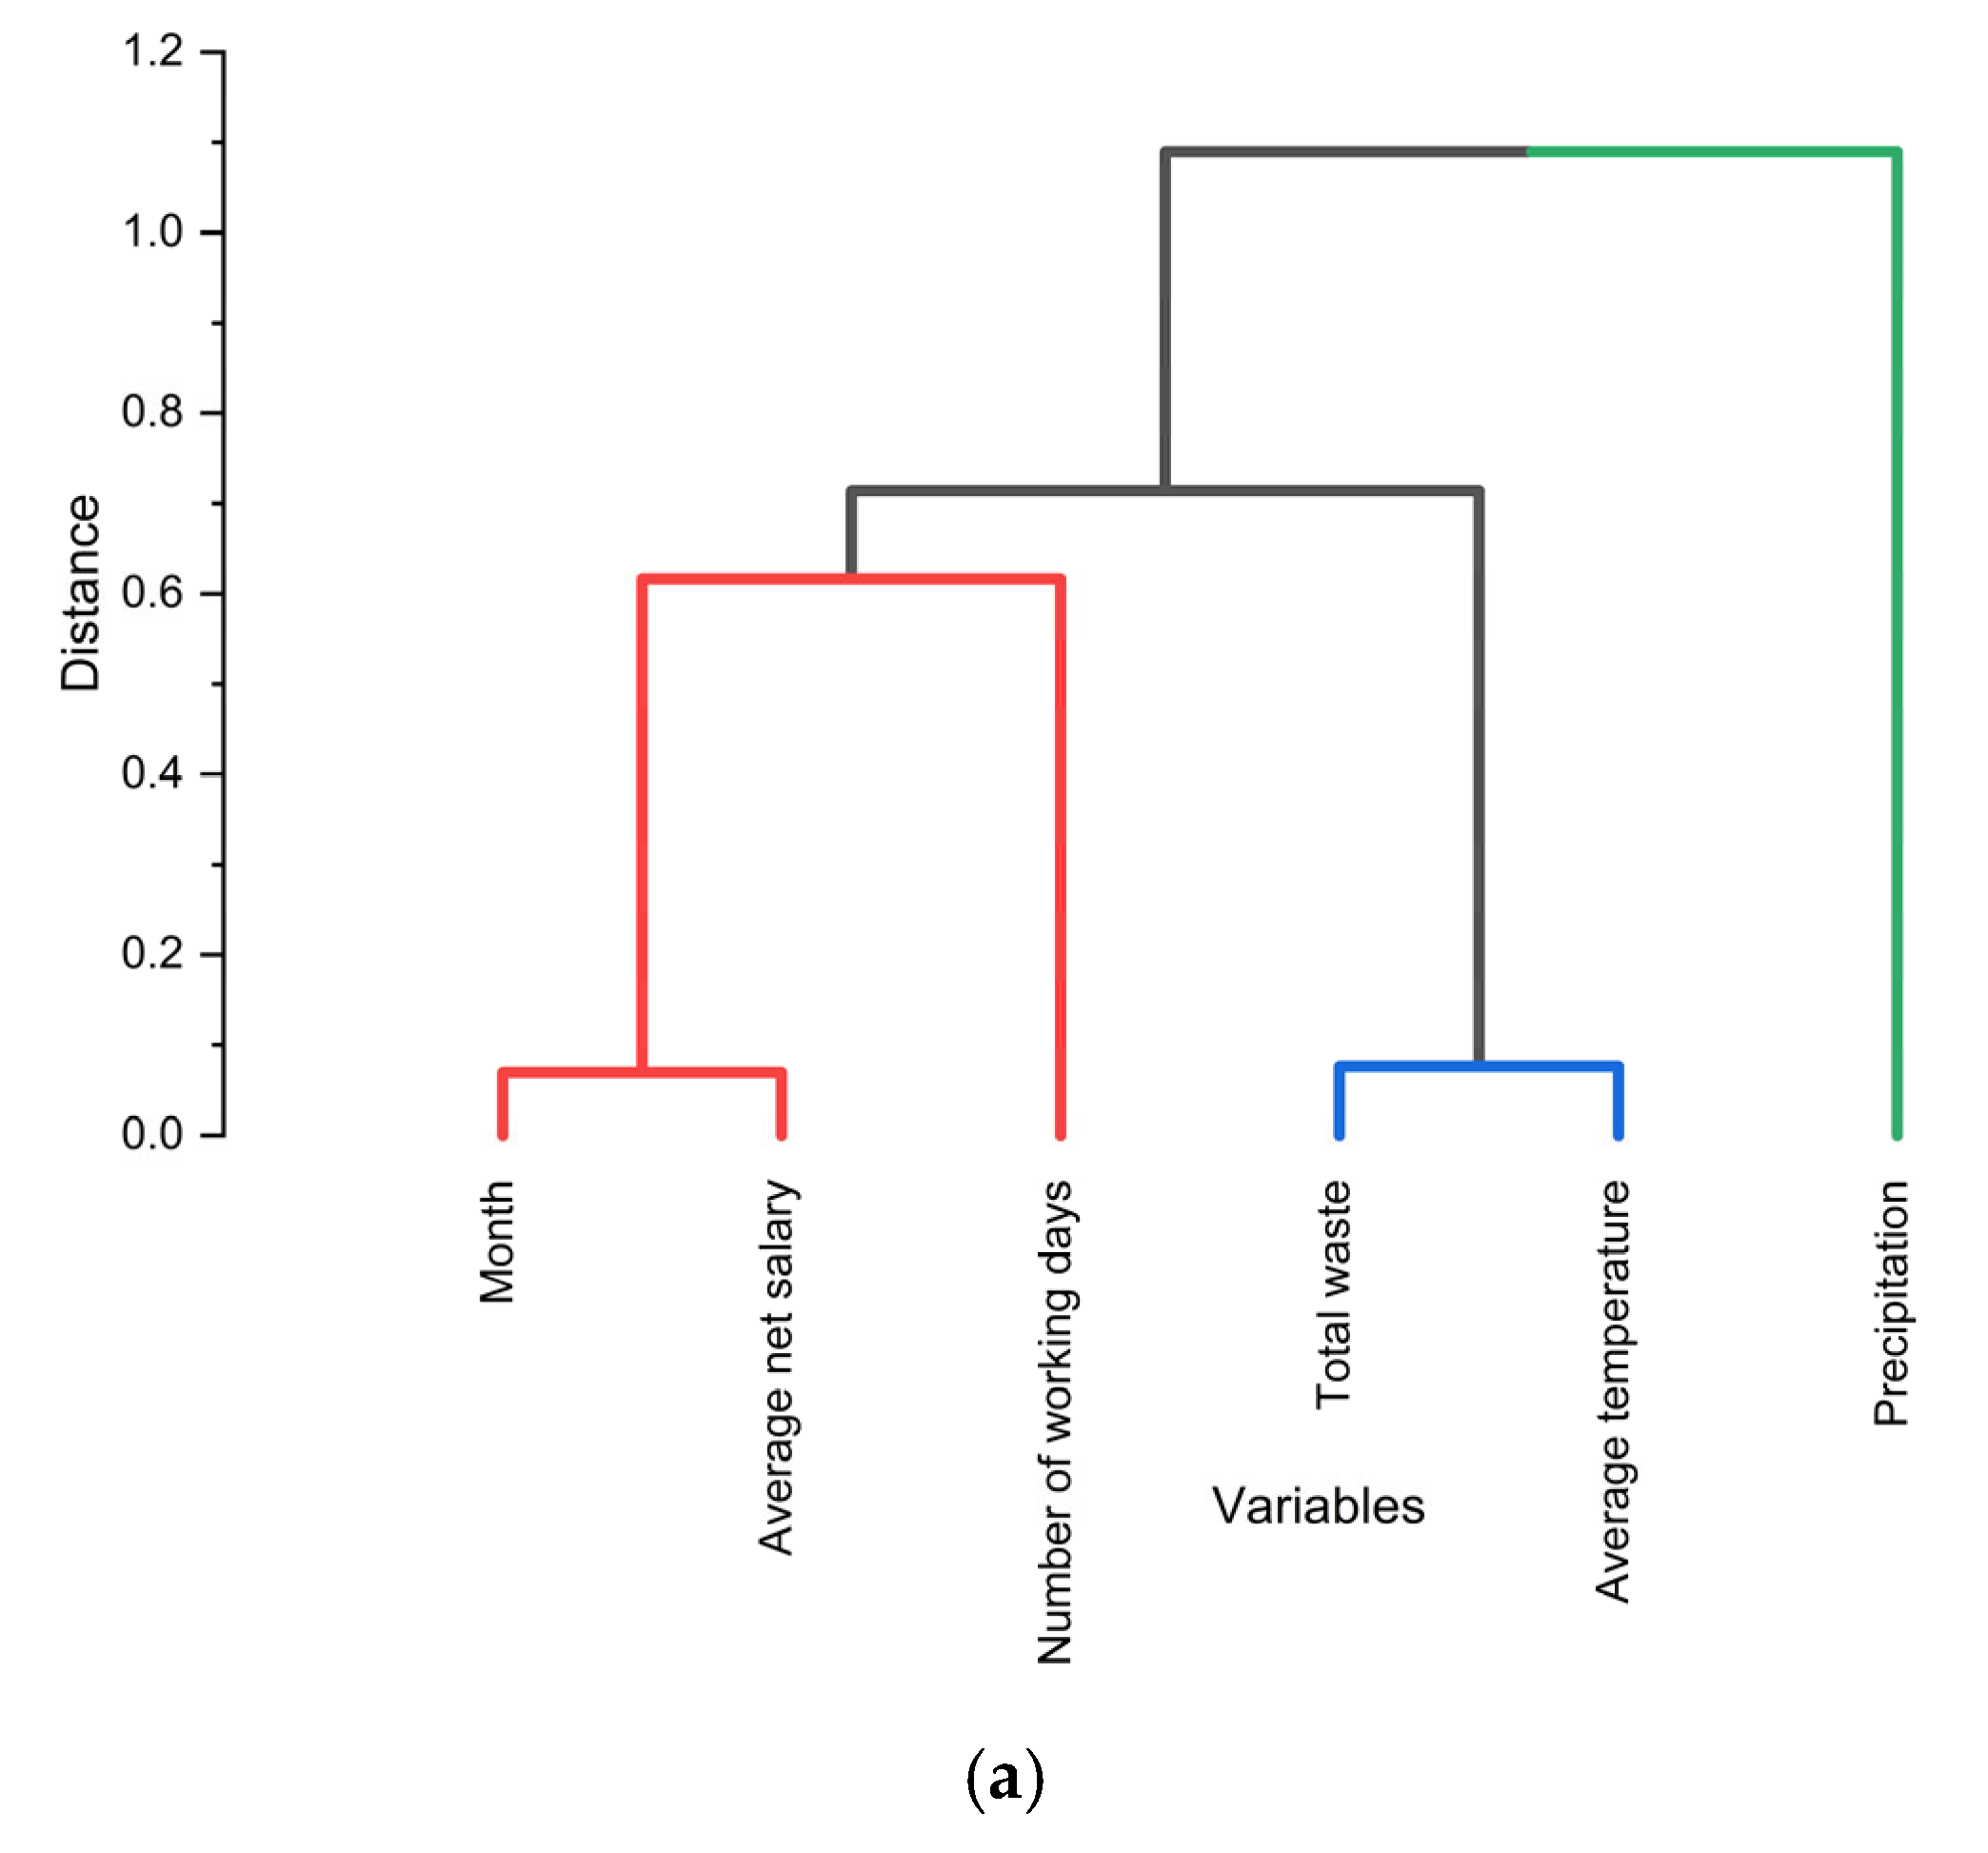
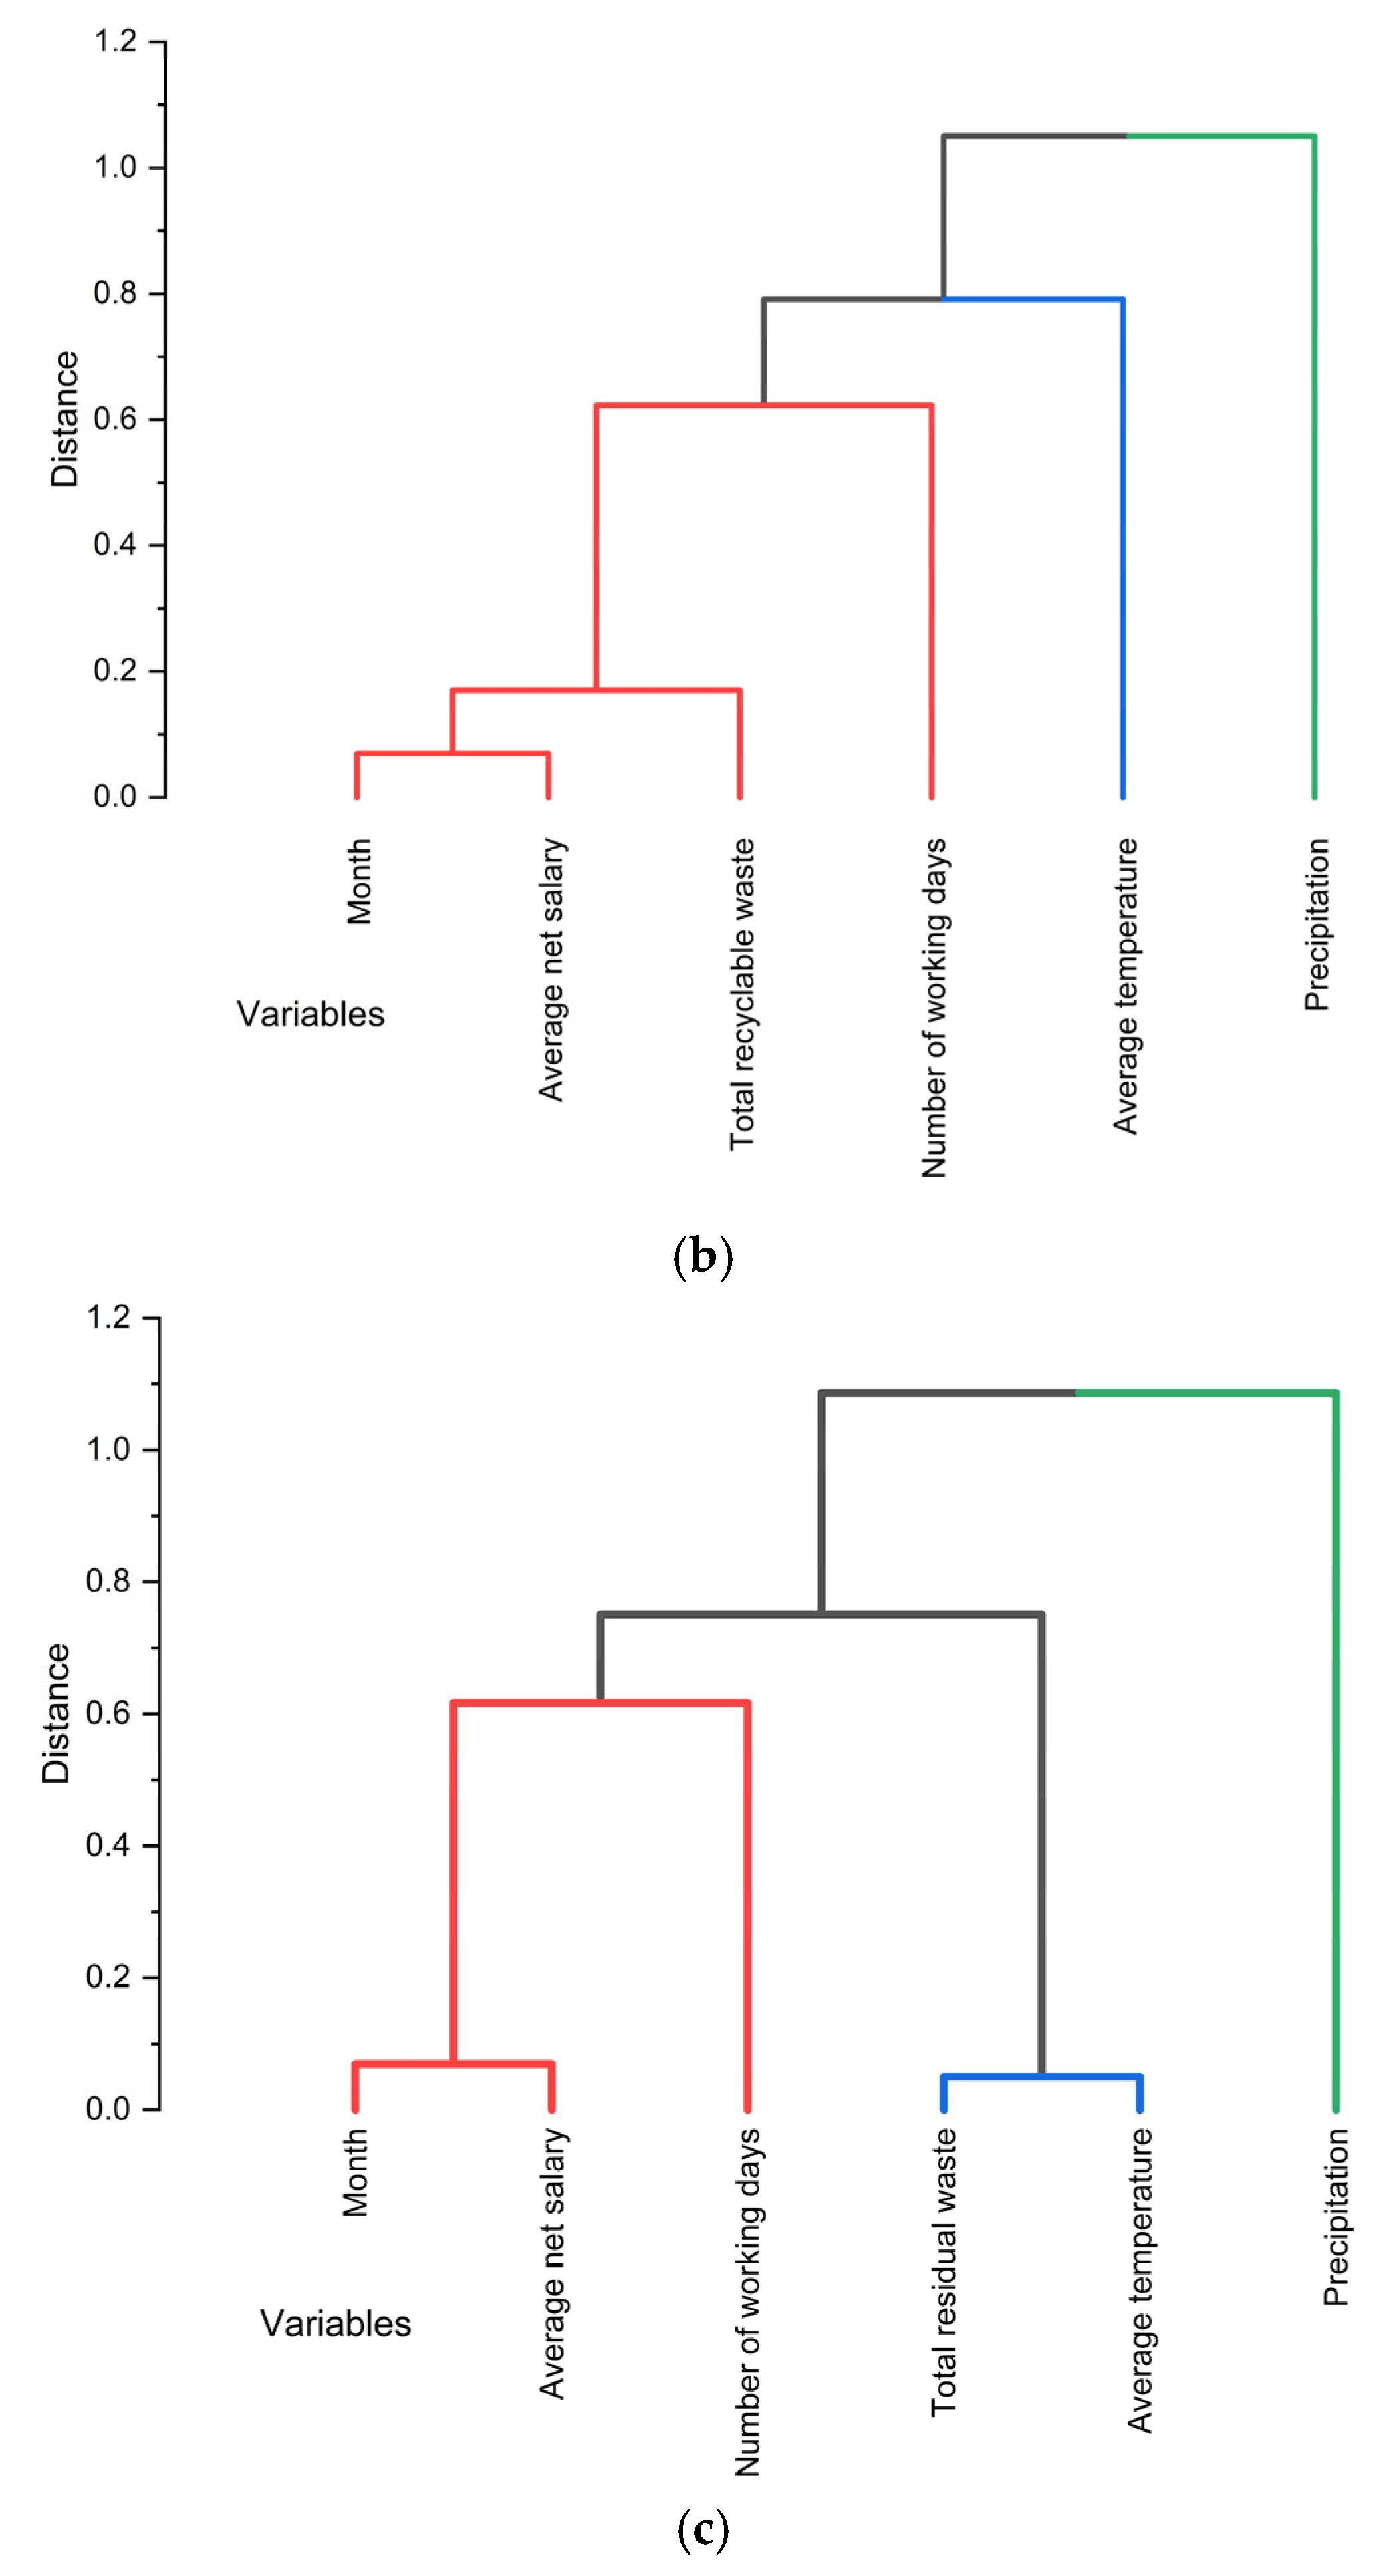
Figure 11 presents the results of the Hierarchical Cluster Analysis (HCA) applied to the variables used in this study, using correlation-based distance and the Group Average linking method, for a solution with k = 3 clusters. Given the small number of observations and the exploratory nature of the method, the HCA results should be interpreted solely as indications of statistical similarity among variables and not as evidence of stable structural relationships or causal mechanisms. The clusters identified reflect patterns of association observed in the analyzed dataset and require further validation through studies based on larger datasets. The analysis is performed separately for:
(a) The total amount of waste generated—In this case, the dendrogram highlights three distinct groups of variables. The first cluster, characterized by the smallest aggregation distance, consists of the month and the average net wage, indicating a possible statistical association between monthly temporal dynamics and the population’s income level. This clustering pattern suggests statistical similarity between municipal waste variability and the temporal and socioeconomic variables included in the analysis. The second cluster includes the variable “number of working days,” which connects to the first group at a moderate distance. This positioning indicates similarity between the calendar structure and the observed waste generation patterns, though of lesser intensity compared to the direct influence of the month and wages. The climatic variables (average temperature and precipitation) are incorporated into the clustering structure at later stages than the temporal and socioeconomic variables. This pattern suggests that the temporal and socioeconomic variables are more closely associated with total waste variations within the analyzed dataset, while climatic factors show a more differentiated pattern of association.
(b) Total quantity of recyclable waste—In this case, the cluster structure shows some significant differences from the previous case. Similar to the analysis of total waste quantity, month and average net income form a compact cluster, indicating that recyclable waste streams share a similar pattern of variation with the temporal and socioeconomic variables included in the analysis. In this case, the total recyclable waste variable integrates earlier into the same cluster as the socioeconomic variables, compared to the analysis of the overall waste quantity. This proximity indicates that recyclable waste quantities are statistically associated with the same pattern of variation represented by the economic and temporal variables included in the analysis. The climatic variables (average temperature and precipitation) remain in a separate cluster from the temporal and socioeconomic variables, indicating a different pattern of association within the analyzed dataset. The relative position of temperature, however, suggests that climatic influences should be interpreted cautiously and not necessarily as uniformly weaker across all variables.
(c) Total amount of residual waste—In this case, the dendrogram shows a slightly different structure, but one that is consistent with the previous results. The first cluster consists of the month and average net income, suggesting statistical similarity between residual waste quantities and the temporal and socioeconomic variables included in the analysis. This result is consistent with the fact that residual waste represents the dominant fraction of the municipal total. The variable number of working days subsequently connects to this core, indicating a secondary pattern of association with the calendar structure variable on the quantities of residual waste generated. A distinct cluster consists of average temperature and precipitation, located at greater distances from the temporal and socioeconomic variables. This clustering pattern suggests that climatic factors are associated with a different structure of variation within the analyzed dataset, although the position of temperature indicates that climatic influences cannot be considered uniformly weak.
A comparative analysis of the three dendrograms reveals a robust and consistent structural pattern, regardless of the type of waste stream analyzed.
In all three cases:
The month and the average net wage consistently form a primary cluster, suggesting that seasonality and the socioeconomic indicator considered in this study share similar patterns of variation with municipal waste quantities within the analyzed dataset.
The number of working days shows an intermediate level of association with the analyzed waste streams, connecting to the socioeconomic cluster at moderate distances, which reflects the calendar’s influence on the intensity of economic and household activities.
Climatic variables (temperature and precipitation) generally join the clustering structure at later stages than the temporal and socioeconomic variables. This pattern indicates different association structures among the analyzed variables, although the dendrograms also suggest that the relative proximity of temperature may vary depending on the waste category considered.
The differences between the three representations are subtle: recyclable waste shows closer statistical associations with the socioeconomic indicator included in the analysis, while residual waste follows a pattern of variation similar to that observed for total waste quantities.
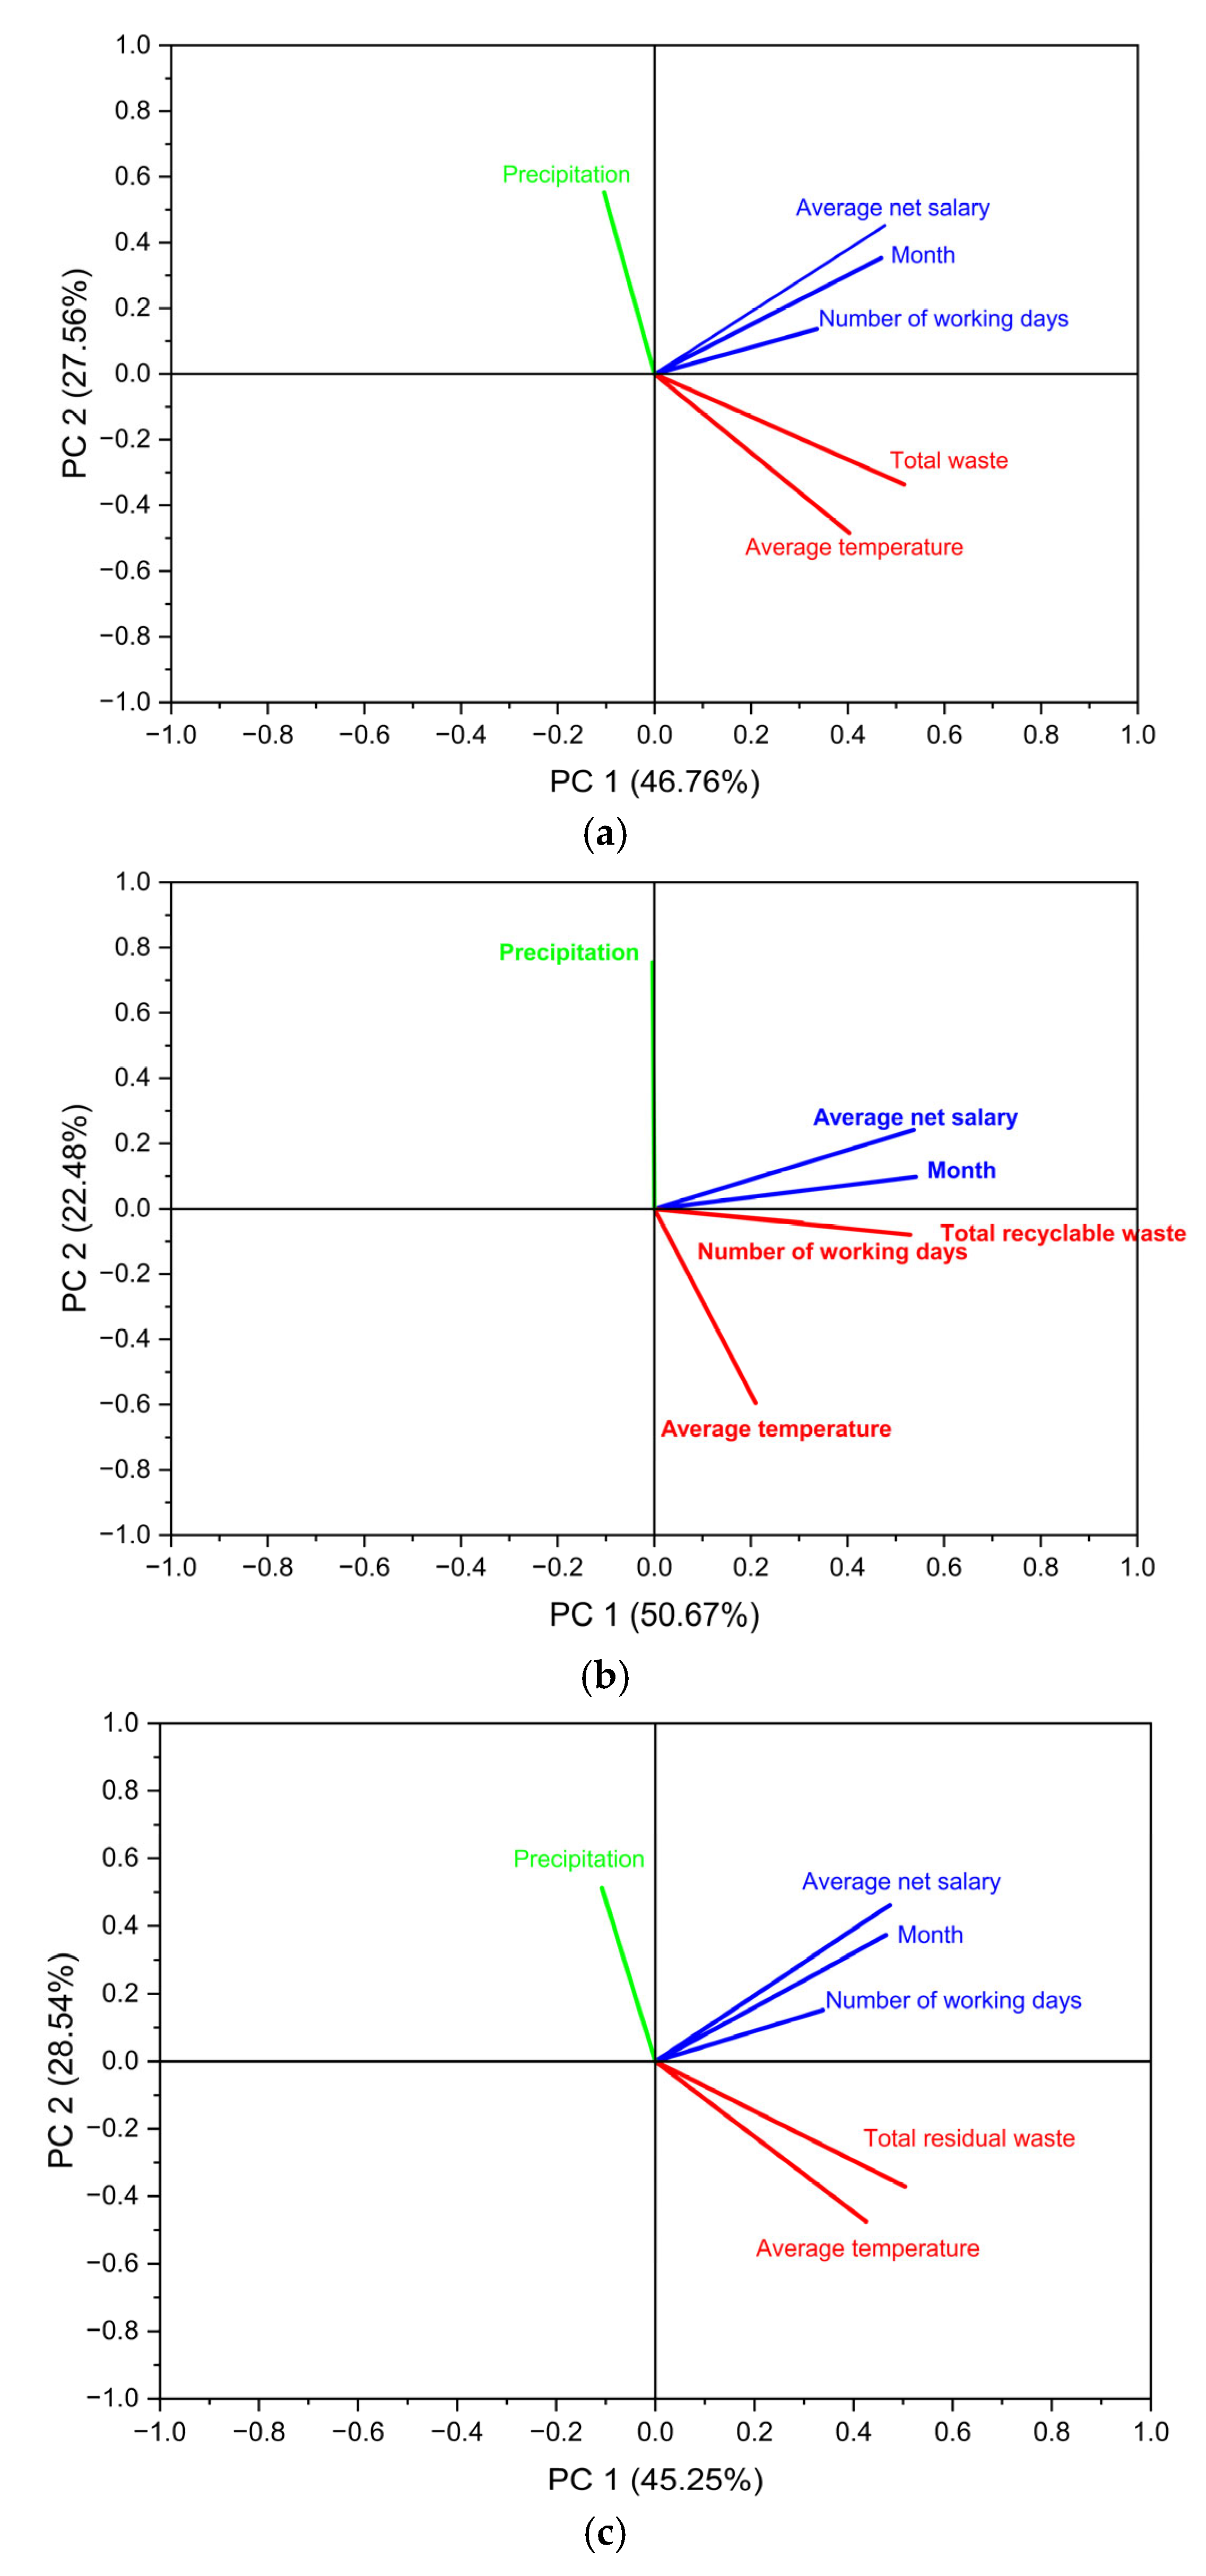
Figure 12 presents the results of the Principal Component Analysis (PCA) applied to the variables considered in the study, separately for:
(a) Total waste volume—in this analysis, the first principal component (PC1, 46.76%) describes a dominant trend associated with socioeconomic and temporal variables. The variables month, average net income, and number of working days are oriented in the same direction and have high positive loadings on PC1, indicating a strong statistical association with the dominant pattern of variation captured by this component. The secondary component (PC2, 27.56%) is primarily associated with climatic factors, showing an opposite orientation between average temperature (negative loadings) and precipitation (positive loadings). This distribution suggests that climatic variables are associated with a secondary pattern of variation captured by PC2, but independently of the dominant socio-economic structure captured by PC1. The positioning of the total residual waste quantity variable closer to the PC1 axis indicates that the residual flow makes a major contribution to the overall variation in the total amount of waste.
(b) Total amount of recyclable waste—here, the first principal component (PC1, 50.67%) explains an even higher proportion of the total variation, being defined almost exclusively by the total amount of recyclable waste, the month, and the average net wage. This proximity indicates that recyclable waste quantities are associated with the same variation pattern represented by the economic and temporal variables, such as income levels and the seasonality of consumption. The number of working days also aligns with PC1, but with a more moderate contribution, indicating a weaker association with the dominant variation pattern captured by PC1 in determining recyclable quantities. The second principal component (PC2, 22.48%) is dominated by precipitation (positive loadings) and average temperature (negative loadings). The orthogonal orientation of the climatic factors relative to the vector associated with recycling suggests an indirect influence that is weakly correlated with the volume of recyclable waste.
(c) Total amount of residual waste—in this case, the PCA structure is similar to that observed for total waste. The first principal component (PC1, 45.25%) is dominated by month, average net wage, and number of working days, indicating that residual waste is closely associated with the temporal and socioeconomic variables included in the analysis. The total residual waste variable has a strong projection on PC1, confirming its central role in the overall structure of municipal waste. The secondary component (PC2, 28.54%) again distinguishes climatic factors, with average temperature and precipitation positioned in opposite directions, suggesting contrasting but secondary climatic effects.
The PCA biplots show a consistent structure across all waste categories. PC1 explains the largest share of variance and is mainly associated with temporal and socioeconomic variables, particularly month and average net wage. PC2 is primarily related to temperature and precipitation, indicating a secondary climatic influence. The results support the findings of the HCA analysis, suggesting that municipal waste variability is more strongly associated with temporal and selected socioeconomic indicator than with climatic variables.
5. Discussion
A seasonal and statistical analysis of municipal waste streams in Bacău County for the year 2021 reveals significant and recurring temporal variations, with relevant implications from both a scientific and operational perspective. The results confirm the existence of a seasonal pattern within the operational dataset analyzed for 2021. Given the temporal coverage of the study, these findings should be interpreted as evidence of intra-annual seasonal variability rather than proof of long-term recurring seasonal behavior.
The interpretation of the results should take into account the temporal scope of the dataset. Since the analysis covers a single year, the identified seasonal patterns reflect the conditions observed during 2021 and should not be interpreted as permanent long-term trends. Nevertheless, the operational dataset provides valuable evidence regarding intra-annual variability and its implications for municipal waste management planning.
The results obtained for Bacău County during 2021 are consistent with seasonal patterns reported in studies conducted in regions with temperate climates and comparable regional economies, where municipal waste quantities vary throughout the year in association with changes in consumption and socioeconomic activities [
23,
25,
55]. This consistency suggests that the intra-annual patterns observed in the analyzed dataset are compatible with seasonal variations reported in the literature. However, because the present study is based on a single year of observations, it does not provide sufficient evidence to assess the long-term persistence or recurrence of these patterns. The results should therefore be interpreted within the operational context observed in Bacău County during 2021 [
17,
29].
A broader comparison with similar European studies further supports the interpretation of the results obtained. Denafas and colleagues [
41] highlighted clear seasonal variations in municipal waste generation in several cities in Eastern Europe, with higher quantities during the warm season and lower values during the winter—a pattern very similar to that observed in Bacău County. Similar conclusions were reported by Edjabou and colleagues in Denmark [
23], where seasonal fluctuations primarily affected the quantities of residual waste, while the overall waste composition remained relatively stable throughout the year. From the same perspective, Jaber and colleagues [
24] identified seasonal variations in Hungary associated with changes in consumer behavior and population activities at different times of the year. Furthermore, studies conducted in Poland by Przydatek [
83,
90,
91] highlighted the role of operational and seasonal factors in shaping municipal waste generation and the efficiency of collection processes. Although the seasonal pattern observed in Bacău County is similar to that reported in these European studies, one important difference lies in the relatively low proportion of separately collected recyclable waste. Compared to more mature waste management systems, in which recyclable fractions account for a larger share of the total waste stream, the composition of municipal waste in Bacău County remains heavily dominated by the residual fraction. This finding suggests that, although the seasonality of waste generation follows broader European trends, the effectiveness of separate collection and material recovery remains highly dependent on the local level of infrastructure development, public participation, and waste-management performance.
At the same time, an analysis of the composition of municipal waste shows that residual waste overwhelmingly dominates the total amount collected, while the share of recyclable waste remains extremely low. This composition reflects both the limited level of separate collection and the behavior of the population, as well as the maturity of the local waste management system. The stability of the structure throughout the year, highlighted by graphical and multivariate analyses, suggests that seasonality does not generate significant structural changes, but rather amplifies or diminishes the same dominant streams. Similar results have been reported in other studies based on monthly time series of municipal waste [
54,
57,
61].
The results highlight the fact that the residual fraction is the dominant component of the analyzed waste stream, while the recyclable fractions account for a much smaller share. This composition is relevant for evaluating the performance of the waste management system, as it shows that seasonal variations primarily affect the total quantities generated and, to a lesser extent, the relative composition of the waste fractions. Thus, the results obtained complement the seasonal analysis by highlighting the compositional stability of waste streams throughout the year under review.
The very low share of recyclable waste shown in
Figure 3 indicates that a large proportion of municipal waste continues to be collected within the residual waste stream. This result suggests that the effectiveness of separate collection remains limited in relation to the total quantity of waste generated. Consequently, recyclable materials represent only a small fraction of the overall municipal waste flow, while residual waste remains the dominant component throughout the year. From the perspective of this study, this structural characteristic provides important context for understanding the composition of municipal waste and the seasonal dynamics observed in the analyzed system. This finding is particularly important because the recyclable fraction accounts for only 3.3% of the total municipal waste generated in the analyzed period. Such a distribution indicates a strong predominance of residual waste within the waste management system and suggests that opportunities for material recovery remain limited in relation to the total waste flow. Although the present study does not evaluate the causes of this situation, the result highlights the importance of strengthening separate collection practices and increasing the recovery of recyclable materials in order to support more resource-efficient waste management strategies.
From the perspective of this study, the significance of this observation lies not only in the low proportion of recyclable waste, but also in the fact that this characteristic remains consistent throughout the entire period analyzed. The results suggest that the structure of waste streams remains relatively stable across seasons, even though the total volume of waste varies significantly. Consequently, the observed seasonality primarily influences the intensity of waste generation and, to a lesser extent, the relative distribution of the main waste categories.
Beyond conventional recycling activities, the recovery of recyclable materials may also contribute to broader waste-valorization strategies within the circular economy framework. Recent studies have highlighted the potential use of waste-derived materials in construction and stabilization applications, including geopolymer-based systems developed from industrial by-products and secondary resources [
95,
96]. Although such valorization pathways were not investigated in the present study, the low recyclable share identified in Bacău County underscores the importance of improving material recovery as a prerequisite for supporting future resource-efficient and circular-economy initiatives.
The application of nonparametric statistical tests objectively confirmed the existence of significant differences between seasons, particularly between the cold and warm seasons. The lack of significant differences between some adjacent seasons indicates a gradual transition in waste generation behavior rather than sudden changes, which is consistent with the progressive nature of the factors influencing consumption and economic activities. These results support the idea that seasonality should be addressed in terms of trends and critical intervals, not just through point-in-time comparisons between months [
24,
31,
69].
The results of the multivariate analyses reveal statistical patterns that are broadly consistent with observations reported in previous studies. Within the analyzed dataset, municipal waste variability shows closer statistical associations with temporal variables and with the socioeconomic indicator considered in this study than with the climatic variables included in the analysis. However, because average monthly net wage was the only socioeconomic indicator included and the analysis was based on twelve monthly observations, these findings should be interpreted as exploratory statistical associations rather than as evidence of socioeconomic drivers or causal mechanisms. Furthermore, the observed relationships should be considered as patterns identified through exploratory statistical methods rather than as evidence of direct causal relationships [
25,
35,
69].
Beyond confirming previously reported seasonal patterns, the present study provides an additional conceptual insight regarding waste generation dynamics in emerging integrated waste management systems. The findings suggest that seasonality primarily acts as an amplification mechanism of existing waste generation patterns rather than as a driver of structural changes in waste composition. In the analyzed system, seasonal peaks increase the magnitude of waste flows while preserving the dominance of the same waste fractions throughout the year. This observation contributes to the understanding of municipal waste seasonality by indicating that, in systems where residual waste remains dominant and separate collection is still developing, operational variability is mainly quantitative rather than compositional.
The results of the cluster analysis support this interpretation, revealing stable groupings among temporal and socioeconomic variables, regardless of the type of waste stream analyzed (total, recyclable, or residual). This consistency suggests a structurally robust pattern of the waste management system, in which quantitative variations are largely explained by common factors, and differences between streams are subtle. In particular, the closer statistical association between recyclable streams and the socioeconomic indicator included in the analysis suggests that these variables share a common pattern of variation within the analyzed dataset, a finding also reported in other regional contexts [
32,
62,
76]. However, this observation should be interpreted cautiously, as average monthly net wage was the only socioeconomic indicator available at monthly resolution and the analysis was based on a limited number of observations.
From an operational and institutional perspective, the results obtained have direct implications for the planning and management of municipal waste services. The seasonal peak observed during the summer months suggests the need for temporary adjustments in collection frequency, transport logistics, and treatment capacity in order to accommodate higher waste volumes. The identification of July and August as the months with the highest waste generation provides a practical basis for allocating additional operational resources during these periods. Conversely, the lower waste volumes recorded during the winter months may offer opportunities for scheduled maintenance activities, infrastructure servicing, personnel training, and logistical optimization. The relatively stable composition of waste streams throughout the year also suggests that seasonal planning should primarily focus on volume fluctuations rather than major changes in waste composition. This approach is consistent with the recommendations of European and international guidelines on the efficient management of municipal waste [
4,
17].
Although the findings may provide useful points of comparison for regions presenting similar waste-management characteristics, the results should be interpreted primarily within the context of Bacău County during 2021. Because the analysis is based on a single county and a single year of observations, the study does not provide sufficient evidence to support broad regional generalizations. Additional studies involving multiple regions and longer time series are necessary before extending these conclusions beyond the investigated case study.
In a broader context, this study contributes to the body of research highlighting the global nature of the municipal waste issue, while also providing a detailed analysis at the county level based on actual operational data. Compared to international studies presented in recent literature, the results obtained for Bacău County confirm similar general trends but also highlight local particularities related to the structure of waste streams and the level of separate collection. Compared to existing studies, the results obtained expand the empirical evidence regarding the seasonality of municipal waste in Eastern European contexts, demonstrating the applicability of seasonal and statistical analyses as relevant tools for informing waste management decisions at the regional level.
The limitations of the study are discussed in
Section 6 and should be considered when interpreting the results.
Building on the results obtained, this study can be expanded in several directions that are relevant from both a scientific and practical standpoint. A first direction involves extending the analysis to multi-year time series, which would allow investigation of the stability of seasonality over time and identifying any structural changes associated with the progressive implementation of waste management measures or exogenous events. Another future research direction involves a differentiated analysis at the sub-county level, by correlating waste generation data with the typology of localities (urban, rural, peri-urban areas), which would allow for a more nuanced understanding of territorial heterogeneity. Furthermore, the inclusion of additional indicators regarding the performance of separate collection and the assessment of the impact of public policy measures could provide an integrated perspective on the transition toward more efficient and sustainable municipal waste management. These future research directions are based on the methodological framework developed in this study and can contribute to strengthening the role of statistical analysis in decision-making at the local and regional levels.
6. Limitations of the Study
This study has several limitations that should be considered when interpreting the results:
First, the analysis is based on monthly observations from a single calendar year, which limits the ability to assess the stability of seasonal patterns over time and reduces the statistical power of certain analyses. Using only one year of data does not allow for a complete distinction between recurring seasonal patterns and any specific characteristics of the year 2021. Therefore, although the results indicate a clear seasonal pattern in municipal waste generation, the possibility that certain observed variations may have been influenced by economic, social, or operational conditions specific to the analyzed period cannot be ruled out. Analyses based on multi-year time series would allow for the validation of the stability of the identified patterns and the assessment of the generalizability of the conclusions.
Second, the selection of explanatory variables was determined by the availability of monthly data. Although there are other indicators that could be relevant for characterizing the socioeconomic and territorial context, most of them are published annually and do not show significant variations over the course of a calendar year. Consequently, including them in an analysis of seasonality based on monthly observations would not have provided additional relevant information regarding intra-annual fluctuations in the quantities of waste generated.
Third, the exploratory statistical methods used in the study allow for the identification of associations between variables, but cannot demonstrate direct causal relationships:
- ○
The results of the hierarchical cluster analysis (HCA) should be interpreted with caution, as the analysis was conducted on a limited number of observations and explanatory variables. Although the method is useful for identifying exploratory patterns of association, the clusters obtained cannot be considered definitive evidence of structural relationships between variables.
- ○
The use of PCA on a dataset consisting of only 12 monthly observations represents an additional limitation of the study. Although the analysis allowed for the identification of general patterns of association among variables, the small sample size may lead to a very high concentration of variation in the first principal component and a limited ability to identify more complex multivariate structures. For this reason, the PCA results should be interpreted as exploratory rather than as definitive statistical evidence regarding the relationships among variables.
An additional limitation is related to the socioeconomic variables included in the analysis. Due to the monthly resolution required by the study design, the average net monthly wage was used as the main socioeconomic indicator. Other potentially relevant variables, including population dynamics, household consumption levels, service coverage indicators, and separate collection infrastructure characteristics, were not available in a form compatible with the monthly dataset. Consequently, the interpretation of socioeconomic influences should be understood within the scope of the selected indicator rather than as a comprehensive assessment of all socioeconomic determinants of municipal waste generation. The study does not provide sufficient evidence to assess the temporal stability of the identified seasonal patterns or to support broad regional generalizations.
Because the study is based on a single county-level case and one year of observations, the results should be interpreted as context-specific. The present analysis does not provide sufficient empirical evidence to demonstrate the generalizability of the identified patterns beyond the investigated system. Future research involving multiple regions and longer time series is required to evaluate the extent to which similar seasonal dynamics occur under different institutional, socioeconomic and operational conditions.
Future research should include multi-year datasets and a larger number of socioeconomic and operational indicators in order to strengthen the robustness and generalizability of the results obtained.
However, the dataset used is of great practical value, as it consists of real operational data from the Integrated Waste Management System in Bacău County, providing direct insight into the functioning of a modern waste management system at the regional level.
7. Conclusions
This study analyzed the seasonality and structure of municipal waste streams in Bacău County for the year 2021, using monthly operational data and a coherent set of descriptive, nonparametric, and multivariate statistical methods. The results reveal a clear intra-annual seasonal pattern within the analyzed 2021 operational dataset, characterized by lower waste quantities during the winter months and higher quantities during the summer period.
Although the available dataset does not allow the assessment of long-term seasonal stability, it provides a complete operational representation of waste generation throughout an entire calendar year. Consequently, the study contributes to understanding short-term seasonal variability and its operational implications, while future analyses based on multi-year datasets are needed to determine the persistence of the identified patterns.
The study provides empirical evidence regarding the seasonal variability of municipal waste generation within the analyzed operational context. Unlike studies relying on aggregated regional or national estimates, the analysis demonstrates how seasonal, socioeconomic, and calendar-related factors can be examined at the local administrative level to support adaptive operational planning in municipal waste management.
An analysis of the waste composition revealed that the municipal waste stream in Bacău County, generated in 2021, is overwhelmingly dominated by the residual component, while the share of recyclable waste remains low. Furthermore, the composition by fraction remains relatively stable throughout the year, indicating that seasonality primarily influences the magnitude of the flows without causing significant structural changes. This finding is supported by both descriptive analyses and the results of the applied multivariate analyses.
However, these associations should be interpreted within the limits of the dataset and the exploratory statistical framework adopted.
From a practical standpoint, the study’s findings highlight the importance of incorporating seasonality into the strategic planning of municipal waste management systems through a flexible and proactive allocation of operational resources. This approach increases the operational efficiency of sanitation services and supports the alignment of local waste management with the objectives and recommendations of relevant European policies.
The study’s results should be interpreted within the methodological limitations of the exploratory analyses applied. While the statistical methods used allow the identification of patterns of association among variables, they do not demonstrate causal relationships. Therefore, the conclusions highlight associations and seasonal patterns observed in the analyzed dataset rather than direct causal mechanisms.
Because the analysis is based on monthly operational data from a single calendar year and a single county-level waste management system, the findings should be regarded as preliminary and context-specific. Although the results provide useful evidence regarding seasonal waste-generation patterns, additional studies based on multi-year datasets and broader territorial coverage are needed to assess the long-term stability and generalizability of the observed relationships.
Although the analysis is limited to a single calendar year, this limitation does not compromise the main objective of the study, which is to characterize intra-annual seasonal variability in municipal waste generation. The availability of complete monthly operational data for the entire year allows the identification of seasonal patterns and their associated operational implications, while broader generalizations regarding long-term trends should be interpreted with appropriate caution.
From a practical standpoint, within the context of the analyzed 2021 dataset, the results may provide useful information for local government authorities, intermunicipal development associations, and waste management operators regarding seasonal variations in waste quantities and their operational implications. The findings may support the adjustment of collection and transportation capacities during periods of increased waste generation and may contribute to improving operational planning under conditions similar to those observed during the study period.
The results contribute to the documentation of intra-annual waste generation patterns observed in the analyzed county-level waste management system during 2021. The study also suggests that temporal variables and the socioeconomic indicator considered in this study exhibit closer statistical associations with municipal waste variability than the climatic variables analyzed. These findings contribute additional empirical evidence regarding the intra-annual seasonal patterns observed in Bacău County during 2021 and may serve as a useful reference point for future comparative analyses conducted in other regional contexts.
Future research could expand this analysis by incorporating multi-year time series, applying predictive modeling of waste generation, or assessing the association between separate collection policies and changes in waste stream structure. Such research directions could help inform more effective strategies for transitioning to sustainable municipal waste management.





 ,
,