Article

Probability Estimation and Regional Differentiation of Agro-Meteorological Damage Risk for Agricultural Sustainability: Based on a Nonparametric Normal Information Diffusion Model

1
School of Economics, Guangxi Minzu University, Nanning 530006, China
2
Research Center for Digital Economy and Population Development, Guangxi Minzu University, Nanning 530006, China
*
Authors to whom correspondence should be addressed.
Sustainability 2026, 18(14), 7487; https://doi.org/10.3390/su18147487
Submission received: 22 June 2026 / Revised: 14 July 2026 / Accepted: 15 July 2026 / Published: 22 July 2026

Abstract

The probability estimation of agrometeorological damage risk is the core technical support for consolidating the agricultural disaster prevention and reduction system and ensuring the sustainable development of national agriculture. It has been widely applied in agricultural production and agricultural insurance. Based on the crop planting area data, as well as the damaged crop area data (damage-affected, damage-stricken, and dead harvest) of 31 provinces and municipalities from 1980 to 2018, this study creatively builds a comprehensive damage strength index. After that, this study obtains accurate risk probability estimation results of five meteorological damage types by using the parameters of the nonparametric normal information diffusion model. The results show that the risk probability of comprehensive meteorological damage is the largest, followed by drought, flood, wind and hail, and freezing. Flood in Hubei, drought in NeiMenggol, windstorm and hailstorm in Qinghai, freezing damage in Hainan, and comprehensive meteorological damage in NeiMenggol have the highest risk probability. The regions where various meteorological damage occur show different distribution characteristics, which is closely related to the latitude and longitude and topography of China. These findings indicate that it is necessary to understand the overall patterns of agrometeorological damage risks and consider their internal heterogeneity, in order to take targeted prevention and control measures to avoid systemic risks in agricultural production and safeguard sustainable and high-quality agricultural development.

1. Introduction

According to State of Food Security and Nutrition in the World (SOFI) Report 2025, it is estimated that between 638 and 720 million people, corresponding to 7.8 and 8.8 percent of the global population, respectively, faced hunger in 2024 (2025 The State of Food Security and Nutrition in the World. https://www.wfp.org/publications/state-food-security-and-nutrition-world-sofi-report-2023 (accessed on 1 July 2026)).
The global food security situation is becoming increasingly precarious. Rapid population growth coupled with the rising frequency of natural disasters has heightened concerns about both current and future food security challenges. According to the World Population Prospects 2024 by the United Nations Population Division, the world population is expected to reach 10.18 billion people by 2100 (World Population Prospects 2024. https://population.un.org/wpp/ (accessed on 1 July 2026)). Though the global per capita agricultural output has increased by 50% since 1960, the feeding number of people has doubled. Food security is still a continuous struggle. When weather events or natural disasters occur, the global food supply is “on the edge of the sword” [1], because the environment is more difficult for agricultural production.
China has a population accounting for about one fifth of the world, but the per capita cultivated land area is far below the world level (World Bank official website. https://data.worldbank.org.cn/indicator/AG.LND.ARBL.HA.PC?view=chart.2022-02-02 (accessed on 1 July 2026)), and the quality of cultivated land ranks medium to low (“2019 Bulletin on the Quality Grade of National Cultivated Land” from official website of the Ministry of Agriculture and Rural Affairs of the People’s Republic of China. http://www.moa.gov.cn/nybgb/2020/202004/202005/t20200506_6343095.htm (accessed on 1 July 2026)). With the implementation of the three-child policy in 2021, China’s population will continue to grow steadily, and food security will remain severe in the future. In addition, China is one of the countries with various types of meteorological damage. Drought, flood, low temperature, frost, hail, high temperature, and other meteorological damage occur frequently, which even form huge damage. They are extremely unfavorable to agriculture as the production mainly depends on the weather. Several major types of meteorological damage in China from 1980 to 2018, such as floods, droughts, wind and hail, and freezing, had an average affected area of 415.66, 831.68, 167.62, and 128.94 million hectares respectively, accounting for 14.79%, 6.72%, 3.45%, and 2.56% of the average sown area. The average affected area of comprehensive meteorological damage is higher (1579.28 million hectares), accounting for 27.53% of the average sown area (The calculation is based on the data of China Statistical Yearbook and China Agricultural Yearbook in the corresponding years). Meteorological damage restricts the stable development of China’s agricultural production and becomes a threat to food security. Therefore, it is urgent to accurately assess the risk probability of China’s agrometeorological damage, and formulate reasonable targeted measures to reduce agricultural production losses considering China’s regional differences, so as to ensure food security as well as the sustainable development of agriculture.
In terms of the research content of agrometeorological damage risk, due to the availability of data and the simplicity of calculation, current researches mainly focus on several common damage types, such as drought, flood, etc. [2,3,4,5]. Some studies have considered other types of meteorological damage, such as freezing, wind and hail, landslide, etc. [6,7,8]. However, very few analyzed the comprehensive meteorological damage [9,10]. However, comprehensive meteorological damage can be seen as a higher-level reflection of various specific types of meteorological damage, which can summarize and reflect the overall situation of meteorological damage from a higher level. For China, which has a large area, it is particularly important to not only understand various specific types of meteorological damage, but also to further understand them as a whole.
There are two common methods for estimating the risk probability of agrometeorological damage: parametric estimation and nonparametric estimation. The parameter estimation firstly assumes the probability distribution, such as normal distribution, normal logarithmic distribution and Weibull distribution [11,12], and then estimates the parameters of the distribution with sample data. The parameter estimation method is suitable for the case where the sample data size is small or the specific form of distribution is known. However, it is risky if we make a subjective assumption without knowing the specific form of distribution. Particularly, for the probability distribution related to natural disasters of crops, there is no exact evidence to show which probability distribution is reasonable. The nonparametric method only needs little or no prior information, thus avoiding the problem of wrong model setting. There are many kinds of nonparametric estimation methods, among which histogram is the simplest, but few scholars use it because its estimation results are quite rough. At present, two commonly used methods are kernel density estimation [13,14,15] and nonparametric information diffusion model [16,17,18]. Although the kernel density estimation method has certain advantages over histogram, sometimes false peaks or real local highest points are smoothed out due to improper bandwidth selection. Since the information diffusion model can change an incomplete sample observation value into a fuzzy set, which helps to make up for the defects caused by insufficient data in function approximation, it is more effective than the general parametric and nonparametric estimation methods, especially when the estimation results are obtained under the condition of small samples. Thus, it has been widely applied in natural disaster risk analysis.
The previous studies in relevant fields have provided references for this study. However, when reviewing the previous literature, we found that few studies analyzed comprehensive meteorological damage. It has been stated previously that the risk of comprehensive meteorological damage is much more serious than that of single meteorological damage. Most of the research did not integrate different damage levels into a comprehensive indicator for discussion, such as damage-affected, damage-stricken and dead harvest (which will be explained later in “3.1. Calculation of Damage Loss Intensity”).
Instead, researchers mainly focused on the risk under a specific level of damage (such as damage-affected or damage-stricken). In some cases, the general effect is greater than the sum of the parts, and the composite index has the advantage that a single dimension does not have, which is the index that reveals the comprehensive change of things [19]. Hence, broader macro-level research should be carried out to fully and accurately identify the inherent patterns of comprehensive agricultural risks. Meanwhile, China covers a vast territory with various meteorological disasters, which display obvious regional disparities. It is necessary to analyze the heterogeneity of each province or certain regions on the basis of overall research, so as to make specific agricultural production guidance.
With the availability of data, this study uses the data of crop planting area and different types of damage area in 31 provinces and cities in China from 1980 to 2018 to construct a damage intensity index that comprehensively considers three different damage degrees: damage-affected, damage-stricken and dead harvest. Then, an information diffusion model is used to estimate the damage risk probability in accordance with the damage intensity of crops suffering from various meteorological damage (drought, flood, wind and hail, freezing, and comprehensive meteorological damage) in 31 provinces and municipalities. According to the results of different risk probability estimations, the damage intensity of various types of meteorological damage in 31 provinces and municipalities at different return periods (such as once-in-five-year return period, once-in-three-year return period, once-in-two-year return period and probability value greater than 3/4) is obtained. Based on the national average damage intensity, the regional conditions of five risk levels for various meteorological damages have been calculated, which can better cope with and guide the current and near future agricultural production, to ensure China’s food security and the sustainable development of agriculture.
The possible innovations of this study are mainly reflected in the following two aspects. First, this study overcame the shortcomings of previous research, which mostly start from a certain point of view of damage. It took into account three kinds of damage (i.e., damage-affected, damage-stricken, and dead harvest), and built a comprehensive damage intensity index, which provided an important basis for the risk probability estimation of subsequent meteorological damage and expanded relevant research. Second, based on previous literature, this study explored the overall characteristics and cross-provincial regional differences of risk probabilities of five types of meteorological damage in China.
The organization of this paper is as follows. Section 2 illustrates the data and methodology. Section 3 presents the results of damage loss intensity, probability estimation of meteorological damage risk, and regional differences in agricultural risks. Section 4 discusses the empirical results. Conclusions are in Section 5.

2. Data and Methods

2.1. Data Source and Variable Description

Data on damage-affected/damage-stricken area from 1980 to 2016 is sourced from the China Agricultural Yearbook; the damage-affected area from 2017 to 2018 is from the China Statistical Yearbook; the damage-stricken area from 2017 to 2018 is from the China Rural Statistical Yearbook. The dead harvest area is from the data of the China Agricultural Yearbook from 1993 to 2016 and the data of the China Statistical Yearbook from 2017 to 2018. Among the above data, since Hainan Province and Chongqing Municipality were established in 1988 and 1997, respectively, the data of these two districts used by this paper are from the year of establishment to 2018.
The sources and algorithms of relevant variables used in this paper are shown in Table 1.

2.2. Methods

In terms of the population Ω and sample X from the population, each sample point x i provides the information on the point of its observation value, as well as the information about the “surrounding” points. We call the information shared by “surrounding” points as information from diffusion, and call the process of point x i information shared by “surrounding” points as information diffusion process. The estimation of the overall probability density function based on the information diffusion principle is called diffusion estimation. Assuming that the observed sample set X   =   { x 1 , x 2 , , x n } is a random sample, independent and identically distributed. Assuming that the basic domain of the risk factor indicators corresponding to information diffusion is U   =   { u 1 , u 2 , , u m } , there exists a function μ , such that the information obtained by each point x i can be diffused to all u j according to the function μ . Assuming that at time t of diffusion function μ ( x ) in the diffusion process, the information state of the corresponding point x is μ ( x , t ) , then the information diffusion state μ ( x , t ) is equivalent to the number of molecules per unit volume of the diffusion substance in the molecular diffusion theory. In light of the molecular diffusion law (Fick’s law), using mathematical methods such as differential equation and Fourier transform, we have:
μ x , t = 1 2 π D t exp x 2 4 D t
In the above Equation (1), D represents the molecular diffusion coefficient, marking as h = 2 D t , Equation (1) can be approximately expressed as:
μ x = 1 h 2 π exp x 2 2 h 2
The above Equation (2) is exactly the same as the density function form of the normal distribution. The corresponding overall probability density function estimate is also called the normal diffusion estimate. h in Equation (2) is called the diffusion coefficient of normal diffusion (or bandwidth, window width).
We choose the appropriate diffusion coefficient h according to the two-point approach principle of normal diffusion. In short, the two-point approach principle of normal diffusion means that the sum of information diffused from the latest two control points should not be less than the sum of information diffused from all other control points, that is:
exp ( x u j ) 2 2 h 2 + exp ( x u j ) 2 2 h 2 x x , x exp ( x u j ) 2 2 h 2 ,   x X  
Among which, x , x X , x < x refer to two nearest points, u j U . In light of the concept of average distance, plus Wang Xinzhou and You Yangsheng’s derivation of the width of the two-point proximity window [20], window width h meets the following equation:
i = 1 k y n ( i + 1 ) 2 = 1 2
Among which, y n = exp d 2 / 2 h 2 , and d represents average distance, k satisfies n = 2 k + 3 . Using matlab, the approximate numerical solution of y n can be obtained by solving the nonlinear equation expressed in Equation (4). Let α n = 1 / 2 ln y n , then the band width is:
h = α n d = α n m a x i = 1,2 , , n ( x i ) m i n i = 1,2 , , n ( x x ) n 1
By solving Equation (5) based on different n , the following empirical data of diffusion coefficient are obtained:
h = 1.6987 ( b a ) / ( n 1 ) , n 5 1.4456 ( b a ) / ( n 1 ) , n = 6 , n = 7 1.4230 ( b a ) / ( n 1 ) , n = 8 , n = 9 1.4207 ( b a ) / ( n 1 ) , n 10
In Equation (6), n represents the number of samples. b = m a x i = 1,2 , , n ( x i ) represents the maximum value of the sample. a = m i n i = 1,2 , , n ( x i ) represents the minimum value of the sample. The approximate solution based on the two-point proximity principle expressed in Equation (6) above is not the optimal solution in the sense of minimum mean square error. Just like the nonparametric kernel density estimation where the thumb rule calculated based on the sample standard deviation is often used ( h = 4 / 3 n 1 / 5 σ ^ ,   n is sample number, σ ^ is sample standard deviation), in the normal diffusion estimation, the diffusion coefficient expressed by Equation (6) is convenient and practical, and the accuracy is sufficient.
When the observation sample is an indicator of risk factors such as damage-affected intensity, damage-stricken intensity, and dead harvest intensity, a normal diffusion function in the form of Equation (2) is selected to form a diffusion matrix. The diffusion function will spread the information carried by each single value observation sample point x i in the observation sample set X to all points in the domain U. For the convenience of understanding, we express the diffusion function as:
f ( x i , u j ) = 1 2 π h exp ( x i u j ) 2 2 h 2 ,   i = 1 , 2 , , n ;   j = 1 , 2 , , m
Through further calculation, the normalized information distribution matrix of sample point x i is formed and expressed as:
μ ( x i , u j ) = f ( x i , u j ) j = 1 m f ( x i , u j ) ,   i = 1 , 2 , , n ;   j = 1 , 2 , , m
By processing the normalized information in Equation (8) above, we obtain a satisfying risk assessment result. Let:
q u j = i = 1 n μ x i , u j , j = 1 , 2 , , m
Here the frequency value of the sample point u j at the midpoint of domain U can be used as the estimate of probability:
p ( u j ) = q u j / i = 1 m q u i , j = 1,2 , , m
When we estimate the damage risk, we often describe the damage risk index as the risk probability that exceeds r % , for example, the probability that the flood damage loss intensity exceeds 20%. Therefore, we set the r % as the domain of damage index, and correspond it to a specific element u j , then we know the probability value of exceeding u j is:
P ( X u j ) = k = j m p ( u j ) , j = 1 , 2 , , m
The above Equation (11) is the risk probability corresponding to the damage loss intensity of crops suffering from various damage.

3. Empirical Results

3.1. Calculation of Damage Loss Intensity

From the perspective of statistical data, the degree of meteorological damage can be expressed as the damage-affected area, damage-stricken area, and dead harvest area, which represents the comprehensive results of one or more damage in the year. To comprehensively evaluate the risks represented by the data of damage-affected, damage-stricken, and dead harvest, the damage intensity is defined as follows:
I L i j = R H S i j W h + R D S i j W d + R F S i j W f
Among them, the subscript i indicates the region; the subscript j indicates the types of damage, including flood, drought, wind and hail, freezing, and comprehensive damage; R H S , R D S and R F S are the damage-affected rate, damage-stricken rate and dead harvest rate respectively; W represents the proportion of equivalent losses.
The relevant provisions of the Statistical System of Natural Disasters issued by the Ministry of Civil Affairs of the People’s Republic of China on 26 December 2013 define that “damage-affected” refers to a reduction of production by more than 10%; “damage-stricken” refers to a reduction of production by more than 30%; “dead harvest” refers to a reduction of production by more than 80%. Meanwhile, the known damage-stricken area includes the dead harvest area. The damage-affected area includes the damage-stricken area. In light of this, we calculate the proportion of equivalent loss corresponding to damage-affected, damage-stricken, and dead harvest by using the statistical data in China from 1980 to 2018. The calculation method and results are shown in Table 2.
From the calculation results in Table 2, we can see that the proportions of equivalent losses of various damage are quite similar. If we compare them with two decimal places, the proportion of equivalent losses of dead harvest is around 0.9; the proportion of damage-affected is 0.6 (or a bit above); the proportion of damage-stricken fluctuates around 0.4. Therefore, we take 0.4, 0.6, and 0.9 as the proportion of equivalent losses of damage-affected, damage-stricken and dead harvest, respectively.
Equation (12) calculates the damage loss intensity of various damage types in 31 provinces and municipalities over the years (as shown in Table 3 and Table 4).
Table 3 and Table 4 show that the average damage intensity of comprehensive meteorological damage in the observation period is the highest, reaching 21.27%. The average damage intensity of drought, flood, wind and hail, and freezing is 11.10%, 5.93%, 2.95%, and 2.70%, respectively. From the provincial perspective, Liaoning has experienced the maximum comprehensive meteorological damage intensity (92.31%) and the maximum drought intensity (91.15%); Qinghai experienced the maximum flood intensity (55.96%); Hunan experienced the maximum freezing intensity (40.81%); and Shanxi experienced the maximum wind and hail intensity (28.43%).

3.2. Probability Estimation of Meteorological Damage Risk

We take the results of Table 3 as the input variable for information diffusion risk probability estimation. The bandwidth of diffusion estimation is calculated by Equation (6), and then the risk probability estimation is completed by Equations (7)–(11). Finally, the estimation results in 31 provinces and municipalities are obtained and shown in Figure 1.
Figure 1 shows that, in general, for the 31 provinces and municipalities, if the comprehensive meteorological damage is not considered, the probability of drought is the highest compared to the other three damage types, followed by flood, wind and hail, and freezing damage. This result is consistent with the research conclusions of other scholars [21]. Since the comprehensive meteorological damage include flood, drought, wind and hail, and freezing, the risk probability of it is the highest.
In terms of flood, Hubei has the highest risk probability; Hunan, Jiangxi, Chongqing, Anhui, Zhejiang, Sichuan, Guangxi, and Hainan also have high risk probability, while Shanghai has the lowest probability. In terms of drought, NeiMenggol has the highest risk probability; Shaanxi, Gansu, Ningxia, Qinghai, Shanxi, and northeast provinces also have high risk probability; while Shanghai have the lowest probability. The risk probability of wind and hail, and freezing damage is quite low, but it greatly damages some provinces and municipalities. For example, Qinghai is the province with the greatest damage of wind and hail damage, followed by Xinjiang, Gansu, and NeiMenggol; Guangxi has the lowest risk of wind and hail damage. As for freezing, Hainan is greatly damaged, followed by Xinjiang, Qinghai, Hubei, and Guangdong; Beijing has the lowest freezing damage probability. Lastly, in terms of the risk probability of comprehensive meteorological damage, NeiMenggol has the highest risk probability, followed by Shanxi, Qinghai, Gansu, Liaoning, Shaanxi, Ningxia, Hubei, Heilongjiang, and Hainan; Shanghai has the lowest risk probability.
As illustrated in Figure 1, distinct outcomes are observed when meteorological damages are evaluated separately versus in an integrated comprehensive framework. This also indicates that insurance companies need differentiated policy designs for single-peril and comprehensive multi-peril meteorological insurance in different regions.

3.3. Analysis of Regional Differences in Agricultural Risks

Previously, the analysis of damage loss intensity and risk probability has been discussed considering provincial differences, but the discussion requires more details, because different administrative regions/provinces have similar climate conditions (especially in neighboring provinces), whereas in the same administrative region/province, the climate conditions are not the same. Hence, further research is needed on the heterogeneity of a wider range of regions across administrative boundaries (provinces).

3.3.1. Regional Differences Based on Different Return Periods

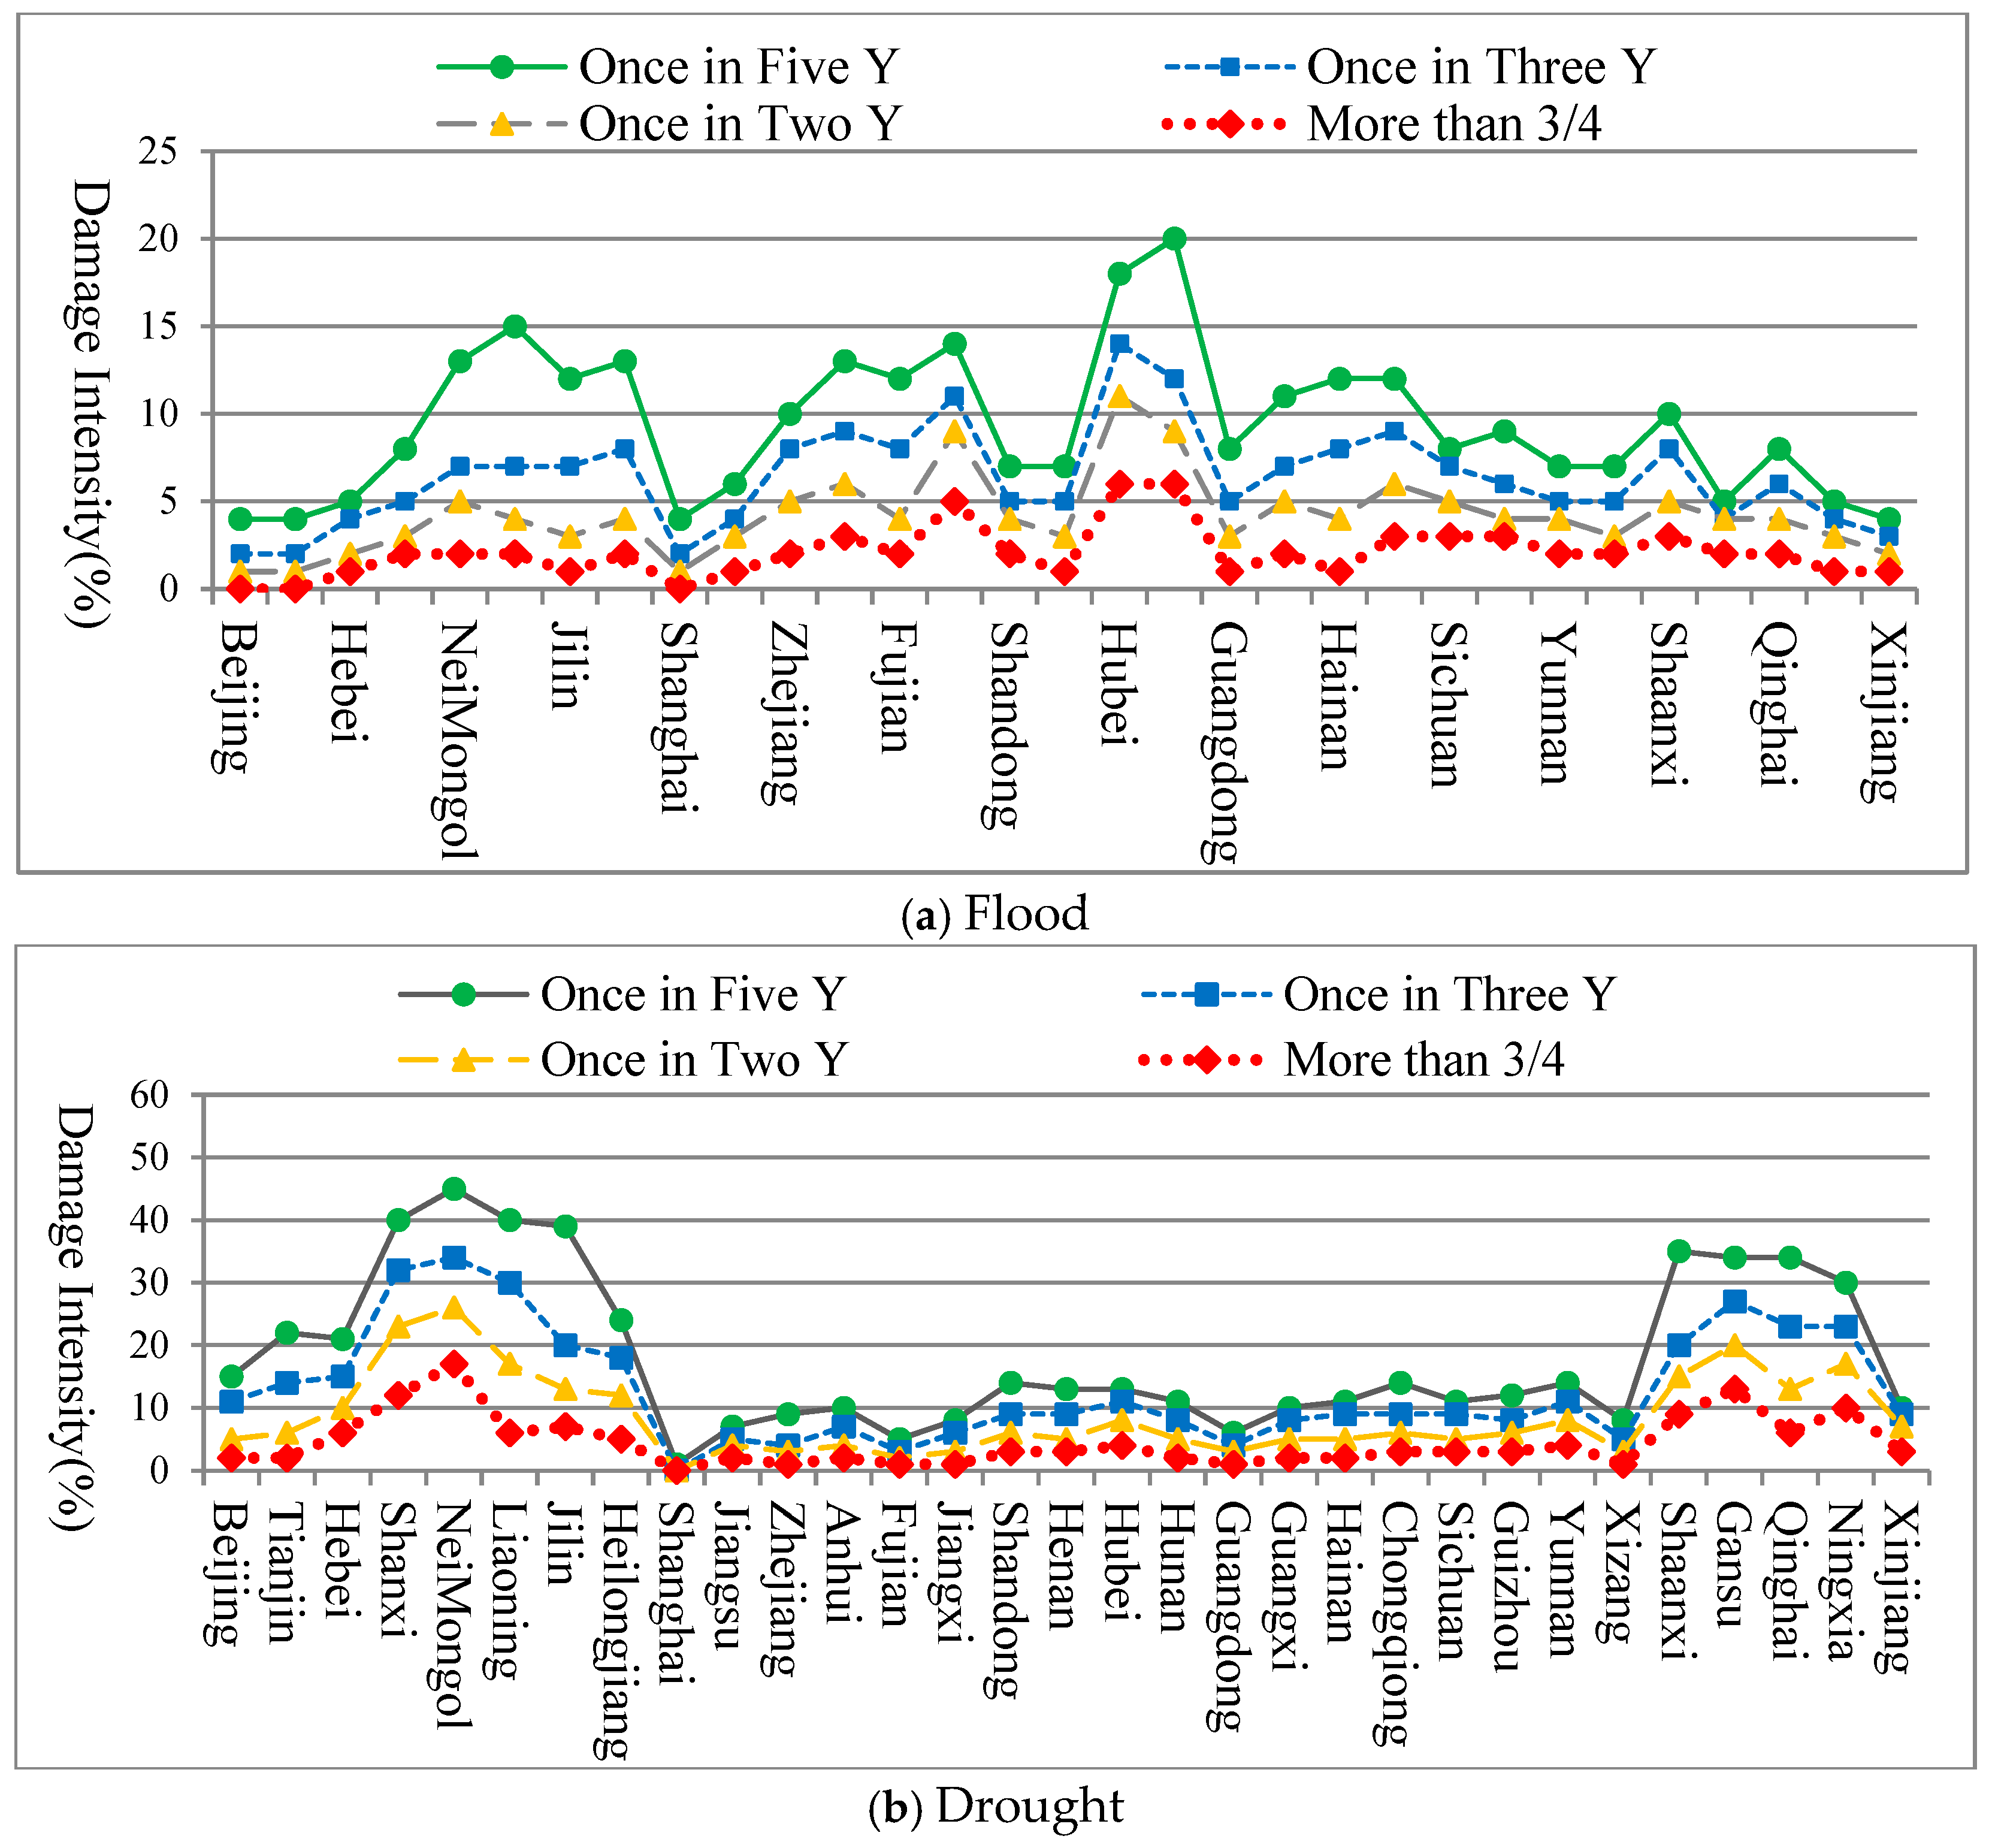
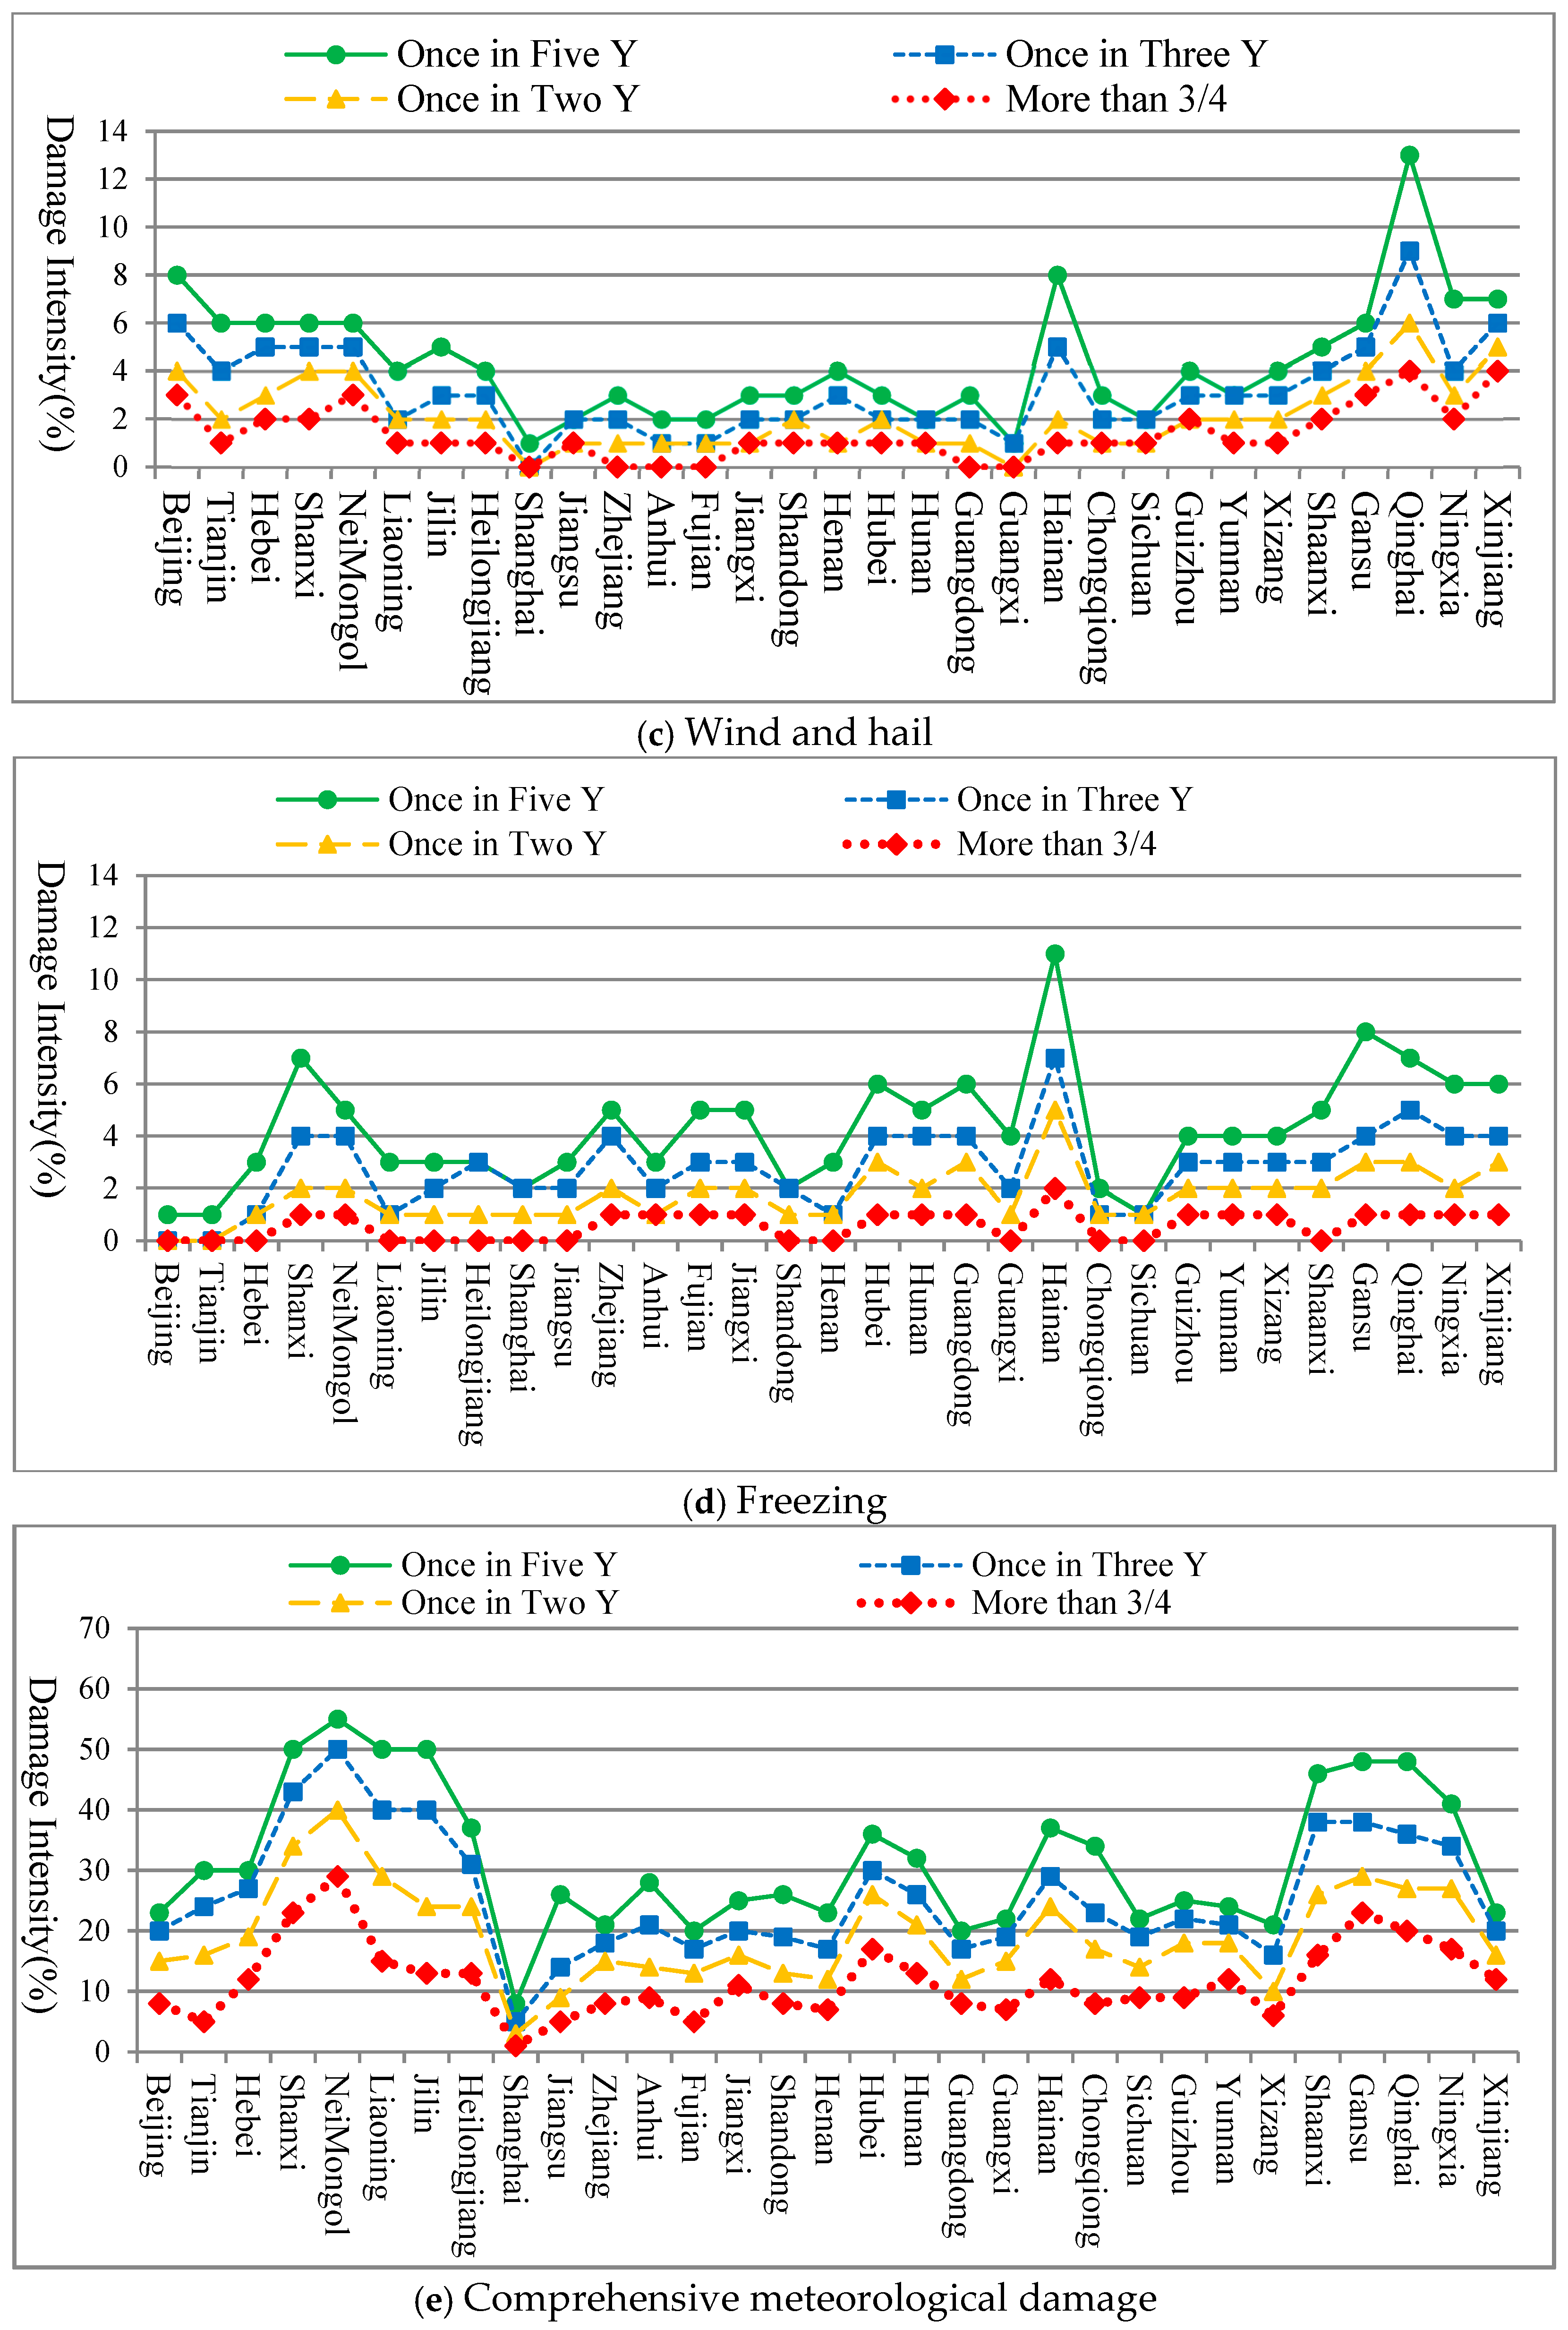
Based on the results of different risk probability estimates, the damage intensities of various meteorological damage in 31 provinces and municipalities in China with different return periods are shown in the small charts in Figure 2.
Panel (a) in Figure 2 shows that the flood damage intensity with a once-in-five-year return period is as high as 20% (Hunan), followed by Hubei (18%). The flood damage intensity in NeiMenggol, Liaoning, Jilin, Heilongjiang, Anhui, Fujian, Jiangxi, Guangxi, Hainan, and Chongqing is also quite high, ranging from 10% to 15%. The maximum damage intensity of the once-in-three-year flood is 18% in Hubei, followed by Hunan Province (12%); the maximum damage intensity of the once-in-two-year flood is 11% in Hubei, followed by Jiangxi and Hunan (9%). However, Hunan and Hubei (6%) have the highest flood damage intensity with a probability greater than 3/4, followed by Jiangxi (5%). In conclusion, Hunan, Hubei, Jiangxi and Chongqing have high flood damage intensity.
Panel (b) in Figure 2 shows that NeiMenggol has the highest drought intensity at any return period, which is 45%, 34%, 26%, and 17%, respectively. Secondly, the drought intensity in Shanxi, Liaoning, Jilin, Heilongjiang, Qinghai, Shaanxi, Gansu, and Ningxia is also relatively high.
In terms of wind and hail damage, panel (c) in Figure 2 shows that the highest damage intensity of wind and hail damage s occurs in Qinghai at any return period, about 13%, 9%, 6%, and 4% respectively. In addition, the damage intensity of wind and hail damage in Beijing and Hainan is also slightly higher than that in other provinces and municipalities.
In terms of freezing damage, as shown in panel (d) in Figure 2, the highest intensity of freezing damage occurs in Hainan at any return period, about 11%, 7%, 5% and 2% respectively. In addition, the freezing damage intensity in Shanxi and Gansu is also higher than that in other provinces and municipalities.
In terms of comprehensive damage, panel (e) in Figure 2 tells us that NeiMenggol has the highest comprehensive damage intensity at any return period, reaching the highest value as 55%, 50%, 40%, and 29%, respectively. In addition, Shanxi, Northeastern provinces, Qinghai, Shaanxi, Gansu, and Ningxia come as the second highest, followed by Hunan, Hubei, Hainan, Chongqing, Tianjin, and Hebei. Moreover, we see from the above figures that Shanghai has the lowest damage intensity in terms of flood, drought, wind and hail, and comprehensive damage.

3.3.2. Regional Variation Based on Risk Level

Hierarchical display of natural disaster risks is one of the most effective methods to intuitively reflect the spatial-temporal differentiation of natural disasters [22]. To conduct further comparative analysis, we calculated the regional disparities in various meteorological disaster risk levels across 31 provincial-level regions based on the estimated risk probabilities and the national average damage intensity presented in Table 3, as shown in columns (a) to (e) of Table 5. Based on the value of risk probability, we use 1/5, 1/3, 1/2 and 3/4 of it (i.e., different return periods) as segmentation points to divide the risk into five levels.
Column (a) of Table 5 shows that the average flood damage intensity of 31 provinces and municipalities in China is 6%. Hunan and Hubei have the highest risk level, followed by Jiangxi, Anhui, and Chongqing, then Hainan, Guangxi, Guizhou, Sichuan, Qinghai, Shaanxi, NeiMenggol, Liaoning, Jilin, Heilongjiang, Zhejiang, and Fujian come next, followed by Guangdong, Yunnan, Xizang, Henan, Shanxi, Jiangsu, and Shandong. The lowest level of flood risk is in Xinjiang, Gansu, Ningxia, Beijing, Tianjin, Hebei, and Shanghai. In general, when the average flood damage intensity is 6%, taking Hunan and Hubei as the center, it roughly presents the characteristics of radioactive and lumpy distribution. From the perspective of the distribution of China’s climate characteristics, the southeast coastal areas are more vulnerable to flood, but these provinces do not have a high level of flood risk. The possible reason is different terrains: the rain in the southeast coastal provinces comes and goes quickly without causing waterlogging, but Hunan and Hubei and other places cannot drain in time.
In terms of drought, column (b) of Table 5 shows that under the 11% average damage intensity of 31 provinces and municipalities in China, Gansu, NeiMenggol and Shanxi have the highest risk level, followed by the surrounding regions including Qinghai, Ningxia, Shaanxi, Liaoning, Jilin, and Heilongjiang, then Yunnan and Hubei come next. Xinjiang, Xizang, Jiangsu, Shanghai, Zhejiang, Fujian, Guangdong, Guangxi, Anhui, and Jiangxi have the lowest risk levels. Overall, it presents a sandwich distribution feature: the southeast and northwest sandwich a large area in the middle. This distribution feature is consistent with the stepped terrain distribution of China, which is high in the West and low in the East. The terrain of the southeast coast is low and tilts towards the ocean, which is conducive to the humid air flow of the ocean going deep into the mainland, forming precipitation, and effectively alleviating the drought. NeiMenggol has a wide range of longitudes and a long distance from east to west. From east to west, it is farther and farther away from the ocean, and the terrain is also higher and higher, which makes it difficult for the moist air flow from the ocean to reach the southwest of NeiMenggol, thus the drought is serious there. It should be pointed out that Xinjiang and Xizang are located in the inland of the border, with scarce precipitation, but the drought risk level is low. The main reason is that although Xinjiang and Xizang both have temperate arid and semi-arid climate, the two provinces are mainly dominated by animal husbandry, and their crops are mostly planted in areas with relatively sufficient water sources. With the promotion and development of drip irrigation and other technologies in arid areas, the risk of damage is low. Therefore, the concept of “arid area” in meteorology and the concept of “drought” in insurance studies are different.
Column (c) of Table 5 shows that the average damage intensity of wind and hail damage in 31 provinces and municipalities is about 3%. On the whole, the level of risk gradually decreases from northwest and north to central and south. Xinjiang, Qinghai, Gansu, NeiMenggol, and Beijing have the highest risk level of wind and hail damage, followed by Ningxia, Shaanxi, Shanxi, and Hebei; Xizang, Yunnan, Guizhou, Henan, Heilongjiang, and Jilin come next. Sichuan, Guangxi, Hunan, Fujian, Anhui, Jiangsu, and Shanghai have the lowest risk level. This distribution feature is related to the low temperature and prevailing northwest wind in northern China.
Unlike drought, flood, wind, and hail, the risk level of freezing damage is generally low. The national average damage intensity is about 3%, and the probability of its risk level is not greater than 3/4. Column (d) of Table 5 shows that the provinces and municipalities with high freezing damage level in China are in Xinjiang, Qinghai and Gansu (in Northwest China), Hubei (in the middle of China) and Guangdong and Hainan (in South China), roughly distributed in the northwest and southeast. This distribution feature is highly related to the causes of freezing damage: firstly, northwest wind prevails in China, and cold air is the main reason for the occurrence of low temperature, thus it has greater impact in Xinjiang, Qinghai, and Gansu in the northwest; secondly, in spring and autumn, the cold air in the north and the warm and humid air in the south frequently meet, which often leads to low temperature and continuous rainy weather. However, the strong cold air, especially the outbreak of the cold wave, makes the temperature drop sharply, causing damage such as “late spring cold” and frost. Therefore, the risk of freezing damage in Hubei, Guangdong and Hainan is high.
In terms of the probability distribution of comprehensive meteorological damage risk, column (e) of Table 5 shows that the average damage intensity of comprehensive meteorological damage in 31 provinces and municipalities across the country is 21%. The provinces and cities with relatively high-risk probability levels can be categorized into several groups. NeiMenggol (in North China), Gansu, and Shanxi form a small group with the highest risk level. Liaoning, Jilin, Heilongjiang, Qinghai, Ningxia, and Shaanxi, together with Hubei and Hunan, show the group distribution characteristics of “T” shape, with Shaanxi as the connecting point. In the southeast coastal area, the general comprehensive meteorological damage risk level is low, but Hainan’s risk level is a bit high, due to its high freezing damage risk level as mentioned above.

4. Discussion

4.1. Analyzing the Risk Probability from the Perspective of Single Damage Type and Comprehensive Meteorological Damage

Global warming brings a variety of meteorological damage types, including the risk of drought and dry heat on land [23,24], acceleration of global mean ocean circulation [25], strong growth of ocean monsoon rainfall [26], risk of frost [27], etc., which would bring certain negative impacts to local agricultural production or social economic activities [28,29,30]. This study further confirms the above statement. However, it is far from enough to consider only the risks of one or two meteorological damage. Sometimes one type meteorological damage may lead to the other type meteorological damage, such as complex dry heat phenomenon [31] and floods followed by hail or snow damage [32]. Therefore, the risk of drought, floods, untimely rainfall, hail, frost should be considered respectively and comprehensively.
In general, this research emphasizes the risk probability of four major types of meteorological damage (drought, flood, wind and hail, and freezing) and comprehensive meteorological damage—five types in all—in China. The results show that the risk probability of comprehensive meteorological damage is indeed greater than that of single meteorological damage, both from the overall perspective and from the provincial perspective. Therefore, in agricultural production, we need to pay attention to the local dominated single meteorological damage, and more importantly, to invest more efforts to reduce the risk of comprehensive meteorological damage for the prevention of the “1 + 1 > 2” effect.

4.2. Integrate the Level of Damage into a Comprehensive Indicator for Consideration

Nearly all types of meteorological damage bring adverse effects on the growth, harvest, and social economy of local crops, reflected in the number of affected areas or total financial losses [33], or loss of output [34], or one of several damage types [35]. Some scholars proposed to use the area of three types of crop damage caused by natural disasters (damage-affected, damage-stricken, and dead harvest) as the leading indicator for agricultural natural disaster risk assessment and zoning [36].
Inspired by the above scholars, this study calculates the average converted loss proportion (i.e., damage loss intensity, or weight) of damage-affected, damage-stricken and dead harvest based on the affected area of crops under three kinds of damage losses (damage-affected, damage-stricken, and dead harvest), and calculates the risk probability of five damage types in 31 provinces and cities of China.
The results show that, from the national perspective, the average damage loss intensity of comprehensive meteorological damage during the observation period is the highest, followed by drought, flood, wind and hail, and freezing, which is consistent with the research conclusions of most scholars [37,38]. Moreover, Liaoning is close to the Bohai Sea and the Yellow Sea, but it once experienced the most serious drought; Qinghai is a semi-arid region, but it once experienced the most serious flood; Hunan is a subtropical monsoon humid climate, but it once experienced the most serious freezing damage; Shanxi is an arid and semi-arid region, but it once experienced the most serious wind and hail damage. It means that extreme meteorological damage occurred in China in the nearly 40 years from 1980 to 2018, showing the necessity of analyzing the spatiotemporal evolution of meteorological damage in various regions of China.

4.3. Information Diffusion Model and Regional Heterogeneity

The information diffusion model can avoid the irrationality caused by the parameter estimation method’s hasty assumption that the loss rate follows a certain distribution, and can overcome the unsteadiness of the nonparametric kernel density estimation method with small samples [39,40]. Thus, this paper adopts the information diffusion model with small samples, taking the province as unit to obtain accurate risk probability estimation results.
Different from the abnormal meteorological damage (which can be understood as an accidental value) in the history of each province mentioned above, in terms of the estimation of the risk probability (which can be regarded as a universal value) of meteorological damage, we find that, by province, the highest risk probability of floods is in Hubei, drought and comprehensive meteorological damage in NeiMenggol, wind and hail damage in Qinghai, and freezing damage in Hainan. The finding is consistent with the longitude and latitude, geographical location, landform, etc. of each province, which is similar to many scholars’ conclusion that most drought damage in China occur in the north or northwest of the Yellow River; most floods occur in the Yangtze River basin and the south; most comprehensive meteorological damage occur in the west and the northeast [41].
When we focus on a larger area crossing the provincial border, from both the perspective of damage loss intensity in different return periods and from the perspective of risk level, the analysis results indicate that drought, flood, wind and hail, freezing, and comprehensive damage all show regional hierarchical structures with different distributions. China’s grain producing areas are mostly distributed in the central, north, and northeast regions along the Yangtze River valley. Therefore, in order to ensure that food crops are less affected by meteorological damage, the relevant government departments of all provinces need to work together across the border to formulate prevention rules and take corresponding response measures to jointly resist various similar meteorological damage risks.

5. Conclusions

Although many studies have estimated the risk probability of a variety of meteorological damage types on crops, few studies have estimated the risk probability of comprehensive meteorological damage, nor integrated three damage loss levels (damage-affected, damage-stricken and dead harvest) into one indicator for analysis and discussed the integrity and internal heterogeneity of a country/region. Here, we use the data of 31 provinces and cities in China from 1980 to 2018 to calculate the damage loss intensity of five damage types, and then use the nonparametric information diffusion model to obtain accurate risk probability estimation results and analyze the heterogeneity. The results show that the risk probability of comprehensive meteorological damage is the largest in China; the risk probability of drought is the largest among single damage; some provinces like Liaoning, Qinghai, Hunan, and Shanxi, have experienced abnormal meteorological damage in the past 40 years. Influenced by longitude and latitude, geographical location, topography and other factors, some provinces have the greatest risk of meteorological damage, such as floods in Hubei, drought in NeiMenggol, wind and hail in Qinghai and freezing in Hainan. In addition, damage intensity and risk probability in different return periods show a cross-provincial regional and hierarchical nature. Therefore, for China, it is not only necessary to examine the unified laws of the country as a whole to provide an important basis for formulating a unified crop production plan and agricultural insurance policy, but also to consider its internal heterogeneity by region or province, so as to achieve precise governance and take targeted prevention and control measures across regions to ensure China’s food security.
Based on this, this study proposes the following four suggestions. Firstly, for relevant management departments such as the China Meteorological Administration and the Ministry of Agriculture and Rural Affairs nationwide, it is necessary to improve laws and regulations related to agrometeorological damage prevention and control and insurance, establish a unified system of crop meteorological damage risk assessment standards, integrate three types of loss indicators of damage-affected, damage-stricken and dead harvest, and formulate a unified national agricultural production plan and insurance fallback policy. At the same time, relevant Chinese departments at the national level need to improve the regional differentiated agricultural subsidy system based on the spatial distribution characteristics of agricultural risks in each region. Secondly, for relevant government departments at the provincial level, they should take into account regional heterogeneity characteristics and implement targeted measures based on the damage shortcomings of each province. They should provide differentiated damage prevention infrastructure and control plans for specific damage risks such as floods in Hubei, droughts in NeiMenggol, hailstorms in Qinghai, and freezing in Hainan. Focusing on provinces with frequent damage such as Liaoning and Qinghai, we should establish a layered and segmented fine meteorological damage warning and governance mechanism based on the regularity of damage recurrence periods, and implement cross regional precise prevention and control measures. Thirdly, for agricultural producers, it is necessary to actively learn about regional meteorological damage prevention and control knowledge, clarify the main types of damage, risk patterns, and crop damage characteristics in the area, and establish a proactive awareness of damage prevention and reduction. At the same time, optimizing the planting structure and field management methods based on the damage characteristics of the province where it is located, strengthening the management of soil moisture preservation and water-saving irrigation in drought prone areas, improving field drainage facilities in flood prone areas, and enhancing the damage resistance of crops in a targeted manner. Fourthly, for insurance companies, it is necessary to rely on the probability of meteorological damage risks and regional heterogeneity data to establish index-based crop insurance products, develop and optimize comprehensive meteorological damage insurance products that are suitable for the whole country, and customize regional characteristic insurance types based on the exclusive damage risks of each province. To promote to other countries, it is also necessary to combine the above four countermeasures and suggestions, based on the requirements of sustainable agricultural development in each country, adjust production resources according to local conditions, optimize disaster prevention and reduction plans, take into account ecological protection and stable and increased income, and comprehensively consolidate the bottom line of national food security through targeted governance in different regions.
Finally, it should be noted that the global COVID-19 pandemic, which erupted in 2019, may impose significant adverse shocks on agricultural output and obscure the root drivers of yield losses. It is challenging to separate output reductions stemming from natural disasters from those caused by pandemic-related disruptions. Accordingly, this study limits the sample to data spanning up to 2018 to eliminate pandemic-induced confounding biases. Separate in-depth analyses of this pandemic timeframe will be undertaken in follow-up research.

Author Contributions

Conceptualization, W.W.; methodology, W.W. and X.H.; software, X.H. and Y.W.; validation, W.W. and Y.W.; formal analysis, W.W.; investigation, Y.W.; resources, W.W. and C.L.; data curation, X.H. and Y.W.; writing—original draft preparation, W.W.; writing—review and editing, C.L.; visualization, X.H. and Y.W.; supervision, C.L.; project administration, W.W.; funding acquisition, W.W. All authors have read and agreed to the published version of the manuscript.

Funding

This research was funded by “Guangxi College and University One Thousand Young and Middle-Aged Backbone Teachers Cultivation Program” Humanities and Social Sciences Project [Grant ID 2020QGRW016], Guangxi Philosophy and Social Science Research [Grant ID 23QBB006], General Project of Guangxi Natural Science Foundation [Grant ID 2024JJA180051], General Project of Guangxi Natural Science Foundation [Grant ID 2024JJA180046], Innovation Project of Guangxi Minzu University Graduate Education [Grant ID gxun-chxs2024020], Xiangsi Lake Youth Innovation Team Project of Guangxi University for Nationalities [Grant ID 2023GXUNXSHQN02], University-level Scientific Research Project of Guangxi Minzu University [Grant ID 2024MDSKYB15] and University-level Talent Introduction Research Project of Guangxi Minzu University [Grant ID 2023SKQD17].

Institutional Review Board Statement

Not applicable.

Informed Consent Statement

Not applicable.

Data Availability Statement

The data presented in this study are available on request from the corresponding authors.

Conflicts of Interest

The authors declare no conflicts of interest.

References

  1. Eisenstein, M. Natural Solutions for Agricultural Productivity. Nature 2020, 588, S58–S59. [Google Scholar] [CrossRef] [Scilit]
  2. Potop, V.; Türkott, L.; Kožnarová, V.; Možný, M. Drought Episodes in the Czech Republic and Their Potential Effects in Agriculture. Theor. Appl. Climatol. 2010, 99, 373–388. [Google Scholar] [CrossRef] [Scilit]
  3. Andrew, K.; Fabio, C.; Irene, M.; Di Baldassarre, G.; Caldas, A.; Royz, M.; Glasscoe, M.; Ranger, N.; van Aalst, M. Multiform Flood Risk in a Rapidly Changing World: What We Do Not Do, What We Should and Why It Matters. J. Int. Money Financ. 2022, 17, 081001. [Google Scholar] [CrossRef] [Scilit]
  4. Hao, H.H.; Zhu, H.Y.; Wang, F.Q. Regional Agricultural Drought Risk Assessment Based on Attribute Interval Identification: A Study from Zhengzhou, China. Water Supply 2022, 22, 4757–5688. [Google Scholar] [CrossRef] [Scilit]
  5. Zhang, Q.; Wang, Y. Distribution of Hazard and Risk Caused by Agricultural Drought and Flood and Their Correlations in Summer Monsoon–Affected Areas of China. Theor. Appl. Climatol. 2022, 149, 965–981. [Google Scholar] [CrossRef] [Scilit]
  6. Liu, Z.X.; Wang, W.L. Risk Regionalization of Gardenia Loss Caused by Chilling Injury on Flowering Stage: A Case Study of Qichun, Hubei Province. Chin. J. Agric. Resour. Reg. Plan. 2017, 38, 146–150. [Google Scholar]
  7. Chhogyel, N.; Kumar, L. Climate Change and Potential Impacts on Agriculture in Bhutan: A Discussion of Pertinent Issues. Agric. Food Secur. 2018, 7, 79. [Google Scholar] [CrossRef] [Scilit]
  8. Wang, B.; Zheng, J.; Du, Y.D.; Liu, J.L.; Wang, Z.C. Study on the Grade Criterion and Risking Zoning of Rubber Wind Disasters in Guangdong. J. Nat. Disasters 2019, 28, 189–197. [Google Scholar] [CrossRef]
  9. Pei, W.; Tian, C.Z.; Fu, Q.; Ren, Y.; Li, T. Risk Analysis and Influencing Factors of Drought and Flood Disasters in China. Nat. Hazards 2022, 110, 1599–1620. [Google Scholar] [CrossRef] [Scilit]
  10. Zhang, J.W.; Wang, J.G.; Chen, S.B.; Tang, S.Q.; Zhao, W.T. Multi-Hazard Meteorological Disaster Risk Assessment for Agriculture Based on Historical Disaster Data in Jilin Province, China. Sustainability 2022, 14, 7482. [Google Scholar] [CrossRef] [Scilit]
  11. Deng, G.; Wang, A.S.; Zhou, Y.S. Grain Yield Risk Level Calculated by Probability Distribution. J. Nanjing Inst. Meteorol. 2002, 25, 481–488. [Google Scholar]
  12. Sherrick, B.J. Crop Insurance Valuation under Alternative Yield Distributions. Am. J. Agric. Econ. 2004, 86, 406–419. [Google Scholar] [CrossRef] [Scilit]
  13. Goodwin, B.K.; Ker, A.P. Nonparametric Estimation of Crop Insurance Rates Revisited. Am. J. Agric. Econ. 2000, 82, 463–478. [Google Scholar] [CrossRef] [Scilit]
  14. Ganguli, P.; Reddy, M.J. Risk Assessment of Droughts in Gujarat Using Bivariate Copulas. Water Resour. Manag. 2012, 26, 3301–3327. [Google Scholar] [CrossRef] [Scilit]
  15. Weng, B.; Zhang, P.; Li, S. Drought Risk Assessment in China with Different Spatial Scales. Arab. J. Geosci. 2015, 8, 10193–10202. [Google Scholar] [CrossRef] [Scilit]
  16. Mamdani, E.H. Application of Fuzzy Logic to Approximate Reasoning Using Linguistic Synthesis. IEEE Trans. Comput. 1977, 26, 1182–1191. [Google Scholar] [CrossRef] [Scilit]
  17. Yu, X.B.; Li, C.L.; Huo, T.Z.; Ji, Z.H. Information Diffusion Theory-Based Approach for the Risk Assessment of Meteorological Disasters in the Yangtze River Basin. Nat. Hazards 2021, 107, 2337–2362. [Google Scholar] [CrossRef] [Scilit]
  18. Guan, Y.; Liu, J.H.; He, Q.J.; Li, R.C.; Mi, X.Y.; Qin, Z.H. Risk Probability of Heat Injury during Summer Maize Flowering in North China Plain Based on Information Diffusion Theory. Chin. J. Agrometeorol. 2021, 42, 606–615. [Google Scholar] [CrossRef]
  19. Khan, M.T.I.; Anwar, S.; Sarkodie, S.A.; Yaseen, M.R.; Nadeem, A.M.; Ali, Q. Comprehensive Disaster Resilience Index: Pathway towards Risk-Informed Sustainable Development. J. Clean. Prod. 2022, 366, 132937. [Google Scholar] [CrossRef] [Scilit]
  20. Wang, X.Z.; You, Y.S. On the Window-Width in Information Spread Estimation. Sci. Surv. Mapp. 2001, 1, 16–20. [Google Scholar]
  21. Yang, R.H.; Wang, L.H.; Xian, Z.D. An Exponential Analysis on the Crop Productivity Risk and Influencing Factors: Based on the Discussion on the 2nd National Agricultural Census. Insur. Stud. 2009, 10, 102–108. [Google Scholar] [CrossRef]
  22. Anelli, D.; Tajani, F.; Ranieri, R. Urban Resilience against Natural Disasters: Mapping the Risk with an Innovative Indicators-Based Assessment Approach. J. Clean. Prod. 2022, 371, 133496. [Google Scholar] [CrossRef] [Scilit]
  23. Carrão, H.; Naumann, G.; Barbosa, P. Global Projections of Drought Hazard in a Warming Climate: A Prime for Disaster Risk Management. Clim. Dyn. 2018, 50, 2137–2155. [Google Scholar] [CrossRef] [Scilit]
  24. Wang, M.M.; Wang, S.Q.; Zhao, J.; Ju, W.; Hao, Z. Global Positive Gross Primary Productivity Extremes and Climate Contributions During 1982–2016. Sci. Total Environ. 2021, 774, 145703. [Google Scholar] [CrossRef] [Scilit] [PubMed]
  25. Wu, L.X. Acceleration of Global Mean Ocean Circulation under the Climate Warming. Sci. China Earth Sci. 2020, 63, 1039–1040. [Google Scholar] [CrossRef] [Scilit]
  26. Fasullo, J. A Mechanism for Land–Ocean Contrasts in Global Monsoon Trends in a Warming Climate. Clim. Dyn. 2012, 39, 1137–1147. [Google Scholar] [CrossRef] [Scilit]
  27. Masaki, Y. Future Frost Risks in the Tohoku Region of Japan under a Warming Climate—Interpretation of Regional Diversity in Terms of Seasonal Warming. Theor. Appl. Climatol. 2022, 147, 473–485. [Google Scholar] [CrossRef] [Scilit]
  28. Cornwall, W. Europe’s Deadly Floods Leave Scientists Stunned. Science 2021, 373, 372–373. [Google Scholar] [CrossRef] [Scilit] [PubMed]
  29. Shugar, D.H.; Jacquemart, M.; Shean, D.; Bhushan, S.; Upadhyay, K.; Sattar, A.; Schwanghart, W.; McBride, S.; Vries, M.V.W.d.; Mergili, M.; et al. A Massive Rock and Ice Avalanche Caused the 2021 Disaster at Chamoli, Indian Himalaya. Science 2021, 373, 300–306. [Google Scholar] [CrossRef] [Scilit] [PubMed]
  30. Huang, X.Y.; Swain, D.L. Climate Change Is Increasing the Risk of a California Megaflood. Sci. Adv. 2022, 8, 32. [Google Scholar] [CrossRef] [Scilit] [PubMed]
  31. Aghakouchak, A.; Cheng, L.; Mazdiyasni, O.; Farahmand, A. Global Warming and Changes in Risk of Concurrent Climate Extremes: Insights from the 2014 California Drought. Geophys. Res. Lett. 2014, 41, 8847–8852. [Google Scholar] [CrossRef] [Scilit]
  32. Hanak, T.; Korytarova, J. Risk Zoning in the Context of Insurance: Comparison of Flood, Snow Load, Windstorm and Hailstorm. J. Appl. Eng. Sci. 2014, 12, 137–144. [Google Scholar] [CrossRef] [Scilit]
  33. Mahmood, S.; Sajjad, A.; Rahman, A. Cause and Damage Analysis of 2010 Flood Disaster in District Muzaffar Garh, Pakistan. Nat. Hazards 2021, 107, 1681–1692. [Google Scholar] [CrossRef] [Scilit]
  34. Yu, W.D.; Hu, C.D.; Zhang, X.Y.; Wei, W. Risk Division of Spring Frost Damage in Winter Wheat in Henan Province by Quantitative Analysis of Disaster Effects. Meteorol. Environ. Sci. 2017, 40, 1–6. [Google Scholar] [CrossRef]
  35. Ye, M.H.; Hu, Q.K. Regional Correlation of Agricultural Risk and Coordination and Optimization of Agricultural Insurance: Take Flood and Drought Disasters in Major Grain Producing Areas from 1978 to 2009 as an Example. J. Jiangxi Univ. Financ. Econ. 2012, 5, 50–57. [Google Scholar]
  36. Zhang, Q.; Wang, K. Assessment and Regional Planning of Chinese Agricultural Natural Disaster Risks. Chin. J. Agric. Resour. Reg. Plan. 2011, 32, 32–36. [Google Scholar]
  37. Liu, Y.; Yang, Y.; Li, L. Major Natural Disasters and Their Spatio-Temporal Variation in the History of China. J. Geogr. Sci. 2012, 22, 963–976. [Google Scholar] [CrossRef] [Scilit]
  38. Shi, J.; Wen, K.; Cui, L. Distribution and Trend on Consecutive Days of Severe Weathers in China During 1959–2014. J. Geogr. Sci. 2016, 26, 658–672. [Google Scholar] [CrossRef] [Scilit]
  39. Li, W.F. Evaluating Natural Disaster Risks in Rice Production of Hubei Province by Non-Parameter Information Diffusion Model. J. Agro-For. Econ. Manag. 2012, 11, 58–62. [Google Scholar] [CrossRef] [Scilit]
  40. Liu, Y.L.; Zhang, R.Q.; Zhang, X. Evaluation on Vegetables Comprehensive Disaster Risk in Hebei Province: Based on Non-Parametric Information Diffusion Model. Guangdong Agric. Sci. 2014, 41, 197–200. [Google Scholar]
  41. Xie, N.; Xin, J.; Liu, S. China’s Regional Meteorological Disaster Loss Analysis and Evaluation Based on Grey Cluster Model. Nat. Hazards 2014, 71, 1067–1089. [Google Scholar] [CrossRef] [Scilit]
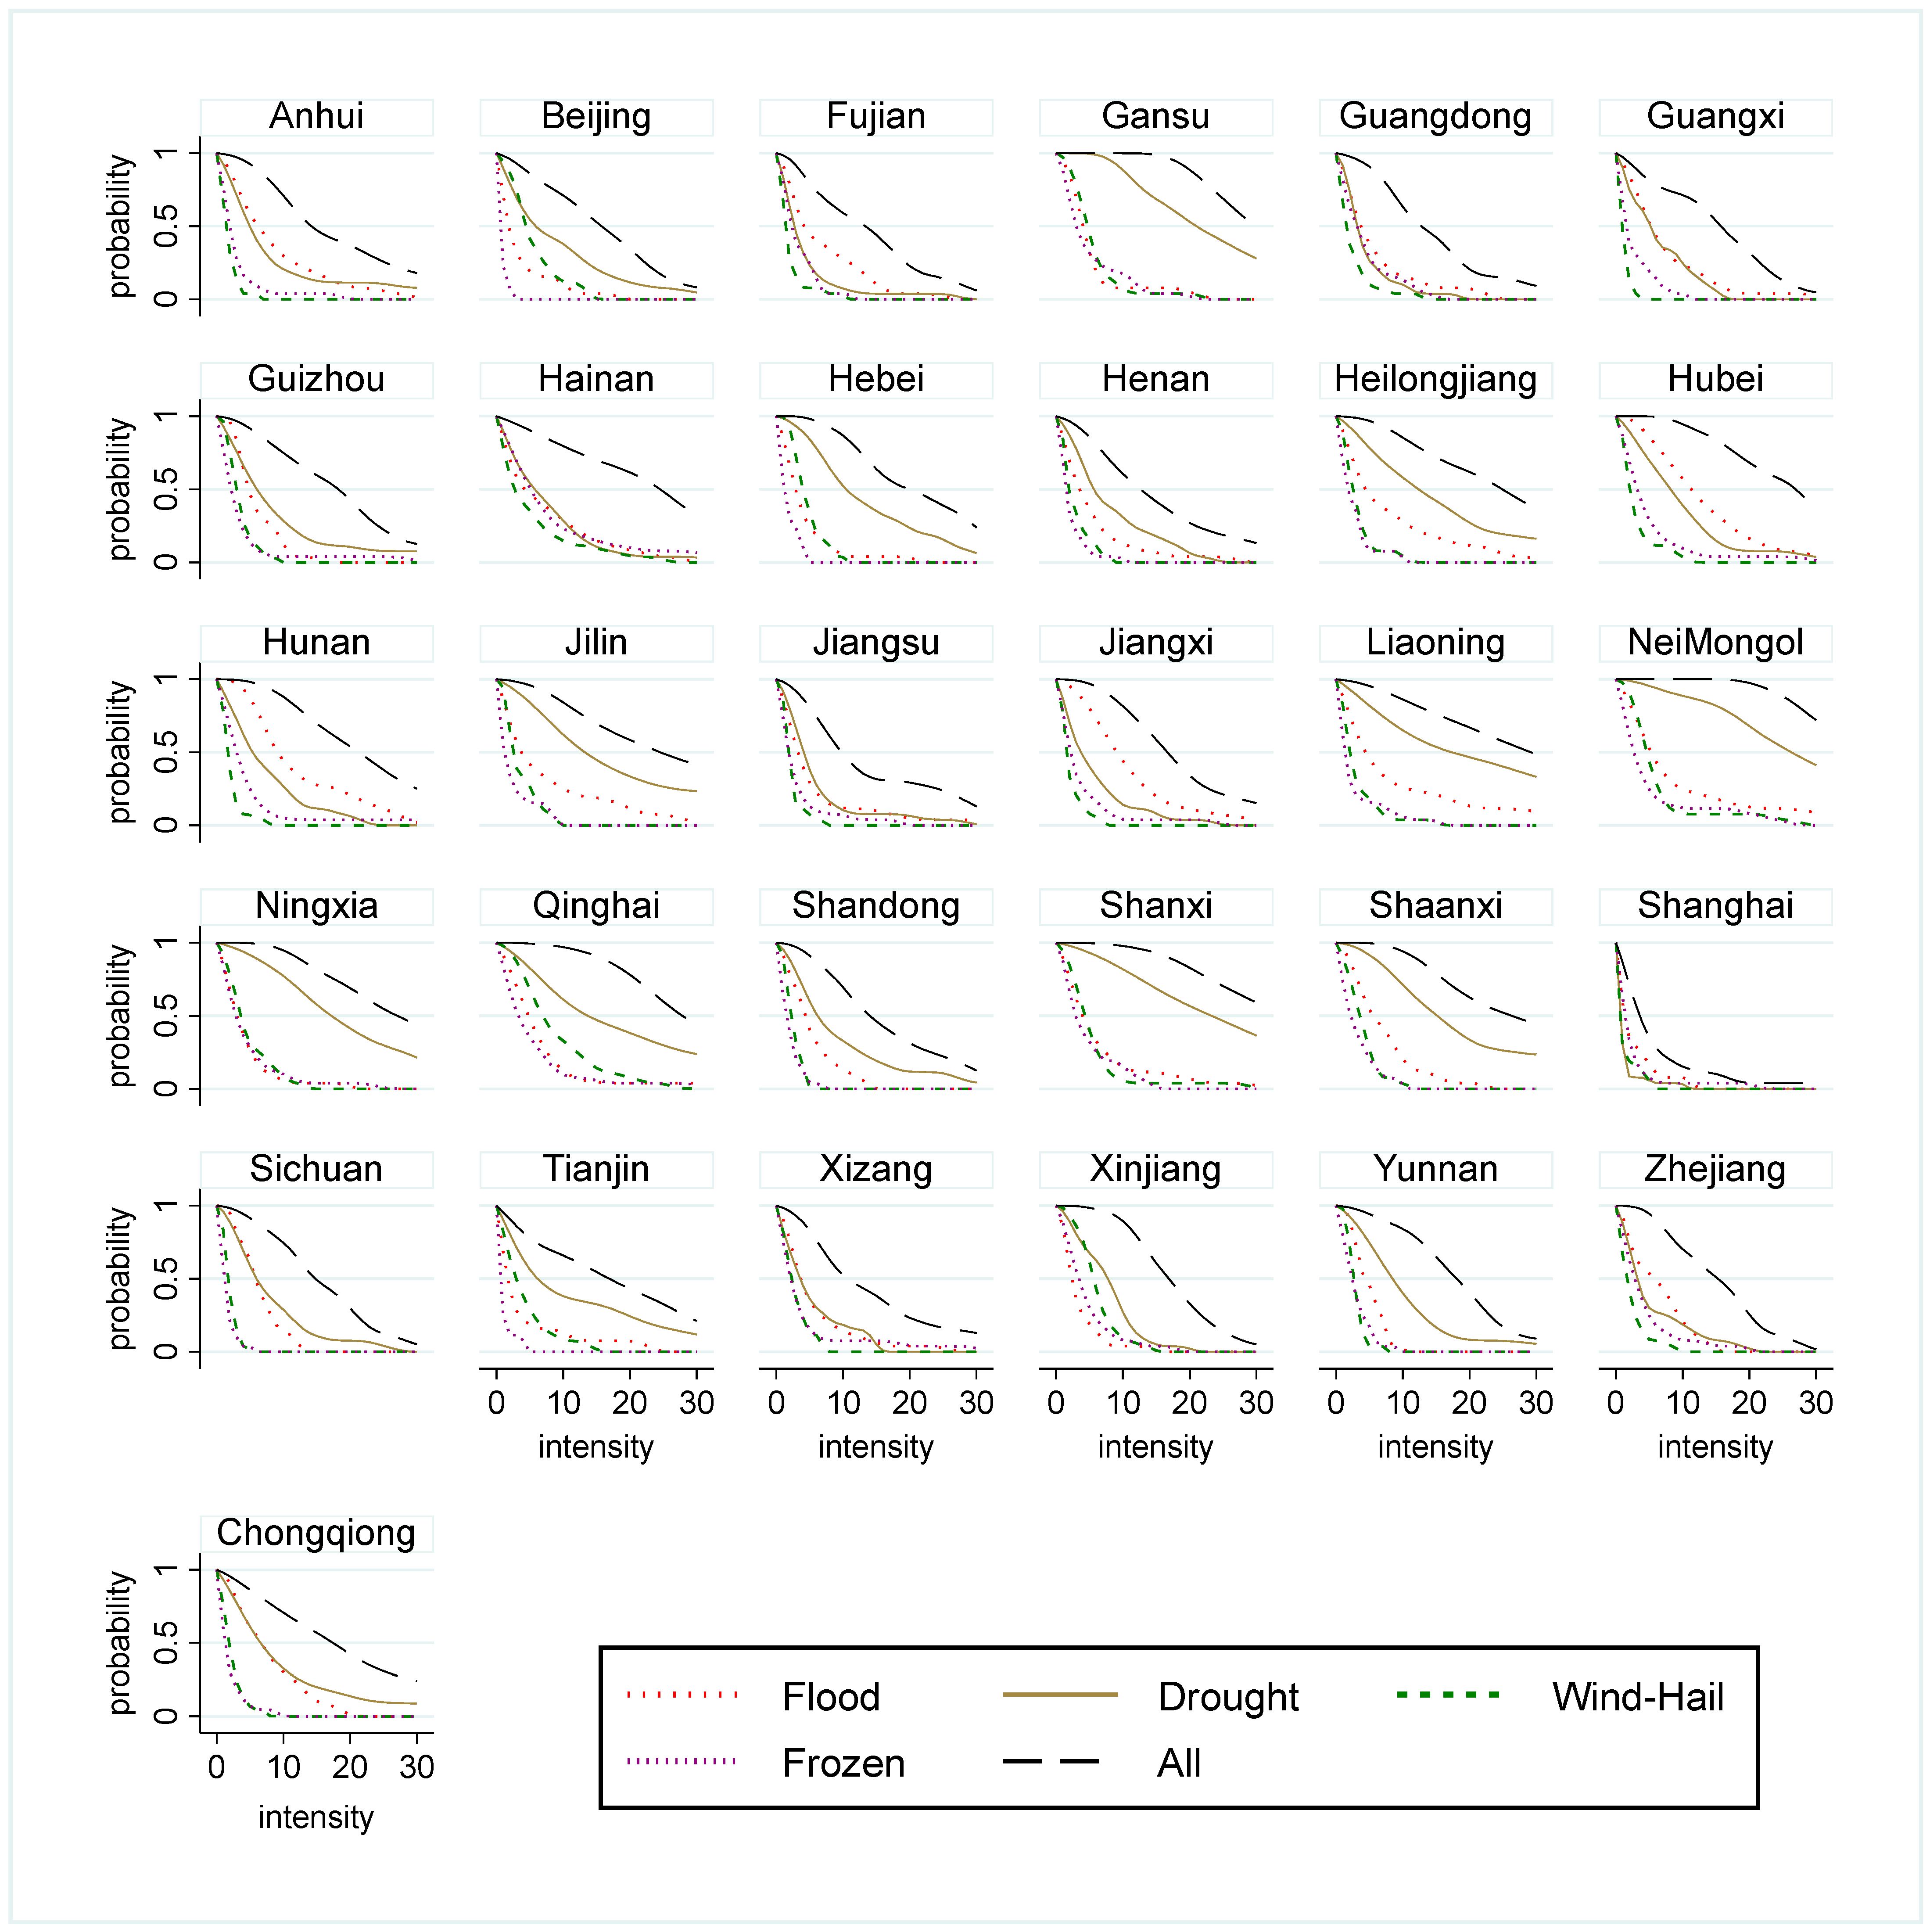
Figure 1. Damage risk probability estimation results of 31 provinces and municipalities in China. Note: The x-axis represents the damage loss intensity, and the y-axis represents the risk probability.
Sustainability 18 07487 g001
Figure 2. Damage intensity of various meteorological damage in 31 provinces and municipalities in China under different risk probabilities.
Sustainability 18 07487 g002aSustainability 18 07487 g002b
Table 1. Description of variables related to probability estimation of damage risk of meteorological damage.
Variable NameVariable SymbolVariable Definition/Description
Total sown area of cropsSTotal sown area of crops
Damage-affected areaHSIncluding flood, drought, wind and hail, and freezing
Damage-affected area of comprehensive meteorological damageHS= Flood-affected area + drought-affected area + wind-and-hail-affected area + freezing-affected area
Damage-stricken areaDSIncluding flood, drought, wind and hail, and freezing
Damage-stricken area of comprehensive meteorological damageDS= Flood-stricken area + drought-stricken area + wind-and-hail-stricken area + freezing-stricken area
Dead harvest areaFSIncluding flood, drought, wind and hail, and freezing
Dead harvest area of comprehensive meteorological damageFS= Dead harvest area of flood + dead harvest area of drought + dead harvest area of wind-and-hail+ dead harvest area of freezing
Damage-affected rateRHSDamage-affected area/total sown area of crops multiplied by 100%, including flood, drought, wind and hail, freezing, and comprehensive meteorological damage
Damage-stricken rateRDS= Damage-stricken area/total sown area of crops multiplied by 100%, including flood, drought, wind and hail, freezing, and comprehensive meteorological damage
Dead harvest rateRFS= Dead harvest area/total sown area of crops multiplied by 100%, including flood, drought, wind and hail, freezing, and comprehensive meteorological damage
Damage intensityIL= The weighted sum of damage-affected rate, damage-stricken rate and dead harvest rate, including flood, drought, wind and hail, freezing, and comprehensive meteorological damage
Damage loss risk probabilityPLThe estimated results, including flood, drought, wind and hail, freezing, and comprehensive meteorological damage
Note: Table 1 demonstrates notation and algorithm descriptions for the 12 related variables used in this article. For example, the variable name of “Total sown area of crops” is marked as “S”, which directly uses the data of China’s national statistics. The variable name of “Damage-affected area of comprehensive meteorological damage” is marked as “HS”, which is equal to the sum of the affected area of flood, drought, wind-and-hail and freezing damage.
Table 2. Calculation table of loss equivalent to damage-affected, damage-stricken, and dead harvest.
ItemFloodDroughtWind and HailFreezingComprehensive Meteorological Damage
Dead harvest area (million hectares)45.1157.7813.7612.08129.45
Damage-stricken area (million hectares)228.16428.5886.6959.47815.24
Damage-affected area (million hectares)415.66831.68167.62128.941579.28
Area of production reduced by 30–80% (million hectares)183.05370.8172.9347.39685.79
Area of production reduced by 10–30% (million hectares)187.50403.1080.9369.47764.04
Dead harvest equivalent loss (million hectares)40.6052.0012.3910.87116.51
Damage-stricken equivalent loss (million hectares)141.28255.9452.5036.94493.69
Damage-affected equivalent loss (million hectares)178.78336.5668.6850.83646.50
Proportion of dead harvest equivalent loss0.900.900.900.900.90
Proportion of damage-stricken equivalent loss 0.620.600.610.620.61
Proportion of damage-affected equivalent loss 0.430.400.410.390.41
Note: Table 2 shows the statistical data of damaged crop area (low-loss damage, mid-loss damage and dead harvest) of five damage types (flood, drought, wind and hail, freezing and comprehensive meteorological damage) in China from 1980 to 2018, and the corresponding proportion of harvest reduced losses calculated according to Formula (12). Dead harvest area is equivalent to the loss of 90% of the average value; the area of production reduced by 30–80% is equivalent to the loss of 55% of the average value; the area of production reduced by 10–30% is equivalent to the loss of 20% of the average value.
Table 3. Descriptive statistics of damage intensity of three damage categories in 31 provinces and municipalities in China.
Province and
Municipality
Flood Damage IntensityDrought Damage IntensityWind and Hail Damage Intensity
Bandwidth (‱)Max
(%)
Mean (%)Bandwidth (‱)Max
(%)
Mean (%)Bandwidth (‱)Max
(%)
Mean (%)
Beijing10117.762.7720636.268.417713.624.94
Tianjin13022.873.0531054.5811.018214.403.53
Hebei11620.483.4217131.2312.80509.984.03
Shanxi16829.815.5340472.7726.4815628.434.77
NeiMenggol26848.078.5332361.0428.4414427.175.62
Liaoning24543.318.0551891.1522.138314.642.52
Jilin16629.566.7044277.8020.26498.552.95
Heilongjiang17030.227.1623841.8514.885810.772.64
Shanghai6511.372.035710.020.65284.890.80
Jiangsu18532.514.5916028.315.11376.601.69
Zhejiang7714.255.6511219.674.72498.671.76
Anhui16128.848.0020736.597.50346.021.26
Fujian13824.646.2215126.693.43559.701.46
Jiangxi27350.2810.9013223.174.86376.531.63
Shandong7613.364.6618633.498.80234.372.00
Henan15026.564.5213123.127.47437.742.21
Hubei16331.5812.2617931.658.975810.462.43
Hunan14829.4511.7012421.896.61417.331.53
Guangdong12722.665.1710218.053.877012.321.86
Guangxi17030.406.648815.575.73173.080.73
Hainan15727.726.5217931.496.7913924.444.37
Chongqing11818.766.4230845.477.64476.971.54
Sichuan6412.555.7514526.227.39244.501.46
Guizhou7214.395.3521237.368.19468.642.89
Yunnan479.464.3228149.8210.08366.952.35
Xizang14225.374.878314.634.64376.562.29
Shaanxi11821.876.4025448.0118.835810.463.35
Gansu12221.784.6323248.7522.7611521.384.99
Qinghai31855.965.8245880.9919.5614125.888.25
Ningxia11019.423.4828049.7919.007012.754.05
Xinjiang7813.932.7111019.737.077414.035.50
Nationwide-55.965.93-91.1511.10-28.432.95
Note: Table 3 reports the damage loss intensity of three damage types in China’s 31 provinces over the years calculated according to Formula (12), which is used as the input variable for information diffusion risk probability estimation, and the bandwidth of diffusion estimation calculated according to Formula (6).
Table 4. Descriptive statistics of damage intensity of two damage categories in 31 provinces and municipalities in China.
Province and
Municipality
Freezing Damage IntensityComprehensive Meteorological Damage Intensity
Bandwidth (‱)Max (%)Mean (%)Bandwidth (‱)Max (%)Mean (%)
Beijing101.740.2825345.6015.87
Tianjin233.970.5631855.9018.07
Hebei234.031.2317436.0920.42
Shanxi8014.054.0040079.8336.57
NeiMenggol14425.384.2725865.0241.16
Liaoning8615.071.9948992.3132.15
Jilin508.841.8642780.9830.06
Heilongjiang549.482.0532763.3025.17
Shanghai11620.481.5117831.394.95
Jiangsu10218.052.3318934.2813.41
Zhejiang11119.463.4714629.1014.70
Anhui10318.102.2427051.0918.19
Fujian6110.892.6618033.5513.35
Jiangxi13623.862.7831863.1118.97
Shandong376.461.5022242.6516.22
Henan559.641.5925345.5614.90
Hubei16228.674.0322948.8825.79
Hunan23240.813.5226953.2922.23
Guangdong8314.723.7419636.0814.27
Guangxi6010.512.1524143.8115.08
Hainan23040.407.3442675.0524.91
Chongqing588.561.3231848.7316.41
Sichuan295.221.0317532.8515.18
Guizhou16428.872.4524646.6818.09
Yunnan508.782.3727852.6018.42
Xizang17130.142.8822840.7413.91
Shaanxi569.872.5525753.5228.97
Gansu11219.684.3222956.1833.24
Qinghai17130.114.2845188.6433.47
Ningxia13323.473.7027757.2427.89
Xinjiang9917.463.8820941.8917.43
Nationwide-40.812.70-92.3121.27
Note: Table 4 reports the damage loss intensity of two damage types in China’s 31 provinces over the years calculated according to Formula (12), which is used as the input variable for information diffusion risk probability estimation, and the bandwidth of diffusion estimation calculated according to Formula (6).
Table 5. Regional differences of various meteorological damage risk levels in 31 provinces and municipalities in China under the national average damage intensity.
Different Return Periods(a)(b)(c) (d) (e)
Flood (Average Damage Intensity Is 6%)Drought (Average Damage Intensity Is 11%)Wind and Hail (Average Damage Intensity Is 3%)Freezing (Average Damage Intensity Is 3%)Comprehensive Meteorological Damage (Average Damage Intensity Is 21%)
<1/5Xinjiang, Gansu, Ningxia, Beijing, Tianjin, Hebei, and ShanghaiXinjiang, Xizang, Jiangsu, Shanghai, Zhejiang, Fujian, Guangdong, Guangxi, Anhui, JiangxiSichuan, Guangxi, Hunan, Fujian, Anhui, Jiangsu, ShanghaiSichuan, Chongqing, Shanghai, Shandong, Beijign, TianjinShanghai, Fujian, Guangdong
Once in 5 yearsGuangdong, Yunnan, Xizang, Henan, Shanxi, Jiangsu, and ShandongSichuan, Chongqing, Guizhou, Hunan, Henan, Shandong, HainanChongqing, Hubei, Jiangxi, Zhejiang, Guangdong, Shandong, LiaoningGuangxi, Anhui, Henan, Jiangsu, Hebei, Liaonign, JilinBeijing, Shandong, Henan, Jiangsu, Zhejiang, Jiangxi, Guangxi, Sichuan, Xizang, Xinjiang
Once in 3 yearsHainan, Guangxi, Guizhou, Sichuan, Qinghai, Shaanxi, NeiMenggol, Liaoning, Jilin, Heilongjiang, Zhejiang, and FujianYunnan, Hubei, Beijing, Tianjin, HebeiXizang, Yunnan, Guizhou, Hainan, Henan, Jilin, HeilongjiangXizang, Yunnan, Guizhou, Hunna, Jiangxi, Fujian, Zhejang, Heilongjiang, Ningxia, NeiMenggol, Shananxi, ShanxiHebei, Tianjin, Anhui, Chongqing, Guizhou, Yunnan
Once in 2 yearsJiangxi, Anhui, ChongqingQinghai, Ningxia, Shaanxi, Liaoning, Jilin, HeilongjiangNingxia, Shaanxi, Shanxi, Hebei, TianjinXinjiang, Qinghai, Gansu, Hubei, Guangdong, HainanHeilongjiang, Jilin, Liaoning, Shananxi, Hubei, Hunan, Hainan, Qinghai
>3/4Hunan, HubeiGansu, NeiMenggol, ShanxiXinjiang, Qinghai, Gansu, NeiMenggol, Beijing-NeiMenggol, Shanxi, Gansu, Ningxia
Disclaimer/Publisher’s Note: The statements, opinions and data contained in all publications are solely those of the individual author(s) and contributor(s) and not of MDPI and/or the editor(s). MDPI and/or the editor(s) disclaim responsibility for any injury to people or property resulting from any ideas, methods, instructions or products referred to in the content.