Article

Recycling Fruit and Vegetable Wastes into Fermentation Broths and Effects of Their Application on Soil Properties and Crop Growth


1
School of Environmental and Chemical Engineering, Shanghai University, Shanghai 200444, China
2
Shanghai Key Laboratory of Bio-Energy Crops, School of Life Sciences, Shanghai University, Shanghai 200444, China
*
Author to whom correspondence should be addressed.
Sustainability 2026, 18(14), 7369; https://doi.org/10.3390/su18147369
Submission received: 20 June 2026 / Revised: 14 July 2026 / Accepted: 17 July 2026 / Published: 19 July 2026
(This article belongs to the Special Issue Soil Health and Sustainable Society)

Abstract

Fruit and vegetable wastes can be recycled into value-added fermentation broths (FBs) through anaerobic fermentation, but the characteristics of FBs and the effects on soil ecological processes remain insufficiently understood. This study analyzed FBs produced from 14 wastes and selected five FBs (garlic, tomato, sweet potato, apple, and lettuce) for pot experiments. The results showed significant differences among the FBs in nutrients, enzymes, and microbial communities. Garlic FB had the highest concentrations of ammonium nitrogen (309.81 mg/L), total phosphorus (327.73 mg/L), total potassium (1365.8 mg/L), and organic matter (28.99 g/L), along with the highest activity of acid phosphatase, urease, protease, and catalase (p < 0.05). FB application improved soil nutrient availability and enzyme activities, with garlic FB showing the strongest effects, increasing catalase, urease, acid phosphatase, and β-glucosidase by 83.34%, 180.72%, 112.34%, and 21.95%, respectively. Metagenomic analysis revealed that the soil treated with garlic FB contained beneficial taxa, including Saprospiraceae, Chitinophagaceae, Azotobacter, and Sphingomonas, which are associated with enzyme production and organic matter decomposition. Furthermore, the application of FBs reduced the incidence of downy mildew and leaf spot and promoted the growth of Brassica chinensis. Though chemical fertilizer produced the highest biomass due to immediate nutrient availability, the FB treatments, especially garlic FB, showed advantages concerning soil health, disease suppression, and sustainability, highlighting their potential for organic waste recycling and sustainable agriculture.

1. Introduction

The rapid expansion of fruit and vegetable production has significantly improved global food security; however, it has also generated a large amount of agricultural waste throughout the harvesting, transportation, processing, and marketing stages [1]. It is estimated that nearly one-third of fruit and vegetable products are lost or discarded before consumption, resulting in considerable waste of biomass resources and environmental burdens [2]. These residues contain abundant organic carbon, nitrogen, phosphorus, potassium, soluble sugars, phenolic compounds, and other bioactive substances, making them valuable feedstocks for resource recovery and circular agriculture [3].
In recent years, the technology of microbial fermentation-based bioconversion has attracted considerable attention as a sustainable approach for the valorization of agricultural wastes. During anaerobic fermentation, fruit and vegetable residues supplemented with carbon sources can be transformed into liquid products containing organic acids, soluble nutrients, extracellular enzymes, and diverse microbial communities. In China, these fermentation products are commonly called fermentation broths (FBs) [4]. The application of FBs can enhance nutrient uptake, improve crop yield and quality, and increase agricultural productivity [5,6,7]. In addition, the phenolic compounds and organic acids present in the FBs may regulate plant redox homeostasis and contribute to improved tolerance to environmental stresses [8]. The FBs are also enriched with hydrolytic enzymes, including proteases, cellulases, and phosphatases, which may facilitate organic matter decomposition and nutrient transformation, thereby contributing to soil nutrient cycling processes [9].
The application of FBs increases the content of organic matter, improves pH and salinity conditions, and enhances nutrient availability in the soil [10]. Furthermore, the FBs may influence soil ecological functions through modifications in the microbial community structure and enzyme activity. However, current studies primarily focus on FBs from the perspective of individual substrates or specific agronomic responses, while systematic comparisons of the physicochemical properties, enzymatic characteristics, and microbial community structures of FBs derived from different fruit and vegetable substrates remain scarce. Moreover, the mechanisms underlying the interactions among the physicochemical properties and microbial communities in soil and crop growth following FB application are still poorly understood. Variations in substrate composition may lead to substantial differences in microbial succession, metabolic pathways, and functional gene expression during fermentation, ultimately affecting the characteristics of FBs and their ecological functions after soil application. Nevertheless, experimental evidence supporting these relationships remains limited.
Understanding how the substrate-dependent characteristics of FBs affect soil–microbe–plant interactions is essential for optimizing the agricultural utilization of fruit and vegetable wastes. Therefore, this study selected 14 common fruit and vegetable wastes as fermentation substrates and systematically analyzed the nutrient contents, enzyme activities, and microbial community structures of the resulting FBs. Pot experiments were subsequently conducted to evaluate the effects of the application of the FBs on the nutrient status, enzyme activities and microbial communities in the soil, growth performance of Brassica chinensis, and disease incidence. The objectives of this study are to compare the physicochemical and microbiological characteristics of the FBs derived from different fruit and vegetable substrates; to evaluate their effects on soil fertility, enzyme activities, and microbial community structure; and to elucidate the potential mechanisms linking FB application, soil ecological functions, and crop growth.

2. Materials and Methods

2.1. Preparation of FBs

Fourteen fresh fruit and vegetable substrates were selected to produce FBs. They represented a wide diversity of waste types commonly generated in food systems, including root vegetables (garlic, onion, ginger, carrot and sweet potato), leafy vegetables (lettuce), fruit vegetables (tomato, pumpkin and chili pepper), and fruits (apple, persimmon, pear, dragon fruit and banana). After washing, the substrates were cut into small pieces several centimeters in diameter and used for fermentation.
For the FBs, 210 g of chopped substrate, 70 g brown sugar and 0.7 L deionized water (Sichuan Ulupure Technology Co., Ltd., Chengdu, China) were placed into a 2 L black fermentation container (Huapu Container Co., Ltd., Changzhou, China). The ratio of substrate, brown sugar and water was roughly 3:1:10. Each substrate was fermented using three replicated containers. The mixture was thoroughly stirred and sealed for anaerobic fermentation at room temperature (25 °C) for 90 days. During the first month, the containers, fitted with gas-release valves, were vented to release accumulated gas every seven days. After fermentation, the liquid fractions were filtered through four layers of gauze (Jiangsu Hengrui Medical Products Co., Ltd., Nantong, China) and collected as FBs.

2.2. Pot Experiments

After comparison of the nutrient contents, enzyme activities, and microbial community characteristics among the 14 FBs, the five FBs from garlic, tomato, sweet potato, lettuce and apple were selected for pot experiments because they were the most common and exhibited high concentrations of ammonium nitrogen. Moreover, the tomato FB had antimicrobial potential [8].
The soil used for the pot experiments was collected from the surface layer (0–20 cm) of an agricultural field located near the Baoshan Campus of Shanghai University, Shanghai, Southeast China. The soil was classified as a fluvo-aquic soil developed from coastal alluvial parent material. The basic physicochemical properties of the soil were as follows: pH 6.92, soil organic matter (SOM) 19.95 g/kg, total nitrogen (TN) 1.92 g/kg, alkali-hydrolyzable nitrogen (AmN) 145.16 mg/kg, total phosphorus (TP) 1.31 g/kg, available phosphorus (AvP) 32.52 mg/kg, and available potassium (AK) 43.30 mg/kg. The soil was air-dried, passed through a 2 mm sieve, and was put into pots at a rate of 4.5 kg dry soil per pot. Each pot was 2 L in volume.
Both the pot experiments were conducted on a well-ventilated balcony of a building under natural light conditions. The first pot experiment was conducted from 2 June to 23 July 2024. Owing to prolonged high-temperature conditions and associated heat stress during the summer season, the experiment was suspended earlier than initially planned. The second pot experiment took place from 12 August 2024 to 2 December 2024.
Brassica chinensis was used as the test crop. Seeds were surface-sterilized with 1% sodium hypochlorite solution and germinated in seedling trays (Taizhou Junsu Packaging Technology Co., Ltd., Taizhou, China). When seedlings reached the four-leaf stage, healthy and uniform plants without visible symptoms were transplanted into pots, with one plant per pot. Afterwards, seedlings were allowed to acclimate for five days. The successful establishment of seedlings was confirmed when new leaves were fully expanded and leaf color returned to normal green. Treatments were applied on the day following the acclimation.
Seven treatments were established, including the applications of the FBs derived from garlic (GA), tomato (TO), sweet potato (SP), apple (AP) and lettuce (LE), as well as chemical fertilizer solution (CF) and deionized water (CK). Each treatment consisted of three replicates, resulting in a total of 21 pots, which were placed randomly.
The FB solutions for the treatments were prepared by diluting the original fermentation liquid 50-fold with water [11]. For the CF treatment, 1 g of compound fertilizer (N–P2O5–K2O = 20%–20%–20%, Stanley Agriculture Group Co., Ltd., Linyi, China) was diluted 2000-fold according to the fertilizer requirements of protected vegetable cultivation [12]. The fertilizer application rate was designed based on conventional greenhouse vegetable production practices.
During the growing period, the solutions of all the treatments and CK were watered on the pot soil every four days, with a total application volume of 100 mL per pot each time [9]. A total of 16 applications were performed during the entire growth cycle.
Due to the significant differences in the contents of nutrients and organic matter of different substrate FBs, it was difficult to achieve complete nutrient equivalence per pot across the different treatments. The amount of nutrient inputs was controlled within a certain range. For the different treatments, the total input of AmN ranged from 3.6 to 9.9 mg per pot, the total input of TK from 26.2 to 43.7 mg per pot, the total input of TP from 0.4 to 10.5 mg per pot, and the total input of OM from 0.4 to 0.9 mg per pot.

2.3. Plant Growth Assessment and Sample Collection

During the first pot experiment, plant height, leaf number, leaf width, and other growth parameters were recorded on 14 June, 26 June, 8 July, and 21 July 2024. Soil samples were collected at the end of the experiment.
During the second pot experiment, plant growth parameters were recorded on 12 October, 21 October, 29 October, 8 November, 20 November, and 29 November 2024. After three months of growth, plants were harvested and carefully washed to remove adhering soil. Fresh biomass was measured immediately. Roots and shoots were separated for the determination of biochemical characteristics. Soil samples were collected after harvest for metagenomic and other chemical analyses. During the cultivation period, the incidence of pests and diseases was monitored. Aphid infestation was assessed by examining the upper three young leaves of each plant and counting both adult and nymph aphids on both leaf surfaces. Plants with ≥10 aphids were considered infested. The incidence of downy mildew was checked and recorded when the lesions covered more than one-third of a leaf area or when at least two diseased leaves were observed per plant. The incidence of leaf spot was investigated and recorded when at least three characteristic brown circular lesions (>2 mm in diameter) were observed on a single plant.

2.4. Analytical Methods

FB Analysis: Ammonium nitrogen (AmN) was determined by the indophenol blue colorimetric method. Total nitrogen (TN) was determined using the alkaline potassium persulfate digestion–ultraviolet colorimetric method. pH was measured using a glass electrode (Shanghai Sanxin Peirui Instrument Technology Co., Ltd., Shanghai, China). Total phosphorus (TP) was determined using the alkaline potassium persulfate digestion–molybdenum blue colorimetric method after potassium persulfate digestion. Dissolved total phosphorus (DTP) was also measured by the molybdenum blue colorimetric method after the original FB liquid was filtered by filter paper. Total potassium (TK) was determined by the alkaline potassium persulfate digestion–inductively coupled plasma optical emission spectrometry (ICP-OES, LabTech Co., Ltd., Beijing, China) method. Organic matter (OM) content was measured using the potassium dichromate–sulfuric acid oxidation method [13].
Soil Nutrient Analysis: Total nitrogen (TN) was determined using the sulfuric acid–copper sulfate–selenium digestion and distillation method. Alkali-hydrolyzable nitrogen (AN) was measured by the alkali diffusion method. Total phosphorus (TP) was determined by the acid digestion–molybdenum blue colorimetric method. Available phosphorus (AvP) was determined by the sodium bicarbonate extraction–molybdenum blue colorimetric method. Total potassium (TK) was measured using ICP-OES after acid digestion. Available potassium (AK) was measured by the water extraction–ICP-OES method. Soil organic matter (SOM) was determined using the potassium dichromate–sulfuric acid oxidation method [14].
Enzyme Activity Determination: Acid phosphatase (ACP) activity was determined using disodium p-nitrophenyl phosphate as substrate. Protease (PRT) activity was measured by the Folin–phenol method. Urease (URE) activity was determined using the phenol–sodium hypochlorite colorimetric method. Catalase (CAT) activity was measured by potassium permanganate titration. Amylase (AMY) activity was determined according to the manufacturer’s protocol provided with the commercial assay kit (Catalog No. BC0615, Beijing Solarbio Science & Technology Co., Ltd., Beijing, China). Cellulase (CEL) activity was measured using the 3,5-dinitrosalicylic acid (DNS) method. β-glucosidase (β-Glu) activity was determined using the p-nitrophenol method. The bacterial and fungal abundances in the FBs were quantified by plate counting [15].
Plant Physiological Parameter Measurement: The content of soluble protein in the leaves was measured using the Coomassie Brilliant Blue G-250 method, soluble sugar using the anthrone colorimetric method, and chlorophyll using the acetone extraction spectrophotometric method [16]. All measurements were performed in triplicate.
Metagenomic Analysis of FBs: 20 mL of FB liquid was filtered to remove coarse particles and then centrifuged at 4000× g for 15 min at 4 °C. The resulting pellets were collected and stored at −80 °C until DNA extraction. Metagenomic sequencing was performed on an Illumina NovaSeq 6000 platform (PE150) at Majorbio Bio-Pharm Technology Co., Ltd. (Shanghai, China), generating an average of 7.4 Gb raw data per sample. Raw reads were quality-filtered using fastp (v0.23.0) and assembled with MEGAHIT (v1.2.9) [17]. ORFs were predicted using Prodigal (v2.6.3), and a non-redundant gene catalog was constructed with CD-HIT (v4.6.1). Functional annotation was performed against the KEGG database (release 2023.08.30) using DIAMOND (v2.0.13, E-value ≤ 1 × 10⁻⁵) and taxonomic annotation against the NR database. Gene abundances were normalized as CPM. Differential taxa were identified using LEfSe (Linear Discriminant Analysis Effect Size) (p < 0.05, LDA > 3.0) [18]. The raw sequencing data have been deposited in the NCBI SRA under BioProject accession number PRJNA1492194.
Soil Microbial Community Analysis: Soil bacterial communities were characterized by 16S rRNA gene amplicon sequencing (V3-V4 region) on an Illumina Novaseq platform. Sequences were processed using the QIIME2 pipeline with DADA2 for amplicon sequence variant (ASV) calling. Taxonomic assignment was performed against the Silva database. Alpha and beta diversity analyses were conducted based on ASV abundance. LEfSe was used to identify differentially abundant taxa between treatments (p < 0.05, LDA > 3.0) [18]. All inorganic and organic chemical reagents used in this study were purchased from Sinopharm Chemical Reagent Co., Ltd., Shanghai, China.

2.5. Statistical Analysis

All statistical analyses were based on the complete dataset from the pot experiments. Data were analyzed using IBM SPSS Statistics 26.0 (IBM Corp., Armonk, NY, USA). One-way analysis of variance (ANOVA) followed by Duncan’s multiple range test was used to determine significant differences among the treatments at p < 0.05. All data are presented as mean ± standard error (SE) unless otherwise indicated. All measurements were performed in triplicate (n = 3). Principal coordinate analysis (PCoA) based on Bray–Curtis dissimilarity and PERMANOVA (999 permutations) were performed using the vegan package to test microbial community differences. Pearson’s correlation analysis was used to evaluate relationships between soil properties, enzyme activities, and plant growth indices, with FDR correction for multiple comparisons.

3. Results

3.1. Characteristics of FBs

After three months of anaerobic fermentation, all the substrates released an alcoholic and fermented aroma. The average concentrations of AmN, TP, DTP, and TK in the 14 FBs were 26.23, 98.33, 55.43, and 983.16 mg/L, respectively (Table 1). However, considerable differences in nutrient contents were observed among the different substrate FBs. The garlic FB exhibited the highest concentrations of AmN, TP, DTP, and TK, with average values of 309.81, 327.73, 236.34, and 1365.8 mg/L, respectively, all of which were significantly higher than those of the other FBs (p < 0.05). In particular, the AmN concentration in the garlic FB was 1.67–31.41 times higher than in the other FBs.
Substantial differences in enzyme activities were also detected among the FBs derived from different substrates (Table 2). The garlic FB exhibited the highest activities of ACP, URE, CAT, and PRT, reaching 358.38 mg/mL/h, 95.26 U/mL, 5.51 U/mL, and 2.36 U/mL, respectively, which were significantly greater than those of all the other FBs (p < 0.05). In contrast, the sweet potato FB showed the highest AMY activity (96.55 U/mL), whereas the apple and persimmon FBs exhibited the highest CEL activities, reaching 89.08 and 86.99 U/mL, respectively.
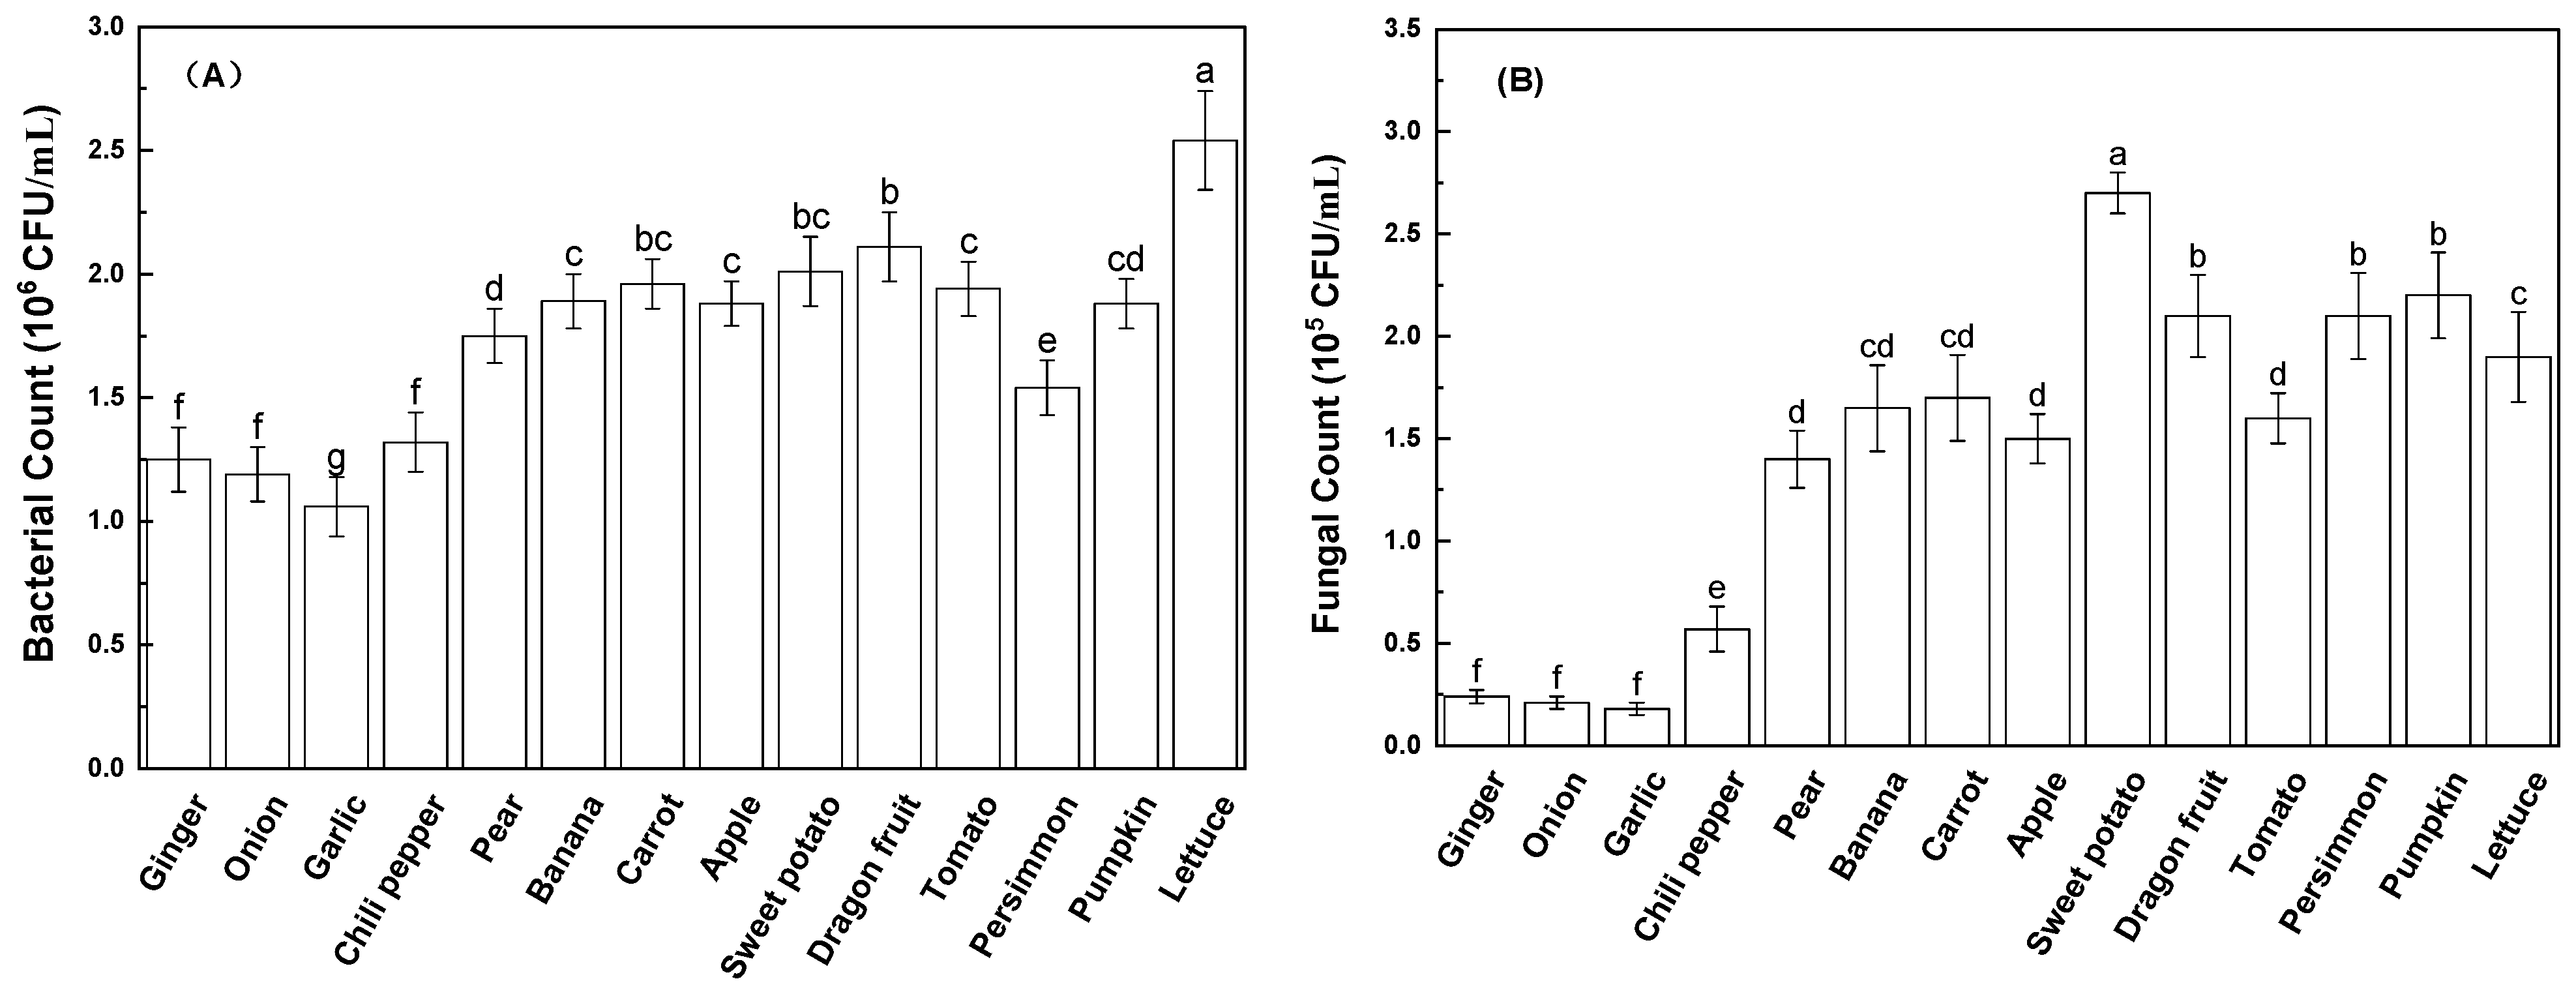
The abundance of bacteria in all the FBs was approximately one order of magnitude greater than that of fungi (Figure 1). Significant differences in microbial abundance were observed among the FBs from the different substrates. The FBs derived from garlic, onion, ginger, and chili contained significantly lower bacterial and fungal populations than the others (p < 0.05).
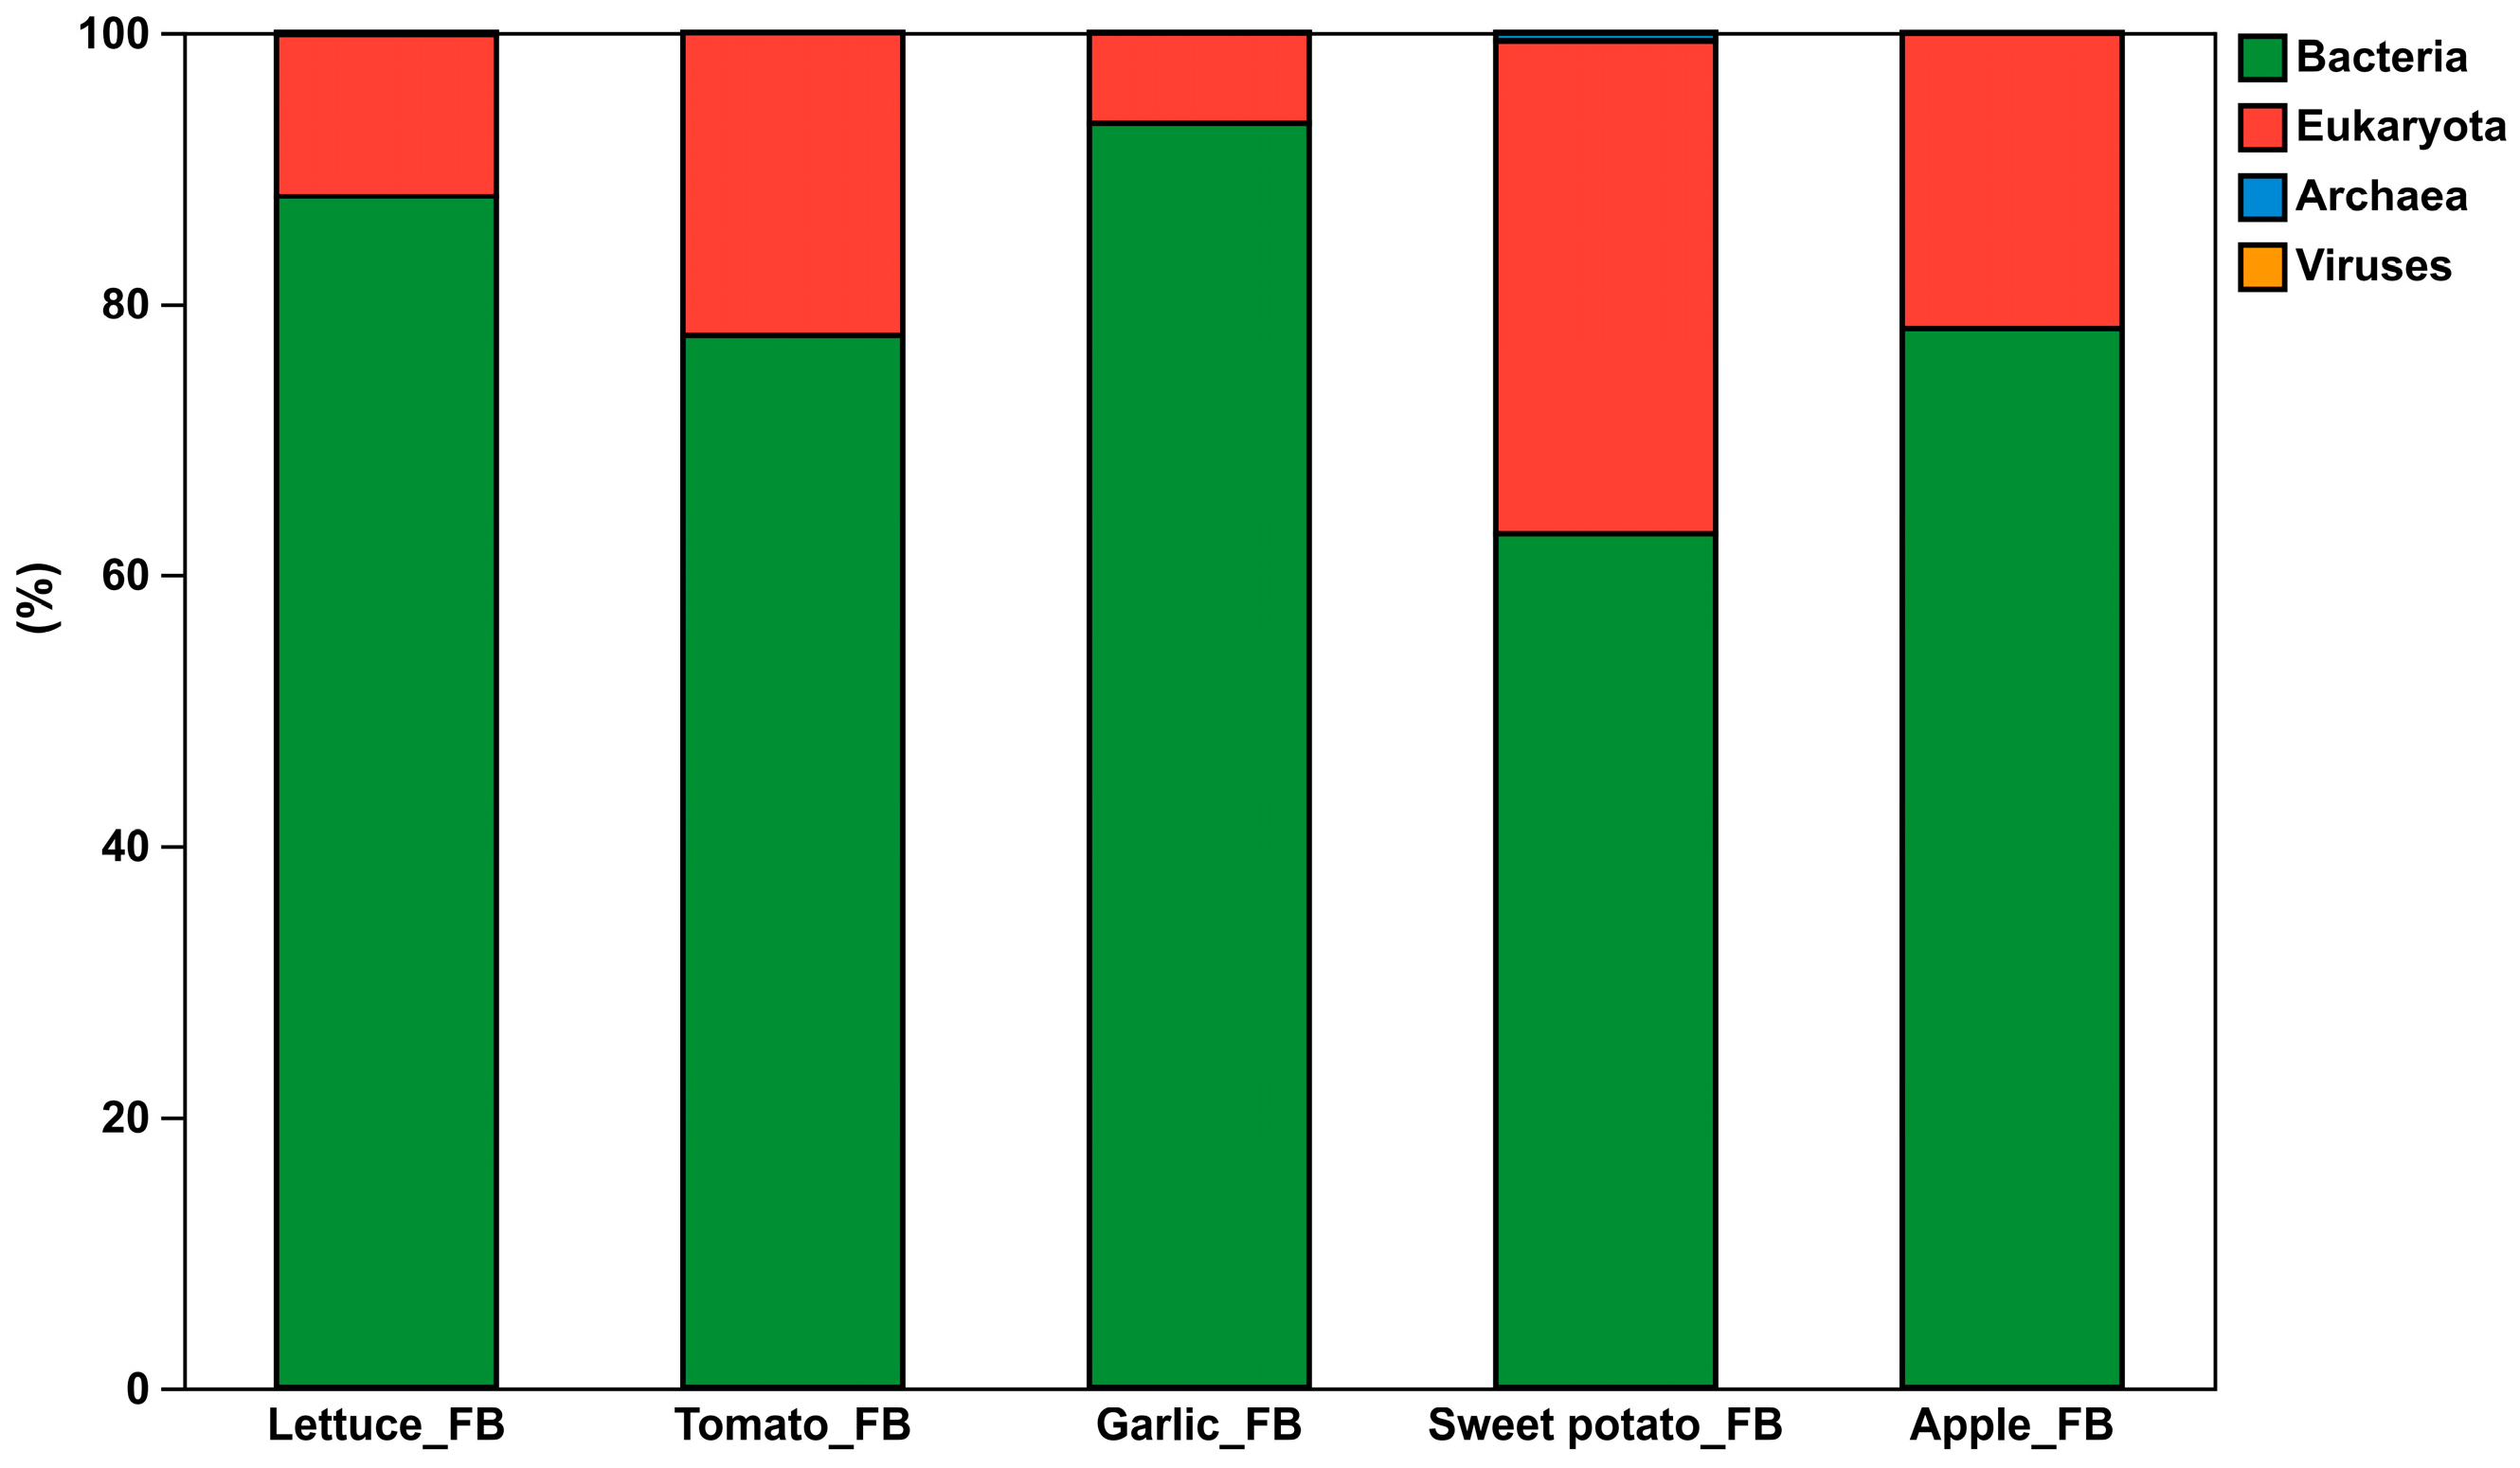
Metagenomic sequencing revealed that the microbial communities of the FBs were dominated by the domain of bacteria, accounting for 84.18% of the total microbes on average (Figure 2). Eukaryota represented the second most abundant domain, with relative abundances ranging from 6.67% to 21.81%, and differed significantly among the different FBs (p < 0.05). In contrast, Archaea and Viruses were detected only at very low abundances, together accounting for less than 0.1% of the total community. Among all the FBs, the garlic FB contained the highest abundance of bacteria (93.4%) and the lowest of fungi (6.6%).
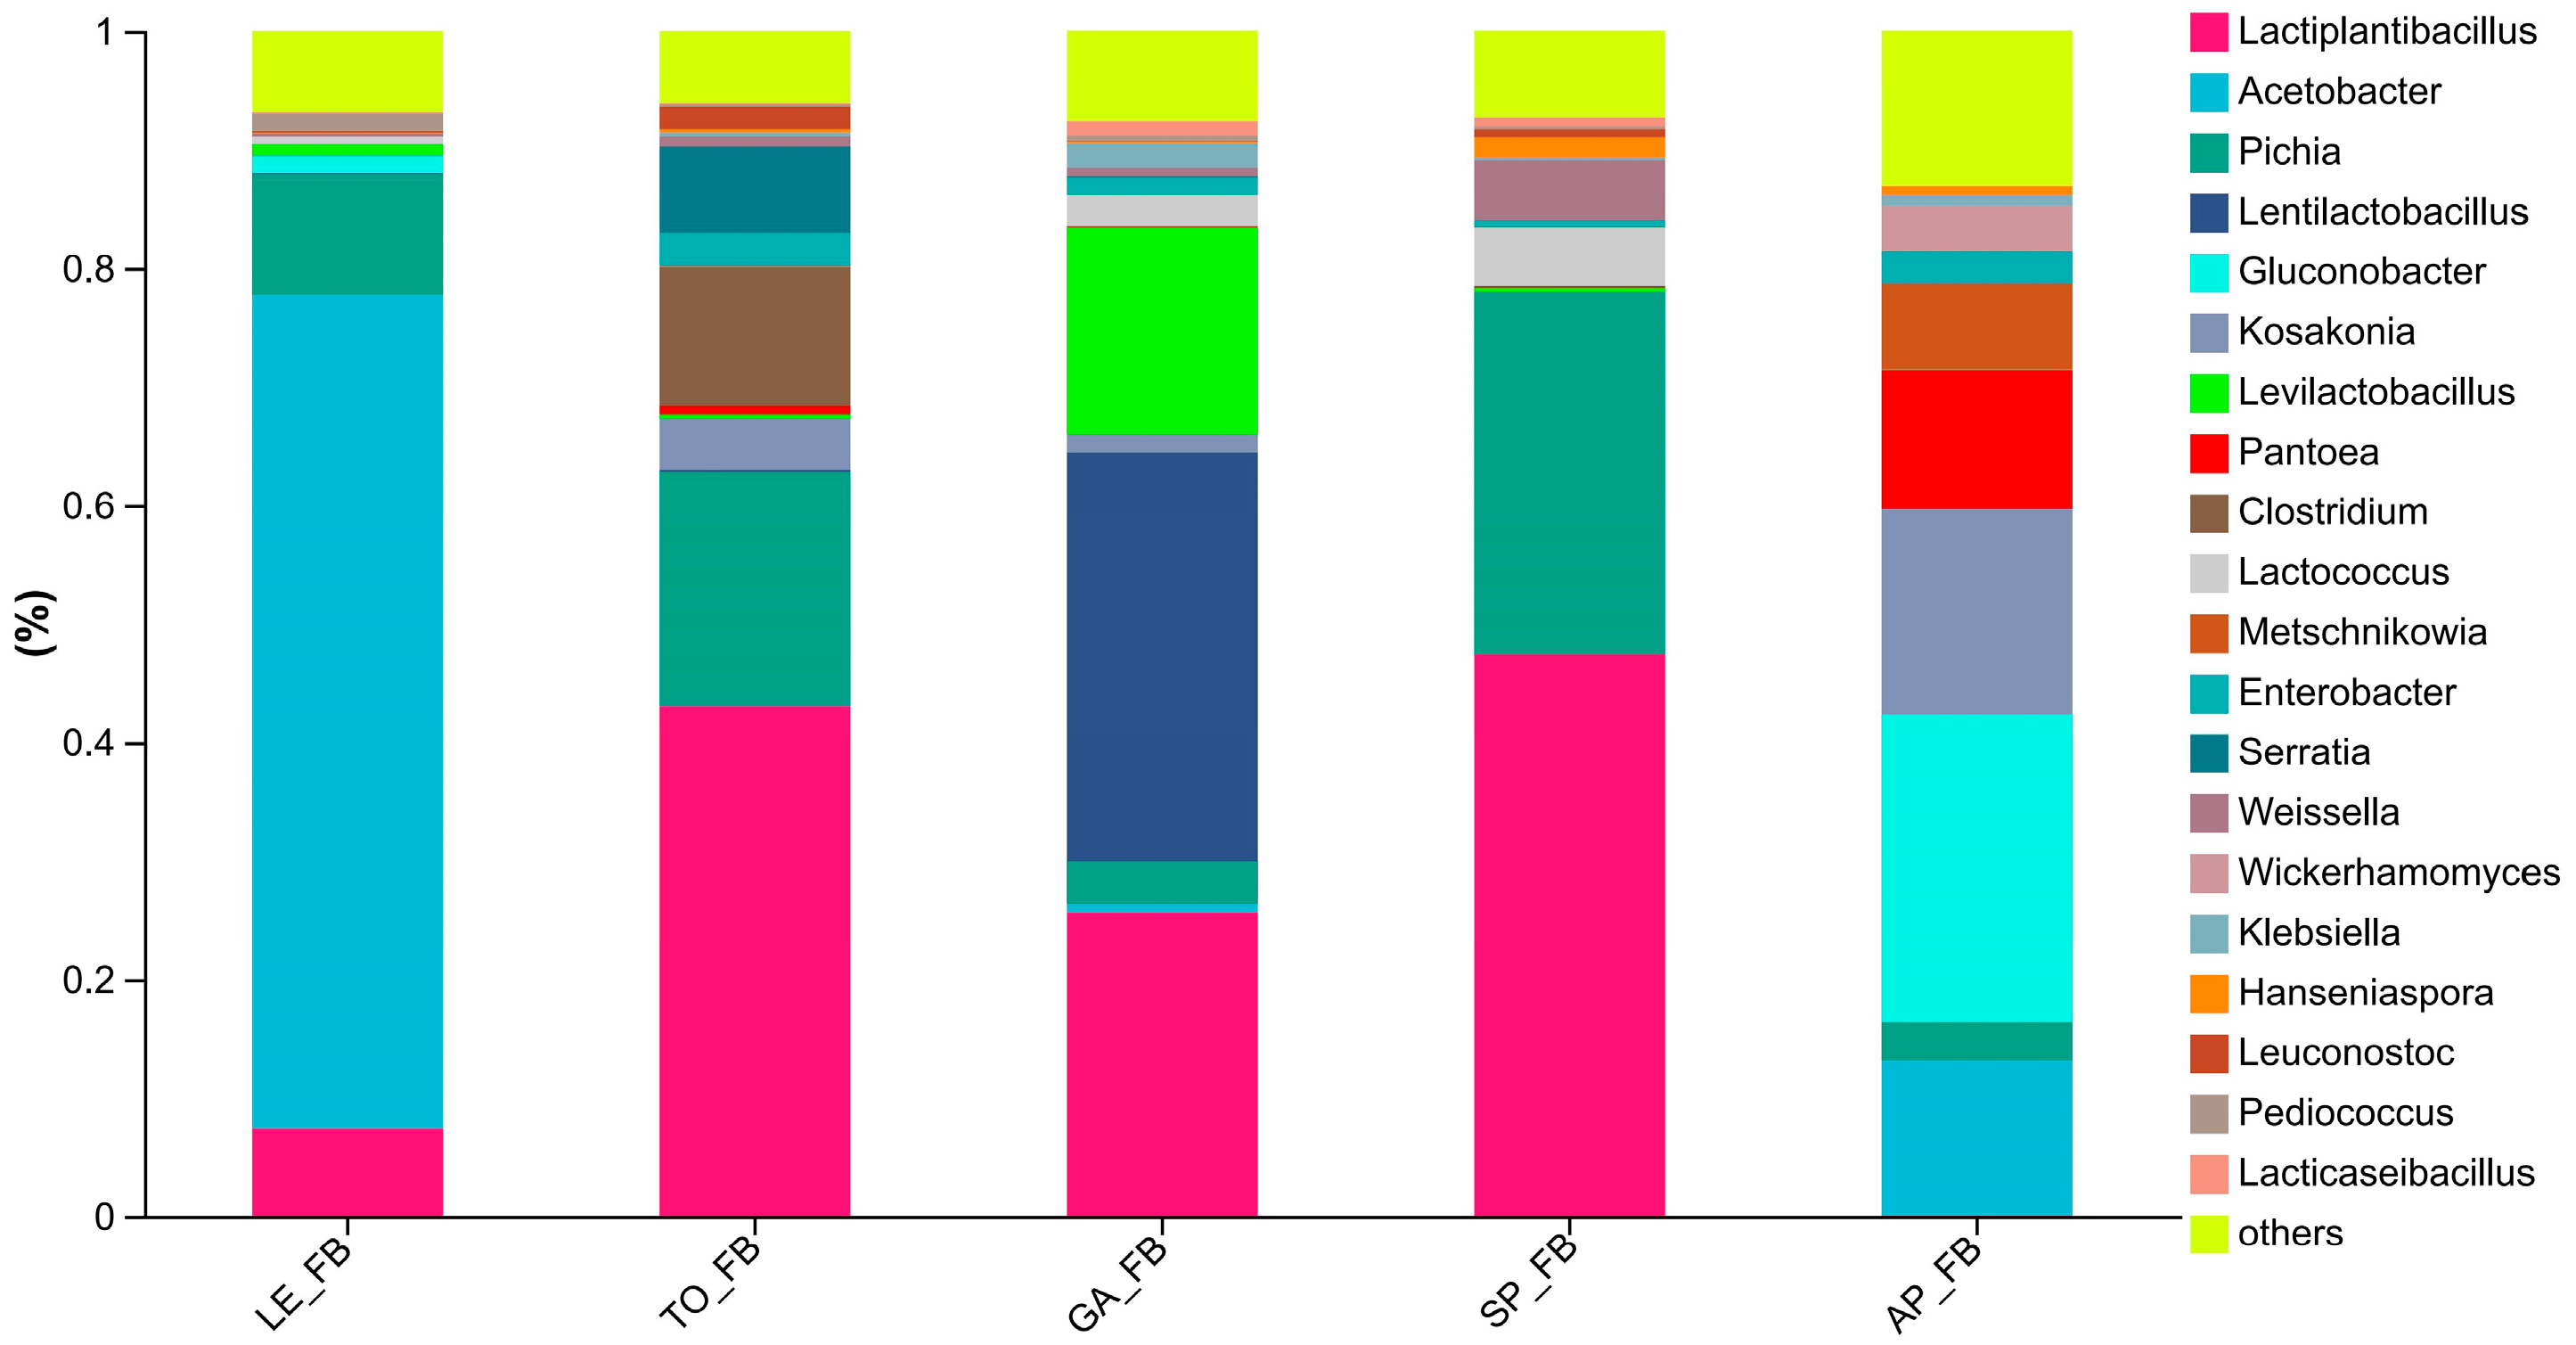
At the genus level, distinct microbial community structures were observed among the different FBs (Figure 3). The apple FB was characterized by relatively high abundances of the genera Gluconobacter (approximately 26%), Kosakonia (17%), and Pantoea (12%). The tomato FB was dominated by Lactiplantibacillus (43%), followed by Pichia (19%) and Clostridium (12%). The garlic FB was dominated by Lentilactobacillus (35%), Lactiplantibacillus (26%) and Levilactobacillus (18%), forming a complex lactic acid bacterial community. The lettuce FB was strongly dominated by Acetobacter (70%), whereas the sweet potato FB exhibited co-dominance of Lactiplantibacillus (45%) and Pichia (30%). In addition, low-abundance genera, including Lactococcus, Serratia, Enterobacter, Weissella, Wickerhamomyces, Klebsiella, and Hanseniaspora, were detected in most FBs.
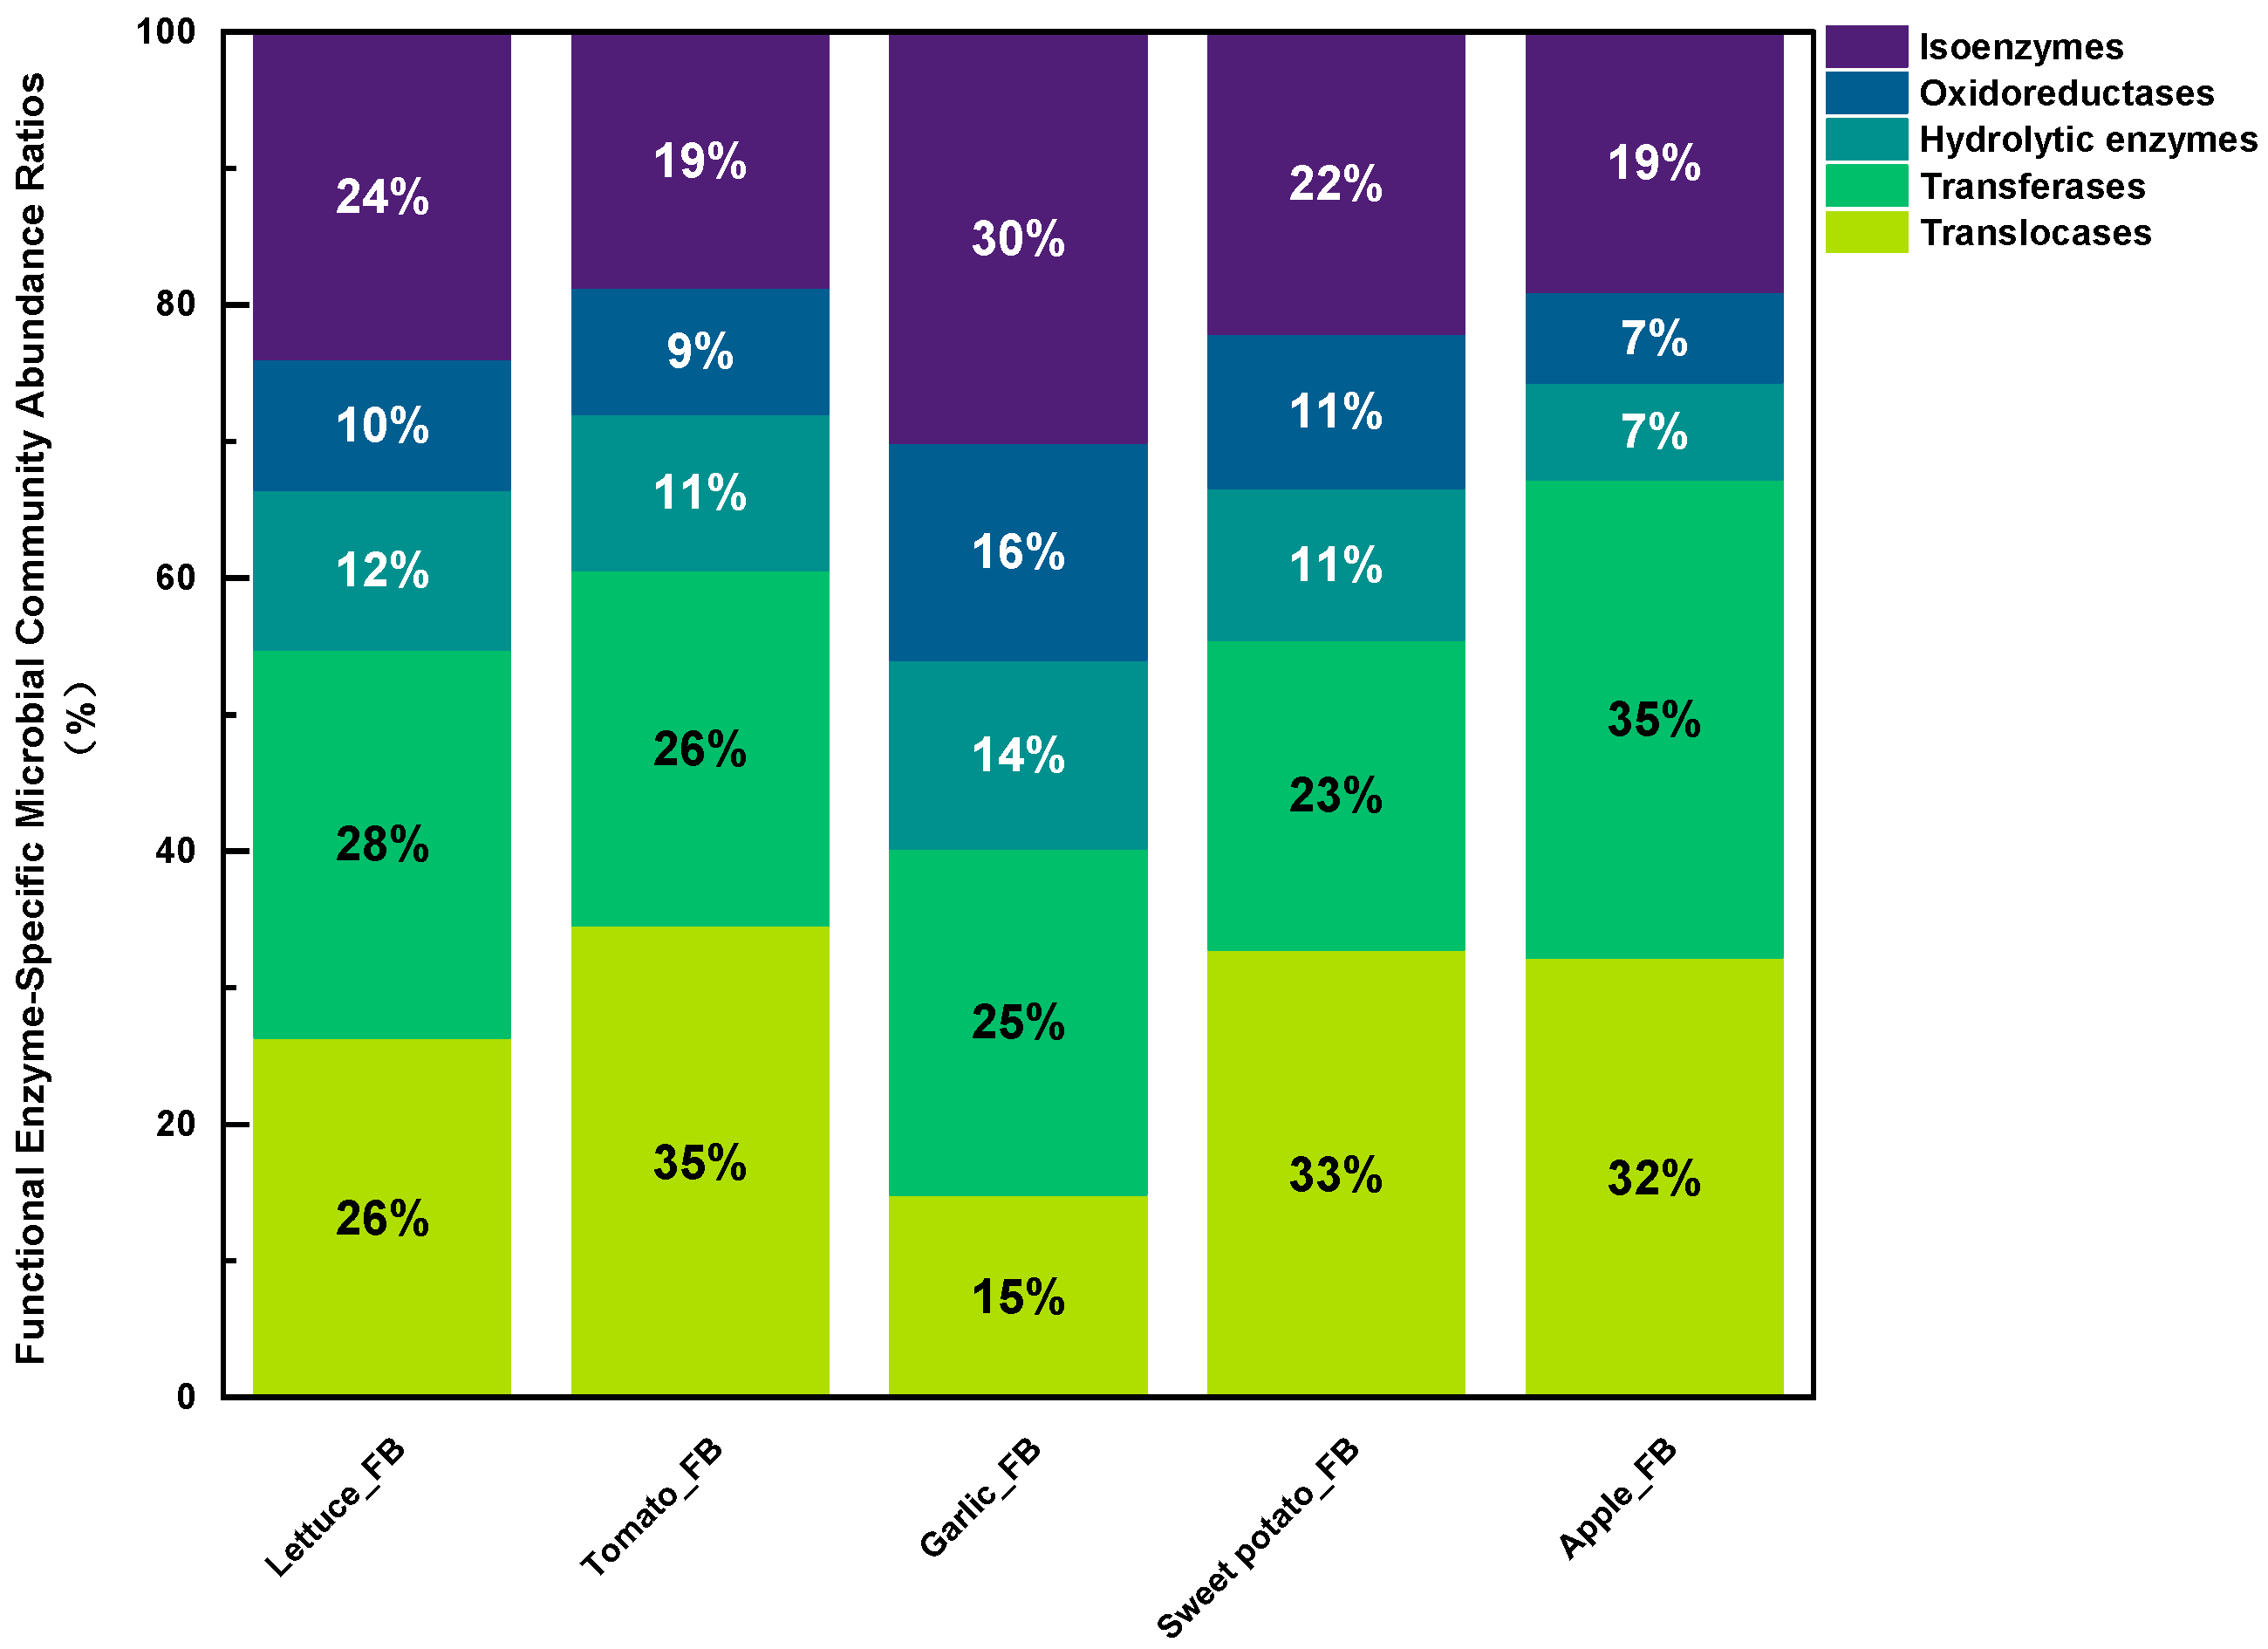
The KEGG functional annotation revealed clear differences in the distribution of enzyme-related functional genes among the FBs (Figure 4). Genes associated with translocases, transferases, and isomerases represented the most abundant functional categories. The highest relative abundance of translocase-related genes was observed in the tomato, sweet potato, and lettuce FBs, whereas transferase-related genes were most abundant in the apple, tomato, and garlic FBs. Other major functional categories included oxidoreductases and hydrolases. Notably, the garlic FB exhibited the highest abundance of genes associated with both oxidoreductase and hydrolase functions.

3.2. Soil Nutrients and Enzyme Activities

In the two pot experiments, the CF treatment exhibited the highest content of nutrients in the soil (p < 0.05). The GA treatment showed significantly higher levels of TN, AN, TP, AvP, TK, and AK in the soil compared with the other FB treatments (p < 0.05) (Table 3). Although the improvement in soil nutrients under the FB treatments was lower than that under the CF treatment, the enhancement effects were still significant (Table 3).
In the second experiment, compared with CK, the GA, TO, LE, SP, and AP treatments increased TN content by 41.32%, 35.54%, 30.58%, 27.27%, and 17.36%; AmN by 21.57%, 16.50%, 17.23%, 16.36%, and 13.73%; TK by 73.57%, 57.48%, 62.04%, 60.52%, and 65.08%; AK by 258.55%, 131.82%, 180.13%, 178.18%, and 131.82%; TP by 65.23%, 58.53%, 60.88%, 50.21%, and 55.04%; AvP by 119.72%, 77.46%, 71.83%, 83.87%, and 72.25%; and OM by 37.84%, 13.51%, 22.30%, 22.97%, and 16.22% in the soil, respectively. Due to the superior content of nutrients in the garlic FB (Table 1), the GA treatment showed the most pronounced improvement in soil nutrient levels. In particular, the content of TP in the GA-treated soil was significantly higher than that of all the other treatments (p < 0.05).
Both the FB and CF treatments significantly increased soil enzyme activities (Table 3). The GA treatment, in particular, exhibited the strongest enhancement effects on the activities of ACP, URE, CAT, and β-Glu in the soil (p < 0.05). Compared with CK, the SP, LE, TO, AP, CF, and GA treatment increased ACP activity by 112.34%, 66.64%, 52.77%, 35.71%, 51.84%, and 33.80%; URE activity by 180.72%, 42.07%, 33.14%, 33.91%, 30.17%, and 33.91%; CAT activity by 83.34%, 4.31%, 24.74%, 59.21%, 37.50%, and 53.16%; and β-Glu activity by 22.68%, 27.00%, 14.18%, 18.75%, 15.15%, and 6.18% in the soil, respectively. Overall, the GA treatment consistently produced the greatest improvement in soil fertility and enzyme activities.

3.3. Growth of Brassica chinensis and Incidence of Disease and Pest

In the two pot experiments, the CF treatment generally produced the highest values of leaf number, plant height, leaf width, and leaf length (p < 0.05). The GA treatment showed significantly higher growth performance than the other FB treatments and CK (p < 0.05) (Table 4).
In the second experiment, compared with CK, TO, LE, SP, and AP, the GA treatment increased leaf number by 43.60%, 27.02%, 37.50%, 37.50%, and 27.02%; plant height by 49.53%, 21.52%, 15.66%, 21.52%, and 15.66%; leaf width by 47.11%, 23.97%, 15.53%, 21.02%, and 23.28%; and leaf length by 20.63%, 21.08%, 16.23%, 17.75%, and 17.00%, respectively (Table 4).
Across both experiments, the CF treatment significantly increased the total and aboveground biomass compared with the FB treatments and CK (p < 0.05). The GA treatment also significantly outperformed the other FB treatments and CK (p < 0.05). Specifically, the total biomass under the GA treatment was 94.40%, 82.75%, 86.01%, 71.00%, and 98.41% higher than under CK, LE, TO, SP, and AP; the aboveground biomass increased by 153.19%, 108.77%, 105.17%, 108.77%, and 95.08%, respectively.
The leaf biochemical indices, including soluble protein, soluble sugar, and chlorophyll, in the CF-treated plants were the highest in both experiments. The values in the GA plants were generally higher than those of the other FB treatments (p > 0.05) (Table 4). In the second experiment, compared with CK, SP, LE, AP, and TO, the GA treatment increased soluble protein content by 32.31%, 6.92%, 4.56%, 7.23%, and 7.85%; soluble sugar content by 33.17%, 3.67%, 0.16%, 3.45%, and 2.65%; and chlorophyll content by 42.52%, 14.20%, 6.78%, 5.85%, and 4.02%, respectively.
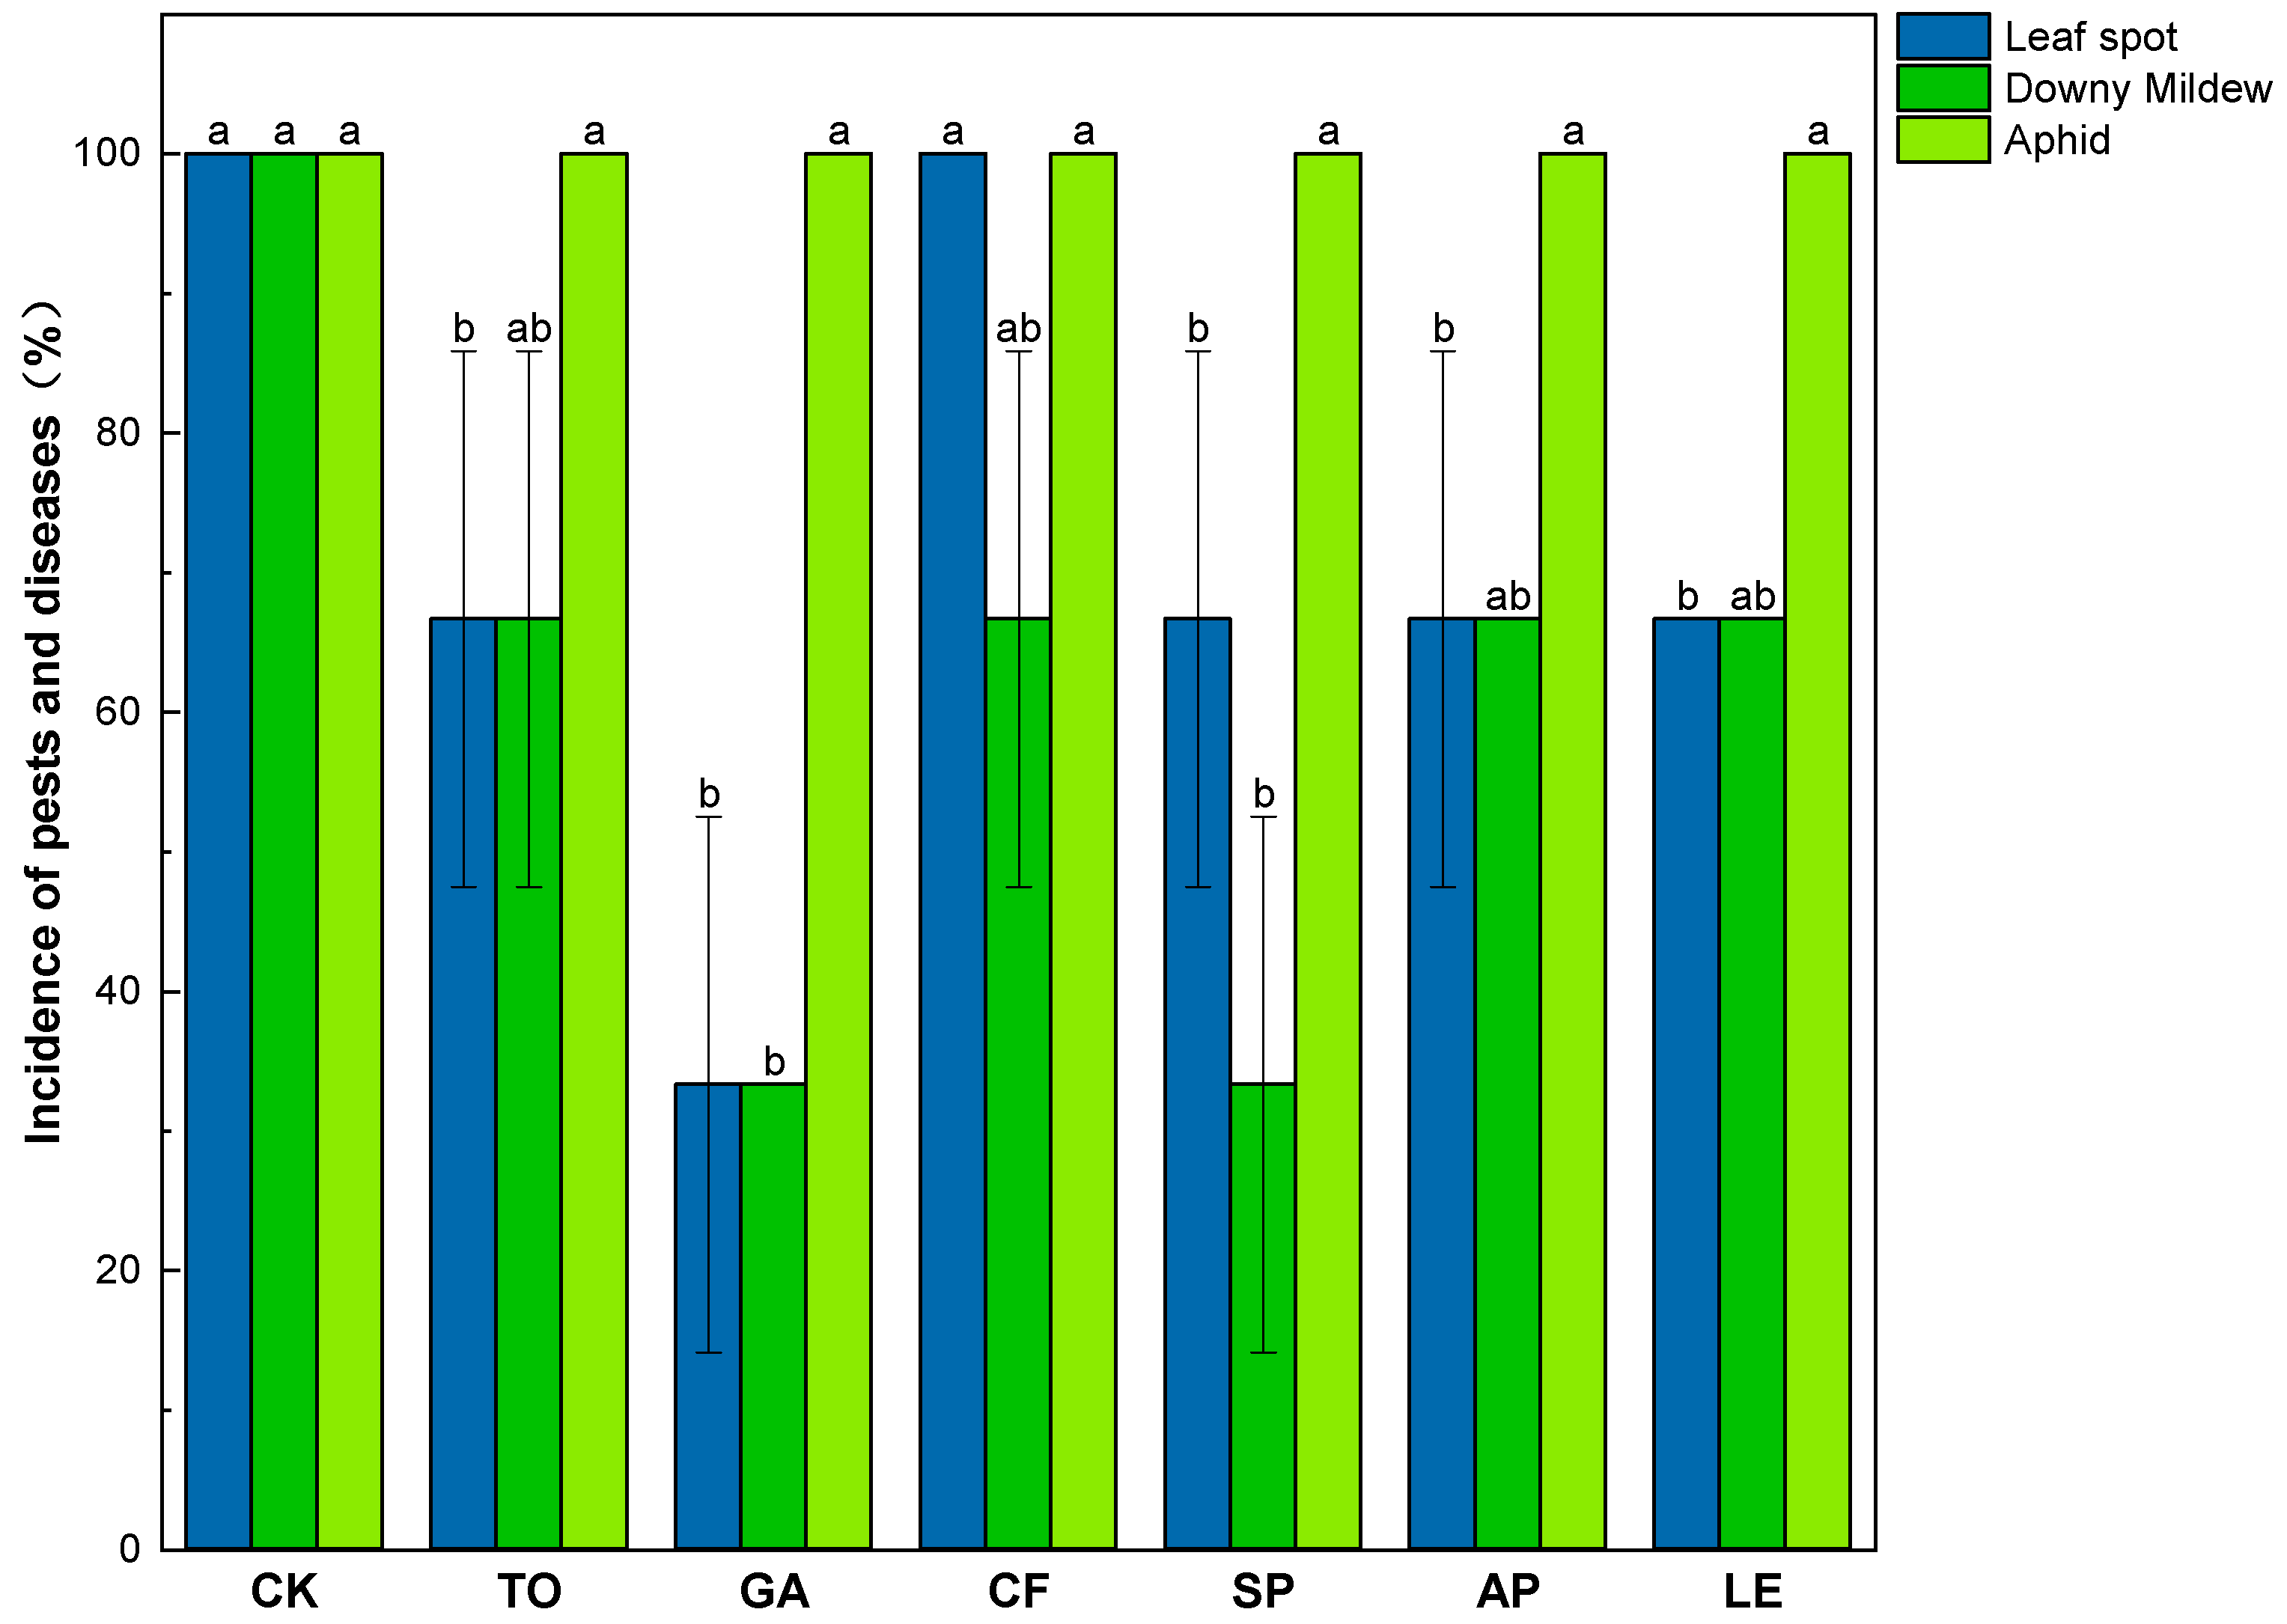
The disease incidence in all the FB and CF treatments was lower than that in the CK. Among the treatments, the GA-treated plants exhibited the lowest incidence of downy mildew and leaf spot disease (Figure 5).

3.4. Microbial Community in the Soil

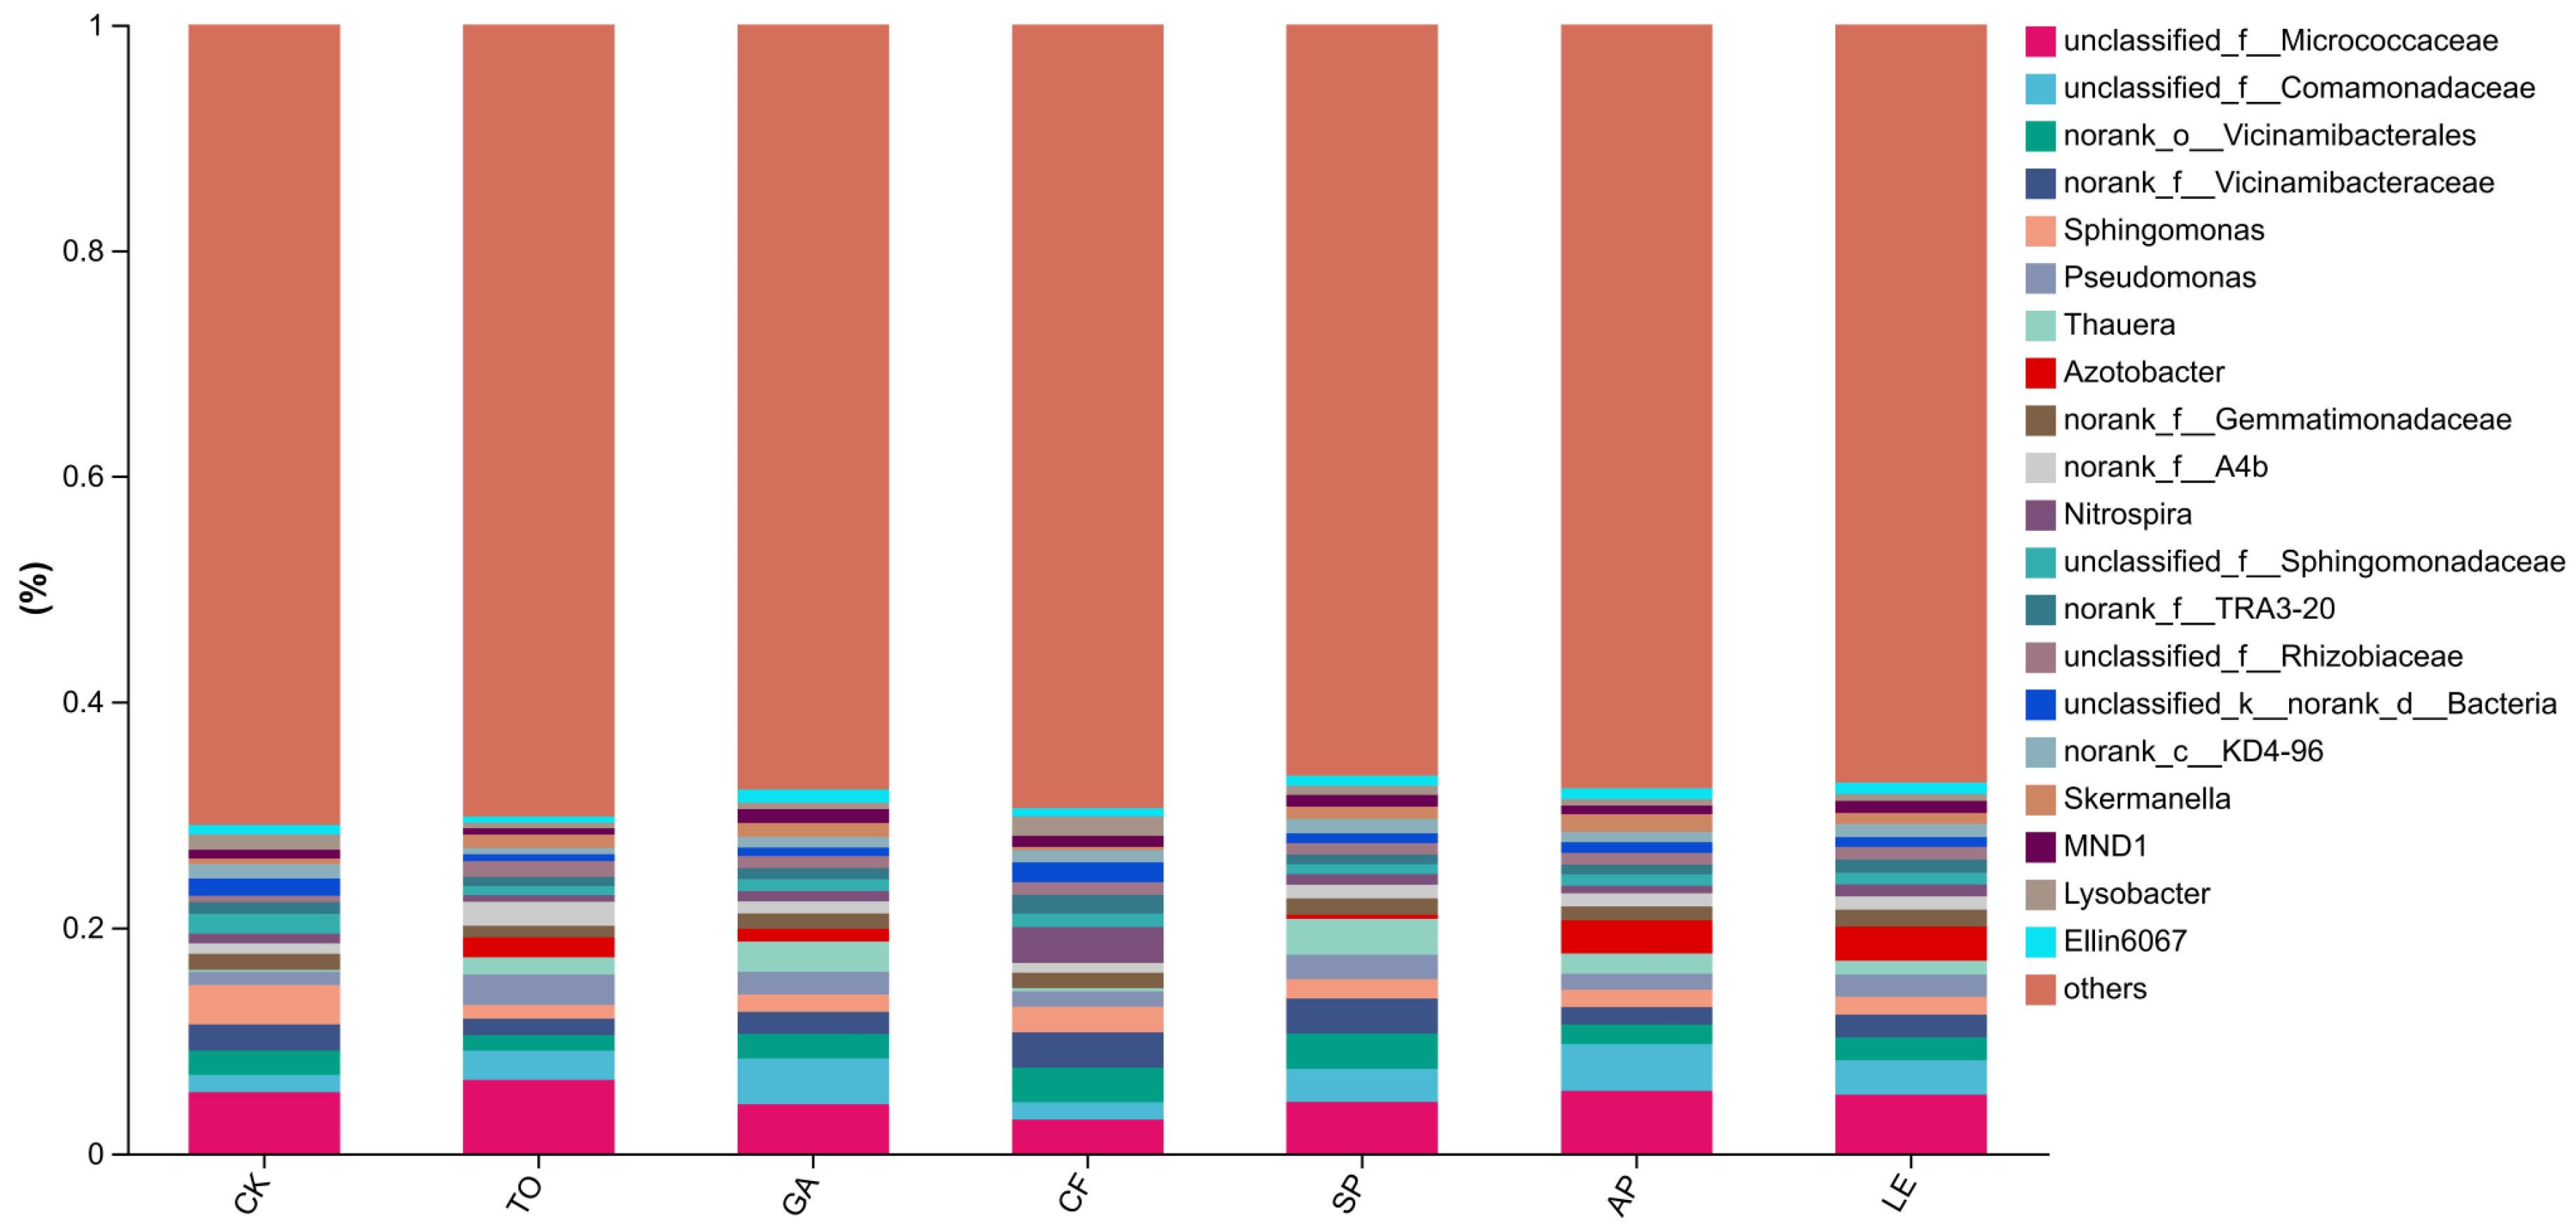
In the second pot experiment, the dominant bacterial groups in the soil across all the treatments included Micrococcaceae, Comamonadaceae, Vicinamibacterales, Pseudomonas, Sphingomonas, Azotobacter, Nitrospira, and Lysobacter at the genus level (Figure 6). The FB treatments showed varying degrees of promotion on the relative abundance of functional microbial groups.
The LE treatment increased the abundance of Micrococcaceae and Azotobacter compared with CK, indicating that the lettuce FB provided available carbon sources that stimulated heterotrophic and nitrogen-fixing microorganisms. The GA treatment exhibited higher abundances of Micrococcaceae, Thauera and Sphingomonas. The TO treatment slightly increased Comamonadaceae and Pseudomonas. The AP treatment showed higher abundances of Azotobacter, Micrococcaceae, and Micrococcaceae. The SP treatment also showed enrichment of functional microbial groups.
Alpha diversity indices in the soil were significantly affected by the application of FBs (Table 5). For richness, the LE and SP treatments showed significantly higher ACE, Chao1, and Sobs indices compared with CK and the other FB treatments (p < 0.05), while the AP treatment showed the lowest values. For diversity, the SP treatment showed the highest Shannon index, significantly higher than the TO and AP treatments and CK (p < 0.05). The GA, LE, and CF treatments also showed relatively high Shannon values, but differences from CK were not always significant (p > 0.05). The Simpson index was highest in the AP treatment, which was significantly higher than in GA, SP, and CF (p < 0.05). The sequencing coverage exceeded 0.996 across all the treatments, indicating sufficient sequencing depth and reliable community coverage. The enrichment of these taxa suggests that the fruit- and vegetable-derived FBs may selectively stimulate microbial groups involved in nutrient transformation and rhizosphere functioning.
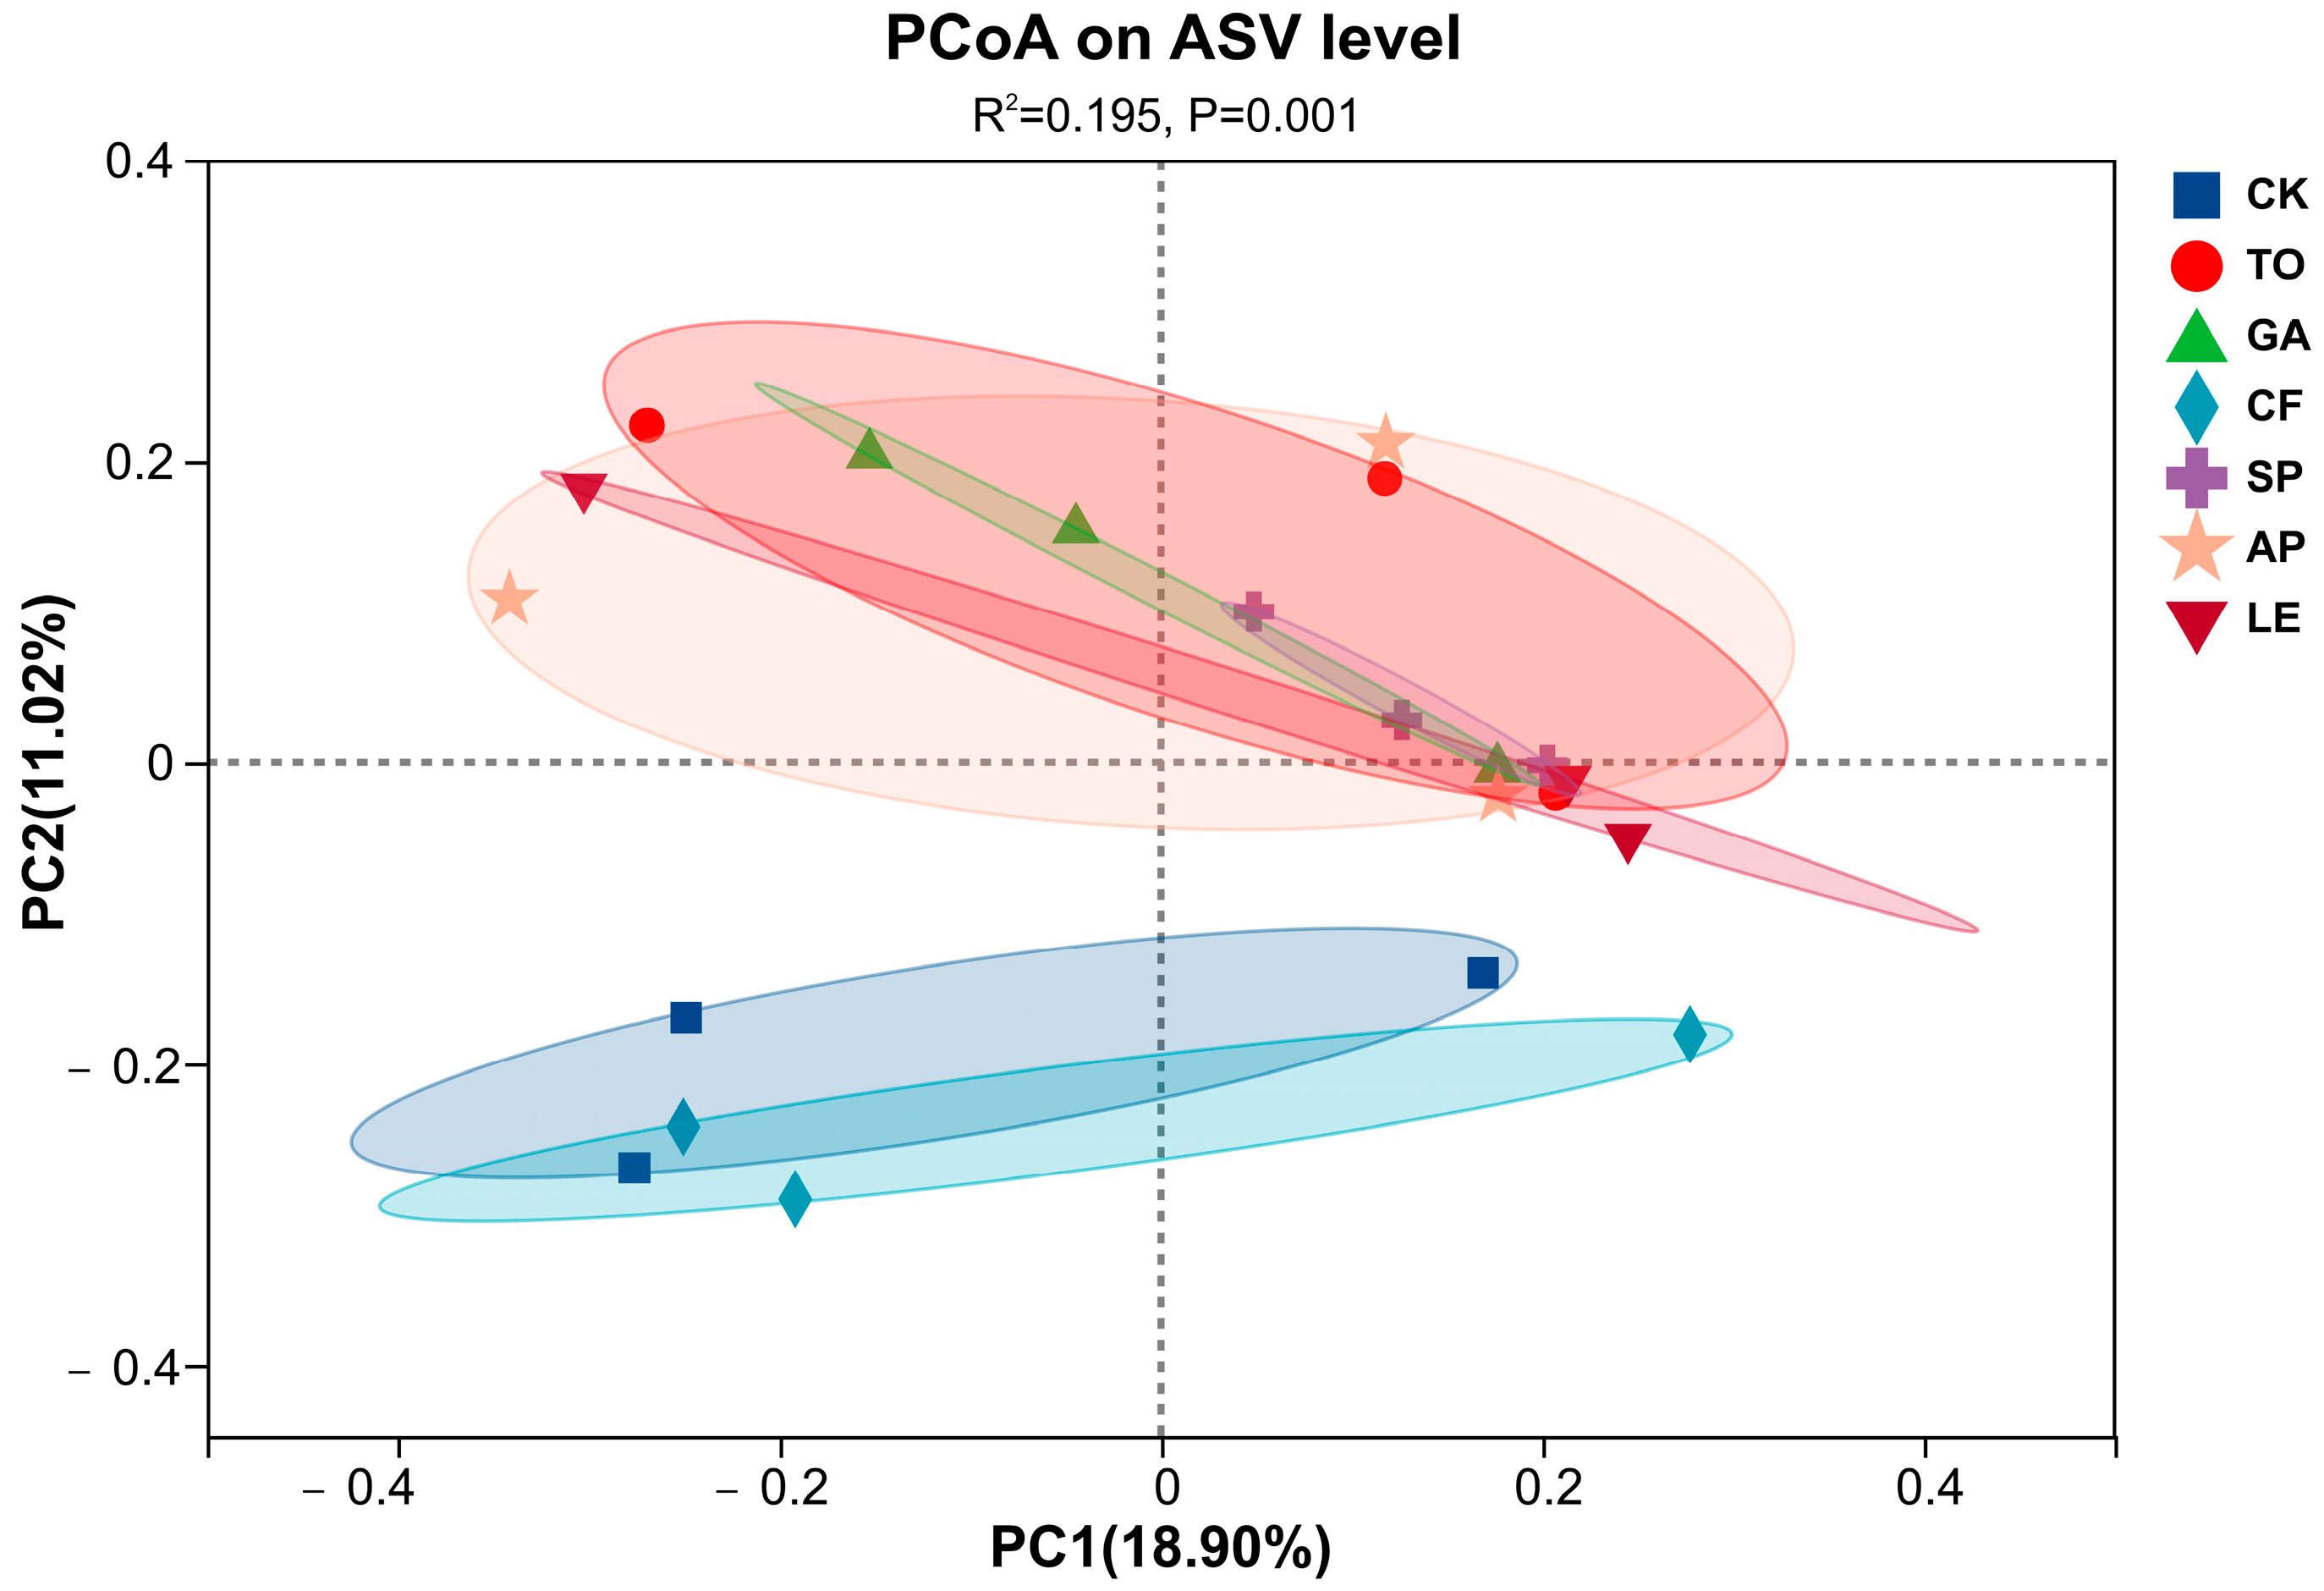
The PCoA was performed to evaluate differences in the soil microbial community among the treatments (Figure 7). The first two principal coordinates explained 18.90% and 11.02% of the total variation, respectively. The microbial communities of the FB-treated soil were generally separated from that of the CF and CK, suggesting that the FB application altered the overall structure of microbial communities in the soil (Figure 7).
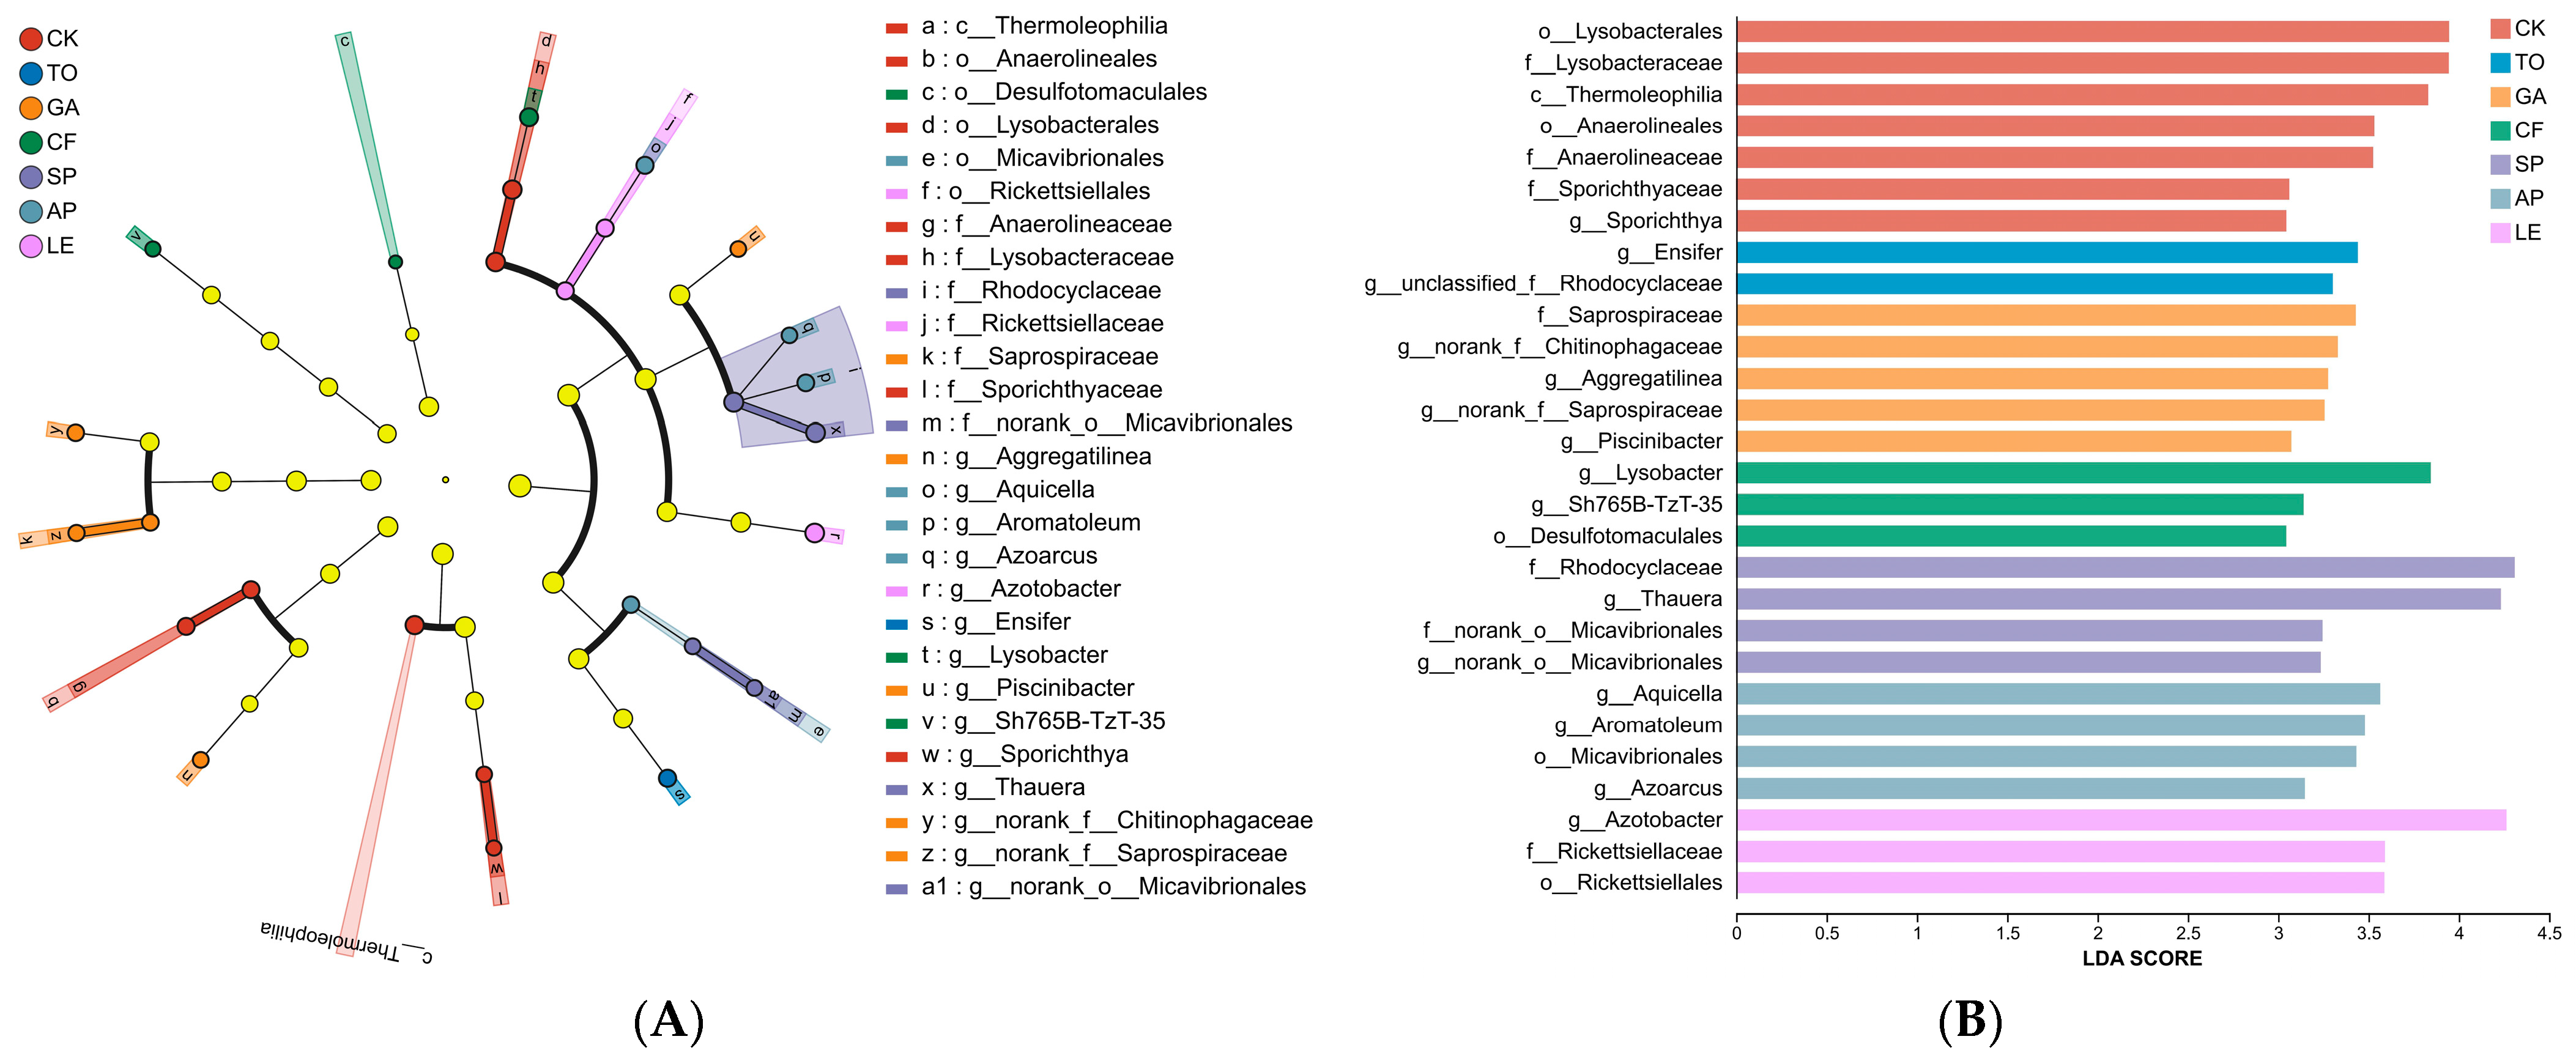
LEfSe analysis was performed to identify the microbial taxa that differed significantly among the treatments (Figure 8). Discriminatory taxa with LDA scores > 3.0 were identified, indicating that different fertilization treatments selectively enriched distinct microbial lineages in the rhizosphere. The CK treatment was characterized by the enrichment of Thermoleophilia, Anaerolineales, Anaerolineae, Lysobacterales, Lysobacteraceae, Sporichthya and Sporichthyaceae. The TO treatment was mainly associated with Ensifer and unclassified_f_Rhodocyclaceae. The GA treatment preferentially enriched Saprospiraceae, norank_f_Saprospiraceae, Chitinophagaceae, Piscinibacter, and Aggregatilinea. The CF treatment was characterized by the enrichment of Lysobacter, Sh765B-TzT-35, and Desulfotomaculales. The LE treatment enriched Azotobacter, Rickettsiellaceae, and Rickettsiellales, whereas the AP treatment was associated with Agromatellum, Aquicella, Micavibrionales, and Azoarcus. In contrast, the SP treatment was characterized by the enrichment of Rhodocyclaceae, Thauera, norank_o_Micavibrionales, and norank_o_Micavibrionales.
These results indicated that the different fertilization treatments selectively enriched distinct bacterial taxa in the soils.

4. Discussion

4.1. Differentiation of Substrate-Dependent FBs

The marked differences in nutrient content, enzyme activity, and structure of microbial communities among the tested FBs indicate that the substrate composition was a primary determinant of fermentation quality. The garlic FB exhibited the highest concentrations of nutrient elements and hydrolytic enzymes, suggesting a superior nutrient transformation capacity during fermentation. The garlic FB contains abundant proteins, sulfur-containing compounds, and readily degradable organic matter, providing favorable substrates for microbial growth and metabolism [19,20,21].
Metagenomic analysis further demonstrated that garlic FB was characterized by a dominant Lactobacillus community. Although its overall microbial abundance was not the highest, the concentration of microbial taxa was substantially greater than that of the other substrate FBs. Such a low-diversity but functionally specialized microbial structure may promote metabolic efficiency and resource utilization. Lactobacillus species are known to produce organic acids through glycolysis, resulting in pH reduction and enhanced solubilization of organic phosphorus and nitrogen-containing compounds [22]. Consequently, the enrichment of hydrolytic enzyme-related functional genes and the elevated activities of ACP, URE, and PRT observed in the garlic FB are likely associated with the dominance of lactic acid bacteria [23].
In contrast, the sweet potato FB was enriched with Pichia species, which preferentially utilize carbohydrates and starch-derived substrates, resulting in higher amylase activity but relatively limited nutrient mineralization [24]. The apple and persimmon FB contained abundant structural polysaccharides, thereby favoring cellulolytic microorganisms and increasing cellulase activity [25]. These findings suggest that the substrate characteristics regulate microbial succession and functional gene expression during fermentation, ultimately leading to differentiated pathways of nutrient transformation and enzyme activity profiles.

4.2. Soil Ecological Responses to FB Application

The application of FBs significantly enhanced soil nutrient availability and enzyme activities, indicating that these products function not only as nutrient sources but also as biologically active amendments capable of regulating soil ecological processes. Soil enzymes play critical roles in carbon, nitrogen, and phosphorus cycling, and their activities are widely recognized as sensitive indicators of soil biological functioning [26].
The observed increases in ACP, URE, CAT, and β-Glu activities in the soil following FB application can be attributed to multiple mechanisms. The FBs directly introduce extracellular enzymes into the soil and provide readily available carbon sources, organic acids, amino acids, and other labile metabolites that stimulate indigenous microbial growth and metabolism [27]. The shifts in microbial community may further enhance the production of nutrient-transforming enzymes. Overall, these processes accelerate organic matter decomposition and nutrient mineralization [28].
Among all the treatments, the GA treatment induced the strongest improvements in soil nutrient status and enzyme activities. This response may be associated with its higher concentrations of active metabolites and its enrichment in microbial taxa [29]. Correlation analyses revealed significant positive relationships between soil nutrients and enzyme activities, suggesting that the FB application strengthened the coupling between microbial metabolism and nutrient cycling. Consequently, soil fertility improvement was achieved not only through direct nutrient supplementation but also through the stimulation of biologically mediated nutrient transformation processes [30].

4.3. Effects of FB Application on Soil Microbial Communities

The fruit- and vegetable-derived FBs contained considerable amounts of mineral nutrients (Table 1). The fermentation products may also contain phytohormone-like substances, organic acids, amino acids, and soluble carbohydrates that can contribute to plant growth and physiological performance [31]. These compounds may stimulate soil microbial activity and nutrient transformation processes, thereby indirectly enhancing crop productivity [32].
The PCoA has suggested that the FB applications improved the structure of microbial communities in the soils (Figure 7). Several beneficial microbial taxa enriched under the FB treatments, including Sphingomonas, Azotobacter, Nitrospira, and Rhizobiaceae, are directly involved in nutrient cycling, organic matter decomposition, and plant growth promotion (Figure 6). The enrichment of Sphingomonas under GA treatment is consistent with its known role in complex organic matter degradation and plant growth promotion [33]. Azotobacter and Ensifer are well-known nitrogen-fixing bacteria that may contribute to nitrogen cycling [34,35]. Nitrospira plays an important role in nitrification, whereas Rhizobiaceae includes plant-associated bacteria that may contribute to nitrogen cycling and plant–microbe interactions. These microbial shifts may partially explain the enhanced enzyme activities and nutrient availability in the soil observed in the present study. This finding suggests that FB application not only modified the soil physicochemical properties but also reshaped the structure of microbial communities in the soil [36]. Notably, the LE and SP treatments significantly increased microbial richness, indicating that substrate-derived metabolites may expand ecological niches and support greater microbial diversity [37].
The LEfSe analysis further identified bacterial biomarkers associated with the different treatments (Figure 8). The enrichment of Saprospiraceae and Chitinophagaceae in the GA treatment may reflect an enhanced potential for the degradation of complex organic matter and nutrient turnover, which aligns with the relatively high soil enzyme activities detected in this study [38,39]. In contrast, the LE treatment preferentially enriched Azotobacter, a genus widely reported to participate in biological nitrogen fixation [40]. SP treatment mainly recruited Rhodocyclaceae and Thauera, taxa known for their versatile metabolism of aromatic compounds, suggesting a potential role in the transformation of phenolic substances in soil [41]. The CF treatment enriched Lysobacter and Desulfotomaculales, taxa that have been associated with extracellular enzyme production and sulfur-related biogeochemical cycling [42,43]. These findings indicate that the FB application was associated with the enrichment of treatment-specific microbial taxa and the establishment of distinct microbial assemblages in the soil.
The enrichment of functional microbial groups identified by the LEfSe was consistent with the enhanced soil enzyme activities and nutrient availability observed under the FB treatments. These microbial communities may have contributed to nutrient cycling, organic matter decomposition, and biological activity in the rhizosphere, thereby improving soil ecosystem functioning [18].

4.4. Effects of FB Application on Plant Growth and Disease Control

Improved soil biological activity was closely associated with enhanced plant growth. The enrichment of microbial taxa may have strengthened the coupling between microbial metabolism and nutrient transformation. For example, nitrogen-fixing bacteria can increase nitrogen availability, while decomposer taxa accelerate the mineralization of organic substrates, thereby supporting sustained nutrient supply for plant growth [33]. Positive correlations between plant biomass, soil nutrient availability, and enzyme activities indicate that crop productivity was largely driven by biologically mediated nutrient cycling processes [29,30]. The superior performance of the garlic FB may therefore result from an integrated mechanism involving nutrient supply, stimulation of soil enzymatic activities, enhancement of microbial functions, and improved nutrient acquisition by plants.
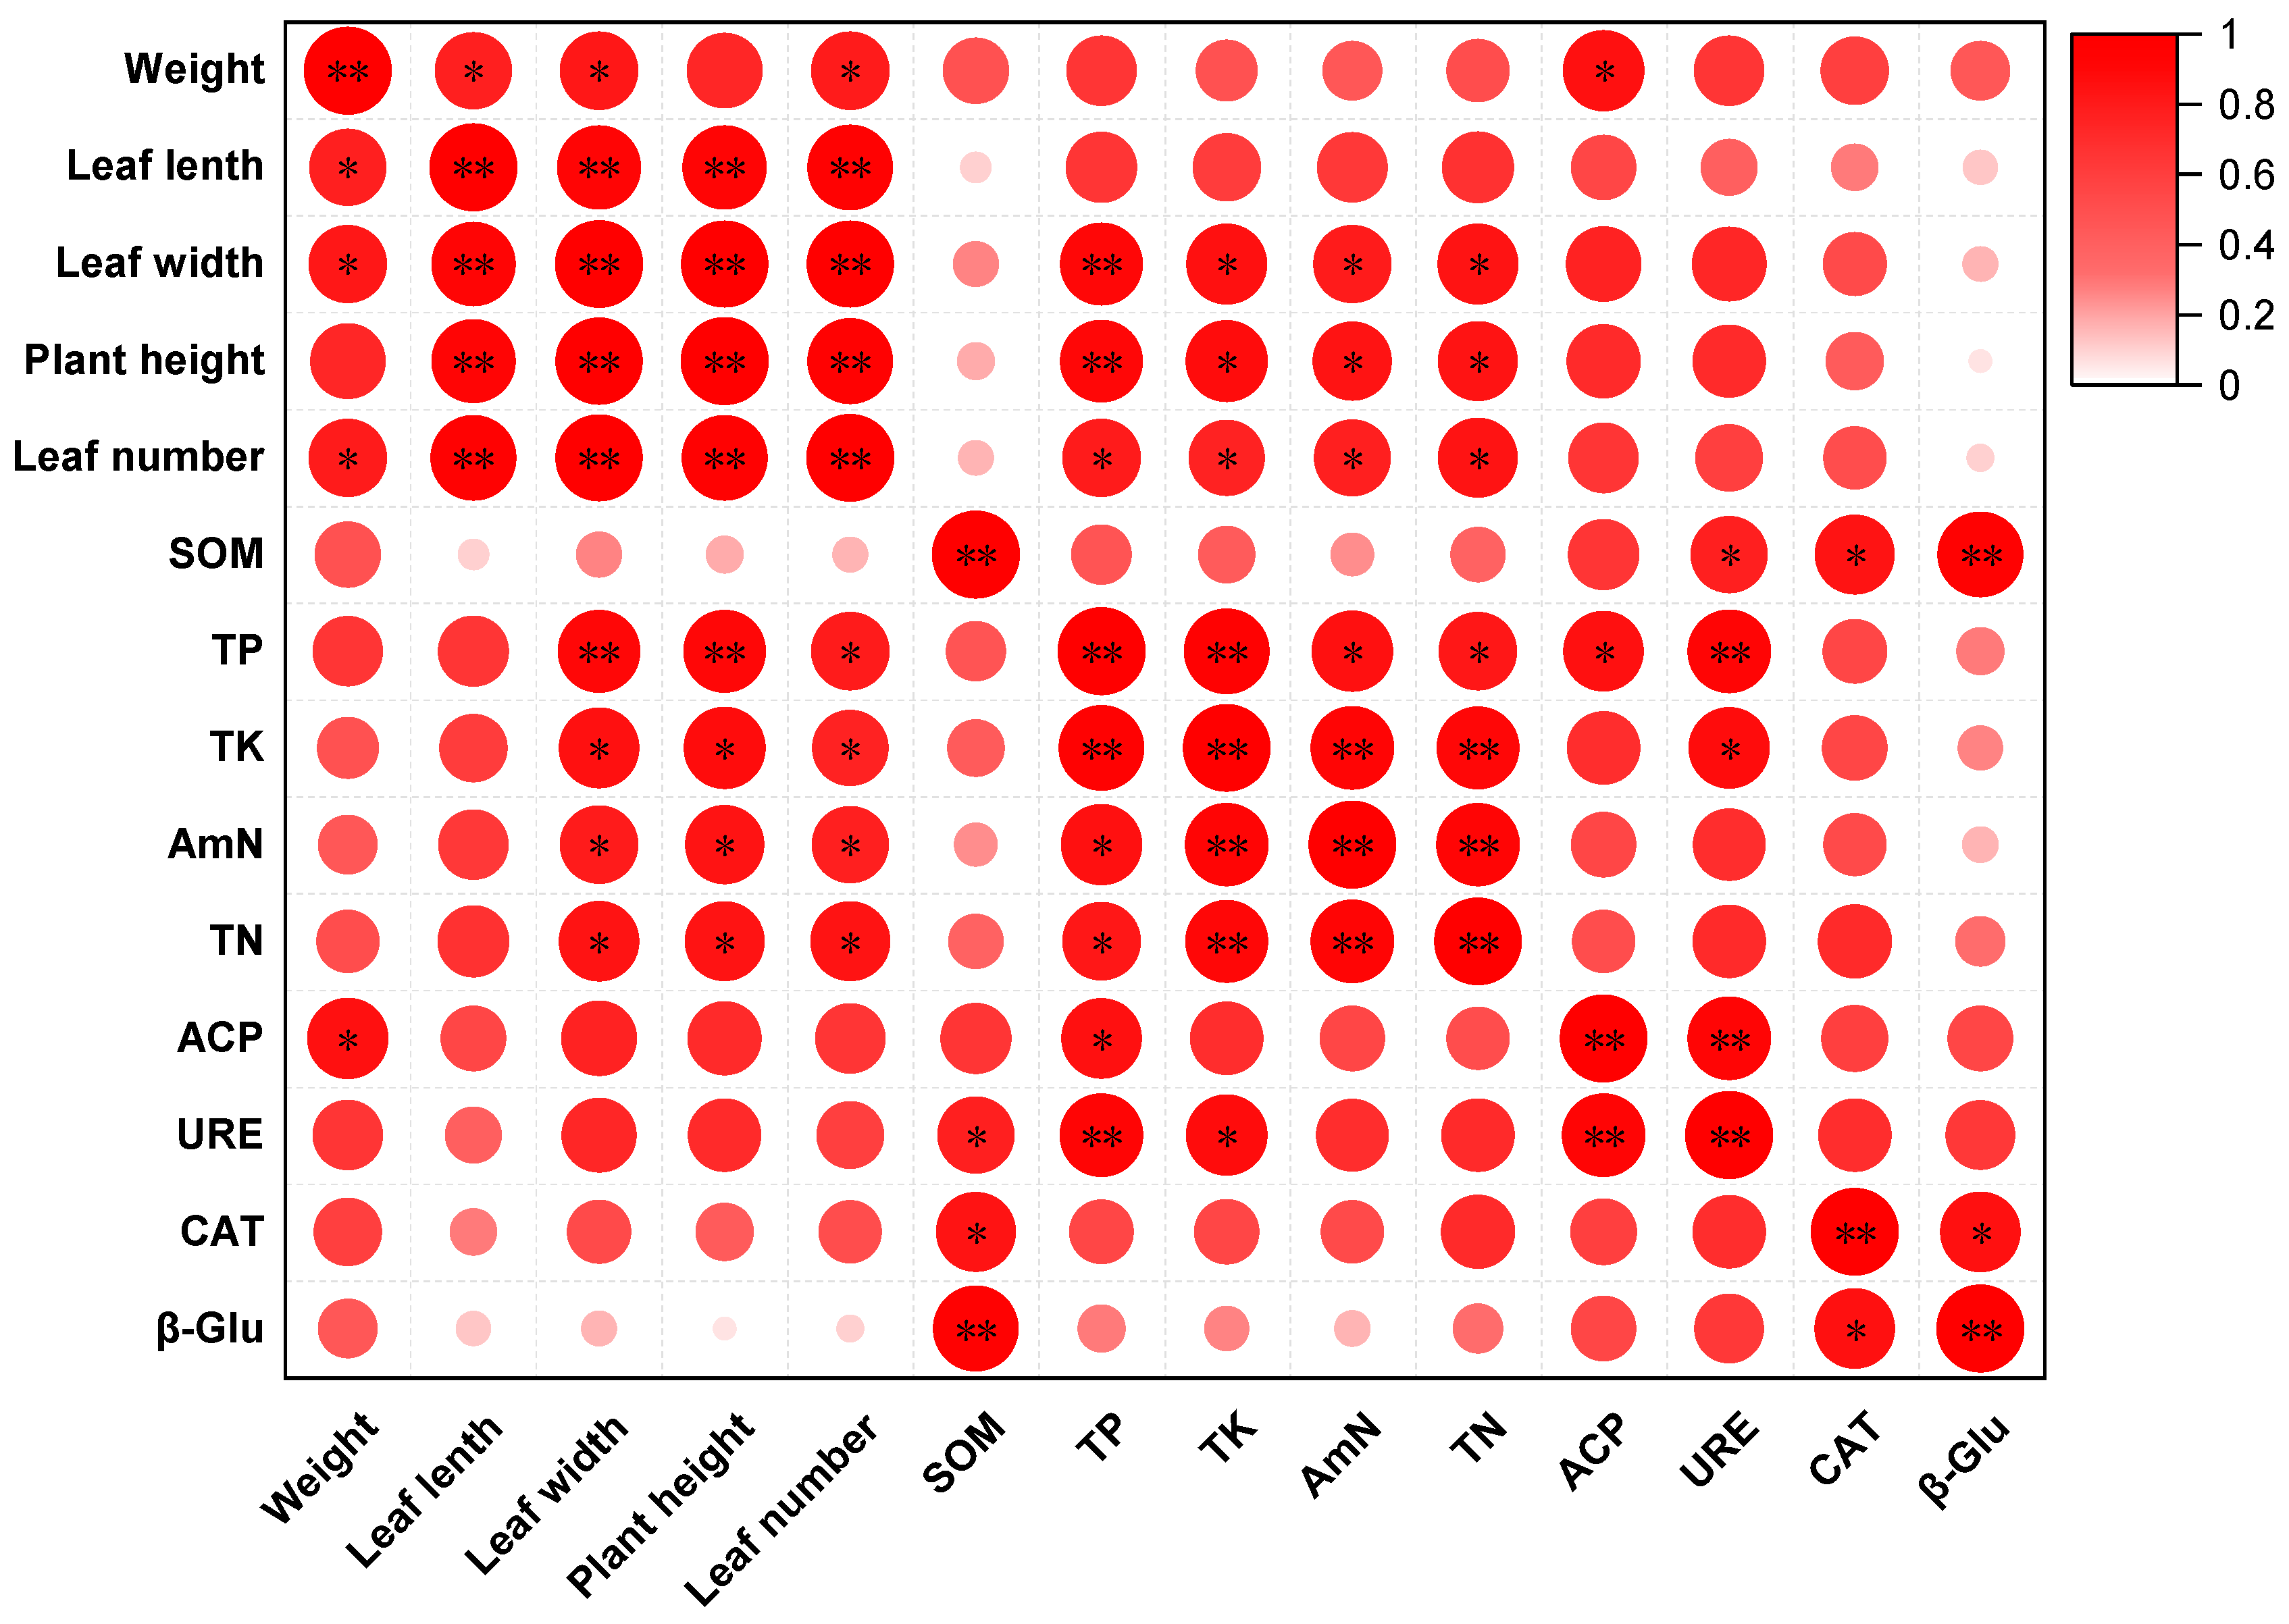
In this study, the growth indices of Brassica chinensis were significantly positively correlated with nutrient contents and enzyme activities of the soil (Figure 9) (r > 0.70; p < 0.05). In particular, the total plant biomass showed strong positive correlations with the content of SOM, AN, and the activities of hydrolytic enzymes, including URE and ACP (Figure 9) (r > 0.80; p < 0.01). These results suggest that improved crop performance was closely associated with enhanced nutrient availability and nutrient cycling intensity in the soil. The SOM serves as both a nutrient reservoir and a substrate for microbial metabolism, facilitating nitrogen mineralization and phosphorus mobilization, thereby improving nutrient acquisition by plants [30]. Similarly, increased URE and ACP activities indicated accelerated nitrogen and phosphorus turnover, which was consistent with the observed biomass accumulation.
Among all the treatments, the CF treatment yielded the highest soil nutrient values and vegetable growth indices due to its immediate availability of mineral nutrients. Compared with the other FB treatments, the GA exhibited the best growth-promoting effect, the total and shoot biomass of which increased by 94.40% and 153% compared with CK, respectively (Table 4). In addition, the contents of soluble protein, soluble sugar, and chlorophyll in the leaves tended to be higher under the GA treatment than under the other FB treatments, although the differences were not always statistically significant (p > 0.05). The superior growth performance observed under the GA treatment may be related to its greater capacity to improve soil nutrient availability and enzyme activities, thereby promoting nutrient acquisition and photosynthetic performance.
The FB application also reduced the incidence of downy mildew and leaf spot disease, with the GA treatment showing the most pronounced effect. The garlic FB was characterized by a high relative abundance of lactic acid bacteria and elevated concentrations of organic acids generated during fermentation. Organic acids and antimicrobial metabolites produced during fermentation, together with the enrichment of antagonistic microorganisms such as Lysobacter, may contribute to pathogen suppression [44,45]. In addition, improved soil fertility and plant nutritional status may enhance plant vigor and resistance to disease [40]. In short, the reduction in disease incidence is likely attributed to the combined effects of improved soil conditions, enhanced plant growth, and potential microbial-mediated suppression of pathogens.
Though the CF treatment produced the highest contents of soil nutrients and the greatest plant biomass due to the immediate availability of mineral nutrients, the FB treatments, particularly garlic FB, demonstrated distinct advantages in soil health, disease suppression and ecosystem sustainability. These complementary effects suggest that the CF remains effective for immediate yield improvement, but the FB applications offer additional benefits for soil health and disease management, highlighting their potential as integrated components of sustainable agricultural systems.
From a sustainable perspective, the recycling of fruit and vegetable wastes into FBs represents an effective strategy for organic waste valorization [46]. By transforming low-value agricultural residues into biologically active soil amendments, the fermentation technology contributes to waste reduction, nutrient recycling, and sustainable crop production [30]. The present study suggests that substrate selection is a critical factor influencing fermentation quality and subsequent ecological effects. Among the tested substrates, the garlic-derived FB showed the strongest associations with nutrient transformation, microbial regulation, plant growth promotion, and a tendency toward reduced disease incidence, highlighting its potential as a sustainable bio-based agricultural input for circular agriculture and environmentally friendly vegetable production.

4.5. Assessment of Potential Risks of FB Application

Although the application of FBs, particularly garlic FB, demonstrated multiple beneficial effects on soil properties and plant growth, their biosafety warrants careful consideration. Metagenomic analysis revealed the presence of several genera belonging to the family Enterobacteriaceae in the FBs, including Enterobacter, Klebsiella, and Pantoea (Figure 3). Members of these genera are known to have a dual nature. They can function as plant growth-promoting rhizobacteria (PGPRs) with beneficial traits, but are also recognized as opportunistic pathogens [47]. However, pathogenicity is strain-specific, and the presence of these genera does not necessarily equate to direct health risks. It should be noted that the present study did not systematically examine specific pathogenic species, virulence factors, or antibiotic resistance genes in the FBs. Therefore, future research should incorporate comprehensive biosafety assessments, including strain-level identification of potentially pathogenic taxa, screening for antibiotic resistance genes and virulence factors, and evaluation of pathogen persistence in soil and on crop surfaces, to ensure the safe and sustainable application of FBs in agricultural systems.

5. Conclusions

The physicochemical properties, enzyme activities, and microbial community structures of the FBs varied substantially among the different fruit and vegetable substrates, indicating that substrate composition is a key factor determining the functional characteristics of fermentation products. Among the 14 tested substrates, the garlic FB exhibited the highest nutrient concentrations, enzyme activities, and abundance of beneficial microbial taxa.
In summary, the application of FBs enhanced the nutrient contents and enzyme activities in the soil, improved the growth of Brassica chinensis, and reduced the incidence of crop downy mildew and leaf spot. Among the different FBs, the application of garlic FB showed the best effects on soil improvement, crop growth, and disease suppression. The beneficial effects of FBs were associated with the coupled processes of organic substrate input, microbial community regulation, stimulation of soil enzymatic activity, and nutrient activation. The CF treatment produced the highest contents of soil nutrients and the greatest plant biomass due to immediate availability of mineral nutrients. However, the FB treatments, particularly garlic FB, demonstrated distinct advantages in soil health, disease suppression and ecosystem sustainability.
Fruit and vegetable wastes can be effectively recycled into value-added bio-based FBs for agricultural inputs through anaerobic fermentation, which serves as an excellent approach for the sustainable utilization of organic wastes. However, the biosafety of FBs should be further assessed.

Author Contributions

X.L. conducted the experiments, performed data curation and analysis, and prepared the original manuscript. Z.G. assisted with the experimental work and data collection. X.H. conceived and supervised the study, provided methodological guidance, revised the manuscript, and approved the final version. All authors have read and agreed to the published version of the manuscript.

Funding

Supported by the National Natural Science Foundation of China (No. 42530506) and the Science and Technology Plan Project of Cixi City, Zhejiang Province, China (No. CN2023001).

Institutional Review Board Statement

Not applicable.

Informed Consent Statement

Not applicable.

Data Availability Statement

The datasets used in the current study have been uploaded and are available in the public data repository and are openly available at https://doi.org/10.5281/zenodo.21331919.

Conflicts of Interest

The authors declare no conflicts of interest.

References

  1. Taheri, S.; Hosseini, S.S. Waste Not, Want Not: Comprehensive Valorization of Fruit and Vegetable Waste from Single-Product Recovery to Zero-Waste Strategies. Clean. Waste Syst. 2025, 11, 100300. [Google Scholar] [CrossRef] [Scilit]
  2. Food and Agriculture Organization of the United Nations (FAO). Waste Management in Agribusiness: Challenges and Solutions; FAO: Rome, Italy, 2022. [Google Scholar]
  3. Roy, P.; Graceffa, V. From waste to therapeutics: Extraction methodologies and biological properties of bioactive compounds from fruit and vegetable waste. Food Biosci. 2024, 62, 105389. [Google Scholar] [CrossRef] [Scilit]
  4. Pasalari, H.; Moosavi, A.; Kermani, M.; Sharifi, R.; Farzadkia, M. A systematic review on garbage enzymes and their applications in environmental processes. Ecotoxicol. Environ. Saf. 2024, 277, 116369. [Google Scholar] [CrossRef] [Scilit] [PubMed]
  5. Liu, T.; Lin, Y.; Liu, P. Application and Research Progress of Garbage Enzyme in Agriculture. Adv. Environ. Prot. 2021, 11, 457–464. (In Chinese) [Google Scholar] [CrossRef]
  6. Zhu, G.; Wang, X.; Chen, R.; Wang, Y.; Tu, Q. Application and exploration of garbage enzymes in soil remediation of multiple heavy metal pollution. Sci. Rep. 2025, 15, 12075. [Google Scholar] [CrossRef] [Scilit] [PubMed]
  7. Fan, H.L.; Wang, H.C.; Chen, W.Y.; Lu, J.M.; Sun, X.B.; Zhu, Q.; Li, C.J.; Zhang, R.P. Effects of Enzymes on the Physicochemical Properties of Soils and Crop Growth in Hotspots. Chin. J. Agric. Meteorol. 2021, 37, 76–83. [Google Scholar] [CrossRef]
  8. Lu, X.; Huang, N.; Ai, J.; Fan, L.; Chen, L.; Meng, G.; Liu, J. The biological product agricultural jiaosu enhances tomato resistance to Botrytis cinerea. J. Fungi 2025, 11, 873. [Google Scholar] [CrossRef] [Scilit] [PubMed]
  9. Wen, T.G.; Guo, X.S.; Wu, C.W.; Du, X.F.; Wang, L.Z.; Gu, D.L.; Yang, W.F.; Wang, G.L.; Wang, W.Z. Effects of enzymatic bacteria on the growth and development of greenhouse bell peppers and the rhizosphere soil environment. Chin. Agric. Sci. Bull. 2015, 31, 55–60. [Google Scholar]
  10. Han, J.H.; Liu, Z.X.; Zhang, L.K.; Li, Y.M.; Jiang, Q.H.; Wang, W.D. Effects of garbage enzyme on key chemical properties of saline -alkali soil. Bull. Soil Water Conserv. 2019, 39, 126–131. [Google Scholar] [CrossRef]
  11. Gao, T.; Sheng, X.W.; Wu, Q.J.; Jian, X.Y.; Xing, J.Y.; Zhou, B.C.; Huang, N. Effects of apple enzyme application on physiological characteristics and fruit quality of strawberry plants. Hebei Agric. Sci. 2023, 27, 44–48. [Google Scholar]
  12. Zhao, Q.C.; Chen, J. Practical Production Technology of Integrated Water and Fertilizer Management for Major Protected Vegetables; China Agriculture Press: Beijing, China, 2022. [Google Scholar]
  13. State Environmental Protection Administration. Water and Wastewater Monitoring and Analysis Methods, 4th ed.; China Environmental Science Press: Beijing, China, 2002; pp. 214–279. [Google Scholar]
  14. Zhang, G.L.; Gong, Z.T. Soil Survey Laboratory Methods; Science Press: Beijing, China, 2012; pp. 85–130. (In Chinese) [Google Scholar]
  15. Li, Z.G.; Luo, Y.M.; Teng, Y. Soil and Environmental Microbiology Research Method; Science Press: Beijing, China, 2008. (In Chinese) [Google Scholar]
  16. Li, L. Experimental Guide for Plant Physiology Modules; Science Press: Beijing, China, 2009. (In Chinese) [Google Scholar]
  17. Li, D.; Liu, C.M.; Luo, R.; Sadakane, K.; Lam, T.W. MEGAHIT: An ultra-fast single-node solution for large and complex metagenomics assembly via succinct de Bruijn graph. Bioinformatics 2015, 31, 1674–1676. [Google Scholar] [CrossRef] [Scilit] [PubMed]
  18. Segata, N.; Izard, J.; Waldron, L.; Gevers, D.; Miropolsky, L.; Garrett, W.S.; Huttenhower, C. Metagenomic Biomarker Discovery and Explanation. Genome Biol. 2011, 12, R60. [Google Scholar] [CrossRef] [Scilit] [PubMed]
  19. El-Saber Batiha, G.; Magdy Beshbishy, A.G.; Wasef, L.; Elewa, Y.H.A.; Al-Sagan, A.A.; El-Hack, M.E.A.; Taha, A.E.; Abd-Elhakim, Y.M.; Prasad Devkota, H. Chemical Constituents and Pharmacological Activities of Garlic (Allium sativum L.): A Review. Nutrients 2020, 12, 872. [Google Scholar] [CrossRef] [Scilit] [PubMed]
  20. Petropoulos, S.A.; Fernandes, Â.; Ntatsi, G. Chemical Composition and Bioactive Compounds of Garlic (Allium sativum L.) as Affected by Pre- and Post-Harvest Conditions: A Review. Food Chem. 2016, 211, 41–50. [Google Scholar] [CrossRef] [Scilit] [PubMed]
  21. Shang, A.; Cao, S.-Y.; Xu, X.-Y.; Gan, R.-Y.; Tang, G.-Y.; Corke, H.; Mavumengwana, V.; Li, H.-B. Bioactive Compounds and Biological Functions of Garlic (Allium sativum L.). Foods 2019, 8, 246. [Google Scholar] [CrossRef] [Scilit] [PubMed]
  22. Cardinali, F.; Botta, C.; Harasym, J.; Ferrocino, I.; Reale, A.; Boscaino, F.; Di Renzo, T.; Milanović, V.; Garofalo, C.; Rampanti, G.; et al. Lacto-fermented garlic from Lower Silesia (Poland): Microbial diversity, texture, and volatile compounds. Food Res. Int. 2024, 188, 114484. [Google Scholar] [CrossRef] [Scilit] [PubMed]
  23. Jankowska, M.; Rejman, K.; Wysocka, K. Lactic acid bacteria in sustainable food production. Sustainability 2024, 16, 3362. [Google Scholar] [CrossRef] [Scilit]
  24. Zhao, N.; Wang, Y.C.; Yi, P.; Yan, Q.J.; Jiang, Z.Q. High-efficiency expression of α-amylase from Rhizopus camelinae in Pichia pastoris and its role in maltose syrup production. Food Ferment. Ind. 2019, 45, 1–6. [Google Scholar] [CrossRef]
  25. Hassan, L.; Reppke, M.J.; Thieme, N.; Schweizer, S.A.; Mueller, C.W.; Benz, J.P. Comparing the physiochemical parameters of three celluloses reveals new insights into substrate suitability for fungal enzyme production. Fungal Biol. Biotechnol. 2017, 4, 10. [Google Scholar] [CrossRef] [Scilit] [PubMed]
  26. Nannipieri, P.; Trasar-Cepeda, C.; Dick, R.P. Soil enzyme activity: A brief history and biochemistry as a basis for appropriate interpretations and meta-analysis. Biol. Fertil. Soils. 2018, 54, 11–19. [Google Scholar] [CrossRef] [Scilit]
  27. Kuzyakov, Y.; Blagodatskaya, E. Microbial hotspots and hot moments in soil: Concept and review. Soil Biol. Biochem. 2015, 83, 184–199. [Google Scholar] [CrossRef] [Scilit]
  28. Burns, R.G.; DeForest, J.L.; Marxsen, J.; Sinsabaugh, R.L.; Stromberger, M.E.; Wallenstein, M.D.; Weintraub, M.N.; Zoppini, A. Soil enzymes in a changing environment: Current knowledge and future directions. Soil Biol. Biochem. 2013, 58, 216–234. [Google Scholar] [CrossRef] [Scilit]
  29. Van der Heijden, M.G.A.; Bardgett, R.D.; van Straalen, N.M. The unseen majority: Soil microbes as drivers of plant diversity and productivity in terrestrial ecosystems. Ecol. Lett. 2008, 11, 296–310. [Google Scholar] [CrossRef] [Scilit] [PubMed]
  30. Lehmann, J.; Bossio, D.A.; Kögel-Knabner, I.; Rillig, M.C. The concept and future prospects of soil health. Nat. Rev. Earth Environ. 2020, 1, 544–553. [Google Scholar] [CrossRef] [Scilit] [PubMed]
  31. Lugtenberg, B. (Ed.) Principles of Plant-Microbe Interactions: Microbes for Sustainable Agriculture; Springer: Cham, Switzerland, 2015; pp. 45–67. [Google Scholar]
  32. Aloo, B.N.; Tripathi, V.; Makumba, B.A.; Mbega, E.R. Plant Growth-Promoting Rhizobacterial Biofertilizers for Crop Production: The Past, Present, and Future. Front. Plant Sci. 2022, 13, 1002448. [Google Scholar] [CrossRef] [Scilit] [PubMed]
  33. Asaf, S.; Numan, M.; Khan, A.L.; Al-Harrasi, A. Sphingomonas: From diversity and genomics to functional role in environmental remediation and plant growth. Crit. Rev. Biotechnol. 2020, 40, 138–152. [Google Scholar] [CrossRef] [Scilit] [PubMed]
  34. Masson-Boivin, C.; Sachs, J.L. Symbiotic nitrogen fixation by rhizobia—The roots of a success story. Curr. Opin. Plant Biol. 2018, 44, 7–15. [Google Scholar] [CrossRef] [Scilit] [PubMed]
  35. Rodrigues, M.Â.; Ladeira, L.C.; Arrobas, M. Azotobacter-Enriched Organic Manures to Increase Nitrogen Fixation and Crop Productivity. Eur. J. Agron. 2018, 93, 88–94. [Google Scholar] [CrossRef] [Scilit]
  36. Fierer, N. Embracing the unknown: Disentangling the complexities of the soil microbiome. Nat. Rev. Microbiol. 2017, 15, 579–590. [Google Scholar] [CrossRef] [Scilit] [PubMed]
  37. Cui, J.; Yang, B.; Zhang, M.; Song, D.; Xu, X.; Ai, C.; Liang, G.; Zhou, W. Investigating the Effects of Organic Amendments on Soil Microbial Composition and Its Linkage to Soil Organic Carbon: A Global Meta-Analysis. Sci. Total Environ. 2023, 894, 164899. [Google Scholar] [CrossRef] [Scilit] [PubMed]
  38. McIlroy, S.J.; Nielsen, P.H. The Family Saprospiraceae. In The Prokaryotes; Rosenberg, E., DeLong, E.F., Lory, S., Stackebrandt, E., Thompson, F., Eds.; Springer: Berlin/Heidelberg, Germany, 2014. [Google Scholar] [CrossRef] [Scilit]
  39. Lu, Z.; Kvammen, A.; Li, H.; Hao, M.; Inman, A.R.; Bulone, V.; McKee, L.S. A polysaccharide utilization locus from Chitinophaga pinensis simultaneously targets chitin and β-glucans found in fungal cell walls. mSphere 2023, 8, e00244-23. [Google Scholar] [CrossRef] [Scilit] [PubMed]
  40. Asghar, W.; Craven, K.D.; Swenson, J.R.; Kataoka, R.; Mahmood, A.; Farias, J.G. Enhancing the resilience of agroecosystems through improved rhizosphere processes: A strategic review. Int. J. Mol. Sci. 2025, 26, 109. [Google Scholar] [CrossRef] [Scilit] [PubMed]
  41. Jiang, K.; Sanseverino, J.; Chauhan, A.; Lucas, S.; Copeland, A.; Lapidus, A.; Del Rio, T.G.; Dalin, E.; Tice, H.; Bruce, D.; et al. Complete genome sequence of Thauera aminoaromatica strain MZ1T. Stand. Genom. Sci. 2012, 6, 324–334. [Google Scholar] [CrossRef] [Scilit] [PubMed]
  42. Christensen, P.; Cook, F.D. Lysobacter, a New Genus of Nonfruiting, Gliding Bacteria with a High Base Ratio. Int. J. Syst. Bacteriol. 1978, 28, 367–393. [Google Scholar] [CrossRef] [Scilit]
  43. Aüllo, T.; Ranchou-Peyruse, A.; Ollivier, B.; Magot, M. Desulfotomaculum spp. and Related Gram-Positive Sulfate-Reducing Bacteria in Deep Subsurface Environments. Front. Microbiol. 2013, 4, 362. [Google Scholar] [CrossRef] [Scilit] [PubMed]
  44. Drenker, C.; El Mazouar, D.; Bücker, G.; Weißhaupt, S.; Wienke, E.; Koch, E.; Kunz, S.; Reineke, A.; Rondot, Y.; Linkies, A. Characterization of a Disease-Suppressive Isolate of Lysobacter enzymogenes with Broad Antagonistic Activity against Bacterial, Oomycetal and Fungal Pathogens in Different Crops. Plants 2023, 12, 682. [Google Scholar] [CrossRef] [Scilit] [PubMed]
  45. Wang, C.; Chang, T.; Yang, H.; Cui, M. Antibacterial mechanism of lactic acid on physiological and morphological properties of Salmonella Enteritidis, Escherichia coli, and Listeria monocytogenes. Food Control 2015, 47, 231–236. [Google Scholar] [CrossRef] [Scilit]
  46. Koul, B.; Yakoob, M.; Shah, M.P. Agricultural waste management strategies for environmental sustainability. Environ. Res. 2022, 206, 112285. [Google Scholar] [CrossRef] [Scilit] [PubMed]
  47. Keswani, C.; Prakash, O.; Bharti, N.; Vílchez, J.I.; Sansinenea, E.; Lally, R.D.; Borriss, R.; Singh, S.P.; Gupta, V.K.; Fraceto, L.F.; et al. Re-addressing the Biosafety Issues of Plant Growth Promoting Rhizobacteria. Sci. Total Environ. 2019, 690, 841–852. [Google Scholar] [CrossRef] [Scilit] [PubMed]
Figure 1. Bacterial (A) and fungal counts (B) in the FBs from the different fruits and vegetables. Data are presented as mean ± SE (n = 3). Different letters above the bars indicate significant differences among the substrates (p < 0.05, Duncan’s test).
Sustainability 18 07369 g001
Figure 2. Relative abundances of microbial communities at the domain level (Bacteria, Eukaryota, Archaea, and Viruses) in fermentation broths derived from 14 different fruit and vegetable substrates. The data are presented as percentages of total microbial sequences. (n = 3).
Sustainability 18 07369 g002
Figure 3. Taxonomic composition of microbial communities in the FBs derived from different fruit and vegetable substrates at the genus level or the lowest classified taxonomic level (n = 3). Only genera with relative abundance > 1% are shown; low-abundance taxa are grouped as “others”.
Sustainability 18 07369 g003
Figure 4. Relative abundances of KEGG enzyme-associated functional genes in the FBs derived from different fruit and vegetable substrates. Functional genes were classified into six major categories: translocases, transferases, isomerases, oxidoreductases, hydrolases, and others. Data are presented as mean (n = 3).
Sustainability 18 07369 g004
Figure 5. Incidences of leaf spot, downy mildew, and aphid infestation in Brassica chinensis under the different treatments in the second pot experiment. Data are presented as mean ± SE (n = 3). Different letters above the bars indicate significant differences among the treatments within each disease/pest category (one-way ANOVA followed by Duncan’s test, p < 0.05). Aphid incidence showed no significant differences among the treatments (all groups: 100%).
Sustainability 18 07369 g005
Figure 6. Relative abundance of microbial communities at the phylum to genus levels in the soil under different treatments in the second pot experiment. Data are presented as mean (n = 3).
Sustainability 18 07369 g006
Figure 7. Principal coordinates analysis (PCoA) of soil microbial communities (n = 3). PERMANOVA (999 permutations) confirmed significant differences among the treatments (R2 = 0.195, pseudo-F = 4.589, p = 0.001). CK, control, deionized water; AP, apple FB; TO, tomato FB; GA, garlic FB; LE, lettuce FB; SP, sweet potato FB; CF, chemical fertilizer.
Sustainability 18 07369 g007
Figure 8. LEfSe identification of soil microbial biomarkers among the treatments (n = 3). (A) Cladogram showing phylogenetic relationships of differentially abundant taxa across taxonomic levels. (B) Histogram of LDA scores (LDA > 3.0) indicating the effect size and enrichment direction of each biomarker in the corresponding treatment.
Sustainability 18 07369 g008
Figure 9. Pearson’s correlation matrix of soil properties, enzyme activities, and plant growth indices (n = 3). The color gradient indicates the correlation coefficient (r), with red indicating positive and blue indicating negative correlations. Asterisks indicate significance levels (* p < 0.05; ** p < 0.01).
Sustainability 18 07369 g009
Table 1. Nutrient contents and pH value in the FBs from the different fruits and vegetables.
SubstratesOM
(g/L)
AmN
(mg/L)
TP
(mg/L)
DTP
(mg/L)
TK
(mg/L)
Garlic28.99 ± 3.29 a309.81 ± 12.65 a327.73 ± 20.12 a236.34 ± 18.66 a1365.8 ± 34.45 a
Sweet Potato22.57 ± 1.13 c180.1 ± 12.28 b301.1 ± 23.66 b227.11 ± 21.12 b1143.98 ± 101 cd
Apple27.43 ± 2.32 b160.31 ± 3.82 c50.88 ± 3.45 l41.8 ± 2.45 i819.6 ± 33.49 ef
Persimmon18.43 ± 2.34 e130.92 ± 5.73 f38.81 ± 6.45 m28.86 ± 1.45 l1002.4 ± 56.93 de
Onion7.43 ± 0.89 j9.55 ± 0.97 m51.66 ± 4.34 k38.58 ± 4.34 j707.40 ± 37.45 f
Ginger6.43 ± 0.87 k40.58 ± 3.22 k61.58 ± 4.8 f80.79 ± 5.09 d1245.34 ± 95.69 bc
Chili Pepper9.43 ± 1.18 i34.78 ± 3.05 l67.69 ± 13.09 h48.93 ± 3.09 h963.19 ± 37.45 de
Tomato13.26 ± 0.53 h130.32 ± 3.30 g13.45 ± 11.26 n8.07 ± 1.26 m1234.9 ± 109.44 bc
Pumpkin20.42 ± 2.24 d143.54 ± 1.93 d72.55 ± 15.33 f51.05 ± 2.33 f890.62 ± 45.63 ef
Lettuce22.33 ± 2.29 c112.94 ± 4.46 j82.89 ± 3.45 c54.7 ± 3.45 e817.62 ± 34.92 ef
Carrot15.53 ± 2.15 g136.2 ± 30.9 e120.48 ± 21.66 e73.78 ± 14.66 c913.12 ± 27.98 e
Pear16.43 ± 1.02 f130.84 ± 11.75 g67.12 ± 16.45 i47.81 ± 6.45 h879.20 ± 56.45 ef
Dragon Fruit17.53 ± 1.22 e109.34 ± 6.45 j69.30 ± 13.55 g43.59 ± 13.45 i1355.89 ± 80.56 ab
Banana17.55 ± 2.22 e120.16 ± 2.08 h52.44 ± 15.34 j31.19 ± 5.34 k1329.9 ± 146.45 abc
Note: Letters denote Duncan’s multiple-comparison results (p < 0.05). Values are mean ± SE (n = 3). Different letters within a column indicate significant differences among substrates (p < 0.05, Duncan’s test). The same as below.
Table 2. Enzyme activities in the FBs from the different fruits and vegetables.
SubstratesACP
(mg/mL/h)
PRT
(U/mL)
URE
(U/mL)
CEL
(U/mL)
AMY
(U/mL)
Garlic358.38 ± 21.6 a2.36 ± 0.27 a95.26 ± 7.3 a28.98 ± 4.54 f4.14 ± 0.42 h
Sweet Potato87.10 ± 19.09 cd1.26 ± 0.19 bc17.09 ± 2.08 de61.88 ± 3.45 d96.55 ± 8.72 a
Apple103.89 ± 18.93 c0.31 ± 0.02 i5.03 ± 0.39 h89.08 ± 7.09 a8.45 ± 1.04 e
Persimmon134.99 ± 18.94 b0.47 ± 0.05 gh5.09 ± 0.29 h86.99 ± 6.32 a16.71 ± 2.35 c
Onion101.18 ± 20.92 c1.32 ± 0.11 b41.32 ± 3.5 b38.99 ± 4.66 e13.87 ± 1.87 d
Ginger123.82 ± 17.94 bc1.20 ± 0.21 bc7.32 ± 1.22 fg31.82 ± 4.23 f4.61 ± 0.32 h
Chili Pepper72.35 ± 13.98 d1.25 ± 0.22 bc21.20 ± 3.09 d12.35 ± 2.54 h1.34 ± 0.16 j
Tomato45.67 ± 3.8 h0.78 ± 0.07 ef8.98 ± 1.32 f21.88 ± 4.57 g1.19 ± 0.53 j
Pumpkin119.98 ± 20.92 bc0.83 ± 0.11 ef5.59 ± 0.41 gh39.82 ± 3.65 e19.84 ± 2.61 c
Lettuce145.98 ± 19.23 b1.09 ± 0.14 cd32.09 ± 4.22 c74.92 ± 4.99 b1.32 ± 0.10 j
Carrot94.31 ± 13.09 c0.79 ± 0.13 ef5.79 ± 0.22 gh68.77 ± 2.83 c12.45 ± 1.55 d
Pear89.09 ± 14.09 c0.40 ± 0.07 hi4.43 ± 0.69 hi74.98 ± 4.01 b1.56 ± 0.10 ij
Dragon Fruit113.90 ± 15.93 c0.74 ± 0.08 f2.09 ± 0.19 i40.92 ± 5.45 e5.59 ± 0.62 g
Banana102.9 ± 14.09 c0.84 ± 0.12 ef15.09 ± 1.66 e62.83 ± 5.90 d23.94 ± 3.17 b
Note: Letters denote Duncan’s multiple-comparison results (p < 0.05). Values are mean ± SE (n = 3). Different letters within a column indicate significant differences among substrates (p < 0.05, Duncan’s test). The same as below.
Table 3. Nutrient contents and enzyme activities in the soil across the different treatments in the second pot experiment.
IndexesCKAPTOGALESPCF
TN
(g/kg)
1.21
± 0.10 d
1.54
± 0.10 bc
1.42
± 0.12 c
1.71
± 0.16 ab
1.58
± 0.10 b
1.65
± 0.12 b
1.78
± 0.15 a
AmN
(mg/kg)
140.11
± 15.75 d
159.34
± 11.95 c
163.23
± 14.08 bc
170.34
± 12.63 b
164.23
± 11.66 bc
163.04
± 19.67 bc
178.32
± 15.44 a
TK
(mg/kg)
988.35
± 111.69 d
1631.73
± 110.04 c
1556.55
± 126.32 c
1715.43
± 154.86 b
1601.73
± 110.07 c
1586.53
± 106.13 c
1834.14
± 132.25 a
AK
(mg/kg)
15.90
± 3.63 d
36.86
± 2.59 c
36.86
± 2.59 c
57.01
± 5.15 a
44.54
± 5.30 b
44.23
± 4.56 b
46.18
± 5.05 b
TP
(mg/kg)
685.32
± 98.40 c
1062.32
± 113.40 b
1086.45
± 137.40 b
1132.32
± 114.20 b
1102.30
± 119.34 b
1029.20
± 113.45 b
1273.84
± 114.30 a
AvP
(mg/kg)
14.20
± 2.30 c
24.46
± 2.60 b
25.20
± 3.30 b
31.20
± 3.30 a
24.40
± 3.20 b
26.11
± 3.20 b
27.70
± 2.20 b
SOM (%)1.48
± 0.21 c
1.72
± 0.43 b
1.68
± 0.32 b
2.04
± 0.27 a
1.81
± 0.34 ab
1.82
± 0.33 ab
1.51
± 0.42 c
β-Glu
(μg·PNP/g/4 h)
129.06
± 5.66 c
137.50
± 6.36 bc
133.33
± 3.51 c
158.33
± 9.71 a
138.67
± 6.11 bc
124.67
± 8.50 c
149.11
± 8.49 b
ACP
(mg/g)
11.67
± 1.00 d
16.32
± 2.34 c
18.26
± 2.10 b
24.78
± 2.65 a
16.22
± 1.76 c
14.87
± 3.13 c
18.52
± 3.33 b
URE
(mg/g/d)
0.83
± 0.21 c
1.79
± 0.56 b
1.72
± 0.32 b
2.33
± 0.22 a
1.75
± 0.43 b
1.64
± 0.35 b
1.74
± 0.46 b
CAT
(mg/g)
0.66
± 0.18 d
0.88
± 0.21 c
0.76
± 0.23 c
1.21
± 0.26 a
0.97
± 0.25 bc
1.16
± 0.13 b
0.79
± 0.24 c
Note: This table presents data from the second experiment only; letters denote Duncan’s multiple-comparison results (p < 0.05). Values are mean ± SE (n = 3). Different letters within a column indicate significant differences among substrates (p < 0.05, Duncan’s test).
Table 4. Growth indices and biochemical properties of the leaves of Brassica chinensis across the different treatments on the two pot experiments.
IndexesExperimentCKAPTOGALESPCF
Leaf
number
First
experiment
5.00
± 1.00 c
6.67
± 0.58 c
7.33
± 0.58 b
8.67
± 0.58 a
8.33
± 0.58 a
8.33
± 0.58 a
9.67
± 0.58 a
Second
experiment
7.66
± 0.58 c
8.66
± 1 bc
8.66
± 0.58 c
11.00
± 2.08 b
8.00
± 2.08 c
8.00
± 1 c
13.34
± 1 a
Plant height
(cm)
First
experiment
4.37
± 1.12 c
5.83
± 0.20 b
5.53
± 0.33 c
6.72
± 0.24 a
5.81
± 0.41 b
5.53
± 0.31 c
7.56
± 0.47 a
Second
experiment
6.42
± 0.5 e
8.3
± 0.34 c
7.9
± 0.6 d
9.6
± 0.5 b
8.3
± 0.3 c
7.9
± 0.4 d
10.8
± 0.4 a
Leaf Length
(cm)
First
experiment
5.36
± 0.86 b
5.53
± 0.51 b
5.34
± 0.60 b
6.47
± 0.57 a
5.57
± 0.39 b
5.50
± 0.42 b
7.38
± 0.61 a
Second
experiment
7.66
± 0.34 c
7.90
± 0.37 c
7.63
± 0.40 c
9.24
± 0.43 b
7.95
± 0.34 c
7.85
± 0.33 c
10.54
± 0.34 a
Leaf width
(cm)
First
experiment
3.15
± 0.43 b
3.76
± 0.39 b
3.74
± 0.51 b
4.63
± 0.38 a
4.01
± 0.46 a
3.83
± 0.42 a
4.97
± 0.42 a
Second
experiment
4.50
± 0.30 e
5.37
± 0.55 d
5.34
± 0.30 d
6.62
± 0.50 b
5.73
± 0.30 c
5.47
± 0.50 d
7.10
± 0.60 a
Protein content
(mg/g)
First
experiment
19.15
± 3.21 a
25.34
± 4.22 a
23.70
± 5.31 a
23.49
± 4.62 a
24.23
± 5.62 a
23.63
± 4.88 a
26.21
± 3.37 a
Second
experiment
22.53
± 3.12 b
29.81
± 2.52 ab
27.88
± 3.71 ab
27.64
± 3.12 ab
28.51
± 2.68 ab
27.80
± 3.64 ab
30.83
± 3.22 a
Soluble sugar
(g/kg)
First
experiment
16.07
± 5.65 a
21.39
± 3.58 a
20.64
± 4.22 a
20.84
± 3.15 a
20.60
± 4.51 a
20.68
± 3.82 a
23.60
± 3.21 a
Second
experiment
18.9
± 2.32 c
25.17
± 2.16 b
24.28
± 3.77 b
24.52
± 3.29 b
24.23
± 3.18 b
24.33
± 2.41 b
27.77
± 2.8 a
Chlorophyll
(mg/g)
First
experiment
2.16
± 0.42 a
3.08
± 0.22 a
2.69
± 0.41 a
2.96
± 0.52 a
2.88
± 0.46 a
2.75
± 0.33 a
3.24
± 0.39 a
Second
experiment
2.54
± 0.03 e
3.62
± 0.11 ab
3.17
± 0.04 c
3.48
± 0.22 b
3.39
± 0.04 b
3.24
± 0.12 d
3.81
± 0.24 a
Total biomass
(g)
First
experiment
3.18
± 0.84 d
4.10
± 0.51 c
4.37
± 0.53 c
8.13
± 0.51 b
4.45
± 0.37 c
4.75
± 0.44 c
11.19
± 0.33 a
Second
experiment
6.43
± 1.50 c
6.30
± 1.20 d
6.72
± 1.40 c
12.50
± 2.30 b
6.84
± 2.10 c
7.31
± 1.60 c
17.21
± 3.30 a
Aboveground biomass
(g)
First
experiment
2.86
± 0.72 c
3.97
± 0.33 c
3.77
± 0.47 c
7.74
± 0.38 b
3.71
± 0.51 c
3.71
± 0.59 c
10.53
± 1.22 a
Second
experiment
4.70
± 1.00 d
6.10
± 0.90 c
5.80
± 1.50 c
11.90
± 1.20 b
5.70
± 1.20 c
5.70
± 1.10 c
16.20
± 2.40 a
Note: Values are mean ± SE (n = 3). Different letters within a column indicate significant differences among substrates (p < 0.05, Duncan’s test).
Table 5. Microbial alpha diversity indices of the soil across the different treatments in the second pot experiment.
TreatmentsACEChao1ShannonSimpsonCoverageSobs
CK1657.28
± 141.96 b
1650.13
± 142.77 b
6.72
± 0.06 c
0.004
± 0.00 bc
0.999
± 0.001 b
1843.33
± 140.17 b
AP1685.71
± 240.58 c
1674.50
± 238.90 c
6.43
± 0.44 e
0.008
± 0.008 a
0.999
± 0.000 b
1668.33
± 236.58 c
TO1863.50
± 314.45 b
1836.24
± 298.02 b
6.50
± 0.24 d
0.006
± 0.003 ab
0.997
± 0.002 c
1809.00
± 280.66 b
GA1885.58
± 185.82 b
1878.91
± 184.91 b
6.83
± 0.21 ab
0.003
± 0.001 cd
0.999
± 0.000 ab
1874.33
± 184.11 b
LE2222.23
± 422.91 a
2199.02
± 406.58 a
6.83
± 0.41 ab
0.005
± 0.004 ab
0.996
± 0.002 d
2158.00
± 375.72 a
SP2110.64
± 331.36 a
2103.09
± 326.66 a
6.90
± 0.20 a
0.003
± 0.001 bc
0.997
± 0.002 c
2068.33
± 297.14 a
CF1883.33
± 116.45 b
1879.31
± 115.51 b
6.85
± 0.13 ab
0.003
± 0.001 d
0.999
± 0.000 a
1877.33
± 114.85 b
Note: Chao1, ACE, Shannon, Simpson, Coverage and Sobs are the indices of microbial alpha diversity. Data are presented as mean ± SE (n = 3). The values in the same column showing different letters are different among the treatments at a significant level (p < 0.05).
Disclaimer/Publisher’s Note: The statements, opinions and data contained in all publications are solely those of the individual author(s) and contributor(s) and not of MDPI and/or the editor(s). MDPI and/or the editor(s) disclaim responsibility for any injury to people or property resulting from any ideas, methods, instructions or products referred to in the content.