Article

AI Multimodal Capability and Inclusive Innovation: The Mediating Roles of AI-Enhanced Customer Empathy and Generative Inclusive Design and the Moderating Roles of AI Ethical Awareness and Data Governance Quality


1
School of Public Policy and Administration, Xi’an Jiaotong University, No. 29 West Xianning Road, Xi’an 710049, China
2
School of Economics and Finance, Xi’an Jiaotong University, No. 29 West Xianning Road, Xi’an 710049, China
*
Author to whom correspondence should be addressed.
Sustainability 2026, 18(14), 7345; https://doi.org/10.3390/su18147345 (registering DOI)
Submission received: 13 June 2026 / Revised: 7 July 2026 / Accepted: 15 July 2026 / Published: 17 July 2026
(This article belongs to the Section Economic and Business Aspects of Sustainability)

Abstract

The rapid advancement of artificial intelligence (AI) offers significant opportunities for innovation, yet its benefits remain unequally distributed, with digitally marginalized groups often left behind. Based on the attention-based view and dynamic capability theory, this study investigates how firms may leverage AI’s multimodal capability to foster inclusive innovation, the moderating effects of AI ethical awareness and data governance quality, and the mediating effects of AI-enhanced customer empathy and generative inclusive design. Using survey data from 233 Chinese firms, we employ hierarchical regression and bootstrap analysis to test the hypotheses. The results show that AI multimodal capability is positively associated with inclusive innovation: AI ethical awareness and data governance quality positively moderate this relationship, while AI-enhanced customer empathy and generative inclusive design mediate it. These findings suggest that inclusive innovation is not merely a social imperative but a strategically achievable outcome through deliberate use of AI, and offer actionable insights for firms’ AI-enabled innovation practices.

1. Introduction

Artificial intelligence (AI) has become a transformative force in business, reshaping new product development (NPD), enhancing operational efficiency, and enabling novel forms of value creation [1,2,3]. AI reduces development cycles and enables personalized offerings [4,5], positioning it as a key enabler of competitive advantage [6]. However, its benefits are unequally distributed. Digitally marginalized groups, including the elderly, low-educated populations, low-income communities, and rural residents, face three types of obstacles that limit their access to AI-driven benefits: access barriers due to underdeveloped digital infrastructure, skill barriers due to low digital literacy (i.e., the ability to access, evaluate, and effectively use information and communication technologies to participate in the digital economy; [7,8]), and psychological barriers arising from concerns about unfamiliarity, safety, privacy, and trustworthiness [9,10]. Approximately 700 million people aged 40 and above—many of whom have limited digital access or literacy—remain underserved by AI-driven products [11]. Overlooking these populations not only constrains aggregate demand but also deepens cycles of socioeconomic vulnerability [12].
At the technological level, the lack of training data from marginalized groups can lead to algorithmic bias, reducing AI’s applicability in these markets [13], which may, in turn, steer firms’ AI investments toward mainstream applications, causing them to miss opportunities to collect and leverage the sparse and multimodal data generated by marginalized populations, ultimately limiting their capacity to serve these markets [14]. Socially, skill and psychological barriers may widen with the advancement of AI, reducing participation opportunities and increasing social exclusion for those omitted from the value creation system of the digital economy [15,16]. In this situation, inclusive innovation, defined as firms’ development of products and services that address the untapped needs of digitally marginalized populations [17,18], may become the key to solving these issues.
Specifically, unlike conventional innovation, which focuses primarily on the mainstream market, inclusive innovation targets users who generally have poor infrastructure conditions, relatively lower affordability, and lack digital literacy. Firms that achieve the former under such constraints (e.g., low digital literacy, limited infrastructure, and atypical usage contexts) would generate solutions that not only serve the marginalized populations, but also offer insights that may benefit the offerings for mainstream markets [10]. In this case, inclusive innovation could be deemed essential for achieving the Sustainable Development Goals [19]. Notably, it requires firms’ accurate positioning of user needs, deep empathy and contextual immersion of users’ scenarios, and rapid iterations of solution design and testing [20,21].
First, information regarding the needs of digitally marginalized users is often fragmented and tacit, conveyed through sparse multimodal signals (e.g., facial expressions, voice, and online footprints) that conventional customer needs research methods cannot fully capture and accurately interpret [22,23]. As suggested by Warner and Wäger [24], sensing external opportunities in digital contexts requires firms to use digital scouting capabilities that can comprehensively capture and interpret weak signals. In this situation, AI multimodal capability, defined as the ability to collect, integrate, and process data from multiple sources (e.g., texts, images, voice, video, and sensors) to generate holistic insights [25,26], would enable firms to capture the information from marginalized groups and transform it into understandable cues and insights [27,28]. However, existing studies tend to treat AI as a monolithic capability and focus on mainstream financial or innovation performance [2,3,29]; although recent work has begun to explore inclusive AI capability [30] and responsible AI attention [31], the role of AI multimodal capability in inclusive innovation remains underexplored.
Second, traditional customer analytics focus on understanding explicit preferences in mainstream markets [32]; thus, even when firms have multimodal data from marginalized markets, they may still need to go beyond the traditional paradigm to interpret the unarticulated needs of those users. From a dynamic capability perspective, sensing requires not just data but also the ability to interpret ambiguous signals from external actors [24], which, in the scenario of inclusive innovation, requires empathic understanding of users’ unarticulated needs [12,33,34]. AI-enhanced customer empathy, defined as firms’ use of AI technologies (e.g., Natural Language Processing (NLP), affective computing, and multimodal sentiment analysis) to interpret, understand, and resonate with the context-dependent needs of digitally marginalized users [10,35], enables firms to accurately define latent needs that would otherwise remain invisible. Moreover, designing solutions for marginalized users should account for their diversified and atypical usage scenarios, with the premise that firms face tight budget and time constraints [36,37]. Digital seizing, according to dynamic capability theory, should involve rapid prototyping and balancing digital portfolios [24]. Generative inclusive design, namely firms’ use of generative AI to rapidly and creatively produce diverse, accessible, and adaptable design alternatives, is an approach that firms may employ for their inclusive innovation projects [4,20]; in contrast to the traditional paradigm, it enables companies to explore numerous design variations at near-zero marginal cost and test them in simulated environments before deployment [27]. Thus, AI multimodal capability may enhance inclusive innovation through two parallel, yet complementary, pathways: AI-enhanced customer empathy, which addresses the interpretation of latent needs, and generative inclusive design, which enables the generation of tangible solutions, which both indicate the tentative paths that warrant further exploration.
Third, the effectiveness of firms’ AI use may depend on managers’ awareness of AI ethical principles and the quality of firms’ data governance. Specifically, managers with higher levels of AI ethical awareness, defined as the extent to which they recognize and prioritize AI ethical principles (i.e., fairness, accountability, transparency, privacy, and non-maleficence) in their development and use of AI [38,39], are more likely to direct their company’s strategic attention toward the exploration of digitally marginalized markets and use their AI multimodal capability in ways that mitigate rather than inadvertently amplify existing inequalities [40]. Similarly, the multimodal data produced by marginalized users are often sparse and contain sensitive information, which heightens their vulnerability to data-related ethical risks (e.g., leakage, misuse, and exclusionary data collection) [41,42]. Data governance quality, reflecting the robustness of a firm’s policies, processes, and systems for safeguarding data availability, integrity, security, privacy, and regulatory compliance [43,44], is therefore crucial for ensuring that multimodal data from marginalized populations are ethically sourced, accurately labeled, securely stored, and appropriately used, which in turn supports reliable AI training and fair algorithmic outcomes [45]. However, prior studies have largely treated AI ethics as design principles [38,46] and data governance as regulatory compliance [43], with limited empirical evidence on how they condition the effectiveness of specific AI capabilities for inclusive social outcomes.
To address these gaps, we draw on the attention-based view [47] and dynamic capability theory [24,48] to investigate how AI multimodal capability is associated with firms’ inclusive innovation, the mediating roles of AI-enhanced customer empathy and generative inclusive design, and the moderating roles of AI ethical awareness and data governance quality. This study makes several contributions to the literature.
First, we specify AI multimodal capability as a distinct AI capability that addresses the information collection and interpretation challenges inherent in inclusive innovation for digitally marginalized groups. In doing so, we enrich the antecedent research of inclusive innovation, and add to the discussion around the social and sustainability outcomes of AI development, addressing the call for research on AI’s contribution to the Sustainable Development Goals (SDGs) [2,49]. Second, we examine two parallel mediating pathways, AI-enhanced customer empathy and generative inclusive design, through which AI multimodal capability may relate to inclusive innovation, thereby situating firms’ AI-enabled and -augmented innovation activities within the dynamic process of value creation in the digitally marginalized market context. Third, we identify AI ethical awareness and data governance quality, which reflect firms’ ethical practices in AI development and deployment, and illustrate how they may shape the relations between AI multimodal capability and inclusive innovation. In this way, we respond to the growing recognition that AI’s societal benefits are contingent on an ethical framework that ensures fairness, transparency, and accountability when using specific AI capabilities, particularly for populations vulnerable to AI-related harms, and support the necessity of responsible AI use [39,45].

2. Theoretical Background and Hypotheses Development

2.1. Theoretical Foundations: Attention-Based View and Dynamic Capability Theory

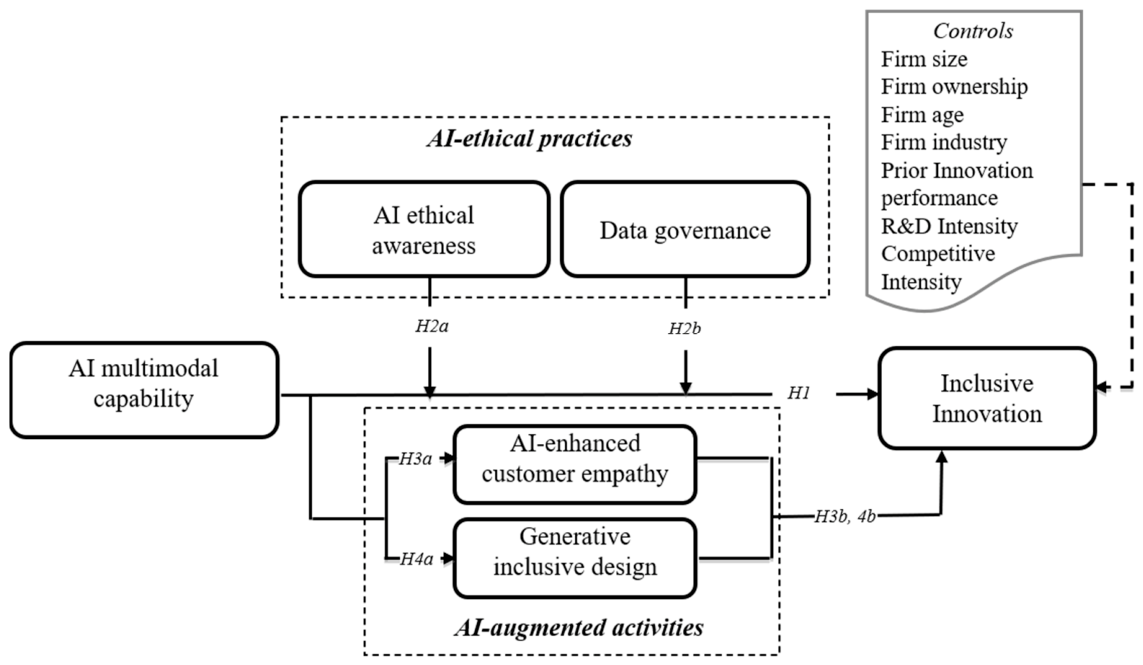
We integrate the attention-based view [47] with dynamic capability theory [24,48] to develop our conceptual framework. The former posits that organizational decision-makers operate under bounded rationality, and that what managers focus on determines the specific projects that receive resources and managerial attention, and the strategic actions that are prompted [47]. Without awareness of the needs of digitally marginalized groups, whose observable signals are often weak, fragmented, and embedded in non-standard modalities, firms tend to allocate R&D resources to mainstream, high-return applications, thereby inhibiting inclusive innovation initiatives and perpetuating the digital divide [9,10]. The latter complements ABV by illustrating how firms translate attention into strategic action through sensing, seizing, and transforming [27,48]. Specifically, sensing involves identifying and interpreting opportunities and threats based on information collection from the external environment. In the inclusive innovation context, however, this task is particularly challenging because user signals are sparse, fragmented, and cross-modal; in this case, AI multimodal capability is needed to collect and integrate such data for firms to detect latent needs that would otherwise remain invisible. Seizing refers to mobilizing internal capabilities and resources to address opportunities; in this context, AI-enhanced customer empathy, which interprets latent needs through AI-augmented empathic understanding of user signals, and AI-enabled generative inclusive design, which rapidly produces and tests diverse and adaptable design alternatives, are key activities that translate the aforementioned collected and integrated multimodal data into inclusive innovation outcomes. Transforming refers to the continuous renewal and reconfiguration of organizational resources and routines in response to environmental changes [48]. However, in our research context, where AI technologies introduce risks of bias and opacity [38,46] and the targeted users are particularly vulnerable to data misuse [9,10], transformation may occur throughout the process, shaping how AI capabilities are directed toward inclusive outcomes. AI ethical awareness, as managers’ recognition and prioritization of ethical principles, and data governance quality, as the robustness of firms’ data-related policies and systems, are the important governance logics and practices that would moderate the strength of the association between AI multimodal capability and inclusive innovation. Figure 1 presents our conceptual framework.

2.2. AI Multimodal Capability and Inclusive Innovation

Inclusive innovation, as defined earlier, targets digitally marginalized populations whose needs are often expressed through non-standard, fragmented, and cross-modal signals [17,18]. Unlike mainstream innovation, which typically assumes that target users possess adequate digital literacy, infrastructure access, and the ability to articulate preferences, inclusive innovation should address the latent needs of marginalized users hidden behind the multimodal signals they produce, such as a low-income user’s voice query with strong ambient noise or a rural resident’s low-resolution image-based question [23]. Therefore, inclusive innovation builds on the premises of data sparsity, signal heterogeneity, and contextual extremity, requiring firms to collect, integrate, and process heterogeneous, often noisy, multimodal data. AI multimodal capability, as noted earlier, is the ability to collect, integrate, and process data across diverse modalities, including text, images, speech, video, and sensors, to generate holistic insights [25,26], a fusion capability that is critical for capturing the fragmented, non-standard, and often incomplete signals produced by digitally marginalized users. We argue that AI multimodal capability is positively associated with inclusive innovation.
First, AI multimodal capability helps firms identify latent needs that are not detectable through unimodal analysis; for example, combining facial expression analysis (video) with voice sentiment (audio) and usage patterns (sensor data) can reveal that an elderly user is not only struggling with interface complexity but also experiencing anxiety about data privacy, an insight that traditional analytics can hardly generate [35]. By surfacing such tacit, context-dependent data, AI multimodal capability can assist firms in recognizing the needs of marginalized users who cannot easily articulate their requirements. Second, by processing extreme-case, low-quality data (e.g., low-resolution images, incomplete voice commands from noisy contexts), AI multimodal capability enables firms to train on such data [27], thereby generating solutions that are robust within the usage contexts of marginalized users rather than assuming that trickle-down solutions designed for mainstream users will naturally work [13,14]. Third, as managers observe the unfulfilled needs of marginalized populations identified through multimodal data, they may become more willing to allocate attention and resources toward inclusive innovation projects, potentially generating reputational and market returns [29,47].
H1. 
AI multimodal capability is positively associated with inclusive innovation.

2.3. Moderating Roles of AI Ethical Awareness and Data Governance Quality

2.3.1. The Moderating Role of AI Ethical Awareness

AI ethical awareness, as defined earlier, reflects managers’ recognition and prioritization of AI ethical principles such as fairness, accountability, transparency, privacy, and non-maleficence in their AI-related practices [38,39]. We argue that this positively moderates the relationship between AI multimodal capability and inclusive innovation.
First, given that digitally marginalized groups are particularly vulnerable to algorithmic bias, privacy violations, and manipulative design [9,10], firms with higher levels of AI ethical awareness are more obliged to collect and analyze multimodal data in ways that safeguard user privacy, avoid stereotyping, and ensure the inclusion of marginalized signals and details [40]. These practices would enhance the effectiveness of AI multimodal capability in generating inclusive innovation outcomes, as the resulting insights are less likely to be based on biased or discriminatory data processing; for instance, an ethically aware firm would endeavor to ensure that its multimodal models perform consistently across different demographic groups, dialects, and cultural contexts, rather than applying a model trained primarily on mainstream data in a one-size-fits-all manner [35]. Second, ethical awareness encourages firms to involve marginalized users in their innovation process, which would increase the suitability and applicability of the resulting inclusive innovation outcomes [45]. In contrast, firms with low ethical awareness may deploy multimodal analytics in ways that extract insights without informed consent and reinforce stereotypes about marginalized groups (e.g., associating low-income users with risk-averse preferences), thereby decreasing the potential benefits that AI multimodal capability could otherwise generate for inclusive innovation [50].
H2a. 
AI ethical awareness positively moderates the relationship between AI multimodal capability and inclusive innovation.

2.3.2. The Moderating Role of Data Governance Quality

Data governance quality, as defined earlier, refers to the robustness of a firm’s policies, processes, and systems for safeguarding data availability, integrity, security, privacy, and regulatory compliance [43,44]. We argue that data governance quality positively moderates the relationship between AI multimodal capability and inclusive innovation.
First, marginalized users often produce sparse, noisy, and sensitive data [9]. Firms with higher data governance quality are better positioned to ensure that such multimodal data are ethically sourced, accurately labeled, securely stored, and appropriately anonymized [45], which helps preserve meaningful signals for uncovering the tacit needs and usage patterns of marginalized populations. In this way, AI models can learn from more reliable and readily prepared data to generate insights that are accurate, fair, and privacy-preserving [40]; for instance, robust data lineage and audit trails allow firms to trace whether a generated design insight inadvertently encodes bias present in the training data [43]. Second, data governance practices, such as regular data quality assessments and privacy-preserving data sharing, may help firms continuously improve training datasets with feedback from marginalized users, thereby enhancing the relevance and applicability of the resulting inclusive innovation outcomes [51].
H2b. 
Data governance quality positively moderates the relationship between AI multimodal capability and inclusive innovation.

2.4. Mediating Roles of AI-Enhanced Customer Empathy and Generative Inclusive Design

2.4.1. The Mediating Role of AI-Enhanced Customer Empathy

Effective inclusive innovation requires deep understanding of the unspoken, emotionally charged, and usage scenario-dependent needs of marginalized users [10,12]. AI-enhanced customer empathy, as defined earlier, refers to firms’ use of AI technologies (e.g., NLP, affective computing, and multimodal sentiment analysis) to interpret, understand, and resonate with the context-dependent needs of digitally marginalized users [10,35], extending traditional customer research by emphasizing empathic understanding rather than analytical understanding. In this context, AI multimodal capability can provide a foundation by fusing text, voice, image, and sensor data for AI-enhanced customer empathy to detect and resonate with contextual and psychological clues; for example, information of a user’s prolonged hesitation on a payment screen, combined with a deep sigh captured by a microphone, may together signal their financial anxiety.
H3a. 
AI multimodal capability is positively associated with AI-enhanced customer empathy.
Design thinking research has long emphasized the empathic understanding of consumer needs as the foundation of human-centered innovation [20,34], enabling firms to prioritize features that matter most to marginalized users, define their tacit needs accurately, and avoid solutionism that ignores contextual constraints [20]. Considering the scale and speed of firms’ obtaining of multimodal data using their multimodal capability, AI-enhanced empathy enables firms to conduct empathic analysis across a broader range of users with greater timeliness and comprehensiveness, overcoming the data volume, timeliness, and cost limitations of traditional human-centric empathy methods [33,35]. When AI augments empathy, firms can identify previously invisible pain points (e.g., a visually impaired user’s need for audio-based navigation that adapts to ambient noise levels) [52], and translate them into product specifications that may increase the probability of success of inclusive innovation. Thus, the association between multimodal capability and inclusive innovation is consistent with an indirect pathway through enhanced empathic understanding.
H3b. 
AI-enhanced customer empathy mediates the relationship between AI multimodal capability and inclusive innovation.

2.4.2. The Mediating Role of Generative Inclusive Design

Inclusive innovation requires firms to rapidly generate diverse, accessible, and adaptable solutions under tight resource and time constraints [17,18,51]. Generative inclusive design, as defined earlier, refers to firms’ use of generative AI technologies (e.g., large language models [LLMs], generative adversarial networks [GANs]) to efficiently produce such design alternatives, thereby differing from traditional design approaches in three critical ways: it enables near-zero marginal cost exploration of vast solution spaces, allows for simulation under extreme user scenarios (e.g., low bandwidth, low compatibility of assistive technologies), and facilitates iteration based on real-time user feedback [27,53]. Therefore, it can help address the specific needs of marginalized users effectively and accurately, while ensuring accessibility, affordability, and adaptability [4,51,54].
AI multimodal capability can support generative inclusive design by providing rich, multimodal input for generative models [27]; for instance, combining images of rural infrastructure, voice recordings of user complaints about connectivity, and text descriptions of maintenance challenges can help a generative AI design a solution with a low-cost, offline-first interface and voice-based troubleshooting [53]. Thus, using generative AI based on multimodal data would enhance the relevance and diversity of the generated designs, and assist firms in evaluating those designs using the same multimodal data [55,56].
H4a. 
AI multimodal capability has a positive effect on generative inclusive design.
Generative inclusive design can help firms rapidly produce and iterate design alternatives, thereby overcoming the time and cost constraints that may deter their intention to enter niche markets [54]. In the context of inclusive innovation, marginalized users often have heterogeneous, extreme, and even contradictory requirements that cannot be satisfied by a one-size-fits-all solution [51]; thus, firms using generative AI can produce vast numbers of variations (e.g., different color contrasts, voice feedback styles, and gesture controls) for certain requirements (e.g., an accessible mobile interface for visually impaired users), and select the most promising ones for field testing [4]. Moreover, generative design can simulate how a design performs under extreme conditions (e.g., a user with tremors interacting with a touchscreen), identifying failure modes before costly physical prototyping [27]. Therefore, the association between AI multimodal capability and inclusive innovation is consistent with an indirect pathway through generative inclusive design.
H4b. 
Generative inclusive design mediates the positive relationship between AI multimodal capability and inclusive innovation.

3. Methodology

3.1. Sampling and Data Collection

To test our hypotheses, we conducted a questionnaire survey from July 2025 to March 2026 using self-report scales appropriate for measuring perceived organizational constructs. We selected China as the empirical context for the following reasons: it is the world’s second largest economy and has become one of the global leaders in AI development and application; China exhibits substantial regional and demographic disparities in digital access and literacy, making it a suitable context to examine firms’ inclusive innovation practices in digitally marginalized markets (e.g., rural residents, the elderly, and low-income markets); Chinese firms increasingly engage in inclusive innovation practices, as evidenced by the rising investments in accessible technology and poverty alleviation through digital solutions [57]. Thus, China is an appropriate empirical setting to test our theoretical model.
We used the translation–back-translation method to maintain cross-cultural equivalence [58,59]; when first developing the scale, we adopted a team-based iterative approach. Two independent groups, each consisting of two faculty members with relevant domain expertise and two doctoral students, were formed. One group developed the initial item pool for each construct, while the other group served as an independent review panel, evaluating each item against the construct definitions and providing feedback on content relevance, representativeness, and clarity. The development group revised the items based on the review panel’s feedback, and this process was repeated iteratively until the review panel reached consensus on all items.
The resulting item sets were then further refined through pilot interviews with 10 firms, averaging 2.5 h per session. During these sessions, respondents completed the questionnaire and were interviewed specifically about the core construct items. Following recommended practices for pre-testing in scale development, the interviews assessed (a) whether the items adequately captured the intended constructs (content validity); (b) whether the items aligned with respondents’ understanding of the corresponding practices in their organizational context (content and face validity); (c) whether any items were ambiguous or prone to misinterpretation (response processes); and (d) suggestions for wording improvements (face validity). The items were revised accordingly based on this feedback before finalizing the survey instrument [60], and then we undertook another round of translation–back-translation, and finalized the questionnaire design.
During the survey, to minimize economic development and geographic biases, we divided China’s provincial-level regions into three groups based on geographic location and GDP (Gross Domestic Product) rankings [61]. In each region, we randomly selected 300 firms according to the published industrial directories, and employed and trained 15 professional interviewers to contact the top managers of these firms. To ensure the validity of self-reported AI capability measures, we adopted multiple procedural safeguards. Prior to survey administration, each potential respondent was required to meet four eligibility criteria: (a) holding a senior management position (e.g., CEO, CTO, CFO, CMO, or department heads such as marketing or R&D); (b) having a good understanding of the firm’s inclusive innovation practices; (c) having at least one year of experience in their current role to ensure familiarity with the firm’s strategic and operational processes; (d) being knowledgeable about AI technologies and their potential applications in their business context. The questionnaire items measuring AI-related constructs were accompanied by detailed contextual descriptions and concrete examples. The clarity and comprehensibility of these items were pre-tested with a pilot sample of 10 firms (2.5 h each), during which respondents provided feedback on item clarity, comprehensibility, and alignment with their understanding of inclusive innovation and AI practices, which was used to revise the wording before finalizing the survey instrument.
We asked whether the firm had engaged in inclusive innovation-related practices; for those that had, we explained the study’s academic purpose, emphasized that there were no right or wrong answers, and guaranteed confidentiality to encourage their participation. Due to budget constraints, we distributed electronic questionnaires and provided assistance via email, online communication tools, and mobile phone when managers had questions about the survey instruments.
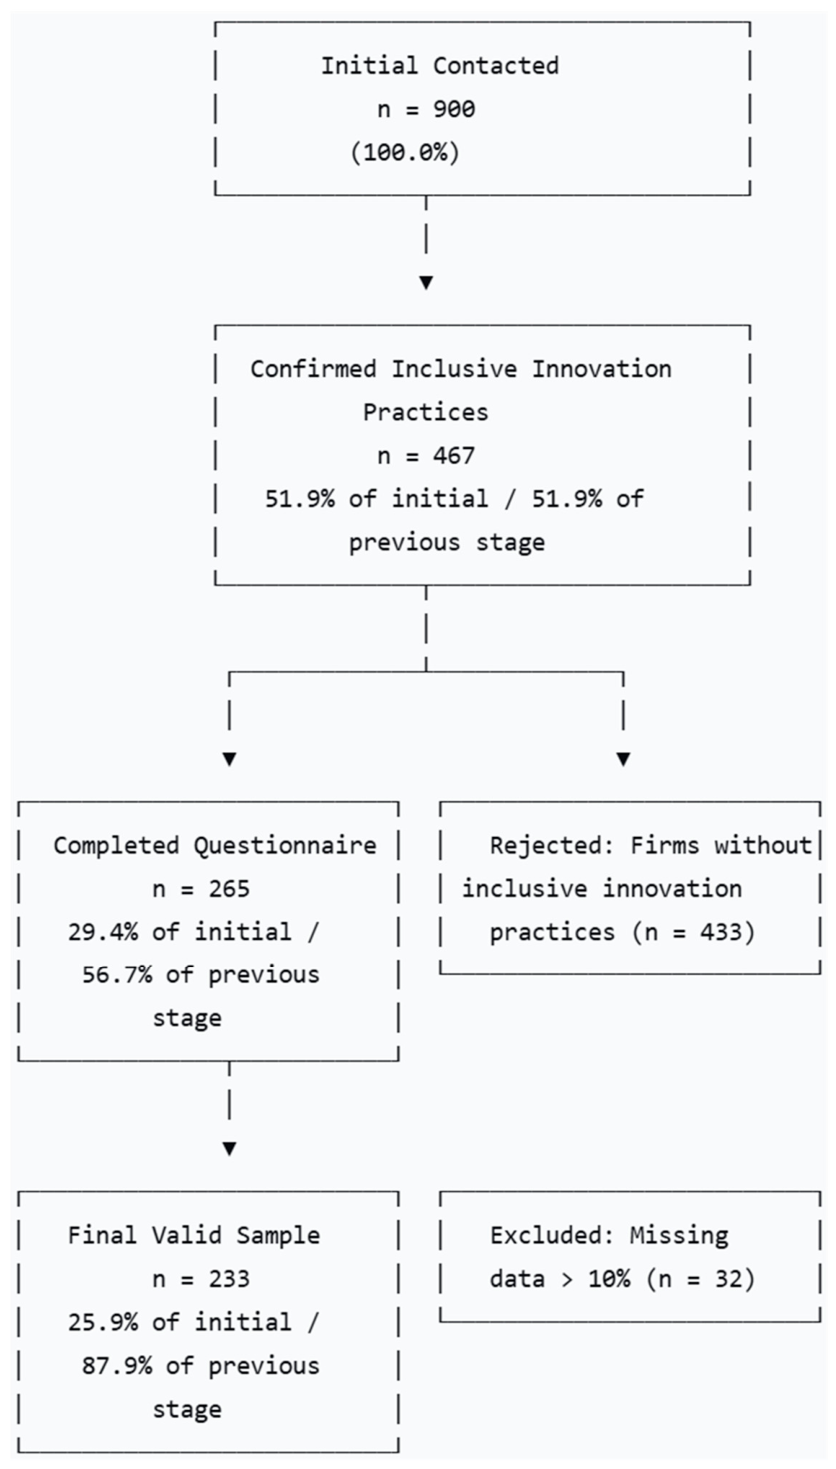
Of the 900 firms initially contacted, 467 (51.9%) confirmed that they had engaged in inclusive innovation-related practices, of which 265 (56.7%) completed the questionnaire. After excluding 32 responses with excessive missing data (>10%), the final analytic sample comprised 233 valid responses. The overall effective response rate was 25.9% relative to all contacted firms, which falls within the acceptable 20–30% range for top-management surveys [62,63], and the response rate among eligible firms was 49.9% (233/467), which exceeds the 32% average for executive surveys [63]. Figure A1 in Appendix A presents the sample screening funnel. The sampled firms covered various ownership structures (i.e., SOEs (state-owned enterprises) 27.9%, POEs (privately owned enterprises) 36.5%, FIEs (foreign-invested enterprises) 21.4%, and COEs (collectively owned enterprises) 14.2%) and industrial sectors (i.e., manufacturing 32.6%, chemistry 8.6%, information technology 19.3%, electronics 21.9%, automobile 8.2%, and industrial service 9.4%). To assess non-response bias, we conducted early–late respondent comparisons by comparing early (those who responded within the first two weeks) with late respondents (those who responded after follow-up reminders) on all focal constructs. No significant differences were found (all p > 0.1), suggesting that non-response does not substantially threaten the validity of our findings. T-tests comparing firm size and age of participating and non-participating firms also showed no significant differences (p > 0.1).

3.2. Measures

We identified useful scales through the review of the inclusive innovation, digital capability, AI-empowered new product development (NPD), AI ethics and governance, and responsible AI literature. Items and constructs were adapted to the AI-driven inclusive innovation context where necessary, and we developed new items based on prior conceptual research for measures that were not completely available and suitable. All constructs were measured with multiple items on a 7-point Likert scale (1 = strongly disagree, 7 = strongly agree). The measurement items, factor loadings, and internal consistencies are presented in Appendix A.
We measured inclusive innovation with four items developed based on the conceptual definitions of Ramani et al. [18] and George et al. [17] and contextualized to the digitally marginalized market setting, which reflect the extent to which firms develop new products, services, or processes that address the needs of digitally marginalized populations. AI multimodal capability was measured with four items that were adapted from Mikalef and Gupta’s [29] 43-item AI capability scale, with three items retained from the Data and Technology sub-dimensions and one newly developed item to capture cross-modal fusion, and contextualized according to the conceptualization of multimodal capability [22,64]. These items capture a firm’s ability to integrate and process data across modalities (e.g., text, image, speech, video, and sensor modalities) to generate holistic, actionable insights. AI-enhanced customer empathy was measured with three items adapted from Spreng et al.’s [65] Toronto Empathy Questionnaire (TEQ), a well-established measure of individual dispositional empathy, and contextualized to the AI-driven inclusive innovation context. Following MacKenzie et al.’s [66] operationalization approach, we adapted TEQ items by (a) shifting the referent from individual psychological capacity to organizational AI-system capability; (b) specifying the AI technologies enabling empathic interpretation; and (c) contextualizing to the digitally marginalized user context. We conducted item redundancy diagnostics following Briggs and Cheek [67] and Clark and Watson [68], reducing the initial four-item scale to three items after removing one redundant item; the remaining three capture the following: (1) detecting emotional states from multimodal user interactions; (2) understanding tacit, context-dependent needs of marginalized users; (3) leveraging multimodal sentiment analysis to capture what users cannot easily express. Generative inclusive design was measured with four items adapted from Robbins and Fu’s [69] design thinking practices scale and contextualized to the AI-driven inclusive innovation context [20,27,51,54], which capture the following: (1) rapid generation of design alternatives for marginalized users; (2) simulation of extreme-use scenarios using generative AI; (3) design of accessible, affordable, and adaptable products; (4) iteration based on real-time generative model feedback. AI ethical awareness was measured with four items developed based on the ethical principles synthesized by Floridi et al. [38] and the responsible AI framework of Mikalef et al. [40]. Following MacKenzie et al.’s [66] operationalization approach, the four items capture managers’ recognition of the (1) importance of fairness, accountability, and transparency in AI development; (2) need to assess AI models for potential bias against demographic groups; (3) necessity of explicit ethical guidelines for collecting and using data from vulnerable populations; and (4) importance of involving marginalized users in the design and validation of AI systems. Data governance quality was measured with four items developed based on the conceptual frameworks of Abraham et al. [43], Janssen et al. [70], and Houser and Bagby [71]. Following MacKenzie et al.’s [66] operationalization approach, the four items capture the robustness of firms’ data governance practices: (1) policies to ensure data availability, integrity, and security; (2) strict anonymization and consent management for sensitive user data; (3) data lineage and audit trails to trace biases back to their sources; (4) regular data quality assessment and training dataset updates with end-user feedback.
Content validity was assessed for all scales through a panel of nine independent experts—five academics and four industry practitioners—who were not involved in the original scale development and were unaware that the survey data had already been collected, following Polit and Beck [72] and Yusoff [73]. Experts rated each item’s relevance to its intended construct on a 4-point scale (1 = not relevant to 4 = highly relevant), and all 24 items met the retention criteria: I-CVI ranged from 0.89 to 1.00; S-CVI/Ave for each scale ranged from 0.89 to 1.00; overall S-CVI = 0.94; all κ* > 0.74.
Control variables: Following prior research and reviewer suggestions, we controlled for firm size (natural logarithm of number of employees), firm age (years since founding), industry (manufacturing vs. non-manufacturing, coded 1 for manufacturing and 0 otherwise), ownership (state-owned enterprises coded 1, 0 otherwise), R&D intensity (“Compared with competitors, we place greater emphasis on R&D investment”), competitive intensity (“Please evaluate the external competitive pressure your firm faces”), and prior innovation performance (self-assessed innovation performance relative to major competitors over the past three years; [74]); all control variables were included in the structural model to account for potential confounding effects.
Table 1 presents descriptive statistics, correlations, and the square roots of average variance extracted (AVE).

3.3. Analyses and Results

3.3.1. Construct Validity and Reliability

We assessed the psychometric properties of all latent constructs. First, composite reliability (CR) values ranged from 0.885 to 0.910 (>0.70), indicating good reliability [77]. Second, we conducted confirmatory factor analysis; the results showed that all items loaded significantly onto their respective constructs, with Cronbach’s α values ranging from 0.884 to 0.910, indicating good internal consistency. Third, as shown in Table 1, the square roots of average variance extracted (AVE) for each construct were larger than the correlations between constructs, supporting discriminant validity [78]. Fourth, we further examined discriminant validity using the heterotrait–monotrait (HTMT) ratio of correlations. Table 1b reports the testing results of the HTMT matrix for discriminant validity.
As shown in Table 1b, all HTMT values were below 0.61, well below the conservative 0.85 threshold [76], providing strong evidence of discriminant validity. Fifth, we used AMOS 26.0 to test the measurement model; the results (χ2/df = 1.764, CFI = 0.958, TLI = 0.951, RMSEA = 0.057, SRMR = 0.058) showed good model fit.
To further establish discriminant validity, we conducted a series of confirmatory factor analyses (CFAs) comparing our hypothesized six-factor model with several theoretically plausible alternative models [79].
As shown in Table 2, the hypothesized six-factor model demonstrated excellent fit to the data; in contrast, all alternative models showed substantially worse fit. The CFI differences (ΔCFI) between the six-factor model and each alternative exceeded the 0.01 threshold recommended by Cheung and Rensvold [80]: ΔCFI = 0.079, 0.088, 0.167, and 0.159 for the five-factor (AEC + GID), five-factor (AEA + DGQ), four-factor (AEC + GID, AEA + DGQ), and four-factor (AMC + AEC + GID) models, respectively. These results provide strong evidence that the six constructs are empirically distinguishable. To further validate the stability of the six-factor structure, we conducted a split-sample analysis following established scale development practices [68,81], randomly splitting the total sample (N = 233) into two subsamples: Sample 1 (n1 = 125) for exploratory factor analysis (EFA) and Sample 2 (n2 = 108) for confirmatory factor analysis (CFA). On Sample 1, we performed principal axis factoring with Varimax rotation on all 23 items; the KMO measure was 0.888, and Bartlett’s test was significant (χ2 = 2166.724, df = 253, p < 0.001).
As shown in Table 3, six factors with eigenvalues greater than 1.0 were extracted, cumulatively explaining 79.37% of the total variance, with all items loading above 0.70 on their respective factors (loadings ranged from 0.711 to 0.874). On Sample 2, the six-factor measurement model demonstrated acceptable fit (Table 4): χ2/df = 1.672, CFI = 0.925, TLI = 0.911, RMSEA = 0.079, and SRMR = 0.079. Together, these results confirm that our six-factor measurement model is stable across independent subsamples.
To address common method variance (CMV), we employed three complementary diagnostic tests [82]: First, we conducted Harman’s single-factor test as an initial diagnostic [83], with the first unrotated factor accounting for 42.45% of the total variance, below the 50% threshold. While we acknowledge that this test is widely regarded as insensitive and not diagnostic [82], we supplemented it with two additional approaches as described below. Second, we used the marker variable technique [75], with respondents’ tenure in their current position as a theoretically unrelated marker variable; this marker showed weak and non-significant correlations with all substantive constructs, with the smallest correlation being r = 0.016 (with II). We applied the partial correlation correction formula to adjust the observed correlations; after this adjustment, all previously significant correlations remained significant. Third, we employed the unmeasured latent method factor (ULMC) approach [82] by adding a common method factor to the six-factor measurement model. The common method factor explains approximately 29.9% of the total variance, which is substantially lower than the variance explained by the substantive factors. Additionally, the model fit improved only marginally when the method factor was added (ΔCFI = +0.003, from 0.958 to 0.961), well below the 0.01 threshold that would indicate meaningful method effects, indicating that common method variance does not substantially inflate the structural relationships. Collectively, these diagnostics suggest that CMV is unlikely to be a major threat to the validity of our findings.

3.3.2. Hypotheses Testing and Results

We conducted hierarchical linear regression to test our hypotheses. All models included the full set of control variables: firm size, firm age, industry, ownership, R&D intensity, competitive intensity, and prior innovation performance. We mean-centered all interaction terms to minimize multicollinearity; all VIF values were well below 10, indicating no serious multicollinearity [84]. F-tests for R2 changes were significant for each model, supporting the incremental explanatory power of the added variables. Table 5 reports the results.
Direct effects. Model 1 and Model 2 test the association between AI multimodal capability (AMC) and inclusive innovation (II). The coefficient is positive and significant (β = 0.349, p < 0.001), supporting H1. Model 5 tests the association between AMC and AI-enhanced customer empathy (AEC). The coefficient is positive and significant (β = 0.396, p < 0.001), supporting H3a. Model 7 tests the association between AMC and generative inclusive design (GID). The coefficient is positive and significant (β = 0.374, p < 0.001), supporting H4a.
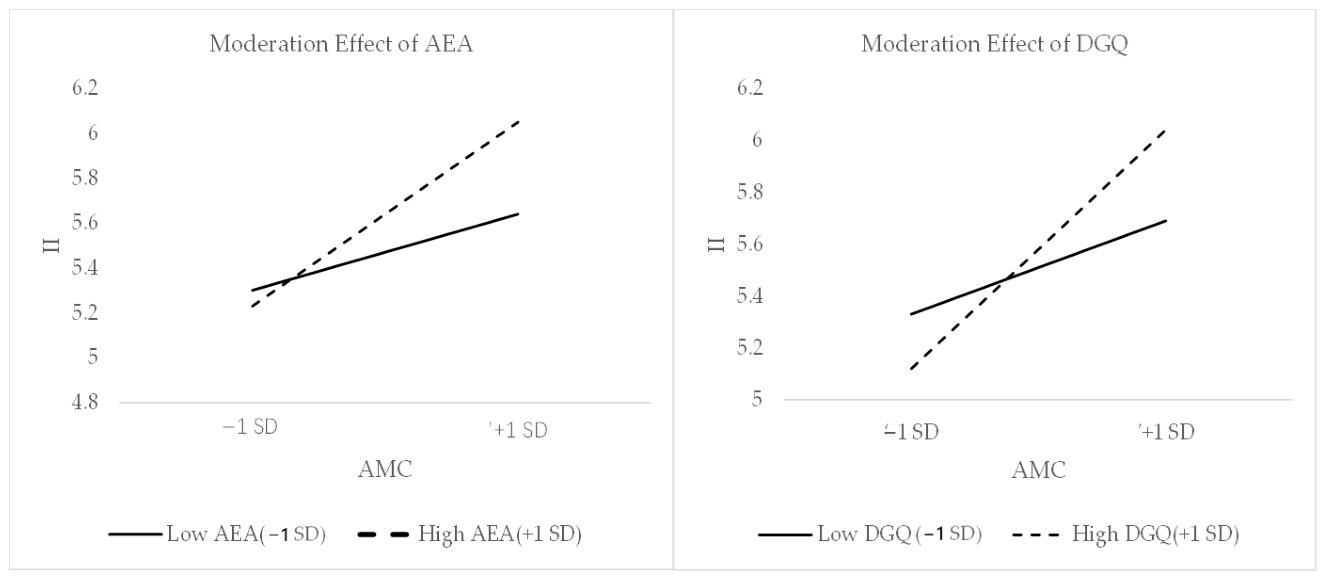
Moderation effects. Model 3 tests the moderating effects of AI ethical awareness (AEA) and data governance quality (DGQ) on the AMC-II relationship. The interaction terms are both positive and significant/marginally significant: AMC × AEA (β = 0.115, p < 0.05) and AMC × DGQ (β = 0.114, p < 0.1), supporting H2a and H2b. To fully interpret these moderating effects, we conducted simple slope tests, Johnson–Neyman (JN) analysis, and effect size (f2) calculations. The simple slopes of AMC on II were significantly stronger at high levels of both moderators than at low levels. The JN analysis identified threshold values at which the AMC-II relationship became statistically significant: for AEA, the effect was significant when it exceeded 3.88 on a 7-point scale (representing 91.0% of the sample); for DGQ, the effect was significant when it exceeded 3.52 (representing 87.6% of the sample). Effect sizes (f2) were 0.043 for AEA and 0.044 for DGQ, indicating small-to-medium moderating effects [85,86]. Figure A2 in Appendix A plots the moderation effects of AEA and DGQ based on the testing results.
Mediating effects: Following methodological recommendations, we treat the AMOS bootstrap results as the primary evidence for mediation. We employed a bootstrap procedure with 5000 resamples using AMOS [87,88]. As shown in Table 6, the indirect effect of AMC on II through AEC was significant (indirect effect = 0.131, 95% CI [0.030, 0.266], p = 0.011, percentile method), supporting H3b, as well as that through GID (indirect effect = 0.082, 95% CI [0.012, 0.164], p = 0.017, percentile method), supporting H4b. The AMOS bootstrap direct effect is not significant (95% CI contains zero), indicating that the relationship between AMC and II is fully mediated by AEC and GID. Following Zhao et al.’s [89] classification, we characterize this mediation pattern as “predominantly indirect.”
To address concerns about the reverse causality inherent in cross-sectional data, we estimated a reverse model with inclusive innovation (II) as the predictor and AI multimodal capability (AMC) as the outcome, through AEC and GID [90], including the same set of control variables. As shown in Table 7, the forward model (our hypothesized model) demonstrated superior fit across all indices: χ2/df = 1.464 vs. 1.609, CFI = 0.966 vs. 0.956, RMSEA = 0.045 vs. 0.051, SRMR = 0.093 vs. 0.101, and AIC = 403.106 vs. 430.955. The CFI difference (ΔCFI = 0.010) meets the 0.01 threshold recommended by Cheung and Rensvold [80], indicating that the forward model provides a meaningfully better representation of the data.

4. Discussion

4.1. Theoretical Implications

First, we identify AI multimodal capability (AMC) as a distinct capability that addresses the information collection and interpretation challenges inherent in inclusive innovation for digitally marginalized groups. Our findings suggest that AMC is positively associated with inclusive innovation. Prior research on AI capability has largely treated it as a monolithic capability to investigate its effects on efficiency, productivity, or product innovation in the mainstream market [3,29]. While recent work has begun to explore inclusive AI capability more broadly [30] and to map the roles of AI in innovation management [2], the specific role of AI multimodal capability in addressing the information collection and interpretation challenges inherent in inclusive innovation for digitally marginalized groups has remained underexplored. Conceptualizing AI multimodal capability as firms’ ability to integrate and process heterogeneous data modalities (text, image, speech, video, and sensor data) to generate holistic insights, we illustrate the central rationale behind our proposition that AMC may help address the information collection and interpretation challenges inherent in inclusive innovation for digitally marginalized groups [25,26]. Our findings are consistent with the view that AMC can help firms capture and integrate fragmented, non-standard, and sparse signals from marginalized users, thereby identifying latent needs that would otherwise remain invisible. In doing so, we contribute to the antecedent research of inclusive innovation by identifying AMC as a distinct capability that addresses the information collection and interpretation challenges inherent in this context. Our findings also suggest that AI capability research can be extended beyond efficiency- and growth-oriented outcomes to encompass inclusive and prosocial outcomes—a direction that has received limited empirical attention.
Second, we examine AI-enhanced customer empathy and generative inclusive design, through which AI multimodal capability may relate to inclusive innovation. Prior studies in design thinking have long recognized empathy as foundational to human-centered innovation [34,36] and, more recently, have begun to explore how generative AI can accelerate ideation [27,54]. However, how AI technology-enabled and -augmented empathic understanding and generative solution exploration would be applied to improve the development of inclusive innovation, characterized by the sparse, fragmented, and often noisy multimodal signals through which marginalized users express their unmet needs, remains relatively underexplored. Specifically, while empathy has long been recognized as foundational to human-centered design [34], how AI can augment empathic understanding of marginalized users’ tacit needs to facilitate the detection of inclusive innovation needs has received limited attention [33,35]. Moreover, while generative AI has shown potential to accelerate ideation [27], its application in inclusive design scenarios where solutions must accommodate context extremity and heterogeneity remains underexplored [51,54]. Our study theoretically delineates and empirically suggests two pathways via which AI multimodal capability can improve inclusive innovation—namely by improving firms’ ability to empathize with marginalized users (interpreting latent, emotionally charged needs), and by accelerating generative solution exploration (producing diverse, accessible, and adaptable designs at near-zero marginal cost)—applying the “problem definition” and “solution generation” principles of the design thinking double diamond [27] in the context of inclusive innovation for digitally marginalized populations. In doing so, our study connects AI capability research with design-driven innovation studies by illustrating how two AI-enabled and -augmented design thinking double-diamond practices, namely AI-enhanced customer empathy (AEC) and generative inclusive design (GID), can operate to leverage the data collected and integrated by AI multimodal capability to support inclusive innovation, thereby contributing to the ongoing inquiry into how AI capabilities may support social value creation in digitally marginalized market contexts.
Third, we identify AI ethical awareness and data governance quality as important boundary conditions that shape the effectiveness of AI multimodal capability in relation to inclusive innovation. Previous studies have largely treated AI ethics-related practices as compliance with regulatory requirements and societal expectations [38,39,45]; however, as noted earlier, in the inclusive innovation context, the “compliance” means of ethical governance would be extended as AI technologies introduce risks of bias and opacity, and the targeted users are particularly vulnerable to data misuse. In this situation, firms’ AI ethics-related practices (i.e., awareness of ethical principles, governance of their data practices), as the transformation of their ways of doing things [24] and operate throughout the process as an embedded governance logic that shapes the effectiveness of AI capabilities. Specifically, when firms exhibit higher levels of AI ethical awareness, they are more likely to collect and process multimodal data in ways that respect privacy, avoid stereotyping, and involve marginalized users, thereby strengthening the positive association between AMC and inclusive innovation. Similarly, higher data governance quality can help ensure that multimodal data from marginalized populations are ethically sourced, accurately labeled, and securely stored, which, in turn, supports more reliable and fair AI training. Our results are consistent with this proposition that AI ethical awareness and data governance quality strengthen the positive association between AMC and inclusive innovation. Based on prior work that conceptualized responsible AI as a set of capabilities [92], and examined responsible AI attention as an antecedent of innovation [31], our theoretical discussion and empirical findings extend this line of inquiry by suggesting that AI ethics-related practices would affect the effectiveness of AI capabilities in relation to inclusive outcomes.

4.2. Managerial Implications

Our theoretical discussions and empirical results provide several implications for managers and policymakers.
First, managers should be aware of the value of AI multimodal capability in supporting inclusive innovation. Firms may move beyond unimodal data analytics toward integrated multimodal pipelines that combine voice, image, video, and sensor data; acquire or partner with multimodal AI platforms (e.g., Google’s Vertex AI); and establish cross-functional teams that include domain experts familiar with marginalized user contexts to facilitate their exploration of inclusive innovation opportunities in digitally marginalized markets. Second, managers should recognize the role of AI-enhanced customer empathy and generative inclusive design in translating the potential benefits that AI multimodal capability may provide into inclusive innovation outcomes. Firms should actively deploy and utilize empathic AI technologies (e.g., affective computing, sentiment analysis) during their definition of consumer problems in usage scenarios [35], and work together with generative AI tools (e.g., LLMs, diffusion models, and GANs) to rapidly prototype and iterate their design alternatives for detailed and diversified usage scenarios [4]. Third, managers should treat AI ethics-related practices as ‘competitiveness building’ rather than ‘compliance to regulations and societal expectations’, particularly in their business activities involving digitally marginalized groups. Firms may adopt established frameworks (e.g., Microsoft’s Responsible AI Standard, [45]) that provide guidance for impact assessment, fairness evaluation, and transparency documentation. They should pay particular attention to data governance during their collection, processing, and use of data; investments and managerial attention should be focused on areas such as implementing robust data lineage, anonymization protocols, and consent management systems [43]. Fourth, our findings indicate the importance of AI ethics for policymakers in governing and supporting AI-enabled inclusive innovation. Therefore, policies that safeguard AI ethics in business practices, and investments in AI infrastructure that may enhance inclusive and sustainable developments, should be formulated and implemented.

4.3. Limitations and Future Research Directions

First, the cross-sectional design limits causal inference. We estimated a reverse model to assess the plausibility of alternative directionality, comparing the hypothesized forward model against a specification reversing the causal direction between AMC and II, following established recommendations for cross-sectional model comparison [80,90]. The model comparison supported the hypothesized forward model; nonetheless, cross-sectional data cannot definitively establish temporal ordering or completely rule out omitted-variable bias. Future research may employ longitudinal designs that temporally separate the measurement of predictors, mediators, and outcomes, or quasi-experimental designs (e.g., natural experiments following AI infrastructure rollouts) to strengthen causal inferences.
Second, the reliance on perceptual, single-informant measures introduces potential common method variance and reporting bias, as all focal constructs were measured through self-reports from a single senior manager per firm. We implemented multiple procedural and statistical remedies to bound this concern: procedurally, we applied four eligibility criteria to select knowledgeable informants, pre-tested all items with contextual examples and real-time clarification, and ensured respondent anonymity; statistically, we conducted three complementary diagnostic tests—Harman’s single-factor test [82], the marker variable technique [75], and the unmeasured latent method factor approach [82,93]. The results of these diagnostics collectively suggested that common method variance does not substantially inflate the observed relationships; nonetheless, we acknowledge that no statistical remedy can fully eliminate the inherent limitations of single-source, cross-sectional survey data. Moreover, inclusive innovation targets digitally marginalized populations whose needs differ substantially from mainstream markets; managers may have less familiarity with these atypical contexts, which could introduce cognitive ambiguity in their responses. Future research may triangulate self-reported measures with objective indicators such as system logs, procurement records, number of accessibility features shipped, or revenue from inclusive product lines, and may employ multi-informant designs.
Third, the sampling strategy focused on firms that had engaged in inclusive innovation-related practices. This was a deliberate theoretical sampling decision, as firms without such practices would be unable to meaningfully assess the constructs of interest; however, this selection criterion restricts the range of the dependent variable and limits the generalizability of our findings to firms that have not yet pursued inclusive innovation. We reported the complete screening funnel transparently following established reporting guidelines for survey research [94], and conducted early–late respondent comparisons to assess non-response bias [95], with results indicating no significant differences on focal constructs. Split-sample analyses across firm size, age, industry, and high-tech status were conducted to assess whether the results were driven by a particular subset of firms, and these analyses supported the stability of our findings across subgroups. Nonetheless, we encourage future research to examine whether the hypothesized relationships hold in firms at earlier stages of inclusive innovation adoption.
Fourth, the study is situated within a specific empirical context that limits generalizability. Our data were collected from firms operating in China’s manufacturing, information technology, and electronics sectors, and we were unable to include several potentially relevant covariates—particularly AI budget allocation and digital maturity—due to data availability constraints at the time of survey design. While China provides a valuable empirical context for studying inclusive innovation given its substantial regional and demographic digital divides [9,10], this geographic and sectoral concentration limits the generalizability of our findings to other institutional, cultural, and economic settings. Different regulatory environments for AI ethics, varying levels of digital infrastructure, divergent social inequality profiles, and distinct cultural attitudes toward technology adoption may shape how AI multimodal capability relates to inclusive innovation. Similarly, the unavailability of objective AI investment and digital maturity data prevents us from examining whether these factors moderate the observed relationships. Future research may include objective measures of AI investment and digital maturity indices, and may conduct cross-country replication studies in other developing economies as well as developed economies.

5. Conclusions

This study draws on the attention-based view and dynamic capability theory to investigate how AI multimodal capability is associated with inclusive innovation and how this relationship is mediated by AI-enhanced customer empathy and generative inclusive design and moderated by AI ethical awareness and data governance quality. Using survey data from 233 Chinese firms, we find that AI multimodal capability is positively associated with inclusive innovation both directly and indirectly through the two mediating pathways: AI-enhanced customer empathy and generative inclusive design mediate this relationship, while AI ethical awareness and data governance quality positively moderate it. These findings suggest that inclusive innovation is not merely a social imperative but a strategically achievable outcome that firms may pursue through deliberate deployment of multimodal AI, empathic analytics, generative design, and governance practices. As AI continues to permeate economic and social life, ensuring that its benefits reach those who have been underserved is both a responsibility and an opportunity for sustainable development. We hope this study provides references for further research and practice at the intersection of AI-related capabilities and practices, and inclusive innovation.

Author Contributions

Conceptualization, H.Y. and Y.G.; methodology, H.Y. and Y.G.; software, H.Y.; validation, H.Y.; formal analysis, H.Y.; investigation, H.Y. and Y.G.; writing—original draft preparation, H.Y. and Y.G.; supervision, Y.G. All authors have read and agreed to the published version of the manuscript.

Funding

This research received no external funding.

Institutional Review Board Statement

Ethical review and approval were waived for this study due to it exclusively used fully anonymized, non-sensitive data collected for academic purposes, posed no more than minimal risk to participants, and did not involve vulnerable populations, thereby meeting the exemption criteria under Article 32 of China’s Measures for Ethical Review of Life Sciences and Medical Research Involving Humans (2023).

Informed Consent Statement

Informed consent was obtained from all subjects involved in the study.

Data Availability Statement

The raw data supporting the conclusions of this article will be made available by the authors on request.

Acknowledgments

We confirm that no generative AI tools were used in the writing or analysis of this manuscript; all analyses were conducted using SPSS 19.0 and AMOS 26.0., and all writing and revisions were performed by the authors. AI tools were used solely for language polishing after all analyses and writing were completed by the authors, which, according to MDPI’s policy, does not require disclosure.

Conflicts of Interest

The authors declare no conflicts of interest.

Abbreviations

The following abbreviations are used in this manuscript:
AEAAI Ethical Awareness
AECAI-Enhanced Customer Empathy
AMCAI Multimodal Capability
CICompetitive Intensity
COEsCollectively Owned Enterprises
DGQData Governance Quality
FIEsForeign-Invested Enterprises
GANsGenerative Adversarial Networks
GIDGenerative Inclusive Design
IIInclusive Innovation
Indus.Industry
LLMsLarge Language Models
NLPNatural Language Processing
NPDNew Product Development
Own.Ownership
PIPPrior Innovation Performance
POEsPrivate-Owned Enterprises
R&D IR&D Intensity
SDGsSustainable Development Goals
SOEsState-Owned Enterprises

Appendix A

Table A1. Measurement items, factor loadings, and internal consistencies.
Construct (CR/Cronbach’s α)ItemsFactor Loading
Inclusive Innovation
(CR = 0.906/α = 0.905)
Our company develops new products/services specifically for digitally marginalized populations (e.g., elderly, low-literacy users).0.827
We actively design solutions that address the accessibility and affordability constraints of underserved digitally marginalized groups.0.904
Our innovation process incorporates the unique needs of users with low digital literacy and/or limited infrastructure.0.882
Our products improve digital participation for digitally vulnerable populations.0.744
AI Multimodal Capability
(CR = 0.897/α = 0.894)
Our company can integrate data from text, image, speech, video, and sensors to generate comprehensive insights.0.792
We have the abilities to fuse heterogeneous data modalities (e.g., text + image + voice) to understand user needs.0.770
Our AI systems can process both structured and unstructured data from multiple sources simultaneously.0.900
We use multimodal data (e.g., combining clickstream, voice, and facial expression) to improve decision-making.0.845
AI-Enhanced Customer Empathy (CR = 0.885/α = 0.884)Our AI systems can detect emotional states (e.g., frustration, anxiety) from user interactions (voice, text, or video).0.827
We use AI to understand the tacit, context-dependent needs of marginalized users.0.863
We leverage multimodal sentiment analysis to capture what users cannot easily express.0.853
Generative Inclusive Design
(CR = 0.908/α = 0.907)
We use generative AI to rapidly produce many design alternatives for marginalized users.0.803
We simulate extreme-use scenarios (e.g., assistive technology) using generative AI before physical prototyping.0.902
Generative AI helps us design accessible, affordable, and adaptable products for diverse user groups.0.855
We iterate design solutions based on real-time feedback from generative models.0.810
AI Ethical Awareness (CR = 0.910/α = 0.910)Top managers in our company prioritize fairness, accountability, and transparency in AI development.0.777
We regularly assess AI models for potential bias against demographic groups (e.g., age, income, dialect).0.847
Our organization has explicit ethical guidelines for collecting and using data from vulnerable populations.0.860
We involve marginalized users in the design and validation of AI systems.0.901
Data Governance Quality (CR = 0.895/α = 0.894)We have robust policies to ensure data availability, integrity, and security for all AI projects.0.873
We implement strict anonymization and consent management for sensitive user data (e.g., health, location).0.854
Data lineage and audit trails allow us to trace potential biases back to their sources.0.794
We regularly assess data quality and update training datasets with feedback from end users.0.776
Notes: CR = composite reliability. All factor loadings are standardized estimates from the confirmatory factor analysis (CFA) measurement model. AEC was reduced to three items (AEC1, AEC2, AEC4) following item redundancy diagnostics, with AEC3 deleted due to redundancy (mean inter-item r = 0.783 with other items). CR and Cronbach’s α values are reported for the final measurement model. N = 233.
Figure A1. Sample screening funnel. Notes: The funnel illustrates the sample selection process from initial contact (n = 900) to the final analytic sample (n = 233). Firms without inclusive innovation practices (n = 433) were screened out at the eligibility stage. Among eligible firms (n = 467), 265 completed the questionnaire, and 32 responses with excessive missing data (>10%) were excluded, yielding the final sample of 233 valid responses. Percentages represent proportions relative to the initial sample and the previous stage, respectively.
Sustainability 18 07345 g0a1
Figure A2. Moderation effects of DGQ and AEA.
Sustainability 18 07345 g0a2

References

  1. Cockburn, I.M.; Henderson, R.; Stern, S. The impact of artificial intelligence on innovation. In The Economics of Artificial Intelligence; Agrawal, A., Gans, J., Goldfarb, A., Eds.; University of Chicago Press: Chicago, IL, USA, 2018; pp. 115–146. [Google Scholar]
  2. Gama, F.; Magistretti, S. Artificial intelligence in innovation management: A review of innovation capabilities and a taxonomy of AI applications. J. Prod. Innov. Manag. 2025, 42, 76–111. [Google Scholar]
  3. Rammer, C.; Fernández, G.P.; Czarnitzki, D. Artificial intelligence and industrial innovation: Evidence from German firm-level data. Res. Policy 2022, 51, 104555. [Google Scholar] [CrossRef]
  4. Cooper, R.G. The NPD game is won or lost in the first five plays: How AI can help in product innovation. IEEE Eng. Manag. Rev. 2025, 53, 9–17. [Google Scholar] [CrossRef]
  5. Roberts, D.L.; Candi, M. Artificial intelligence and innovation management: Charting the evolving landscape. Technovation 2024, 136, 103081. [Google Scholar] [CrossRef]
  6. Babina, T.; Fedyk, A.; He, A.; Hodson, J. Artificial intelligence, firm growth, and product innovation. J. Financ. Econ. 2024, 151, 103745. [Google Scholar] [CrossRef]
  7. ALA. Digital Literacy, Libraries, and Public Policy; American Library Association: Chicago, IL, USA, 2011. [Google Scholar]
  8. Ritzhaupt, A.D.; Liu, F.; Dawson, K.; Barron, A.E. Differences in student information and communication technology literacy based on socio-economic status, ethnicity, and gender. J. Res. Technol. Educ. 2013, 45, 291–307. [Google Scholar] [CrossRef]
  9. Carter, L.; Liu, D.; Cantrell, C. Exploring the intersection of the digital divide and artificial intelligence: A hermeneutic literature review. AIS Trans. Hum.-Comput. Interact. 2020, 12, 253–275. [Google Scholar] [CrossRef]
  10. Wang, C.; Boerman, S.C.; Kroon, A.C.; Möller, J.; de Vreese, C.H. The artificial intelligence divide: Who is the most vulnerable? New Media Soc. 2024, 27, 3867–3889. [Google Scholar] [CrossRef]
  11. World Bank. World Development Report 2023; World Bank: Washington, DC, USA, 2023. [Google Scholar]
  12. Prahalad, C.K. Bottom of the pyramid as a source of breakthrough innovations. J. Prod. Innov. Manag. 2012, 29, 6–12. [Google Scholar]
  13. Tomašev, N.; Cornebise, J.; Hutter, F.; Mohamed, S.; Picciariello, A.; Connelly, B.; Belgrave, D.C.M.; Ezer, D.; van der Haert, F.C.; Mugisha, F.; et al. AI for social good: Unlocking the opportunity for positive impact. Nat. Commun. 2020, 11, 2468. [Google Scholar] [CrossRef] [PubMed]
  14. Clough, D.R.; Wu, A. Artificial intelligence, data-driven learning, and the decentralized structure of platform ecosystems. Acad. Manag. Rev. 2022, 47, 184–189. [Google Scholar] [CrossRef]
  15. Acemoglu, D.; Restrepo, P. Automation and new tasks: How technology displaces and reinstates labor. J. Econ. Perspect. 2019, 33, 3–30. [Google Scholar] [CrossRef]
  16. Yang, C.H. How artificial intelligence technology affects productivity and employment: Firm-level evidence from Taiwan. Res. Policy 2022, 51, 104536. [Google Scholar] [CrossRef]
  17. George, G.; McGahan, A.M.; Prabhu, J. Innovation for inclusive growth: Towards a theoretical framework and a research agenda. J. Manag. Stud. 2012, 49, 661–683. [Google Scholar] [CrossRef]
  18. Ramani, S.V.; Athreye, S.; Bruder, M.; Sengupta, A. Inclusive Innovation for the BoP: It’s a Matter of Survival! Technol. Forecast. Soc. Change 2023, 194, 122666. [Google Scholar] [CrossRef]
  19. United Nations. Transforming Our World: The 2030 Agenda for Sustainable Development; United Nations: New York, NY, USA, 2015. [Google Scholar]
  20. Verganti, R.; Vendraminelli, L.; Iansiti, M. Innovation and design in the age of artificial intelligence. J. Prod. Innov. Manag. 2020, 37, 212–227. [Google Scholar] [CrossRef]
  21. Marion, T.J.; Fixson, S.K. The transformation of the innovation process: How digital tools are changing work, collaboration, and organizations in new product development. J. Prod. Innov. Manag. 2021, 38, 192–215. [Google Scholar]
  22. Grewal, R.; Gupta, S.; Hamilton, R. Marketing insights from multimedia data: Text, image, audio, and video. J. Mark. Res. 2021, 58, 1025–1033. [Google Scholar] [CrossRef]
  23. Hauser, J.R.; Li, Z.; Mao, C. Artificial intelligence and user-generated data are transforming how firms come to understand customer needs. In Artificial Intelligence in Marketing; Emerald Publishing: Bingley, UK, 2023; pp. 147–167. [Google Scholar]
  24. Warner, K.S.R.; Wäger, M. Building dynamic capabilities for digital transformation: An ongoing process of strategic renewal. Long Range Plan. 2019, 52, 326–349. [Google Scholar] [CrossRef]
  25. Wamba, S.F. Building AI-enabled capabilities for improved environmental and manufacturing performance. Int. J. Prod. Res. 2026, 64, 545–564. [Google Scholar]
  26. Shi, J.; Huang, X.; Yuan, L. Hyper-MDR: An open-world multimodal reasoning framework. PLoS ONE 2026, 21, e0342169. [Google Scholar] [CrossRef] [PubMed]
  27. Bouschery, S.G.; Blazevic, V.; Piller, F.T. Augmenting human innovation teams with artificial intelligence: Exploring transformer-based language models. J. Prod. Innov. Manag. 2023, 40, 139–153. [Google Scholar] [CrossRef]
  28. Garbuio, M.; Lin, N. Innovative idea generation in problem finding: Abductive reasoning, cognitive impediments, and the promise of artificial intelligence. J. Prod. Innov. Manag. 2021, 38, 701–725. [Google Scholar] [CrossRef]
  29. Mikalef, P.; Gupta, M. Artificial intelligence capability: Conceptualization, measurement calibration, and empirical study on its impact on organizational creativity and firm performance. Inf. Manag. 2021, 58, 103434. [Google Scholar] [CrossRef]
  30. Tajvidi, M.; Wang, Y.; Hajli, N.; Love, P.E.D. Inclusive AI capability: Conceptualization and empirical validation. J. Bus. Res. 2026, 152, 113–128. [Google Scholar]
  31. Xiong, M.; Xu, H.; Ji, J.; Zuo, R.; Wang, Y.; Olya, H. Responsible artificial intelligence attention and firm innovation: An attention-based view. J. Prod. Innov. Manag. 2026, 43, 186–214. [Google Scholar]
  32. Puntoni, S.; Walker Reczek, R.; Giesler, M.; Botti, S. Consumers and artificial intelligence: An experiential perspective. J. Mark. 2021, 85, 131–151. [Google Scholar]
  33. Liu-Thompkins, Y.; Okazaki, S.; Li, H. Artificial empathy in marketing interactions: Bridging the human-AI gap in affective and social customer experience. J. Acad. Mark. Sci. 2022, 50, 1198–1218. [Google Scholar] [CrossRef]
  34. Brown, T. Design thinking. Harv. Bus. Rev. 2008, 86, 84–92. [Google Scholar] [PubMed]
  35. Foroudi, P.; Robson, M.J.; Marvi, R.; Spyropoulou, S. Enhancing customer engagement through artificial intelligence authenticity. J. Prod. Innov. Manag. 2026, 43, 76–98. [Google Scholar]
  36. Liedtka, J. Perspective: Linking design thinking with innovation outcomes through cognitive bias reduction. J. Prod. Innov. Manag. 2015, 32, 925–938. [Google Scholar]
  37. Dorst, K. Frame creation and design in the expanded field. She Ji 2015, 1, 3–20. [Google Scholar] [CrossRef]
  38. Floridi, L.; Cowls, J.; Beltrametti, M.; Chatila, R.; Chazerand, P.; Dignum, V.; Luetge, C.; Madelin, R.; Pagallo, U.; Rossi, F.; et al. AI4People—An ethical framework for a good AI society: Opportunities, risks, principles, and recommendations. Minds Mach. 2018, 28, 689–707. [Google Scholar] [CrossRef]
  39. Rana, N.P.; Pillai, R.; Sivathanu, B.; Malik, N. Assessing the nexus of Generative AI adoption, ethical considerations and organizational performance. Technovation 2024, 135, 103064. [Google Scholar] [CrossRef]
  40. Mikalef, P.; Conboy, K.; Lundström, J.E.; Popovič, A. Thinking responsibly about responsible AI and ‘the dark side’ of AI. Eur. J. Inf. Syst. 2022, 31, 257–268. [Google Scholar] [CrossRef]
  41. Martin, K.D.; Murphy, P.E. The role of data privacy in marketing. J. Acad. Mark. Sci. 2017, 45, 135–155. [Google Scholar]
  42. van Giffen, B.; Herhausen, D.; Fahse, T. Overcoming the pitfalls and perils of algorithms: A classification of machine learning biases and mitigation methods. J. Bus. Res. 2022, 144, 93–106. [Google Scholar] [CrossRef]
  43. Abraham, R.; Schneider, J.; vom Brocke, J. Data governance: A conceptual framework, structured review, and research agenda. Int. J. Inf. Manag. 2019, 49, 424–438. [Google Scholar] [CrossRef]
  44. Grilli, L.; Pedota, M. Creativity and artificial intelligence: A multilevel perspective. Creat. Innov. Manag. 2024, 33, 234–247. [Google Scholar] [CrossRef]
  45. Microsoft. Microsoft Responsible AI Standard, v2; Microsoft Corporation: Redmond, WA, USA, 2022. [Google Scholar]
  46. Jobin, A.; Ienca, M.; Vayena, E. The global landscape of AI ethics guidelines. Nat. Mach. Intell. 2019, 1, 389–399. [Google Scholar] [CrossRef]
  47. Ocasio, W. Towards an attention-based view of the firm. Strateg. Manag. J. 1997, 18, 187–206. [Google Scholar] [CrossRef]
  48. Teece, D.J. Explicating dynamic capabilities: The nature and microfoundations of (sustainable) enterprise performance. Strateg. Manag. J. 2007, 28, 1319–1350. [Google Scholar] [CrossRef]
  49. Spanjol, J.; Noble, C.H.; Baer, M.; Bogers, M.L.A.M.; Bohlmann, J.; Bouncken, R.B.; Bstieler, L.; De Luca, L.M.; Garcia, R.; Gemser, G.; et al. Fueling innovation management research: Future directions and five forward-looking paths. J. Prod. Innov. Manag. 2024, 41, 893–948. [Google Scholar] [CrossRef]
  50. Shin, D.; Park, Y.J. Role of fairness, accountability, and transparency in algorithmic affordance. Comput. Hum. Behav. 2019, 98, 277–284. [Google Scholar] [CrossRef]
  51. Lehmann, S.L.; Dahlke, J.; Pianta, V.; Ebersberger, B. Artificial intelligence and corporate ideation systems. J. Prod. Innov. Manag. 2026, 43, 160–185. [Google Scholar]
  52. Baldassarre, B.; Calabretta, G.; Karpen, I.O.; Bocken, N.; Hultink, E.J. Responsible design thinking for sustainable development: Critical literature review, new conceptual framework, and research agenda. J. Bus. Ethics 2024, 195, 25–46. [Google Scholar] [CrossRef] [PubMed]
  53. Marion, T.J.; Yuan, C.; Moghaddam, M. Integrating AI into the front end of new product development. Res.-Technol. Manag. 2025, 68, 10–22. [Google Scholar] [CrossRef]
  54. Marzi, G.; Balzano, M. Artificial intelligence and the reconfiguration of NPD Teams: Adaptability and skill differentiation in sustainable product innovation. Technovation 2025, 145, 103254. [Google Scholar] [CrossRef]
  55. Yuan, C.; Marion, T.J.; Moghaddam, M. Leveraging end-user data for enhanced design concept evaluation. J. Mech. Des. 2021, 143, 071404. [Google Scholar]
  56. Chen, Y.; Qin, Z.; Sun, L.; Wu, J.; Ai, W.; Chao, J.; Li, H.; Li, J. GDT Framework: Integrating Generative Design and Design Thinking for Sustainable Development in the AI Era. Sustainability 2025, 17, 372. [Google Scholar] [CrossRef]
  57. World Bank. China Economic Update: June 2020; World Bank: Washington, DC, USA, 2020. [Google Scholar]
  58. Chen, S.; Qiu, S.; Li, H.; Zhang, J. Translation and back-translation in cross-cultural management research. Manag. Int. Rev. 2022, 62, 1–31. [Google Scholar]
  59. Hoskisson, R.E.; Eden, L.; Lau, C.M.; Wright, M. Strategy in emerging economies. Acad. Manag. J. 2000, 43, 249–267. [Google Scholar] [CrossRef]
  60. Li, J.J.; Poppo, L.; Zhou, K.Z. Do managerial ties in China always produce value? Strateg. Manag. J. 2008, 29, 383–400. [Google Scholar] [CrossRef]
  61. Fan, G.; Wang, X.; Zhu, H. NERI Index of Marketization of China’s Provinces 2011; Economic Science Press: Beijing, China, 2011. [Google Scholar]
  62. Baruch, Y.; Holtom, B.C. Survey response rate levels and trends in organizational research. Hum. Relat. 2008, 61, 1139–1160. [Google Scholar] [CrossRef]
  63. Cycyota, C.S.; Harrison, D.A. What (not) to expect when surveying executives: A meta-analysis of top manager response rates and techniques over time. Organ. Res. Methods 2006, 9, 133–160. [Google Scholar] [CrossRef]
  64. Shrestha, Y.R.; He, V.F. Integrating multimodal data and machine learning for entrepreneurship research. Strateg. Entrep. J. 2025. [Google Scholar] [CrossRef]
  65. Spreng, R.N.; McKinnon, M.C.; Mar, R.A.; Levine, B. The Toronto Empathy Questionnaire: Scale development and initial validation of a factor-analytic solution to multiple empathy measures. J. Pers. Assess. 2009, 91, 62–71. [Google Scholar] [CrossRef] [PubMed]
  66. MacKenzie, S.B.; Podsakoff, P.M.; Podsakoff, N.P. Construct measurement and validation procedures in MIS and behavioral research: Integrating new and existing techniques. MIS Q. 2011, 35, 293–334. [Google Scholar] [CrossRef]
  67. Briggs, S.R.; Cheek, J.M. The role of factor analysis in the development and evaluation of personality scales. J. Pers. 1986, 54, 106–148. [Google Scholar] [CrossRef]
  68. Clark, L.A.; Watson, D. Constructing validity: Basic issues in objective scale development. Psychol. Assess. 1995, 7, 309–319. [Google Scholar] [CrossRef]
  69. Robbins, P.; Fu, N. Blind faith or hard evidence? Exploring the indirect performance impact of design thinking practices in R&D. R&D Manag. 2022, 52, 704–719. [Google Scholar] [CrossRef]
  70. Janssen, M.; Brous, P.; Estevez, E.; Barbosa, L.S.; Janowski, T. Data governance: Organizing data for trustworthy Artificial Intelligence. Gov. Inf. Q. 2020, 37, 101493. [Google Scholar] [CrossRef]
  71. Houser, K.A.; Bagby, J.W. Next-generation data governance. Duke Law Technol. Rev. 2023, 21, 1–43. [Google Scholar]
  72. Polit, D.F.; Beck, C.T. The content validity index: Are you sure you know what’s being reported? Critique and recommendations. Res. Nurs. Health 2006, 29, 489–497. [Google Scholar] [CrossRef] [PubMed]
  73. Yusoff, M.S.B. ABC of content validation and content validity index calculation. Educ. Med. J. 2019, 11, 49–54. [Google Scholar] [CrossRef]
  74. Peng, M.W.; Luo, Y. Managerial ties and firm performance in a transition economy. Acad. Manag. J. 2000, 43, 486–501. [Google Scholar] [CrossRef]
  75. Lindell, M.K.; Whitney, D.J. Accounting for common method variance in cross-sectional research designs. J. Appl. Psychol. 2001, 86, 114–121. [Google Scholar] [CrossRef] [PubMed]
  76. Henseler, J.; Ringle, C.M.; Sarstedt, M. A new criterion for assessing discriminant validity in variance-based structural equation modeling. J. Acad. Mark. Sci. 2015, 43, 115–135. [Google Scholar]
  77. Hair, J.F. Multivariate Data Analysis; Macmillan: New York, NY, USA, 1987. [Google Scholar]
  78. Fornell, C.; Larcker, D.F. Evaluating structural equation models with unobservable variables and measurement error. J. Mark. Res. 1981, 18, 39–50. [Google Scholar] [CrossRef]
  79. Anderson, J.C.; Gerbing, D.W. Structural equation modeling in practice: A review and recommended two-step approach. Psychol. Bull. 1988, 103, 411–423. [Google Scholar] [CrossRef]
  80. Cheung, G.W.; Rensvold, R.B. Evaluating goodness-of-fit indexes for testing measurement invariance. Struct. Equ. Model. 2002, 9, 233–255. [Google Scholar] [CrossRef]
  81. DeVellis, R.F. Scale Development: Theory and Applications, 4th ed.; Sage Publications: Thousand Oaks, CA, USA, 2017. [Google Scholar]
  82. Podsakoff, P.M.; MacKenzie, S.B.; Lee, J.Y.; Podsakoff, N.P. Common method biases in behavioral research: A critical review of the literature and recommended remedies. J. Appl. Psychol. 2003, 88, 879–903. [Google Scholar] [CrossRef] [PubMed]
  83. Podsakoff, P.M.; Organ, D.W. Self-reports in organizational research: Problems and prospects. J. Manag. 1986, 12, 531–544. [Google Scholar] [CrossRef]
  84. Kleinbaum, D.G.; Kupper, L.L.; Muller, K.E.; Nizam, A. Applied Regression Analysis and Other Multivariable Methods; Duxbury Press: Pacific Grove, CA, USA, 1998. [Google Scholar]
  85. Aguinis, H.; Beaty, J.C.; Boik, R.J.; Pierce, C.A. Effect size and power in assessing moderating effects of categorical variables using multiple regression: A 30-year review. J. Appl. Psychol. 2005, 90, 94–107. [Google Scholar] [CrossRef] [PubMed]
  86. Cohen, J. Statistical Power Analysis for the Behavioral Sciences, 2nd ed.; Lawrence Erlbaum Associates: Hillsdale, NJ, USA, 1988. [Google Scholar]
  87. Preacher, K.J.; Hayes, A.F. Asymptotic and resampling strategies for assessing and comparing indirect effects in multiple mediator models. Behav. Res. Methods 2008, 40, 879–891. [Google Scholar] [CrossRef] [PubMed]
  88. Shrout, P.E.; Bolger, N. Mediation in experimental and nonexperimental studies: New procedures and recommendations. Psychol. Methods 2002, 7, 422–445. [Google Scholar] [CrossRef] [PubMed]
  89. Zhao, X.; Lynch, J.G.; Chen, Q. Reconsidering Baron and Kenny: Myths and truths about mediation analysis. J. Consum. Res. 2010, 37, 197–206. [Google Scholar] [CrossRef]
  90. MacCallum, R.C.; Wegener, D.T.; Uchino, B.N.; Fabrigar, L.R. The problem of equivalent models in applications of covariance structure analysis. Psychol. Bull. 1993, 114, 185–199. [Google Scholar] [CrossRef] [PubMed]
  91. Burnham, K.P.; Anderson, D.R. Model Selection and Multimodel Inference: A Practical Information-Theoretic Approach, 2nd ed.; Springer: New York, NY, USA, 2002. [Google Scholar]
  92. Akbarighatar, P. Operationalizing responsible AI principles through responsible AI capabilities. AI Ethics 2025, 5, 1787–1801. [Google Scholar]
  93. Williams, L.J.; Cote, J.A.; Buckley, M.R. Lack of method variance in self-reported affect and perceptions at work: Reality or artifact? J. Appl. Psychol. 1989, 74, 462–468. [Google Scholar] [CrossRef]
  94. Dillman, D.A.; Smyth, J.D.; Christian, L.M. Internet, Phone, Mail, and Mixed-Mode Surveys: The Tailored Design Method, 4th ed.; Wiley: Hoboken, NJ, USA, 2014. [Google Scholar]
  95. Armstrong, J.S.; Overton, T.S. Estimating nonresponse bias in mail surveys. J. Mark. Res. 1977, 14, 396–402. [Google Scholar] [CrossRef]
Figure 1. Conceptual framework.
Sustainability 18 07345 g001
Table 1. (a) Descriptive statistics, correlations, and discriminant validity indices (n = 233). (b) HTMT matrix for discriminant validity (N = 233).
(a)
Variables1234567891011121314
1. Age0.3640.140−0.007−0.1980.0170.0230.0110.1170.0550.070−0.058−0.009
2. Size0.3640.1590.0280.0110.0560.0770.1580.3580.2280.1140.0820.092
3. Own.0.1400.1590.1390.014−0.0440.0590.042−0.0090.046−0.059−0.063−0.107
4. Indus.−0.0070.0280.1390.006−0.1530.031−0.084−0.062−0.191−0.116−0.220−0.173
5. R&D I−0.1980.0110.0140.0060.1390.2230.3210.1950.2570.1570.1670.197
6. PIP0.0170.056−0.044−0.1530.139−0.0300.4420.2990.4460.3770.3570.325
7. CI0.0230.0770.0590.0310.223−0.030−0.0170.1050.0580.112−0.0060.121
8. II0.0110.1580.042−0.0840.3210.442−0.0170.8410.4710.5620.4560.3170.3410.016
9. AMC0.1170.358−0.009−0.0620.1950.2990.1050.4790.8280.5310.4480.4600.4910.025
10. AEC0.0550.2280.046−0.1910.2570.4460.0580.5690.5380.8480.4730.4140.3780.071
11. GID0.0700.114−0.059−0.1160.1570.3770.1120.4650.4570.4810.8440.3730.4330.087
12. DGQ−0.0580.082−0.063−0.2200.1670.357−0.0060.3280.4690.4230.3830.8250.519−0.034
13. AEA−0.0090.092−0.107−0.1730.1970.3250.1210.3510.4990.3880.4420.5270.8470.035
14. MV 0.0160.0250.0710.087−0.0340.035
Mean2.4706.0620.2790.3265.2665.0675.1635.6124.9725.4064.8164.8755.0344.455
S. D0.5601.8540.4490.4701.1621.1731.3640.9231.0510.9550.8911.1230.9613.298
(b)
VariablesAMCAECGIDIIAEADGQ
AMC
AEC0.606
GID0.5100.538
II0.5350.6360.512
AEA0.5540.4340.4860.388
DGQ0.5240.4740.4250.3630.584
Notes: (a) 1. N = 233. 2. Age = firm age; Size = firm size; Own. = ownership structure; Indus. = firm industry; R&D I = R&D intensity; PIP = prior innovation performance; CI = competitive intensity; II = inclusive innovation; AMC = AI multimodal capability; AEC = AI-enhanced customer empathy; GID = generative inclusive design; DGQ = data governance quality; AEA = AI ethical awareness; MV = marker variable (respondent tenure in current position). 3. Diagonal elements (bolded, rows 8–13, columns 8–13) are square roots of AVE. Lower triangle = zero-order Pearson correlations; upper triangle (rows 8–13, columns 8–13) = correlations corrected for common method variance using the Lindell–Whitney (2001) [75] procedure with r M = 0.016 (the smallest absolute correlation between MV and any focal construct). 4. Correlations ≥ |0.129| are significant at p < 0.05 ; ≥ |0.181| at p < 0.01 (two-tailed). All other entries are original Pearson correlations (no correction applied). (b) Notes: N = 233. AMC = AI multimodal capability; AEC = AI-enhanced customer empathy; GID = generative inclusive design; II = inclusive innovation; AEA = AI ethical awareness; DGQ = data governance quality. All HTMT values are below the conservative 0.85 threshold (Henseler et al., 2015) [76], confirming discriminant validity.
Table 2. Confirmatory factor analysis: model fit comparisons.
Modelχ2dfχ2/dfCFITLIRMSEASRMRΔCFI
Six-factor model (hypothesized)379.1922151.7640.9580.9510.0570.058
Five-factor A (AEC + GID combined)695.8002203.1630.8790.8610.0970.0830.079
Five-factor B (AEA + DGQ combined)729.0912203.3140.8700.8510.1000.1020.088
Four-factor (AEC + GID, AEA + DGQ combined)1043.4382244.6580.7910.7640.1260.1310.167
Four-factor (AMC, AEC, GID combined)1012.5672244.5200.7990.7730.1230.07910.159
Notes: N = 233. CFI = comparative fit index; TLI = Tucker–Lewis index; RMSEA = root mean square error of approximation; SRMR = standardized root mean square residual; ΔCFI = difference in CFI relative to the six-factor model. All alternative models show ΔCFI > 0.01, indicating significantly worse fit (Cheung & Rensvold, 2002) [80]. The six-factor model retains the theoretically specified structure with AEC reduced to three items (AEC1, AEC2, AEC4) following item redundancy diagnostics.
Table 3. Split-sample validation: exploratory factor analysis results (Sample 1).
FactorEigenvalueVariance Explained (%)Cumulative (%)ItemsLoadings Range
1 (GID)9.36240.7140.71GID1–GID40.817–0.851
2 (II)2.68211.6652.37II1–II40.819–0.849
3 (AEA)2.2209.6562.02AEA1–AEA40.784–0.833
4 (DGQ)1.5976.9568.96DGQ1–DGQ40.791–0.874
5 (AMC)1.3886.0374.99AMC1–AMC40.711–0.794
6 (AEC)1.0074.3879.37AEC1, AEC2, AEC40.734–0.793
Notes: n1 ≈ 125. Extraction method: principal axis factoring with Varimax rotation. KMO = 0.888; Bartlett’s test of sphericity: χ2 = 2166.724, df = 253, p < 0.001. No cross-loadings exceeded 0.35.
Table 4. Split-sample validation: confirmatory factor analysis fit (Sample 2).
Modelnχ2/dfCFITLIRMSEASRMR
Six-factor model1081.6720.9250.9110.0790.079
Notes: n2 = 108. CFI = comparative fit index; TLI = Tucker–Lewis index; RMSEA = root mean square error of approximation; SRMR = standardized root mean square residual. The six-factor measurement model was estimated on the holdout subsample. CFI and TLI both exceed the 0.90 threshold, indicating acceptable model fit in the validation subsample.
Table 5. Hierarchical regression results (Models 1–7).
VariablesM 1 (II)M2 (II)M3 (II)M4(AEC)M5(AEC)M6(GID)M7(GID)
Controls
Age0.0100.0010.0210.009−0.0020.0630.054
Size0.130 *0.0120.0280.196 **0.0620.074−0.053
Own.0.0420.0620.0660.0470.070−0.064−0.043
Indus.−0.033−0.024−0.006−0.145 *−0.134 *−0.059−0.048
R&D I0.285 ***0.233 ***0.221 ***0.200 **0.141 *0.100 †0.044
PIP0.389 ***0.301 ***0.277 ***0.387 ***0.287 ***0.349***0.254 ***
Cl−0.081−0.100 †−0.120 *0.011−0.0110.098 †0.077
Direct Effects
AMC 0.349 ***0.328 *** 0.396 *** 0.374 ***
ZDGQ (H1)0.007 (H3a) (H4a)
ZAEA 0.076
Interactions
AMC × AEA 0.115 * (H2a)
AMC × DGQ 0.114 † (H2b)
R20.2900.3830.4210.2990.4190.1810.288
ΔR20.093 ***0.038 †0.120 ***0.107 ***
F13.115 ***17.353 ***13.335 ***13.742 ***20.203 ***7.126 ***11.331 ***
Max VIF1.2251.3341.7301.2251.3341.2251.334
Notes: N = 233. Age = firm age; Size = firm size; Own. = ownership structure; Indus. = firm industry; R&D I = R&D intensity; PIP = prior innovation performance; CI = competitive intensity; II = inclusive innovation; AMC = AI multimodal capability; AEC = AI-enhanced customer empathy; GID = generative inclusive design; DGQ = data governance quality; AEA = AI ethical awareness. All interaction terms were mean-centered prior to analysis. Standardized regression coefficients (Beta) are reported. † p < 0.10, * p < 0.05, ** p < 0.01, *** p < 0.001. Models 4 and 6 include only control variables as benchmarks for Models 5 and 7, respectively.
Table 6. Bootstrap mediation results (5000 resamples, percentile method).
PathEffectSE95% CI (Percentile)pConclusion
Indirect Effects
AMC → AEC → II0.131[0.030, 0.266]0.011Significant
AMC → GID → II0.082[0.012, 0.164]0.017Significant
Total indirect effect0.213
Direct Effect
AMC → II0.161[−0.025, 0.380]0.093Not significant
Total Effect0.374
Notes: CI = confidence interval. Confidence intervals are based on 5000 bootstrap resamples using the percentile method. CI containing zero indicates non-significance at p < 0.05. Model fit: χ2 = 281.106, df = 192, χ2/df = 1.464, CFI = 0.966, TLI = 0.960, RMSEA = 0.045, SRMR = 0.093. All control variables (firm age, firm size, ownership, industry, R&D intensity, prior innovation performance, and competitive intensity) were included in the model. The SRMR value falls within the acceptable range (< 0.10) for complex models with full control variables. AEC and GID fully mediate the relationship between AMC and II (direct effect not significant; both indirect effects significant).
Table 7. Comparison of forward and reverse models.
Modelχ2dfχ2/dfCFITLIRMSEASRMRAIC
Forward model (AMC → AEC/GID → II)281.1061921.4640.9660.9600.0450.093403.106
Reverse model (II → AEC/GID → AMC)308.9551921.6090.9560.9470.0510.101430.955
DifferenceΔCFI = 0.010ΔTLI = 0.013ΔAIC = 27.849
Notes: N = 233. Forward model is the hypothesized model (AMC → AEC/GID → II). Reverse model reverses the causal direction between AMC and II (II → AEC/GID → AMC). Both models include the same set of control variables. ΔCFI > 0.01 indicates meaningful model improvement (Cheung & Rensvold, 2002) [80]. Lower AIC indicates better model fit (Burnham & Anderson, 2004) [91]. SRMR values are from AMOS output (RMR for forward model = 0.093; RMR for reverse model = 0.101).
Disclaimer/Publisher’s Note: The statements, opinions and data contained in all publications are solely those of the individual author(s) and contributor(s) and not of MDPI and/or the editor(s). MDPI and/or the editor(s) disclaim responsibility for any injury to people or property resulting from any ideas, methods, instructions or products referred to in the content.