Article

Energy–Carbon Trade-Offs of Windcatcher Integration in a High-Thermal-Mass Courtyard House: A Combined EnergyPlus and CFD-Based Assessment in a Hot–Arid Climate


by
Mohammad Ahmad Hussein Khataybeh
1,
Alpay Akgüç
2,* and
Dilek Yasar
3
1
Department of Architecture, Faculty of Architecture and Design, Istanbul Aydın University, 34295 Istanbul, Türkiye
2
Department of Architecture, Faculty of Architecture, Istanbul Bilgi University, 34060 Istanbul, Türkiye
3
Department of Interior Architecture, Faculty of Architecture and Design, Istanbul Aydın University, 34295 Istanbul, Türkiye
*
Author to whom correspondence should be addressed.
Sustainability 2026, 18(14), 7283; https://doi.org/10.3390/su18147283
Submission received: 4 June 2026 / Revised: 10 July 2026 / Accepted: 10 July 2026 / Published: 16 July 2026
(This article belongs to the Special Issue Innovations in Sustainable Building Design and Energy)

Abstract

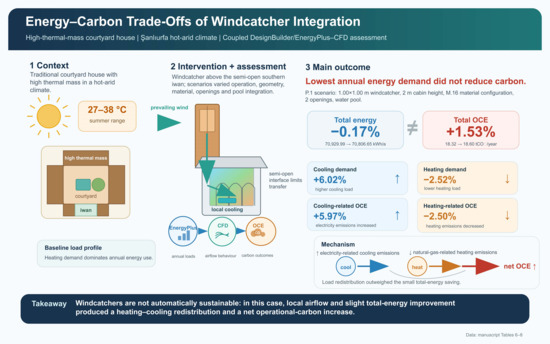
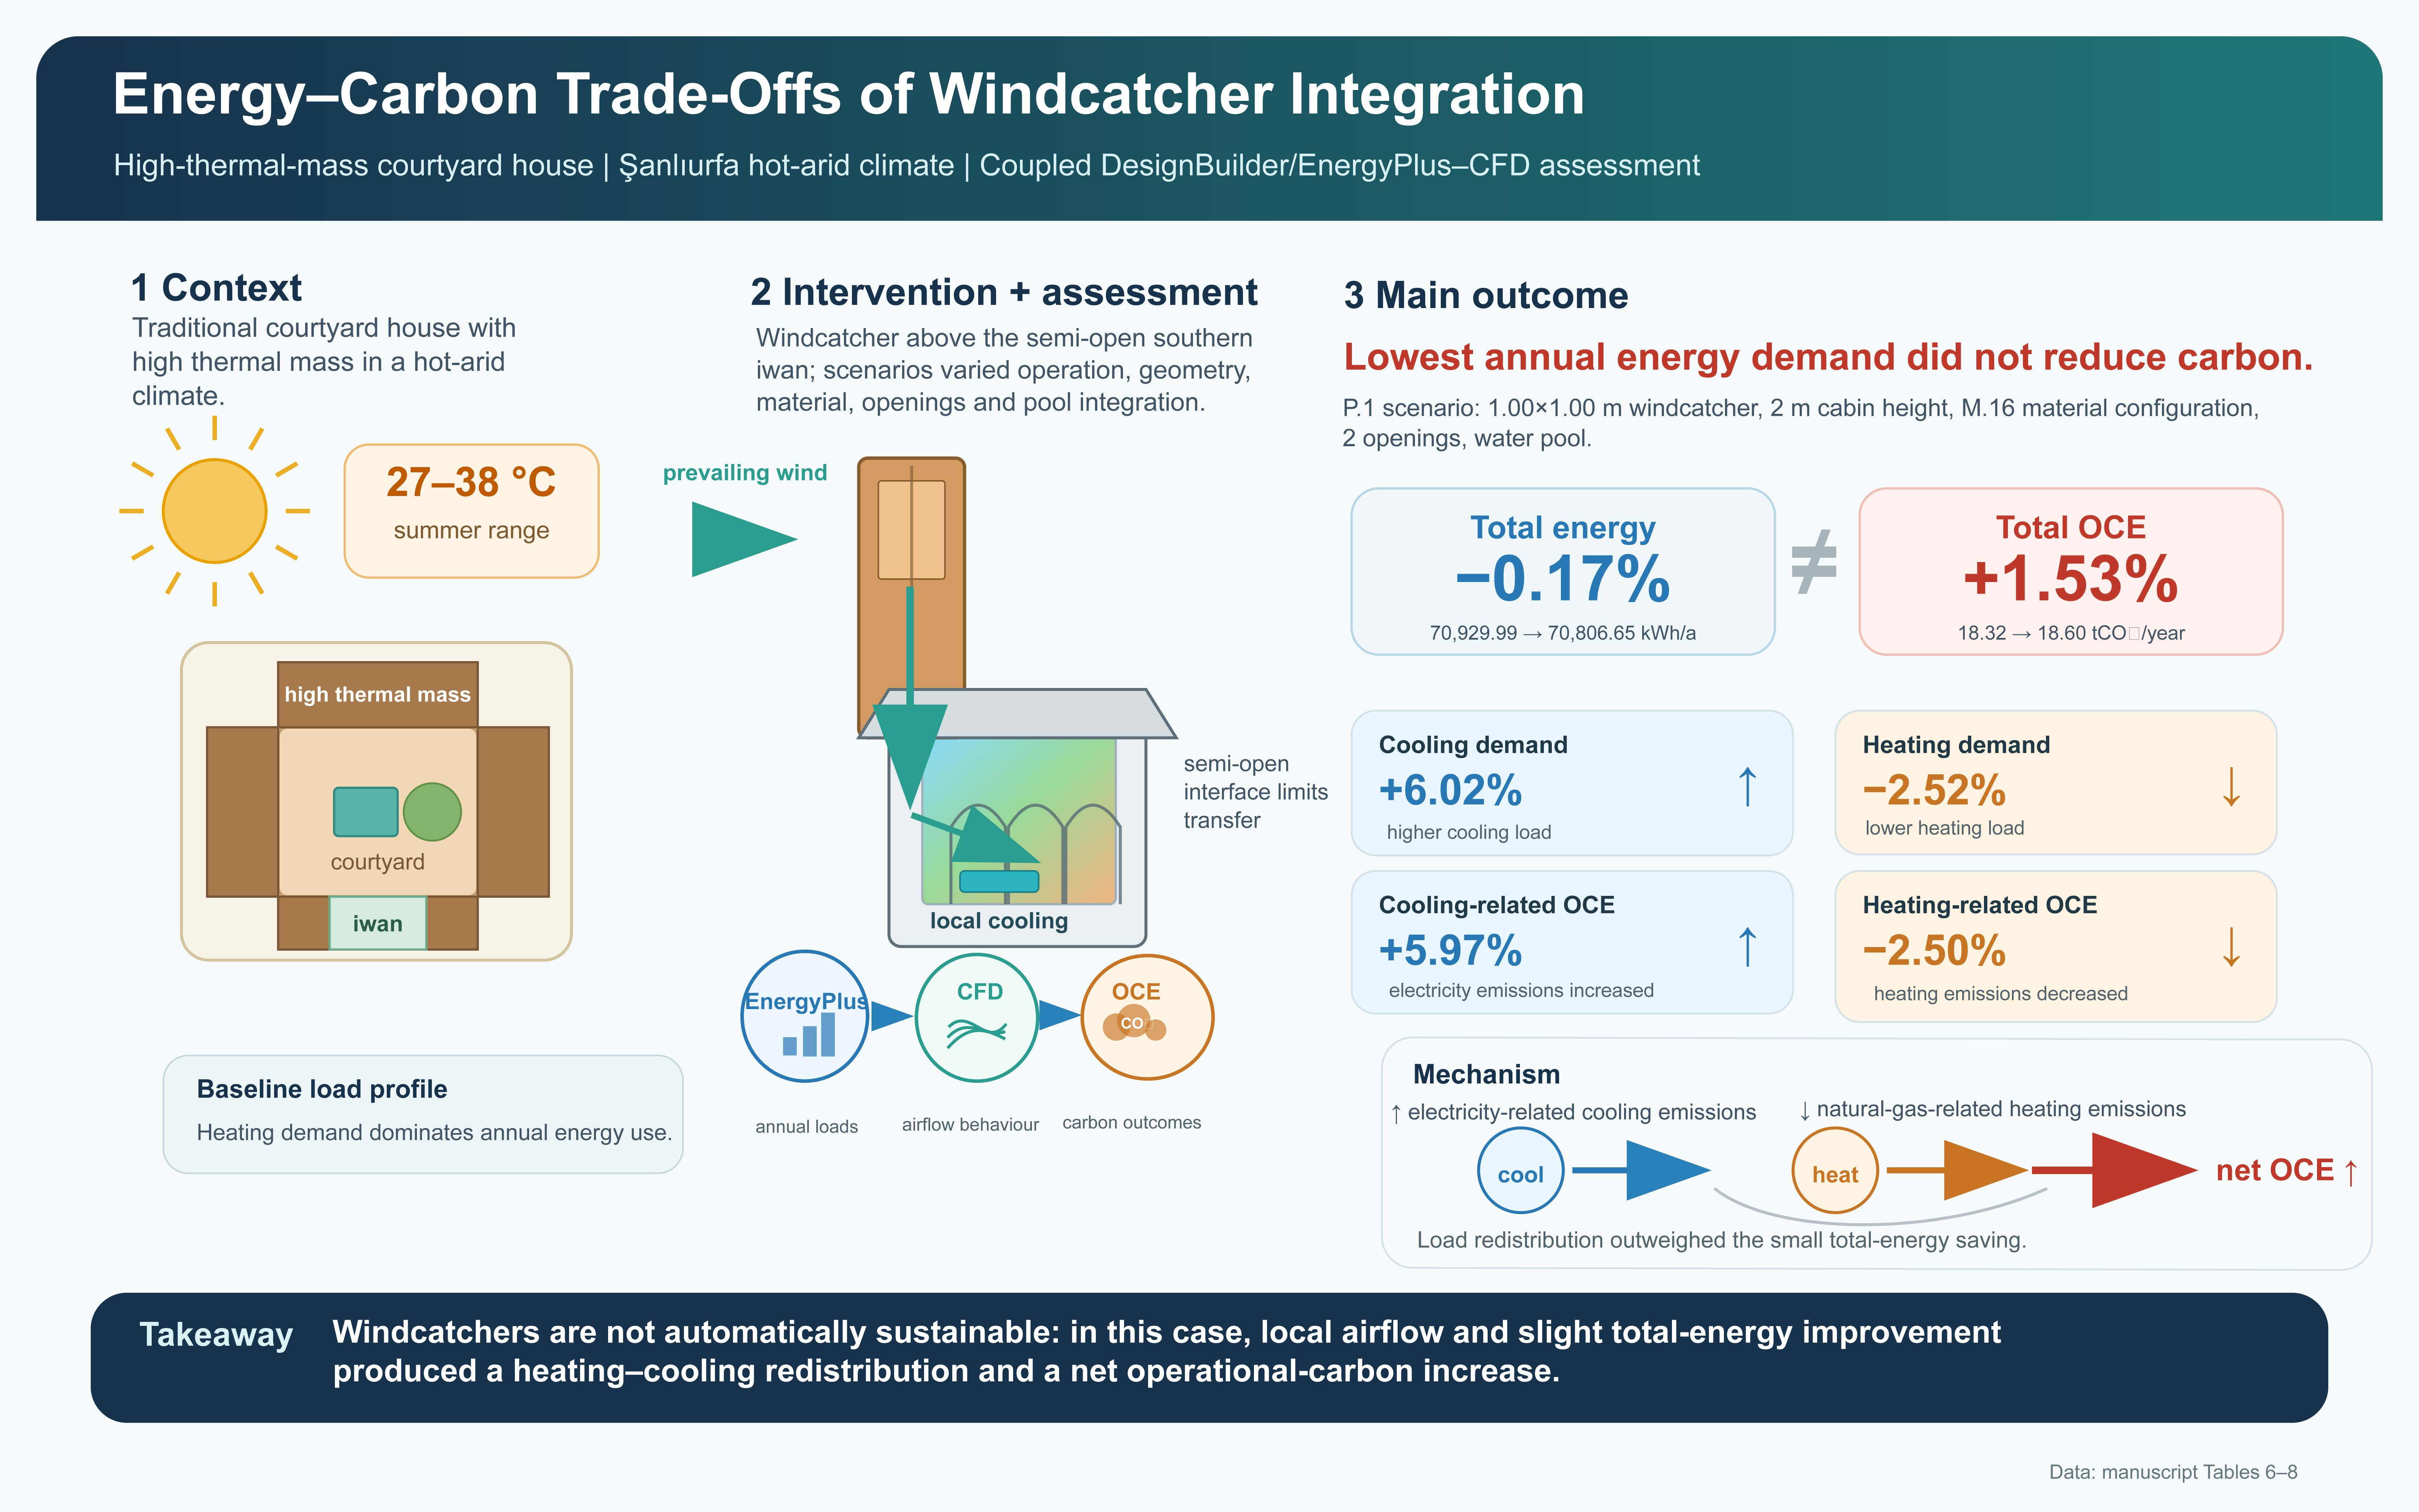
Traditional windcatchers are often discussed as passive cooling devices for hot–arid climates, yet their sustainability performance under contemporary comfort-controlled operation remains insufficiently understood. This study evaluates the energy and load-based carbon implications of integrating a windcatcher into a high-thermal-mass courtyard house in Şanlıurfa, Türkiye. A combined DesignBuilder v6.1/EnergyPlus v8.2 and CFD-based assessment was used: annual heating and cooling loads were calculated through EnergyPlus-based building energy simulation, while CFD analyses were used to interpret representative airflow behavior and localized thermal effects within the semi-open iwan. Scenarios varied operational schedule, geometry, material configuration, ventilation openings, and water pool integration. The results show strongly context-dependent performance rather than uniform energy or carbon benefit. Continuous operation weakened annual performance, whereas seasonal operation produced more balanced outcomes. The P.1 configuration produced the lowest total annual energy demand among the tested scenarios, decreasing total demand from 70,929.99 to 70,806.65 kWh/a, corresponding to a reduction of 123.34 kWh/a or 0.17% relative to the baseline. However, this limited reduction was accompanied by a 6.02% increase in cooling demand and a 2.52% decrease in heating demand. Consequently, the total load-based carbon indicator increased from 18.32 to 18.60 tCO2/year, corresponding to an increase of 0.28 tCO2/year or 1.53%. CFD results indicate that the semi-open iwan geometry and its orientation relative to prevailing winds constrained airflow effectiveness and limited the transfer of local cooling effects to conditioned zones. This study demonstrates that vernacular passive systems should be evaluated through integrated annual energy, airflow, and load-based carbon analyses before being adopted in sustainable renovation or climate-responsive design.

Graphical Abstract

1. Introduction

The accelerating impacts of climate change, combined with rising global energy demand, are increasing the vulnerability of residential buildings in hot and arid climate regions, where cooling energy constitutes a dominant share of operational energy consumption. As the building sector remains one of the largest contributors to global energy use and carbon emissions, reducing reliance on mechanical cooling systems has shifted from an optional design preference to a critical environmental and economic necessity [1]. In this context, passive and low-energy ventilation strategies have regained prominence as key components of climate-responsive residential design.
Among traditional passive ventilation systems, windcatchers represent one of the oldest and most extensively studied architectural devices developed in hot and dry regions. By facilitating indoor ventilation through wind-induced pressure differences, buoyancy-driven airflow, and natural air exchange, windcatchers can also contribute to passive cooling under appropriate conditions. Recent research documents their historical development, typological diversification, and regional adaptations across the Middle East, North Africa, and comparable climate zones [2,3], while contemporary studies emphasize their potential impacts on indoor air quality, thermal comfort, and energy demand [4,5,6].
A substantial body of research has focused on optimizing windcatcher geometry using computational fluid dynamics methods, offering detailed insights into how parameters such as opening size, height, orientation, internal partitions, and upper wing-wall configurations influence airflow patterns, pressure differentials, and ventilation performance [7,8,9,10]. Recent CFD-based work on upper wing walls further demonstrates the importance of windcatcher geometry in modifying wind capture, air circulation, and ventilation effectiveness. These studies provide valuable local ventilation evidence under selected boundary conditions, but they remain limited in representing year-round building operation, interaction with comfort-controlled energy models, and carbon-weighted load implications in high-thermal-mass courtyard houses.
This limitation has contributed to growing interest in hybrid ventilation strategies that combine natural and mechanical systems. Studies demonstrate that hybrid ventilation, when supported by appropriate control mechanisms, can deliver significant energy and economic benefits in residential buildings [11]. Windcatchers are therefore proposed as complementary elements that can reduce mechanical cooling loads under favorable climatic conditions [12]. Nevertheless, quantitative evidence regarding their annual impact on heating and cooling loads under continuous thermal comfort control remains limited.
On the other hand, under climate change scenarios, the risk of summertime overheating has become an increasingly critical issue for buildings employing natural and hybrid ventilation strategies. Empirical and simulation-based studies indicate that traditional passive cooling strategies may exacerbate indoor overheating rather than mitigate it under future climate conditions [13,14,15]. Despite this, residential buildings incorporating windcatcher based ventilation are rarely examined from an overheating risk perspective, as existing studies tend to focus primarily on cooling potential.
This limitation becomes particularly critical in buildings with high thermal mass. Although thermal mass is widely recognized for its ability to dampen temperature fluctuations and support night ventilation [16,17], it has also been emphasized that insufficient heat dissipation can lead to heat accumulation and increased cooling demand [18]. Therefore, the interaction between windcatchers and thermal mass should be evaluated within a holistic, year-round energy performance framework that encompasses heating and cooling loads, overheating risk, and load-based carbon indicators.
To clarify the positioning of the present study, Table 1 summarizes how this study differs from the main strands of prior windcatcher and passive-ventilation research.
Taken together, the literature shows that windcatchers have been widely examined as passive ventilation and cooling devices, but the relationship between local airflow mechanisms and annual building-scale performance remains insufficiently resolved. Existing CFD-oriented studies provide valuable evidence on velocity fields, pressure differences, opening geometry, height, orientation, and internal partitions; however, these studies often focus on selected boundary conditions or short-term airflow behavior. Conversely, annual building energy studies can quantify heating and cooling loads, but they may provide limited explanation of how airflow is spatially mediated through architectural interfaces such as semi-open iwans. This gap becomes especially important in high-thermal-mass courtyard houses, where local airflow or evaporative cooling within a semi-open space may not be transferred effectively to adjacent conditioned zones. Therefore, a more integrated assessment is needed to examine whether windcatcher-induced local airflow and cooling effects actually translate into annual heating–cooling load reduction and improved load-based carbon outcomes under contemporary comfort-controlled operation.
Accordingly, this study reconceptualizes the windcatcher not as an inherently sustainable passive device, but as a context-dependent architectural component that may generate energy and load-based carbon trade-offs. The analysis is conducted on a traditional high-thermal-mass courtyard house in the hot–arid climate of Şanlıurfa, Türkiye, using an integrated assessment approach that combines annual EnergyPlus-based building energy simulation with CFD-based interpretation of representative airflow behavior. By evaluating windcatcher integration under comfort-controlled conditions, the study examines how spatial configuration, operational scheduling, material properties, ventilation openings, and evaporative support affect annual heating demand, cooling demand, total energy demand, local airflow behavior, and load-based carbon outcomes.
More specifically, this study assesses whether windcatcher integration reduces or redistributes annual heating and cooling loads in a high-thermal-mass courtyard house; how the semi-open iwan mediates airflow effectiveness and the transfer of local cooling effects to adjacent conditioned zones; whether the configuration with the lowest total annual energy demand also improves the load-based carbon indicator; and under which spatial, operational, and material conditions windcatcher integration produces beneficial, limited, or adverse performance outcomes. In doing so, this study aims to challenge generalized assumptions about passive cooling and high thermal mass in hot–arid housing and to provide a more performance-based basis for evaluating vernacular passive systems in sustainable renovation and climate-responsive design.
This study makes three main contributions. First, it demonstrates that windcatcher integration in a high-thermal-mass courtyard house may produce heating–cooling load redistribution rather than uniform annual energy savings. Second, it shows that the configuration with the lowest total annual energy demand within the tested sequence does not necessarily improve the load-based carbon indicator, thereby highlighting the need to evaluate annual energy loads and carbon-weighted outcomes together. Third, it identifies the semi-open iwan as a critical architectural interface that can limit the transfer of local airflow and cooling effects to adjacent conditioned zones. These contributions distinguish the study from short-term CFD-only or idealized passive-operation assessments by linking local airflow interpretation, annual comfort-controlled energy simulation, and load-based carbon analysis within a single courtyard house case.
The originality of this study lies in reframing windcatcher evaluation from a single-dimensional passive cooling perspective to an integrated energy–airflow–carbon assessment. Rather than treating vernacular passive systems as automatically sustainable, the study demonstrates the need to test their performance across annual operation, spatial interfaces, and carbon consequences before adopting them as sustainable renovation or climate-responsive design strategies.

2. Materials and Methods

2.1. Research Approach and Methodological Framework

This study adopts a quantitative research approach incorporating building energy performance simulations, computational fluid dynamics (CFD) analyses, comparative energy assessments, and load-based carbon indicator analysis. The methodological framework is designed to interpret the effects of an architectural intervention not only through annual energy outcomes, but also in relation to the underlying physical processes, including airflow behavior, thermal mass interaction, and air exchange mechanisms.
Within this framework, the research begins with the selection of a traditional high-thermal-mass courtyard building located in Şanlıurfa, Türkiye, characterized by hot and arid climatic conditions, as the case study building (CSB). The building represents a region-specific residential typology through its masonry construction, thick load-bearing walls, high thermal mass, and semi-open spaces such as the iwan. Its selection is based on three criteria: representativeness of hot and arid climates, high thermal mass characteristics, and spatial suitability for the integration of passive ventilation elements such as windcatchers.
Although the building typology is traditional, the simulations are configured to reflect contemporary residential use. Indoor air temperatures are controlled around defined setpoints throughout the year, enabling an objective evaluation of the energy performance of a traditional building under modern operational conditions.

2.1.1. Development of the Energy Model

In accordance with the CSB and operational assumptions defined above, the next stage of the study involved the development of a detailed building energy model. Architectural data, including plans, sections, spatial organization, and construction materials, were digitized, and the model was developed using the DesignBuilder simulation environment, which employs the EnergyPlus computational engine. EnergyPlus is a dynamic building performance simulation tool, and its calculation framework is consistent with EN ISO 13790 and related building energy assessment standards [19].
Drawing on recent studies that conceptualize windcatchers as architectural elements integrated with semi-open spaces, a windcatcher was designed and incorporated into the model as an architectural component connected to the iwan zone [2,3,6]. The semi-open character of the iwan, its capacity to direct airflow, and its climate-responsive role in traditional architecture formed the primary rationale for this placement. The windcatcher’s operation was defined through time-dependent opening and closing scenarios based on outdoor air temperature and daily thermal variations, and it was activated during periods favorable for natural ventilation and night cooling.
In the energy model, the windcatcher was represented as an architectural ventilation component rather than as a mechanical HVAC device. It was geometrically added above the roof of the southern iwan and connected to the semi-open iwan zone through the windcatcher opening and vertical airflow path. The baseline model (N.W) did not include this windcatcher geometry or its associated ventilation opening. In the windcatcher-integrated scenarios, the iwan zone remained unconditioned, while adjacent residential rooms retained their original conditioned status, heating and cooling setpoints, occupancy schedules, lighting loads, and equipment loads. This modeling strategy made it possible to examine how the added windcatcher pathway affected the annual heating and cooling thermal loads of adjacent conditioned zones through changes in airflow exchange and local thermal behavior.
The windcatcher operation was controlled through scenario-specific opening schedules. These schedules determined when the windcatcher pathway was active or inactive according to the operational logic of each scenario. When active, the windcatcher functioned as a passive airflow path connected to the iwan; when inactive, the windcatcher opening was treated as closed for the purpose of the annual energy assessment. The scenario parameters varied the windcatcher operation schedule, base area, cabin height, material construction, number of ventilation openings, and pool integration, while all non-windcatcher building assumptions were kept constant.
At this stage, the Ideal Loads Air System in EnergyPlus v8.2 was employed to evaluate the effects of the windcatcher independently of mechanical system efficiencies. This approach calculates the theoretical heating and cooling loads required to maintain indoor air temperatures at defined setpoints without specifying an HVAC system, thereby isolating the net impact of the architectural intervention on building thermal loads. Because the Ideal Loads Air System reports theoretical thermal loads rather than delivered energy use, primary energy consumption, or metered operational consumption, the resulting heating and cooling values were interpreted as load indicators. No specific cooling coefficient of performance, boiler efficiency, distribution loss, or HVAC control efficiency was embedded in these load outputs. This distinction is important for the subsequent carbon-related assessment, which is therefore framed as a load-based carbon indicator analysis rather than as a prediction of actual operational emissions from a fully specified HVAC system.
The weather input used for the annual simulations was the same typical meteorological year weather file for Şanlıurfa across all scenarios. The file was used consistently in DesignBuilder v6.1/EnergyPlus v8.2 and was reviewed through the climatic summaries presented in Section 3.1, including seasonal temperature ranges, relative humidity patterns, and prevailing wind directions. Since no site-specific measured weather station data were available for the case study building, the weather file was not locally calibrated. It was therefore used as a standardized climatic input for controlled scenario comparison rather than as a site-validated record of the exact microclimatic conditions around the building.

2.1.2. Simulation Scenarios and Comparative Analysis

The developed energy model enabled the formulation of simulation scenarios that allow for a comparative evaluation of the effects of the windcatcher on building energy performance. Accordingly, separate simulation scenarios were established for a reference building model without a windcatcher and for a building model with an integrated windcatcher, and annual heating and cooling loads were calculated for both scenarios. The reference model and the windcatcher-integrated models were therefore identical in terms of building geometry, thermal zoning, envelope properties, internal gains, occupancy schedules, lighting and equipment assumptions, and comfort setpoints, except for the added windcatcher geometry, its opening configuration, and its operation schedule. This ensured that differences in annual heating and cooling thermal loads could be interpreted as scenario-specific changes associated with the windcatcher intervention under otherwise consistent modeling assumptions.
In developing the simulation scenarios, long-term climatic data corresponding to the building location were used as the basis. Outdoor air temperatures, daily temperature ranges, sunshine duration, solar radiation levels, and prevailing wind directions for Şanlıurfa were analyzed using the Climate Consultant v.6.0 software. These data were employed to identify the time periods during which the windcatcher could theoretically operate effectively. The resulting simulation outputs were then evaluated comparatively in order to determine the impact of the windcatcher on overall building energy demand.
The scenario structure should be understood as a sequential scenario-based comparative assessment rather than a full factorial parametric design. The study did not test all possible combinations of operational schedule, floor area, cabin height, material configuration, ventilation openings, and pool integration. Instead, each scenario subset was developed by holding the previously selected configuration constant and varying the next design parameter. This structure was adopted to examine a realistic step-by-step design refinement process for a windcatcher intervention in a specific courtyard house configuration. Consequently, the results should be interpreted as relative performance changes within each scenario subset and within the tested sequence, rather than as isolated main effects of individual parameters or as a global optimization across all possible parameter interactions.

2.1.3. Computational Fluid Dynamics (CFD) Analyses

While the annual heating and cooling loads obtained from energy simulations provide quantitative results regarding windcatcher performance, these outcomes require interpretation in terms of the underlying physical processes. For this reason, CFD analyses were conducted to examine the effects of the windcatcher and the iwan zone on airflow behavior at the spatial scale.
Within the scope of these analyses, air velocity fields and temperature distributions in the relevant zones were evaluated, and the role of the windcatcher in shaping airflow patterns and thermal behavior was visualized. The CFD analyses were conducted as comparative airflow assessments for selected representative time periods rather than as annual dynamic airflow simulations. Accordingly, CFD outputs were used to interpret velocity fields, airflow paths, and localized thermal effects within the windcatcher–iwan configuration, while annual heating and cooling load impacts were obtained from the building energy simulations. This distinction between local CFD interpretation and annual energy simulation is central to the methodological logic of the study. CFD outputs were used to identify local microclimatic and airflow mechanisms, such as velocity concentration, localized temperature reduction, and the limited transfer of airflow through the semi-open iwan. These CFD-based local effects were not treated as direct evidence of whole-building annual energy savings or carbon-related improvement. Whole-building heating and cooling load outcomes were assessed through the EnergyPlus-based annual simulations, while carbon-related outcomes were evaluated separately through the load-based carbon indicator analysis. It should be noted that the EnergyPlus and CFD components were not dynamically or iteratively coupled. In this study, “integrated” refers to the combined interpretation of two complementary simulation outputs: EnergyPlus v8.2 was used to quantify annual heating and cooling load outcomes, whereas CFD was used to explain representative airflow patterns, velocity fields, and localized thermal effects within the windcatcher–iwan configuration. The CFD results therefore serve an explanatory role in interpreting spatial airflow behavior and do not constitute a time-step-by-time-step input to the annual energy simulation.
The CFD setup followed a comparative scenario-based logic. The same iwan geometry, windcatcher location, and surrounding spatial configuration were maintained across comparable simulations, while selected windcatcher parameters such as base area, cabin height, material configuration, internal partitioning, and pool integration were varied according to the scenario structure. Representative time periods were selected from the energy simulation outputs and climatic analysis to examine airflow behavior under conditions relevant to windcatcher operation.
The CFD governing equations, numerical setup, and reproducibility controls were specified within the CFD methodology. The analyses were performed in the DesignBuilder v6.1 CFD module as steady-state comparative airflow simulations. They were used to examine representative airflow and temperature fields rather than annual transient airflow behavior. The CFD workflow included two levels of interpretation: an external courtyard-scale airflow assessment used to characterize the interaction between the surrounding urban massing, prevailing wind direction, and the semi-open iwan; and internal windcatcher–iwan assessments used to compare the airflow implications of windcatcher parameter changes under consistent geometry and boundary condition logic.
The CFD analysis was formulated as a steady-state airflow and heat transfer problem for representative windcatcher–iwan configurations. The airflow field was described through the conservation of mass, momentum, and energy for air, which was treated as an incompressible Newtonian medium under the representative low-speed windcatcher–iwan airflow conditions considered in the CFD analysis. The airflow and heat transfer phenomena were modeled by solving the continuity, momentum (Navier–Stokes), and energy equations. The governing equations are expressed in vector form as follows:
∇ · u = 0
ρ (u · ∇) u = −∇p + μ∇2u + ρg
ρ cp(u · ∇T) = k∇2T + St
where u is the velocity vector [m/s], p is static pressure [Pa], ρ is air density [kg/m3], μ is dynamic viscosity [Pa·s], g is gravitational acceleration [m/s2], cp is the specific heat capacity of air [J/kg·K], T is air temperature [K], k is thermal conductivity [W/m·K], and St represents thermal source or sink terms where applicable. These equations describe airflow continuity, momentum balance, and convective–conductive heat transfer within the computational domain.
The CFD simulations were performed using the standard k–ε turbulence model implemented in the DesignBuilder v6.1 CFD module. The same turbulence model and numerical solver settings were maintained throughout all simulation cases to ensure methodological consistency and to enable direct comparison among the investigated windcatcher configurations. Since the CFD analyses were intended to provide a com-parative interpretation of representative airflow behavior rather than high-fidelity aerodynamic prediction, identical numerical settings were consistently applied across all scenarios.
For the external airflow assessment, a non-uniform computational grid was generated using the DesignBuilder v6.1 CFD module with a default grid spacing of 2.0 m and a grid-line merge tolerance of 0.2 m. The computational domain was extended using length, width, and height factors of 3.0, 3.0, and 2.0, respectively. External boundary conditions were defined as open boundaries. The inlet airflow conditions consisted of a wind speed of 4 m/s from the east (90°), and the surrounding terrain was represented using the suburban exposure category. This inlet condition was used as a representative steady-state boundary condition for controlled comparison among the CFD scenarios. In real outdoor conditions, however, approaching wind is not fully uniform: it is affected by atmospheric boundary layer development, surrounding urban roughness, local obstruction, and free-stream turbulence intensity. Previous CFD guidance and urban wind simulation studies emphasize that inlet flow profiles and turbulence quantities can influence predicted velocity fields around buildings [20,21]. Therefore, the present CFD results should be interpreted as representative comparative airflow pattern evidence under the specified inlet condition rather than as a complete prediction of all possible turbulent or gust-driven outdoor wind states. Building envelopes and windcatcher surfaces were treated as solid wall boundaries according to the default CFD settings implemented in DesignBuilder, without additional modification of the wall boundary treatment.
For the internal windcatcher–iwan analyses, the volumetric airflow rate was used as a governing airflow metric to define the inlet condition associated with the windcatcher opening. It was calculated from the ventilation opening area and representative wind speed as follows:
Q = A × V
where Q is the volumetric airflow rate [m3/s], A is the ventilation opening area [m2], and V is the representative wind speed [m/s]. For the 1.75 × 1.75 m reference configuration, the ventilation opening was 1.55 × 1.00 m and the representative wind speed was 4 m/s, giving an initial volumetric airflow rate of 6.2 m3/s. A loss coefficient of 0.5 was applied to account for sudden contraction at the sharp-edged inlet [22], reducing the effective volumetric airflow rate to 3.1 m3/s. The same scenario comparison logic was maintained across subsequent windcatcher configurations.
The iterative solution process monitored mass residuals, velocity residuals in the principal directions, temperature residuals, and a selected velocity cell monitor. Iteration histories were inspected to evaluate solution stabilization. The simulations were treated as steady-state calculations for selected representative conditions rather than as time-dependent transient CFD runs. Initial conditions were assigned from the corresponding representative climatic and model conditions used for each scenario, including inlet wind speed, inlet direction, and air temperature assumptions.
The CFD mesh was generated using the same DesignBuilder v6.1 CFD meshing procedure across comparable simulations in order to preserve scenario-to-scenario consistency. However, a formal mesh-independence study based on multiple systematically refined grids was not available within the present CFD workflow. Therefore, the manuscript does not claim full mesh independence. Instead, the CFD results are interpreted as comparative and explanatory airflow pattern evidence under a consistent mesh generation procedure. The mesh-related reporting status is summarized in Supplementary Table S1.
Likewise, measured airflow or indoor environmental data were not available for calibration. The CFD outputs were therefore used as comparative and explanatory simulation evidence of airflow patterns, local velocity fields, and localized thermal behavior within the windcatcher–iwan configuration. To improve scenario-to-scenario consistency, the same CFD module, geometric domain logic, opening configuration logic, wind direction assumptions, inlet condition logic, turbulence model setting, and mesh generation procedure were maintained across comparable simulations.

2.1.4. Load-Based Carbon Indicator Analysis

The annual heating and cooling thermal loads obtained from the EnergyPlus Ideal Loads simulations were used to calculate load-based carbon indicators. These indicators were not intended to represent actual delivered-energy consumption or measured operational emissions. Instead, they were used to examine whether the redistribution of heating and cooling loads caused by windcatcher integration would produce a favorable or unfavorable carbon-weighted outcome under the selected Turkish emission factors.
For cooling-related loads, the Turkey Electricity Generation and Electricity Consumption Point Emission Factors Information Form published by the Ministry of Energy and Natural Resources of the Republic of Türkiye [23] was used. Among the emission factors defined in the document, the distribution line-connected consumption point factor, representing building electricity use, was adopted as 0.481 tCO2/MWh.
For heating-related loads, the Turkey Emission Inventory published by the same ministry [24] was used as the reference. The inventory reports a natural gas emission factor of 55.46 ton/TJ for source category 1.A.1.a. Following unit conversion (1 TJ = 277,777.78 kWh), this corresponds to an emission factor of 0.20 tCO2/MWh.
The load-based carbon indicator was calculated by multiplying annual heating and cooling thermal loads by the corresponding emission factors after converting kWh to MWh. Since no specific HVAC system was modeled, the calculation did not include cooling COP, boiler efficiency, part-load performance, distribution losses, or system control effects. Lighting and equipment loads were assumed constant across all scenarios; therefore, the comparison focused only on changes in heating- and cooling-related thermal loads.

2.1.5. Simulation Reliability, Reproducibility, and Methodological Boundaries

The simulation framework was designed as a comparative and scenario-based assessment rather than as a calibrated prediction of the actual energy consumption of a monitored building. Since measured indoor environmental data, utility bills, or long-term operational records were not available for the case study building, the energy model was not calibrated against empirical performance data. The purpose of the model was therefore to isolate the relative effects of windcatcher integration and related design parameters under consistent assumptions, rather than to claim exact prediction of real-life energy use.
To support comparability across scenarios, the same base building geometry, weather file, occupancy assumptions, lighting and equipment loads, envelope properties, thermal zoning logic, and comfort setpoints were maintained throughout the annual simulations. Only the windcatcher-related parameters defined in the scenario structure, including operational schedule, floor area, cabin height, material configuration, ventilation openings, and pool integration, were varied. This controlled structure supports interpretation of the results as relative scenario-to-scenario load changes within the tested sequence.
The weather file was used as a standardized climatic input rather than as a locally calibrated microclimatic record. It was reviewed through the climatic summaries presented in Section 3.1, including seasonal temperature ranges, relative humidity patterns, and prevailing wind directions, but it was not validated against site-specific measured weather data for the case study building. Therefore, the absolute magnitude of heating and cooling loads may be sensitive to weather file uncertainty, especially with respect to wind direction, wind speed, and seasonal temperature distribution.
The EnergyPlus Ideal Loads Air System was used to evaluate heating and cooling load implications independently from the efficiencies, losses, and control characteristics of a specific HVAC system. This approach is suitable for isolating the thermal load impact of an architectural intervention; however, it does not represent the delivered energy consumption of a particular heating or cooling technology. Therefore, the reported heating and cooling results should be interpreted as thermal load indicators rather than as direct metered energy consumption values for a fully specified mechanical system.
The CFD analyses were used to interpret airflow behavior, velocity distribution, and local thermal effects within the windcatcher–iwan configuration. They were not treated as stand-alone evidence of annual energy performance or as a substitute for monitored airflow validation. The reliability of the CFD interpretation was supported by maintaining consistent geometry, boundary condition logic, solver settings, and scenario comparison procedures across the tested configurations. However, because measured airflow and indoor environmental data were not available, and because formal grid-independence and residual-threshold documentation was not available, the CFD outputs were not interpreted as fully validated predictions of actual indoor air velocities. They should instead be interpreted as comparative and explanatory simulation evidence for spatial airflow behavior.
The relationship between the CFD and annual energy components should also be understood within this boundary. CFD results were not used as time-step inputs to the EnergyPlus v8.2 model and did not directly calculate annual heating or cooling loads. Instead, they were used to interpret the spatial airflow mechanisms behind the annual load results, particularly the limited transfer of local airflow and evaporative cooling effects from the semi-open iwan to adjacent conditioned zones. As a result, conclusions regarding heating–cooling load redistribution should be interpreted as controlled comparative simulation findings rather than as calibrated predictions of measured building performance.
The carbon-related assessment was based on annual heating and cooling thermal load outputs combined with the emission factors specified in Section 2.1.4. Because these outputs were obtained from the EnergyPlus Ideal Loads Air System, the resulting values should be interpreted as load-based carbon indicators rather than actual operational carbon emissions. Since lighting and equipment loads were kept constant across all scenarios, the comparison focused only on changes in heating- and cooling-related thermal loads. This approach makes the energy–carbon trade-off associated with heating–cooling load redistribution visible, but it does not account for HVAC system efficiency, cooling COP, boiler efficiency, part-load behavior, distribution losses, embodied carbon, water consumption associated with the pool scenario, maintenance impacts, or life-cycle environmental burdens. The windcatcher should therefore be understood as an architectural airflow intervention within the energy model, not as a substitute for a fully specified HVAC or hybrid ventilation control system. The model isolates the thermal-load implications of opening, closing, and geometrically modifying the windcatcher pathway, but it does not simulate fan-assisted operation, mechanical control algorithms, or equipment-level system performance.
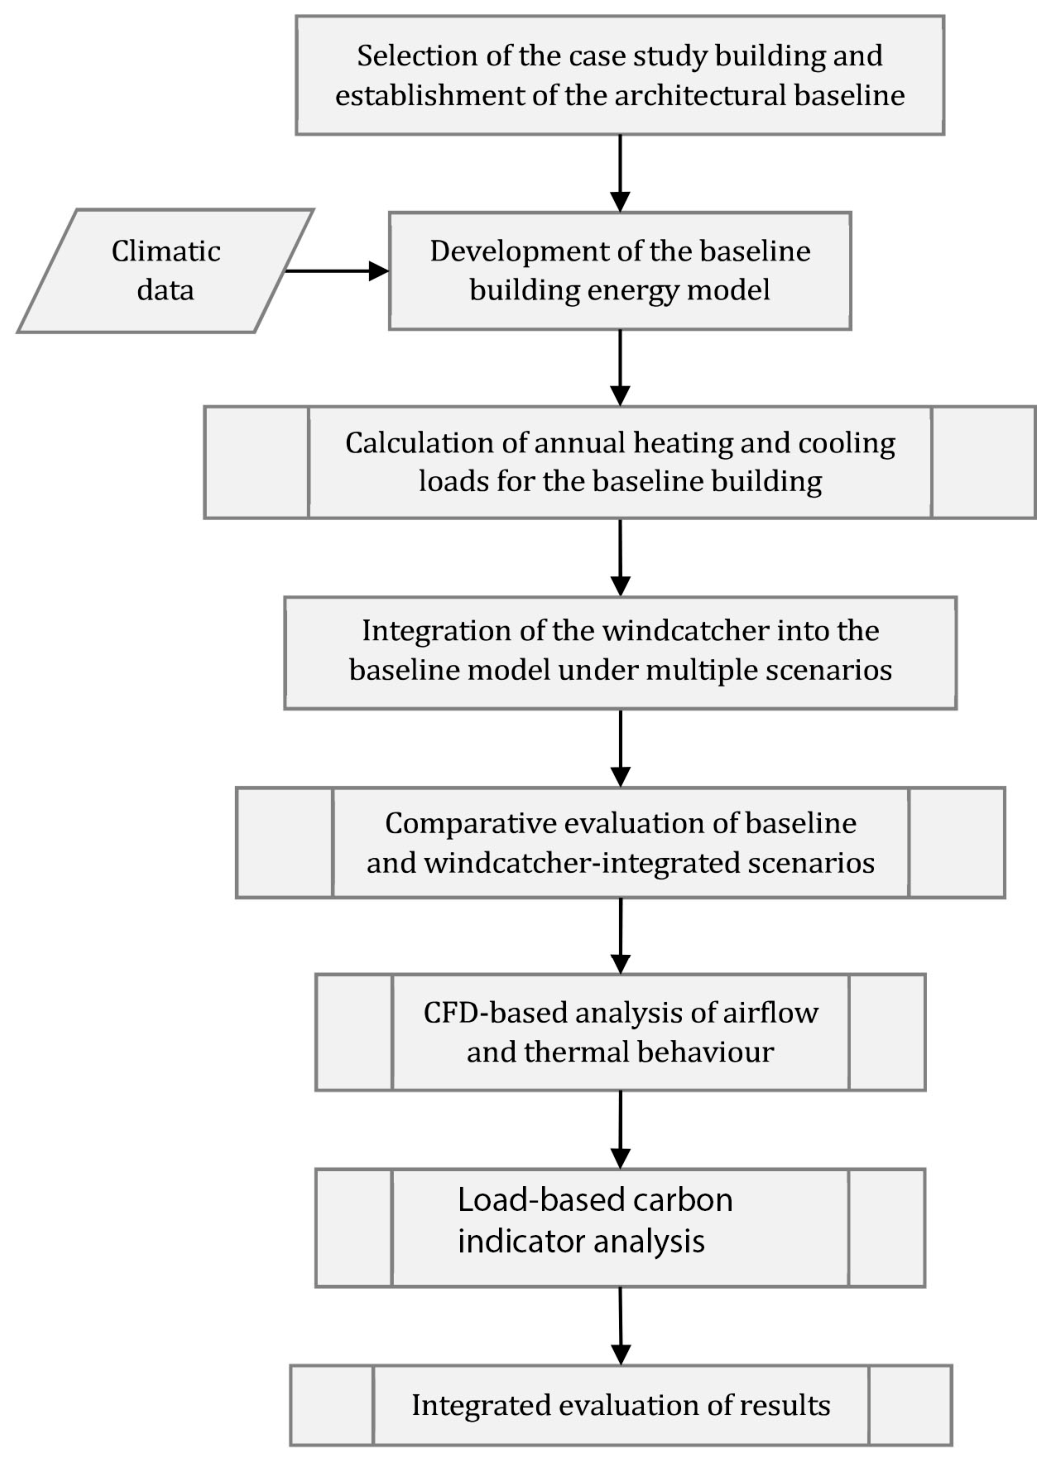
Accordingly, the findings should be interpreted within the methodological boundaries of a single-case, current-climate, simulation-based comparative study. The results provide analytical insight into how windcatcher integration may produce beneficial, limited, or adverse outcomes under specific spatial and operational conditions, rather than universal performance rules for all windcatcher types or hot–arid residential buildings. The overall methodological workflow is summarized in Figure 1.

3. Case Study Building and Climatic Context

3.1. Climatic Characteristics of Şanlıurfa

Şanlıurfa has a hot–dry climate typical of Southeastern Anatolia, characterized by cool winter conditions and very hot, dry summers. Outdoor temperatures range from 0 to 21 °C in winter and 27 to 38 °C in summer, while midday relative humidity during summer often falls below 40%. Prevailing winds are mainly from the west and northwest, shifting to the southeast and southwest in summer, when air temperatures typically range between 21 and 27 °C [25].

3.2. Architectural Characteristics of Case Study Building

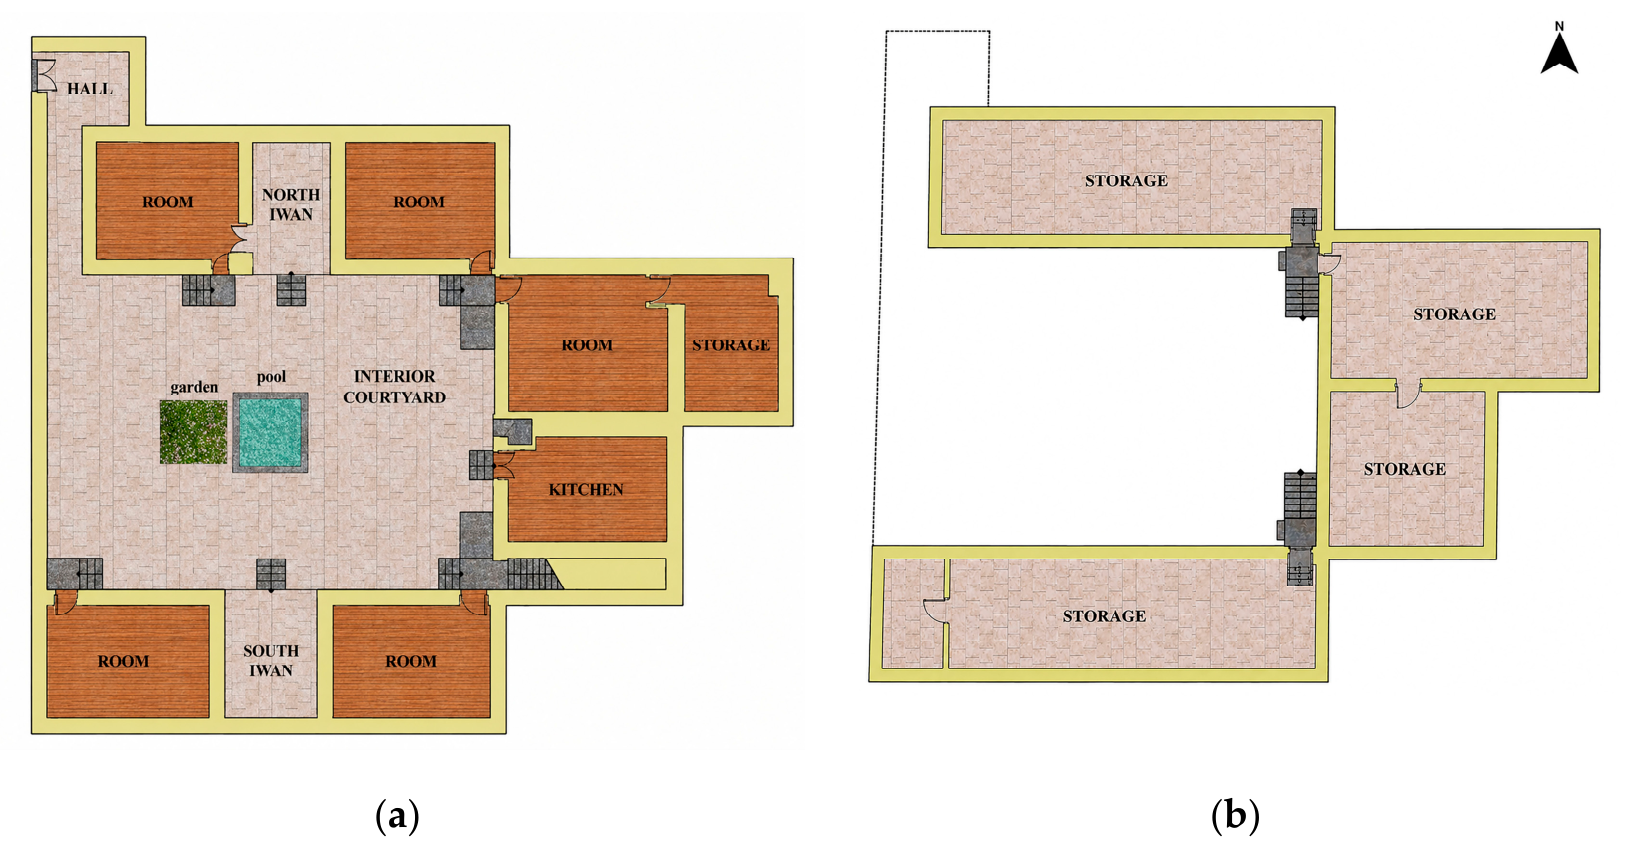
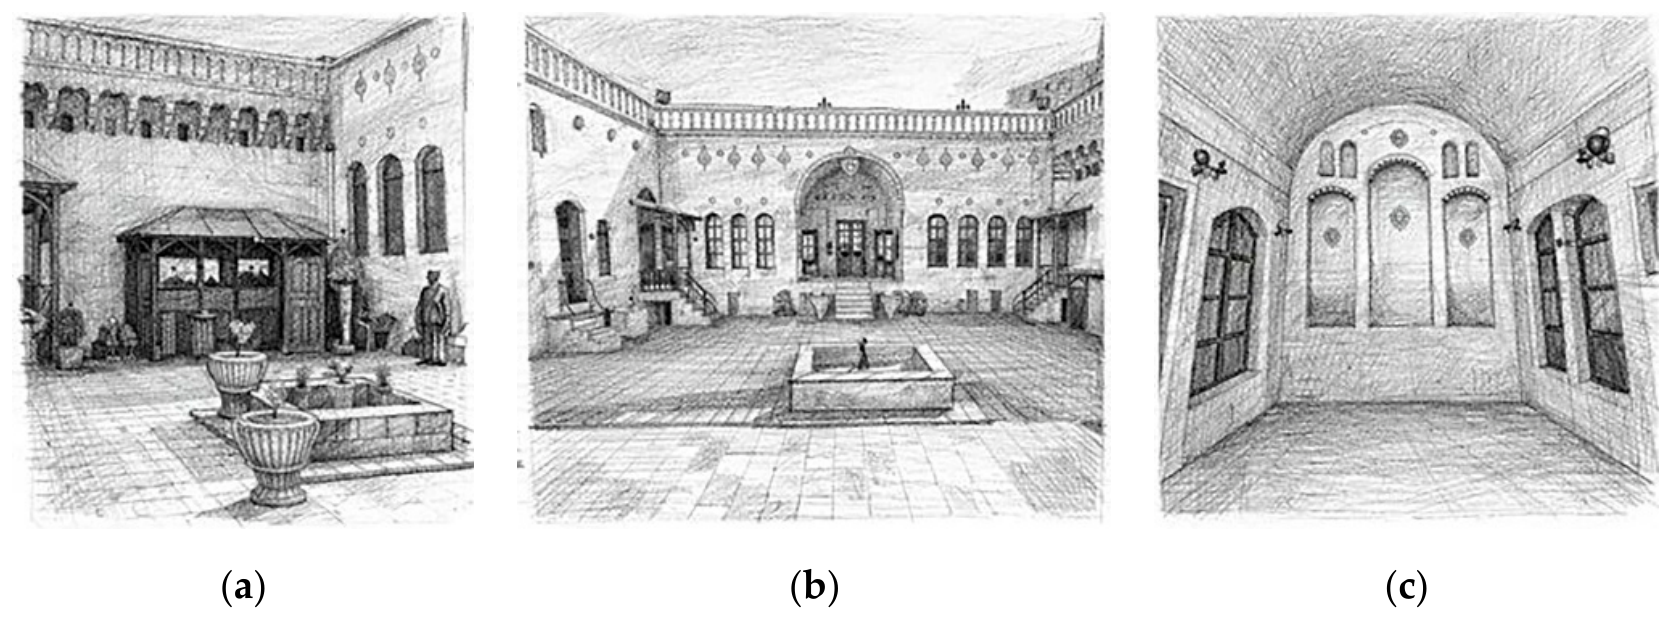
A traditional courtyard house located in the historic center of Şanlıurfa was selected as the CSB, as it represents a well-preserved example of vernacular residential architecture characterized by a courtyard-centered spatial organization and climate-responsive design strategies typical of the region. The building exhibits integrated passive environmental systems, including its form, orientation, spatial configuration, and use of local building materials, which show strong typological and structural similarities with other traditional residential buildings in Şanlıurfa.
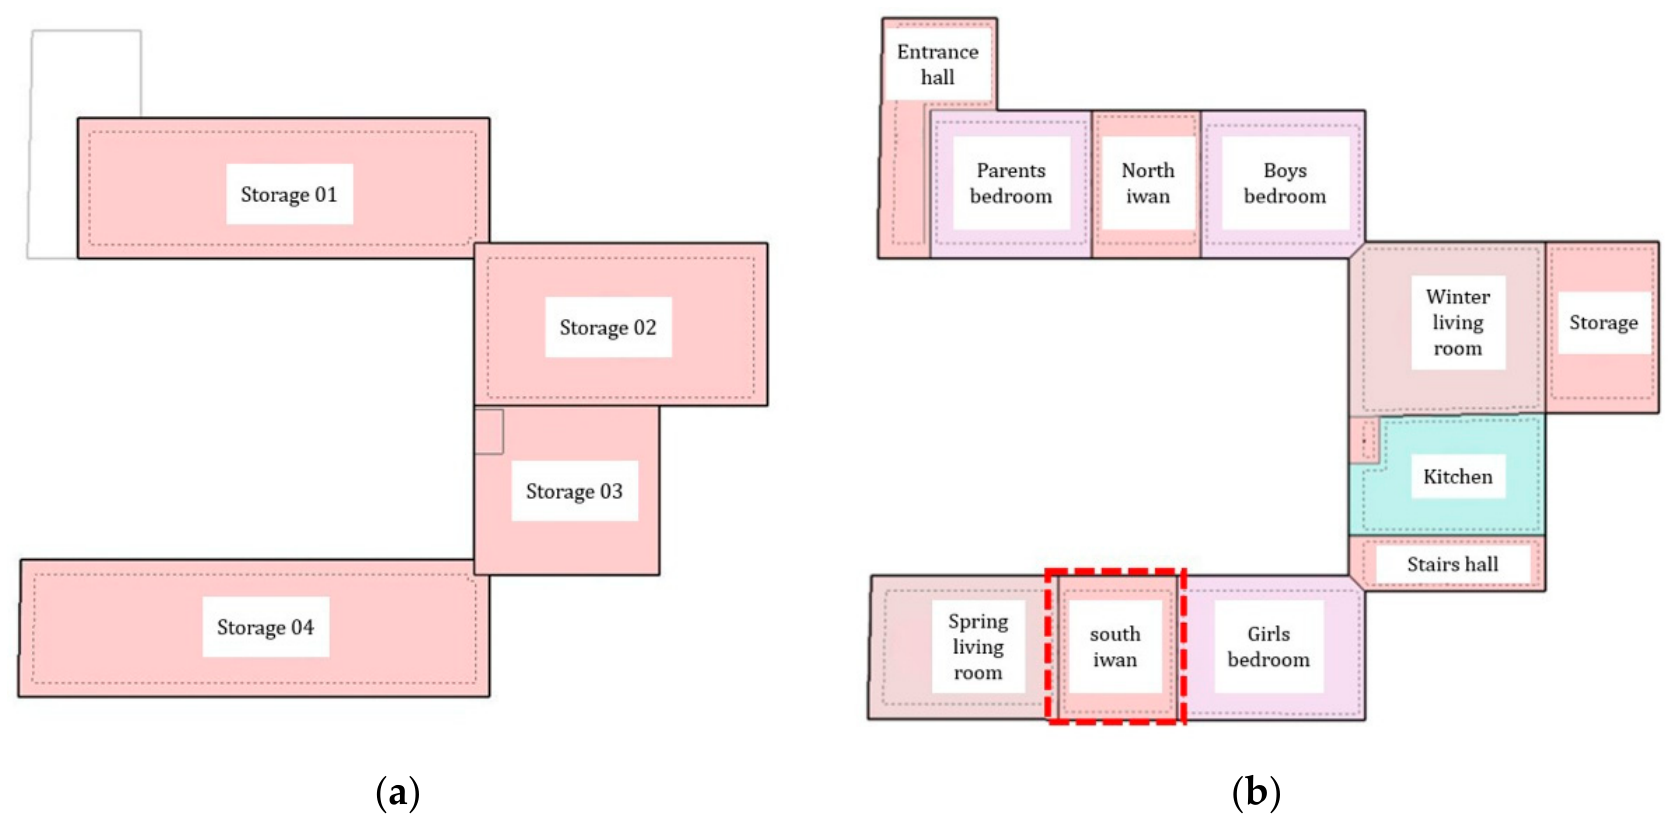
Figure 2 presents a schematic sketch of the overall building form and courtyard-centered layout, while Figure 3 presents the architectural floor plans of the CSB.
Consistent with the architectural characteristics that informed its selection as a CSB, the building is constructed primarily of Küfeki stone, a type of limestone widely used in Şanlıurfa due to its compatibility with hot climatic conditions. The masonry walls were built using traditional techniques with ash–lime mortar, composed of Küfeki stone dust, lime, and water [26]. Window openings are fitted with double glazing and wooden frames. The flat roof assembly comprises layered construction including arid soil, compacted soil, and shrub layers, forming a heavy structure that enhances thermal inertia [27]. The building mass is organized into distinct summer and winter zones to optimize solar radiation and wind flow. Summer spaces are oriented toward the north to remain shaded, while winter spaces face south to benefit from solar gains during colder periods, reflecting a seasonally adaptive spatial strategy typical of traditional houses in the region [28].

3.3. Building Energy Modeling

In this study, building energy simulations were conducted to evaluate the impact of the windcatcher on the energy performance of CSB. The building was modeled using DesignBuilder v6.1 software, employing the EnergyPlus v8.2 simulation engine, and energy performance was assessed for scenarios with and without the windcatcher. Architectural drawings were imported into DesignBuilder v6.1 to generate the building geometry and define the envelope components, including walls, floors, and roof (Figure 4).

3.4. Thermal Zoning and Operational Assumption

Table 2 summarizes the areas, volumes, occupancy rates, and occupancy schedules of all conditioned and unconditioned thermal zones in the building. LED lighting was assumed throughout the building, and the corresponding lighting power density (LPD) and total lighting power for each thermal zone are also presented in Table 2. Basement spaces were assumed to be unused and unconditioned; therefore, their occupancy levels as well as lighting and equipment loads were set to zero in the energy model.
Occupancy schedules were defined for each thermal zone using binary and fractional values to represent full, partial, or no use. The resulting schedules by zone type are provided in Table 3.
Heating and cooling setpoint temperatures were defined in order to calculate the thermal energy demands of each zone. Setpoints were adopted from the Turkish standard TS 825 Thermal Insulation Rules in Buildings [29], with heating set to 19 °C and cooling to 26 °C for all conditioned zones. Natural ventilation was modeled by allowing for window opening when indoor temperatures exceeded 24 °C. Accordingly, thermal zones were defined in DesignBuilder v6.1 based on space function, occupancy characteristics, activity levels, and setpoint temperatures.

3.5. Building Envelope Characteristics

The overall heat transfer coefficients (U-values) of the building envelope were calculated using DesignBuilder v6.1. The U-values of the exterior walls, internal walls, and roof were 0.810, 0.872, and 0.815 W/m2K, respectively. The window system exhibited a U-value of 2.233 W/m2K, a solar heat gain coefficient (SHGC) of 0.645, and a visible light transmittance (T-vis) of 0.708.

3.6. Boundary Condition and Urban Context

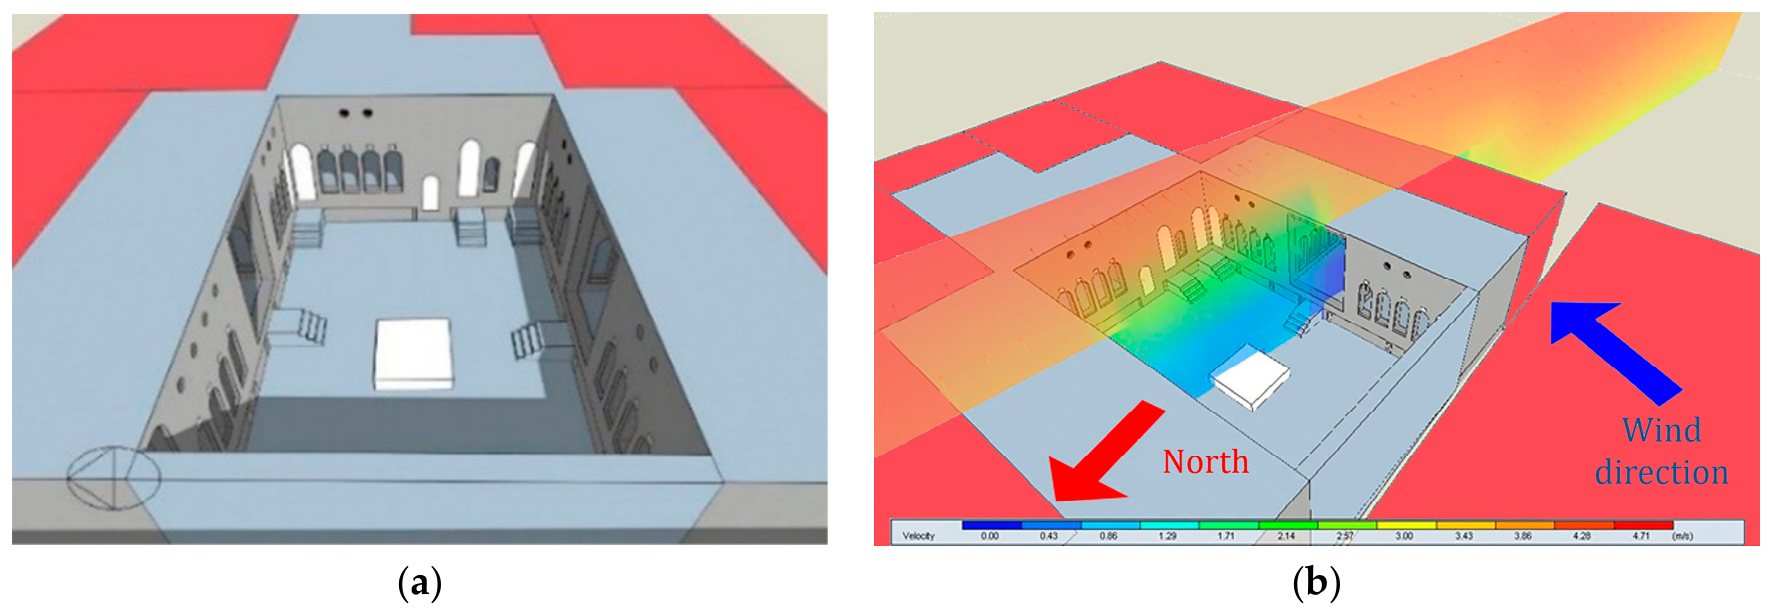
Due to the dense urban fabric surrounding CSB, adjacent buildings were modeled as adiabatic surfaces in DesignBuilder v6.1, assuming no heat transfer between the CSB and its immediate surroundings. The integrated model of CSB and neighboring structures is illustrated in Figure 5a.

3.7. Baseline Building Energy and Airflow Performance

Based on the previously defined input data and assumptions, the energy model of CSB was completed, and the baseline (N.W) simulation results are summarized in Table 4. The results indicate that the annual heating demand (48,057.16 kWh/a) is substantially higher than the cooling demand (18,101.77 kWh/a), resulting in a total annual energy demand of 70,929.99 kWh/a, including lighting and equipment loads.
The dominance of heating demand can be attributed to the annual heating-load profile created by winter conditions, despite the region’s hot–dry climatic classification. Moreover, as the building was originally designed for residential use, internal heat gains from lighting and equipment were relatively low, limiting their contribution to reducing heating demand when compared to non-residential buildings.
In addition to energy performance, airflow conditions within the southern iwan were evaluated using CFD analysis in DesignBuilder v6.1, with reference to prevailing wind data obtained from the Climate Consultant v6.0 program. As illustrated in Figure 5b, airflow within the iwan was minimal due to its perpendicular orientation to the prevailing wind direction and its enclosure on multiple sides. Consequently, air movement remained weak during the spring usage period, potentially restricting the occupants’ ability to benefit from the cooling effect of natural airflow.

4. Parametric Analyses of Windcatcher Design

In traditional residential architecture of Şanlıurfa, windcatchers are typically positioned on the rear wall of the north-oriented southern iwan, which constitutes the primary living space during hot summer periods. These systems generally comprise a central, taller niche accompanied by narrower side niches, with air circulation facilitated through vertical ducts connecting the niches to the roof. At roof level, a mihrab-shaped stone surface is oriented toward the north and northwest, corresponding to the prevailing wind directions in Şanlıurfa [26,30].
In line with these vernacular precedents, the windcatcher was integrated into the DesignBuilder v6.1/EnergyPlus v8.2 model as an added architectural component positioned on the roof of the southern iwan, with its ventilation opening oriented toward the west. The windcatcher was connected to the semi-open iwan through a vertical airflow path and was not modeled as a mechanical cooling or heating device. Its influence on the annual energy model was therefore assessed through changes in the building’s heating and cooling thermal loads under scenario-specific opening schedules and geometric/material configurations.
Within this framework, seven primary parameters governing windcatcher design were examined:
  • The location of the windcatcher on the southern iwan;
  • The operational schedule;
  • The floor area;
  • The cabin height;
  • The cabin material;
  • The number of ventilation openings;
  • The incorporation of a water pool.
The parametric analysis followed a sequential scenario-based logic. It was not designed as a full factorial experiment in which every possible combination of all parameters was tested. Each stage used the comparatively most favorable or least adverse configuration from the preceding subset as the basis for the next subset. Therefore, the results reported in Section 4.2, Section 4.3, Section 4.4, Section 4.5, Section 4.6 and Section 4.7 should be read as subset-specific comparisons under inherited scenario assumptions. The terms “lowest” or “most balanced” refer to the tested alternatives within the relevant subset or sequence and should not be interpreted as universal optima for all windcatcher configurations.

4.1. The Location of the Windcatcher on the Southern Iwan

An examination of vernacular Şanlıurfa houses indicates that windcatchers are commonly positioned above the niches of the southern iwan to enhance airflow velocity within the space. Following this established strategy, the windcatcher system in CSB was placed on the roof of the southern iwan. This configuration was intended to promote continuous air circulation between the iwan entrance and the windcatcher opening, enabling the extraction of heated indoor air through the negative pressure effect generated by the windcatcher system.

4.2. Windcatcher Operation Schedules

Identifying appropriate operational periods for the windcatcher system is essential, as operation under unfavorable outdoor conditions may increase heat losses and negatively affect energy performance. In Şanlıurfa, where winter outdoor temperatures may fall to around −1 °C in January, winter operation was considered inappropriate due to the risk of increased heating demand caused by cold air directed toward the iwan.
Based on vernacular precedents, windcatchers in Şanlıurfa are typically constructed using adobe or brick, with an approximate height of 1 m and a floor area of 0.50 × 0.50 m. These characteristics were adopted for the windcatcher integrated onto the roof of the southern iwan of CSB. Three windcatcher operation schedule scenarios were simulated using DesignBuilder v6.1.
In the first scenario (O.S.1), the windcatcher operated throughout the year. In the second scenario (O.S.2), operation was limited to the summer period (15 April–25 August). In the third scenario (O.S.3), operation was selectively scheduled according to outdoor air temperature conditions. Among the operational schedule scenarios, O.S.2 produced the lowest total annual energy demand; however, its advantage remained limited and should be interpreted as a relative improvement within the operation schedule subset rather than as evidence of a substantial building-scale energy saving. Lighting and equipment loads remained unchanged across all scenarios; therefore, the observed differences among the operation schedule scenarios reflect variations in heating and cooling loads. Differences in annual heating and cooling demands therefore reflect variations associated with the tested windcatcher operation schedules under otherwise constant modeling assumptions. Year-round operation (O.S.1) resulted in the poorest performance, whereas summer-only operation (O.S.2) outperformed O.S.3.
As shown in Table 5, during peak summer conditions (20 July, 07:00–08:00), O.S.2 increased airflow within the southern iwan and reduced air temperatures in adjacent spaces, including the spring hall and the girl’s bedroom, maintaining indoor temperatures below 26 °C for approximately two hours. Under O.S.3, the windcatcher was inactive, resulting in higher indoor temperatures.

4.3. Floor Area of Windcatcher

The floor area of the windcatcher was considered a critical design parameter, as enlarging this area reduces the available roof surface of the southern iwan. Therefore, windcatcher dimensions were kept within limited ranges. Based on observations of traditional windcatcher systems in Şanlıurfa, adobe-coated brick was selected as the construction material. For all floor-area scenarios, the windcatcher cabin height was fixed at 5 m.
Four windcatcher base-area configurations (depth × width) were examined: 1.75 × 1.75 m (F.A.D.1), 1.50 × 1.50 m (F.A.D.2), 1.25 × 1.25 m (F.A.D.3), and 1.00 × 1.00 m (F.A.D.4). These configurations were evaluated through annual energy simulations before the CFD-based airflow assessment. Simulations conducted on 2 June between 22:00 and 23:00 indicated that indoor air temperatures within the iwan slightly decreased with reduced windcatcher floor area, reaching the lowest value (25.95 °C) in the smallest configuration.
The volumetric airflow rate for the reference windcatcher configuration was calculated according to the airflow metric and local-loss adjustment defined in Section 2.1.3. The initial airflow rate was 6.2 m3/s, and the effective airflow rate after applying the loss coefficient was 3.1 m3/s. These values were used to support the CFD-based comparison of airflow behavior across the tested windcatcher configurations.
Simulation results indicated that variations in windcatcher floor area did not improve overall building energy efficiency. Moreover, the integration of the windcatcher slightly increased air temperatures within the iwan. Among the floor-area configurations, the smallest windcatcher area (1.00 × 1.00 m) resulted in the lowest total annual energy demand within this subset; however, this outcome should not be interpreted as an overall comfort advantage, since the CFD-based airflow assessment indicated that reduced area could also increase local air velocity within the iwan. Because the floor-area subset was evaluated while keeping the material and cabin height assumptions constant, these results indicate the relative performance of the tested floor-area alternatives under the selected scenario conditions. They should not be interpreted as a general isolated effect of floor area independent of height, material, opening configuration, or operational schedule.
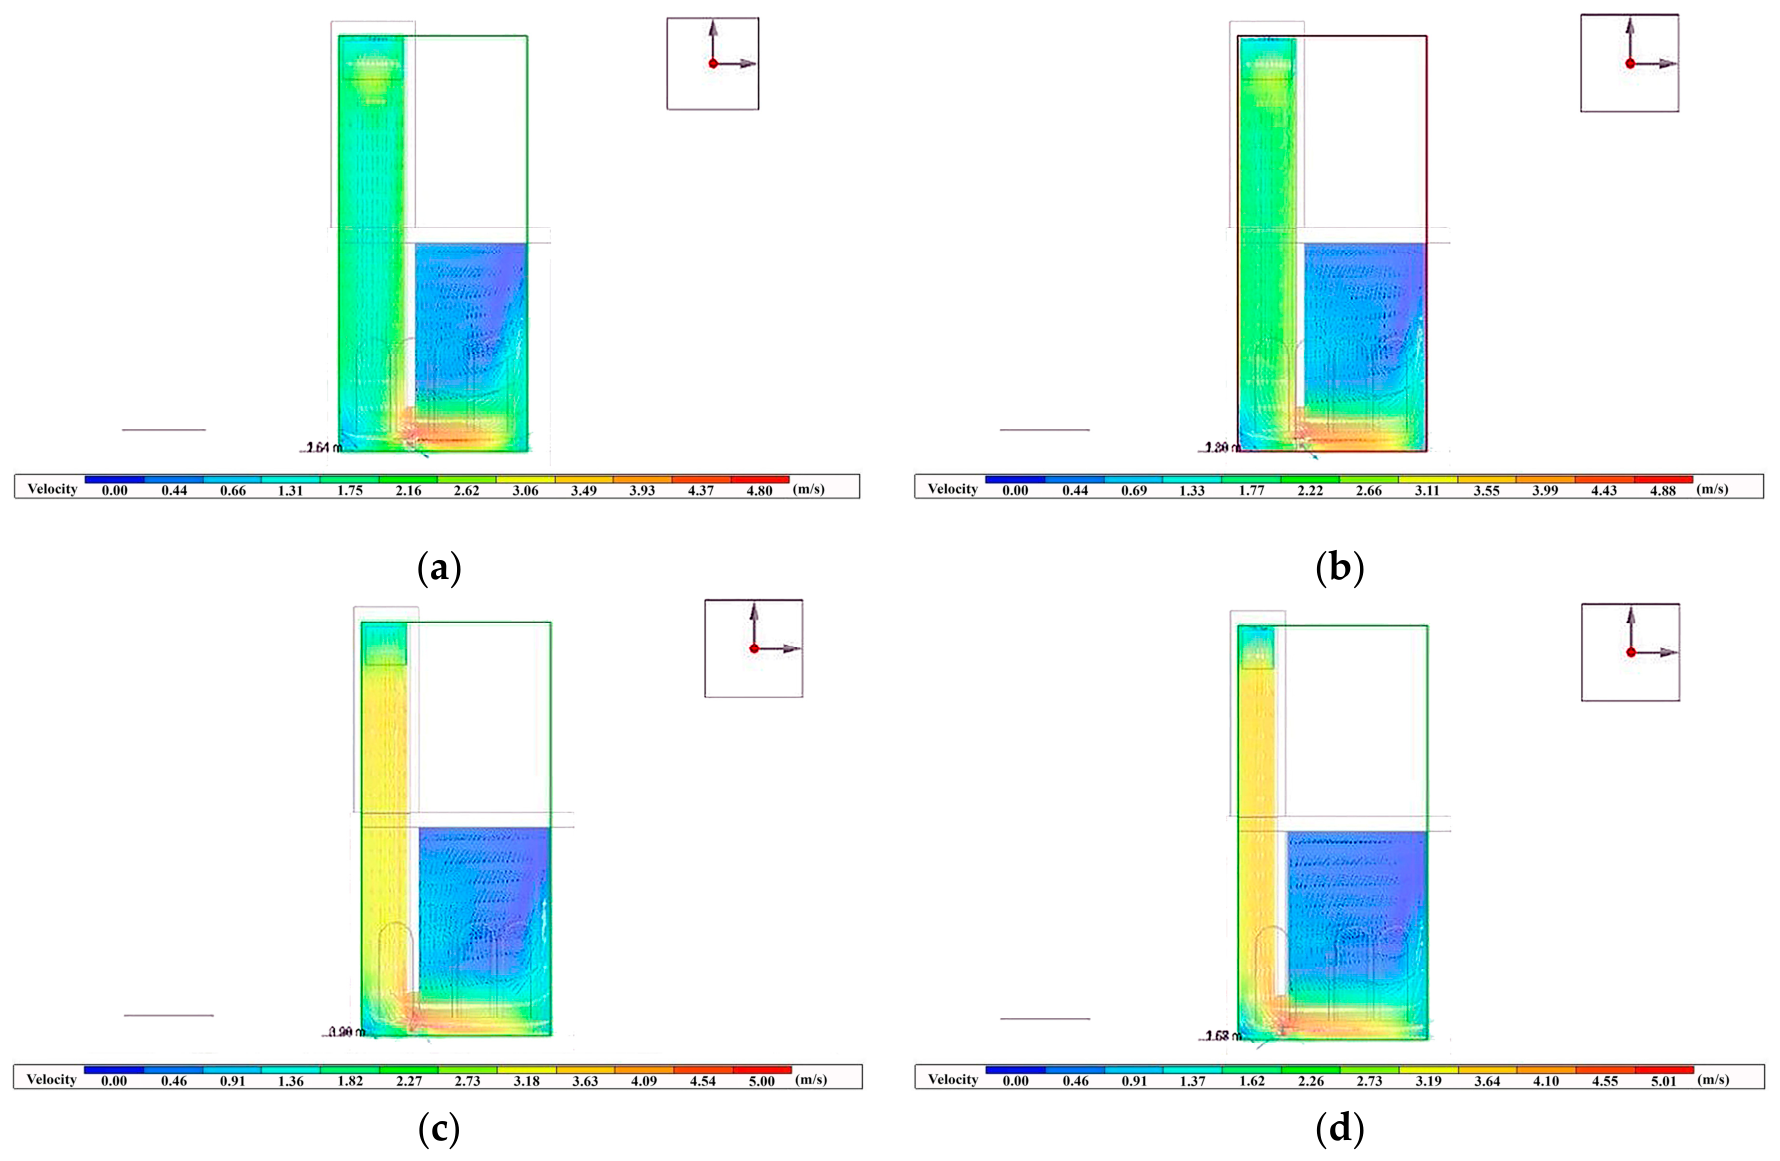
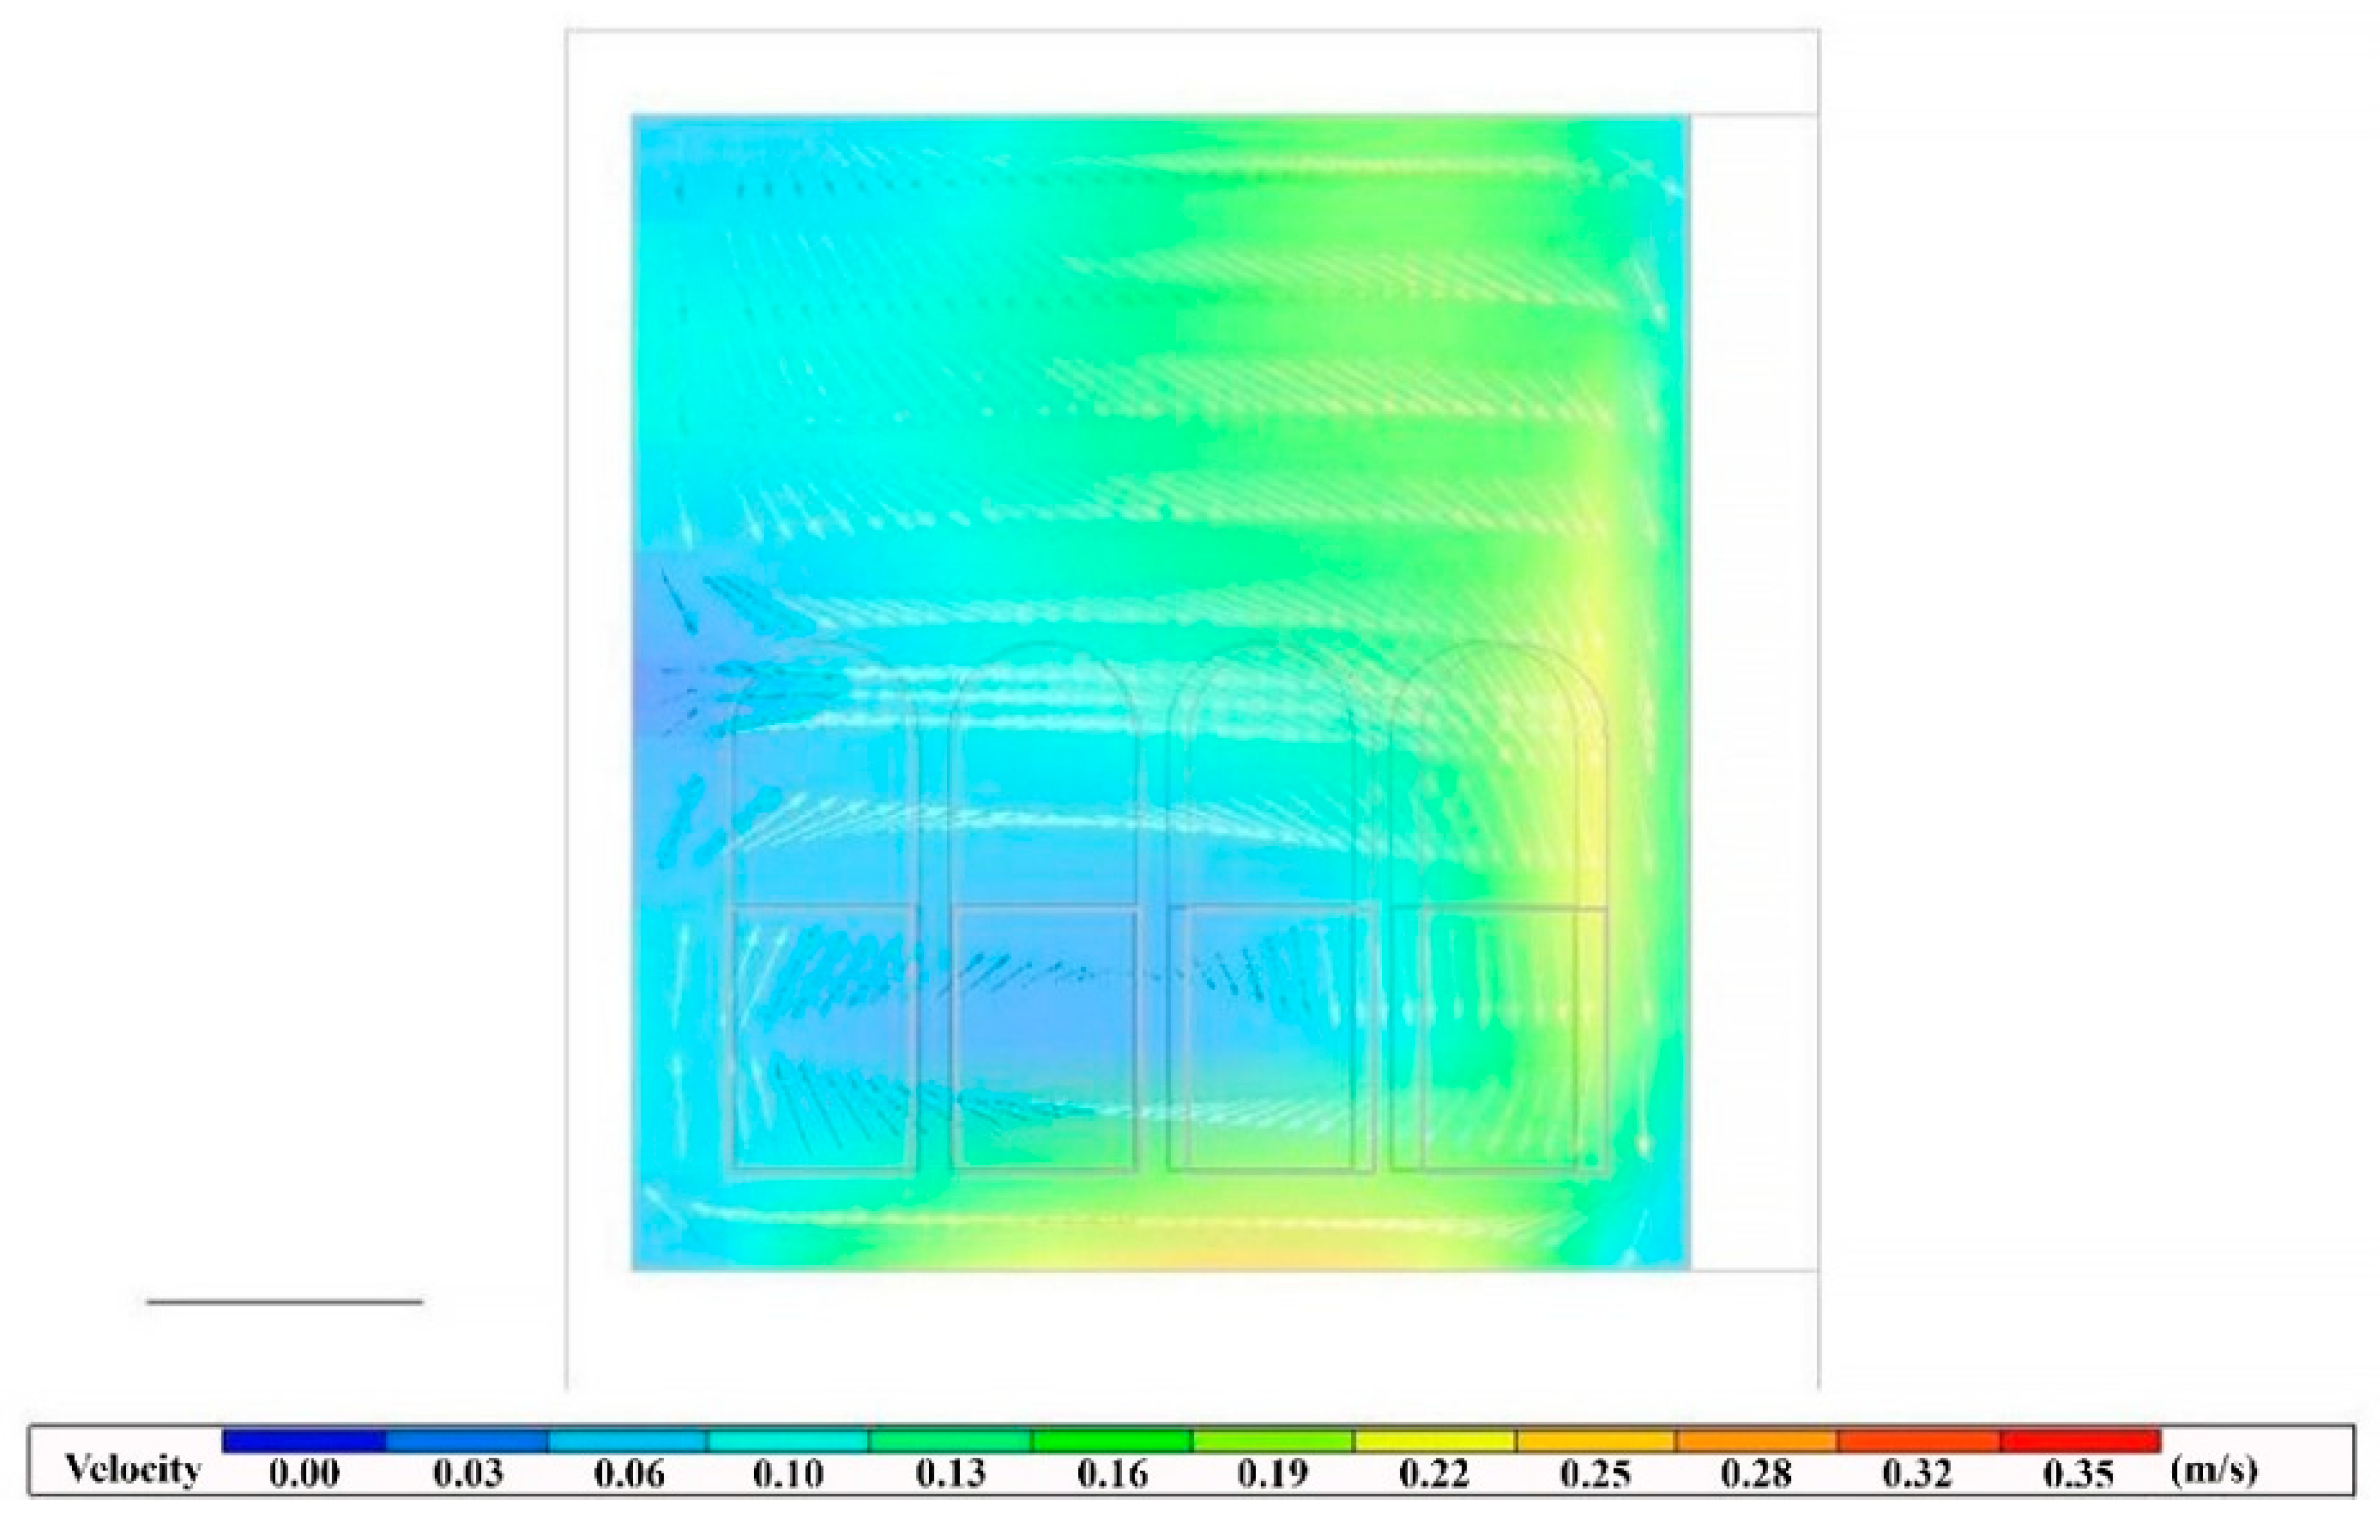
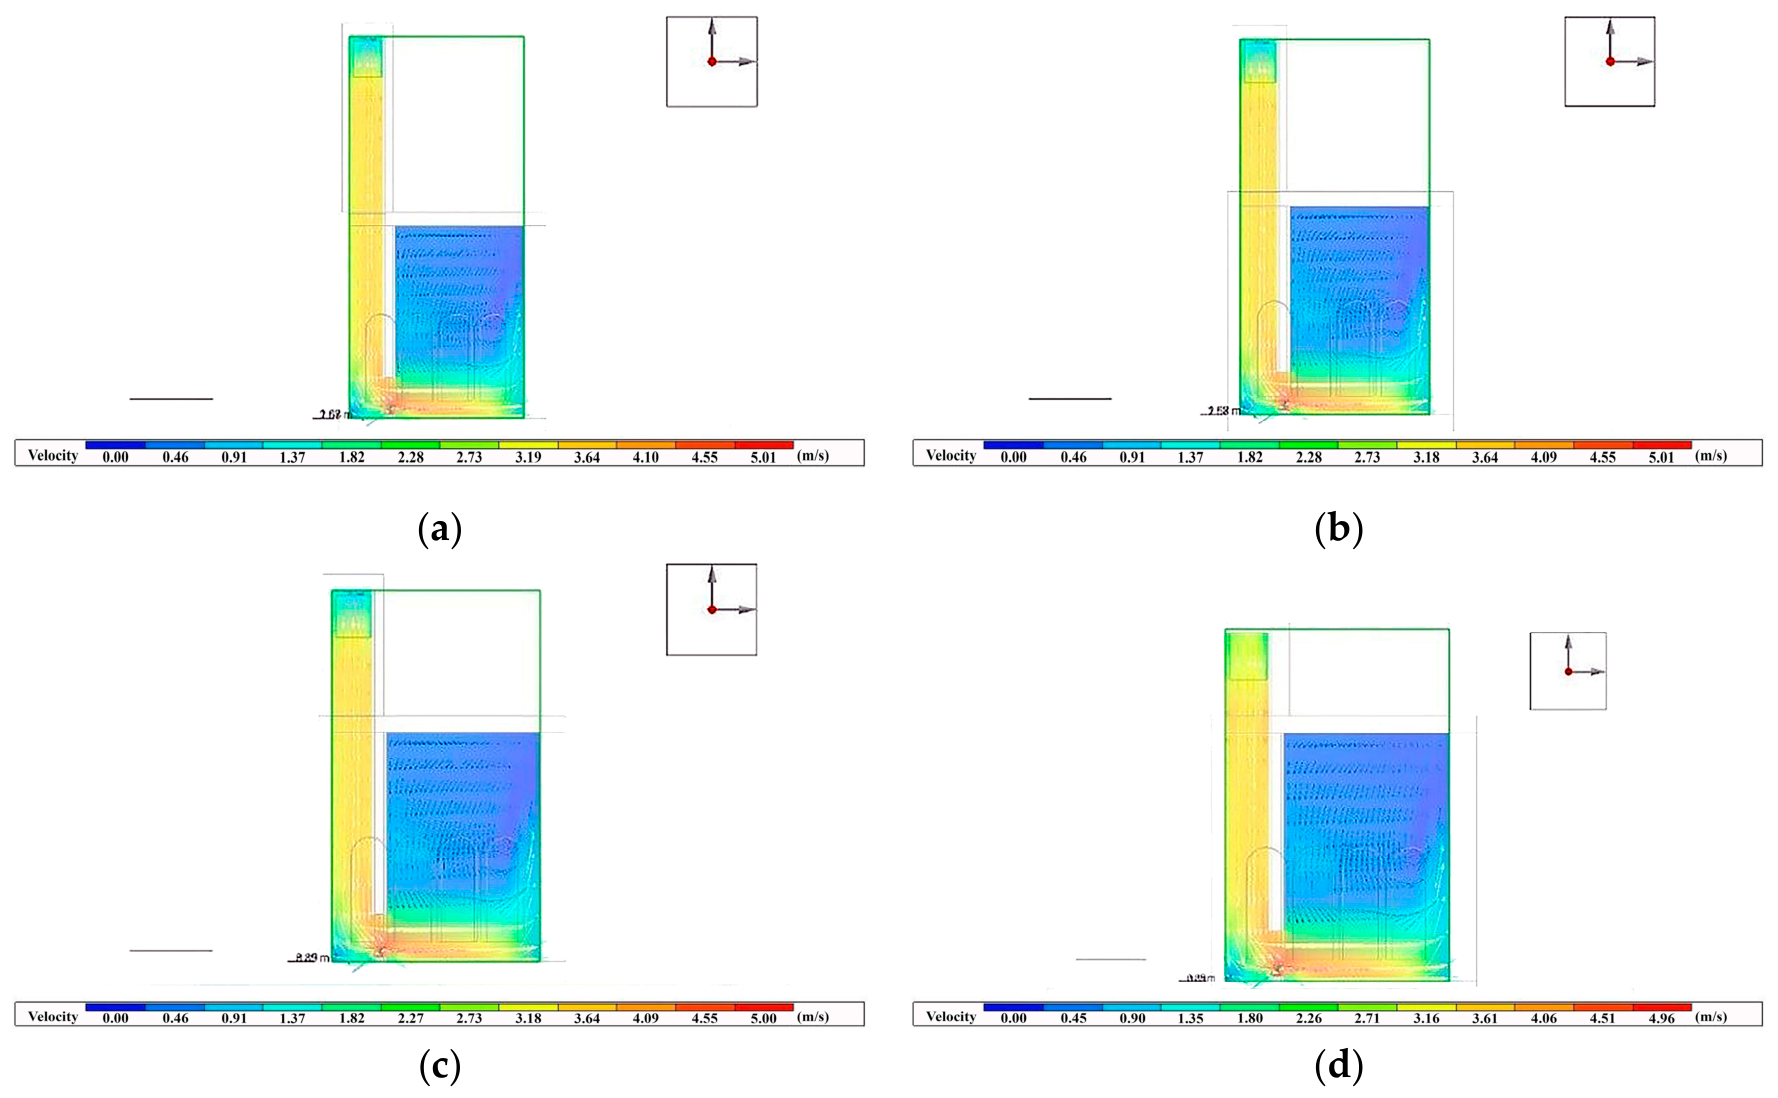
Thermal comfort in the iwan was further evaluated considering airflow speed, in addition to dry-bulb temperature and relative humidity. According to the bioclimatic comfort chart, acceptable summer comfort conditions correspond to airflow velocities between 0.2 and 0.75 m/s. Figure 6 shows that airflow velocity within the southern iwan remained low across much of the occupied semi-open zone, mainly because the iwan is oriented perpendicular to the prevailing wind direction and enclosed on multiple sides. The velocity field identifies the low-velocity region that limits the local cooling potential of the baseline iwan configuration.
A comparison between the airflow velocities obtained in the iwan and the acceptable wind speed ranges defined in the bioclimatic comfort chart revealed that windcatcher integration increased airflow beyond user comfort limits. Among the examined configurations, the smallest windcatcher floor area (1.00 × 1.00 m) resulted in the highest airflow speeds and the weakest performance in terms of local airflow comfort, despite producing the lowest total annual energy demand within the floor-area subset. The corresponding CFD comparison is presented in Figure 7.

4.4. Cabin Height of Windcatcher

At this stage, the windcatcher floor area associated with the lowest total annual energy demand within the previous floor-area subset (1.00 × 1.00 m) was kept constant, and the effects of varying windcatcher cabin height on building performance were evaluated. Four cabin height scenarios were examined: 2 m (C.H.W.1), 3 m (C.H.W.2), 4 m (C.H.W.3), and 5 m (C.H.W.4). The corresponding building energy performance outputs were evaluated comparatively with the other scenario subsets. Since the cabin height scenarios inherited the previously selected floor-area condition, the observed differences represent the relative behavior of the tested height alternatives under that fixed floor-area assumption. They do not constitute a full interaction analysis between floor area and cabin height.
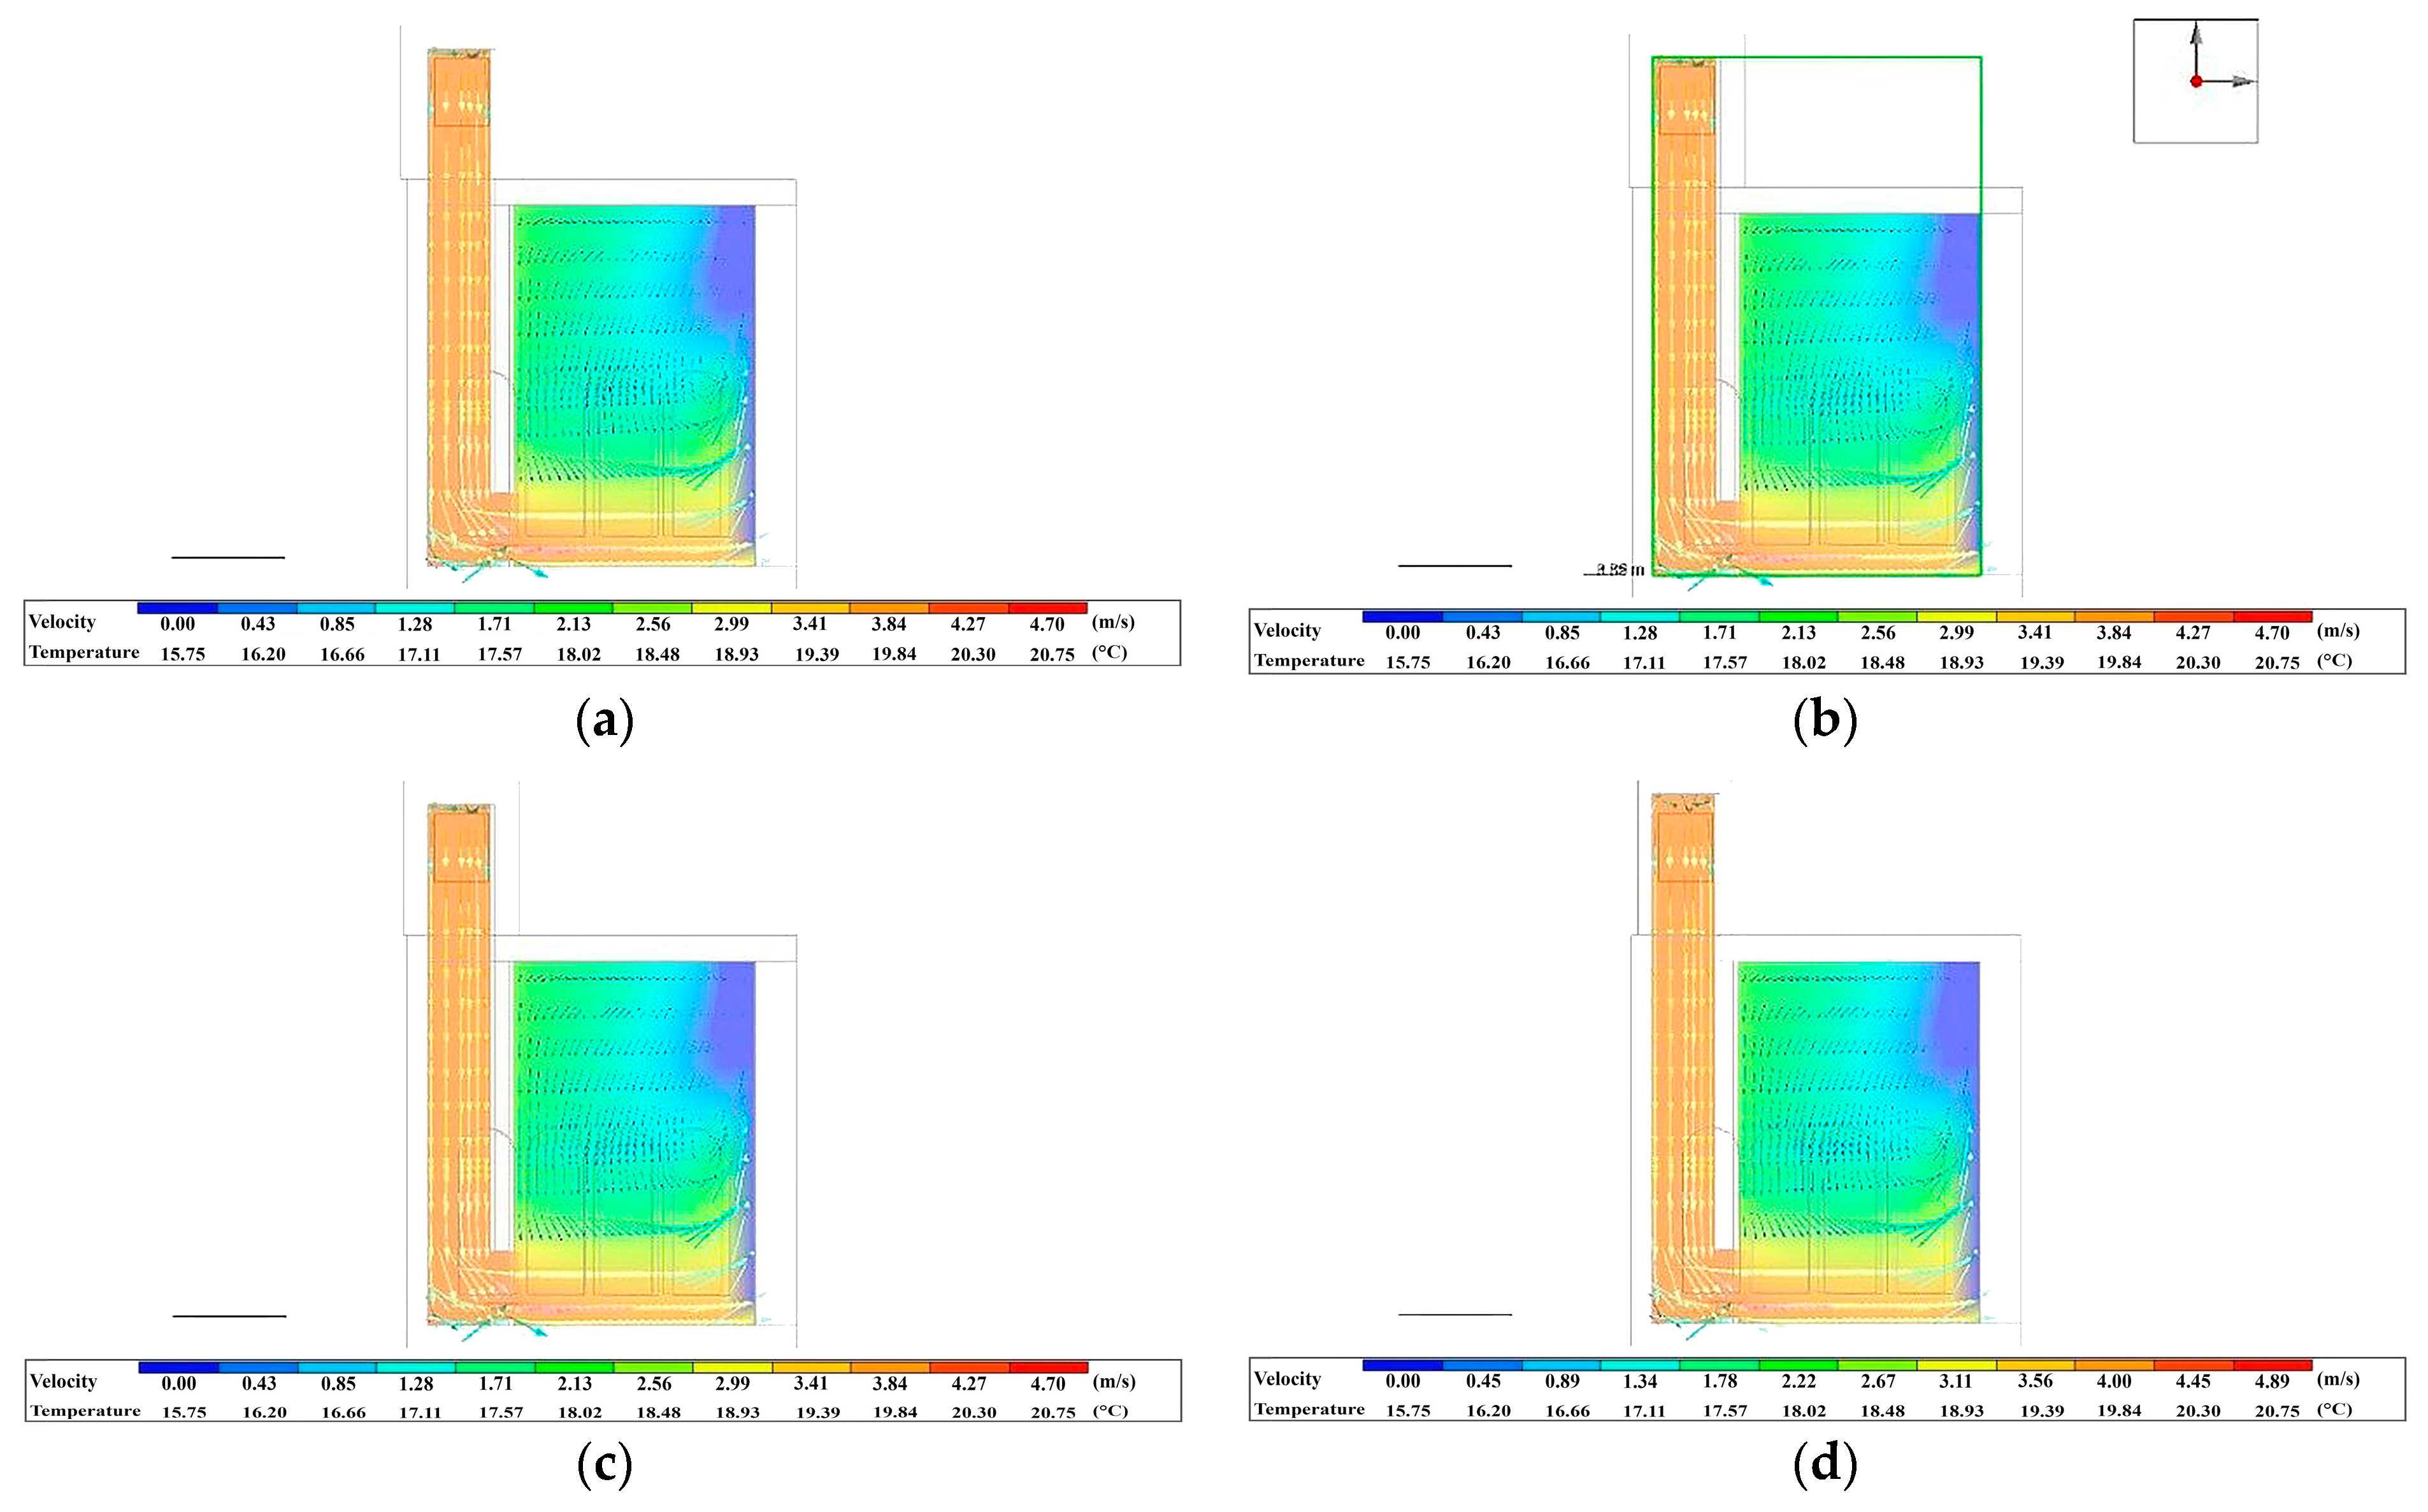
Figure 8 shows that cabin height primarily affected the local distribution and intensity of airflow within the windcatcher shaft and at the iwan interface. Taller cabin configurations produced stronger vertical acceleration within the shaft and higher local velocities near the windcatcher outlet, whereas shorter configurations moderated the airflow entering the semi-open iwan. However, these local airflow differences did not translate into proportional whole-building annual energy improvements. This is because the southern iwan operates as a semi-open transitional space rather than a fully conditioned zone, and the airflow generated within the windcatcher–iwan pathway was only weakly transferred to adjacent conditioned rooms.
The cabin height results therefore indicate a distinction between local airflow regulation and annual energy load performance. Reducing the cabin height helped moderate local airflow conditions and reduced the risk of excessive air movement within the iwan, but the resulting temperature changes remained small. Simulations conducted on 5 June between 01:00 and 02:00 showed that iwan air temperature decreased only slightly as cabin height decreased, from 25.09 °C at 5 m to 25.02 °C at 2 m. This limited temperature difference explains why cabin height variation was relevant for local airflow and comfort interpretation but produced only marginal changes in total annual energy demand.

4.5. Selection of Windcatcher Cabin Materials

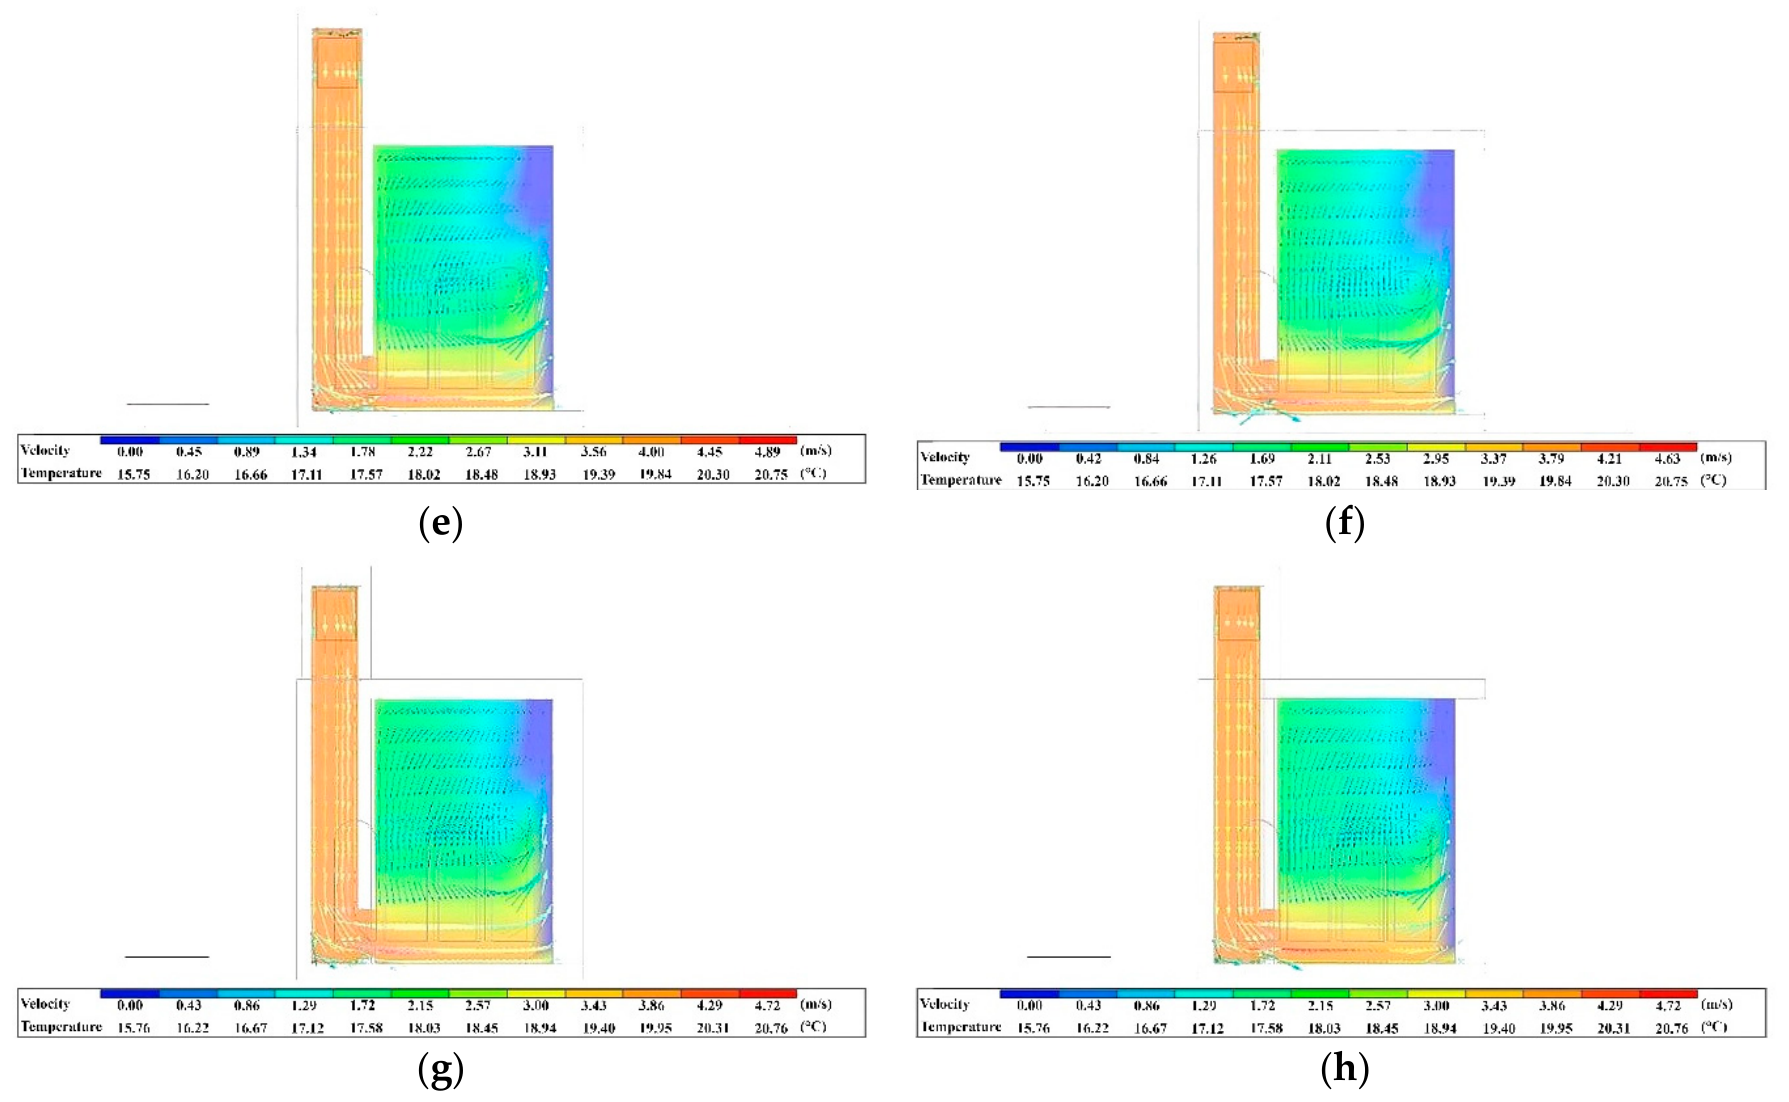
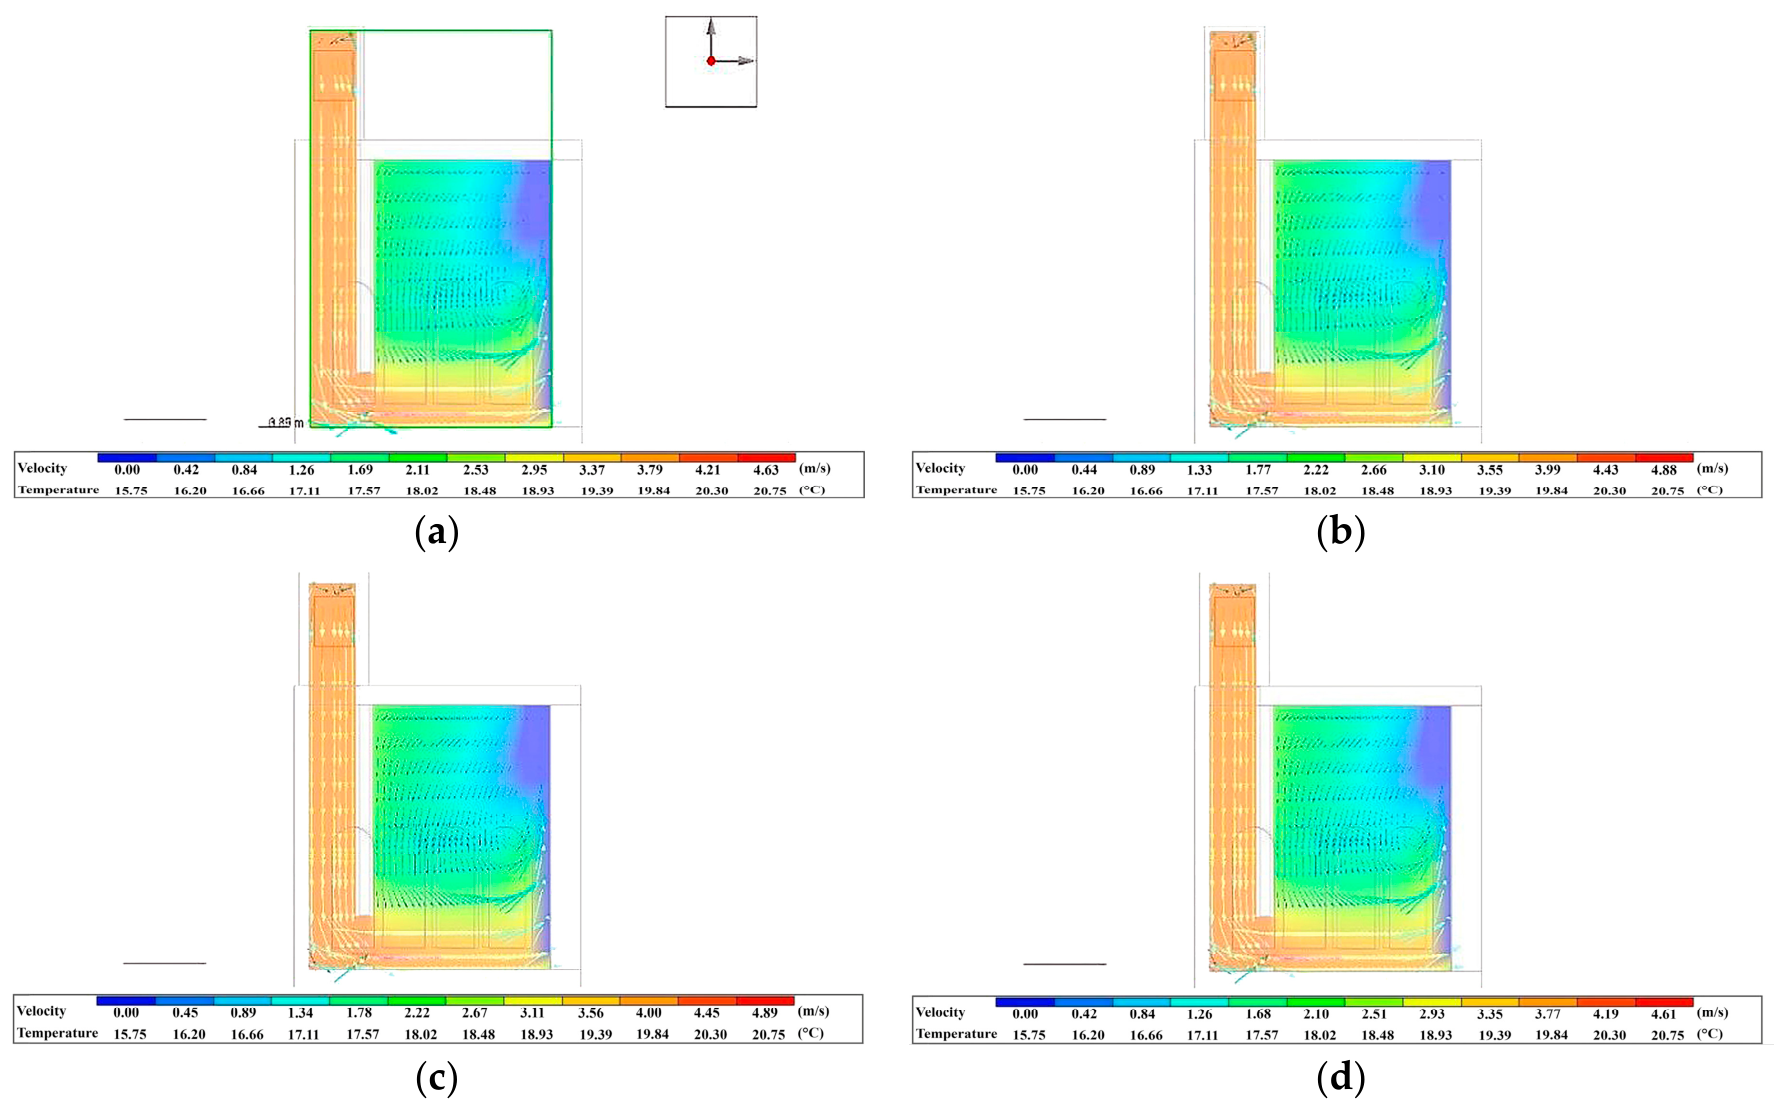
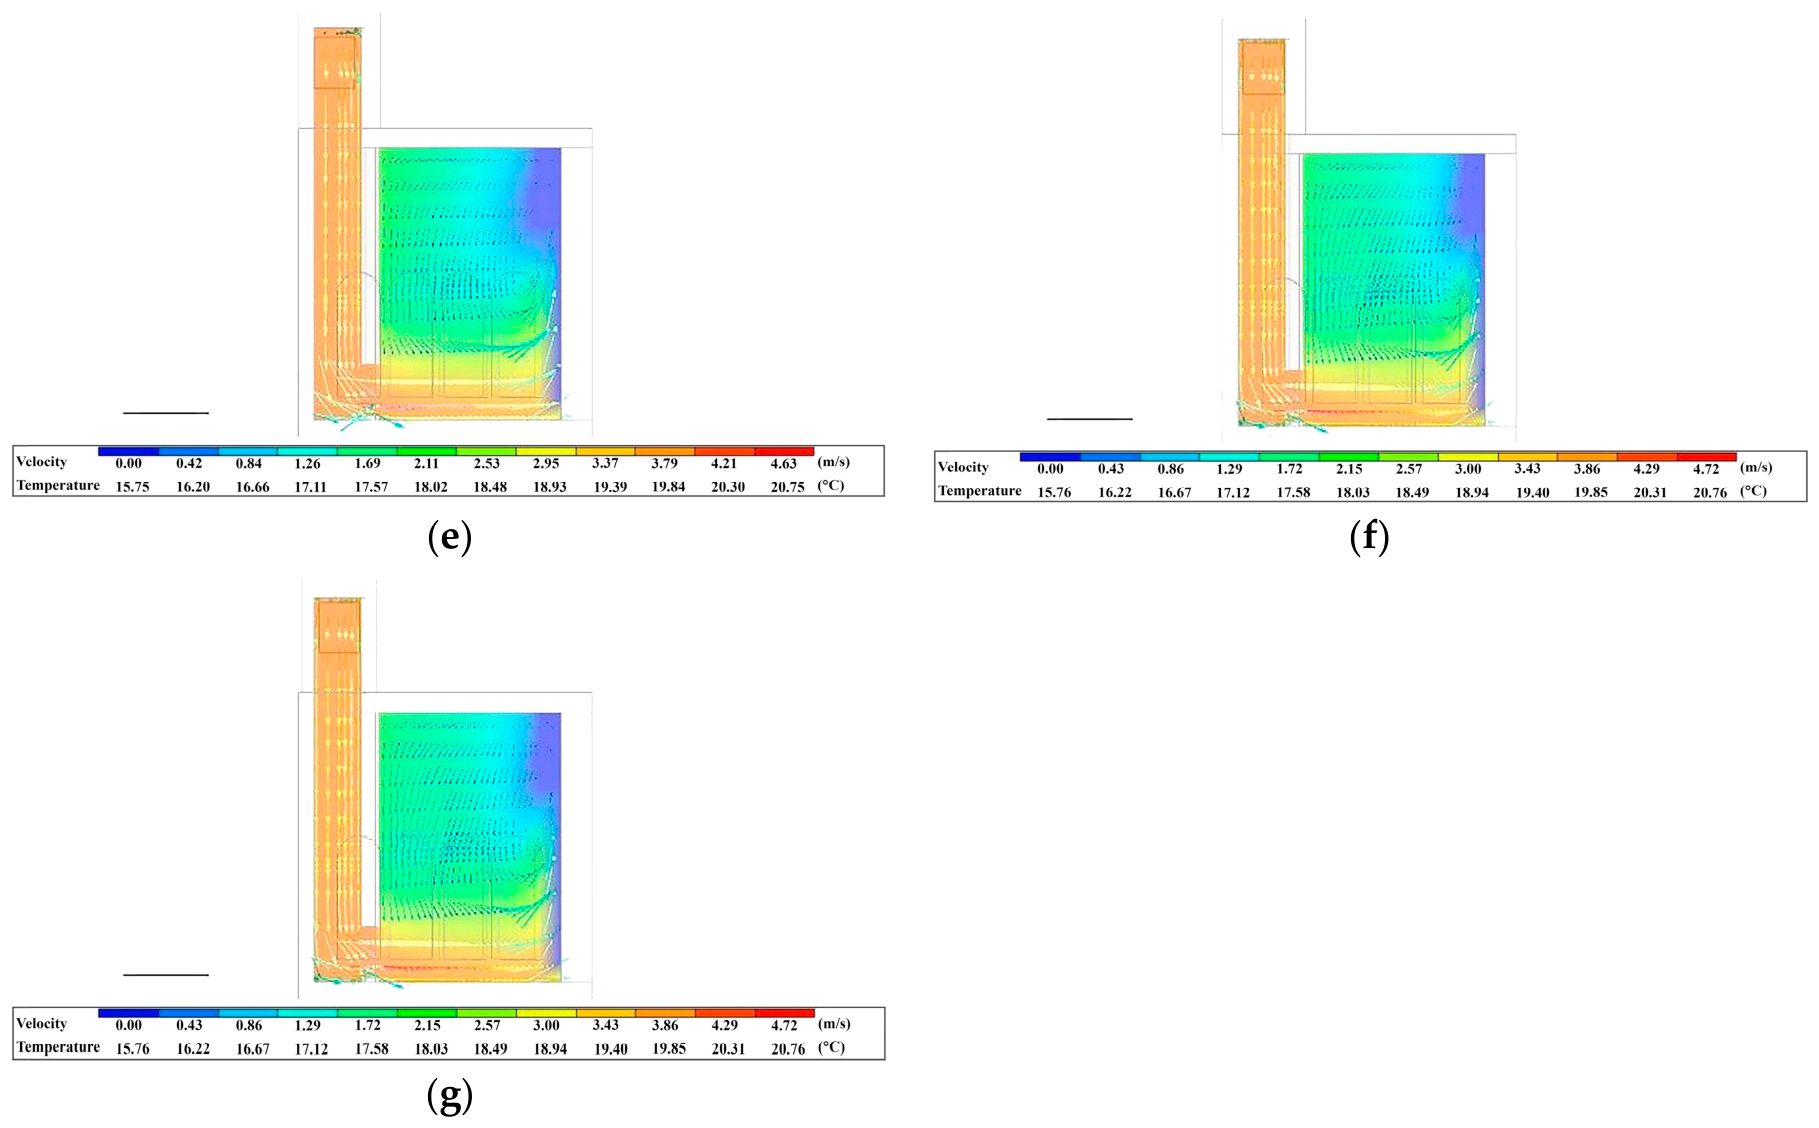
At this stage, new scenarios were developed to examine the effects of windcatcher cabin material (M) selection, while maintaining the floor area (1.00 × 1.00 m) and cabin height (2.00 m) associated with the lowest total annual energy demand in the preceding scenario subsets. A total of 15 material scenarios were defined, and their impacts on both building energy performance and airflow velocity within the southern iwan were evaluated (Table 6). Because the material scenarios were developed after fixing the selected floor area and cabin height, the results should be interpreted as material-related differences within that inherited configuration. They do not isolate material effects across all possible geometric combinations. Figure 9 and Figure 10 show that the material scenarios produced broadly similar airflow vectors and temperature fields within the southern iwan. Across the tested material configurations, the main airflow path remained concentrated along the windcatcher shaft and the iwan interface, while the semi-open character of the iwan continued to limit the transfer of airflow effects to adjacent conditioned spaces. This indicates that the material variations did not substantially reorganize the local airflow pattern. Instead, the annual energy differences observed in the material scenarios were mainly associated with changes in thermal transmission through the windcatcher envelope, especially changes in material thickness and U-values. These results distinguish the aerodynamic mechanism, which remained relatively stable across the material scenarios, from the thermal-transmission mechanism, which contributed more directly to annual heating and cooling load differences.
The limited variation in airflow behavior can be attributed to the constant internal volume of the windcatcher cabin, which constrained changes in convective heat transfer despite differences in material composition and layer thickness. The CFD simulation results presented in Figure 9 and Figure 10 support this interpretation, as the material scenarios exhibited broadly similar airflow velocities and vector directions within the iwan. These findings indicate that material selection and thickness primarily affected U-values and annual energy performance through thermal transmission, rather than producing a measurable change in airflow speed or air movement patterns in the semi-open southern iwan.

4.6. Determining the Number of Ventilation Openings of the Windcatcher

At this stage, a new configuration was derived from the M.8 scenario by introducing an internal partition within the windcatcher. Constructed of 5 cm thick brick and oriented along the north–south axis, the partition redirected prevailing westerly winds toward the iwan while limiting the discharge of heated air outdoors. An additional ventilation opening was introduced on the east side of the cabin, and this configuration was coded as V.O.1 for the annual energy assessment.
The partition divided the windcatcher into two equal compartments, increasing airflow velocity within the cabin. This enhanced convective heat transfer caused the windcatcher to function as a solar chimney during the heating period, reducing annual heating demand, while the same mechanism increased cooling demand during the cooling period, resulting in improved heating performance but reduced cooling performance.
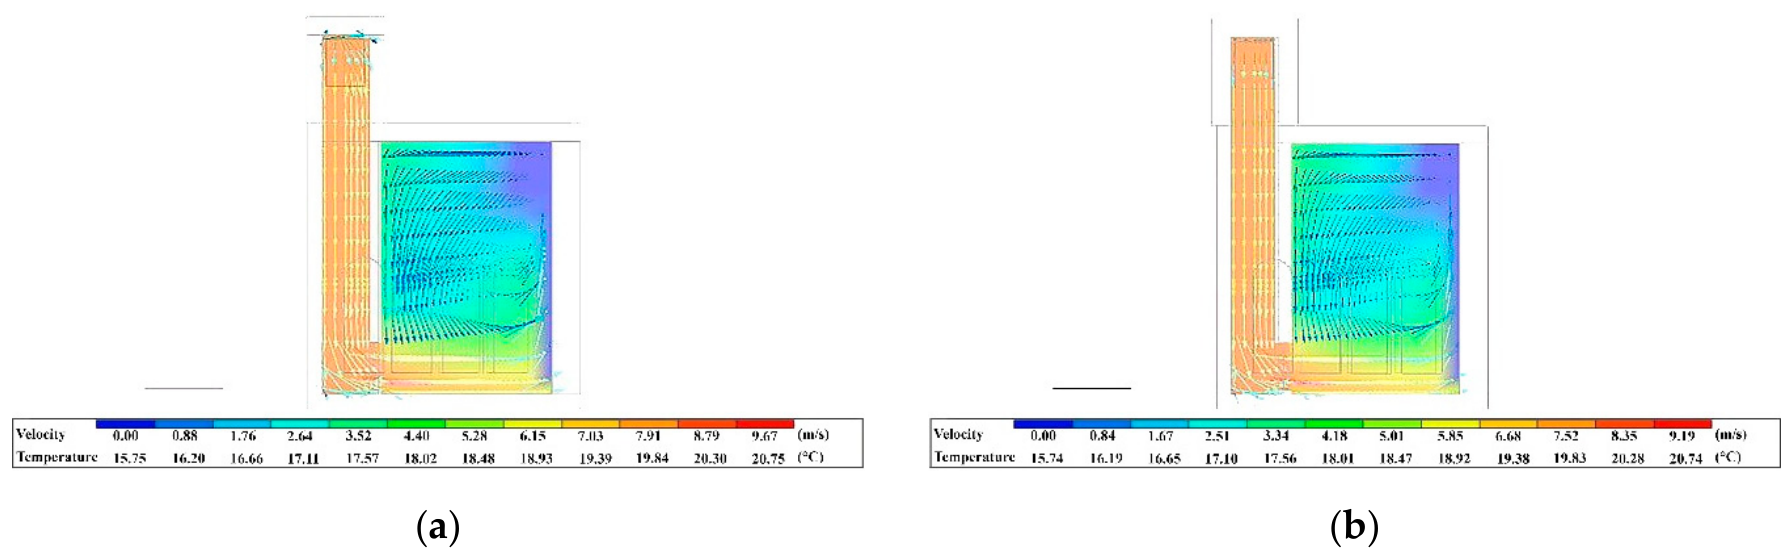
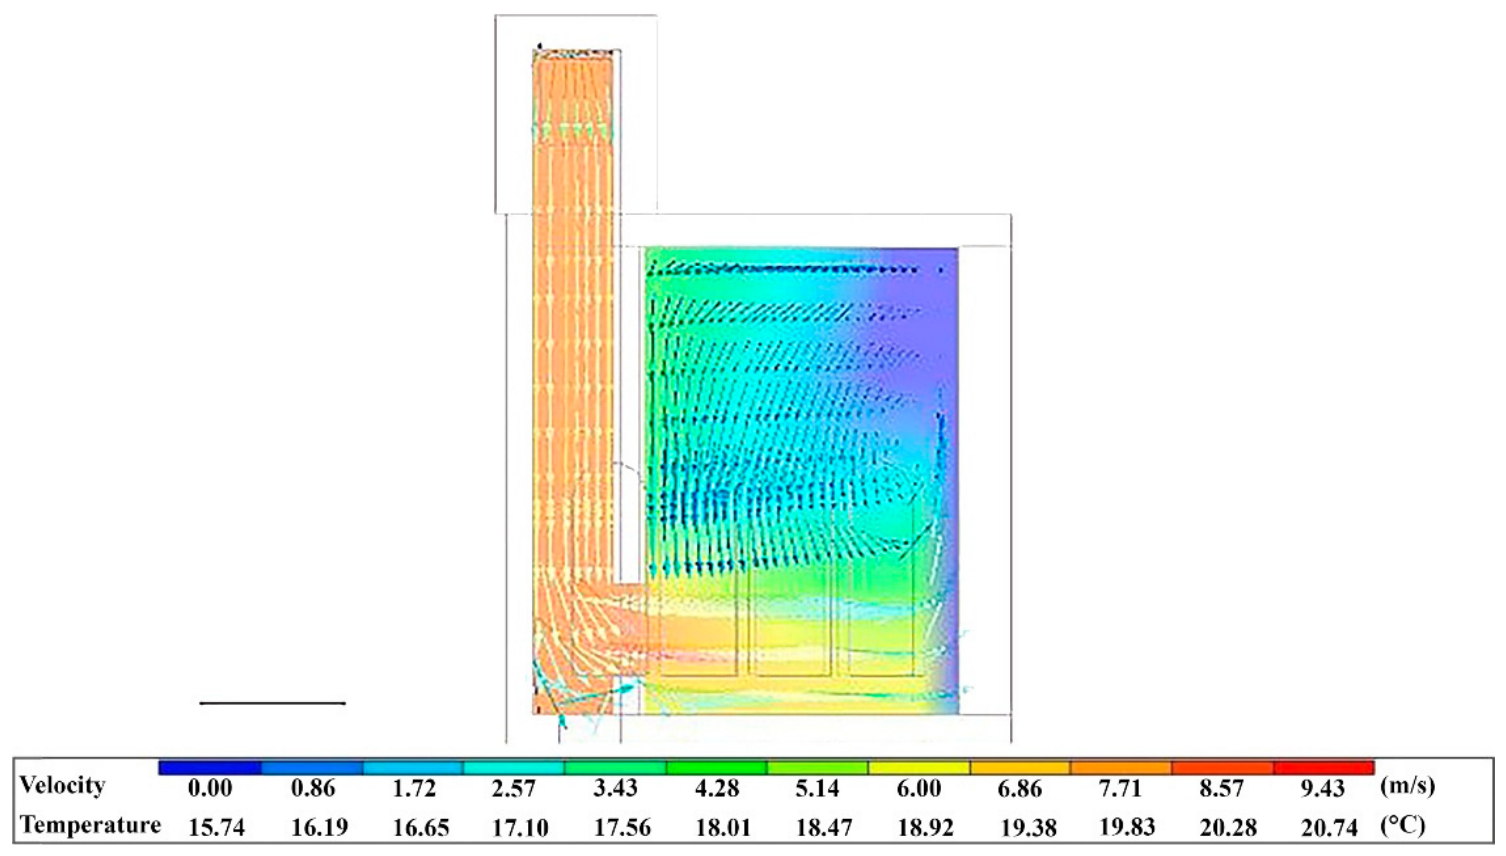
To mitigate this effect, a new material configuration was developed by increasing the layer thicknesses of the M.8 scenario. The resulting configuration (M.16) reduced heating demand and total annual energy demand relative to M.8, but it did not reduce cooling demand. This indicates that the additional opening and adjusted M.16 material configuration produced a heating–cooling load trade-off rather than a uniform improvement across all energy indicators. CFD simulation results comparing M.8 and M.16 are shown in Figure 11. Increasing cabin material thickness by 9.5 cm slightly reduced airflow velocity toward the southern iwan, which helped moderate the cooling demand penalty relative to the preceding partition scenario.

4.7. Use of Pool Inside the Windcatcher

In hot–dry climatic regions, low relative humidity levels increase the need for humidification during the summer season. Accordingly, traditional residential architecture in Şanlıurfa commonly adopts a courtyard typology, where water pools placed at the center of the courtyard contribute to increased ambient humidity and improved thermal comfort. A similar principle is observed in some windcatcher systems, in which water elements integrated into the niche enhance evaporative cooling. The city of Yazd in Iran represents a well-known example, where pools integrated into windcatcher niches increase indoor humidity levels. Based on this precedent, incorporating a pool into the windcatcher niche was considered an appropriate design strategy for the present study.
At this stage, a new scenario (P.1) was developed by integrating a pool with a height of 50 cm into the floor of the windcatcher niche. In this scenario, the previously selected parameters—floor area (1.00 × 1.00 m), cabin height (2.00 m), and cabin material configuration (M.16)—were kept constant, and the configuration was evaluated through the annual energy model.
Relative to the no-pool M.16 scenario, the integration of the pool slightly reduced annual cooling demand through evaporative cooling. Simulations conducted on 7 June between 18:00 and 19:00 showed that the air temperature in the southern iwan decreased from 30.87 °C in the no-pool configuration to 29.94 °C when the pool was integrated. Although this approximately 1 °C reduction improved local thermal conditions within the windcatcher–iwan configuration, it was not strongly reflected in overall building energy performance due to the semi-open nature of the southern iwan. This result demonstrates a scale mismatch between local microclimatic improvement and whole-building annual performance. The pool scenario produced a localized evaporative cooling effect, but this effect remained spatially constrained and did not translate into a proportional reduction in annual conditioned-zone cooling demand. Figure 12 shows the localized evaporative cooling region within the windcatcher–iwan configuration. The CFD result supports the interpretation of local cooling within the iwan, while the annual energy results indicate that this local effect was only weakly transferred to the whole-building scale.

4.8. Synthesis of Annual Energy Load Outcomes

The scenario results presented in Table 7 indicate that windcatcher integration did not generate a uniform reduction in annual energy demand. Compared with the baseline case, several configurations increased total annual energy demand, particularly those involving larger windcatcher areas or less favorable operational assumptions. The comparatively lowest total annual energy demand was obtained in the P.1 scenario, which combined the reduced windcatcher area, lower cabin height, adjusted M.16 material configuration, additional ventilation opening, and water pool integration. However, the magnitude of the total annual energy reduction remained very limited when compared with the baseline. Because the scenario sequence was not factorial, the P.1 configuration should not be interpreted as a global optimum among all possible combinations of windcatcher parameters. Rather, it represents the comparatively most balanced outcome within the tested sequential pathway. The results therefore indicate how windcatcher performance changed under the specific order of operational, geometric, material, opening, and pool-related design refinements examined in this study. The annual energy results should therefore be distinguished from the local CFD findings. The CFD analyses show where airflow acceleration or localized cooling occurred within the windcatcher–iwan configuration, but the annual load results show whether those local effects affected conditioned zones sufficiently to alter yearly heating and cooling demand. In the present case, several local airflow and temperature effects remained largely confined to the semi-open iwan and did not produce proportional improvements at the whole-building scale.
More importantly, the load components reveal a clear heating–cooling trade-off. In the P.1 scenario, annual heating demand decreased relative to the baseline, whereas annual cooling demand increased. This means that the apparent improvement in total annual energy demand was not the result of a consistent reduction across all thermal loads, but rather of a redistribution between heating and cooling requirements. Therefore, the P.1 scenario should be interpreted as the comparatively least adverse or most balanced configuration among the tested alternatives, rather than as an unequivocally energy-efficient windcatcher solution.
These results support the central premise of the study: windcatcher performance in high-thermal-mass courtyard houses depends on the interaction between spatial configuration, operational scheduling, airflow pathways, and seasonal thermal load balance. Accordingly, the annual energy results provide a necessary but insufficient basis for sustainability assessment. They must be interpreted together with load-based carbon indicators, since a limited reduction in total annual energy demand does not automatically imply a reduction in carbon-weighted outcomes when heating and cooling are associated with different emission factors.

5. Energy–Carbon Trade-Offs Based on Load-Based Carbon Indicators

The annual energy load results presented in Table 7 indicate that the P.1 scenario produced the lowest total annual energy demand among the tested configurations. However, this outcome should be interpreted cautiously because the reduction in total annual energy demand was limited and was accompanied by an increase in annual cooling demand. For this reason, the carbon-related assessment was conducted not to confirm an actual operational emissions benefit, but to test whether the limited energy load improvement observed in P.1 translated into a lower load-based carbon indicator.
Load-based carbon indicators were calculated from annual heating and cooling thermal load values using the emission factors described in Section 2.1.4. Since the EnergyPlus Ideal Loads Air System does not model a specific HVAC system, these values should not be interpreted as actual delivered-energy emissions. The baseline scenario (N.W) and the P.1 scenario were compared because they represent, respectively, the reference condition without a windcatcher and the windcatcher configuration with the lowest total annual energy demand among the tested alternatives. The resulting annual load-based carbon indicators are presented in Table 8.
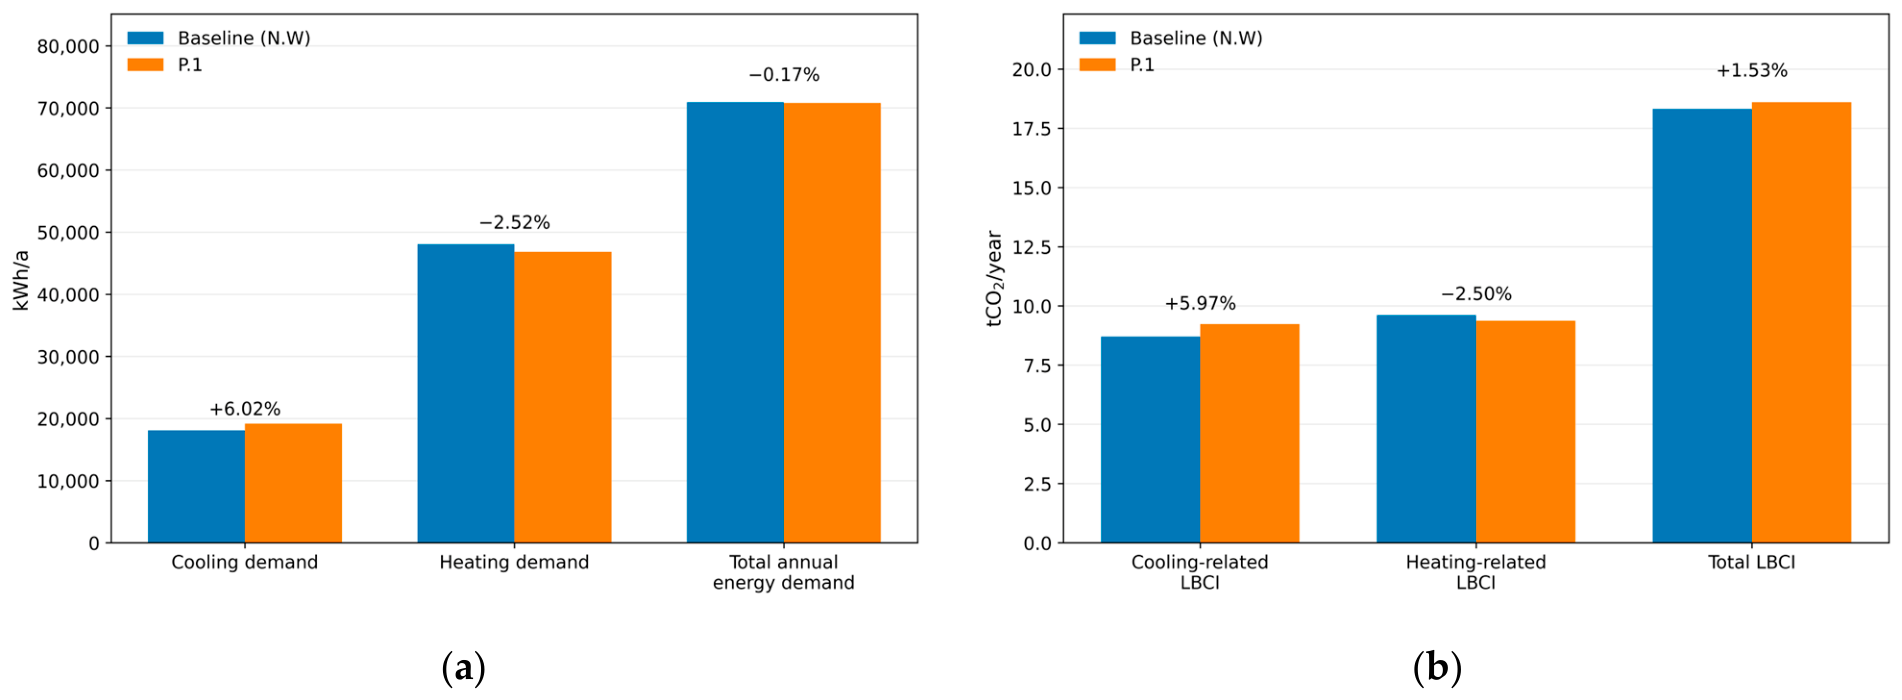
According to Table 8, the baseline scenario generated a total load-based carbon indicator of 18.32 tCO2/year. In the P.1 scenario, the heating-related indicator decreased from 9.61 to 9.37 tCO2/year; however, the cooling-related indicator increased from 8.71 to 9.23 tCO2/year. As a result, the total load-based carbon indicator increased to 18.60 tCO2/year. Therefore, the P.1 scenario did not improve the carbon-weighted load outcome, despite producing the lowest total annual energy demand among the tested configurations. To clarify the magnitude and direction of these changes, Table 9 summarizes the baseline–P.1 differences in annual energy loads and load-based carbon indicators.
The same trade-off is visualized in Figure 13, which compares the energy load and load-based carbon indicator components of the baseline and P.1 scenarios.
The same distinction applies to the carbon-related assessment. Local airflow improvement or localized cooling within the iwan does not necessarily imply an improvement in the total load-based carbon indicator. In the P.1 scenario, the localized cooling effect was accompanied by an increase in annual cooling demand, and the carbon-weighted increase in cooling-related load outweighed the reduction in heating-related load. Therefore, the carbon-related outcome should be interpreted at the whole-building annual load scale rather than at the local microclimatic scale.
This result reveals a critical energy–carbon mismatch at the level of carbon-weighted thermal loads. The reduction in heating demand did not compensate for the increase in cooling-related carbon-weighted load because the emission factor associated with cooling electricity was higher than the emission factor used for heating. Consequently, a limited reduction in total annual energy demand did not translate into an improved load-based carbon indicator. This finding demonstrates that passive design strategies should not be assessed solely through total energy demand; their carbon-related implications should also be evaluated according to the energy carriers and emission factors associated with heating and cooling. However, because the present calculation is based on Ideal Loads outputs, the values should be interpreted as comparative indicators rather than actual operational emissions.
The load-based carbon indicator results therefore reinforce the central argument of this study: windcatcher integration in high-thermal-mass courtyard houses should be understood as a context-dependent intervention that can generate trade-offs rather than automatic sustainability benefits. In the present case, the windcatcher configuration produced a limited energy load advantage but no load-based carbon advantage. This does not invalidate the architectural or microclimatic relevance of windcatchers; rather, it shows that their use in sustainable renovation and climate-responsive design requires careful evaluation across annual energy loads, spatial airflow behavior, and carbon outcomes.

6. Discussion

6.1. Windcatchers as Context-Dependent Sustainability Components

The findings of this study demonstrate that windcatcher integration does not generate a uniform or automatically beneficial effect on annual building performance. Across the tested scenarios, the effects of the windcatcher varied according to operational schedule, geometry, material configuration, ventilation openings, and evaporative support. This finding supports recent critical reviews showing that windcatcher performance is strongly shaped by micro-environmental conditions, design configuration, and operational assumptions rather than by the mere presence of the device [4,5,6]. Several configurations increased total annual energy demand, while the P.1 scenario produced only a limited reduction in total annual energy demand compared with the baseline. This confirms that windcatchers should not be treated as inherently energy-efficient passive devices, even in hot–arid climatic contexts.
This result is particularly important for sustainable design discourse, where vernacular passive systems are often associated with environmental performance. The present findings indicate that the sustainability value of such systems depends not only on their historical or climatic appropriateness, but also on their interaction with contemporary comfort expectations, conditioned spaces, operational assumptions, and annual load profiles. Therefore, windcatchers should be understood as context-dependent sustainability components rather than universally beneficial passive cooling solutions.

6.2. Operational Scheduling and Selective Control

The scenario comparison indicates that operational scheduling is a decisive factor in windcatcher performance. Continuous year-round operation weakened performance because the windcatcher remained active under conditions that were not necessarily favorable for reducing annual loads. Seasonal operation produced more balanced outcomes, but even this did not result in a substantial building-scale energy advantage. This confirms that the presence of a passive ventilation device is less important than the conditions under which it is activated.
This finding supports the broader principle that passive and hybrid ventilation strategies require selective control. Previous research on mixed-mode and hybrid ventilation similarly emphasizes that energy benefits depend on control logic, activation timing, and compatibility with outdoor conditions rather than continuous availability of natural ventilation [11,12,31]. If operated without regard to seasonal or daily outdoor conditions, a windcatcher may shift from a potentially beneficial ventilation component to a source of unwanted heat exchange. In the present case, the performance reversal was not only a matter of airflow quantity, but also of timing, thermal mass interaction, and the relationship between the semi-open iwan and adjacent conditioned zones.

6.3. Semi-Open Iwan Geometry as a Limiting Interface

The CFD results help explain why the windcatcher’s theoretical airflow potential did not translate into substantial annual energy benefits. The southern iwan functions as a semi-open transitional space rather than a fully conditioned interior zone. Its orientation relative to prevailing winds, enclosure on multiple sides, and relationship with adjacent rooms limited the effectiveness of airflow transfer. As a result, increased air movement within or near the windcatcher did not necessarily produce proportional improvements in conditioned interior zones. The interpretation of Figure 8, Figure 9 and Figure 10 further supports this scale distinction. Figure 8 indicates that cabin height can modify local velocity intensity within the windcatcher shaft and iwan interface, but this local airflow regulation does not necessarily produce proportional annual energy savings. Figure 9 and Figure 10 show the opposite pattern: material changes produced limited visible differences in airflow distribution, yet they affected annual energy performance through changes in thermal transmittance. Together, these results demonstrate that windcatcher performance cannot be inferred from airflow visualization alone. Local CFD patterns must be interpreted alongside annual heating and cooling load results because geometric parameters may affect airflow without substantially changing annual loads, while material parameters may affect annual loads without visibly reorganizing the airflow field.
This distinction is important because the CFD and annual energy results operate at different analytical scales. CFD captures local airflow mechanisms and microclimatic behavior within the windcatcher–iwan configuration, whereas EnergyPlus-based annual simulation evaluates the net heating and cooling load response of conditioned zones over the year. A local increase in air velocity or a short-term reduction in iwan temperature may improve local thermal perception, but it can remain weakly connected to the annual energy balance if the airflow path does not effectively reach conditioned rooms or if the semi-open interface limits thermal transfer. Therefore, the CFD findings should be read as explanatory evidence for why local passive-cooling effects did not necessarily become whole-building energy or load-based carbon benefits.
This finding highlights the importance of architectural interfaces in passive design performance. CFD-based studies of windcatchers and natural ventilation have shown that airflow effectiveness depends not only on wind availability, but also on opening geometry, orientation, internal partitions, pressure differentials, and the continuity of airflow paths [7,8,9,10,32]. In traditional courtyard houses, semi-open spaces such as iwans may support local microclimatic moderation and seasonal use. However, when evaluated under contemporary comfort-controlled operation, these spaces can also become unstable interfaces between outdoor air, transitional zones, and conditioned rooms. Therefore, the energy relevance of a windcatcher cannot be assessed independently from the spatial configuration into which it is inserted.

6.4. Mass, Airflow, and Load Redistribution

The interaction between the windcatcher and the high-thermal-mass building envelope produced complex outcomes. The results show that increasing airflow or modifying windcatcher geometry did not automatically improve annual energy performance. In some scenarios, enhanced airflow contributed to load redistribution rather than net load reduction. This is particularly significant in high-thermal-mass buildings, where heat storage, delayed heat release, and night ventilation potential must operate in a coordinated manner.
The findings therefore challenge the assumption that combining high thermal mass with passive ventilation necessarily improves performance. Previous studies have shown that thermal mass can support temperature stabilization and night cooling, but its effectiveness depends on the availability of sufficient heat dissipation and appropriate ventilation timing [16,17,18]. Thermal mass may therefore contribute to heat retention or delayed heat release when airflow pathways and seasonal operation are not aligned. In this case, the windcatcher’s effect depended on whether the induced air movement supported useful heat dissipation or generated additional heating or cooling penalties. This reinforces the need to evaluate passive strategies through annual thermal load behavior rather than isolated airflow or temperature indicators.

6.5. Energy Savings Versus Carbon Outcomes

A central finding of this study is that energy load performance and carbon-weighted load performance did not move in the same direction. The P.1 scenario produced the lowest total annual energy demand among the tested configurations, but it did not reduce the total load-based carbon indicator. The heating-related indicator decreased, whereas the cooling-related indicator increased; consequently, the total indicator rose from 18.32 tCO2/year in the baseline scenario to 18.60 tCO2/year in the P.1 scenario.
This result demonstrates an important energy–carbon mismatch. A small reduction in total annual energy demand cannot be interpreted as carbon mitigation when heating and cooling rely on different energy carriers or emission factors. Studies on building decarbonization and energy performance in hot climates similarly indicate that load-based carbon outcomes depend not only on the magnitude of energy demand, but also on the carbon intensity of the energy carriers serving different end uses [1]. In the present case, the decrease in the heating-related load-based indicator was outweighed by the increase in the cooling-related load-based indicator. Therefore, the environmental assessment of passive design strategies should not be limited to total energy demand. It should explicitly examine the carbon consequences of load shifts between heating and cooling.
This finding strengthens the contribution of the study to sustainability-oriented building assessment. Rather than presenting windcatcher integration as an energy-saving solution, the results show that passive systems may generate trade-offs that are only visible when annual energy loads and load-based carbon indicators are evaluated together. For this reason, joint energy–carbon assessment should be considered a necessary component of performance-based decision-making in sustainable renovation and climate-responsive design.

6.6. Implications for Sustainable Renovation of Vernacular Buildings

The results have direct implications for the sustainable renovation of traditional and historic residential buildings. Vernacular passive elements such as windcatchers can provide architectural, cultural, and microclimatic value; however, their environmental performance under contemporary operation cannot be assumed in advance. When such systems are reintroduced or retrofitted into existing buildings, their effects should be tested in relation to annual energy loads, comfort expectations, spatial interfaces, and carbon outcomes.
In conservation-sensitive contexts, this is particularly important because interventions are often justified through references to traditional climatic wisdom. Research on energy retrofit and climate adaptation in historic buildings emphasizes that environmental upgrading must be balanced with conservation constraints, user comfort, and long-term performance risks under changing climatic conditions [13,33]. The present study does not reject the value of vernacular environmental strategies. Instead, it shows that their contemporary use requires evidence-based adaptation. A windcatcher may support local airflow, seasonal comfort, or architectural continuity, but these benefits do not automatically correspond to annual energy savings or carbon reduction. Sustainable renovation strategies should therefore distinguish between cultural–climatic relevance, local comfort potential, building-scale energy performance, and load-based carbon outcome.
For sustainable renovation practice, this means that vernacular passive elements should be evaluated across multiple performance scales. A windcatcher may provide local airflow, seasonal comfort, or architectural continuity, but these microclimatic and cultural benefits should be distinguished from annual conditioned-zone energy performance and load-based carbon outcomes. Design decisions should therefore avoid equating visible local airflow or short-term cooling with whole-building energy savings or carbon-related improvement.

6.7. Methodological Contribution, Study Boundaries, and Future Research

The methodological contribution of this study lies in combining annual energy simulation, CFD-based airflow interpretation, and load-based carbon indicator assessment within a single comparative framework. Previous studies combining EnergyPlus and CFD have demonstrated the value of linking annual building performance simulation with spatial airflow analysis when evaluating passive or natural ventilation strategies [34]. Building on this methodological logic, the present study extends the assessment by adding load-based carbon interpretation to distinguish between local airflow effects, annual load outcomes, and carbon consequences. The CFD results clarified why local airflow and evaporative effects within the iwan did not necessarily translate into building-scale energy benefits, while the load-based carbon indicator assessment showed that limited energy load improvement did not produce carbon mitigation.
The study also has clearly defined boundaries. The findings are based on a single traditional courtyard house, one hot–arid climatic context, and a specific semi-open iwan configuration. The EnergyPlus Ideal Loads approach was used to isolate the heating and cooling load effects of the architectural intervention; therefore, the results should not be interpreted as measured energy consumption or as the performance of a fully specified HVAC system. The model was not calibrated against monitored indoor environmental data or utility records. Occupant behavior, adaptive comfort responses, future climate scenarios, embodied carbon, water consumption associated with the pool scenario, and maintenance-related environmental impacts were also outside the scope of the analysis. These reliability boundaries affect how the load redistribution findings should be interpreted. The absence of measured calibration data means that the absolute annual heating and cooling load values may vary if monitored indoor data, local weather measurements, alternative weather years, or a fully specified HVAC system were incorporated. Similarly, CFD uncertainty means that local velocity and temperature fields should be interpreted as comparative spatial evidence rather than exact predictions of indoor airflow. However, because the same modeling assumptions were applied consistently across the baseline and windcatcher scenarios, the study’s central conclusion is framed as a relative scenario comparison finding: windcatcher integration redistributed heating and cooling loads under the tested assumptions rather than producing a uniform annual energy reduction. Future calibrated and monitored studies are needed to test the magnitude of this redistribution under real operation.
These boundaries are important for interpreting the sustainability implications of the findings. The results provide analytical evidence of context-dependent performance rather than universal rules for all windcatcher applications. Future research should therefore test comparable passive interventions across different building typologies, climatic years, control strategies, and HVAC assumptions. Further studies should integrate monitored performance data, future weather files, occupant behavior modeling, life-cycle carbon assessment, water use evaluation, and maintenance impacts in order to determine when windcatcher-based interventions can support sustainable renovation and when they may generate energy–carbon trade-offs.

7. Conclusions

This study examined the integration of a windcatcher into a high-thermal-mass traditional courtyard house in the hot–arid climate of Şanlıurfa, Türkiye, using an integrated assessment framework combining annual EnergyPlus-based building energy simulation, CFD-based airflow interpretation, and load-based carbon indicator analysis. The results demonstrate that windcatcher performance is not inherently beneficial or universally energy-efficient. Instead, its effects depend on the interaction between spatial configuration, operational schedule, thermal mass, airflow pathways, and the carbon intensity of heating and cooling energy carriers.
The annual energy results showed that several windcatcher configurations increased total annual energy demand compared with the baseline. The P.1 scenario produced the lowest total annual energy demand among the tested configurations; however, the improvement was very limited. More importantly, this scenario reduced heating demand but increased cooling demand, indicating a heating–cooling load trade-off rather than a consistent reduction across all thermal loads. Therefore, the P.1 configuration should be interpreted as the comparatively most balanced scenario within the tested set, not as an unequivocally energy-efficient windcatcher solution.
The load-based carbon indicator assessment further strengthened this interpretation. Although the P.1 scenario slightly reduced total annual energy demand, it did not reduce the total carbon-weighted load indicator. The heating-related indicator decreased, but the cooling-related indicator increased, resulting in a rise in the total indicator from 18.32 tCO2/year in the baseline scenario to 18.60 tCO2/year in the P.1 scenario. This finding demonstrates that a reduction in annual thermal load does not necessarily translate into an improved carbon-related outcome when heating and cooling are associated with different emission factors. Because the calculation is based on EnergyPlus Ideal Loads outputs, these values should be interpreted as comparative load-based indicators rather than actual operational emissions from a fully specified HVAC system.
The CFD findings explain why the expected passive cooling benefit remained limited at the building scale. The semi-open southern iwan, its orientation relative to prevailing winds, and its relationship with adjacent conditioned zones constrained the effective transfer of airflow and localized cooling effects. As a result, increased air movement or localized temperature reduction within the windcatcher–iwan configuration did not automatically produce proportional improvements in conditioned interior spaces. This distinction is central to the interpretation of the study: CFD results indicate local microclimatic mechanisms, whereas annual energy simulation and load-based carbon indicators determine whether those local mechanisms translate into whole-building performance outcomes.
This study therefore contributes to sustainable building research by reframing windcatchers as context-dependent performance components rather than automatically sustainable passive systems. For the sustainable renovation of traditional and historic buildings, the findings suggest that vernacular environmental strategies should be evaluated through integrated energy, airflow, and carbon analyses before being adopted as design solutions. Their cultural, architectural, and microclimatic value may remain significant, but these qualities should not be equated directly with annual energy savings or load-based carbon improvement.
The findings should be interpreted within the boundaries of a single-case, current-climate, simulation-based assessment. Since the model was not calibrated against monitored data and did not include actual HVAC efficiencies, occupant behavior, future climate scenarios, embodied carbon, water use implications, or maintenance impacts, the results should not be generalized as universal performance rules for all windcatcher applications.
Future research should extend this framework to different building typologies, climatic contexts, control strategies, and measured performance datasets. Integrating future weather scenarios, occupant behavior, life-cycle carbon, water use assessment, and maintenance impacts would provide a more comprehensive basis for evaluating the conditional sustainability value of windcatcher-based interventions.
The main contribution of this study is therefore not to prove that windcatchers are energy-efficient, but to show that their sustainability value is conditional, scale-dependent, and potentially reversible when annual energy loads and load-based carbon indicators are evaluated together.

Supplementary Materials

The following supporting information can be downloaded at: https://www.mdpi.com/article/10.3390/su18147283/s1, Supplementary Table S1: CFD mesh-control and grid-independence reporting status.

Author Contributions

Conceptualization, D.Y., A.A. and M.A.H.K.; methodology, A.A., M.A.H.K. and D.Y.; software, M.A.H.K.; validation, A.A. and M.A.H.K.; formal analysis, A.A., M.A.H.K. and D.Y.; investigation, A.A., M.A.H.K. and D.Y.; resources, A.A., M.A.H.K. and D.Y.; data curation, A.A., M.A.H.K. and D.Y.; writing—original draft preparation, A.A. and D.Y.; writing—review and editing, A.A. and D.Y.; visualization, M.A.H.K.; supervision, A.A.; project administration, A.A. and D.Y. All authors have read and agreed to the published version of the manuscript.

Funding

This research received no external funding.

Institutional Review Board Statement

Not applicable.

Informed Consent Statement

Not applicable.

Data Availability Statement

The data supporting the findings of this study are available from the corresponding author upon reasonable request. The supporting materials include building energy simulation inputs, scenario definitions, and generated simulation and CFD outputs. Publicly available climatic data used in the study are cited in the manuscript.

Acknowledgments

During the preparation of this manuscript, the authors used ChatGPT (OpenAI, GPT-5.5 Thinking) for language refinement only. The authors have reviewed and edited the output and take full responsibility for the content of this publication.

Conflicts of Interest

The authors declare no conflicts of interest.

References

  1. Österreicher, D.; Seerig, A. Buildings in Hot Climate Zones—Quantification of Energy and CO2 Reduction Potential for Different Architecture and Building Services Measures. Sustainability 2024, 16, 9812. [Google Scholar] [CrossRef]
  2. Chohan, A.H.; Awad, J. Wind Catchers: An Element of Passive Ventilation in Hot, Arid and Humid Regions, a Comparative Analysis of Their Design and Function. Sustainability 2022, 14, 11088. [Google Scholar] [CrossRef]
  3. Nessim, M.A.; Elshabshiri, A.; Bassily, V.; Soliman, N.; Tarabieh, K.; Goubran, S. The Rise and Evolution of Wind Tower Designs in Egypt and the Middle East. Sustainability 2023, 15, 10881. [Google Scholar] [CrossRef]
  4. Liu, M.; Nejat, P.; Cao, P.; Jimenez-Bescos, C.; Calautit, J.K. A critical review of windcatcher ventilation: Micro-environment, techno-economics, and commercialisation. Renew. Sustain. Energy Rev. 2024, 191, 114048. [Google Scholar] [CrossRef]
  5. Ma, Q.; Qian, G.; Yu, M.; Li, L.; Wei, X. Performance of Windcatchers in Improving Indoor Air Quality, Thermal Comfort, and Energy Efficiency: A Review. Sustainability 2024, 16, 9039. [Google Scholar] [CrossRef]
  6. Sirror, H. Innovative Approaches to Windcatcher Design: A Review on Balancing Tradition Sustainability and Modern Technologies for Enhanced Performance. Energies 2024, 17, 5770. [Google Scholar] [CrossRef]
  7. Ghandi, H.; Leone, M.F. The Potential of One-Sided Traditional Windcatchers for Outdoor Use as a Sustainable Urban Feature. Urban Sci. 2024, 8, 229. [Google Scholar] [CrossRef]
  8. Katona, Á.L.; Háber, I.E.; Kistelegdi, I. CFD Simulation Supported Development of Wind Catcher Shape Topology in a Passive Air Conduction System (PACS). Buildings 2022, 12, 1583. [Google Scholar] [CrossRef]
  9. Shayegani, A.; Joklova, V.; Illes, J. Optimizing Windcatcher Designs for Effective Passive Cooling Strategies in Vienna’s Urban Environment. Buildings 2024, 14, 765. [Google Scholar] [CrossRef]
  10. Nejat, P.; Fekri, Y.; Sheikhshahrokhdehkordi, M.; Jomehzadeh, F.; Alsaad, H.; Voelker, C. The Windcatcher: A Renewable-Energy-Powered Device for Natural Ventilation—The Impact of Upper Wing Walls. Energies 2024, 17, 611. [Google Scholar] [CrossRef]
  11. Do, H.; Cetin, K.S. Mixed-Mode Ventilation in HVAC System for Energy and Economic Benefits in Residential Buildings. Energies 2022, 15, 4429. [Google Scholar] [CrossRef]
  12. Al Niyadi, S.; Elnabawi Mahgoub, M.H. Advancing hybrid ventilation in hot climates: A review of current research and limitations. Front. Built Environ. 2025, 10, 1502941. [Google Scholar] [CrossRef]
  13. Hao, L.; Herrera-Avellanosa, D.; Del Pero, C.; Troi, A. Overheating Risks and Adaptation Strategies of Energy Retrofitted Historic Buildings under the Impact of Climate Change: Case Studies in Alpine Region. Appl. Sci. 2022, 12, 7162. [Google Scholar] [CrossRef]
  14. Yu, Y.; Shao, Y.; Zhao, B.; Yu, J.; Guo, H.; Chen, Y. Study on Summer Overheating of Residential Buildings in the Severe Cold Region of China in View of Climate Change. Buildings 2023, 13, 244. [Google Scholar] [CrossRef]
  15. Zahiri, S.; Gupta, R. Examining the Risk of Summertime Overheating in UK Social Housing Dwellings Retrofitted with Heat Pumps. Atmosphere 2023, 14, 1617. [Google Scholar] [CrossRef]
  16. Song, Y.L.; Sheykhi Darani, K.; Khdair, A.I.; Abu-Rumman, G.; Kalbasi, R. Review on conventional passive cooling methods applicable to arid and warm climates. Energy Rep. 2021, 7, 2800–2825. [Google Scholar] [CrossRef]
  17. Ratajczak, K.; Amanowicz, Ł.; Pałaszyńska, K.; Pawlak, F.; Sinacka, J. Recent Achievements in Research on Thermal Comfort and Ventilation in the Aspect of Providing People with Appropriate Conditions in Different Types of Buildings—Semi-Systematic Review. Energies 2023, 16, 6254. [Google Scholar] [CrossRef]
  18. Sun, H.; Calautit, J.K.; Jimenez-Bescos, C. Regulating impact of thermal mass and night ventilation across climates. Clean. Eng. Technol. 2022, 9, 100534. [Google Scholar] [CrossRef]
  19. EN ISO 13790:2008; Energy Performance of Buildings—Calculation of Energy Use for Space Heating and Cooling. European Committee for Standardization (CEN): Brussels, Belgium, 2008.
  20. Tominaga, Y.; Mochida, A.; Yoshie, R.; Kataoka, H.; Nozu, T.; Yoshikawa, M.; Shirasawa, T. AIJ guidelines for practical applications of CFD to pedestrian wind environment around buildings. J. Wind Eng. Ind. Aerodyn. 2008, 96, 1749–1761. [Google Scholar] [CrossRef]
  21. Blocken, B. Computational Fluid Dynamics for urban physics: Importance, scales, possibilities, limitations and ten tips and tricks towards accurate and reliable simulations. Build. Environ. 2015, 91, 219–245. [Google Scholar] [CrossRef]
  22. Cengel, Y.A.; Cimbala, J.M.; Turner, R.H. Fundamentals of Thermal-Fluid Sciences (SI Units), 4th ed.; McGraw-Hill Education: New York, NY, USA, 2012. [Google Scholar]
  23. Republic of Türkiye Ministry of Energy and Natural Resources. Turkey Electricity Generation and Electricity Consumption Point Emission Factors; Ministry of Energy and Natural Resources: Ankara, Türkiye, 2024. Available online: https://enerji.gov.tr/Media/Dizin/EVCED/tr/%C3%87evreVe%C4%B0klim/%C4%B0klimDe%C4%9Fi%C5%9Fikli%C4%9Fi/EmisyonFaktorleri/TEUVETN_Emisyon_Fakt%C3%B6rleri_Bilgi_Formu.pdf (accessed on 12 September 2024).
  24. Republic of Türkiye Ministry of Energy and Natural Resources. Turkey Emission Inventory; Ministry of Energy and Natural Resources: Ankara, Türkiye, 2024. Available online: https://enerji.gov.tr/Media/Dizin/EVCED/tr/ÇevreVeİklim/İklimDeğişikliği/UlusalSeraGazıEmisyonEnvanteri/Belgeler/Ek-1.pdf (accessed on 18 May 2025).
  25. Huld, T. Typical Meteorological Data Access Service; [Dataset]; European Commission, Joint Research Centre: Ispra, Italy, 2017. Available online: https://data.europa.eu/89h/jrc-tmy-tmy-download-service (accessed on 21 August 2024).
  26. Akkoyunlu, Z. Geleneksel Urfa Evlerinin Mimari Özellikleri. Master’s Thesis, Gazi University, Ankara, Türkiye, 1988. [Google Scholar]
  27. Karaca, Ü.B. Anadolu geleneksel kırsal mimarisinde düz toprak damların iyileştirilmesine yönelik öneriler. Mimar. VE Yaşam 2021, 6, 447–458. [Google Scholar] [CrossRef]
  28. Erdemir, İ. Sıcak-Kuru İklim Bölgelerinde Enerji Korunumu–Yerleşme Dokusu–Form Etkileşimi: Geleneksel Diyarbakır Evleri Örneği. Master’s Thesis, İstanbul Technical University, Istanbul, Türkiye, 2014. [Google Scholar]
  29. Turkish Standards Institution (TSE). Thermal Insulation Requirements for Buildings (TS 825); Turkish Standards Institution: Ankara, Türkiye, 2008. [Google Scholar]
  30. Melikoğlu, Y.; Bekleyen, A. Şanlıurfa’nın geleneksel rüzgâr yakalayıcıları: Kaybolan bir geleneğin günümüze kadar gelen örnekleri. EL-Cezeri 2021, 8, 268–286. [Google Scholar]
  31. Bienvenido-Huertas, D.; De la Hoz-Torres, M.L.; Aguilar, A.J.; Tejedor, B.; Sánchez-García, D. Holistic overview of natural ventilation and mixed-mode in built environments of warm climate zones and hot seasons. Build. Environ. 2023, 245, 110942. [Google Scholar] [CrossRef]
  32. Zhong, H.Y.; Sun, Y.; Shang, J.; Qian, F.P.; Zhao, F.Y.; Kikumoto, H.; Jimenez-Bescos, C.; Liu, X. Single-sided natural ventilation in buildings. Build. Environ. 2022, 212, 108797. [Google Scholar] [CrossRef]
  33. Park, H.; Park, J.; Kim, S.; Chang, S.J. Energy retrofit technology for modern and contemporary educational historical buildings. Energy Rep. 2024, 11, 3995–4007. [Google Scholar] [CrossRef]
  34. Guo, W.; Liang, S.; He, Y.; Li, W.; Xiong, B.; Wen, H. Combining EnergyPlus and CFD to predict and optimize passive ventilation in a medium-sized gymnasium. Build. Environ. 2022, 210, 108420. [Google Scholar] [CrossRef]
Figure 1. Flowchart of research methodology.
Sustainability 18 07283 g001
Figure 2. A sketch of (a) the CSB courtyard through the east–west axis, (b) the courtyard through the north–south axis, and (c) the southern iwan.
Sustainability 18 07283 g002
Figure 3. A schematic view of the (a) ground floor and (b) basement floor plans of CSB.
Sustainability 18 07283 g003
Figure 4. DesignBuilder v6.1 model view of CSB: (a) basement floor and (b) ground floor.
Sustainability 18 07283 g004
Figure 5. (a) The CSB and (b) DesignBuilder v6.1 model view of the buildings in the immediate vicinity of the house.
Sustainability 18 07283 g005
Figure 6. The CFD simulation result showing airflow velocity in the southern iwan of the case study building. The velocity field identifies the low-velocity zone formed by the iwan’s orientation relative to the prevailing wind direction.
Sustainability 18 07283 g006
Figure 7. The effect of windcatcher base area on airflow speed in the southern iwan: (a) 1.75 × 1.75 m, (b) 1.50 × 1.50 m, (c) 1.25 × 1.25 m, and (d) 1.00 × 1.00 m. All panels use a consistent velocity scale to support direct comparison. The annotations indicate that reducing the base area increased local airflow velocity within the windcatcher–iwan pathway, although this local velocity increase did not automatically correspond to an overall comfort or annual energy advantage.
Sustainability 18 07283 g007
Figure 8. The effect of windcatcher cabin height on airflow speed in the southern iwan: (a) 5 m, (b) 4 m, (c) 3 m, and (d) 2 m. The panels use a consistent velocity scale to show how cabin height variation altered local airflow distribution within the windcatcher–iwan configuration.
Sustainability 18 07283 g008
Figure 9. CFD simulation results from material scenarios M.1–M.8: (a) M.1, (b) M.2, (c) M.3, (d) M.4, (e) M.5, (f) M.6, (g) M.7, and (h) M.8. The panels support direct visual comparison among material scenarios using consistent velocity and temperature legends.
Sustainability 18 07283 g009aSustainability 18 07283 g009b
Figure 10. CFD simulation results from material scenarios M.9–M.15: (a) M.9, (b) M.10, (c) M.11, (d) M.12, (e) M.13, (f) M.14, and (g) M.15. The panels show that material changes had limited influence on local airflow distribution within the iwan.
Sustainability 18 07283 g010aSustainability 18 07283 g010b
Figure 11. CFD comparison of the partition/material scenarios: (a) M.8 and (b) M.16. The visualization uses a consistent velocity scale and annotation to show that the M.16 configuration slightly moderated airflow velocity toward the southern iwan relative to M.8, helping explain the cooling demand penalty observed in the annual energy results.
Sustainability 18 07283 g011
Figure 12. The CFD simulation result for the water pool integration scenario. The visualization indicates the localized evaporative cooling effect within the windcatcher–iwan configuration. The local iwan air temperature decreased from 30.87 °C in the no-pool configuration to 29.94 °C with pool integration, but this local temperature reduction did not translate into a proportional annual building-scale energy improvement.
Sustainability 18 07283 g012
Figure 13. Energy–carbon trade-off between the baseline and P.1 scenarios: (a) annual cooling, heating, and total energy demand; (b) cooling-related, heating-related, and total load-based carbon indicators. Percentage values indicate relative change from the baseline scenario.
Sustainability 18 07283 g013
Table 1. Comparative positioning of the present study within windcatcher and passive-ventilation research.
Research StreamTypical Focus in Prior StudiesRemaining LimitationPosition of the Present Study
Windcatcher review and performance studies [4,5,6]Typologies, indoor air quality, thermal comfort, energy-efficiency potential, and commercial or technological developmentWindcatchers are often discussed in terms of potential benefits, while annual comfort-controlled building operation and carbon-weighted consequences remain less explicitEvaluates windcatcher integration as a context-dependent intervention rather than an inherently sustainable passive device
CFD-based windcatcher optimization studies [7,8,9,10]Opening geometry, height, orientation, partitions, upper wing-wall configurations, velocity fields, and pressure differences under selected boundary conditionsMany studies emphasize local airflow behavior or short-term representative conditions rather than year-round heating and cooling load redistributionUses CFD as explanatory evidence for local airflow mechanisms while separately assessing annual heating and cooling loads through EnergyPlus-based simulation
Hybrid and natural ventilation studies [11,12]Control logic, mixed-mode operation, energy benefits, and compatibility with outdoor conditionsWindcatcher-specific implications in high-thermal-mass courtyard houses remain insufficiently examined under contemporary comfort controlTests operational scheduling and windcatcher activation within a comfort-controlled residential modeling framework
Thermal-mass and overheating studies [13,14,15,16,17,18]Heat storage, night ventilation, overheating risk, and climate-sensitive performanceThe interaction among high thermal mass, semi-open transitional spaces, windcatcher airflow, and annual load balance is rarely examined togetherExamines a high-thermal-mass courtyard house in which the semi-open iwan mediates the transfer of local airflow effects to conditioned zones
Present studyIntegrated annual energy simulation, CFD-based airflow interpretation, and load-based carbon indicator analysisConnects local airflow behavior, annual heating–cooling load redistribution, and carbon-weighted load outcomes in a single high-thermal-mass courtyard house case
Table 2. Sections and conditioning statuses and lighting loads of interiors.
ZoneArea
[m2]
Conditioned
(Y/N)
Volume
[m3]
Occupancy Rate
[People/m2]
LPD
[W/m2]
G.F: Kitchen28.33Yes150.440.02377.5000
G.F: Storage24.10No127.96--
G.F: Winter Saloon44.30Yes235.260.01693.7500
G.F: Stairs Hall11.95No63.46--
G.F: Spring Saloon30.22Yes160.450.01693.7500
G.F: Girl’s Bedroom34.15Yes181.330.02292.5000
G.F: South Iwan20.56No109.16--
G.F: Entrance Hall18.34No112.96--
G.F: Master Bedroom28.58Yes151.780.02292.5000
G.F: Boy’s Bedroom28.45Yes151.060.02292.5000
G.F: North Iwan19.41No103.09--
Total569.85-2479.76-22.500
Conditioned Total194.03-1030.33-22.500
Unconditioned Total375.82-1449.43--
Table 3. Occupancy schedules of thermal zone types.
ParametersBedrooms (Throughout the Year)
Time Period07:0008:0009:0022:0023:0024:00
Occupancy Rate10.50.2500.250.75
Winter Saloon (30 September–30 April)
Time Period06:0007:0009:0010:0018:0019:0021:0022:0024:00
Occupancy Rate00.2510.2500.510.30
Spring Saloon (30 April–30 September)
Time Period06:0007:0009:0010:0018:0019:0021:0022:0024:00
Occupancy Rate00.2510.2500.510.30
Kitchen (Throughout the Year)
Time Period07:0010:0019:0023:0024:00
Occupancy Rate0100.20
Table 4. Energy demands of baseline building.
Scenario CaseCooling DemandHeating DemandTotal Annual Energy Demand 1
[kWh/a][kWh/a][kWh/a]
N.W18,101.7748,057.1670,929.99
1 The total is calculated by adding a constant of 4771.06 kWh/a (lighting and equipment loads) to the cooling and heating demands.
Table 5. The effect of the second scenario on the temperatures of the southern iwan and adjacent rooms (20 July between 07:00 and 08:00).
Climate DataSecond ScenarioThird Scenario
Outer
Atmosphere
[°C]
Spring
Saloon
[°C]
South
Iwan
[°C]
Girl’s
Bedroom
[°C]
Spring
Saloon
[°C]
South
Iwan
[°C]
Girl’s
Bedroom
[°C]
24.3725.8525.2425.8126.0025.2426.00
25.2225.8226.0825.6826.0025.9926.00
Table 6. Properties of selected building materials.
Scenario CaseMaterialThickness
[cm]
U-Value
[W/m2K]
M.1Glass Brick83.518
M.2Glass Brick113.057
M.3Concrete201.436
M.4Concrete301.042
M.5Adobe202.290
M.6Adobe301.754
M.7Adobe Plaster + Brick + Adobe Plaster1 + 19 + 12.145
M.8Adobe Plaster + Brick + Adobe Plaster1 + 30 + 11.604
M.9Nahit Stone + Brick + Adobe + Reed Mat + Nahit Stone2.5 + 5 + 20 + 10 + 2.50.725
M.10Nahit Stone + Brick + Adobe + Reed Mat + Nahit Stone2.5 + 5 + 15 + 10 + 2.50.761
M.11Nahit Stone + Brick + Adobe + Reed Mat + Nahit Stone2.5 + 5 + 20 + 5 + 2.51.037
M.12Nahit stone203.043
M.13Nahit stone302.452
M.14Brick222.065
M.15Brick321.595
M.16Adobe Plaster + Brick + Adobe Plaster + Brick + Adobe Plaster1 + 30 + 1 + 8.5 + 11.321
Table 7. All scenario cases of the study.
Scenario CaseFloor Area Dimensions
[m]
Cabin Height of Windcatcher
[m]
MaterialNumber of Ventilation OpeningsPool [Y/N]Cooling Demand
[kWh/a]
Heating Demand
[kWh/a]
Total Annual
Energy Demand 1 [kWh/a]
N.W-----18,101.7748,057.1670,929.99
O.S.15.00 × 5.001.00Bricks1N18,132.0648,169.9271,073.04
O.S.25.00 × 5.001.00Bricks1N18,119.8448,101.1270,992.02
O.S.35.00 × 5.001.00Bricks1N18,119.8448,143.2171,034.11
F.A.D.11.75 × 1.755.00Bricks1N18,603.1248,314.3671,688.54
F.A.D.21.50 × 1.505.00Bricks1N18,551.4848,304.6871,627.22
F.A.D.31.25 × 1.255.00Bricks1N18,491.1448,353.8971,616.09
F.A.D.41.00 × 1.005.00Bricks1N18,480.0148,255.6671,506.74
C.H.W.11.00 × 1.004.00Bricks1N18,391.3548,163.9671,326.37
C.H.W.21.00 × 1.003.00Bricks1N18,302.4148,134.9171,208.38
C.H.W.31.00 × 1.002.00Bricks1N18,154.9548,267.0071,193.02
M.11.00 × 1.002.00M.11N18,255.8748,146.4971,173.43
M.21.00 × 1.002.00M.21N18,207.7648,216.9671,195.79
M.31.00 × 1.002.00M.31N18,177.6748,226.9771,175.71
M.41.00 × 1.002.00M.41N18,179.8748,196.2671,147.20
M.51.00 × 1.002.00M.51N18,352.2348,127.2671,250.56
M.61.00 × 1.002.00M.61N18,351.4948,210.1771,332.73
M.71.00 × 1.002.00M.71N18,220.4148,195.3371,186.80
M.81.00 × 1.002.00M.81N18,242.1848,104.4371,117.68
M.91.00 × 1.002.00M.91N18,121.9848,228.6771,121.72
M.101.00 × 1.002.00M.101N18,163.2948,229.1371,163.49
M.111.00 × 1.002.00M.111N18,150.7748,310.5471,232.38
M.121.00 × 1.002.00M.121N18,335.1448,202.3171,308.52
M.131.00 × 1.002.00M.131N18,281.8648,170.7771,223.69
M.141.00 × 1.002.00M.141N18,207.3948,168.1571,146.60
M.151.00 × 1.002.00M.151N18,209.0748,161.4971,141.63
V.O.11.00 × 1.002.00M.82N19,219.5846,874.2970,864.94
M.161.00 × 1.002.00M.162N19,203.8346,843.9370,818.83
P.11.00 × 1.002.00M.162Y19,191.6546,843.9370,806.65
1 The total annual energy demand was calculated as the sum of annual cooling demand, annual heating demand, and a constant lighting and equipment load of 4771.06 kWh/a, which was kept unchanged across all scenarios.
Table 8. Annual load-based carbon indicators of the baseline and P.1 windcatcher scenarios.
Scenario CaseCooling-Related LBCI [tCO2/Year]Heating-Related LBCI [tCO2/Year]Total LBCI [tCO2/Year]
N.W8.719.6118.32
P.19.239.3718.60
Note: LBCI = load-based carbon indicator calculated from EnergyPlus Ideal Loads thermal load outputs and selected emission factors; values should not be interpreted as measured or fully HVAC-specific operational emissions.
Table 9. Summary of annual energy and load-based carbon indicator changes between baseline and P.1 scenarios.
IndicatorBaseline N.WP.1 ScenarioAbsolute ChangeRelative Change
Cooling demand [kWh/a]18,101.7719,191.65+1089.88+6.02%
Heating demand [kWh/a]48,057.1646,843.93−1213.23−2.52%
Total annual energy demand [kWh/a]70,929.9970,806.65−123.34−0.17%
Cooling-related LBCI [tCO2/year]8.719.23+0.52+5.97%
Heating-related LBCI [tCO2/year]9.619.37−0.24−2.50%
Total LBCI [tCO2/year]18.3218.60+0.28+1.53%
Disclaimer/Publisher’s Note: The statements, opinions and data contained in all publications are solely those of the individual author(s) and contributor(s) and not of MDPI and/or the editor(s). MDPI and/or the editor(s) disclaim responsibility for any injury to people or property resulting from any ideas, methods, instructions or products referred to in the content.