1. Introduction
Wetlands are dynamic interfaces between land and water—biogeochemical engines that regulate climate, sustain biodiversity, and buffer hydrological extremes in a warming world. Although they occupy only about six percent of the global land surface, they sustain nearly forty percent of known species and contain roughly one-third of all soil carbon (C) [
1]. Within their waterlogged soils, organic matter derived from roots and litter accumulates under anoxic conditions, locking C for centuries while capturing atmospheric carbon dioxide (CO
2) and storing it within natural systems [
2]. However, this delicate equilibrium is increasingly at risk. Over the past half-century, wetlands have undergone severe degradation as a result of rapid urban expansion, agricultural intensification, and industrial pollution, leading to biodiversity loss, declining water quality, and reduced carbon sequestration capacity [
3]. Each hectare lost not only releases long-sequestered carbon but also weakens the feedbacks that stabilize regional and global climate systems, thereby exacerbating global warming [
4]. In addition to human pressures, natural factors such as climate change and persistent droughts have also exacerbated the vulnerability of wetlands, particularly leading to frequent extreme weather events, which have far-reaching ecological, social, and economic consequences [
5]. Statistics indicate that the degradation of wetland ecosystems may expose approximately 15 million people worldwide to heightened flood risk and result in an estimated US
$65 billion in annual property damage, while also subjecting wildlife habitats to hazards such as sandstorms and storms, thereby severely reducing biodiversity [
6,
7].
China accounts for approximately 4% of the world’s wetlands, yet over the past century the country has lost nearly 60% of its wetland area due to urbanization, agricultural expansion, and industrial development. At the same time, the national “dual carbon” strategy aims to achieve carbon neutrality by 2060 [
8,
9], underscoring the urgency of wetland restoration. Several key wetland regions in China have undergone dramatic changes driven by both natural and anthropogenic factors. For instance, the Sanjiang Plain wetlands in northeastern China have been extensively drained for agricultural purposes, resulting in the loss of floodplain habitats and reduced water retention capacity [
10]. Similarly, Poyang Lake—the country’s largest freshwater wetland and a critical stopover site for migratory birds such as the Siberian white crane—faces severe hydrological alterations due to dam construction and decreased seasonal inflows [
11]. Dongting Lake, another major freshwater system, has been affected by eutrophication and biological invasions, primarily caused by nutrient runoff from surrounding farmlands [
12]. Coastal wetlands, such as those along Bohai Bay, have experienced severe habitat fragmentation and biodiversity decline, largely driven by land reclamation for industrial development [
13]. In addition, the peatlands of the Qinghai–Tibet Plateau, which serve as significant carbon sinks, are increasingly threatened by permafrost thaw and overgrazing, leading to unstable carbon fluxes and ecosystem degradation [
14]. To counter wetland degradation, China has launched a series of large-scale conservation and restoration initiatives. The Wetland Conservation Law (2022) (
https://www.mee.gov.cn/ywgz/fgbz/fl/202112/t20211227_965347.shtml; (accessed on 4 July 2025)) established a legal framework to regulate land use and restrict development in critical wetland areas. Moreover, the Ecological Redline policy prioritizes wetland protection by designating protected zones, ensuring that more than 50% of China’s remaining wetlands are shielded from agricultural and industrial encroachment [
15]. The Shibalianwei wetland in Feidong County, Anhui Province, exemplifies this crisis. Once a vital component of the Chaohu Lake Basin, its ecological collapse—marked by water quality deterioration to Grade V in 2018—prompted government-funded restoration programs aimed at improving water quality, biodiversity, and carbon sequestration [
16]. Despite these advances, several limitations remain. Many existing studies rely on static carbon coefficients or short-term field observations, limiting their ability to capture spatial heterogeneity and long-term restoration effects. In addition, continuous carbon measurements before and after restoration are often unavailable, particularly for small- to medium-scale wetlands, constraining the evaluation of restoration effectiveness over time. Moreover, the integration of process-based models with data-driven approaches remains limited, and few studies have explored how machine learning frameworks can complement biophysical models to infer carbon sequestration dynamics under restoration-driven land-use change.
Therefore, this study integrates remote sensing, geographic information system (GIS), InVEST model and XGBoost-based machine learning framework to assess and predict carbon sequestration before and after wetland restoration. It aims to address data limitations and improve regional-scale carbon sink assessment, providing an ideal case study for researching carbon sequestration responses in large-scale ecological restoration. We hypothesize that following the implementation of restoration initiatives—including hydrological engineering, vegetation replanting, and pollution control—the wetland’s carbon sink has substantially increased, thereby playing a critical role in regional carbon sequestration. To test this hypothesis, we designed a longitudinal study within a retrospective framework, integrating historical datasets to assess potential future outcomes of regional carbon storage. Specifically, we examined the dynamics of carbon sequestration both prior to and following the initiation of the restoration project, focusing on the seven-year period after its commencement. By analyzing the interactions between environmental factors and carbon sequestration changes, this research is expected to generate insights and lessons applicable to diverse ecosystems worldwide. In doing so, it seeks to contribute to biodiversity conservation and climate change mitigation, offering valuable resources to the broader field of wetland science.
2. Materials and Methods
2.1. Study Area
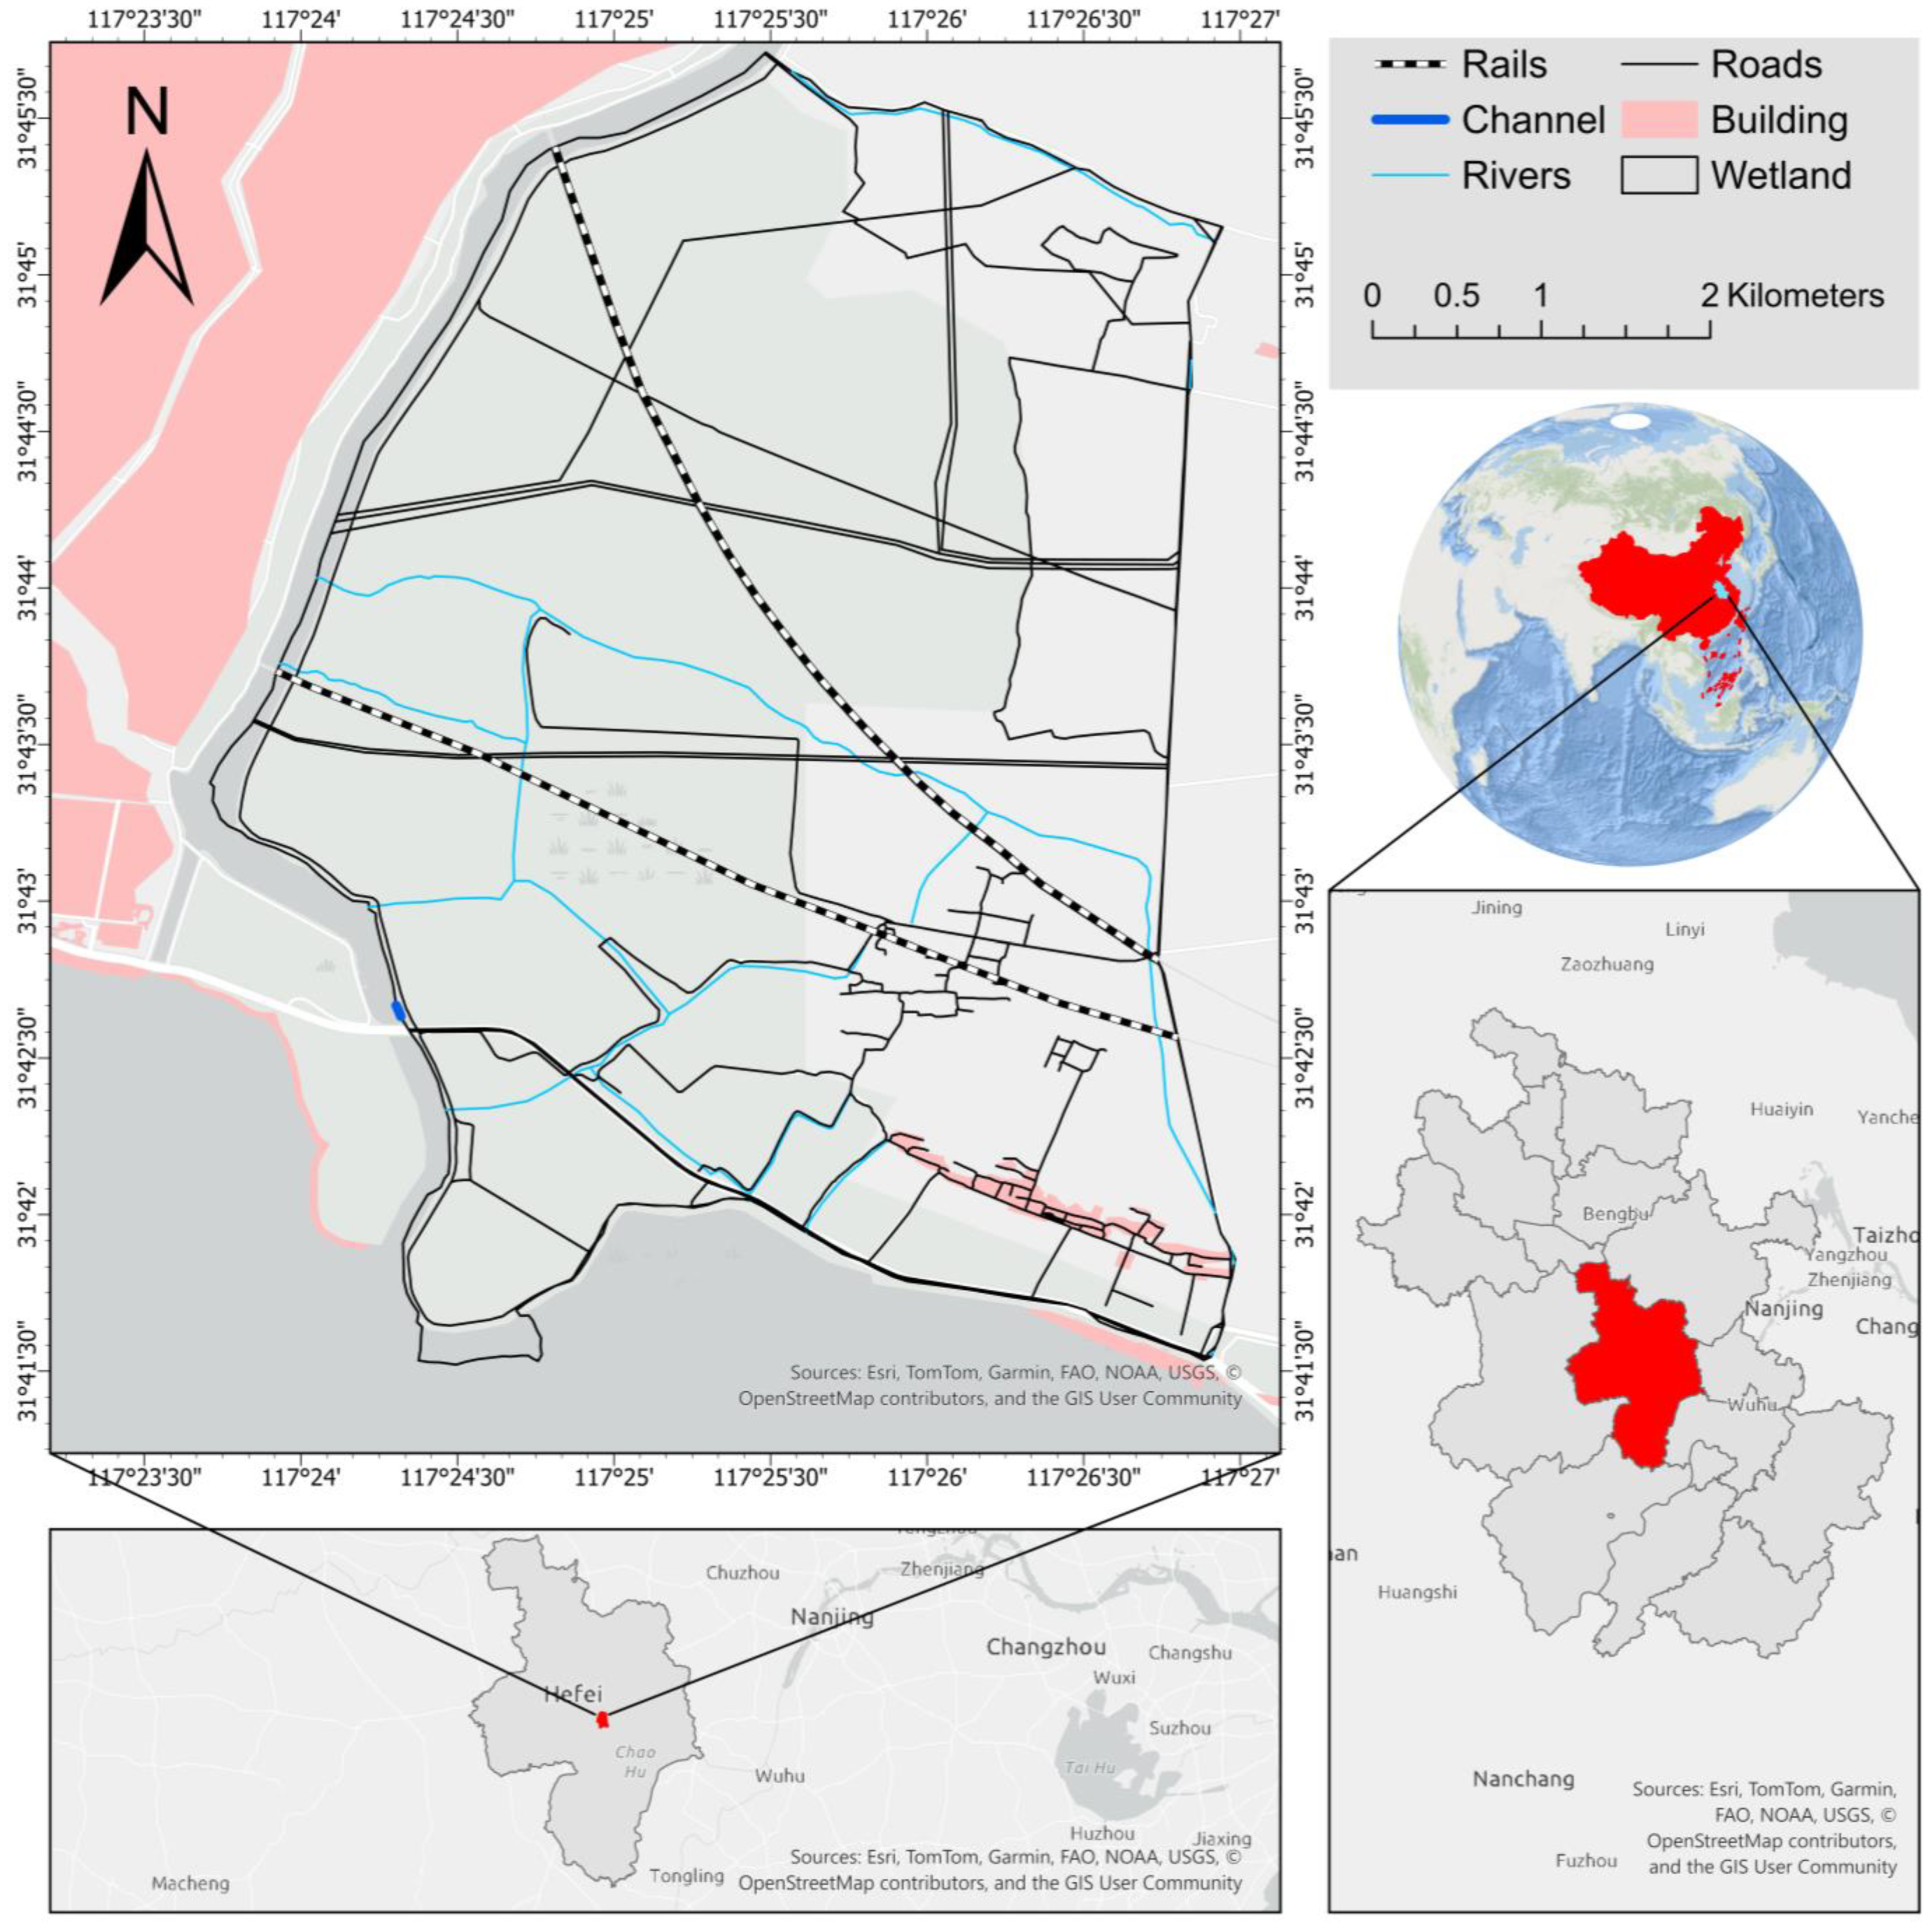
The Shibalianwei Wetland is located on the shores of Lake Chaohu in Changlinhe Town, Feidong County, Anhui, China, forming a key node of the regional ecological network (
Figure 1). The study area lies in the Chaohu Basin at approximately 31.5° N, 117.5° E (representative of the Chaohu basin). The region has a humid subtropical climate with a multi-year mean air temperature of ~16.6 °C and mean annual precipitation around 1100 mm, most of which occurs from May to August, accounting for 55% of the total annual precipitation [
17]. These hydro-climatic conditions are conducive to high primary productivity and wetland carbon accumulation, underpinning the carbon sequestration processes evaluated in this study.
The ecological environment of The Shibalianwei wetland has deteriorated due to human activities such as urbanisation, agricultural production and nutrient loading. This has resulted in eutrophication of water bodies, excessive algal blooms, damaged aquatic habitats and a disrupted ecological balance. From 2018 to 2022, the local government implemented three-phase ecological restoration project focusing on hydrology, vegetation and pollution control, with the aim of adjusting the water system, improving water quality, and restoring the ecosystem. The first phase concentrated on restoring hydrological connectivity and re-establishing vegetation structure through channel dredging, terrain reshaping, and the large-scale planting of Taxodium ascendens, Metasequoia glyptostroboides, and Phragmites australis. These efforts rebuilt the fundamental wetland framework and initiated early biomass carbon accumulation. The second phase aimed to strengthen ecological functions by constructing a multi-tier paddy–wetland complex that combined lotus ponds, submerged and emergent vegetation zones, and bird habitats. This integrated system enhanced water purification, nutrient cycling, and soil organic carbon deposition. The third phase further expanded restoration to a broader landscape scale, including in situ remediation of aquaculture ponds and reforestation of ecological forest islands. The re-establishment of Taxodium distichum, Salix babylonica, and sedge communities significantly increased carbon sequestration and oxygen release, with an estimated annual CO2 uptake exceeding 43,000 tons. Drawing on global best practices, the project sought to enhance this wetland functions and promote the coordinated development of ecology and society.
2.2. Data Acquisition and Preprocessing
To evaluate the impact of ecological restoration on wetland carbon sequestration, this study focused on two target years—2017 and 2024—representing the pre- and post-restoration periods. The year 2017 was selected as the pre-restoration reference because large-scale ecological restoration activities in the Shibalianwei Wetland were initiated in 2018, making 2017 the last complete year representing baseline conditions prior to restoration. Since continuous long-term carbon observations were unavailable, the 2010 carbon stock was first calculated as a baseline reference to establish the initial carbon storage conditions of the Shibalianwei Wetland before large-scale restoration. This baseline served as the dependent variable for subsequent modeling and prediction of carbon sequestration in 2017 and 2024.
The 2010 baseline carbon stock was constructed using globally available, observation-informed datasets rather than site-specific field measurements. This data was estimated by integrating three carbon components: aboveground biomass carbon, belowground biomass carbon, and soil organic carbon (0–30 cm depth). The datasets were primarily obtained from the Oak Ridge National Laboratory Distributed Active Archive Center (ORNL DAAC) and ISRIC–World Soil Information. The aboveground biomass map incorporated land-cover-specific remote sensing layers for forests, grasslands, croplands, and other related categories as defined in the original land-cover dataset. The belowground biomass map was derived from the corresponding aboveground biomass data using empirical allometric relationships for each land cover type. These maps were merged with auxiliary datasets (e.g., tree cover fraction and land cover percentage) and refined through a rule-based decision tree algorithm to generate high-resolution integrated biomass carbon maps [
18]. On the other hand, the ISRIC SoilGrids model provided global digital soil carbon predictions based on more than 230,000 soil profiles from the WoSIS database and a suite of environmental covariates, achieving prediction accuracies of up to 90% [
19]. The resulting above- and below-ground biomass and soil carbon layers together formed the 2010 carbon stock baseline, which was used as a physically grounded baseline to support data-driven inference of relative carbon sequestration changes in subsequent years. (
Table 1). Although direct local carbon measurements were unavailable for validation, these datasets have been widely applied and validated in previous carbon assessment studies and provide a consistent baseline for regional-scale and relative change analysis.
Furthermore, to predict the spatial and temporal dynamics of wetland carbon sequestration in 2017 and 2024, this study comprehensively integrated climate, vegetation, water, and land-cover datasets within a GIS-based analytical framework. These multi-source environmental variables served as key predictors for modeling carbon sequestration changes driven by both ecological restoration and climatic variation.
Vegetation and hydrological conditions were characterized using remote sensing indices derived from multispectral satellite imagery. The Normalized Difference Vegetation Index (NDVI) was employed to represent vegetation vigor and biomass distribution, while the Normalized Difference Water Index (NDWI) was used to quantify surface water content and wetland hydrology. NDVI is calculated from the difference between red and near-infrared (NIR) reflectance, with higher values (approaching +1) indicating dense and healthy vegetation, and lower or negative values denoting sparse or stressed vegetation [
20]. NDWI, on the other hand, utilizes NIR and green spectral bands to capture water availability within vegetation and water bodies. These two indices were spatially mapped and integrated into the GIS to delineate key ecological zones such as vegetation hotspots, hydrological transition areas, and regions of potential carbon accumulation.
Climatic factors, including mean annual temperature and annual precipitation, were obtained from the WorldClim database, which provides bias-corrected global climate datasets. The selected variables were retrieved at a spatial resolution of 2.5 arc-minutes (~4.5 km), representing long-term climatic conditions consistent with the wetland’s environmental setting [
21]. To clarify the effective spatial variability of the coarse-resolution climate predictors, we quantified the within-boundary variance of the WorldClim annual precipitation and mean annual temperature layers. Specifically, we intersected the Shibalianwei Wetland boundary with the native 2.5 arc-minute (~4.5 km) grids and computed the number of unique climate cells and summary statistics (min, max, mean, SD) of climate values within the study area. The wetland boundary is covered by 4 climate grid cells, resulting in limited within-area spatial variability (precipitation: max − min = 1.6587 mm, SD = 0.3247; temperature: max − min = 0.1021 °C, SD = 0.0229). Therefore, climate variables mainly provide background hydro-climatic forcing rather than explaining fine-scale spatial heterogeneity at 30 m.
Finally, land use data were derived from satellite remote sensing imagery using the supervised Random Trees classifier in ArcGIS Pro [
22]. This classifier can process segmented imagery, auxiliary raster datasets, and multispectral images, thereby enabling high-precision classification of land cover types. The landscape was categorized into five classes: cropland, vegetation, barren land, built-up areas, and water bodies. During the training phase, each training sample was manually digitized in the Training Sample Manager to improve classification accuracy. The Random Trees model was systematically trained using parameters such as the NDVI, near-infrared reflectance (NIR), and other spectral indices, ensuring reliable discrimination of different land cover categories [
22]. To assess classification performance, a confusion matrix was generated, yielding an overall accuracy of 91% and a Kappa coefficient of 0.88, indicating strong agreement between the classified results and the actual land cover distribution [
23]. In addition, post-classification refinement techniques (e.g., majority filtering) were employed to minimize classification errors and enhance spatial consistency. This reclassification procedure also incorporated independent validation points to further evaluate the reliability of the classification results [
24]. Together, these multi-dimensional datasets formed a unified spatial framework to support the subsequent XGBoost modeling and prediction of carbon sequestration under different restoration scenarios.
2.3. Study Design
This study adopted a longitudinal and retrospective design to evaluate the carbon sequestration dynamics of the Shibalianwei Wetland before and after ecological restoration. Such retrospective analyses of carbon sequestration enable the evaluation of the ecological benefits of restoration projects by examining multi-year changes in carbon sink capacity. Carbon storage in 2010 was first established as a baseline using outputs from the InVEST model, which integrated soil organic carbon and biomass carbon data. This baseline served as the dependent variable for predictive modeling of subsequent years.
To capture the driving factors influencing carbon dynamics, climate and environmental data for the Shibalianwei Wetland were collected, including temperature, precipitation, vegetation, water indices, and land cover patterns, and spatially aligned within a unified coordinate reference system (CRS) and spatial resolution. Meanwhile, to ensure temporal consistency and comparability of spectral indices during satellite remote sensing data acquisition, this study utilized the Google Earth Engine (GEE) platform to acquire NDVI and NDWI data based on the peak growing season (June to August) for each target year. Imagery from this period was filtered to minimize cloud cover and atmospheric interference, generating annual composite images to represent typical vegetation and surface moisture conditions. This seasonal window was chosen because vegetation activity and hydrological conditions are relatively stable during the peak growing season, thus reducing the intra-annual variability in the NDVI and NDWI. These variables were incorporated into an XGBoost regression model, with the 2010 baseline carbon data used for model training. The model then generated spatially explicit predictions of carbon sequestration for 2017 and 2024, allowing for a comparative evaluation of restoration effectiveness over time. It should be noted that the XGBoost model in this study was not intended to replace process-based biophysical models such as InVEST. Instead, it serves as a complementary, data-driven framework to infer spatial and temporal variations in carbon sequestration under restoration scenarios, particularly in regions where continuous carbon observations or year-specific biophysical parameters are unavailable.
This design enabled an integrated assessment of temporal change, environmental influence, and ecological benefits derived from wetland restoration, providing both quantitative results and spatial insights for carbon sink management.
2.4. Model Development and Validation
The carbon sequestration module of the InVEST model was primarily employed to quantify the carbon stock within the study area, using spatial datasets of land cover, carbon density, and environmental variables. The model estimated carbon storage in aboveground and belowground biomass, soil organic carbon, and dead organic matter across land use categories, generating spatial maps of total carbon stock under different scenarios [
25]. Carbon density values derived from remote sensing and literature sources for each land use type were calibrated using the Zonal Statistics as Table tool in ArcGIS Pro. This process yielded the mean regional carbon density for 2010, forming a spatial baseline of carbon distribution that served as the target variable for subsequent prediction modeling.
XGBoost is an efficient, flexible, and scalable machine learning algorithm built on the Gradient Boosting Decision Tree (GBDT) framework, known for its high accuracy and robustness in regression tasks [
26]. The algorithm trains multiple weak learners (typically decision trees) iteratively, progressively correcting the prediction errors of previous models to form a strong learner for regression and classification tasks [
27]. Each tree is specifically designed to correct the residuals or errors left by preceding trees, and the final prediction is obtained by aggregating the outputs of all trees. In addition, XGBoost can effectively handle carbon sequestration tabular data while maintaining interpretability and transparency of the model. A key feature of XGBoost is its incorporation of regularization into the objective function, which reduces model complexity and mitigates the risk of overfitting in carbon sequestration prediction [
28], thereby ensuring more robust and reliable results. In this study, model implementation was conducted using the open-source XGBoost library (version 1.7.8) in the R environment. The source code is publicly available at
https://github.com/dmlc/xgboost (accessed on 15 July 2025).
To investigate the impact of environmental variables on changes in wetland carbon sequestration, environmental factors were spatially overlaid with historical carbon sequestration data to construct a training dataset that integrates both environmental predictors and carbon sink values. During this process, it is crucial to ensure consistency in spatial resolution and geographic extent across all environmental variable datasets; meanwhile, missing values and outliers were removed to ensure data reliability. The inclusion of environmental variables enables a more refined assessment of carbon sequestration dynamics across different land-use types. In the XGBoost model, C sequestration data from 2010 were selected as the dependent variable to evaluate temporal changes, while environmental variables—such as climate, topography, and land-use drivers—were incorporated as covariates and used as predictive factors in the model. The predictive function generated spatial forecasts based on the model outputs, producing carbon sequestration prediction maps for different years within the study area and revealing the spatial distribution and magnitude of carbon storage across land-use categories. Accordingly, comparative analyses were conducted on the total predicted carbon sequestration in 2017 and 2024, as well as on the predicted carbon storage values across different land use types, in order to evaluate the ecological restoration project’s effectiveness.
In this study, model performance was evaluated using multiple complementary accuracy metrics, including the root mean squared error (RMSE), mean absolute error (MAE), and the coefficient of determination (R
2), based on repeated model fitting and cross-validation. RMSE is a widely used metric in regression analysis and reflects the overall magnitude of prediction errors by assigning greater weight to larger deviations due to the squaring of residuals [
29]. As such, RMSE is particularly sensitive to large errors and is effective for assessing whether a model is disproportionately influenced by extreme residuals, which is an important consideration in environmental modeling applications [
30]. In contrast, MAE provides a more direct measure of the typical prediction error by averaging the absolute differences between predicted and reference values, without disproportionately emphasizing extreme deviations. Therefore, MAE offers a complementary perspective to RMSE by representing the average error level experienced across most pixels. In addition, R
2 was used to quantify the proportion of variance in carbon density explained by the model, providing insight into its explanatory capability at the pixel scale. By jointly considering RMSE, MAE, and R
2, this study captures different aspects of model performance, including the overall error magnitude, typical prediction deviation, and variance explanation. This multi-metric evaluation framework allows for a more comprehensive and robust assessment of the model’ s predictive behavior, which is essential for interpreting carbon sink predictions under changing wetland landscape conditions.
3. Results
3.1. Descriptive Analysis
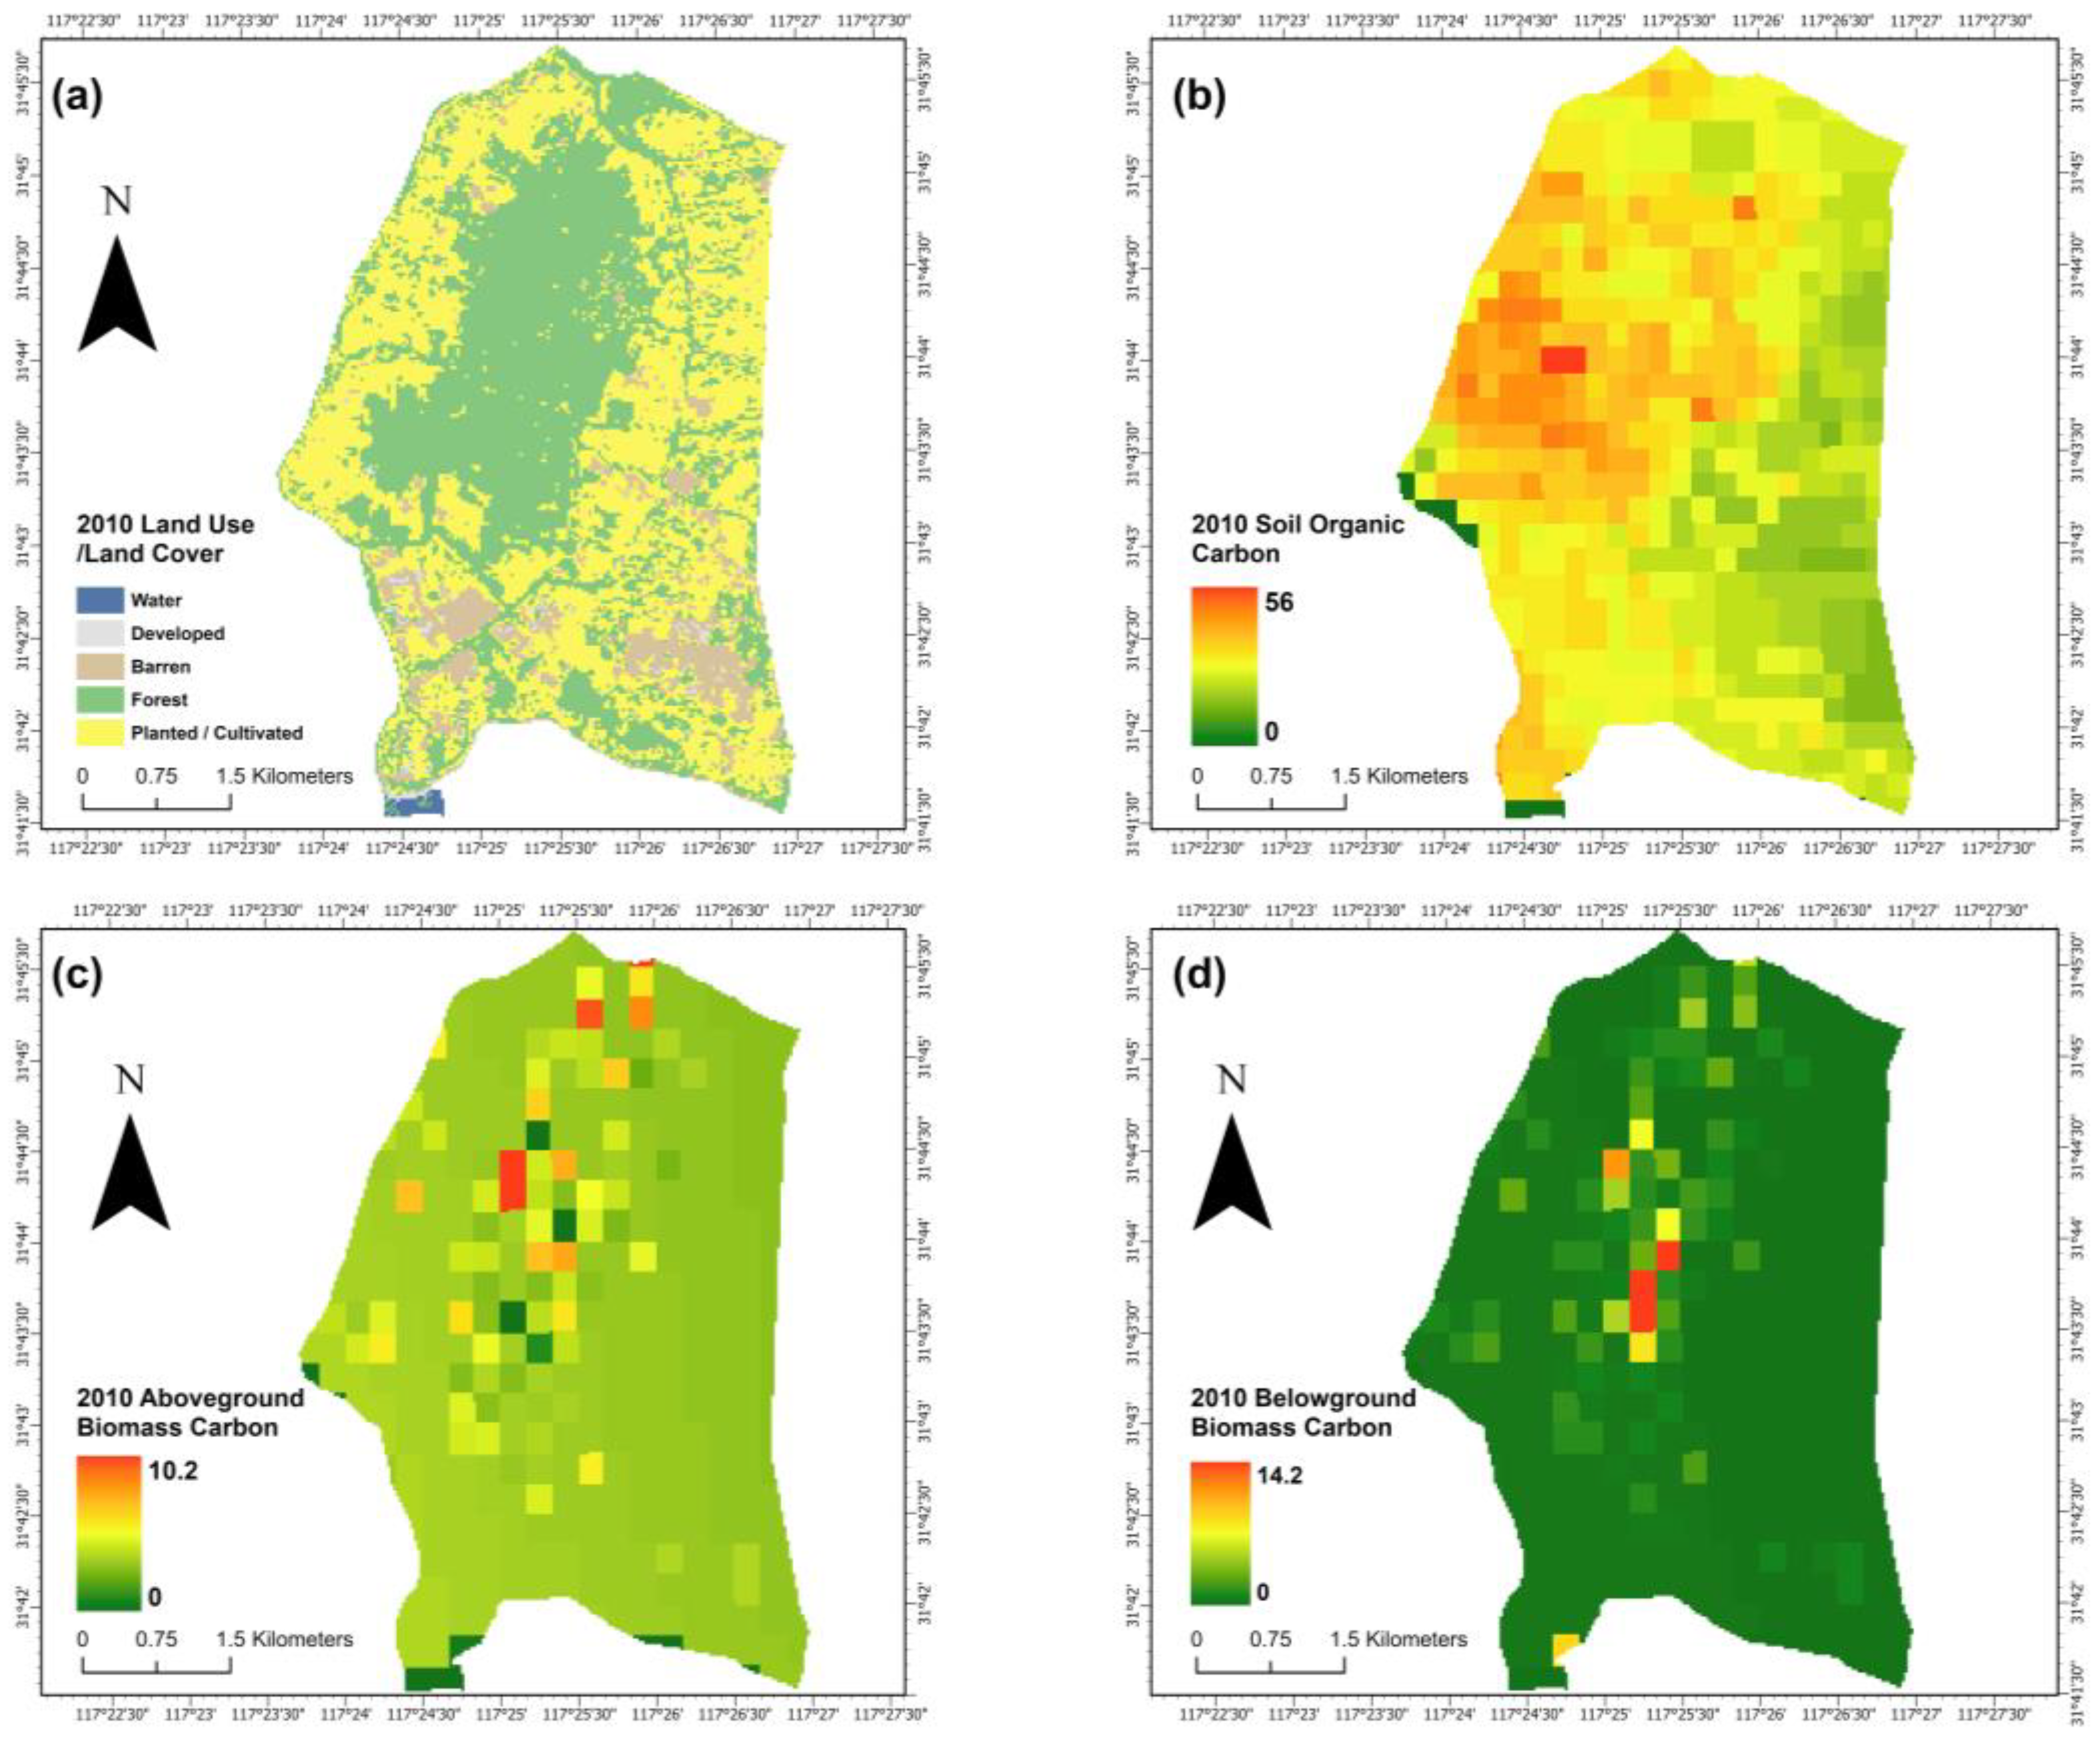
The land use and carbon distribution patterns of the Shibalianwei Wetland in 2010 exhibited clear spatial heterogeneity (
Figure 2). Cropland and forestland dominated the landscape, whereas wetland areas were relatively limited and fragmented, displaying a scattered, patchy distribution (
Figure 2a). Soil organic carbon (SOC) concentrations were higher in the western and central regions and declined toward the southeast and outer zones, likely reflecting variations in soil type and land use intensity (
Figure 2b). Aboveground and belowground biomass carbon showed broadly consistent spatial trends, with both concentrated in localized high-value areas; the latter displayed slightly higher peak values, underscoring the critical role of root systems in carbon accumulation (
Figure 2c,d). Overall, the 2010 carbon stock demonstrated pronounced spatial variation across land-use categories, establishing a baseline pattern essential for subsequent evaluation of carbon sink dynamics and restoration outcomes.
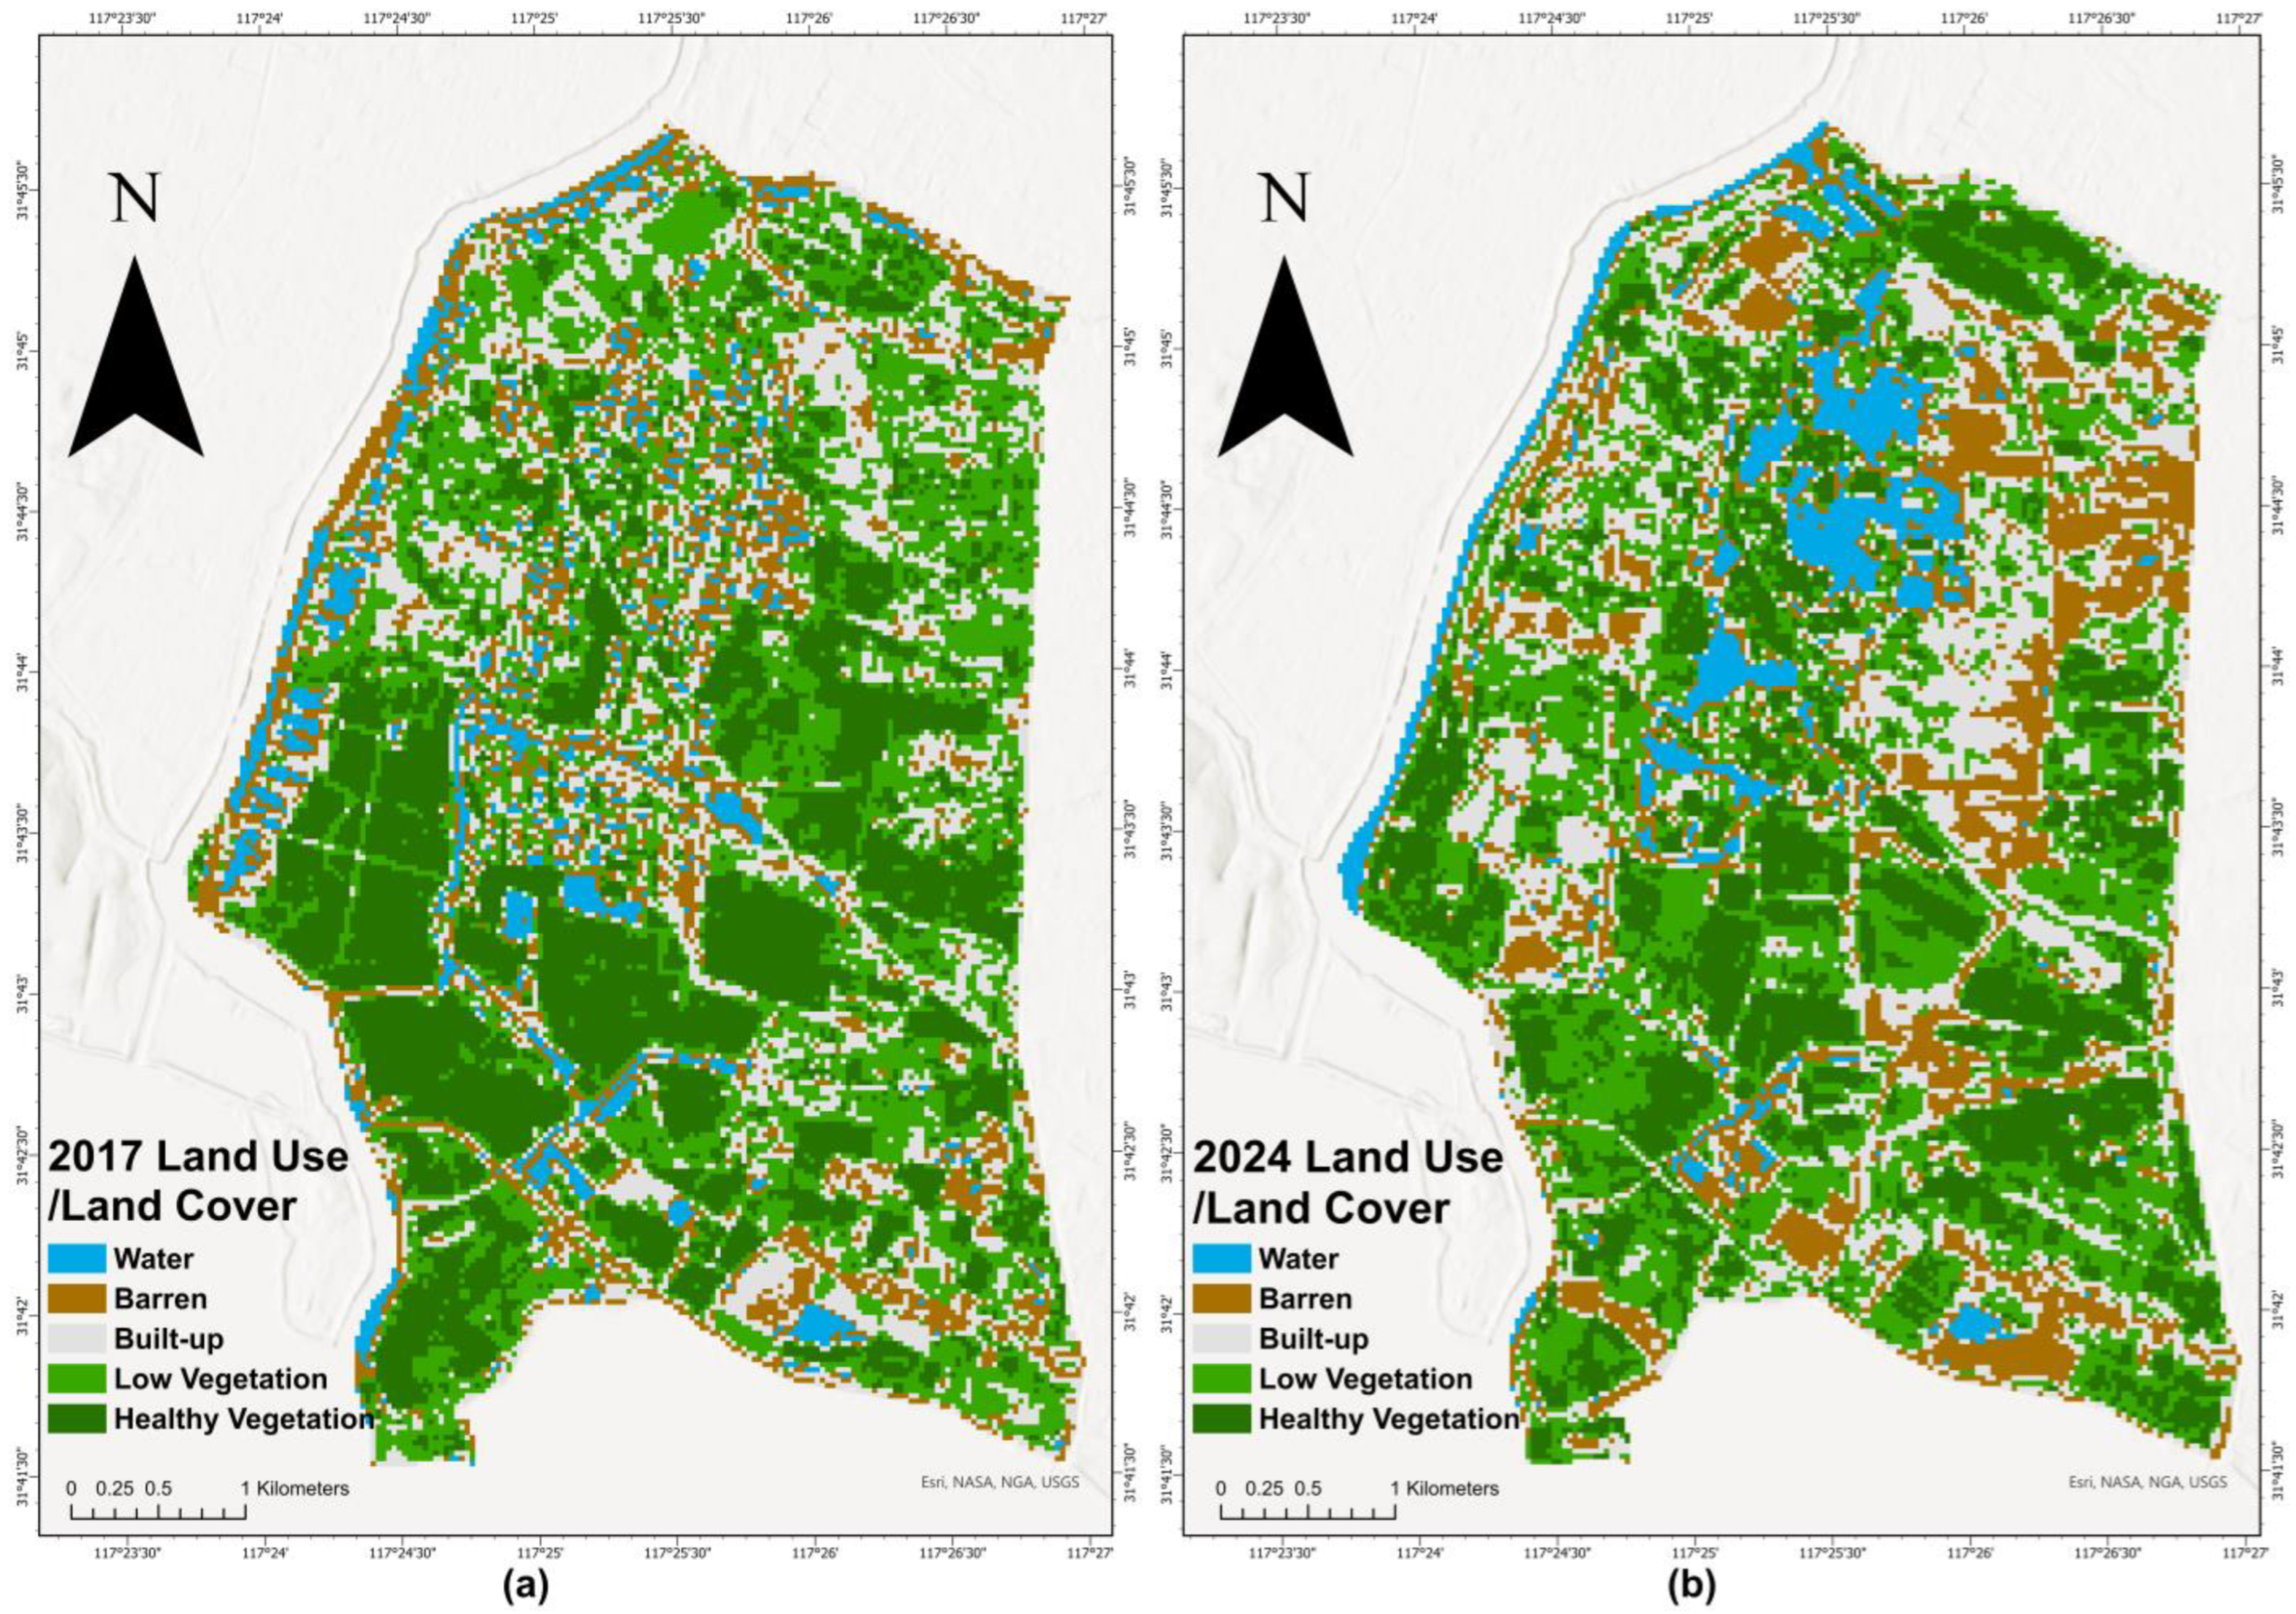
Between 2017 and 2024, the Shibalianwei Wetland underwent substantial land use transformation, reflecting both natural succession and human-induced ecological interventions (
Figure 3). In 2017, the landscape was dominated by healthy vegetation, forming relatively continuous and concentrated green zones. Areas of sparsely vegetated land and bare soil appeared in patchy or banded patterns, scattered among vegetated patches. Built-up land occupied a limited area, mainly concentrated in localized zones, while water bodies covered only a small proportion of the landscape, primarily distributed in the southern part of the study area and to a lesser extent in the western region. By 2024, the land cover composition had changed considerably. The extent of dense vegetation declined and became more fragmented, while low-coverage vegetation and bare land expanded markedly, particularly in the northern and eastern sectors of the study area. Meanwhile, water bodies increased significantly, merging into larger continuous zones across the northern and central regions, and built-up land remained largely stable without large-scale expansion.
Taken together, these patterns clearly indicate that the landscape pattern has shifted towards a more heterogeneous mosaic form. Such transitions not only reflect ongoing ecological restoration efforts and hydrological adjustments but also reveal the evolving spatial structure of the wetland ecosystem under restoration and management pressures.
Distinct differences in carbon density were observed among the various land use types within the Shibalianwei Wetland, reflecting the decisive influence of land use structure on regional carbon storage capacity (
Table 2). Forests exhibited the highest overall carbon density, confirming their role as the dominant carbon reservoir in the region. Both aboveground and belowground biomass carbon in forest areas reached 3.65 t ha
−1 and 1.14 t ha
−1, respectively, while soil organic carbon (SOC) averaged 45.70 t ha
−1, substantially exceeding that of other land types. Croplands and bare lands followed, contributing notably to the regional carbon sink. Their aboveground and belowground biomass carbon values (3.43 t ha
−1 and 0.71 t ha
−1 for cropland; 3.39 t ha
−1 and 0.70 t ha
−1 for bare land) and SOC contents (44.10 t ha
−1 and 43.54 t ha
−1, respectively) indicate that even non-forested areas play an important role in maintaining ecosystem carbon balance. In contrast, built-up areas and water bodies displayed minimal carbon storage capacity. Water bodies contained negligible above- and belowground biomass carbon, with total carbon largely confined to their limited SOC component (6.83 t ha
−1).
3.2. Carbon Sink Prediction Map and Temporal Trends
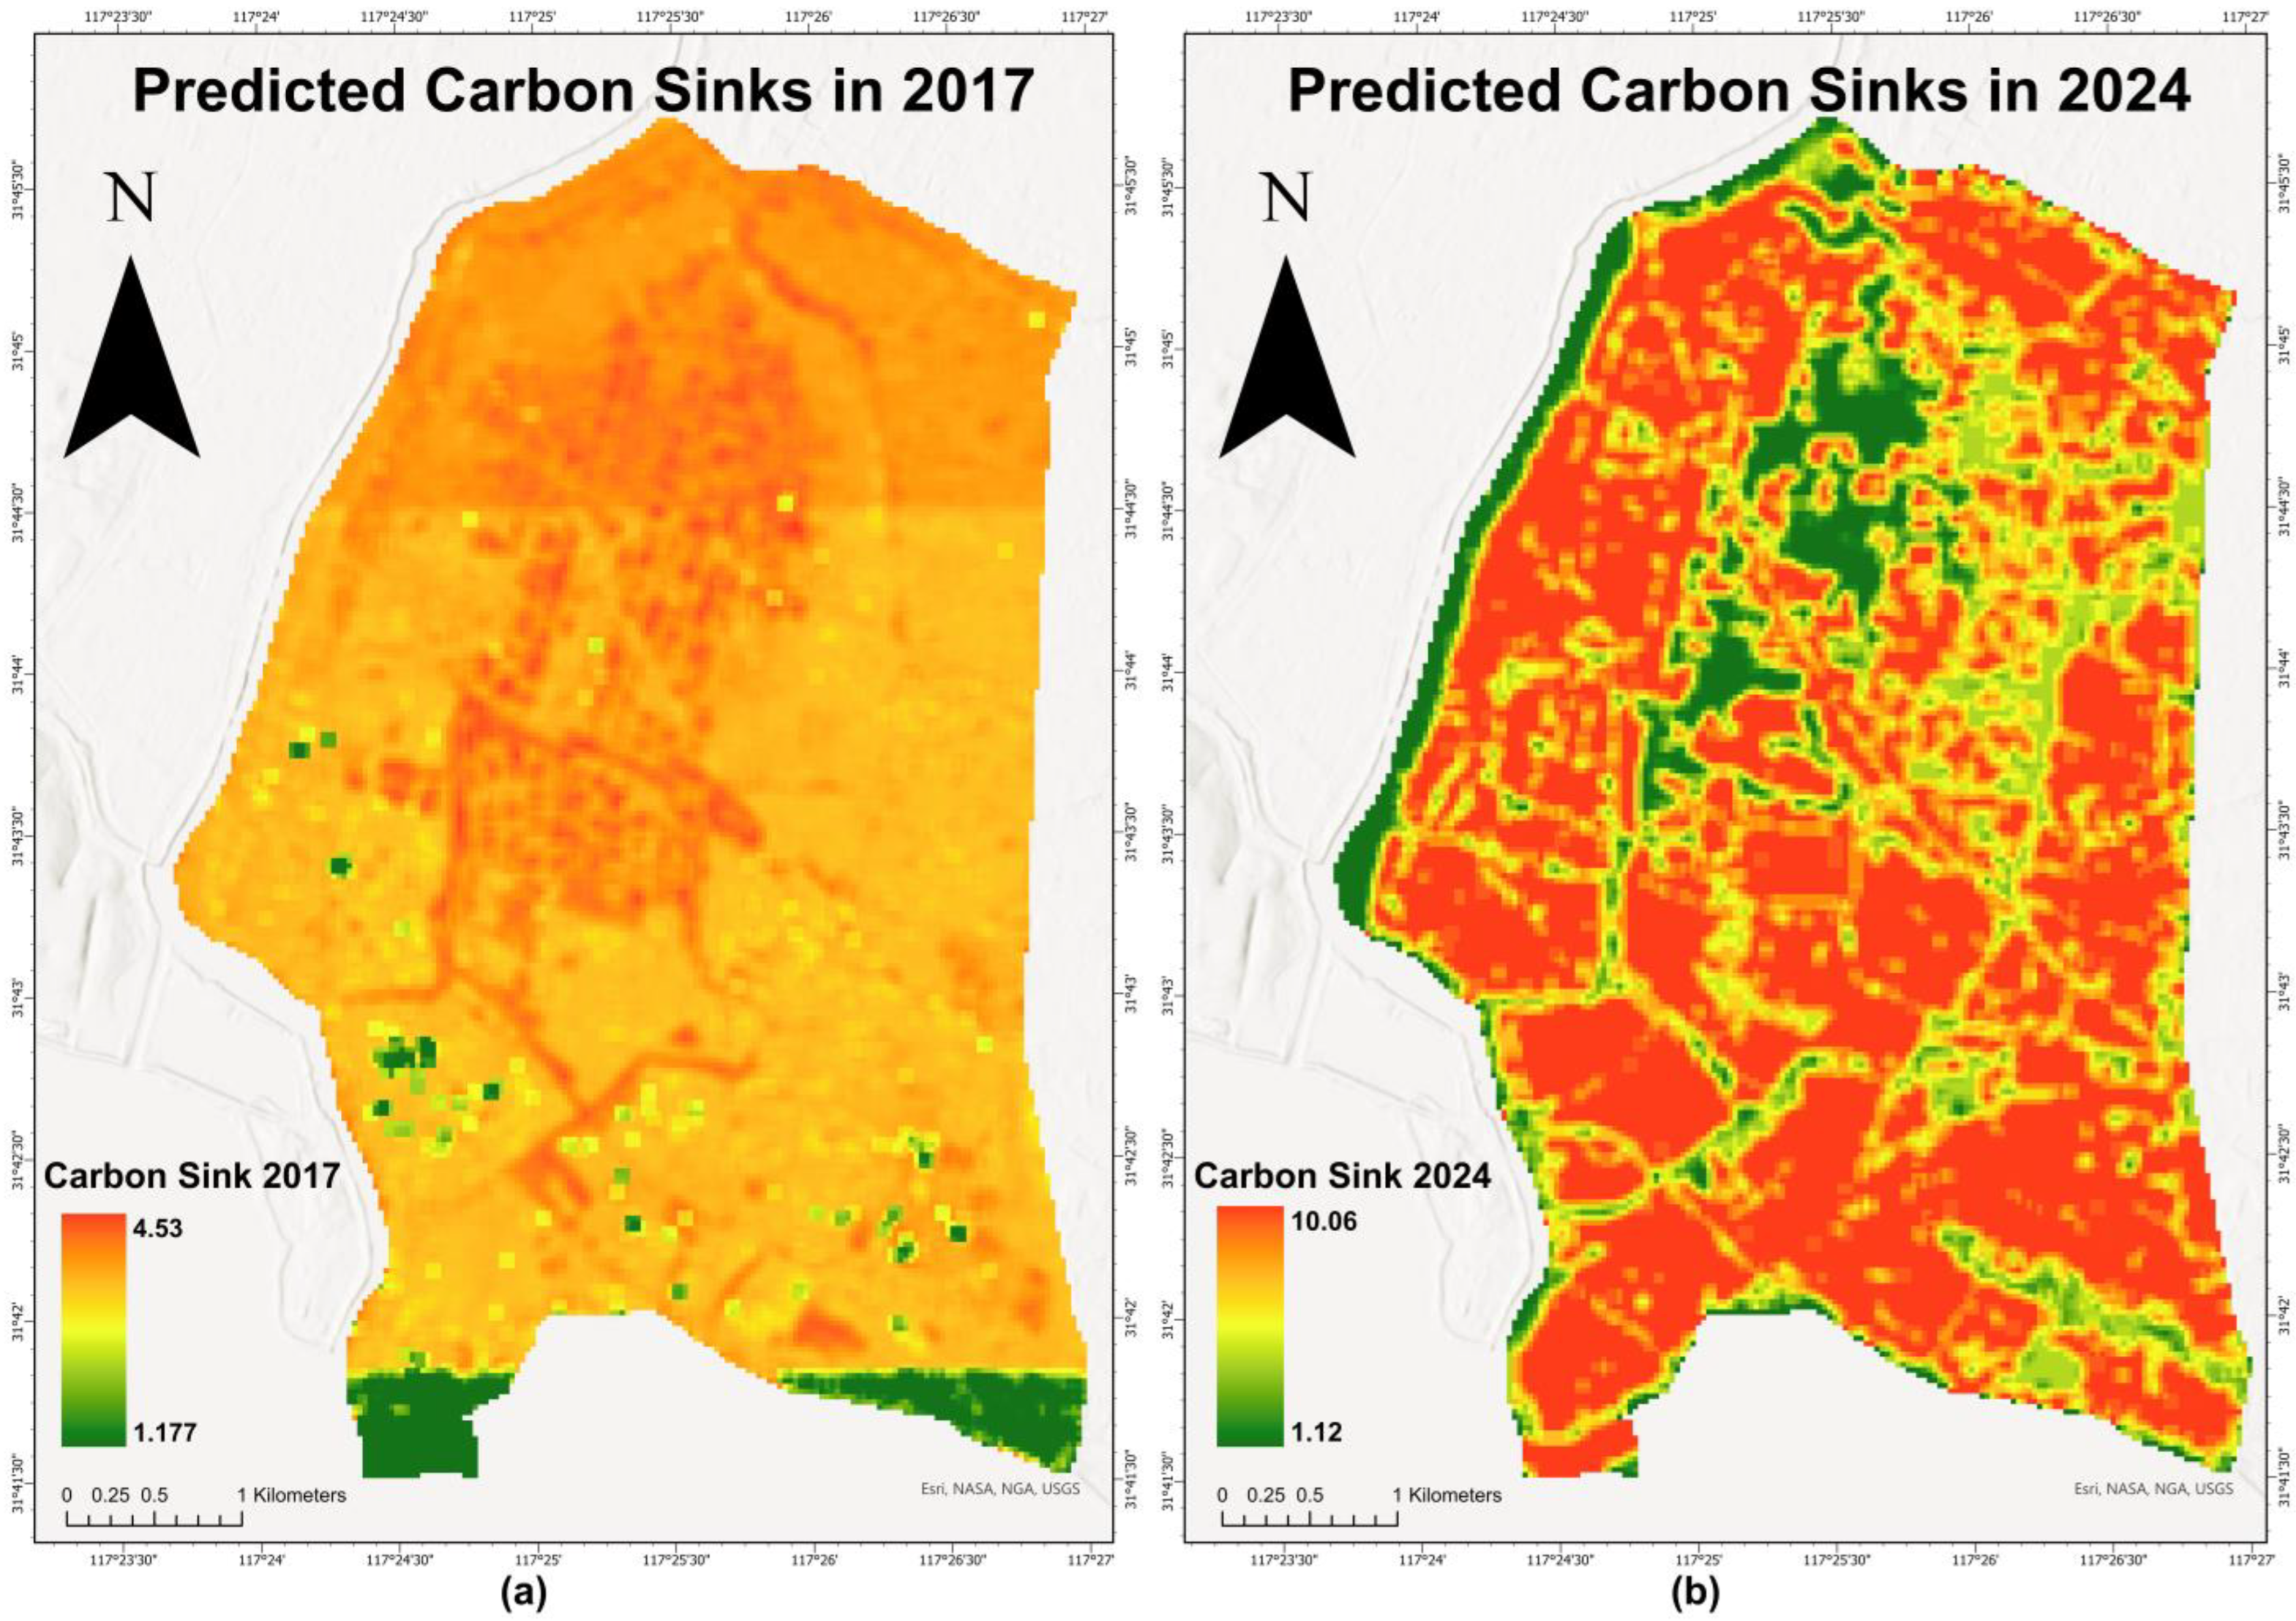
The overall carbon sequestration capacity of the Shibalianwei Wetland showed a substantial increase between 2017 and 2024, demonstrating the significant ecological benefits of ongoing restoration projects (
Figure 4,
Table 3). The InVEST–XGBoost prediction results reveal that both the magnitude and spatial pattern of carbon storage experienced pronounced enhancement during this period.
In 2017, carbon sequestration was predominantly low to moderate, with most values ranging from 0.91 to 4.54 t ha
−1. Low-value zones were widely distributed in the central and northern parts of the study area, while only a few fragmented high-carbon patches appeared in the southern and southeastern regions (
Figure 4a). By contrast, the 2024 prediction displays an evident spatial shift toward higher sequestration levels, with values extending up to 10.73 t ha
−1. High-value areas became more continuous and extensive, particularly across the western, eastern, and southern zones—reflecting improved vegetation growth and enhanced carbon fixation following ecological rehabilitation (
Figure 4b). Regions with persistently low sequestration remained limited to parts of the northeastern and marginal zones. Overall, the spatial pattern evolved from a fragmented, low-value configuration to a clustered, high-value landscape, signifying a more efficient and stable carbon sink system.
Temporal analysis of total carbon stock further supports this trend. The wetland’s total carbon storage remained stable from 2010 (1348.90 t) to 2017 (1349.01 t), corresponding to an average carbon density of approximately 48.7 t ha
−1. However, by 2024, the total carbon stock increased sharply to 2498.12 t, with an average density of 90.18 t ha
−1, representing an 85.2% increase in overall sequestration capacity (
Table 3). This remarkable growth highlights the cumulative impact of vegetation restoration, hydrological improvement, and reduced anthropogenic disturbance in strengthening the carbon sink function of the Shibalianwei Wetland.
3.3. RMSE Estimates to Wetland Carbon Sink Prediction Accuracy
The predictive performance of the XGBoost model exhibited clear temporal differences between the pre-restoration year (2017) and the post-restoration year (2024), as reflected by multiple complementary accuracy metrics (
Table 4). The model performance was evaluated based on 100 iterations using the root mean square error (RMSE), mean absolute error (MAE), and the coefficient of determination (R
2), which together characterize the error magnitude, typical deviation, and variance explanation at the pixel scale.
For 2017, the model achieved relatively low prediction errors, with an RMSE of 0.47 and an MAE of 0.15. The low MAE indicates that, on average, pixel-level predictions deviated only slightly from the reference carbon values. In contrast, the higher RMSE suggests that a limited number of pixels exhibited larger residuals, exerting a disproportionate influence on the overall error magnitude. The R2 value for 2017 was 0.05, indicating that only a small proportion of spatial variance in carbon density was explained at the pixel scale, despite the generally low absolute prediction errors.
However, model accuracy in 2024 declined substantially, with RMSE and MAE increasing to 0.74 and 0.62, respectively. The concurrent rise in both metrics indicates an overall elevation in prediction error magnitude across the study area. Compared with 2017, the closer numerical values of RMSE and MAE in 2024 suggest that prediction errors were more uniformly distributed among pixels, rather than being dominated by a small number of extreme residuals. The R2 value increased to 0.19, indicating that the model captured a greater share of spatial variability in carbon density, although this improvement in variance explanation was accompanied by higher absolute prediction errors. This change in accuracy may be attributed to changes in the wetland landscape in 2024 and increased ecological complexity, which may have exacerbated the heterogeneity among predictor variables, thereby weakening the model’s predictive power.
Overall, these results demonstrate a clear shift in the model’s predictive behavior over time. Prediction performance in 2017 was characterized by low average errors with limited variance explanation, whereas 2024 exhibited higher and more evenly distributed errors alongside increased spatial variability captured by the model. This contrast highlights the sensitivity of pixel-level machine learning predictions to temporal changes in landscape conditions and underscores the importance of considering multiple accuracy metrics when evaluating long-term wetland carbon sink predictions.
4. Discussion
4.1. Interpretation of Results
The observed increase in carbon sequestration from 2017 to 2024 reflects a significant improvement in the ecological environment of the Shibalianwei Wetland, primarily attributable to vegetation restoration and hydrological rehabilitation [
14,
31]. Compared to the carbon distribution recorded in 2017, the 2024 prediction results reveal a more spatially enhanced carbon distribution pattern, indicating that the wetland ecosystem has transitioned from an inefficient carbon sink to an efficient carbon sink. Moreover, the average carbon density increased from 48.7 t/ha in 2017 to 90.18 t/ha in 2024, reflecting enhanced carbon absorption efficiency per unit area and strengthening the wetland’s function as a high-efficiency, high-capacity carbon sink [
32,
33]. This transformation indicates that restoration measures—such as vegetation recovery, reduced human disturbance, and re-established water connectivity—have enhanced biomass accumulation and soil organic carbon stability.
The marked increase in carbon sequestration further demonstrates the synergistic effects of vegetation expansion and improved soil water conditions. Areas dominated by forests and semi-natural vegetation accumulated higher carbon densities, while previously carbon-poor, barren, and sparsely vegetated lands experienced significant increases in carbon density following hydrological restoration. This reflects the ecological benefits of re-establishing hydrological connectivity, which promotes sediment deposition and microbial processes conducive to carbon retention. Agricultural fields also contributed to this growth, likely due to reduced tillage intensity and improved soil moisture conditions that enhanced organic carbon inputs. These findings confirm that ecological restoration not only reestablishes vegetation cover but also promotes the synergistic interaction between vegetation recovery and hydrological stability, collectively enhancing the wetland carbon sequestration capacity.
Nevertheless, the magnitude of this increase should be interpreted within the context of large-scale land use transformation rather than individual vegetation growth rates. The restoration of the Shibalianwei Wetland involved extensive conversion of degraded cropland, barren land, and aquaculture ponds into wetland and semi-natural vegetation systems, leading to rapid gains in soil organic carbon and belowground biomass across the landscape. It should be noted that the carbon density values applied in this study represent land-cover-level mean estimates and do not explicitly account for vegetation age. Consequently, aboveground biomass carbon in recently restored vegetation may be overestimated during early successional stages. Despite this limitation, the adopted approach remains appropriate for capturing relative spatial patterns and system-level trends in carbon sequestration associated with ecological restoration.
4.2. Merits and Limitations of Data Source
Wetland carbon sequestration is fundamentally regulated by the position of the water table relative to the soil surface, as it controls redox potential, organic matter decomposition, root activity, and vertical accretion processes. However, direct measurements of groundwater level, soil bulk density, and sedimentation rates were not available at the spatial and temporal scales required for this landscape-level analysis. Accordingly, this study employed climatic variables (precipitation and temperature) and spectral indices (NDVI and NDWI) as indirect proxies to characterize hydroclimatic conditions and surface moisture status that influence shallow water table dynamics at the landscape scale. Previous studies have demonstrated that wetlands located in regions with higher precipitation generally exhibit greater carbon storage, as increased water availability enhances vegetation growth and biomass accumulation—both of which contribute to stronger carbon retention [
34,
35]. Moreover, increases in NDVI and NDWI provide valuable proxies for vegetation productivity and soil moisture conditions. Collectively, these drivers promote net primary productivity and litter input, while the wetter conditions simultaneously suppress decomposition rates, thereby enhancing soil carbon accumulation. Consequently, the combined effects of land-use transitions, ecological restoration, and favorable hydroclimatic conditions largely explain the sharp increase in carbon storage observed in 2024. However, due to data limitations in both spatial and temporal dimensions, certain anthropogenic and environmental variables were not included in the current analysis. So, to further refine the model and quantify the contribution of other anthropogenic activities to carbon sequestration dynamics in the study area, it is necessary to incorporate human-related variables such as the intensity of human activities, GDP density, and distance to the nearest road [
36,
37].
Among the datasets employed, spatial resolution remains one of the main sources of uncertainty. Specifically, the original climatic datasets have a spatial resolution of approximately 4.5 km and resampling them to 30 m inevitably led to a loss of effective spatial detail. Within the relatively small extent of the Shibalianwei Wetland, the annual precipitation and temperature layers exhibit very limited within-boundary spatial variability, meaning that most pixels share identical or near-identical climate values in a given year. As a result, these climate variables are not intended to explain fine-scale (30 m) spatial heterogeneity in carbon sequestration. This issue is closely tied to data availability, as existing climate products are generally provided at national, provincial, or urban scales, with a lack of high-resolution observations for small regional extents. The mismatch in spatial resolution can produce visible banding artifacts in spatial outputs, reducing the accuracy and continuity of fine-scale simulations. Nevertheless, other key predictors, including land use types, NDVI, and NDWI, were available at a 30 m spatial resolution and therefore played a dominant role in capturing spatial heterogeneity. Moreover, in tree-based models such as XGBoost, predictors with near-constant values typically contribute negligible split gain and are effectively down-weighted during model training, minimizing their influence on spatial pattern interpretation.
Additionally, regarding potentially questionable carbon data from 2010, the carbon data values for farmland and bare land areas are relatively close. This similarity does not necessarily reflect identical ecological processes but may result from mosaic effects captured by 30 m resolution remote sensing data and seasonal surface conditions. In the Shibalianwei area, some farmlands remain fallow or bare after harvest, resulting in spectral characteristics similar to bare soil. Furthermore, the conservative carbon density coefficients used in the InVEST model often diminish the distinct differences between these two land types. In reality, farmlands typically maintain higher soil organic carbon inputs through crop residues and root turnover, suggesting their actual carbon stocks should exceed those of bare land.
Overall, the data sources adopted in this study were well-suited to the research objectives and demonstrated strong applicability and performance during model implementation. This finding further highlights the need for future studies to integrate higher-resolution climatic observations or regional climate model outputs to enhance the accuracy of carbon sequestration simulations at finer spatial scales.
4.3. Model Selection
One of the primary advantages of XGBoost lies in its ability to capture complex nonlinear relationships and generate reliable predictions even in the presence of multicollinearity among variables—an aspect particularly critical for carbon sink studies, where climate, vegetation, and land-use factors interact in multidimensional ways [
38]. In addition, the model can automatically handle partially missing data and identify key driving factors through feature importance ranking, thereby enhancing both the interpretability and ecological relevance of the model [
39]. These strengths have contributed to XGBoost’s widespread application across various domains, including environmental modeling and ecological forecasting. On the other hand, a common limitation of XGBoost is its tendency to overfit when applied to high-dimensional, multivariate, or imbalanced datasets [
38]. To address this issue, this study employed a five-fold cross-validation approach with 100 repeated iterations to improve model robustness. In five-fold cross-validation, the dataset is randomly divided into five subsets; in each round, four subsets are used for training while one is reserved for testing, ensuring that every sample is utilized for both training and validation. Repeating this process 100 times substantially reduces bias and variance associated with a single data split, leading to a more stable and comprehensive evaluation of model performance [
40].
However, various algorithms, like random forests, have been successfully applied to carbon emissions modeling, and they may offer different trade-offs, such as simpler structure and greater interpretability. To further underscore the robustness of our modeling approach, this study compared the performance potential of XGBoost against other commonly used machine-learning algorithms in ecological carbon modelling contexts. Subedi et al. (2025) showed that in a single prediction model, XGBoost is generally better than single tree or classical regression models in capturing nonlinear interactions between environmental drivers [
41]. Furthermore, Adam et al. (2025) compared XGBoost, Random Forest, and CatBoost in greenhouse gas forecasting and found that while XGBoost achieved the highest accuracy, the gap narrowed when data was limited, or features were highly correlated [
42]. In particular, within a single forecast model, XGBoost demonstrated significantly higher prediction accuracy than models like Random Forest and CatBoost [
42].
By situating our results within this broader methodological context, this study demonstrates that the selected XGBoost-based framework not only delivers reliable prediction for the study area but also aligns with state-of-the-art modelling practice in ecological carbon studies.
4.4. Model Performance
In the model validation, the moderate decline in prediction accuracy observed for 2024 suggests a degree of sensitivity to increasing system complexity following ecological restoration. Nevertheless, the RMSE values for both 2017 and 2024 remained below 1, indicating that the model retains reasonable fitting capability at the pixel scale under relatively stable conditions. The higher RMSE in 2024 further reflects enhanced spatial heterogeneity across the restored landscape. This interpretation is supported by the concurrent increase in MAE, which indicates that average prediction deviations were more pronounced in 2024, suggesting a general elevation of uncertainty rather than isolated extreme errors. Furthermore, the increase in R2 from 2017 to 2024 indicates that a greater proportion of spatial variability in carbon density was captured by the model under post-restoration conditions. This apparent combination of higher absolute errors (RMSE and MAE) and improved variance explanation (R2) reflects a shift in the underlying carbon–environment relationships following restoration, where spatial contrasts became more pronounced but also more difficult to predict accurately at fine scales. Therefore, prediction errors are not expected to be uniformly distributed but are likely concentrated in transitional and recently restored zones, where vegetation age, soil development, and management practices vary substantially at fine spatial scales and are difficult to fully capture using land-cover-level predictors and remote sensing indices alone. In contrast, areas with more stable land cover conditions, such as long-established water bodies or mature vegetation patches, tend to exhibit a lower prediction uncertainty. Consequently, the elevated RMSE and MAE observed for 2024 represent localized modeling challenges in highly dynamic restoration landscapes rather than a general decline in model robustness. These findings underscore the importance of careful feature selection and hyperparameter tuning, as well as the incorporation of temporally explicit and process-sensitive variables, for improving long-term carbon sequestration projections in restored wetland ecosystems.
4.5. Internal Validity
Internal validity is a fundamental concept in research methodology, referring to the extent to which a study’s conclusions accurately reflect the true causal relationship between variables, rather than being confounded by extraneous factors or flaws in the research design [
43]. In this study, k-fold cross-validation and multiple iterations were employed to ensure model robustness and thereby enhance internal validity. However, during the input of model-driving variables, anthropogenic and additional environmental factors—such as the intensity of human activities and the degree of drought—were not incorporated. Notably, the influence of human activities has been highlighted in other studies on carbon stock assessment [
36]. Therefore, it is expected that future research on wetland carbon sequestration will continue to improve model prediction accuracy through the inclusion of more environmental and anthropogenic variables, as data availability and applicability increase, particularly with improvements in data resolution. On the other hand, this study, by integrating updated datasets to evaluate the most recent prediction results, can to some extent accurately represent the wetland carbon sequestration patterns of the Shibalianwei region, addressing the limitations of retrospective analyses in reflecting current conditions. In summary, the study achieved its intended objectives; however, the predictive accuracy of the XGBoost model for wetland carbon sequestration requires further enhancement, particularly through the aforementioned approaches. Moreover, given that similar studies are scarce in this region, additional research on wetland carbon sequestration is essential to better validate and contextualize the findings presented here.
4.6. External Validity
External validity refers to the extent to which the results of a study can be generalized beyond the specific conditions under which it was conducted. In empirical research, it is essential to clarify the scope of applicability of the conclusions and to enhance external validity through cross-regional validation, temporal verification, or transferability testing [
44]. The present study demonstrates a certain degree of external validity, as its findings highlight that wetland ecological restoration measures substantially increase carbon stocks—a result consistent with previous studies—thereby providing strong evidence that restoring degraded wetlands is a crucial strategy for achieving global climate goals [
45,
46]. Furthermore, the study area encompasses diverse land use types, indicating that the proposed model can effectively represent and be applied to other anthropogenically managed wetland regions with similar characteristics. In addition, all variables used in this research—including carbon, climatic, environmental, hydrological, and vegetation factors—were derived from globally available open-source remote sensing datasets, which further strengthens its external validity. Therefore, the methodological framework of this study can be extended and refined in other regions. As data quality continues to improve and more driving factors become accessible, future research can conduct more comprehensive analyses to deeply assess and predict patterns of carbon sequestration under various restoration and management scenarios.
4.7. Implications of Research
With the continuous decline of wetland area, massive carbon stocks have been released into the atmosphere, posing a severe threat to ecosystem stability, climate regulation processes, and socio-economic security [
5]. Therefore, accurately predicting wetland carbon sequestration holds not only significant scientific importance but also substantial practical value for global climate strategies. However, few existing studies on wetland carbon sequestration have systematically integrated multiple driving factors using machine learning approaches. Unlike traditional statistical models, machine learning can effectively capture the complex nonlinear relationships among climatic, ecological, and anthropogenic variables, thereby achieving higher predictive accuracy under diverse environmental conditions. This capability is particularly crucial for wetlands, as their carbon fluxes are highly sensitive to both natural fluctuations and human disturbances. In this study, we constructed a spatially explicit model by integrating remote sensing imagery and climatic factors to quantify existing carbon stocks and predict future changes under various land use and climate scenarios. The results indicate that wetland restoration can significantly enhance carbon sequestration capacity, a process accompanied by increased vegetation cover and improved hydrological conditions [
47], further highlighting the critical role of nature-based solutions (NbSs) in climate mitigation [
31]. Overall, our findings demonstrate the substantial contribution of the Shibalianwei Wetland restoration to carbon sequestration, representing an essential component of China’s response to climate change. This study provides empirical evidence for conservation planning, restoration optimization, and climate policy formulation, aligning with previous research that underscores the pivotal role of wetland restoration in achieving China’s carbon neutrality goals [
48].
4.8. Suggestions for Future Management and Research
Based on the results of this study, several practical implications can be derived for decision-makers involved in wetland management and ecological restoration. First, the substantial increase in carbon storage following restoration highlights the importance of prioritizing large-scale wetland restoration as an effective nature-based solution for enhancing regional carbon sinks. Restoration strategies that promote the conversion of croplands and degraded lands into semi-natural vegetation and wetlands should be prioritized, as these land-use transitions were shown to contribute disproportionately to carbon sequestration gains.
Second, the spatial heterogeneity observed in post-restoration carbon sequestration suggests that management interventions should be spatially targeted rather than uniform. Transitional and recently restored areas, which exhibited higher uncertainty and variability, may benefit from adaptive management approaches, such as phased restoration, vegetation structure optimization, and hydrological regulation tailored to local conditions. In contrast, areas with stable land cover and high carbon density should be designated as conservation priorities to safeguard long-term carbon storage.
Third, the spatially explicit modeling framework developed in this study can support decision-making by identifying carbon sequestration hotspots and areas with high restoration potential. Such information can be integrated into land-use planning, ecological zoning, and performance evaluation of restoration projects, enabling more efficient allocation of financial and management resources.
Finally, based on the preceding analyses, this study offers several recommendations for future research on wetland carbon sequestration prediction and the enhancement of wetland restoration success. Future work should emphasize long-term time series analyses, acquisition of high-quality datasets, and incorporation of more diverse driving factors to improve the effectiveness and accuracy of predictive models—particularly incorporate socio-economic drivers—such as human activity intensity and population density—alongside climatic and environmental variables. Moreover, the evaluation of wetland restoration should not be confined solely to the perspective of carbon sequestration; it also requires more detailed hydrological assessments and strategies to mitigate external nutrient pollution in order to achieve a clearer understanding of hydrological processes. Integrating hydrological and nutrient management strategies with carbon sequestration assessments will help determine whether improvements in wetland restoration are sustainable or whether additional interventions are necessary to achieve full recovery. Addressing these research gaps will deepen our understanding of wetland restoration dynamics and contribute to the development of more effective and sustainable restoration practices worldwide.