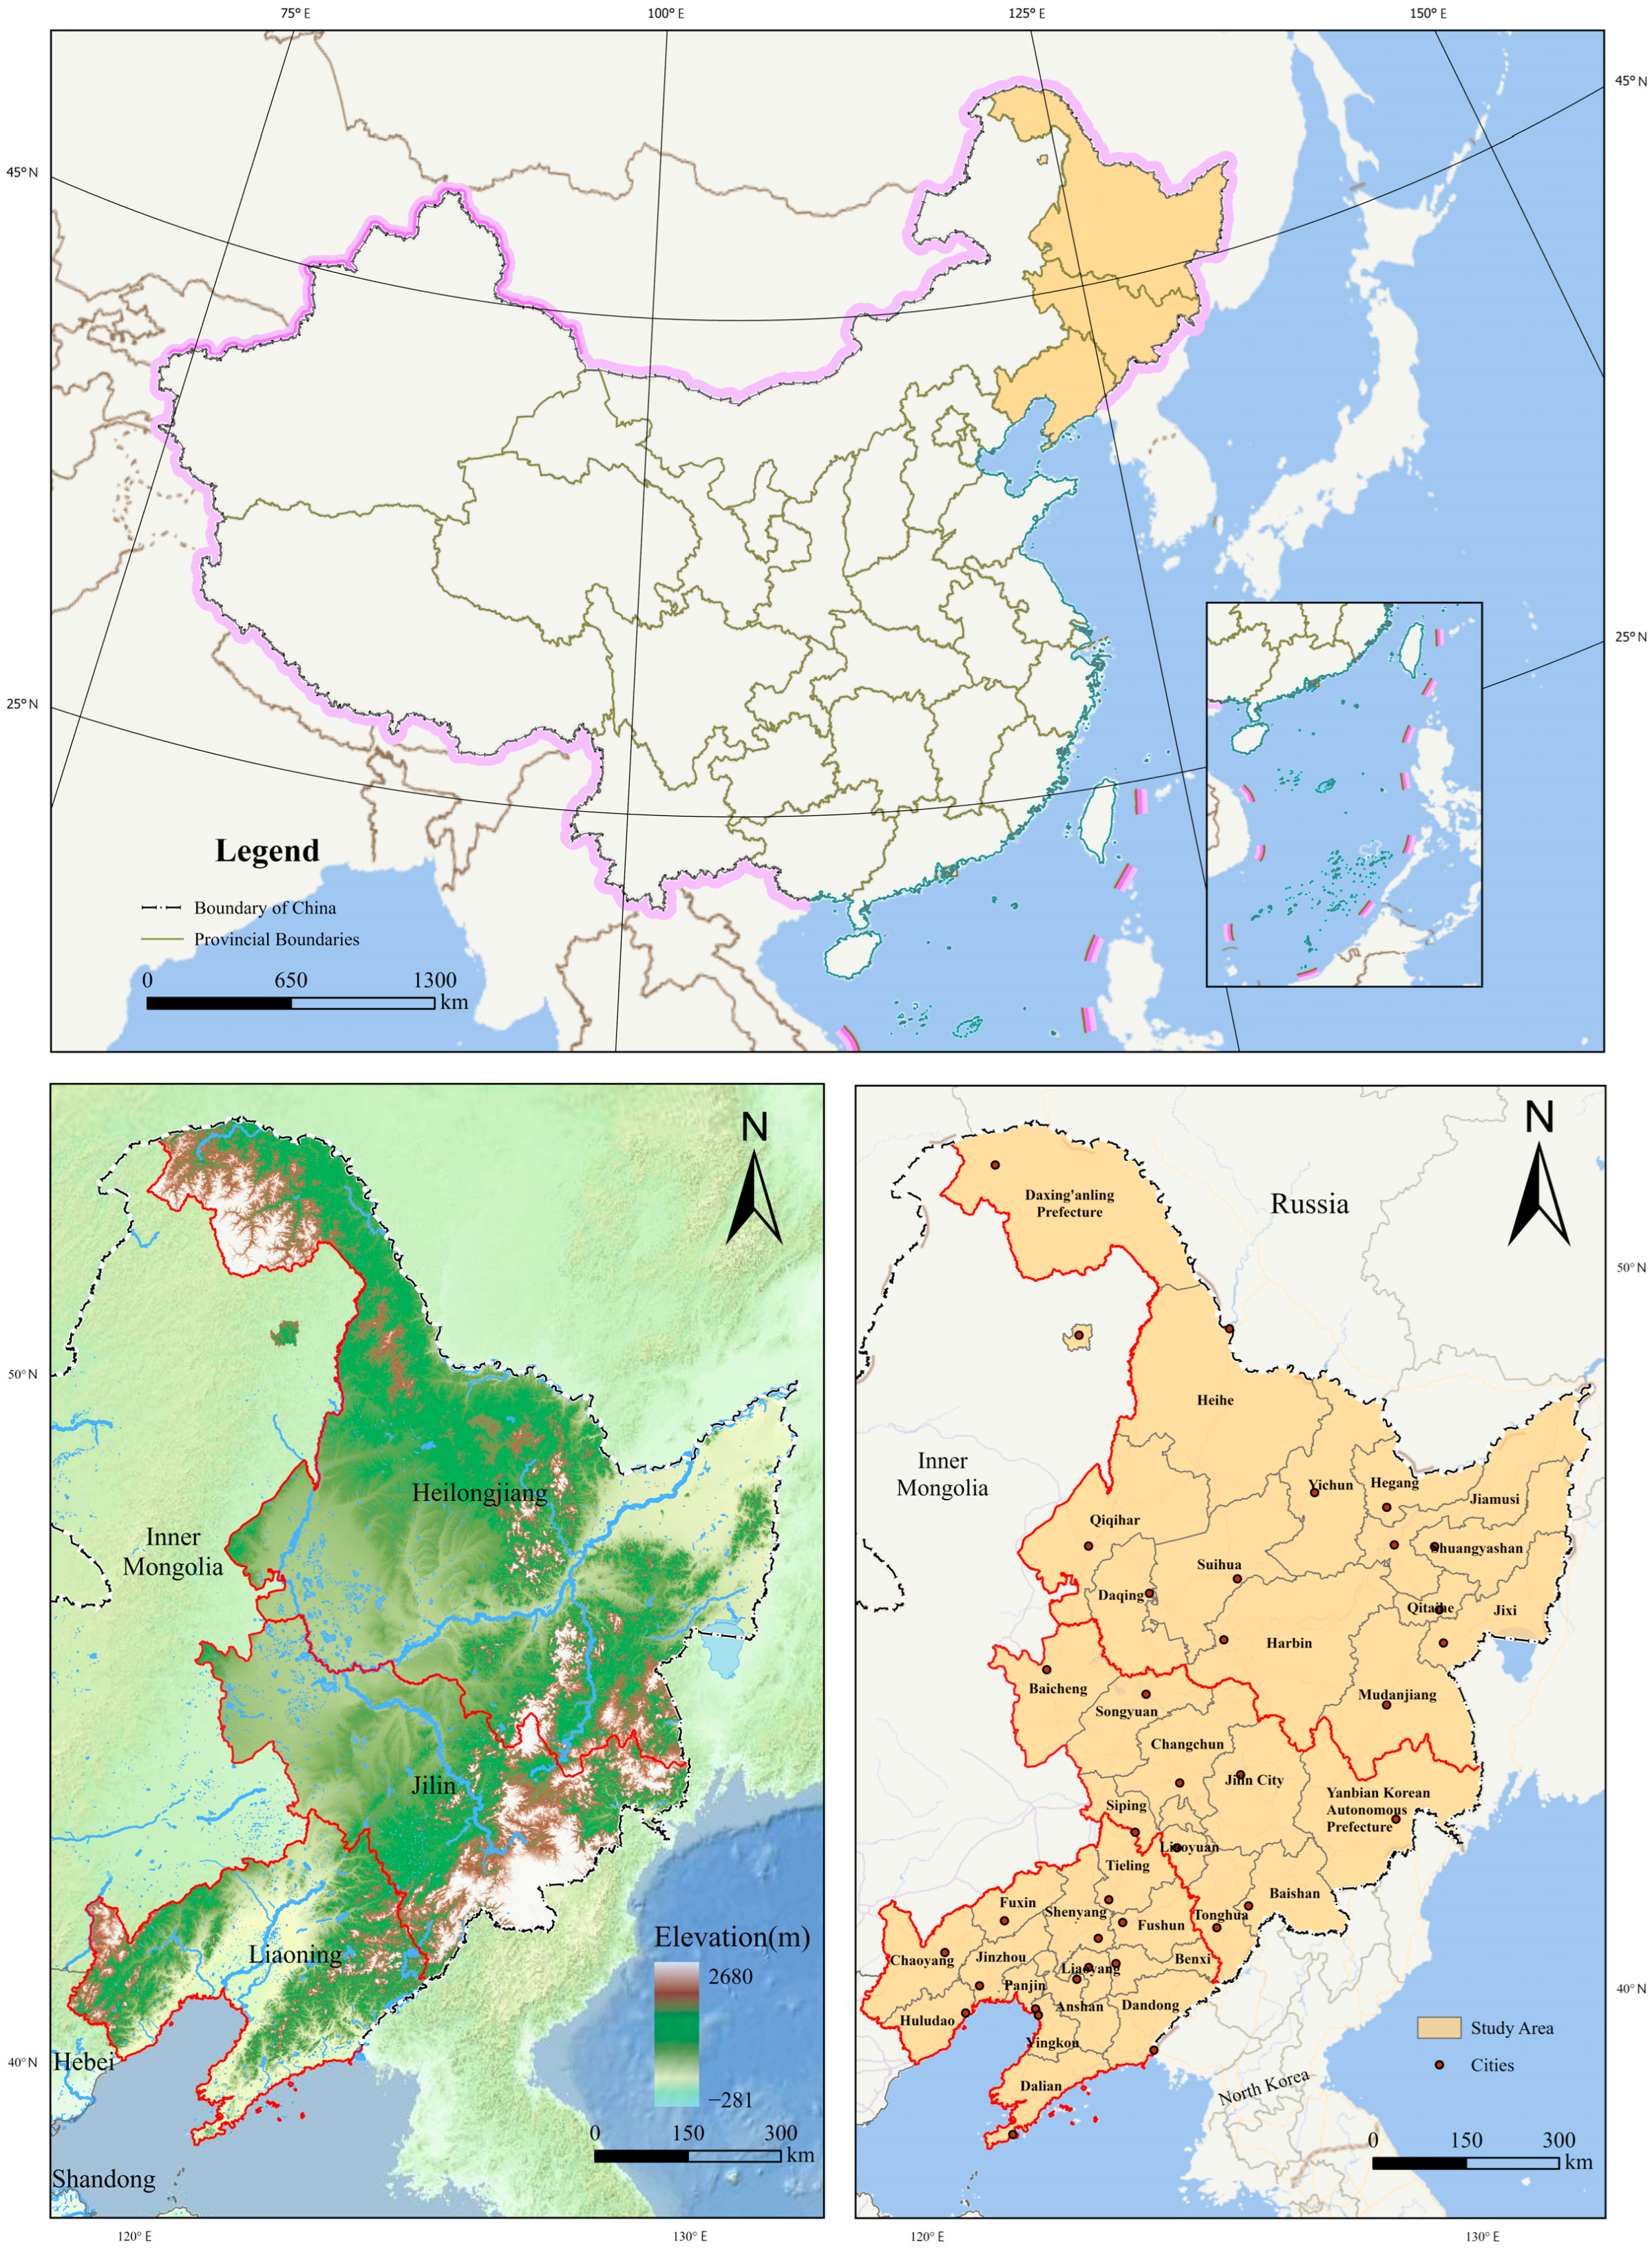
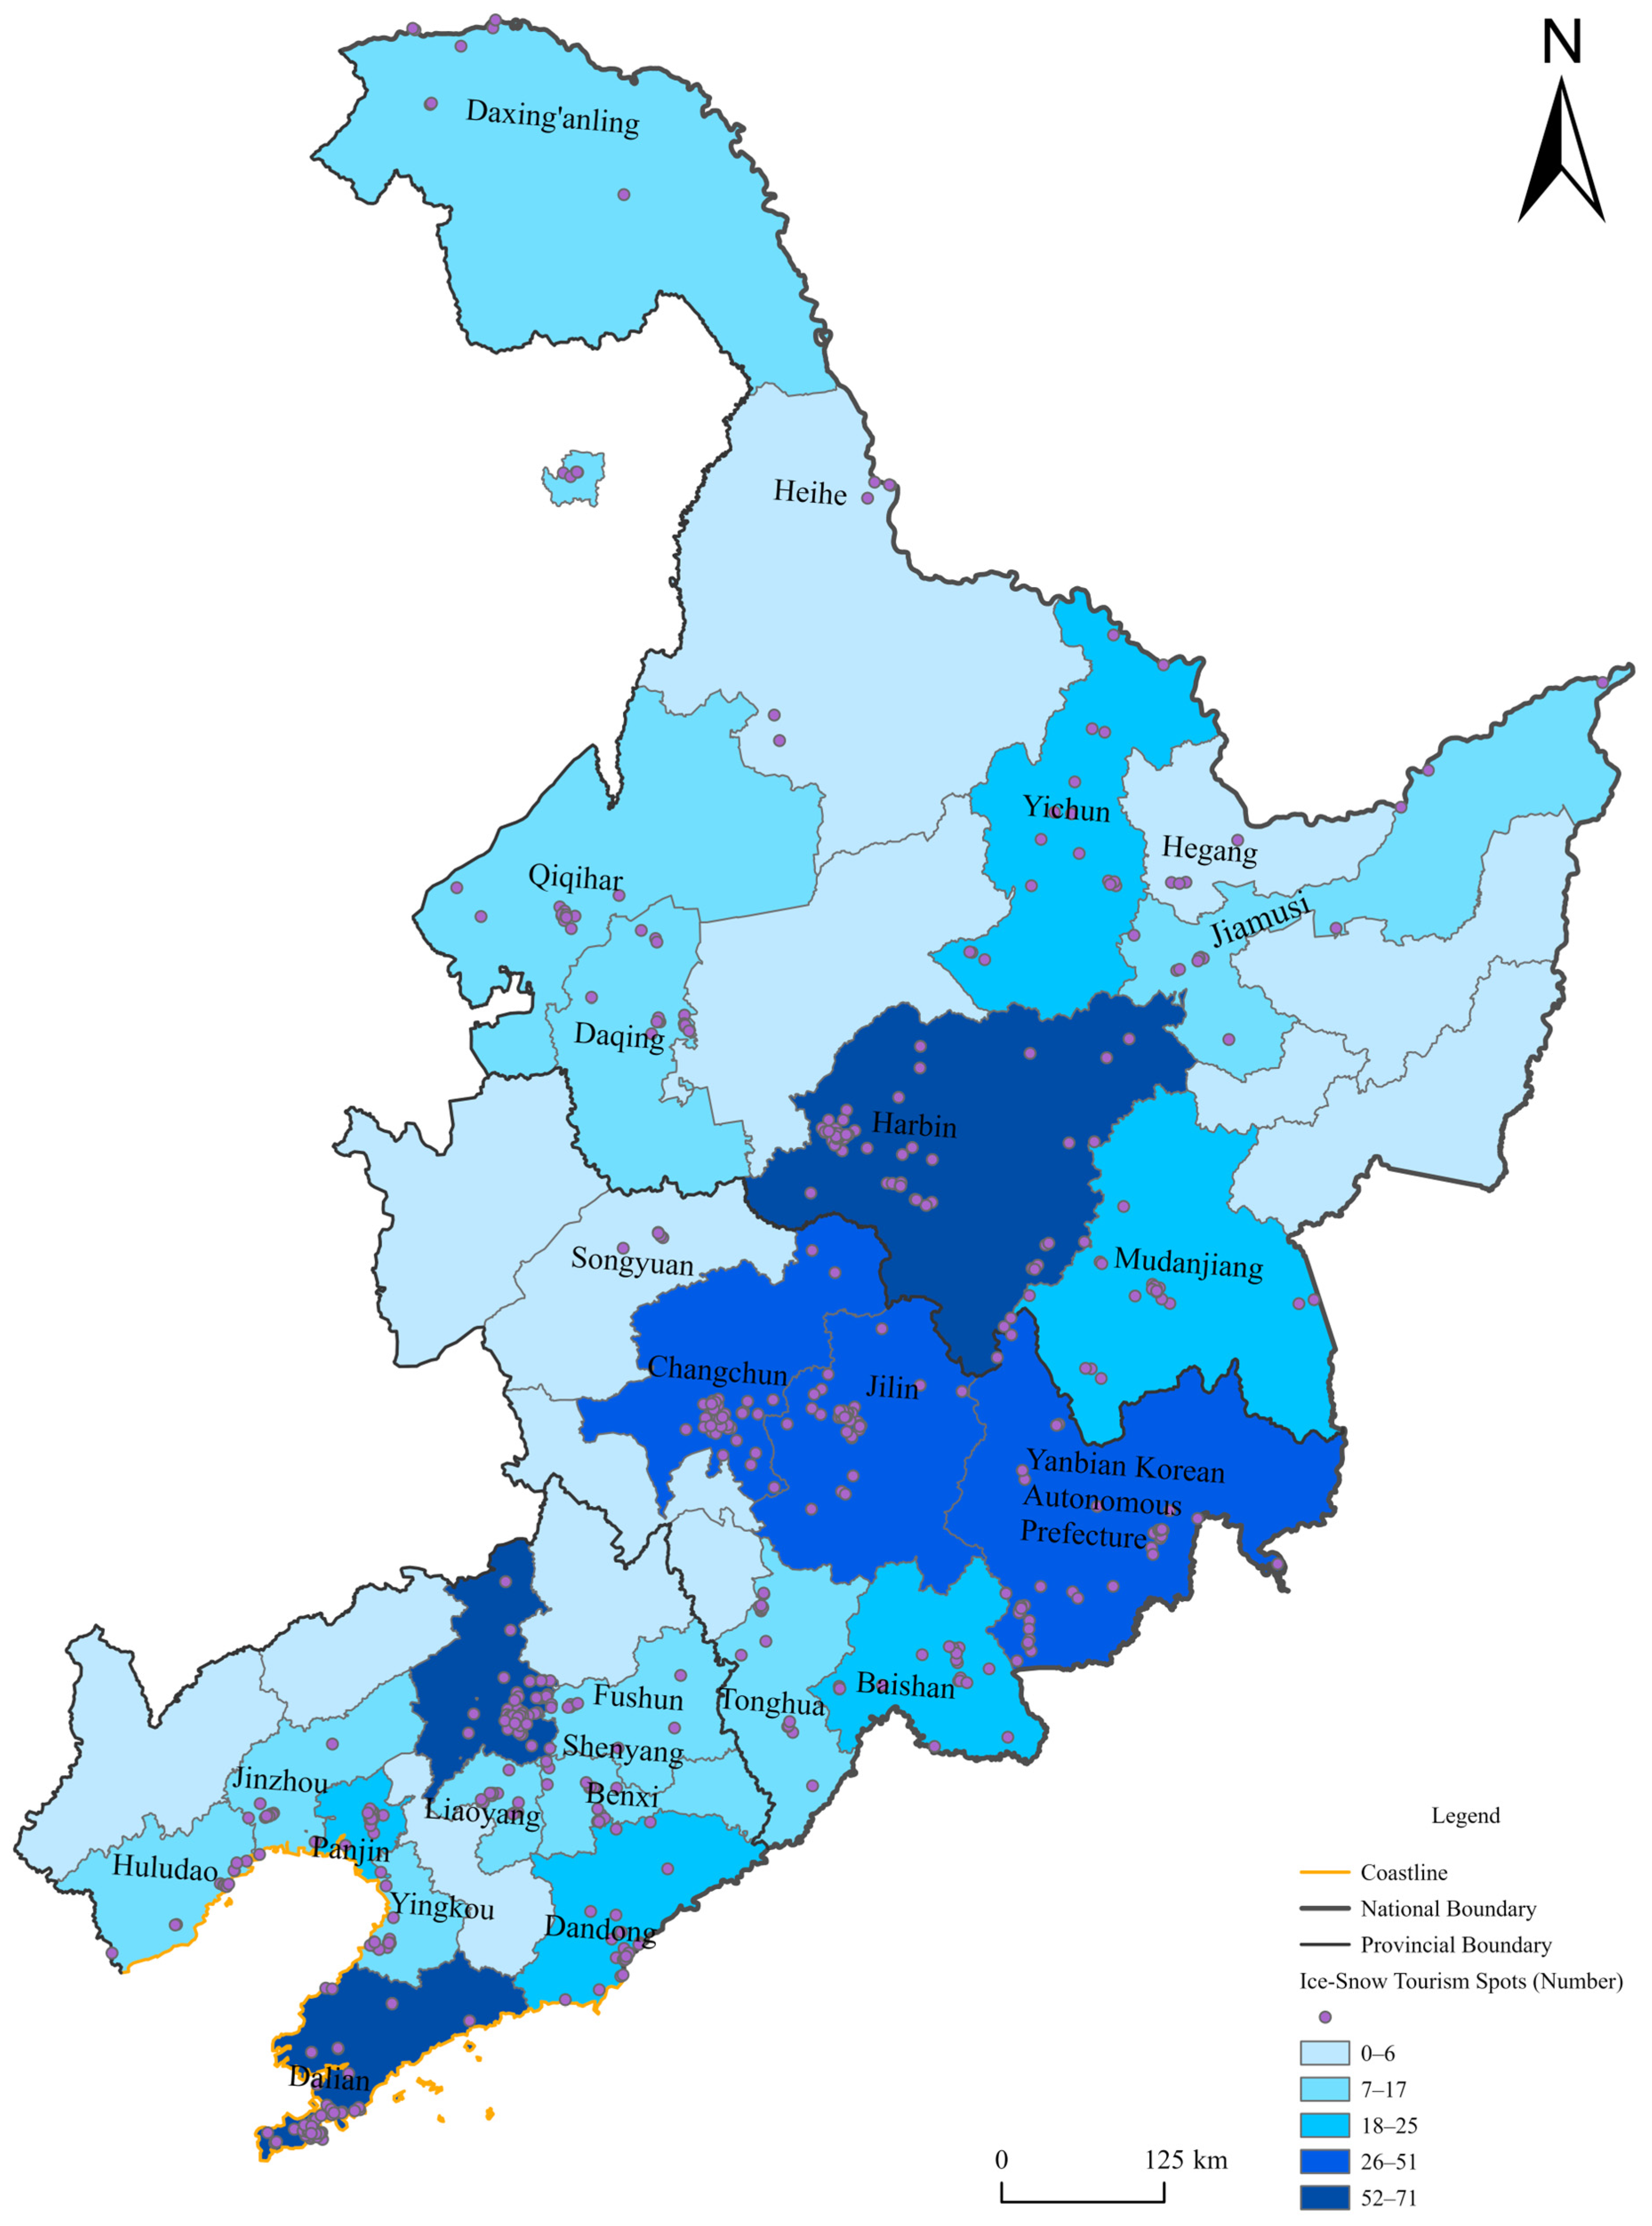
1. Introduction
Ice–snow tourism, which relies on ice–-snow landscapes to develop sightseeing, sports, research and study expeditions, and other business formats, is a distinctive form of ecotourism that generates comprehensive economic, social, and ecological benefits [
1,
2]. The current vigorous development of diverse ice–-snow tourism business formats is driving the continuous expansion of ice–-snow destinations worldwide [
3]. According to relevant reports [
4], during the 2023–2024 ice–-snow season, domestic ice–-snow leisure tourism received 430 million visitor trips and generated 524.7 billion yuan in revenue; the ice–-snow economy has thus become a new growth driver for regional development. Policies such as the
Implementation Plan for Promoting the High-Quality Development of Ice–snow Tourism in Northeast China have explicitly called for advancing the coordinated regional development of ice–-snow tourism [
5]. The three northeastern provinces constitute the region with the richest concentration of ice–-snow resources and the highest industrial vitality in China [
6]. However, under the influence of tourist behavioral preferences, regional tourism flows exhibit pronounced spatial polarization, and ice–-snow tourism city networks generally confront real-world challenges such as developmental imbalance, high sensitivity, and low adaptability [
3]. Identifying the spatial structure and core nodes of the Northeast ice-snow tourism collaborative network and revealing the internal mechanisms of inter-city interaction and synergy are of considerable practical significance for transforming “cold resources” into a “hot economy” and contributing to the full revitalization of Northeast China.
Symbiosis theory originated in biology [
7] and was subsequently extended to the social sciences to explain the competitive and cooperative relationships among regional units [
8,
9]. Its core tenets—interdependence, mutual benefit, and co-evolution—make it possible to conceptualize cities in tourism development as independent symbiotic units [
10]. Unlike tourism network theory, which emphasizes the description of topological structures, symbiosis theory focuses on explaining the intrinsic mechanisms of coexistence and evolution among units [
11,
12]. The integration of these two theoretical perspectives can form an integrated analytical framework of “structure identification–mechanism explanation–resilience assessment,” thereby consolidating the theoretical foundation for adopting cities as symbiotic units in this study [
13]. Tourism symbiosis research has now established a multi-dimensional analytical framework. Its spatial scales span the national, metropolitan area, urban agglomeration, urban district, and scenic spot levels. The research subjects encompass multiple stakeholders, including governments, tourism enterprises, tourists, and community residents. The field also analyzes the symbiotic linkages between tourism and industries such as transportation, accommodation, rural, cultural, and media sectors [
14], and explores the symbiotic logic at both material and spiritual levels between tourism resources and diverse resources [
15,
16]. Grounded in differentiated ice–snow resources, tourist source markets, and industrial foundations, cities across Northeast China have formed an inter-city interaction system characterized by interdependence, complementary advantages, risk sharing, and co-evolution through spatial proximity and factor exchange, thereby providing ample theoretical and practical justification for treating them as symbiotic units.
Ice–snow tourism research has now developed into a mature system, with relevant findings primarily centered on climate response, sustainable development, and destination adaptation strategies [
17]. Global warming has triggered problems such as shortened snow seasons and reduced snow cover extent [
18], imposing rigid constraints on ice–snow tourism [
19]. Some scholars predict that by 2050, the number of operable days for ski resorts at low and medium altitudes will approach zero [
20]. Climatic fluctuations also redirect tourist flows [
21] and compress the range of suitable locations for hosting ice–snow events [
22]. Although artificial snowmaking can compensate for the insufficiency of natural snow resources, it exacerbates water consumption and carbon emissions [
23], creating a vicious cycle of “snow shortage → expanded snowmaking → high carbon emissions” [
20], which further reduces the operational stability of destinations [
21]. Some scholars have proposed strategies such as diversifying tourism products, integrating winter experiences, and weakening seasonal constraints to enhance destination adaptive capacity [
22]. In fact, tourist source sharing, facility sharing, and brand co-construction can effectively disperse climate risks and reduce carbon emissions, indicating that the sustainable development of ice–snow tourism needs to shift from “isolated adaptation at individual scenic areas” to “regional collaborative symbiosis” [
24]. Ice–snow tourism research is thus progressively moving from single-case analyses to studies on the linked development of large urban agglomerations.
Tourism destination systems possess spatiotemporal complexity [
25], and complex network methods, by virtue of their strengths in analyzing system structure, have become mainstream research tools in the tourism field. Related research has extended from early policy [
26] and management applications [
27] to theoretical dimensions such as network structure, dynamic evolution, and operational mechanisms [
28,
29]; at present, complex network approaches also provide methodological support for regional cultural and tourism integration [
30] and for the collaborative development of tourism in urban agglomerations [
31,
32]. Network resilience is generally understood as the capacity of a network system to cope with disturbances, maintain its stability, and sustain normal structural functioning when subjected to multiple internal and external perturbations [
33]. Resilience assessment based on complex network theory proceeds along three lines: at the static level, topological indicators such as network density, clustering coefficient, and centrality are used to evaluate the inherent structural stability potential of the network [
34,
35,
36]; at the dynamic level, shock scenarios such as random attack and deliberate attack are constructed to observe changes in network connectivity efficiency and transmission capacity [
37,
38]; and at the recovery level, the temporal characteristics of network structure reconstruction and visitor flow linkage restoration are tracked after shocks subside [
13,
39]. Drawing on the operational characteristics of the ice–snow tourism symbiotic system, this paper defines network structural resilience as a comprehensive capacity encompassing three stages: buffering and resisting external disturbances, self-adaptive maintenance of system stability, and restoration and optimization for system upgrading. Its core objective is to safeguard network topological integrity and ensure the continuity of regional tourism activities under multiple disturbances. This conceptualization can be used to measure the disturbance resistance level, nodal dependency degree, and sustainable development potential of the Northeast ice–snow tourism symbiotic network. Although resilience assessment has advanced from static analysis to dynamic simulation, post-disturbance process evaluation remains insufficient [
13], and existing studies are largely conducted in the context of integrated tourism development or regional economic integration [
39], lacking targeted discussion of the symbiotic logic of strongly climate-constrained and highly seasonal specialty resources such as ice–snow tourism.
Taking cities as the basic nodes, this paper constructs an ice–snow tourism symbiotic network for the three northeastern provinces, identifies nodal roles and spatial structure, and further analyzes the dynamic interaction mechanisms and co-evolutionary logic among cities. The research contents are as follows: (1) Measuring the symbiotic linkage intensity between cities, identifying node hierarchies, the core–periphery structure, and community distribution patterns, and revealing the overall structural characteristics of the network; furthermore, an in-depth analysis of the formative factors of network structure is conducted; (2) Establish multiple disturbance scenarios to track dynamic changes in network connectivity and transmissibility, and analyze node dependencies and network structural vulnerability responses; (3) Conduct structural optimization and reconstruction simulations via node addition and strengthening, and propose optimization strategies for the coordinated development of ice–snow tourism in Northeast China.
4. Research Methods
This study proceeds in three progressive stages: network construction, structure identification, and vulnerability assessment. In the first stage, research samples are screened using textual data from OTA platforms. The entropy weight method is applied to measure the comprehensive ice–snow tourism level of each city, and the gravity model is employed to quantify inter-city symbiotic linkage intensity, thereby completing the construction of the symbiotic network. In the second stage, social network analysis tools are used to reveal the node hierarchy, spatial pattern, and community structure of the network through centrality measurement, core–periphery analysis, and CONCOR clustering. In the third stage, two types of simulation scenarios—random attacks and deliberate attacks—are designed to identify structurally weak links in the network. Node addition and weight strengthening strategies are then introduced to test potential optimization pathways. These three stages sequentially address the three progressive research objectives of this study: sample city screening, network structure quantification, and assessment of system disturbance resistance.
4.1. Analysis of Traffic Accessibility
Transport accessibility is a key indicator of connectivity between tourism destinations [
51]. This study adopts the weighted average travel time to measure urban transportation accessibility. This indicator reflects the average level of the shortest travel time between two cities. A lower indicator value indicates better urban accessibility and a closer connection; conversely, a higher value indicates a weaker connection. The calculation formula is as follows:
In the formula, Ai represents the weighted average travel time in the transportation network for city i (min); Tij is the shortest time distance from city i to city j (min), obtained based on the shortest path analysis module of ArcGIS Pro 3.5.2; Mj is the total tourism income of city j (108 yuan); n is the total number of cities excluding point i. The smaller the value of Ai is, the better the accessibility of the city is.
4.2. Tourism Symbiosis Linkage Model
A regional tourism destination is a complex system composed of multiple elements and spatial units, with symbiotic development as its core operational characteristic. Within the theoretical framework of symbiosis, the quality of symbiotic units, the efficiency of the symbiotic interface, and the mode of symbiotic organization jointly determine the operational state of the symbiotic system. Urban tourism functional level can represent the comprehensive quality of symbiotic units, while inter-city transportation accessibility can reflect the flow efficiency of the symbiotic interface. The combination of these two dimensions serves to quantify the potential interaction intensity among symbiotic units. The dynamic linkages of multi-dimensional networks—including policy, management, transportation, and information—drive symbiotic units to form a closely connected symbiotic network system of tourism destinations [
52]. Urban tourism functional level reflects the degree of tourism development and its capacity to radiate and drive surrounding areas [
53], and can thus serve as a basis for measuring the symbiotic organization mode of urban agglomeration tourism. Given that traditional gravity models for symbiosis measurement often adopt a single economic indicator [
13], and with reference to the literature on urban functional levels, this study constructs an index system for urban ice–snow tourism functional level (
Table 2). The selection of indicators follows a three-dimensional logic of “economic output–development potential–environmental support” and is specifically optimized for ice–snow tourism, distinguishing it from general regional tourism: the number of urban ice–snow patents is used to represent the iterative level of specialized technologies such as ice–snow equipment manufacturing and snowmaking operation and maintenance; the air quality index replaces a general greening indicator to measure the atmospheric environmental quality on which winter ice–snow tourism depends; and a medical bed indicator is added to address the safety and security needs arising from the high sports risks of ice–snow activities. The above indicators are objectively weighted using the entropy method to calculate the comprehensive ice–snow tourism functional level index for each city. The formula is as follows:
In the formula, Ea represents the tourism energy level index of city a, Wj is the weight of indicator j, and Yaj is the dimensionless value of indicator j for city a.
Based on this, to further quantify the level of inter-city tourism symbiotic linkage, this study uses symbiotic linkage intensity to represent the degree of symbiotic association between nodes, with a higher value indicating a closer symbiotic relationship. Drawing on the classical analytical paradigm of spatial economic linkages, the gravity model is adopted to measure it, and the aforementioned comprehensive capacity index is introduced into the model to enhance explanatory power. Meanwhile, the shortest inter-city travel time is employed to represent spatial accessibility, and a modified ice–snow tourism symbiotic linkage intensity model is established:
In the formula,
TCab represents the urban tourism correlation index between city
a and city
b;
Ea,
Eb are the urban tourism energy level indices of city
a and city
b, respectively; T
ab is the shortest transportation time between the two places. Equation (3) adopts the geometric mean
of the tourism functional level indices of two cities as the mass term. This is a standard formulation of the gravity model in spatial interaction research and has been employed in existing studies on urban agglomeration tourism symbiosis with the same formula specification. The square-root geometric mean can smooth numerical disparities between high- and low-functional-level cities, thereby preventing a single high-functional-level node from dominating the overall network structure measurement and more objectively reflecting the potential for core–periphery collaborative linkages [
54]. After constructing the network based on this indicator, the subsequent centrality analysis and core–periphery identification are used to reveal the hierarchical dominance relationships and spatial polarization characteristics of network nodes, while the vulnerability assessment further examines the stability boundaries of the network under external shocks. These two steps respectively address the core propositions of symbiosis theory regarding “how symbiotic units are linked” and “how the symbiotic system persists.”
4.3. Measure of Network Structure Dependence Based on Interference Scenario Simulation
Network structural vulnerability assessment, informed by the literature, examines the network’s capacity to sustain connectivity and transmissibility under node failure scenarios; this study additionally introduces growth, hierarchy and assortativity for auxiliary analysis. In scenario simulation [
11], two node removal strategies are adopted, namely random failure (random uniform node elimination) and deliberate attack (prioritized removal of critical nodes). The variations in network connectivity and transmissibility after node removal are simulated stepwise under mild, moderate and severe disturbance levels, and the average value of 50 simulation runs is adopted as the final result. The calculation formula for connectivity is presented as follows:
In the formula,
R represents connectivity, indicating the state of connectivity;
Cmax, the maximum number of connected nodes in the network,
n −
n′, the difference in the number of nodes before and after deletion. If any two nodes are mutually reachable, the graph is a completely connected graph. If the deletion of nodes or edges causes the current network level to disconnect but does not affect the connectivity of the next level, the largest connected subgraph at this point contains the maximum number of nodes. The connectivity calculation formula is as follows:
In the formula, E represents the network’s fragility, n is the number of nodes, i, j, respectively represent any different nodes belonging to the G node set in the same network, dij indicates the minimum distance number between the two nodes, and the model operation is performed using Python 3.14. During the preparation of this manuscript, DeepSeek-V3 was used to assist in Python code debugging and optimization, specifically for the network robustness simulation component. The AI was primarily employed for syntax error correction in code related to network centrality calculation and attack simulation.
5. Results
5.1. Spatial Accessibility Analysis
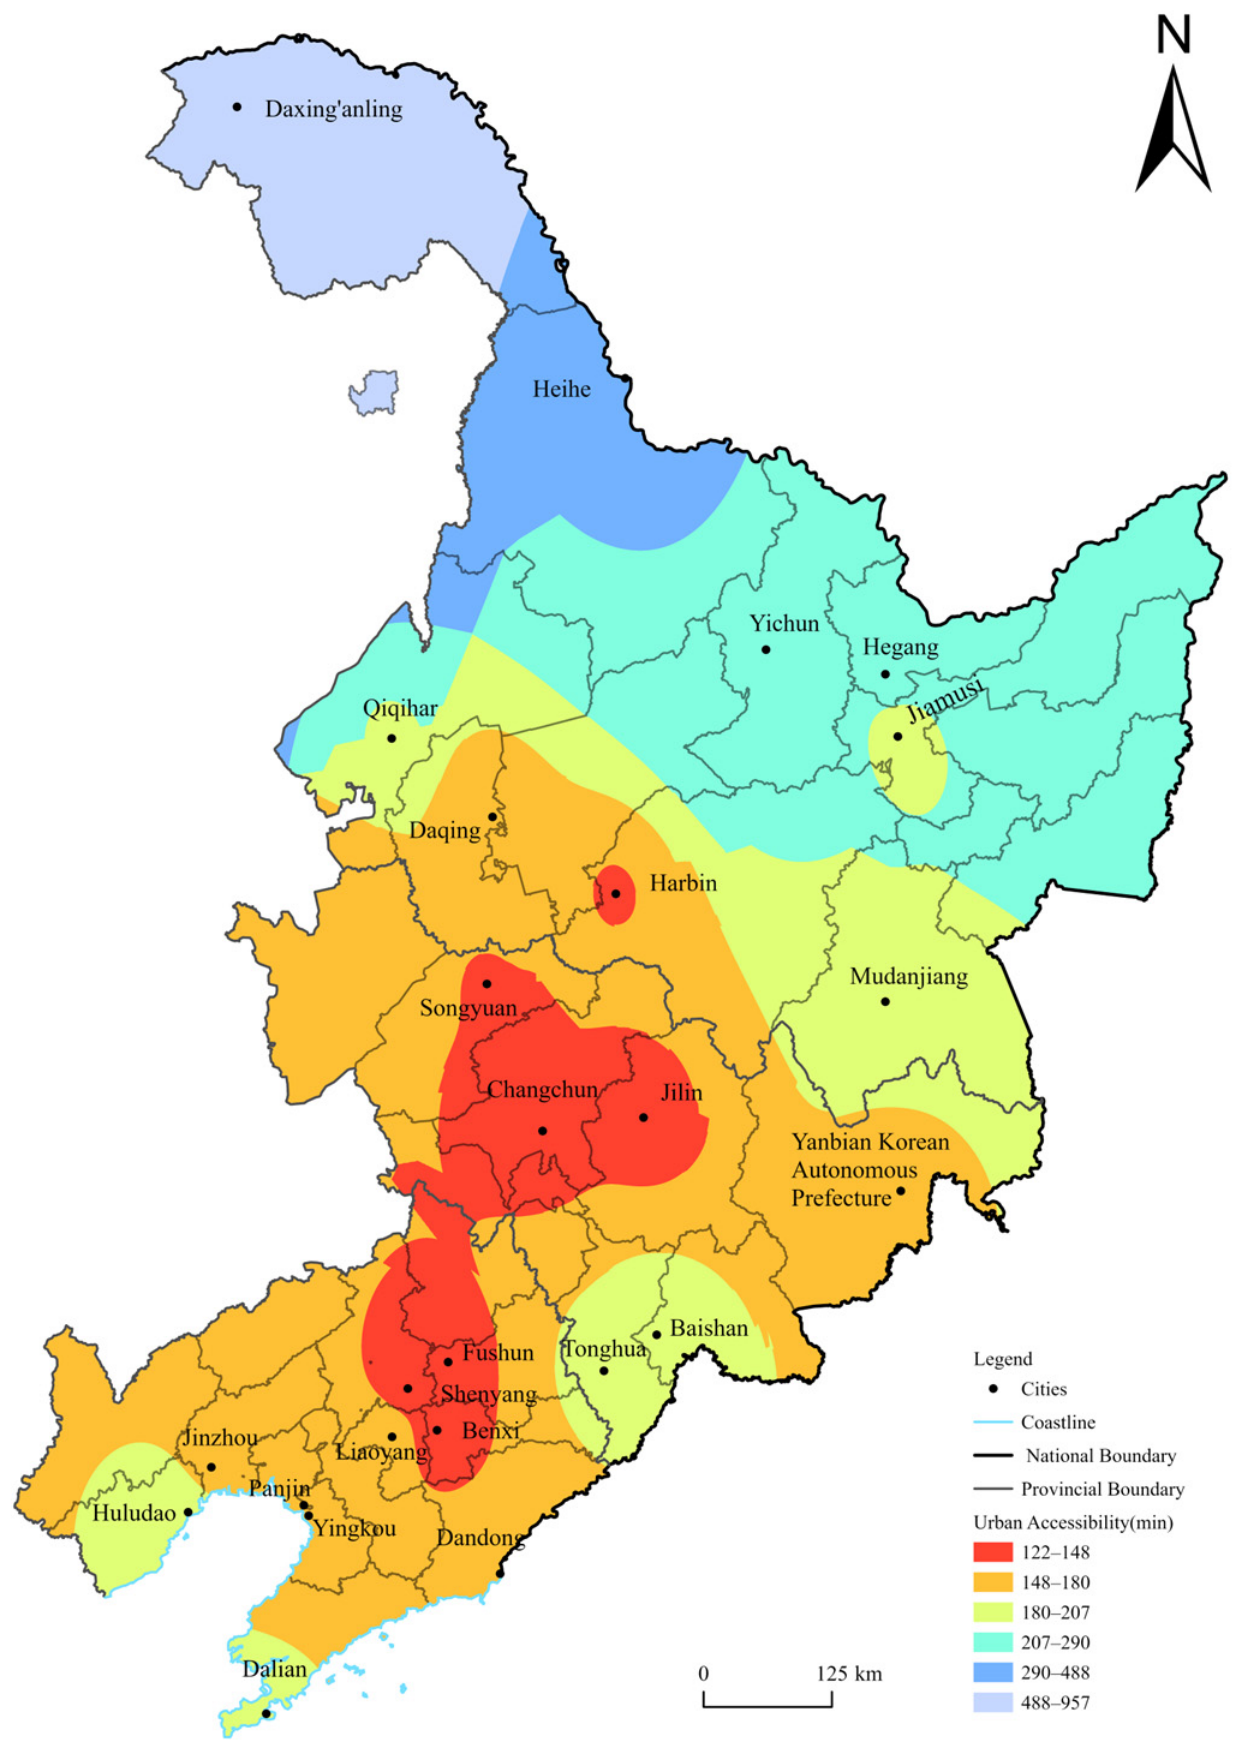
Based on Equation (1), the weighted average travel time for ice–snow tourism cities in Northeast China in 2024 was calculated. By integrating highway and railway network data and assigning standard speeds to different road grades, a quantitative assessment of the transportation accessibility of 25 cities was conducted. The accessibility of each city exhibits significant spatial differentiation and is categorized into six gradient levels according to the calculated values (
Figure 4). The areas with the highest accessibility are concentrated in the core city clusters of Jilin and Liaoning, with Changchun, Benxi, Fushun, Jilin, Shenyang, and Harbin ranking in the top six, reflecting their well-developed transportation infrastructure and centrality advantages. Cities with moderate accessibility are distributed in central–southern Liaoning and the border zone between Jilin and Heilongjiang, including Jinzhou and Dandong; their transport connectivity is affected by both regional development imbalances and geographical location. Some economically developed cities, such as Dalian, are constrained by their location at the tip of the peninsula, resulting in a marked increase in weighted average travel time, which highlights the decisive influence of geographical location on accessibility.
Areas with poor accessibility are mainly situated along provincial peripheries and border zones. Cities such as Mudanjiang and Jiamusi are constrained by low road network density and topographic conditions; Baishan, Yichun, Heihe, and the Daxing’anling Prefecture form the bottom tier, with Daxing’anling Prefecture, as China’s northernmost prefecture, exhibiting the weakest accessibility. An accessibility spatial analysis map was generated using the inverse distance weighting method in ArcGIS. The results reveal a concentric ring structure in which the accessibility of ice–snow tourism cities diminishes progressively from the center to the periphery, with pronounced north–south disparities; in the north, accessibility exhibits a banded distribution. The Daxing’anling Prefecture area has a sparse road network and weak accessibility. Changchun, Shenyang, and Harbin form the core ring, are situated along the high-speed railway corridor to Beijing, enjoy excellent accessibility, and radiate influence on surrounding areas. Baishan, Huludao, and Dalian are located on the periphery of the network and have relatively weak accessibility. From the perspective of tourism symbiosis theory, this accessibility spatial pattern serves as the underlying precondition for the differentiated development of inter-city ice–snow symbiosis intensity.
5.2. Intensity of Tourism Symbiosis Linkage
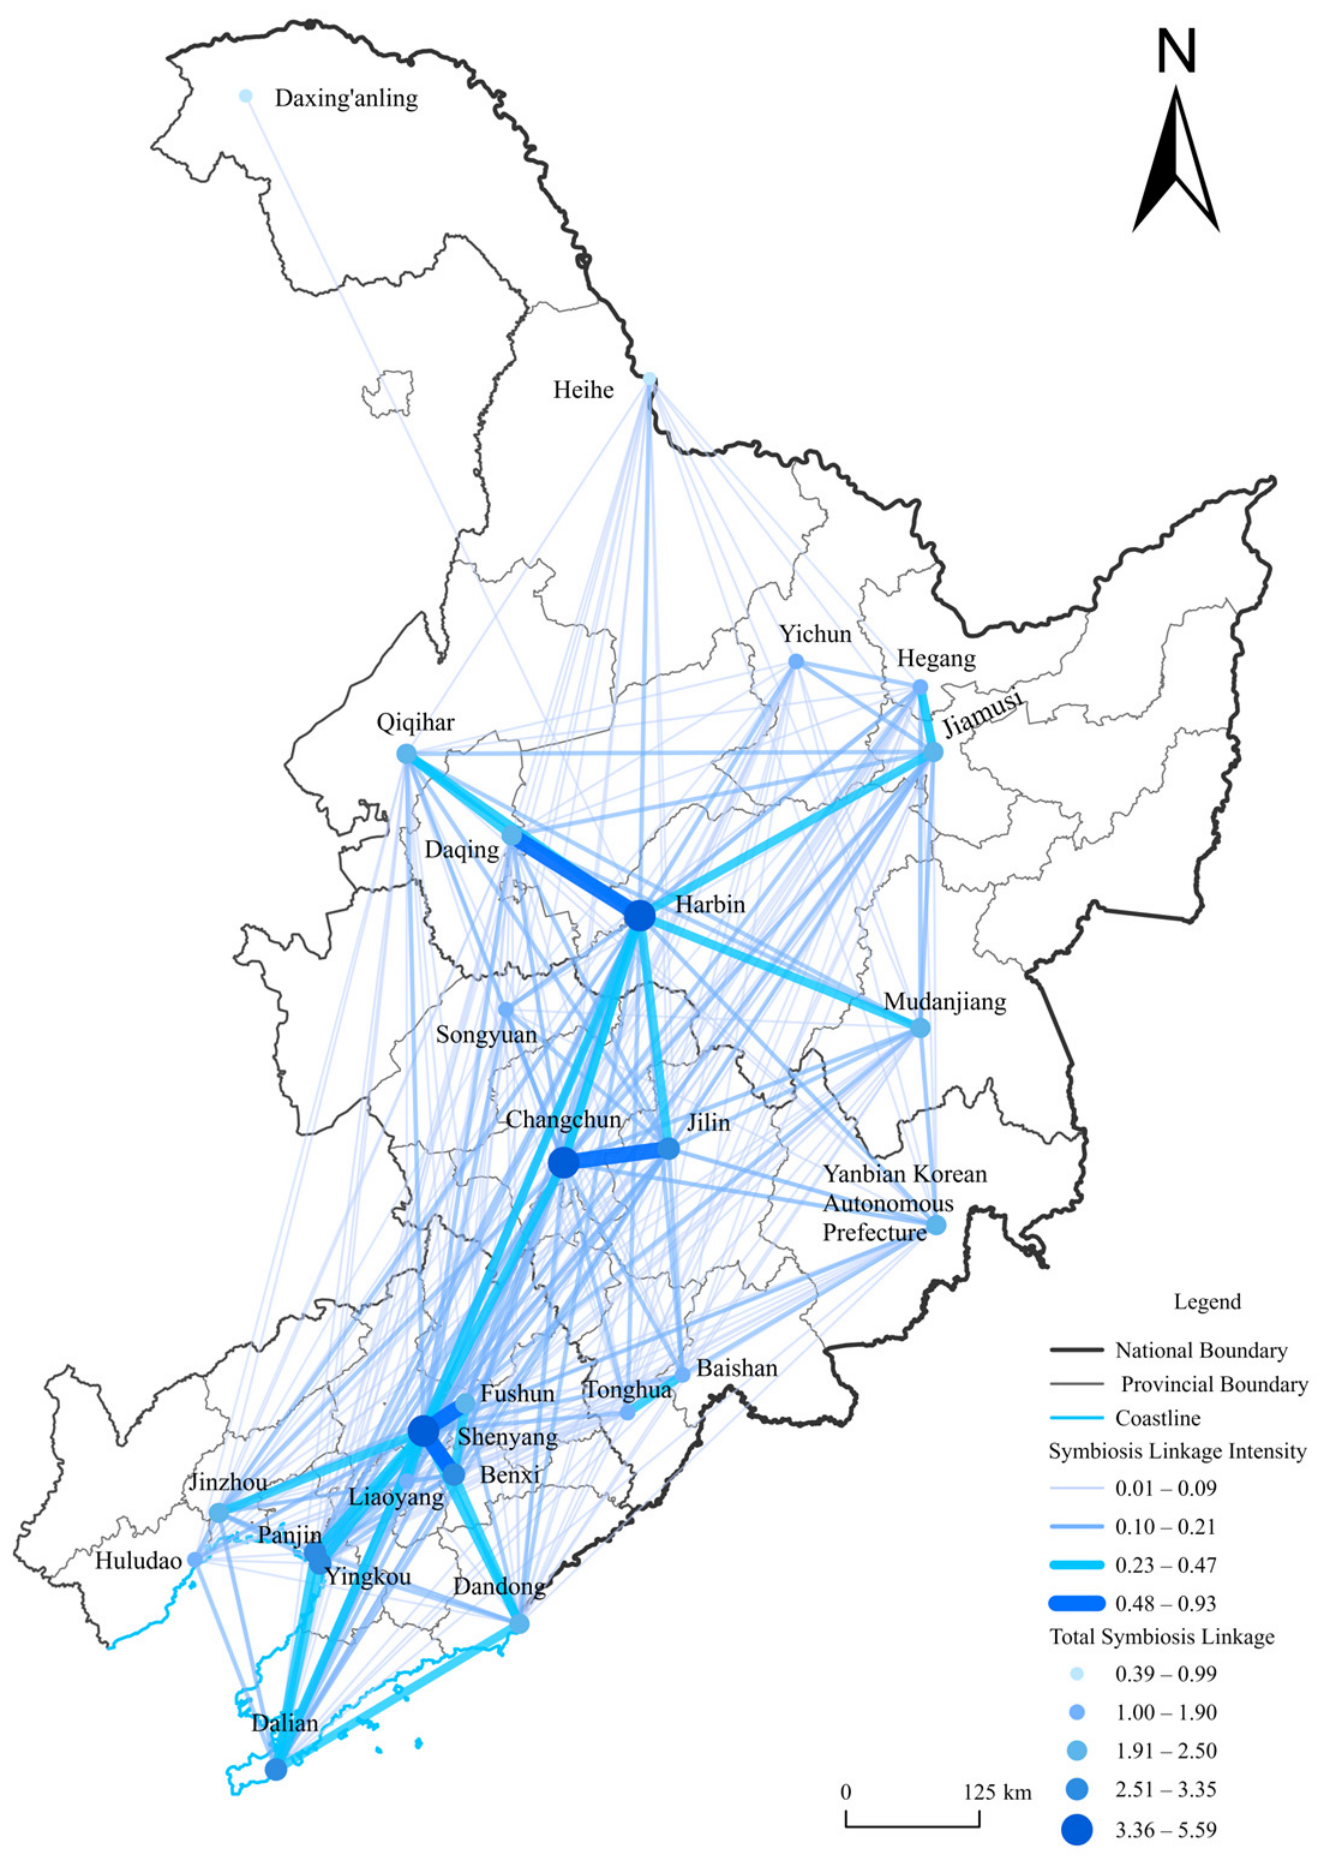
Using the comprehensive urban tourism functional level index and travel time distance, the inter-city tourism symbiotic linkage intensity was calculated using Formula (3) and then classified into four grades by the natural breaks method, integrated symbiosis (0.48–0.93), continuous symbiosis (0.23–0.47), intermittent symbiosis (0.10–0.21), and spot symbiosis (0.01–0.09) (
Figure 5). Among all 300 city-pairs, only five exhibit integrated symbiosis (Shenyang–Benxi, Shenyang–Fushun, Panjin–Yingkou, Changchun–Jilin City, Harbin–Daqing), 21 pairs show continuous symbiosis, intermittent symbiosis accounts for 28%, and spot symbiosis makes up 63.3%. This indicates that the ice–snow tourism symbiotic system in Northeast China is at an intermediate stage of development overall, where most cities have established stable or semi-stable interactive relationships, but the network coverage remains uneven.
Spatially, symbiotic connection intensity exhibits a pronounced distance decay effect. High-intensity connections are concentrated between provincial capitals and adjacent prefecture-level cities within a transport distance of 150 km and a travel time of less than 1.5 h. In the central–southern Liaoning urban agglomeration, high-intensity city-pairs account for 67.4%, forming a polycentric, high-density integrated network. In contrast, the average connection intensity of Heihe, Hegang, Yichun, and Daxing’anling Prefecture in the north is far below the regional average, displaying an “isolated island” pattern. Taking the Daxing’anling Prefecture as an example, the area possesses abundant ice–snow forest scenery and Sino-Russian border cultural charm, indicating a relatively high endowment of tourism resources. However, the total symbiotic connection intensity of this prefecture is lower than that of the Harbin–Changchun pair alone, ranking the lowest in the entire region. Notably, symbiotic intensity is not solely determined by transportation. The study identifies two types of cities that compensate for transportation disadvantages through distinctive resources. The first type is economically compensated cities, represented by Dalian. Although significantly constrained by its location at the southern tip of the Liaodong Peninsula, Dalian has become a major tourist city in the region by leveraging its infrastructure, reputation, and differentiated cultural tourism products combining marine, ice–snow, and hot spring resources. The second type is resource-compensated border cities, represented by Jiamusi and Mudanjiang. These cities rely on their border location adjacent to Russia and distinctive resources such as Jingpo Lake and ice–snow forests, achieving notably higher symbiotic interaction intensity than other cities under comparable transportation conditions.
The pronounced disparities in tourism functional levels further exacerbate the polarization of symbiotic intensity. Harbin, Changchun, Shenyang, and Dalian belong to the top tier, while Hegang, Heihe, and Daxing’anling Prefecture rank at the bottom, resulting in a precipitous drop in symbiotic connections between these two categories of cities. The radiation from high-level cities exhibits selective diffusion, preferentially benefiting medium-level cities with convenient transportation. Such distance decay and selective radiation indicate that the network is currently at a polarization stage, with limited structural robustness reserves. Once core nodes fail, peripheral cities are unable to maintain tourist flows through alternative pathways.
To clarify the driving mechanisms of inter-city ice–snow tourism symbiosis in Northeast China and to distinguish between traditional gravity effects and regional symbiotic synergies, this study constructs a hierarchical regression model. A total of 300 city-pairs formed by pairwise combinations of 25 prefecture-level cities are selected as observation samples, with inter-city ice–snow tourism symbiosis intensity set as the dependent variable. Model 1 incorporates two classical gravity factors—travel time and the product of comprehensive urban tourism functional level—to test basic spatial interaction characteristics such as distance decay and scale polarization. Model 2 introduces two symbiotic indicators reflecting institutional and spatial proximity—“same province” and “geographic adjacency”—while controlling for all gravity variables. The regression results show that the coefficients of the two newly added variables are 0.045 and 0.055, respectively, with p-values below 0.01, significant at the 1% level. Even when inter-city travel distance is held constant, provincial-level policy coordination and cross-provincial ice–snow industry linkages can form driving pathways independent of geographic distance, demonstrating that symbiosis theory offers superior explanatory power over traditional gravity models in accounting for cross-administrative boundary tourism interactions.
5.3. Analysis of Symbiotic Network Complexity
5.3.1. Analysis of Network Node Characteristics
To comprehensively evaluate the nodal characteristics of the ice–snow tourism symbiotic network, this study selects three commonly used centrality indicators: degree centrality, closeness centrality, and betweenness centrality. Two complementary approaches are adopted for network construction: (1) a weighted network, which directly uses the original symbiotic linkage intensities as edge weights to preserve complete intensity gradient information; and (2) a binary network, which applies a threshold equal to the mean symbiotic linkage intensity for binarization—edges with values equal to or above the threshold are assigned a value of 1, otherwise 0—to construct a binary matrix, facilitating graph-theoretic indicator calculation and core–periphery structure identification. Centrality indicators are computed using Ucinet 6. The two approaches complement each other and serve to test the robustness of the conclusions.
The centrality analysis integrating both weighted and binary networks reveals that Shenyang, Harbin, and Changchun occupy absolutely dominant positions in the ice–snow tourism network. Among them, Shenyang has the highest betweenness centrality, serving as the primary regional hub, followed by Changchun and Harbin in the second and third positions, collectively forming the “iron triangle” of the Northeast China ice–snow tourism network. Benxi and Yingkou function as secondary core nodes, exhibiting relatively high external connection intensity but limited intermediary transshipment capacity. Three typical city-pairs—Shenyang–Benxi, Harbin–Daqing, and Panjin–Yingkou—correspond to three distinct mechanisms of symbiosis formation. The Shenyang–Benxi pair, leveraging extremely short commuting distances, exemplifies transportation-driven core–periphery complementary symbiosis. The Harbin–Daqing pair, benefiting from provincial-level supportive policies and a shared ice–snow tourism public brand, represents institutionally coordinated symbiosis. The Panjin–Yingkou pair, characterized by short-distance commuting and multiple cross-city tourism routes, demonstrates industry–function complementary symbiosis. The remaining cities are distributed across semi-peripheral and peripheral tiers. The high concentration of betweenness centrality and the marked differentiation in weighted degree centrality confirm the network’s pronounced hierarchical differentiation and uneven distribution, with a small number of core nodes dominating the flow of tourism factors and the overall topological structure. The above city-pair cases confirm that symbiotic relationships are not merely products of geographic proximity or urban scale, but rather outcomes of the synergistic interactions among multiple factors—transportation conditions, institutional environments, and resource–industry complementarity—providing empirical support for the quantitative operationalization of symbiosis theory at the micro-scale. The core node rankings derived from the two network measurement approaches are highly consistent, indicating the robustness of the network’s core–periphery spatial structure. Given that social network centrality analysis is more applicable to binary networks, subsequent analyses are conducted based on the binarized association matrix [
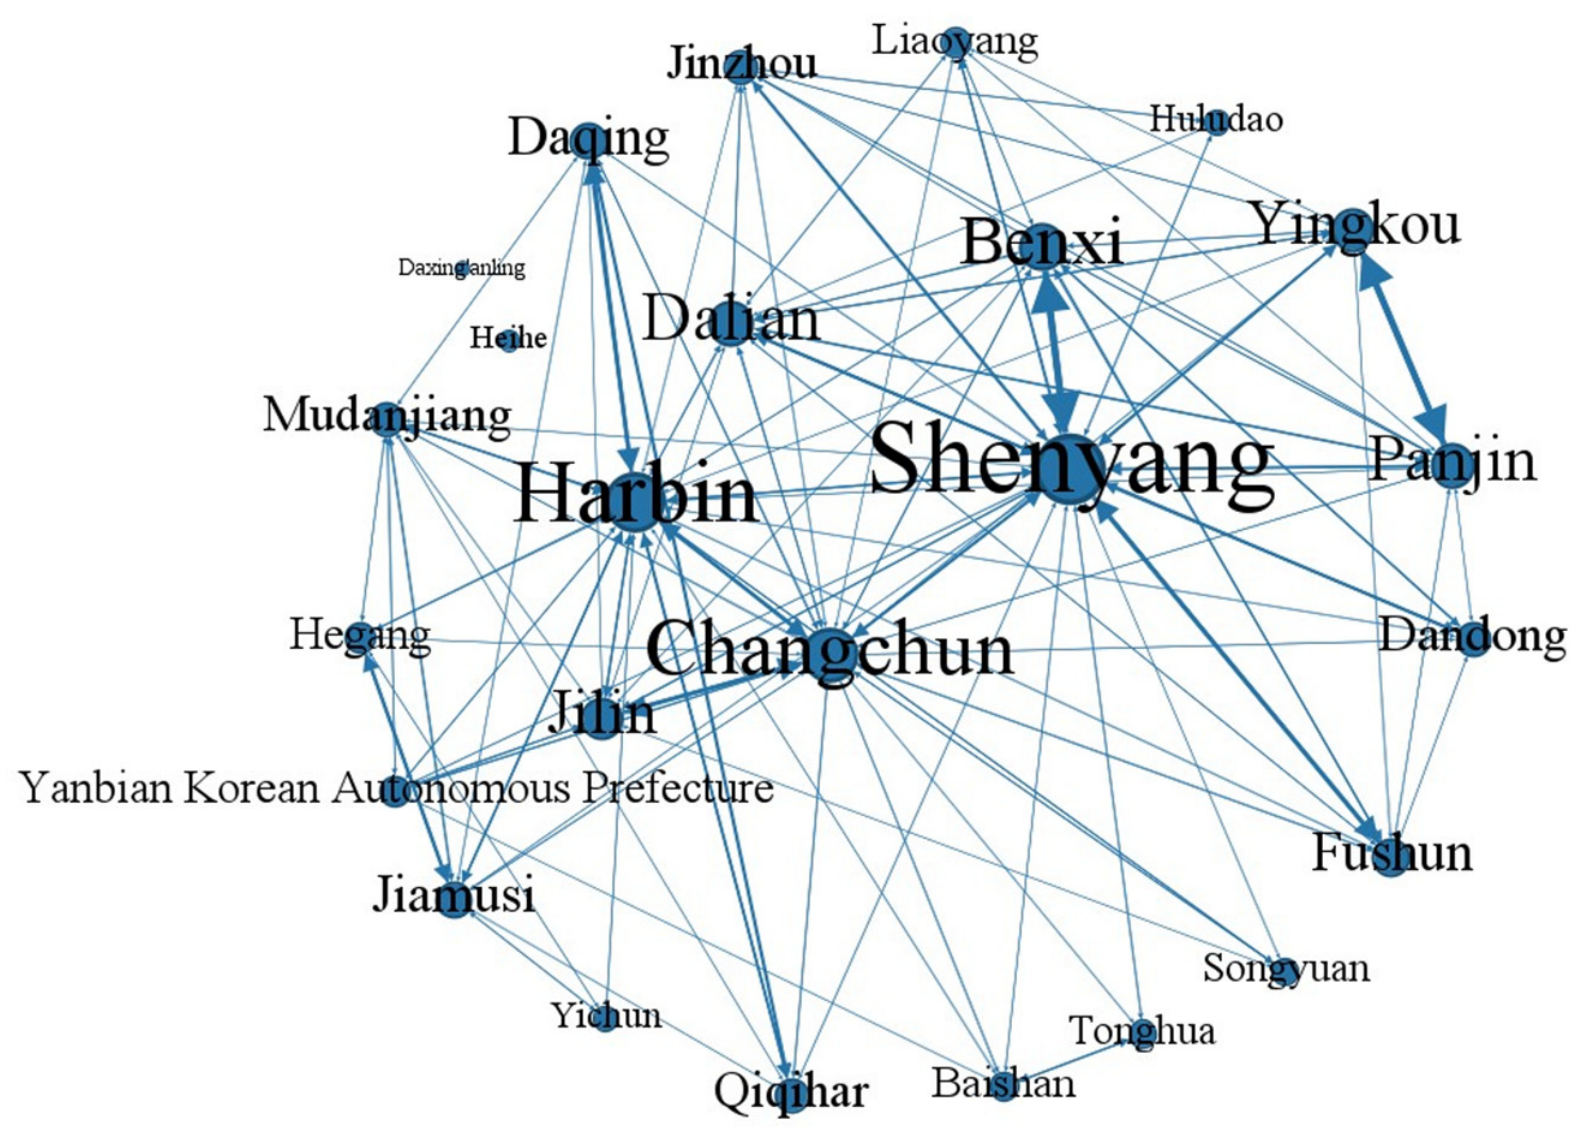
55]. The Daxing’anling Prefecture and Heihe City exhibit connection intensities below the regional average, functioning as isolated peripheral nodes. Using Gephi 9.2, this study calculates the network density and clustering coefficient, and visualizes the topological structure of the ice–snow tourism economic linkage network (
Figure 6). The topological features further corroborate the above structural patterns: geographically proximate core cities are tightly interconnected, forming bidirectional mutually beneficial symbiotic relationships, as seen in Shenyang and Benxi, whereas core cities predominantly exhibit unidirectional factor radiation toward peripheral cities—for instance, Heilongjiang’s core cities driving Heihe, Daxing’anling, and Hegang—manifesting a typical “radiation-driven” gradient development effect.
Small-world analysis (
Table 3) indicates that the network’s clustering coefficient is 0.82, twice that of a random network, demonstrating strong local agglomeration; the average path length is 1.63, close to that of a random network; and the small-world coefficient σ = 2.18 > 1 confirms that the network possesses significant small-world properties. This suggests that nodes form tightly knit clusters while achieving efficient regional coordination through key nodes, providing a sound network structure foundation for tourism information dissemination, tourist flow guidance, and resource integration. However, simulation experiments (detailed in
Section 5.4) show that the network’s connectivity declines rapidly under deliberate attacks, necessitating measures such as adding bridging nodes or strengthening the weight of peripheral nodes to enhance robustness.
5.3.2. Core-Periphery Analysis
By identifying the symbiotic degree of the network, the core–periphery structure of the urban symbiotic network was delineated, with Harbin, Changchun, and Shenyang designated as the core area and the remaining cities as the periphery area. The “core–periphery” symbiotic connection matrix (
Table 4) and the density matrix (
Table 5) were calculated. The core area fit index is 1, indicating that the core cities are highly integrated and form a tightly connected network. The periphery area fit index is only 0.18, suggesting sparse connections among peripheral cities. The overall fit index is 0.59, presenting a typical core–periphery structure. The core–periphery differentiation degree is 0.82, signifying pronounced regional polarization characteristics, which aligns with the classic core–periphery model. However, the connections between the core and the periphery are relatively weak, indicating a need to strengthen the core’s radiating and driving effect to promote balanced regional development.
The geographical detector further quantifies the explanatory power of each factor. Potential capacity and transportation accessibility are the robust core driving factors—the former reflects the spatial distribution of ice–snow resource endowments and market potential, while the latter captures the skeletal constraining role of transportation infrastructure. Although economic capacity exhibits the highest q-value, its p-value does not reach statistical significance, indicating that the explanatory power of economic scale on network status is not statistically robust; its effect can only be effectively realized when embedded within the transportation corridor. In the typical case of Benxi, a non-provincial-capital city ranking fourth in symbiosis intensity, the close alignment between its third-ranked accessibility and fourth-ranked symbiosis intensity demonstrates that when peripheral cities possess superior transportation locations, they can, to some extent, break through the structural constraints of the core–periphery pattern. Environmental support capacity, though statistically significant, shows limited explanatory power, suggesting that public service support and policy investment remain in a stage of passive adaptation rather than active shaping of the network pattern. Interaction detection reveals that the interactive q-value between transportation accessibility and potential capacity reaches 0.947, classified as two-factor enhancement, indicating that the combined effect of transportation skeleton and resource endowment constitutes the key coupling mechanism driving the core–periphery pattern. All six interaction pairs exhibit enhancement, with none showing independence or weakening, demonstrating that the core–periphery pattern results from the synergistic interaction of multiple factors—transportation, resources, economy, and policy. Although peripheral cities possess resource endowments, they lack the transportation and market infrastructure conditions necessary to translate these resources into symbiotic linkages; the synergistic configuration of multiple factors is more important than the advantage of any single factor.
5.3.3. Network Cohesive Subgroup Analysis
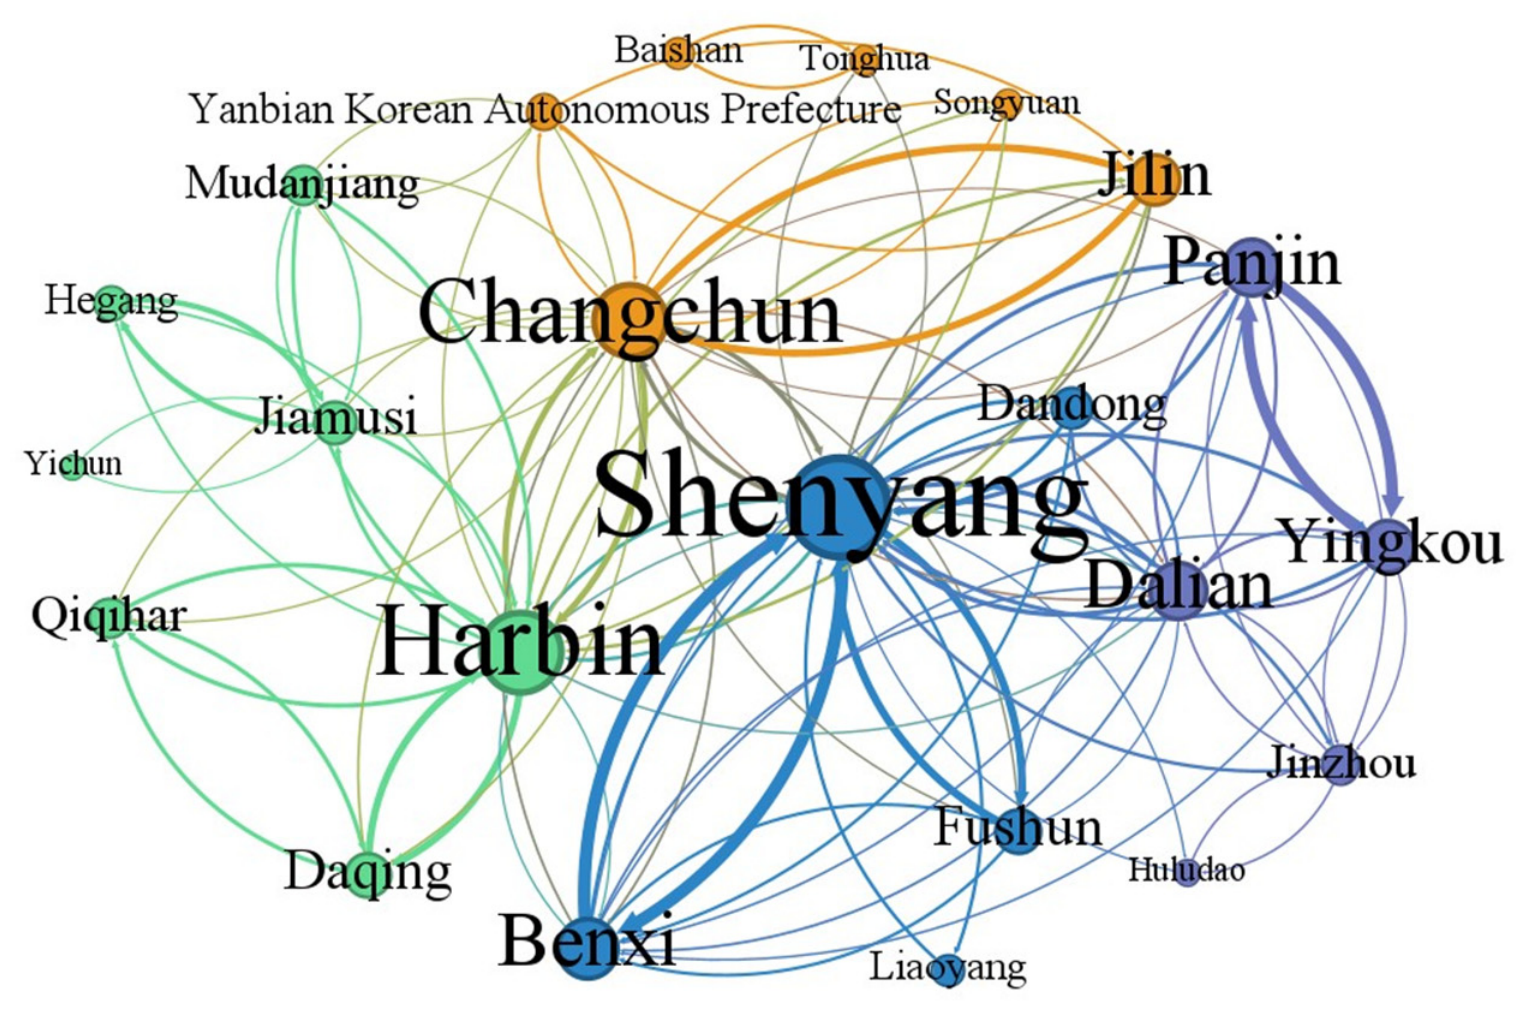
Based on standard methods in the existing literature, the CONCOR method was adopted to perform a cohesive subgroup analysis of the ice–snow tourism symbiotic network in Northeast China (
Figure 7). Since Daxing’anling Prefecture and Heihe had symbiotic linkage values with other cities below the mean and consequently had no edges in the binary matrix, they were excluded as isolated nodes, leaving 23 cities for the analysis. After this exclusion, the ranking of core nodes remained consistent with that when the isolated nodes were included, indicating that the basic structure of the core network was unaffected.
Using the mean of the original symbiotic linkage intensities as the threshold for cohesive subgroup classification, the 23 cities were divided into four subgroups (
Table 6). The inter-subgroup density matrix is shown below (
Table 7). At the low threshold, weak cross-subgroup ties were prevalent and community boundaries were blurred, with a goodness of fit of 0.39 and a modularity
Q = 0.15, indicating an insignificant community structure and a “generalized symbiosis” pattern. When the threshold was doubled, weak ties were effectively filtered out while strong internal connections were preserved; the goodness of fit rose to 0.73 and modularity
Q = 0.37 (>0.3), yielding a clear community structure that shifted to a “specialized symbiosis” pattern. The change in threshold reveals the spatial heterogeneity of tourism symbiotic intensity in Northeast China: a low threshold reflects weak inter-provincial interactions that have yet to form specialized functional clusters, whereas a high threshold screens out strong short-distance intra-provincial ties and forms stable collaborative modules based on inter-city complementarity.
The community structure of the Northeast tourism symbiotic network gradually emerges as symbiotic intensity increases. At the level of strong links, four stable communities have already taken shape, while at the level of weak links the network remains in a generalized stage. The community division results are highly consistent with the differentiated division of labor in Northeast China’s ice–snow tourism. The community boundaries are generally aligned with provincial administrative borders, a spatial differentiation pattern that matches the distinct development positioning of ice-snow tourism across the three provinces.
5.4. Network Dependency Analysis
This section first employs node failure simulations to analyze changes in network connectivity and transmissibility after nodes are subjected to shocks, thereby identifying structurally vulnerable nodes in the network. It then explores the network’s optimization potential through node addition and weight strengthening simulations, compares the improvement effects of these two optimization approaches on the network structure, and completes the structural optimization assessment. Together, these two steps form a complete analytical chain that integrates both problem diagnosis and path optimization.
5.4.1. Sequential Node Failure
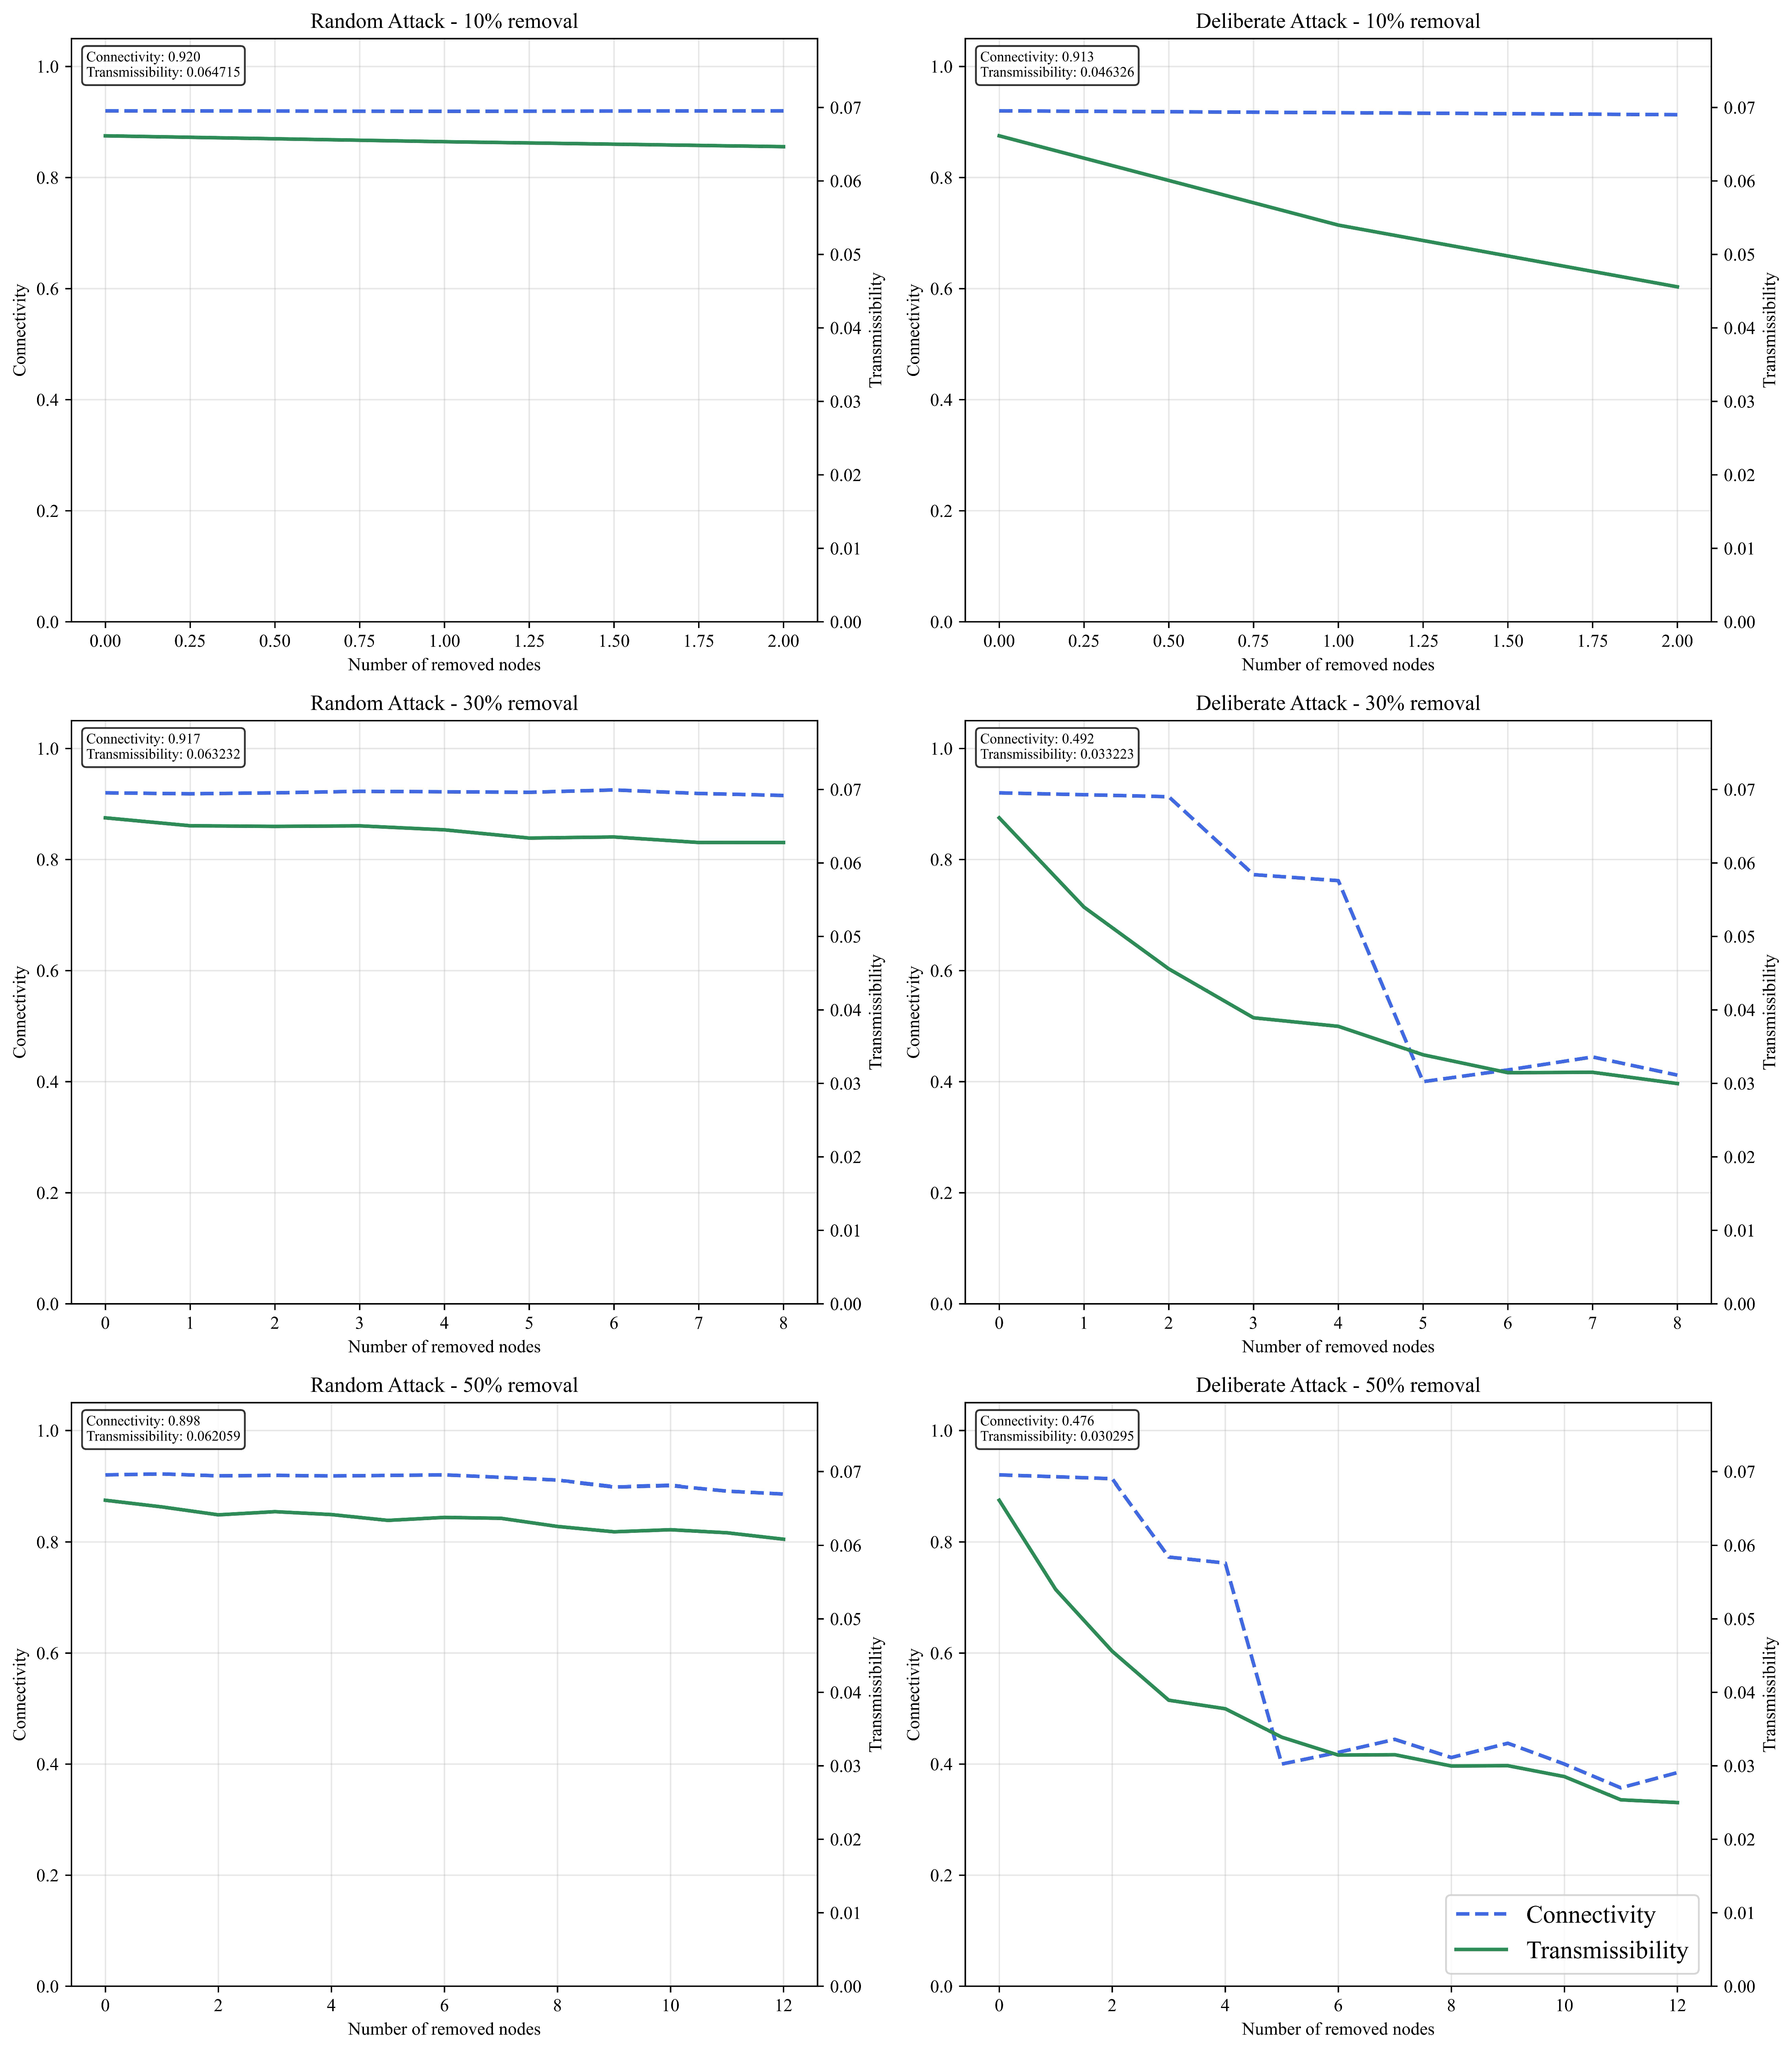
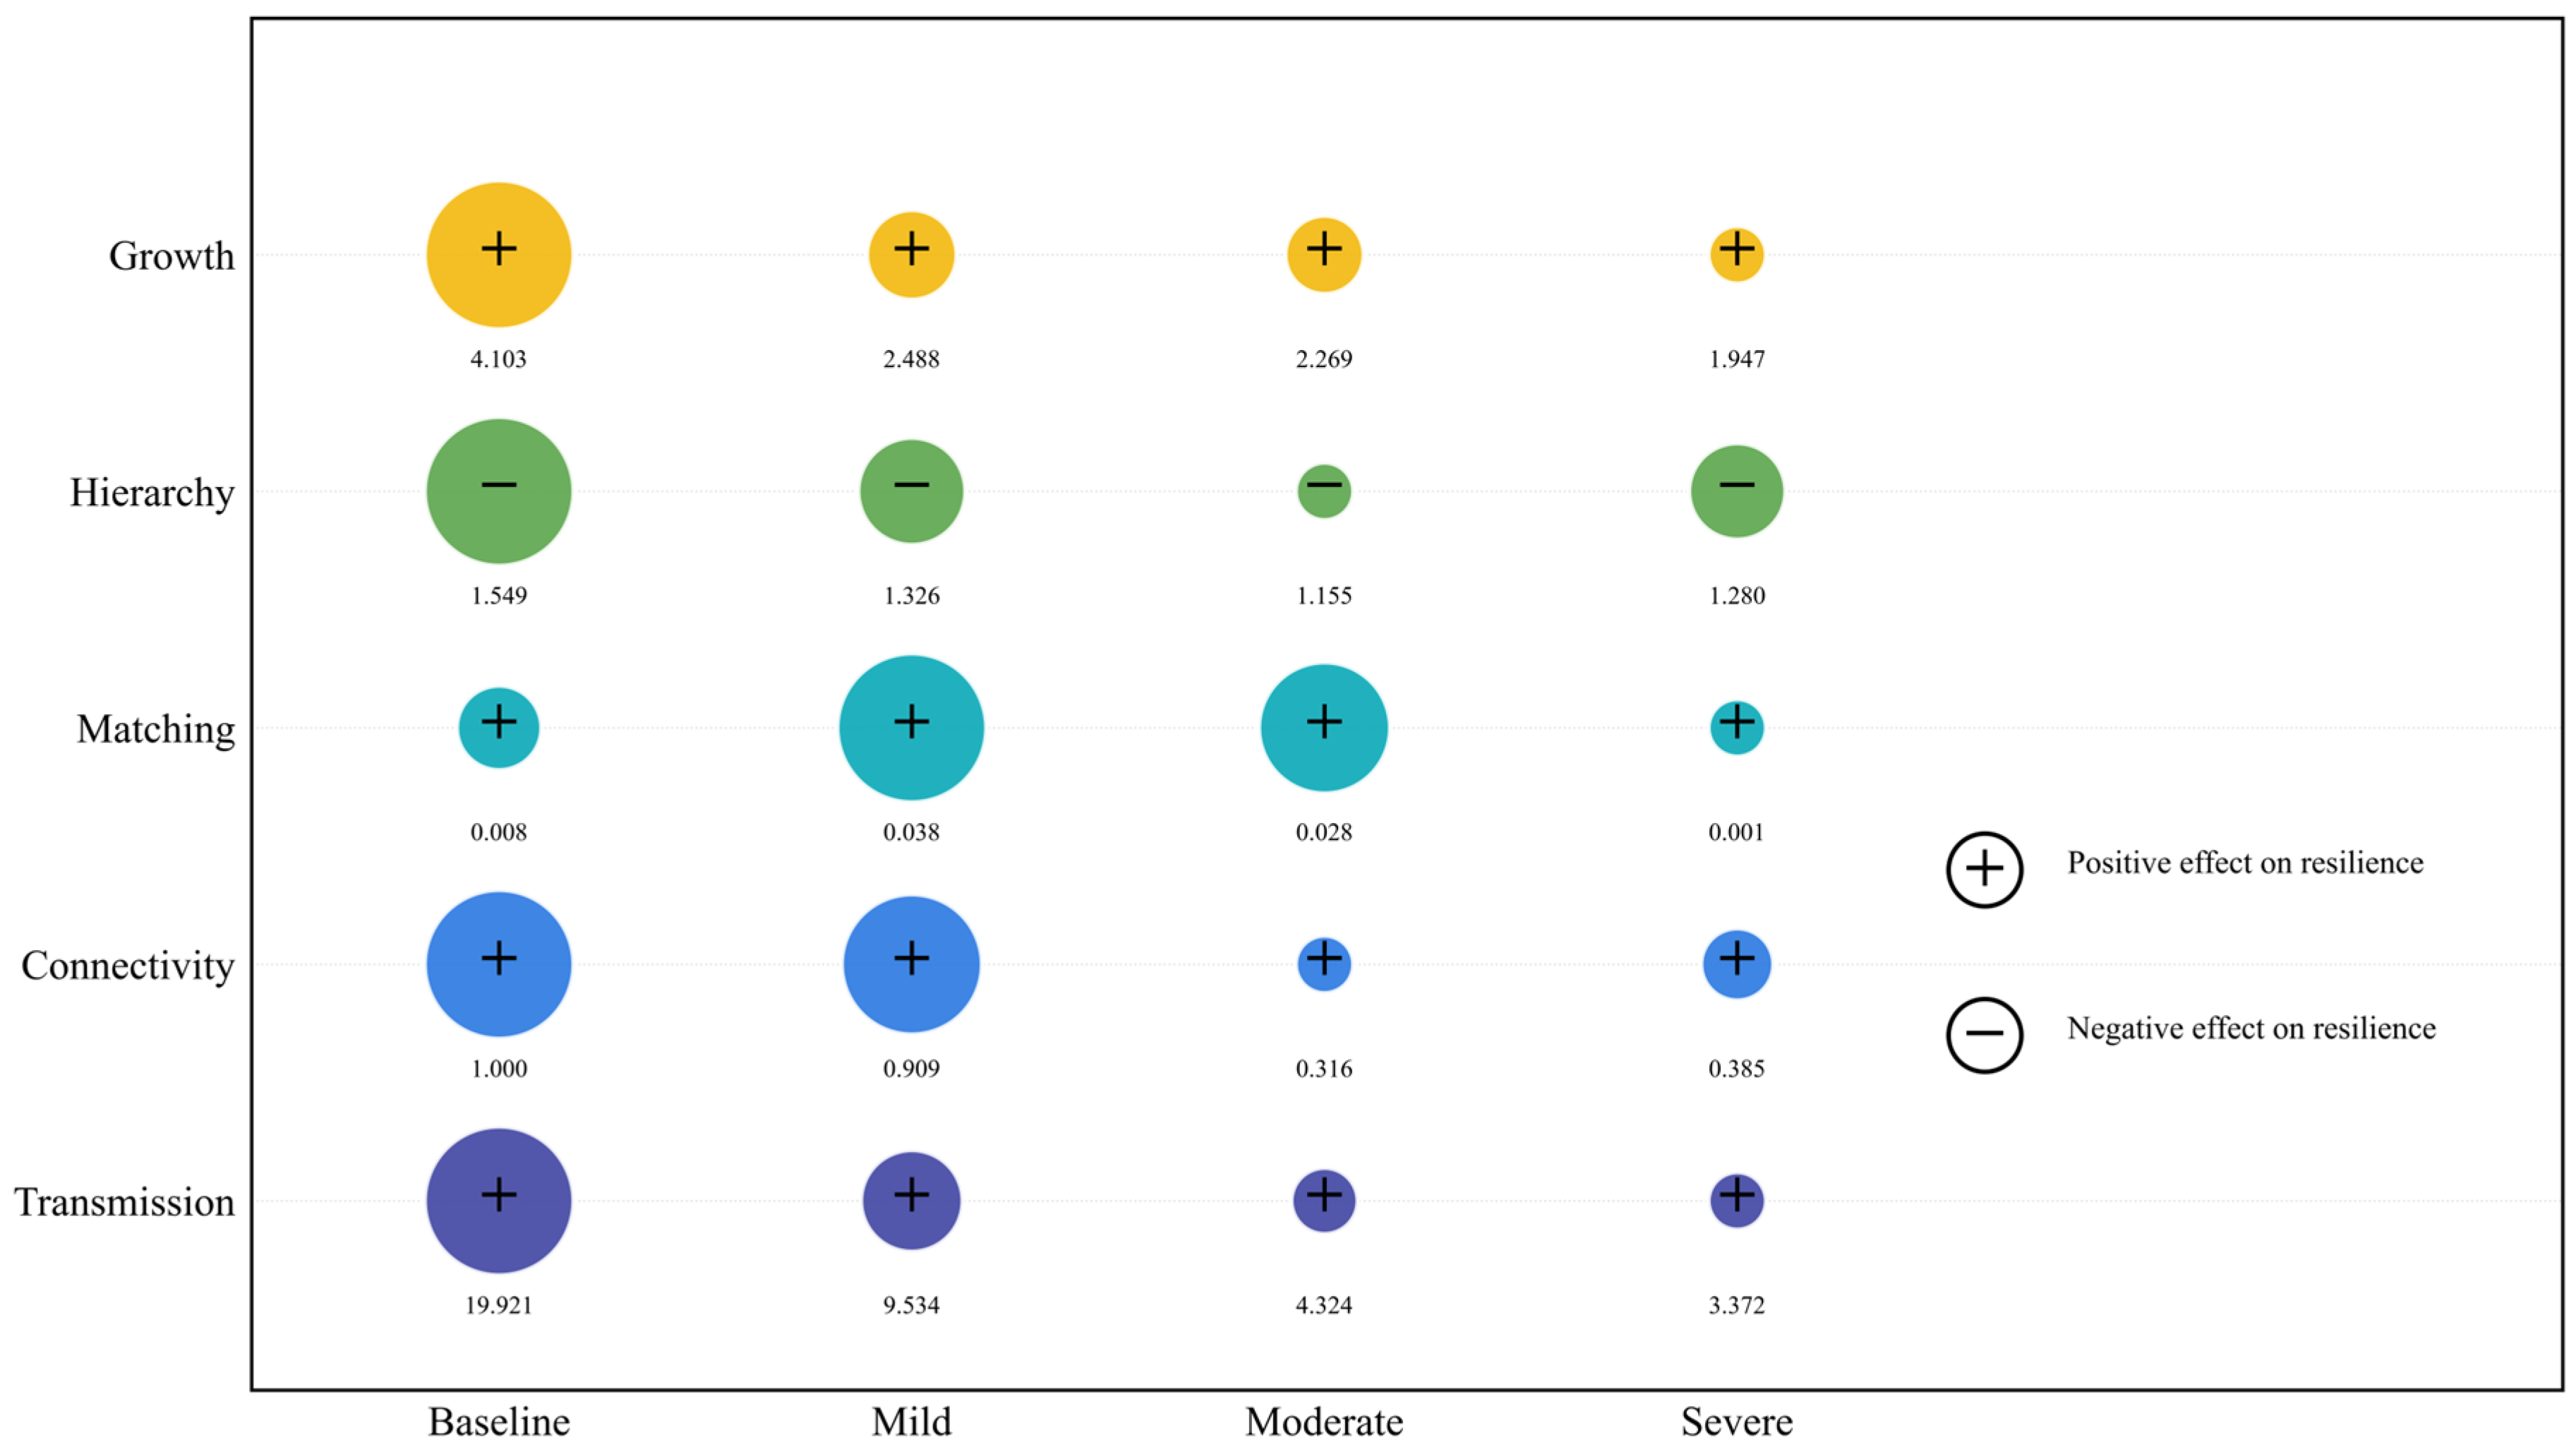
This study aims to measure the structural vulnerability of the ice–snow tourism symbiotic network—specifically, it assesses the level of the network’s ability to maintain connectivity and transmissibility under node failure shocks. Drawing on the three-stage definition of resilience in existing research—resistance, adaptation, and recovery—this study concentrates on the first two stages, resistance and adaptation, primarily investigating the structural vulnerability of the network. Simulations are conducted under two attack modes, random failure and deliberate attack, with node removal proportions set at mild (10%), moderate (30%), and severe (50%) levels, respectively, as shown in
Figure 8. The network vulnerability is comprehensively assessed across five dimensions—development scale, hierarchical structure, assortativity, connectivity, and transmissibility—with the relevant results presented in
Figure 9.
Under deliberate attack, connectivity does not change markedly under mild disruption, because the removal of a small number of core nodes usually does not split the network into multiple large fragments; however, transmissibility is extremely sensitive to the loss of hub nodes. The removal of hub nodes forces flows to detour onto longer paths, leading to a pronounced decline in global efficiency. After approximately five core nodes are deliberately removed, connectivity stabilizes at around 0.4, reflecting the network’s “core–periphery” structure: once the core layer is destroyed, the size of the largest connected component formed by the remaining peripheral nodes stabilizes at approximately 40% of the original network, and further node removal no longer substantially shrinks this component. Under random attack, connectivity remains at a relatively high level overall and declines slowly, indicating relatively strong robustness.
The ice–snow tourism symbiotic network in Northeast China exhibits a certain degree of resistance to random node failures, yet it is extremely vulnerable to deliberate attacks. The network structure displays a pronounced core–periphery characteristic, with a small number of core cities—such as Shenyang and Changchun—bearing disproportionately high connection loads. Once subjected to deliberate attacks, network connectivity and transmission efficiency decline, underscoring the critical dependency on key nodes.
5.4.2. Simulation of Node Addition and Network Structural Optimization
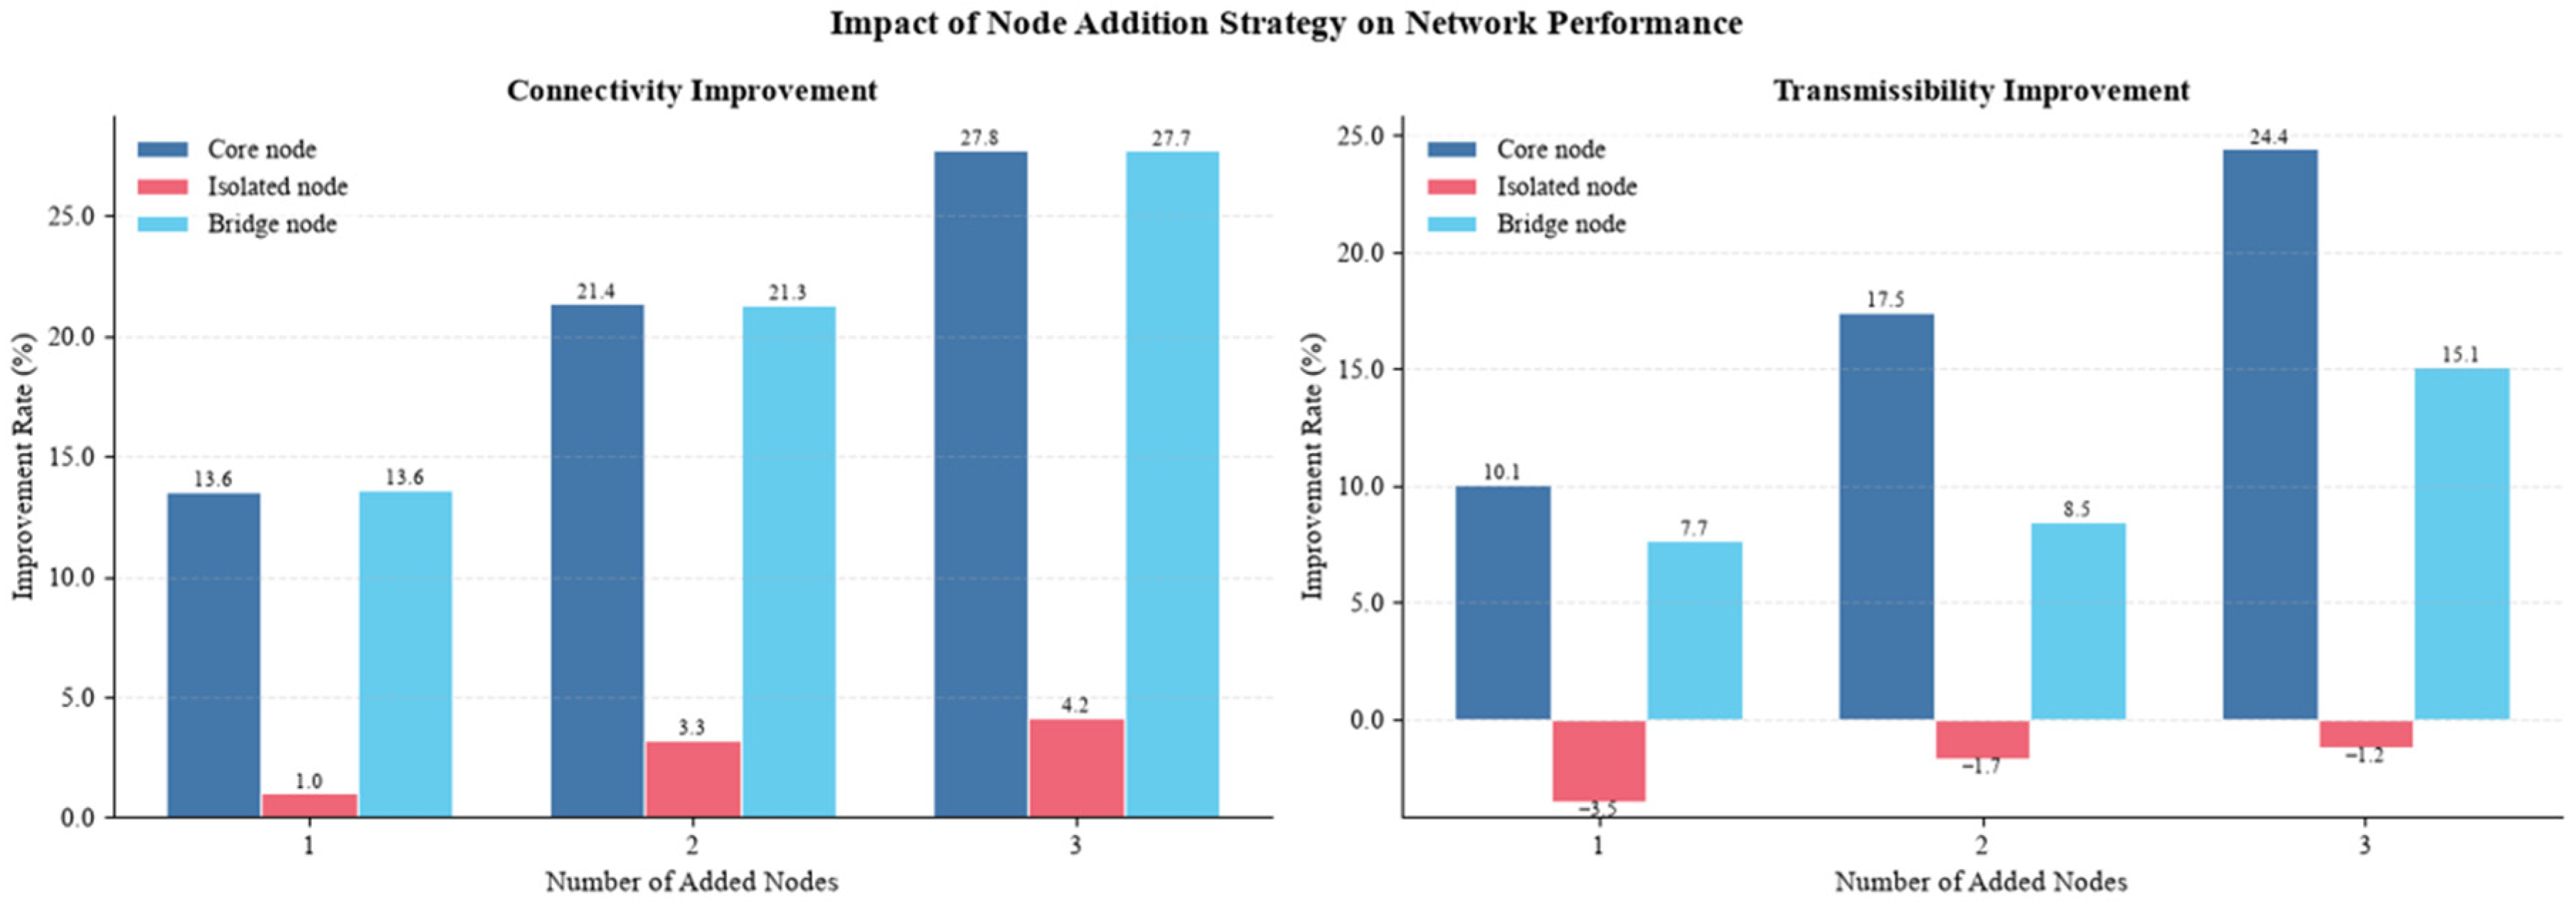
This paper constructs network robustness reconstruction scenarios based on a dual network model, in which the binarized network represents the connectivity structure and the weighted network represents symbiotic intensity, and examines the impact of positive interventions on network robustness from both structural and functional dimensions. Distinguished from traditional simulations that primarily focus on node or edge failure, this study simulates three typical types of node addition: (1) core nodes, which are assigned heterogeneous weights similar to those of existing core nodes in the network, simulating the formation of a regional tourism hub; (2) isolated nodes, which form no connections and serve as structural “enclaves” within the network; and (3) bridging nodes, which add intermediary nodes that increase cross-community connections, simulating the opening of transportation or policy corridors. Given that deliberate attack would prioritize the removal of newly added core nodes, the simulations adopted a random and severe attack mode.
The results show that the addition of different types of nodes has markedly divergent effects on network robustness (
Figure 10). Core nodes yield the most significant improvements in both connectivity and transmissibility: after adding three core nodes, the connectivity area increased by 27.75% and the transmissibility area increased by 24.44%, reflecting the critical supporting value of hub cities in structural stability and functional efficiency. Bridging nodes also achieved steady improvement, with the connectivity area increasing by 27.73% and the transmissibility area by 15.12%, indicating that cross-community connection strategies can effectively enhance network circulation efficiency. The contribution of isolated nodes was negligible; after adding three such nodes, the connectivity area increased by only 4.18%, while the transmissibility area decreased by 1.19%, suggesting that nodes without effective connections do little to improve network functionality and instead increase redundancy.
The two effective types of nodes exhibit a division of labor in their mechanisms: under random attack, bridging nodes better maintain cross-community connections and prevent premature network fragmentation, thus favoring structural robustness; core nodes, by virtue of their high-weight connections, substantially shorten inter-node path distances, leading to more pronounced improvements in transmission efficiency, which favors resource flow.
- 2.
Node Enhancement
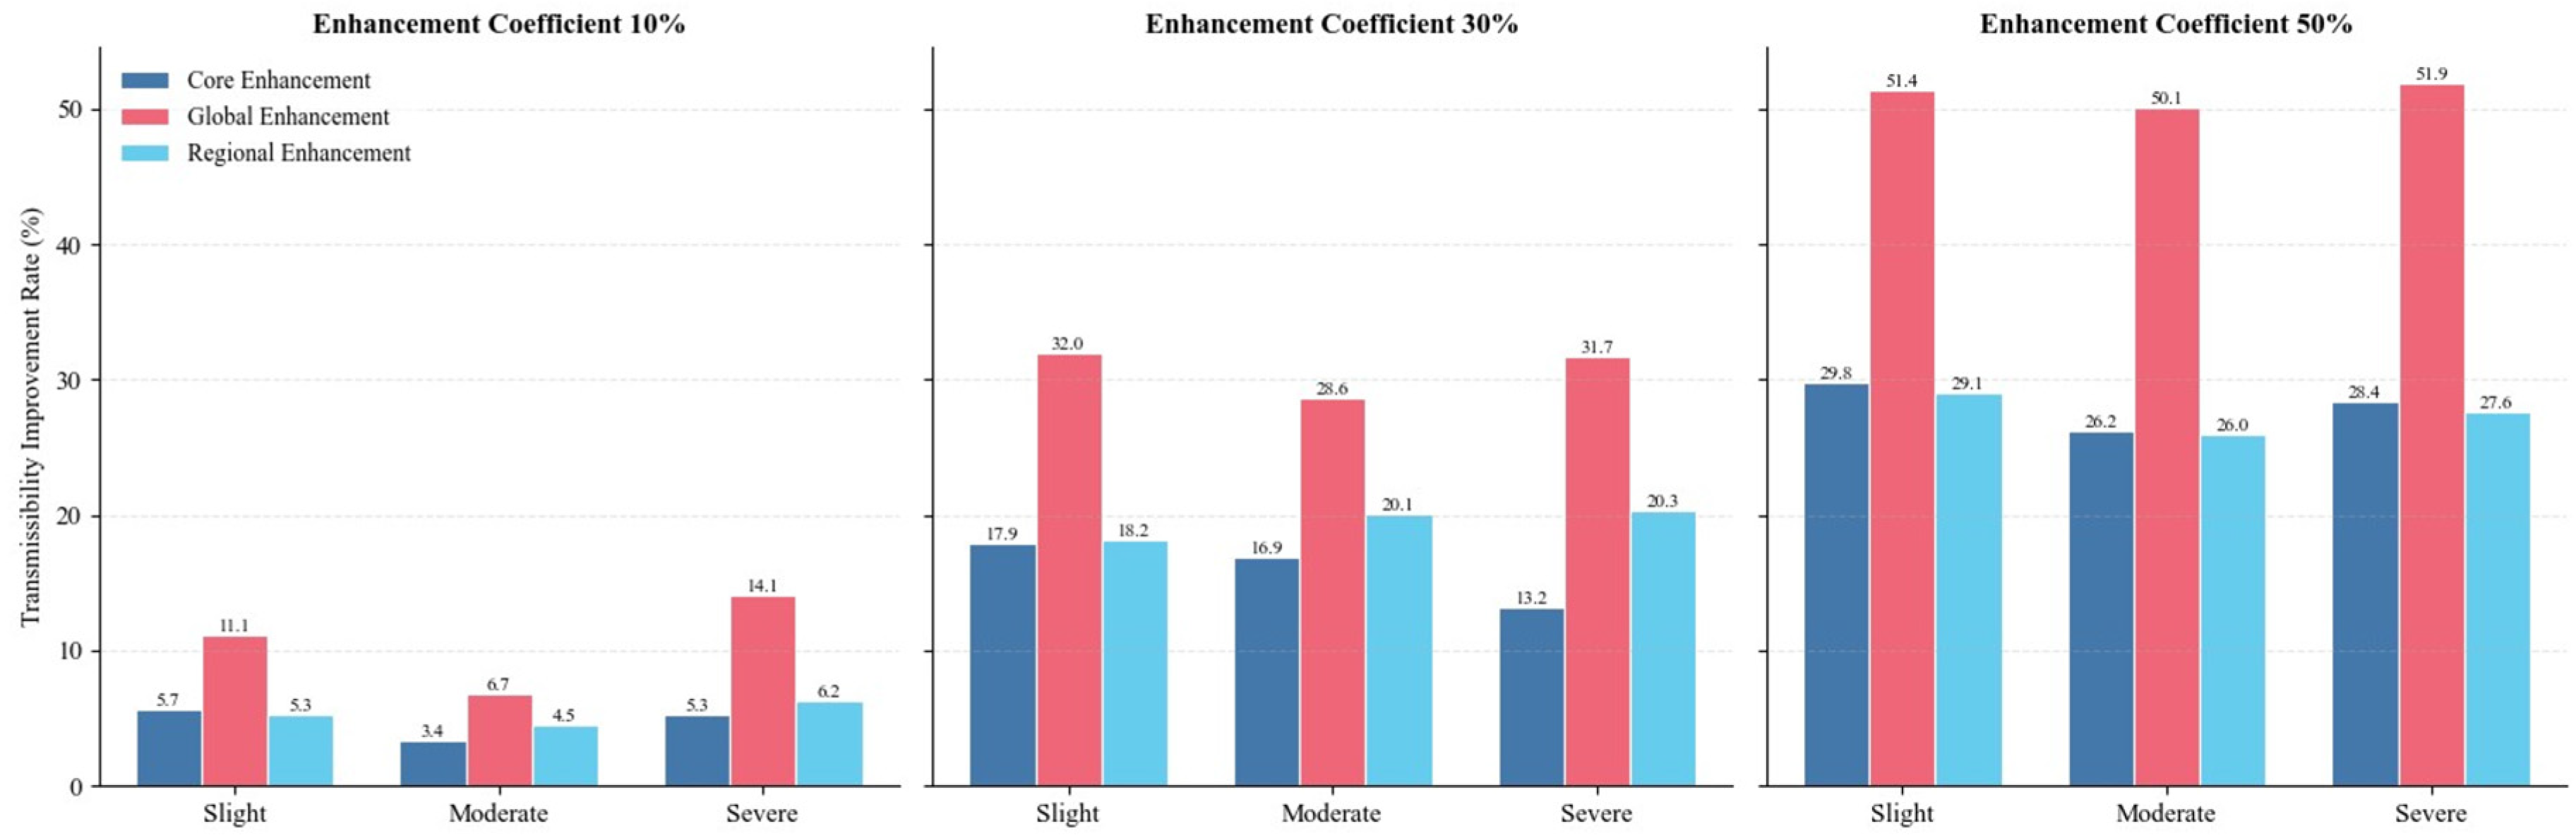
Node strengthening refers to enhancing the symbiotic intensity of existing nodes to bolster their resource reserves and capacity for external assistance during disturbances. This study sets three strengthening coefficients—10%, 30%, and 50%—and designs three scenarios: (1) core city strengthening, which increases the weights of all edges associated with core cities such as Shenyang, simulating the functional upgrading of central cities; (2) global strengthening, which increases the weights of all edges in the network by the same proportion, simulating the overall upgrading of regional tourism infrastructure; and (3) intra-regional strengthening, which focuses on boosting the symbiotic intensity among cities within subgroups, simulating the effects of regional tourism integration policies. Since connectivity depends solely on the existence of nodes and is unrelated to edge weights, strengthening edge weights does not change the connection relationships, and under global optimization the removal order of nodes under deliberate attack remains unchanged. Therefore, only the impact of random attack on network transmissibility is presented below.
The results show that global strengthening is the optimal strategy under all combinations of coefficients and disturbance levels (
Figure 11). At the 50% coefficient under severe disturbance, the transmissibility improvement rate reaches 51.94%, which is 23.56 percentage points higher than that of core strengthening. Intra-regional strengthening delivers improvements under all three disturbance scenarios, reflecting that intra-community ties can provide localized support when core nodes fail. Core strengthening exhibits the fastest growth in the coefficient range of 10–30%, illustrating the high-return characteristics of initial investment. The transmissibility improvement rate increases nonlinearly with the strengthening coefficient, and the marginal benefit of global strengthening decays the least. Overall, the improvement in transmissibility performance is positively correlated with the strengthening coefficient, indicating a cumulative effect of sustained investment: the better the development of urban ice–snow tourism is, the more tourists there are, the more developed the industry is, and the greater the emphasis on tourism economic development is, forming a positive feedback loop.
6. Results and Discussion
The synergistic symbiotic network of ice–snow tourism in Northeast China exhibits three core evolutionary and structural characteristics: (1) Inter-city transportation accessibility forms a core–periphery concentric pattern that attenuates progressively outward from the core cities of Harbin, Changchun, and Shenyang. The Harbin–Changchun and central–southern Liaoning urban agglomerations have developed mature internal transportation linkages, whereas border and peripheral cities such as Daxing’anling and Heihe suffer from weak accessibility, highlighting pronounced regional unbalanced development. (2) The ice–snow tourism synergistic symbiotic network displays prominent hierarchical polarization, with core cities exerting a one-way radiation-driven effect on peripheral areas. The network is characterized by strong intra-provincial connections but insufficient inter-provincial linkages, remaining at a transitional development stage of intense intra-provincial association and weak cross-provincial interaction. Four cohesive subgroups have formed distinct intra-provincial city clusters. (3) The network’s disturbance response exhibits a dual “robust-yet-vulnerable” characteristic: it possesses considerable buffering capacity against random node removal, whereas deliberate attacks on core hubs cause a sharp decline in network connectivity efficiency. Both adding bridging nodes and strengthening existing node weights can significantly enhance the overall disturbance resistance and adaptive capacity of the network. This spatial pattern is shaped by the coupling of multiple factors—transportation skeleton, resource endowments, and economic foundation. Relying on any single factor cannot resolve the polarization imbalance; multi-dimensional coordinated regulation represents the core pathway for optimizing the network structure.
Building upon existing research on urban agglomeration tourism networks, this study further refines and expands both the theoretical framework and analytical methods. Theoretically, taking cities as basic symbiotic units, this study integrates and deepens theories of tourism spatial interaction within a symbiotic analysis framework. By coupling the analysis of symbiotic organization modes, spatial economic linkages, and geographical matching relationships, it systematically elucidates the evolutionary mechanism of inter-city interactions within cold-region ice–snow urban agglomerations. Grounded in the specific context of ice–snow tourism, it expands the applicable scope of symbiosis theory and enriches the symbiotic theoretical analysis system for distinctive tourism urban agglomerations. Methodologically, this study establishes a two-tier integrated assessment framework of “static topological feature identification–multi-scenario vulnerability simulation.” It employs weighted and binary network matrices to cross-validate network structural robustness, sets up two types of disturbances—random node failure and deliberate hub attack—and supplements these with optimization simulations of node addition and weight strengthening to quantify the improvement effects of various regulatory measures on network connectivity and tourist flow transmission efficiency, thereby refining a multi-dimensional quantitative analysis pathway for the robustness of tourism symbiotic networks.
The empirical results indicate that a stable inter-city symbiotic collaborative system has taken shape among ice–snow cities in Northeast China. The polarized spatial pattern is a common feature of core–periphery tourism systems [
56], shaped by a combination of factors including transportation location, tourist source differentiation, ice–snow resource endowments, and network positive feedback effects. Regional symbiotic linkages generally follow the distance decay law, with geographical proximity serving as a foundational condition for network development [
57], though not as the sole constraining mechanism [
10]. Locationally disadvantaged cities such as Daxing’anling and Heihe can form higher-level inter-city connections by leveraging scarce ice–snow resources, thereby demonstrating that distinctive resources can offset transportation weaknesses and compensate for the limitation of single-variable reliance in traditional gravity models. The cohesive subgroup analysis confirms that symbiotic integration in ice–snow tourism has a development threshold: high-intensity collaborative clusters require surpassing a certain inter-city connectivity threshold, which corroborates research findings on specialized development in industrial symbiosis [
58]. Through multi-scenario simulations, this study identifies the systemic risk arising from heavy reliance on core hubs. Building on the characterization of network topological features, this study further integrates the elucidation of symbiotic evolution mechanisms, structural vulnerability identification, and structural optimization design, thereby providing new case and empirical support for extending ice–snow tourism network research from static structural description toward dynamic structural response mechanisms.
Despite the complete analytical framework constructed in this study, certain limitations remain. The analysis integrates online data and panel statistical data, with limited data sources and coverage. The scenario simulations employ idealized disturbance scenario settings, and the assessment focuses solely on the resistance and adaptation stages following a shock, without covering the recovery and reconstruction processes after the disturbance subsides. Moreover, compound external shocks such as climate warming and large-scale transportation disruptions are not incorporated. Future research can be deepened and expanded in the following three aspects. First, by integrating multi-source actual tourist flow data such as mobile phone signaling and tourist trajectories, a high-precision dynamic directed tourist flow network can be constructed to further investigate the multi-stage transmission patterns and spatio-temporal dynamic evolution characteristics of tourist flows across nodes after a disturbance. Second, by introducing compound external shocks—including shortened snow cover periods caused by climate warming, large-scale transportation disruptions, and policy regulations—a multi-dimensional, full-cycle resilience assessment model can be established to systematically reveal the resilience evolution patterns of ice–snow networks under the coupling effects of multiple disturbances. Finally, future research can expand the scope to further investigate the interrelationships among urban nodes and conduct comparative studies with other ice–snow urban agglomerations and overseas cold-region ice–snow tourism destinations, thereby further enriching the theoretical system of cold-region ice–snow tourism networks.
Exploring the spatial structure and dynamic interaction mechanisms of the ice–snow tourism symbiotic network in Northeast China ultimately aims to provide governance approaches for the sustainable, high-quality development of regional ice–snow tourism. Based on the structural deficiencies and risks of the network identified earlier, this paper proposes targeted optimization strategies in three areas to enhance the overall disturbance resistance capacity of the symbiotic network.
First, strengthen core hubs and enhance their radiation capacity. Core cities can host ice–snow festivals, carnivals, and music events to gather tourist flows, which are further distributed to peripheral nodes via intermediate cities, reducing network promotional costs and improving market responsiveness. A tourist flow early-warning and diversion system should be established to regulate peak-season tourism, control scenic area carrying capacity, and alleviate overtourism problems such as congestion and resident livelihood conflicts.
Second, activate peripheral nodes to narrow the core–periphery gap and safeguard community interests. Although Heihe and Daxing’anling possess abundant ice–snow resources, insufficient transportation accessibility restricts regional linkage. Optimizing external transportation networks, integrating these cities into regional tourism routes, and launching combined tickets can effectively attract tourists. Meanwhile, distinctive ice–snow tourism IPs built via new media, localized ecological and cultural products, and resident benefit-sharing mechanisms can ensure sustainable community development.
Third, promote differentiated and complementary synergy among cohesive subgroups to improve regional competitiveness. Each subgroup can achieve coordinated development through resource complementarity. It is necessary to cultivate new ice–snow tourism formats, deepen the integration of culture, intangible cultural heritage, and film and television industries, and connect cross-regional ice–snow tourism products, so as to transform the network from a centralized, single-core dependent structure to a distributed and synergistic structure.