Article

Will Pilot Programs to Integrate Technology and Finance Help Cities Improve Their Carbon Emission Efficiency?

1
School of Statistics and Data Science, Lanzhou University of Finance and Economics, Lanzhou 730020, China
2
Economic Research Institute of the Belt and Road Initiative, Lanzhou University of Finance and Economics, Lanzhou 730020, China
*
Author to whom correspondence should be addressed.
Sustainability 2026, 18(14), 7079; https://doi.org/10.3390/su18147079
Submission received: 6 June 2026 / Revised: 4 July 2026 / Accepted: 8 July 2026 / Published: 10 July 2026

Abstract

As the key driver of economic development, sci-tech finance presents a new opportunity for China’s economic green transformation. This paper employs the difference-in-difference method to examine the influence of sci-tech finance policies on urban carbon emission efficiency. The results show the following: (1) Generally, the technology finance policy can notably enhance urban carbon emission efficiency, and this conclusion remains valid after a series of robustness checks. (2) Mechanism tests indicate that sci-tech finance can promote low-carbon development via innovation, financing, and energy structure channels. (3) Heterogeneity tests reveal that sci-tech finance has a more pronounced impact on emissions reduction in the eastern regions, areas with strict environmental regulations, regions with a higher degree of marketization, and non-resource-based cities. (4) A spatial Durbin model was employed to analyze the spatial spillover effects of science and technology finance. (5) The Double Machine Learning (DML)model was used for verification and inspection, and found that sci-tech is conducive to improving the carbon emission efficiency of cities. Finally, this study offers policy recommendations, including formulating region-specific implementation guidelines for the growth of sci-tech finance, taking into account the distinct features of each area.

1. Introduction

Driven by the dual impetus of global “dual carbon” goals and the green transformation of China’s industries, sci-tech finance policies are expected to guide capital flow toward low-carbon sectors and alleviate the financial constraints on green technological innovation. However, the tension between theory and reality awaits urgent resolution: under a unified policy framework, why can sci-tech finance investment significantly improve carbon efficiency in some cities, while others fall into the dilemma of a “disconnection between policy implementation and carbon emission reduction effects”? Existing studies either focus on the potential of sci-tech finance to reduce carbon emissions at the national macro-level, or are confined to micro-enterprises to explore the impact of financing constraints on the adoption of green technologies. Nevertheless, they lack systematic deconstruction of the key heterogeneous variables in the “policy–region–carbon efficiency” transmission chain, leading to ambiguity regarding the policy’s scope of action and applicable scenarios. More notably, will the internal mechanisms through which sci-tech finance policies enhance carbon efficiency via capital guidance and technological innovation present different pathways due to differences in regional development stages and industrial structures? This research gap not only restricts the scientific evaluation of the effectiveness of sci-tech finance policies to reduce emissions, but also leaves local governments without precise bases when formulating coordinated “sci-tech finance + carbon emission reduction” policies. Consequently, this study aims to clarify the causal relationship, heterogeneous characteristics, and action mechanisms through which sci-tech finance policies influence urban carbon efficiency.
With the rapid development of China’s economy and the accelerating pace of urbanization, the growing demand for transportation and the continuous increase in vehicle ownership have resulted in rising carbon emissions. Improvements in living standards have raised public expectations for more convenient and comfortable mobility, further driving the increase in private vehicle ownership and intensifying the pressure to decarbonize the transportation sector. Coal-fired thermal power generation, as the primary mode of electricity production, continues to contribute to high carbon emissions in the power sector. Although China has made significant strides in developing renewable energy sources such as solar, wind, and hydropower in recent years, their intermittent nature, instability, and the underdeveloped state of energy storage technologies prevent them from fully replacing traditional thermal power. Additionally, certain regions remain heavily dependent on coal due to economic and technological constraints, presenting significant challenges for optimizing energy structures and reducing carbon emissions.
As the world’s largest producer and consumer of renewable energy, China leads in renewable material manufacturing. However, it simultaneously ranks among the top polluters globally [1]. Internationally, China faces significant pressure regarding its emission reduction responsibilities, with developed nations urging stronger commitments. As a developing country that must balance economic growth with environmental protection, China urgently needs strategic solutions to address its immediate environmental challenges [2,3]. Innovation serves as the ultimate determinant in driving industrial transformation and achieving green low-carbon objectives [4]. A critical question arises: How can sufficient funds be quickly mobilized to support industrial upgrading? The implementation of sci-tech finance integration policies by municipal governments becomes essential in driving energy conservation trends. Sci-tech finance refers to innovative investment mechanisms that integrate technology innovation chains with financial capital chains, guiding financial institutions to develop new products and improve services to foster innovation [5]. For developing nations like China, this necessitates not only securing adequate low-carbon financing but also advancing technological innovation.
The existing literature extensively examines factors influencing carbon emission efficiency, particularly focusing on technological innovation and financial development. It presents two main perspectives, the first of which is the relationship between technological innovation and carbon emissions. Feng [6] employed spatial econometric models to demonstrate green technological innovation’s crucial role in improving emission efficiency among developed nations. Gu [7] revealed innovation’s dual function in reducing emissions and decoupling economic growth from carbon output. Compared with conventional models, green innovation specifically targets low-carbon development and serves as key climate response mechanism globally. Gao [8] identified green innovation’s significant catalytic effect on industrial restructuring through a provincial-level analysis, while Zeng [9] highlighted how its spatial spillover effects benefit underdeveloped regions, underscoring its critical role in carbon neutrality. The second perspective concerns the relationship between financial development and emissions. Liu [10] was the first to apply a spatial Durbin model after a financial crisis, revealing financial development’s paradoxical effects: reducing neighboring regions’ emissions while increasing local emissions, yet achieving a net reduction overall. Tao [11] decomposed financial development into depth, scale, and efficiency dimensions, all proving conducive to emission efficiency. Empirical analyses of urban data confirm that, in general, financial development reduces emissions intensity and promotes green growth [12,13]. Existing studies separately examine technological and financial impacts but neglect their synergistic effects on urban emissions, thus this research specifically explores sci-tech finance’s carbon reduction efficiency.
Using China’s Sci-Tech Finance Policy as a quasi-natural experiment, this study examines the effects of urban low-carbon development by analyzing municipal panel data, and makes three key contributions. First, an SBM-GML (Slack-Based Measure–Global Malmquist–Luenberger) model is developed to assess regional carbon emissions efficiency. Second, this study identifies three operational mechanisms through which sci-tech finance contributes to green development: enhancing innovation capacity, improving financing capabilities, and optimizing energy structure. Third, comparative analyses are conducted, taking into account different geographical areas, varying levels of environmental regulation intensity, marketization degrees, and resource endowment characteristics. Finally, by applying the DML (Double Machine Learning) framework to control for human-induced confounding factors, this study finds that sci-tech finance significant promotes urban carbon emissions. This paper contributes three main innovations. First, it adopts the spatial Durbin model to distinguish the local positive policy effects from the cross-regional negative factor siphon spillover effects, thereby enriching the spatial theoretical framework regarding carbon emission reduction driven by sci-tech finance. Second, it introduces Double Machine Learning to capture the nonlinear confounding relationships among variables, addressing the limitations of conventional DID approaches and improving the accuracy of causal identification. Third, it constructs an interactive mediating framework encompassing innovation, financing, and energy structure, revealing the transmission channels through which sci-tech finance affects carbon emission efficiency.

2. Theoretical Analysis and Research Hypotheses

2.1. Sci-Tech Finance and Carbon Emission Efficiency

Under China’s fiscal decentralization system, local governments experience subtle tensions between advancing economic development and enforcing environmental regulations. On the one hand, trapped in the “economic growth tournament”, local governments tend to allocate more sci-tech financial resources to industries with higher short-term returns yet inadequate low-carbon characteristics, which weakens the carbon abatement effectiveness of relevant policies. On the other hand, local authorities are compelled to prioritize carbon emission reduction amid environmental performance assessment pressure imposed by the central government. Accordingly, the actual efficacy of sci-tech finance policies largely hinges on how local governments strike a balance between the dual objectives of economic expansion and environmental protection. Their capacity to channel financial resources toward targeted sectors and the intensity of policy implementation differ substantially across regions. This institutional context constitutes an essential prerequisite for comprehending the heterogeneous impacts of sci-tech finance policies. Pollution and carbon emissions fundamentally stem from the overutilization of environmental resources, driven by the externalities inherent in resource exploitation. Privatesector production activities often exceed socially optimal pollution levels, indirectly transferring environmental governance costs to society. Notably, the seamless execution of these undertakings hinges on the backing provided by the financial infrastructure. In China, sci-tech finance policies are generally implemented through pilot programs, and the two batches of pilots launched in 2011 and 2016 differ markedly in their policy priorities. The first batch focused on addressing financing difficulties faced by small and medium-sized sci-tech enterprises via financial instruments such as risk compensation funds and specialized sci-tech credit institutions, with policy tools centered on incentives for financial institutions. Building upon previous practices, the second batch of pilots, rolled out in 2016, placed greater emphasis on the in-depth integration of sci-tech finance and industrial policies, while introducing innovative financial models including investment–loan linkage and intellectual property securitization. Moreover, policy support was further tilted toward strategic emerging industries and low-carbon technologies. Such iteration of policy instruments and shifts in support priorities form the core institutional backdrop for examining policy effects in this paper. Sci-tech finance demonstrates significant potential in enhancing urban carbon emission efficiency by expanding the real economy, increasing technological content, optimizing industrial structures, and improving ecological environments. This policy creates synergies by integrating technological and financial resources: technological innovation provides solutions to carbon reduction challenges, while financial mechanisms offer funding guarantees and risk-sharing frameworks [14]. In practice, sci-tech finance delivers multifaceted outcomes. First, it directs capital flows to low-carbon industries and high-tech sectors, promoting industrial upgrading while imposing constraints on energy-intensive and high-emission industries. Second, it facilitates adjustments in energy consumption structure through technological advancements, improving energy utilization efficiency and enabling refined energy management. Zhang [15] described the digital economy as an innovation-driven factor promoting low-carbon development, whose positive impacts may be underestimated or ignored. The study examined both the direct and indirect effects of the digital economy on low-carbon development, as well as its heterogeneity across different regions and periods. Wang [16] constructed an evaluation index system covering five dimensions—economy, society, urban planning, energy utilization, and environment—and used the TOPSIS method to score and classify the low-carbon development quality of 259 cities. It was found that regional development is unbalanced, with low-carbon economy, society, and environment being the main obstacles. Ren [17] discussed technological improvements in the steel industry and R&D achievements in ultra-low-carbon technologies, focusing on their cost-effectiveness and development prospects. Based on the life cycle analysis method, a comprehensive analytical framework was built to consider more factors in designing emission reduction strategies. The comprehensive application of mainstream technological improvements can reduce carbon dioxide emissions, and the integration with ultra-low-carbon technologies can achieve an emission reduction of 80% to 95%. Thus, we propose the following hypothesis:
H1. 
Sci-tech finance policies can significantly boost urban carbon emission efficiency, thus driving green and low-carbon development.

2.2. The Innovation Effect of Sci-Tech Finance

Technological innovation serves as the primary driver of environmental quality improvement and green development, acting as a key channel through which sci-tech finance enhances sustainability. Feng [18] argues that sci-tech finance significantly stimulates green technological innovation, particularly in manufacturing and non-state-owned sectors, with its effects amplified by environmental decentralization. By reducing reliance on coal and oil, technological innovation minimizes pollutant emissions during energy production and consumption, supporting green sustainability. Concurrently, innovations in energy storage and transmission technologies ensure stable and efficient clean energy utilization. Sci-tech finance further incentivizes low-carbon innovation through reward funds for breakthrough achievements, guides financial institutions to invest in R&D enterprises, and enhances resource efficiency via agglomeration and spillover effects. Pilot regions integrating technology and finance exhibit superior performance in green innovation [19]. Enhancing technological innovation capability is crucial for improving carbon emission efficiency and promoting urban low-carbon development [20]. As a key area of environmental protection innovation, green technology plays a core role in advancing circular economy, improving resource efficiency, and reducing resource consumption. Sci-tech finance can promote sustainable development both directly through investment and indirectly by supporting the development of green technologies. Regardless of the approach adopted, the degree of innovation in green technologies is a key factor determining the impact of sci-tech finance [21]. Technological innovation capability is the core driving force behind urban development. In the early stage of green technological innovation, issues such as immature technology and high costs may hinder industrial upgrading and even increase urban carbon emissions. However, when green technological innovation reaches a certain threshold, the cost of clean energy decreases, which promotes more extensive use of clean energy and reduces fossil fuel consumption. By increasing the intensity of investment in innovation, cities can utilize resources more efficiently, reduce carbon emissions per unit of output, and thereby improve overall carbon emission efficiency. Therefore:
H2. 
Sci-tech finance policies boost innovation investment, positively affecting urban carbon emission efficiency.

2.3. The Financing Effects of Sci-Tech Finance

Sci-tech finance alleviates financing constraints, elevates environmental investment, and enhances urban carbon emissions efficiency. By imposing higher interest rates and financing limits on heavily polluting enterprises, it raises financing thresholds, reduces excessive investments, and improves capital allocation efficiency, demonstrating distinct regulatory effects [22]. Specifically, sci-tech finance supports low-carbon technology R&D, green energy projects, and equipment upgrades by providing tailored financial products. It also facilitates energy management initiatives through barrier-free financing, optimizing energy utilization and reducing waste [23]. Furthermore, it strengthens corporate financing management, encourages financial innovation, and accelerates industrial restructuring via digital transformation and high-tech industry development [24,25]. Science and technology finance enables the financial sector to allocate resources efficiently, amplify the financing effect, and allow green enterprises to obtain funds quickly. It also helps guide more social investments into low-carbon fields, supplementing market-driven environmental policies [26]. At the same time, science and technology finance policies make it easier for green technology production sectors to access financial resources, thereby supporting research and development as well as application of green technologies aimed at reducing carbon emissions. It also exerts a “crowding-out effect” on heavily polluting industries by tightening financing constraints and increasing production costs [27]. We propose the following hypothesis:
H3. 
Sci-tech finance policies boost urban carbon emission efficiency by strengthening financing capabilities.

2.4. Sci-Tech Finance and Energy Structure

Energy structure optimization is pivotal for achieving carbon peak and neutrality. Rising marginal costs of coal consumption drive enterprises to reduce traditional energy use. While financial development historically amplified fossil energy consumption and environmental pressures [28], sci-tech finance leverages digital tools to enhance green enterprise identification, alleviate resource dependency, and promote sustainable transitions. By tightening emissions oversight, it compels enterprises to improve energy efficiency and adopt cleaner alternatives, curbing carbon emissions at the source [29]. He et al. [30] pointed out that technological innovation has effectively curbed environmental pollution by guiding industrial spatial agglomeration and reducing energy consumption. Energy consumption structure is a restrictive factor for improving carbon emission efficiency. Liu [31] conducted a quantitative study on China’s carbon dioxide emission efficiency, energy consumption structure, and regional differences; they concluded that optimizing the energy consumption structure can significantly reduce carbon dioxide emissions. The development of science and technology finance has significantly reduced the reliance on traditional fossil fuels, thereby greatly reducing carbon emissions from fossil fuel use. In addition, energy efficiency has been substantially improved through technological progress and better energy management, enabling more effective and rational use of energy. This transformation exerts a positive impact on regional carbon emission efficiency, prompting greater attention to environmental protection and sustainable development while supporting economic growth, thus laying a solid foundation for the low-carbon economy [32]. Lin [33] used fixed-effect stochastic frontier analysis to calculate total factor carbon performance for measuring the level of low-carbon development. They also explored the mediating role of clean energy between national income level, R&D investment, and low-carbon development, as well as its moderating role in the negative impact of industrialization on low-carbon development. We propose the following hypothesis:
H4. 
Sci-tech finance policies help refine China’s energy consumption structure, leading to improvements in urban carbon emission efficiency.

2.5. Interactive Mechanisms Among Innovation, Financing, and Energy Structure

The three aforementioned transmission mechanisms do not function in isolation; they are intertwined and mutually reinforcing. First, the innovation effect amplifies the financing effect. Green technological innovation can markedly reduce the costs of clean energy as well as energy-saving and emission-reduction technologies. Projects adopting such technologies accordingly carry lower risks and come with more stable expected returns. The enhanced technical feasibility boosts financial institutions’ willingness to grant loans, which strengthens the capacity of sci-tech finance to advance the green transition through financing channels. Second, the optimization of energy structure creates reverse incentives for innovation. When the optimization of energy consumption structure imposes stricter constraints on the consumption of traditional fossil fuels, enterprises are forced to increase research and development investment to develop state-of-the-art energy efficiency improvement technologies or alternative energy solutions to sustain their competitiveness, which further stimulates technological innovation in return. These interactive linkages indicate that the overall effect of sci-tech finance policies is far greater than the sum of their individual separate effects, forming a virtuous cycle: cost reduction through innovation–scale expansion via financing–industrial and energy structural upgrading–further innovation driven by structural transformation.

3. Variable Selection and Model Setting

3.1. Variable Selection

3.1.1. Dependent Variable

The methodology used in this paper was designed with reference to Meng [34]. The dependent variable, CE, represents urban carbon emission efficiency. In the overall production process, the input factors consist of fixed capital stock, total energy consumption, and the labor force, while the output includes the city’s annual real GDP as the desirable output and carbon dioxide emissions as the undesirable output. The detailed method for selecting variables is presented in Table 1 below:
The model assumes that the production activities of a city are achieved through the input of various production factors to obtain multiple desired and undesirable outputs. A production possibility set that includes undesirable outputs is constructed, and the optimal production technology frontier is established by considering each city over the years as a decision-making unit. Let city k be the decision-making unit, t be the year, x R N + represent the inputs, y R M + represent the desired outputs, and b R I + represent the undesirable outputs. The global SBM directional distance function is defined as
S V G x t , k , y t , k , b t , k ; g x , g y , g b = m a x s x , s y , s b 1 N n = 1 N s n x g n x + 1 M + I m = 1 M s m y g m y + i = 1 I s i b g i b 2
s . t . k = 1 K z k t x k n t + s n x = x k n t , n = 1 , , N k = 1 K z k t y k m t s m y = y k m t , m = 1 , , M k = 1 K z k t b k i t + s i b = b k i t , i = 1 , , I k = 1 K z k t = 1 , z k t 0 , k = 1 , , K s n x 0 , n ; s m y 0 , m ; s i b 0 , i
The GML index is constructed based on the above global SBM directional distance function, and the formula is as follows:
G M L t , t + 1 = 1 + S V G x t , y t , b t ; g x , g y , g b 1 + S V G x t + 1 , y t + 1 , b t + 1 ; g x , g y , g b
( x t , k , y t , k , b t , k ) represents the input, desired output, and undesirable output vectors of a specific decision-making unit k t in year t . ( g x , g y , g b ) represents the directional vectors for input reduction, desired output increase, and undesirable output reduction. ( s n x , s m y , s i b ) represents the slack vectors for input, desired output, and undesirable output. G M L t , t + 1 indicates the change in carbon emission efficiency. For a longitudinal comparison of carbon emission efficiency in different cities across years, the GML index is used in cumulative multiplication.

3.1.2. Core Explanatory Variable

The core explanatory variable TFIN represents China’s sci-tech finance policies, implemented in two stages in 2011 and 2016, with 9 cities being added in the latter stage. A quasi-natural experiment was designed using the “Science–Finance Integration Pilot” policy, assigning 50 pilot cities as the treatment group and non-pilot cities as the control group. Cities adopting the policy in or after the implementation year were coded 1; others 0.

3.1.3. Control Variables

The method used in this paper is based on that of Zeng [35]. We selected the following control variables. (1) Industrial Structure (Ind): Calculated as the ratio of the secondary industry’s added value to that of the tertiary industry in the region. (2) Urbanization Rate (Ur): Defined as the urban population proportion of total (urban + rural) population. (3) Employee Compensation (Ew): Calculated as the ratio of urban residents to total population (urban + rural). (4) Foreign Direct Investment Ratio (Fdi): Measured as the urban resident share in total (urban + rural) population. (5) Degree of Industrialization (Doi): Assessed using the natural log of regional above-scale industrial enterprise counts. (6) Loan-to-Deposit Ratio (Ldr): Calculated as the proportion between the end-of-year loan balance of financial institutions and their deposit balance.

3.1.4. Mediating Variables

In light of the outcomes of the benchmark regression, the influence exerted by sci-tech finance on the carbon emission efficiency of urban areas can be categorized into four distinct channels. (1) Innovation Input Intensity (Ini): Evaluated based on the proportion of scientific spending in the fiscal expenditure of local governments [20]. (2) Innovation Efficiency (Ine): Evaluated via the natural log of the total number of green patent applications [20]. Granted green patents (Grants): The natural logarithm of the total number of granted green patents. (3) Financial Institution Efficiency (Fe): To more accurately represent the development of urban financial industries, this is evaluated by the proportion of the loan balance held by financial institutions to the savings balance of residents. (4) Energy Structure (Es): A proxy indicator based on the ratio of coal consumption to total energy consumption. A lower ratio indicates a more balanced energy structure [32].

3.2. Model Setting

To quantify the impact of the science–technology–finance integration pilot policy on urban carbon emission efficiency, we used a double fixed-effects model and the difference-in-differences (DID) method. The sample was of prefecture-level cities in China. The cities that take part in the sci-tech finance pilot project were classified as the experimental group, and those that did not were the control group. The final model for the benchmark regression is
C E i t = β 0 + β 1 T F I N i t + γ X i t + μ i + δ i + ε i t
where the subscript i represents the city, and t represents the year. C E i t represents the carbon emission efficiency of city i in year t . T F I N i t is the interaction of the dummy variable Treat (indicating the experimental group of the sci-tech finance policy) and the time dummy variable Post. If the coefficient β 1 of the core explanatory variable T F I N i t is significantly positive, it indicates that the pilot policy promoting the integration of science and technology with finance can improve carbon emission efficiency. X i t represents the control variables, β 0 is the constant term, μ i represents city-fixed effects, δ i represents time-fixed effects, and ε i t is the random disturbance term.
Based on theoretical analysis, the sci-tech finance policy may lower urban carbon emission efficiency by enhancing innovation input intensity, improving innovation and financial institution efficiency, and shifting the energy structure. Traditional stepwise regression methods may cause estimation bias when testing economic issues. Therefore, we adopted the two-step approach proposed by Jiang Ting [36] to investigate the mediating role of sci-tech finance. We developed the following model.
M i t = φ 0 + φ 1 T F I N i t + γ X i t + μ i + δ i + ε i t
In this model, M i t represents the mediator variable for city i in year t , and the meanings of the other variables are consistent with those in model (3). In this model, the coefficient φ 1 of the core explanatory variable T F I N i t represents the effect of the sci-tech finance policy on the mediator variables, such as innovation input intensity, innovation efficiency, financial institution efficiency, and energy structure. If the coefficient φ 1 is significant, it indicates that the sci-tech finance policy has an effect on these mediator variables. Equation (4) represents the second step of the Jiang Ting two-step method, and since the first step of this method is the same as in Equation (3), it will not be repeated here. Jiang Ting argues that most existing empirical studies using stepwise regression methods are prone to large estimation errors, especially in identifying “clean” exogenous random mediator variables. Therefore, when testing mediation effects, it is sufficient to verify the impact of the explanatory variable on both the outcome variable and the mediator variable, while the effect of the mediator variable on the outcome variable can be directly derived from theoretical analysis. Nevertheless, Jiang Ting’s two-step approach still has inherent limitations. This method can only identify the average mediating effect for the full sample, failing to distinguish heterogeneous transmission channels between resource-based and non-resource-based cities. Accordingly, it cannot decompose the reverse suppression pathway through which policies exert inhibitory effects in resource-dependent regions. Furthermore, the model cannot standardize the decomposition of total, direct, and mediating effects, making it impossible to quantify the contribution of each transmission channel and the magnitude of their offsetting interactions. It also fails to address the bidirectional endogeneity between the mediating variable and the explained variable. In addition, this approach merely implements reduced-form tests rather than a formal causal mediation analytical framework, which renders it incapable of isolating disturbances from various confounding variables. To accurately disentangle the complete causal transmission chain underlying the negative policy impacts, supplementary tests using a standard causal mediation model are therefore required.
The entropy weight method was used to assign objective weights for measuring the intensity of environmental regulation. To eliminate dimensional impacts, the range normalization method was applied to forwardize the original indicators x1, x2, and x3. The corresponding formula is
S x i = ( x i m i n x i ) ( m a x x i m i n x i )
The proportion of the j-th observation under the i-th indicator is calculated by
P i j = S x i s u m ( s x i )
Entropy values and difference coefficients are calculated by
e i = s u m ( p i j ln p i j ) ln n
where n represents the total number of observations, equal to 4794. Next, the difference coefficient is defined as d i = 1 e i . A larger difference coefficient implies that the indicator contains more informative content. The weight of each indicator is derived via w i = d i s u m ( d i ) . Finally, the composite score reflecting environmental regulation intensity of each city is obtained through weighted summation: S c o r e = s u m ( w i s x i ) .

3.3. Data Sources and Descriptive Statistics

This study uses China’s “Sci-Tech Finance Pilot Policy” as a quasi-natural experiment to measure its impact on urban carbon emission efficiency (CE). It analyzes panel data from 282 prefecture-level cities from 2006 to 2022. CE data were taken from the China Urban Construction Statistical Yearbook, China Urban Statistical Yearbook, and Global Environmental Research Center. Mediating and control variables are taken from official sources including the China Energy Statistical Yearbook, China Science and Technology Statistical Yearbook, and local statistical bureaus. Missing data are interpolated, and cities with large data gaps are excluded.
Descriptive statistics are given in Table 2. The total sample included 4512 observations (800 treatment group, 3712 control group). The average CE value is 1.1109, with a standard deviation of 0.508 and a range of 13.35, suggesting considerable regional variation in emission efficiency and highlighting the uneven progress of green development across cities.

4. Empirical Result Analysis

4.1. Baseline Regression

Table 3 presents the estimation outcomes for Model (3). In column (1), the coefficient was 0.3668. This coefficient is statistically significant at the 1% level and is derived without the inclusion of control variables or fixed effects. Column (2) introduces individual and time fixed effects, yielding a coefficient of 0.3562. Column (3) incorporates both fixed effects and control variables, producing a coefficient of 0.3322 (significant at 1%). The implementation of sci-tech finance policies has significantly improved urban carbon emission efficiency. On average, the sci-tech finance pilot policy raises urban carbon emission efficiency by 0.3322 units. Hypothesis H1 is validated.

4.2. Robustness Tests

4.2.1. Parallel Test

The parallel trend assumption is essential for assessing policy impacts through the difference-in-differences approach. While the baseline regression results show that the sci-tech finance policy notably improves carbon emission efficiency (CE) and fosters urban green development, these findings may not be fully reliable due to potential pre-existing differences between treatment and control groups. For the conclusions of the difference-in-difference method to be valid, systematic differences between groups must be absent before policy implementation. Following Beck [37], we specify the following model:
C E i t = α 0 + j = 4 4 a j T F I N i t j + γ X i t + μ i + δ i + ε i t
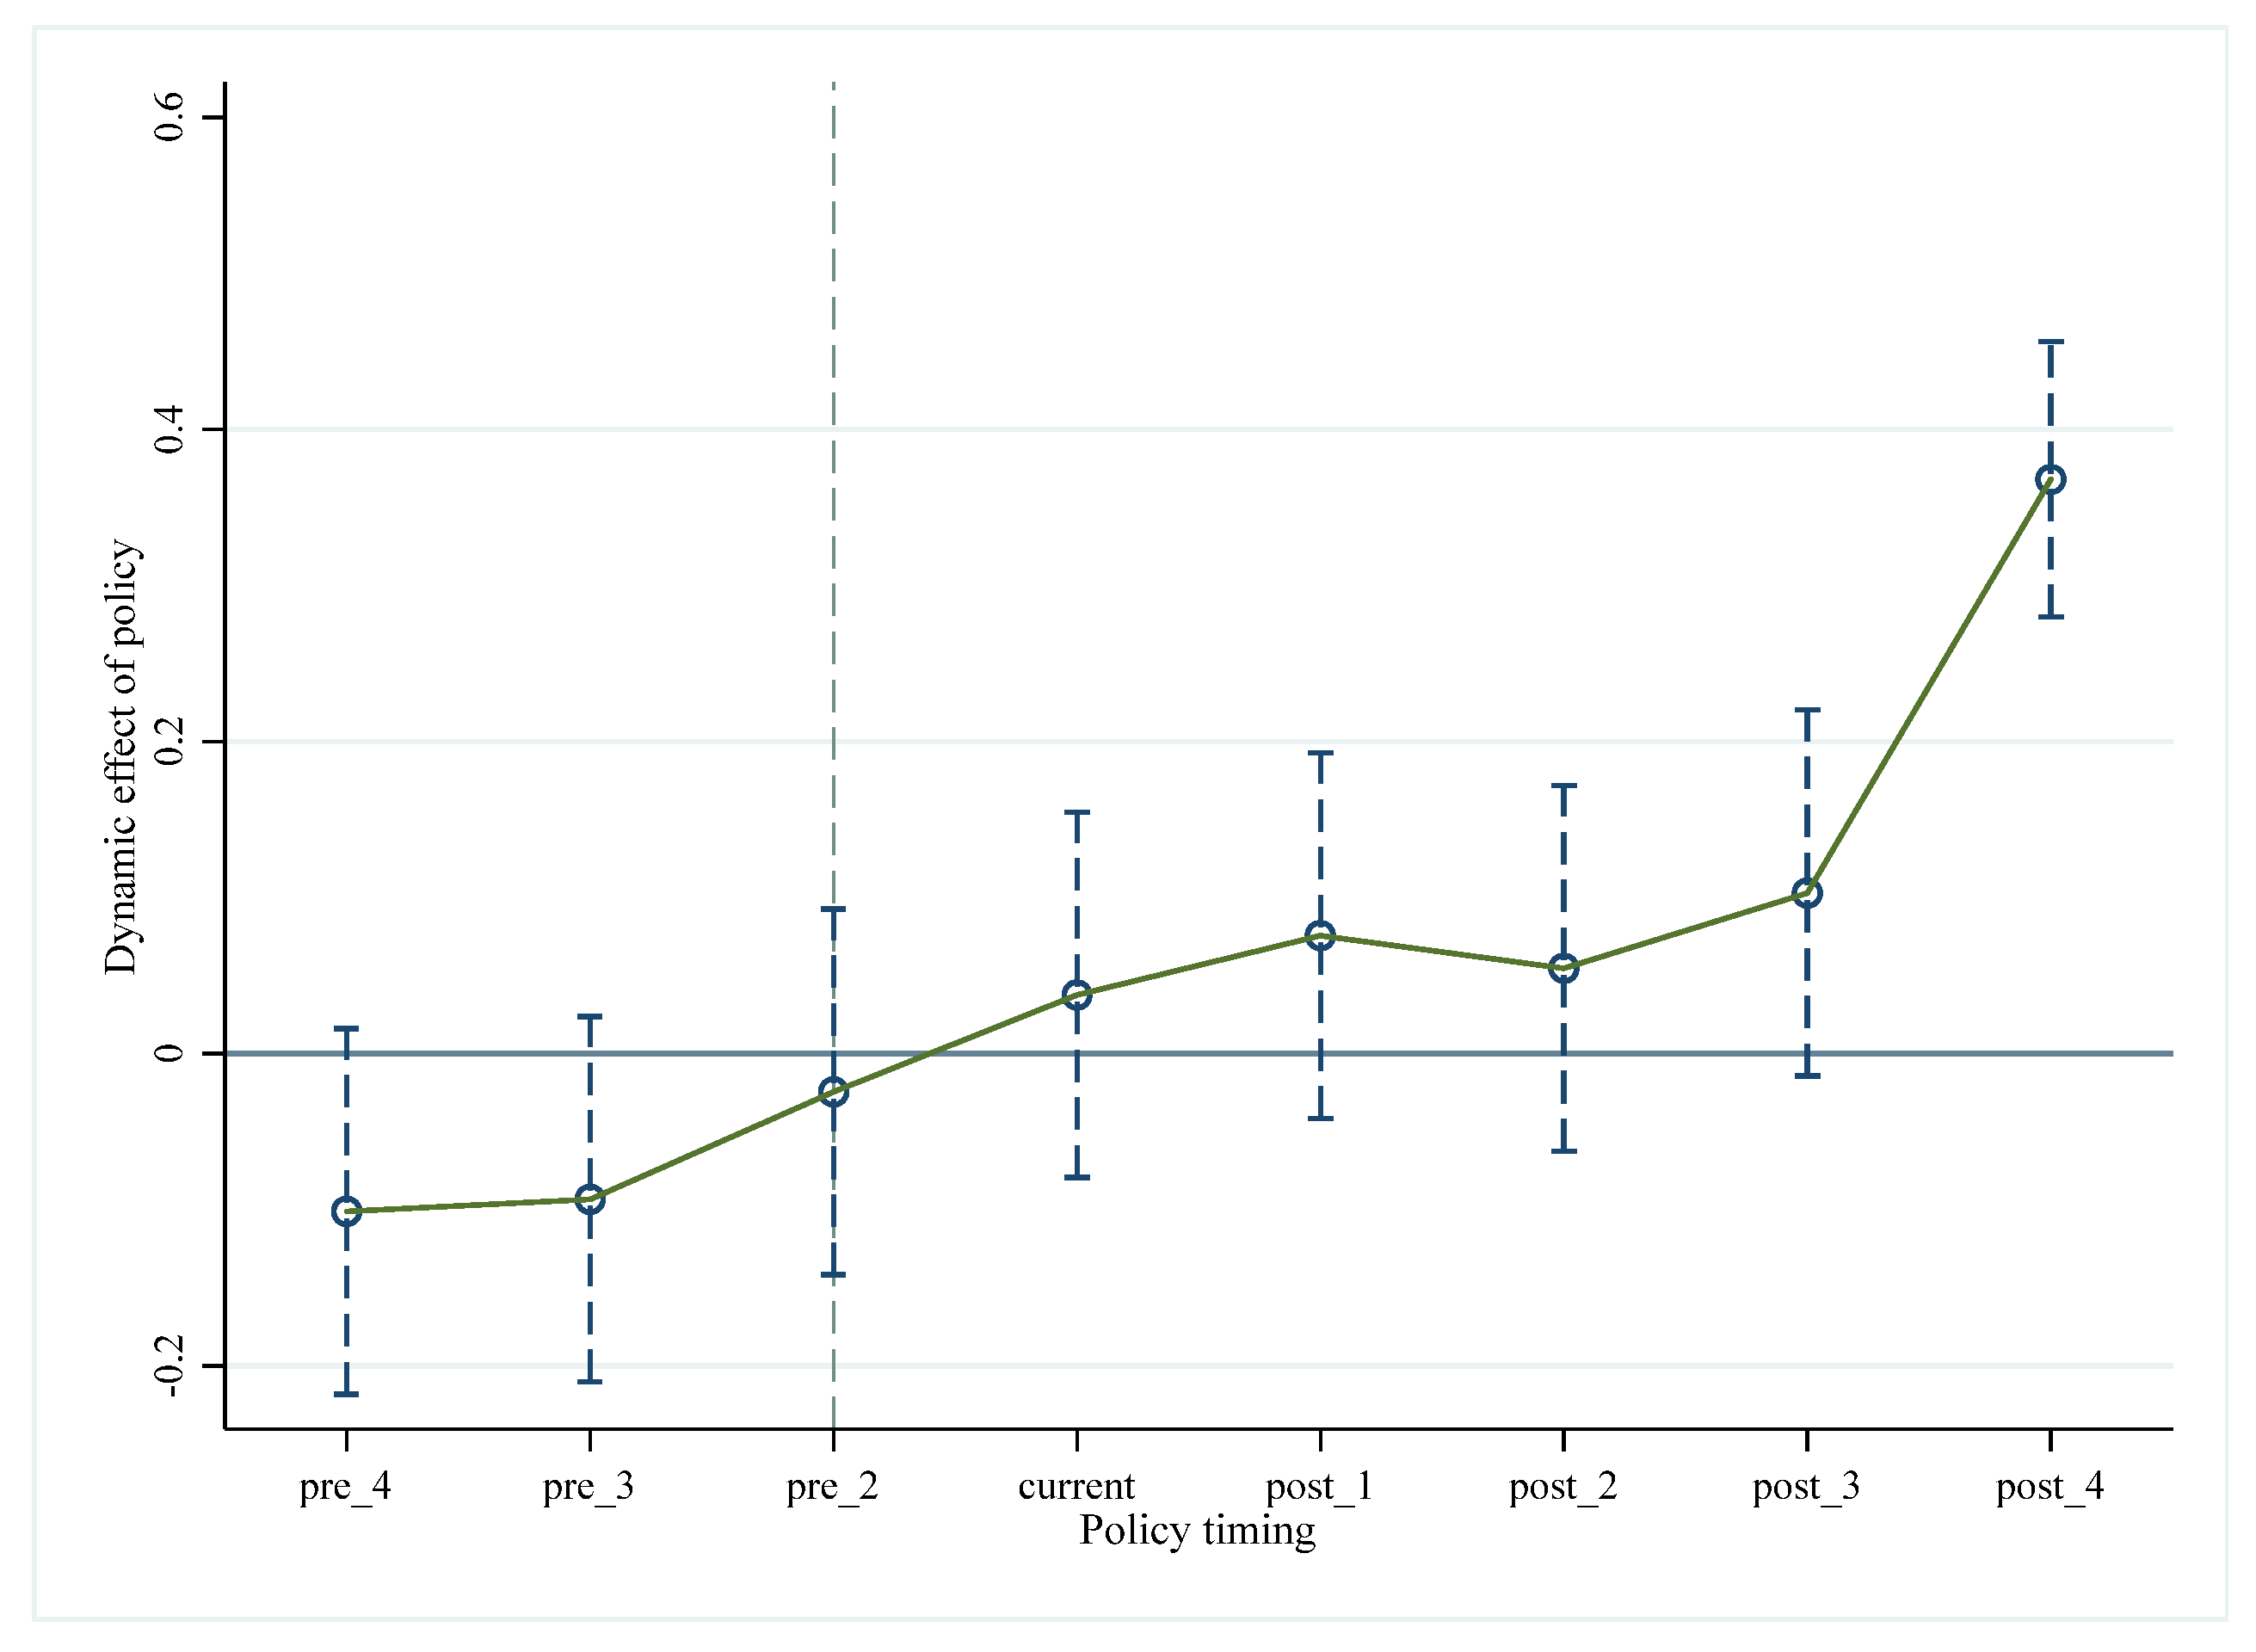
where T F I N i t j represents dummy variables for j years before/after the policy. Given that the policy was first proposed in December 2010 and implemented in 2011, we set the year preceding policy adoption as the baseline. Figure 1 shows insignificant coefficients for all pre-policy periods (post_3), satisfying the parallel trend assumption. Post-policy coefficients are significantly positive and exhibit an upward trend, confirming the policy’s effectiveness in improving CE.

4.2.2. Placebo Test

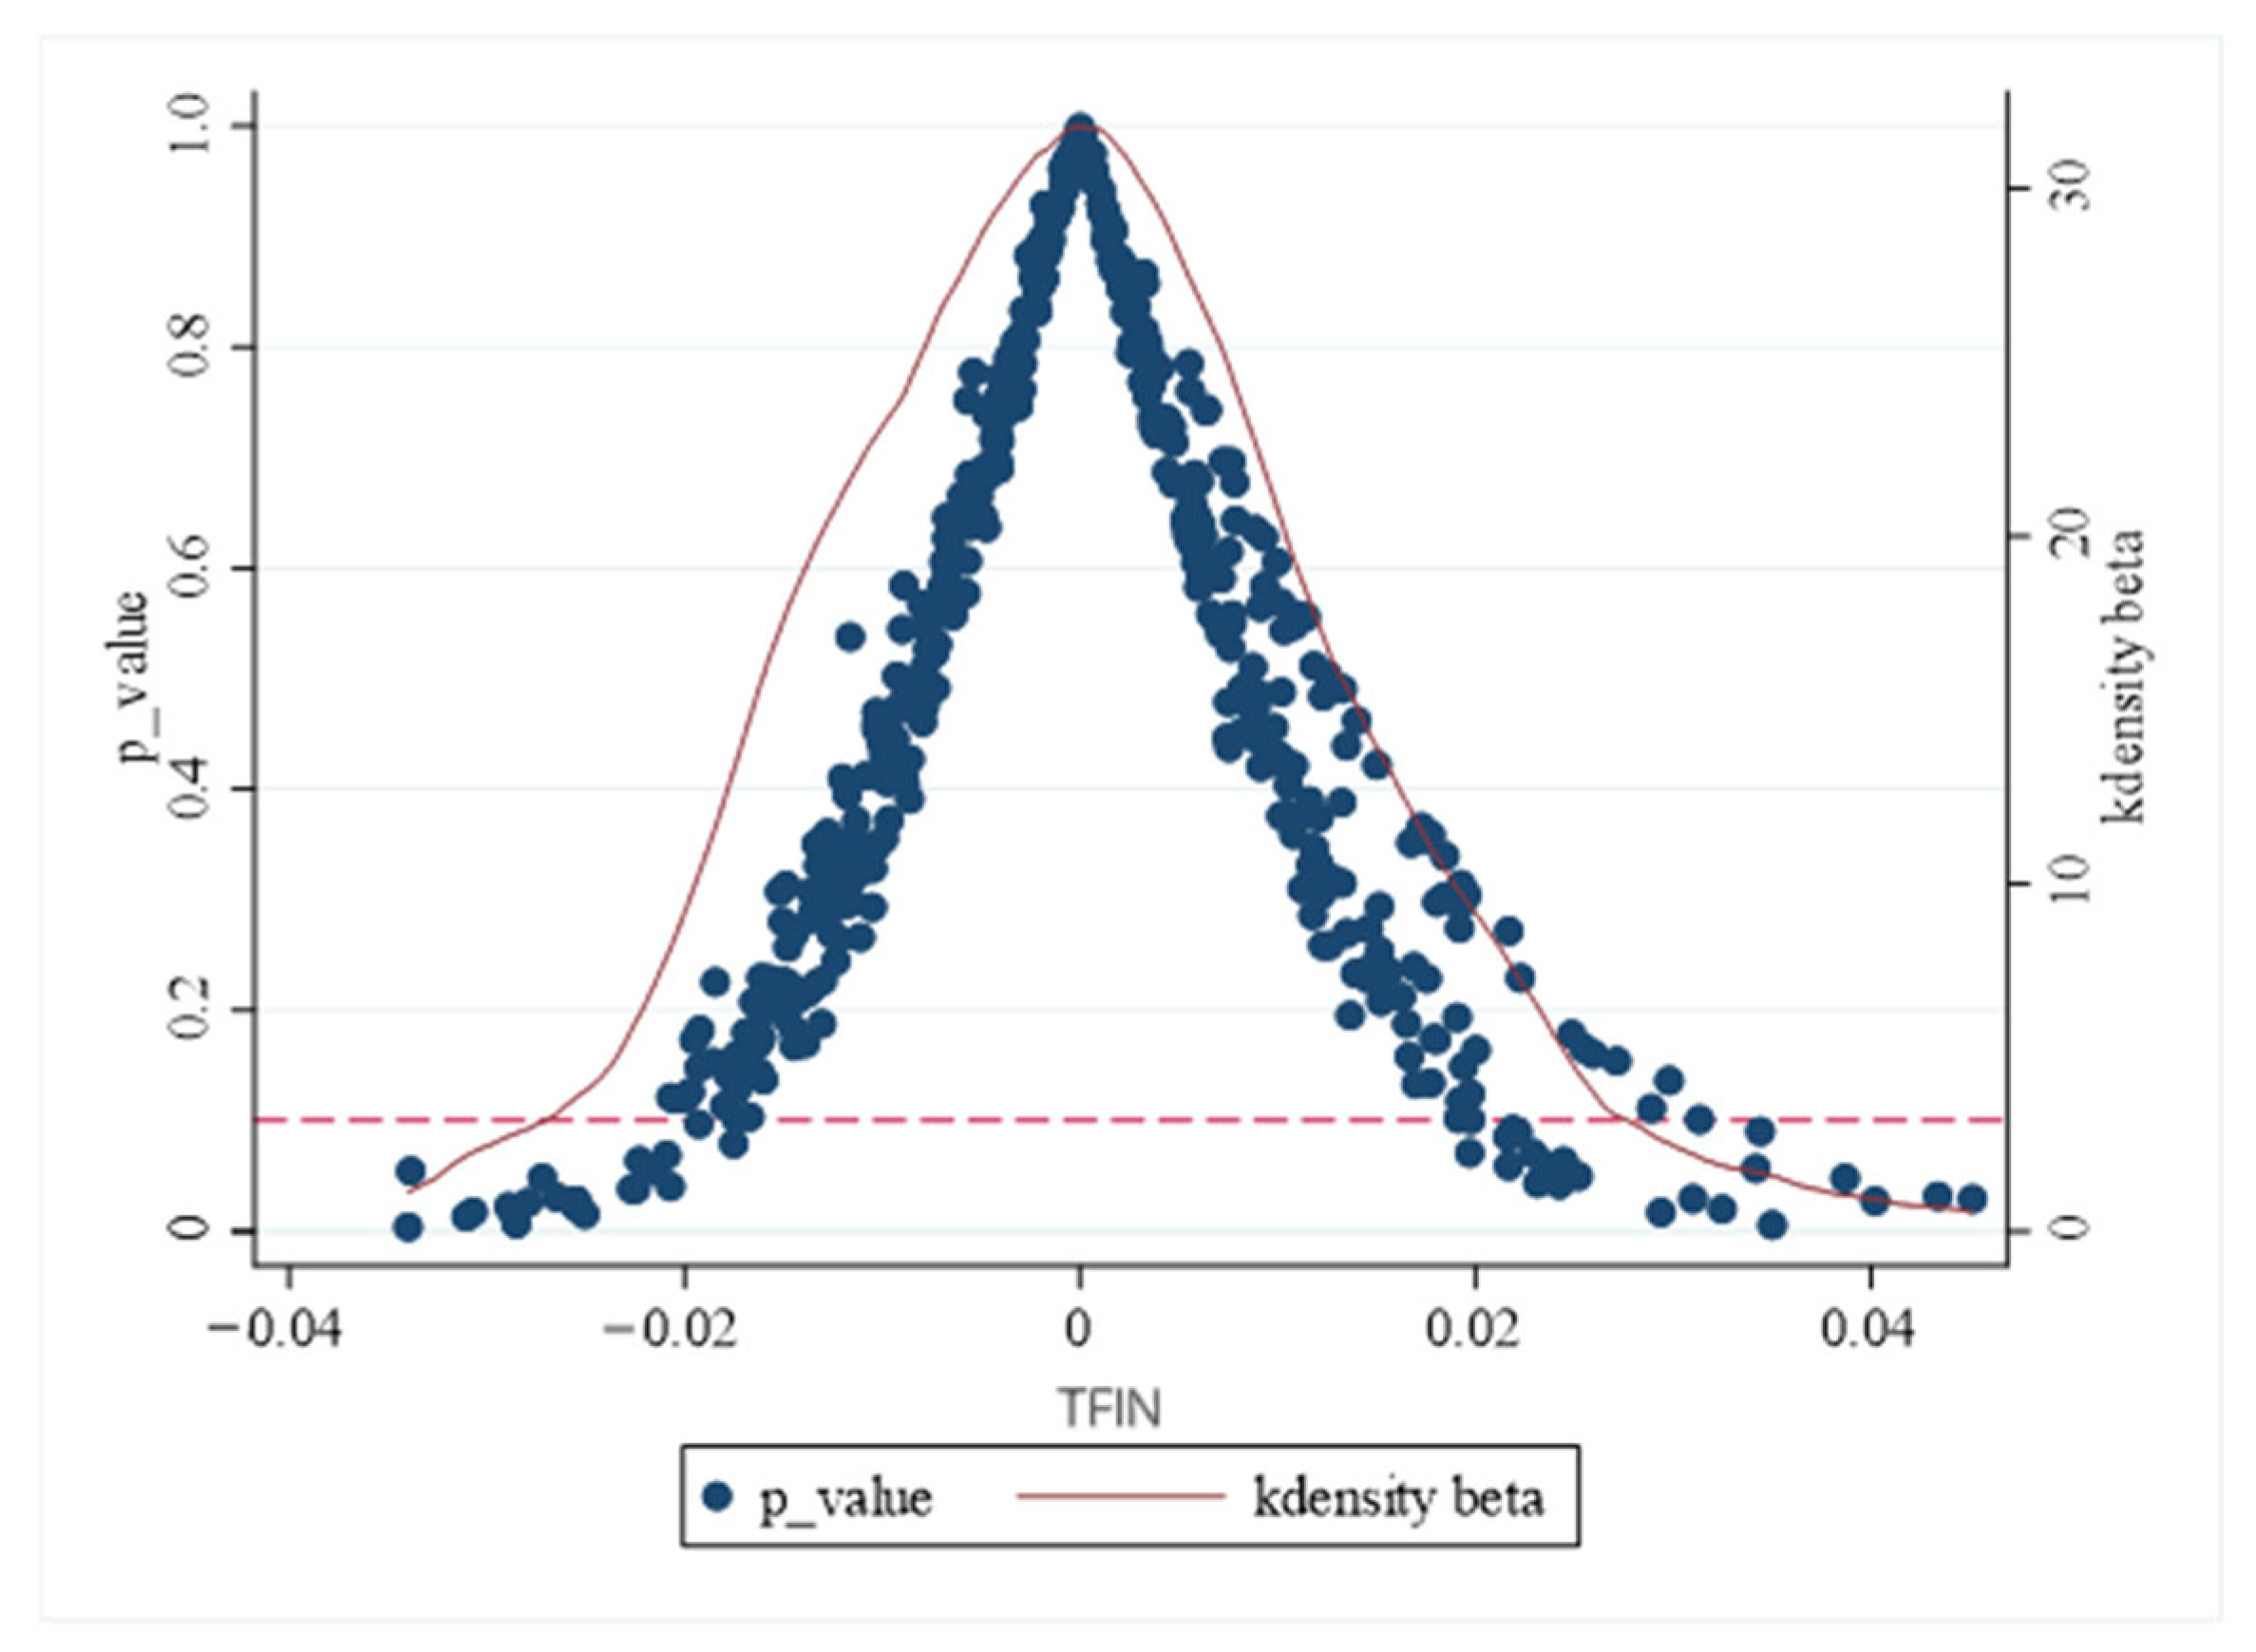
To exclude random interference, we conducted a placebo test by randomly assigning treatment status while retaining the actual policy timeline. The procedure involves (1) randomly selecting pilot cities from the full sample; (2) re-estimating Model (3) for pseudo treatment and control groups; (3) repeating this process 500 times to generate 500 pseudo-policy coefficients. As shown in Figure 2, most p-values exceed the 10% significance threshold, indicating that the true policy coefficient significantly differs from placebo estimates. This supports the idea that the observed improvements in CE are due to the sci-tech finance policy, rather than random influences, thus confirming the robustness of the baseline results.

4.2.3. PSM—DID

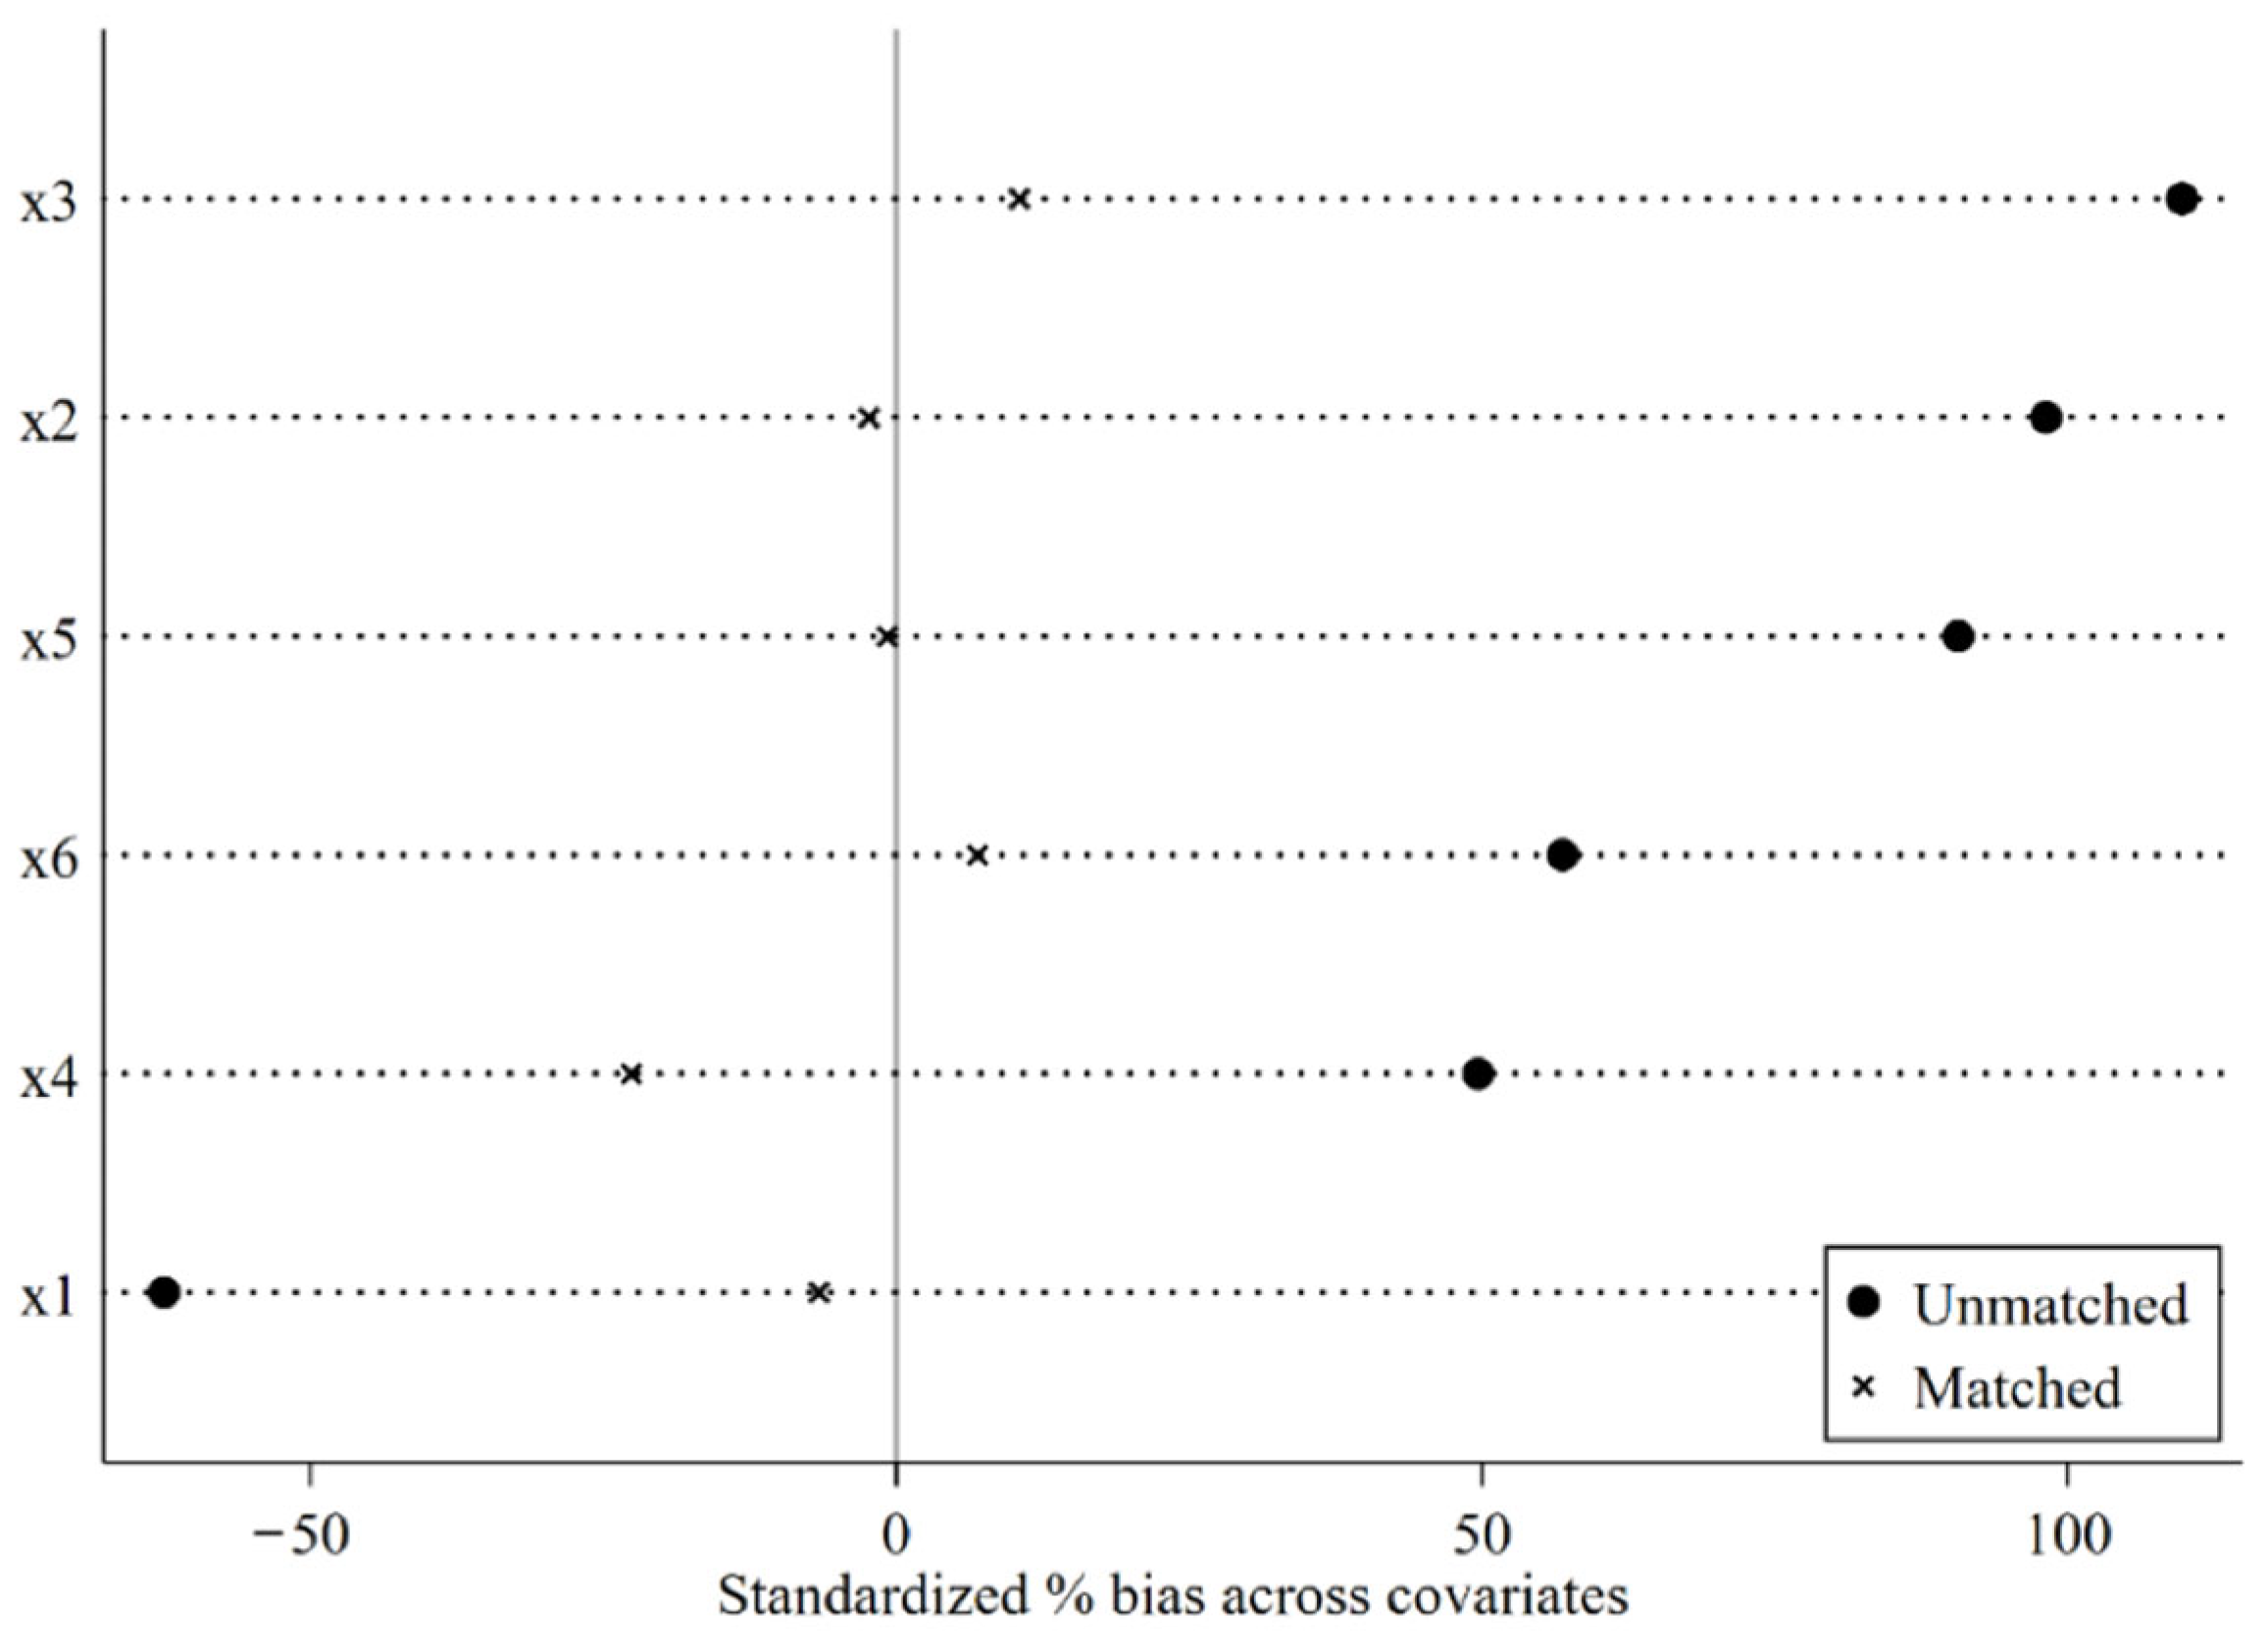
To address self-selection bias in pilot city designation, we applied propensity score matching (PSM) combined with the difference-in-difference method. The sample was Winsorized at 1%, and a bootstrapped 1:3 nearest neighbor matching method was employed to estimate propensity scores via Logit regression. Post-matching standardized bias (Figure 3) reveals substantial reductions in covariate imbalances, with deviations converging near zero, demonstrating effective bias mitigation.
PSM-DID results (Table 4, Column 1) yield a TFIN coefficient of 0.1943 (significant at 1%), consistent with baseline estimates. This confirms the reliability of conclusions after controlling for selection bias.

4.2.4. Alternative Dependent Variable

To address measurement bias in CE, we substituted it with per capita carbon emissions (PCO2), calculated as total emissions divided by resident population. The regression results (Table 4, Column 2) show a TFIN coefficient of −1.3497 (significant at 1%), aligning with CE-based findings and further confirming robustness. In this paper, capital stock, number of employees at the end of the year, and urban electricity consumption were used as input variables, while real GDP, industrial soot, wastewater, and sulfur dioxide were used as output variables to calculate urban green total factor productivity (GTFP) for robustness tests. Column (3) in Table 4 presents the regression results where the explained variable is replaced with GTFP. It is found that the coefficient of TFIN is 0.2659 at the 1% significance level, which further indicates that science and technology finance is conducive to promoting urban green and high-quality development.

4.2.5. Competing Policy Exclusion

To isolate the sci-tech finance policy’s impact, we exclude cities participating in low-carbon or smart city pilots. Post-exclusion regressions (Table 5) yield TFIN coefficients of 0.1150 and 0.3472 (both significant at 1%), underscoring the policy’s independent effect on CE. To clearly define the conceptual boundary of the core policy investigated in this paper, a concise comparative table is constructed from four dimensions including core objectives, supporting financial instruments, low-carbon emission reduction orientation and fundamental differences, so as to visually distinguish the three types of pilot policies, as shown in the Table 6.

4.2.6. Changing the Model Specification

The results of adding city × year interactive fixed effects to the benchmark regression model are shown in Column (3) of Table 5. The regression coefficient of science and technology finance (TFIN) is 0.2566, which is significant at the 1% level. It can be seen that the benchmark regression results remain robust after changing the fixed effects.

4.3. Mediation Analysis

The previous discussion focused on the effect of the science–technology–finance integration pilot policy on the carbon emissions efficiency of Chinese cities. Based on the earlier theoretical analysis, this research empirically explores its impact via innovation, financing, and energy structure channels. In conducting the mediation effect model test, innovation input intensity and innovation efficiency were treated as mediating variables for the innovation channel, financial institution efficiency as a mediating variable for the financing channel, and energy structure as a mediating variable for the energy channel. The Jiang Ting two-step method is used, following model (4).
This study measures urban innovation ability by using innovation input intensity and efficiency. The regression results in columns (1), (2), and (3) of Table 7 show TFIN coefficients of 0.0072, 0.0673, and 0.1152, significantly positive at the 1% and 10% confidence levels. This suggests that the science–technology–finance policy significantly boosts innovation input intensity and efficiency, thereby enhancing urban innovation ability. Moreover, much research has proven that strengthening technological innovation capacity is vital for improving carbon emission efficiency and promoting urban low-carbon development [6,14]. Green technology, as a key area of innovation in environmental protection, plays a crucial role in advancing the circular economy, enhancing resource efficiency, and minimizing resource consumption. Sci-tech finance can contribute to sustainable development both directly, through investment, and indirectly, by supporting the growth of green technologies. Irrespective of the method employed, the degree of innovation in green technology serves as a crucial factor in determining the influence of sci-tech finance [21]. Technological innovation capacity serves as the central force driving urban development. In the initial phases of green technology innovation, challenges such as underdeveloped technologies and high costs may impede industrial upgrades, potentially increasing urban carbon emissions. However, when green technology innovation hits a certain threshold, clean energy costs drop, prompting more use of clean energy and less fossil fuel consumption. By raising innovation input intensity and efficiency, cities can use resources better and cut per-unit-output carbon emissions, thus improving overall carbon emission efficiency. In summary, the sci-tech finance policy can boost urban carbon emission efficiency by enhancing innovation input intensity and efficiency, validating hypothesis H2.
To assess financing ability, the efficiency of financial institutions is used as an indicator for urban financing capacity. The regression results in column (4) of Table 7 show that the TFIN coefficient is 0.174, significantly positive at the 1% confidence level. This indicates that the sci-tech finance policy has a significant positive effect on improving financial institution efficiency. How does the urban financing capacity influence the carbon emission efficiency? A review of the relevant literature indicates that enhancing the urban financing capacity is a vital strategy for improving the carbon emission efficiency and alleviating environmental pollution. On one hand, sci-tech finance enables the financial sector to allocate resources effectively, amplifying the financing impact and allowing green businesses to access funds rapidly. Additionally, it helps direct more social investments into low-carbon sectors, complementing market-driven environmental policies [26]. Conversely, the sci-tech finance policy allows the green technology production sector to obtain financial resources more easily. As a result, it provides support for the research, development, and application of green technologies designed to reduce carbon emissions. It also exerts an “exclusion effect” on heavily polluting sectors by tightening their financing constraints and increasing production costs [27]. By improving urban financing capabilities, sci-tech finance can increase investment in clean energy projects, promote green transportation upgrades, facilitate energy-saving building renovations and green construction, and improve urban waste management and recycling. As a result, the sci-tech finance policy can boost urban carbon emission efficiency by increasing the effectiveness of financial institutions, thus providing support for hypothesis H3.
For the energy aspect, the energy structure is chosen as the mediating variable. The regression results in column (5) of Table 7 show that the TFIN coefficient is −0.0223, significantly negative at the 5% confidence level. This means the sci-tech finance policy can effectively reduce coal reliance, leading to a gradual drop in coal consumption and promoting a shift towards a more sustainable energy consumption structure. Such a transition is vital for green and low-carbon economic development. He et al. [30] indicated that technological innovation effectively curbs environmental pollution by steering industrial spatial agglomeration and cutting down energy consumption. The energy consumption structure acts as a constraint on the enhancement of carbon emission efficiency. Liu [31] carried out a quantitative study on China’s carbon dioxide emission efficiency, energy consumption structure, and regional differences. They found that optimizing the energy consumption structure can substantially reduce carbon dioxide emissions. The development of sci-tech finance has remarkably reduced the dependence on traditional fossil fuels, thus leading to a substantial drop in carbon emissions from fossil fuel utilization. Additionally, through technological advancements and improvements in energy management, energy efficiency has been greatly enhanced, allowing for a more effective and rational use of energy. This shift positively influences regional carbon emission efficiency, fostering a greater focus on environmental protection and sustainable development, while supporting economic growth and creating a strong foundation for a low-carbon economy. This supports the validation of hypothesis H4.

4.4. Heterogeneity Analysis

4.4.1. Heterogeneity Based on Geographic Location

Considering the differences in economic development, industrial set-ups, financial market development, and the availability of technological and human resources between eastern and western China, the effects of the sci-tech finance policy are expected to be distinct. Therefore, we split the total sample into two subgroups—eastern cities and central–western cities—based on the National Bureau of Statistics’ geographical classification. The eastern cities subgroup has 1888 observations, and the central-western cities subgroup has 2624 observations. To examine how the sci-tech finance policy influences carbon emission efficiency in these areas, separate regression analyses were performed for each subgroup, as shown in columns (1) and (2) of Table 8. The results show that the coefficients of the science and technology finance policy dummy variable are significantly positive at the 1% level in both regions. However, the coefficient is larger in eastern cities, indicating that the policy has a stronger impact on improving carbon emission efficiency in eastern regions. This means that after the implementation of the policy, the carbon emission efficiency in both regions has been significantly improved, generally promoting green and high-quality development, but the effect is more pronounced in eastern regions. This reflects the deep connection between policy effects and regional development foundations. There are several reasons for this discrepancy. The eastern region has a high level of economic development, with a large proportion of high-tech industries in its industrial structure. Its industrialization and urbanization processes are more mature, with abundant technological and human resources, and a well-developed financial market. These conditions enable science and technology finance policies to more efficiently meet the needs of green and low-carbon technology research and development as well as industrial upgrading, promoting the concentration of policy resources in areas with great potential for emissions reduction. In contrast, the industrial structure in central and western regions is still dominated by traditional high-carbon energy industries, with insufficient coverage of financial services, limited public financial support and capital market financing capacity, and relatively weak technological and talent reserves. These factors cause science and technology finance policies to face more constraints when guiding resources towards low-carbon transformation areas, restricting the policy effects, and thus leading to differences in effects between regions, with the policy having a less significant impact in central and western regions.

4.4.2. Heterogeneity Based on the Stringency of Environmental Regulations

The Porter hypothesis suggests that environmental regulations increase the extra costs for heavily polluting enterprises, forcing them to adopt greener production methods to meet emission standards. This not only encourages enterprises to adopt greener production methods but also enhances their overall competitiveness. The government plays a key role as an information hub, mandating that businesses disclose environmental data through regulations. This reduces information asymmetry in the financial market, allowing financial institutions to more effectively assess green investment opportunities. Governments can channel capital into green low-carbon projects via sci-tech finance policies to support industrial transformation. To examine how these policies affect carbon emission efficiency under different environmental regulation levels, this study uses industrial SO2, smoke/dust, and wastewater emissions as key factors. The entropy method calculates factor weights to create a composite city-level environmental regulation index. Cities are divided into strict (high-score) and lenient (low-score) groups based on sample average scores (Table 8 columns 3–4). The regression results show that the core variable TFIN has significant positive effects at 1% (strict group) and 10% (lenient group) confidence levels. The strict group coefficient (0.3635) is much higher than the lenient group (0.0555), indicating stronger policy impacts under tighter regulations. Sci-tech finance and environmental policies reduce per capita emissions synergistically by guiding capital flows, optimizing resource allocation, and enhancing environmental information transparency. Regions should strengthen environmental regulations, enforce stricter pollution penalties, and leverage market oversight to realize full policy synergies. In regions with strict environmental regulations, the selection of science and technology finance policy tools is more targeted: local governments may collaborate with financial institutions to launch “special credit for environmental protection technology upgrading,” offering interest rate preferences for enterprises’ end-of-pipe treatment technology transformation and clean energy substitution projects, and linking emission reduction effects with credit lines; green bond issuances are more focused on energy efficiency improvement projects in high-energy-consuming industries, accompanied by strict environmental information disclosure requirements; risk compensation mechanisms also tilt toward low-carbon technology research and development, providing a higher proportion of bad debt risk sharing for technology-based enterprises in new energy and other fields. In regions with loose environmental regulations, science and technology finance policy tools are relatively crude: they rely more on general science and technology credit support, with vague definitions of the green attributes of projects, and some funds may flow into fields that only have technological innovation but limited emission reduction effects; the coordination mechanism between environmental protection departments and financial institutions is weak, and the linkage between enterprises’ environmental records and financing qualifications is low. These differences in policy implementation details enable science and technology finance to more accurately stimulate enterprises’ motivation for emission reduction in regions with strict regulations, while in regions with loose regulations, it is difficult to form a synergy for emission reduction due to insufficient policy focus. This further explains why the policy effect coefficient in the strict regulation group is significantly higher.

4.4.3. Heterogeneity Based on the Process of Marketization

This paper uses the marketization index developed by Fan Gang [38] as the standard for measuring the process of marketization. Using the average annual marketization index for each city from 2006 to 2022, cities are categorized into two groups: those with higher marketization and those with lower marketization. The results of this classification are presented in columns (1) and (2) of Table 9. The analysis reveals that, in terms of the carbon emission efficiency index, the estimated coefficient of sci-tech finance is significantly greater in cities with higher marketization compared to those with lower marketization. This suggests that the policy is more effective in enhancing carbon emission efficiency in regions with more market-oriented economies. In highly marketized regions, the market mechanism plays a key role in resource allocation, enabling a more efficient distribution of resources based on market signals. Financial institutions are better equipped to allocate funds to enterprises or low-carbon projects that have a higher potential for energy savings and emission reductions. Moreover, sci-tech finance supports the free flow and optimal combination of production factors such as capital, technology, and skilled labor. Conversely, in regions where the degree of marketization is lower, administrative interferences might result in the misallocation of sci-tech finance resources. It is possible that funds could be channeled towards high-carbon industries that enjoy administrative protection. This, in turn, weakens the policy’s effectiveness in enhancing carbon emission efficiency. Moreover, the flow of production factors may be more restricted. As a result, it becomes arduous for enterprises to obtain the ideal combination of resources required for reducing carbon emissions. This situation curtails the influence of sci-tech finance, even when such resources are accessible.

4.4.4. Heterogeneity Based on Resource Endowment

Using the State Council’s resource-based city development plan, cities are categorized as resource-based or non-resource-based. The regression results in Table 9 (cols. 3–4) show the divergent effects of sci-tech finance policies on carbon efficiency: positive impacts in non-resource cities but negative effects hindering green development in resource-based ones. In resource-scarce and non-resource cities, these policies drive tech innovation, promoting low-carbon technologies and sustainable growth by compensating for natural resource limitations. In contrast, resource-based cities, relying on resource extraction for growth, have an extensive model and stable industry, which makes the policy less effective. Although science and technology finance aims to guide capital flow into innovative fields to promote industrial upgrading, its preference for high-growth low-carbon technologies conflicts with the characteristics of traditional industries in resource-based cities, such as heavy assets and slow technological iteration. The long-standing industrial inertia formed by resource-based cities’ reliance on resource extraction has led to transformation costs for traditional enterprises in terms of equipment specificity, labor skill structure, and ecological restoration liabilities. However, the risk pricing logic of science and technology finance tends to favor emerging industries with short-term results, making it difficult for financial resources to effectively flow into the green technological transformation of traditional industries. Meanwhile, local governments’ tax dependence on resource industries and financial institutions’ path dependence on traditional credit models have further strengthened the imbalance. Science and technology financial resources are inclined toward non-resource-based industries, and the funding gap for traditional industrial transformation has expanded. Ultimately, in the short term, the policy not only fails to promote the green transformation of traditional industries but may even exacerbate transformation difficulties due to resource diversion, creating a phased contradiction between policy intentions and transformation realities. Although science and technology finance aims to promote industrial transformation, the shift from traditional industries to green industries is a gradual process. Even in the process of green transformation, the development of emerging industries requires substantial financial investment and technological research and development, with a long cycle from research to commercialization, making it difficult to quickly adapt to new development requirements and leading to a decline in production efficiency. In non-resource-based cities with scarce natural resource endowments, the intrinsic logic of sci-tech finance policies driving technological innovation aligns with the core essence of “factor constraints driving innovation leaps” emphasized by the structural transformation theory. This logic remedies the shortage of urban natural resource supply through the technological substitution pathway, thereby providing core support for the in-depth penetration of low-carbon technologies and regional sustainable growth [39]. In sharp contrast, the differential effects of sci-tech finance policies in resource-based cities need to be interpreted in detail based on the “resource curse” theoretical framework. The “Dutch disease” effect formed by such cities’ long-term dependence on the resource extraction industry has trapped them in a path-dependence dilemma of “resource dependence–technological lock-in”. Moreover, the heavy asset nature and rigidity in technological iteration exhibited by traditional resource industries under the extensive development model are precisely the typical practical manifestations of the “technological lock-in” phenomenon. An irreconcilable fundamental contradiction has emerged between this inherent attribute and the natural preference of sci-tech finance policies for high-growth low-carbon technology fields. Therefore, after the implementation of science and technology finance policies, financial resources may flow more to non-resource-based enterprises, while resource-based enterprises receive relatively less financial support, making it difficult for them to carry out effective energy conservation and emission reduction transformations. The implementation of science and technology finance policies in resource-based cities may be constrained by traditional economic development models, resulting in negative effects during policy implementation.
Jiang Ting’s two-step mediation method only tests the two-stage regression relationships between the independent variable and the mediator, as well as between the independent variable and the explained variable. It fails to strictly distinguish the total mediation effect, direct effect and suppressing mediation effect, and thus cannot separate the specific channels through which the policy generates adverse impacts in resource-based cities. The three transmission paths of innovation input, financial allocation and energy structure function as positive mediators in ordinary cities, yet produce negative effects in resource-based cities. Potential reasons are as follows: sci-tech financial resources are excessively tilted toward emerging industries, squeezing funds available for the green transformation of traditional high-carbon industries; the channel for energy structure optimization loses efficacy due to coal resource lock-in; traditional enterprises face long innovation return cycles and high risks, disabling the emission reduction function of the innovation channel. Jiang Ting’s two-step approach can only judge whether the mediator is significant as a whole, but cannot quantify the offsetting magnitude of positive and negative effects from each of the three channels, making it difficult to clarify the internal transmission logic of policy adverse effects under resource dependence constraints. To accurately isolate the reverse mediation mechanism in resource-based cities, a standard causal mediation analysis model is required, which enables quantitative measurement of channel heterogeneity via total effect decomposition and identification of suppressing mediation effects. Restricted by manuscript length and data conditions, this paper only conducts a unified mediation test for the full sample.

4.5. Analysis of Spatial Spillover Effects

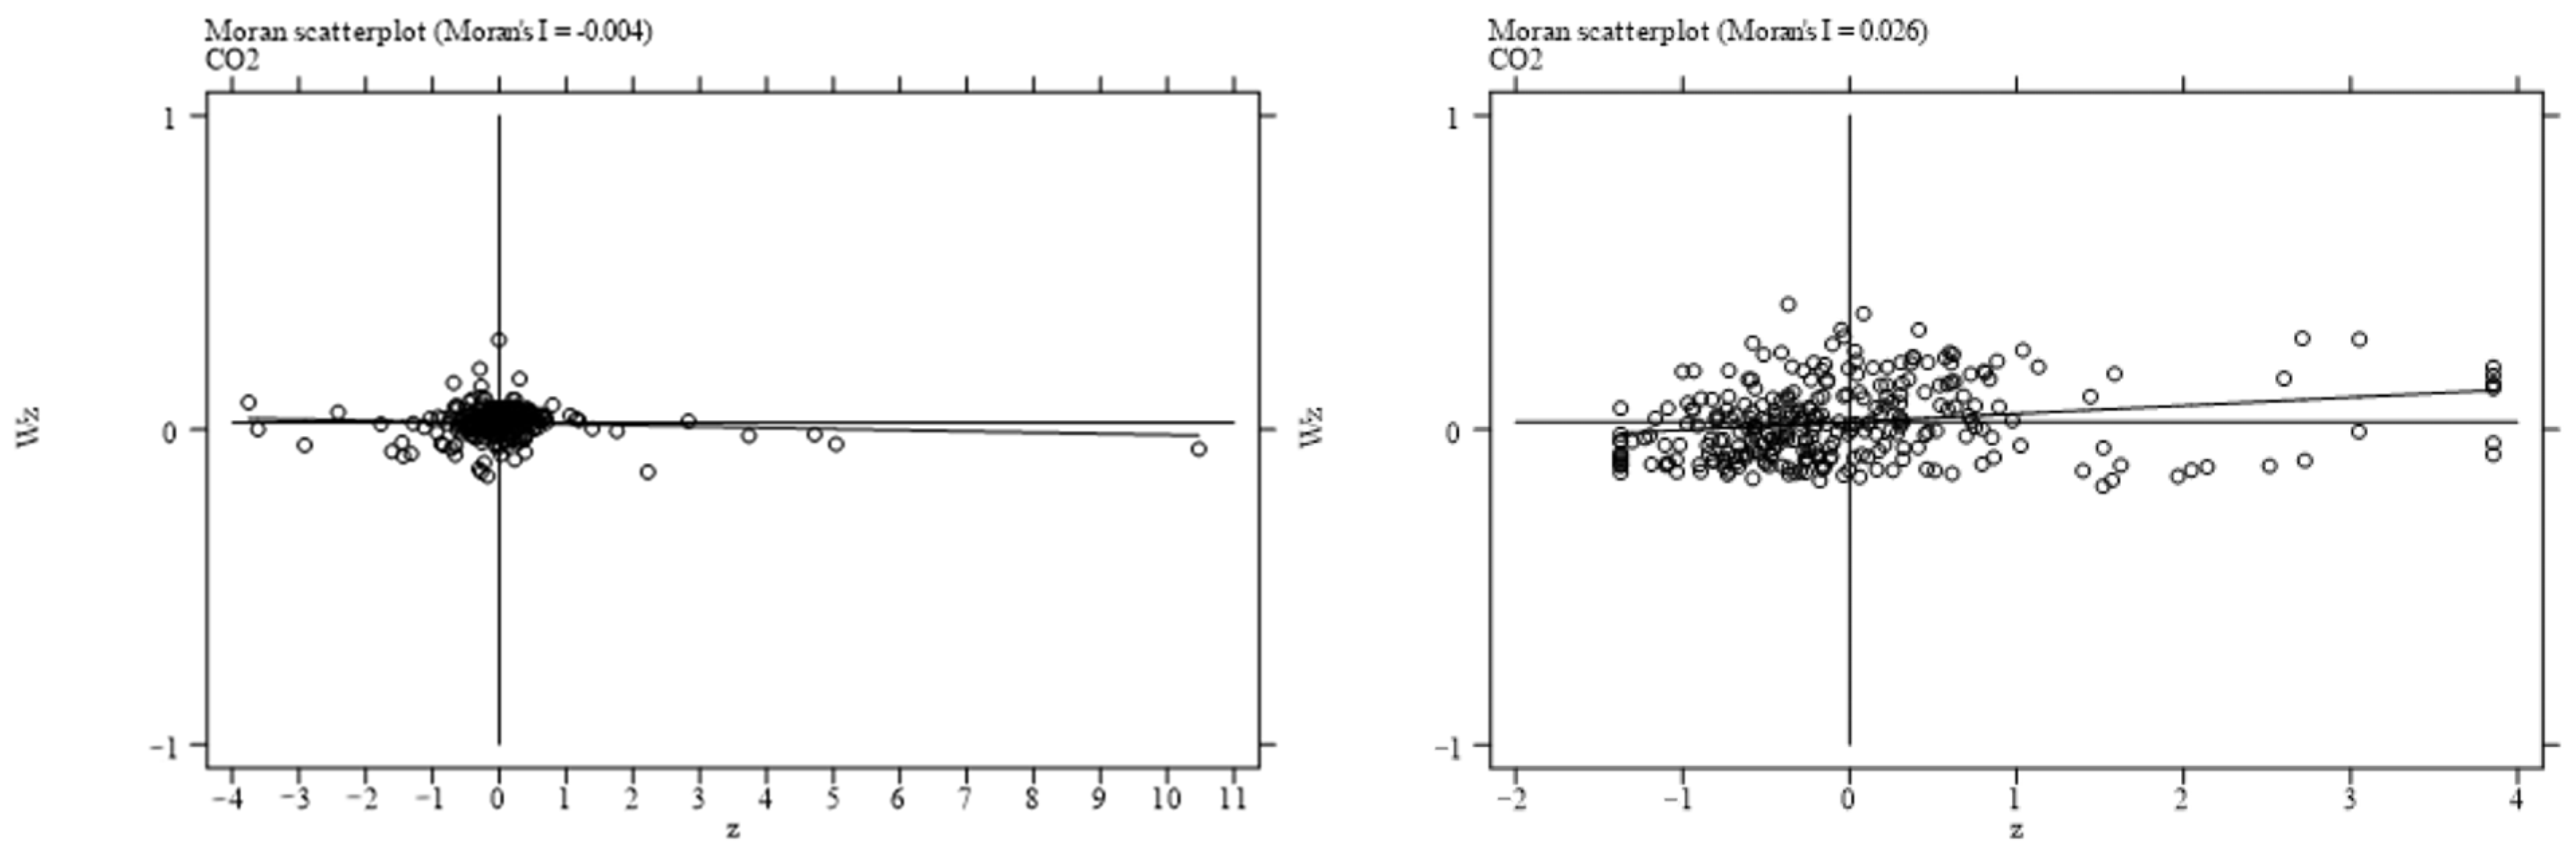
Through the analysis of the global Moran’s I in Table 10, it is confirmed that there is spatial autocorrelation among prefecture-level cities. Figure 4 plots the local Moran scatter plot of carbon emission efficiency in 2007 and 2022, where cities are mainly distributed in the first and third quadrants. Currently, China’s carbon emission efficiency is dominated by low-low agglomeration and high-high agglomeration, indicating that China’s carbon emission efficiency has significant local spatial agglomeration characteristics in terms of distance space. To ensure the robustness of the results, this paper further tests the spatial error and spatial lag effects, with specific results shown in Table 11. To verify the selection of the model and the rationality of fixed effects, this paper employs the Wald test, LR test, and Hausman test. The Wald test confirms that the spatial Durbin model (SDM) will not degenerate into a spatial lag model (SLM) or a spatial error model (SEM); the LR test results indicate that the spatial Durbin model is superior to the spatial lag model and spatial error model; the Hausman test rejects the null hypothesis, suggesting that fixed effects can be adopted. Finally, the LR test results confirm that the two-way fixed effects model is more appropriate. Therefore, this paper selects the spatial Durbin model with two-way fixed effects for the analysis of spatial correlation.
Table 12 (1) reports the estimation results of the spatial spillover effects of science and technology finance on urban carbon emission efficiency. It can be seen that, based on the spatial weight matrix of inverse distance to the first power, the coefficient rho of the spatial lag term of urban carbon emission efficiency is significantly positive, indicating the existence of spatial dependence; the coefficient of TFIN is also significantly positive, which shows that science and technology finance policies have a significant positive spatial spillover effect on urban carbon emission efficiency. Columns (2) and (3) present the direct and indirect effects of each variable. It can be seen that sci-tech finance exerts a significantly positive direct effect on CE, while its indirect effect is significantly negative. The plausible explanation lies in the inherent preference of sci-tech finance for high-growth, low-emission emerging industries: through capital injection, it accelerates the agglomeration of such industries, restrains the blind expansion of high-energy-consuming and high-emission industries, and drives the transition of the local industrial structure from “high-carbon dependence” to “low-carbon dominance”, thereby improving the overall carbon efficiency. The inhibitory spatial impact of sci-tech finance policies on the carbon efficiency of geographically adjacent regions stems from insufficient technological absorption capacity and institutional barriers in surrounding areas. These factors prevent the effective spillover of local low-carbon technologies; instead, the technological advantages of the local region exacerbate the industrial competitive disadvantage of neighboring areas, inhibiting the improvement of their carbon efficiency.
The following section re-estimates the Spatial Durbin Model based on the economic distance spatial weight matrix. Column (1) of the Table 13 reports the overall regression results of sci-tech finance on urban carbon emission efficiency. As can be observed, the coefficient rho of the spatial lag term for urban carbon emission efficiency is significantly positive at the 1% significance level, which implies obvious positive spatial dependence across cities in terms of carbon emission efficiency. The total effect coefficient of the core policy variable TFIN is 0.4433 and highly statistically significant at the 1% level, which further verifies that the sci-tech finance policy exerts an overall significant positive spatial impact on regional carbon emission efficiency, and the benchmark spatial conclusion remains robust to the change in spatial weight matrix. Columns (2) and (3) respectively report the decomposed direct and indirect effects of the core explanatory variable. The regression outcomes show that the direct effect coefficient of sci-tech finance on local carbon emission efficiency is 0.2255 and significantly positive, while its indirect effect coefficient of 0.2178 is also significantly positive. This differs distinctly from the negative indirect effect identified under the inverse distance weight matrix in the previous analysis, which can be explained by economic linkage mechanisms. The economic distance weight matrix emphasizes industrial linkages and capital flows between cities. After the implementation of sci-tech finance policies, low-carbon tech innovation industries cultivated locally radiate outward through economic channels including industrial chain division of labor, cross-regional investment and financing, and technical cooperation. Local green technologies and sci-tech financial models can be replicated and promoted among economically connected neighboring cities, facilitating simultaneous industrial structure upgrading and carbon emission intensity reduction in adjacent regions, thereby generating positive spatial spillover effects.
Overall, the improvement of local sci-tech finance levels significantly enhances the overall carbon emission efficiency through geographical and economic linkages. This finding is highly consistent with the spatial positive correlation characteristic of sci-tech finance revealed by the previous Moran’s I test, and further verifies the rationality and necessity of incorporating spatial effects into the econometric model analysis.

5. Further Analysis

In this paper, four mainstream machine learning algorithms are adopted for comparative tests in the two-stage prediction equations of double/debiased machine learning, namely Random Forest, Lasso linear regularized regression, Gradient Boosting Tree, and Neural Network. All control variables and their quadratic terms are taken as high-dimensional control variables and incorporated into the machine learning prediction stage as confounding variables. Drawing on Chen Ming’s DML model [40], this study investigates the effects of sci-tech finance on CE growth. The regression results are shown in Table 14. The analysis adopts a 1:5 sample splitting ratio and employs the Random Forest algorithm in machine learning models for prediction in both the main and auxiliary regressions. Column (1) controls only for the linear terms of control variables within the full sample. Building upon Column (1), city-year fixed effects are further controlled. Furthermore, considering potential nonlinear effects of control variables on urban CE that may influence the estimation accuracy of the DML model, quadratic terms of these control variables are incorporated to enhance model specification precision. Column (4) extends the baseline regressions by including quadratic terms of control variables. The results demonstrate that after introducing nonlinear specifications, the coefficients of sci-tech finance on urban CE remain stable with no substantial fluctuations, while continuing to significantly promote urban green low-carbon development at the 1% confidence level.
When specifying the DML model, both the sample splitting ratio and machine learning algorithms were subject to manual determination. To mitigate potential human intervention in parameter configuration, we conducted robustness checks by re-examining multiple splitting ratios and alternative machine learning algorithms. First, while the original model employs the Random Forest algorithm for prediction, we substituted it with Lasso, Gradient Boosting, and Neural Network algorithms to assess algorithmic sensitivity. As shown in columns (1)–(3) of Table 15, the DML estimates using these three alternative algorithms remain statistically significant at the 1% level, indicating that the positive effect of TFIN is robust to machine learning algorithm selection. Second, K-fold cross-fitting is applied to eliminate estimation bias induced by sample splitting, and the complete operational procedure is specified as follows. First, stratified sample splitting is implemented: the full sample containing 4512 observations is randomly divided into two non-overlapping subsamples. Two splitting ratios of 1:3 and 1:7 for the primary subsample and auxiliary subsample are set for robustness checks. Second, the auxiliary subsample is utilized to train the machine learning prediction model to generate predicted values of the explained variable carbon emission efficiency, which are then incorporated into the primary subsample to construct orthogonalized variables after residual elimination. Third, the two subsamples are swapped: the primary subsample is used for model training, and orthogonal residual processing is conducted on the auxiliary subsample. Fourth, linear regression is performed separately on the two groups of orthogonalized residual subsamples to estimate the average treatment effect of the policy TFIN. Finally, the regression coefficients and standard errors from the two subsamples are combined to obtain the final DML estimator, which avoids accidental bias arising from a single sample split. Given the initial 1:5 sample splitting ratio, we further test 1:3 and 1:7 ratios under the Random Forest framework. The results in columns (4)–(5) of Table 15 demonstrate that TFIN’s continues to have an effect on CE with statistical significance at least at the 1% level across varying splitting proportions. This confirms that the experimental conclusions are insensitive to cross-fitting ratio specifications, thereby validating the policy efficacy of sci-tech finance in enhancing urban CE.

6. Conclusions and Policy Recommendations

Achieving China’s “Dual Carbon Target” highlights the importance of investigating the role of sci-tech finance in promoting urban green and low-carbon development. This research uses panel data from 282 prefecture-level cities (2006–2022) to examine the effects of the “Sci-Tech Finance Integration Policy” through a quasi-natural experiment approach. By applying the SBM-GML model to assess carbon emission efficiency as an indicator of green development, and utilizing fixed effects and difference-in-differences models, this study demonstrates that sci-tech finance significantly boosts CE, supporting China’s carbon neutrality objectives. A series of robustness tests—including parallel trend analysis, placebo tests, PSM-DID, alternative dependent variables, and excluding competing policies—verify the consistency and credibility of these results. Additionally, the policy’s impact on emission reductions intensifies over time. Mechanism analysis was used to identify three pathways: enhancing urban innovation capacity, improving financial institution efficiency, and optimizing energy consumption structures. Heterogeneity tests demonstrate stronger CE improvements in eastern China, regions with stringent environmental regulations, high-marketization areas, and non-resource-dependent cities. While moderate benefits are observed in central–western regions and low-marketization areas, resource-dependent cities exhibit adverse effects, likely due to entrenched carbon-intensive industries. Sci-tech finance boosts local CE by accelerating low-carbon industry agglomeration, but generates negative indirect effects on neighboring regions, primarily attributed to their insufficient technological absorption capacity and institutional barriers. This spatial pattern aligns with the pre-existing Moran’s I test results, validating the necessity of incorporating spatial effects into the econometric framework. Finally, employing the DML framework, this study further demonstrates that sci-tech finance exert a statistically significant positive impact on enhancing urban CE.
The limitations of this study are as follows: the spatial weight matrix is constructed based on geographical distance, and future research could incorporate economic, technological, or institutional proximity to capture more complex spatial interactions; due to data constraints, the mechanism analysis focuses on macro-level pathways, while micro-level transmission mechanisms such as firm investment decisions have not been fully explored; and this study takes prefecture-level cities as the analysis unit, and the applicability of the conclusions at the firm level needs further verification. Future studies can extend this research in three aspects: utilizing micro-level data to analyze the impacts of sci-tech finance on carbon emission efficiency across different ownership types and industrial sectors; exploring the moderating role of other policy tools such as digital finance and green finance in the relationship between sci-tech finance and carbon emission efficiency to provide insights for policy coordination; and examining the long-term effects of sci-tech finance on carbon neutrality, including its impacts on carbon sequestration and circular economy development, so as to establish a more comprehensive evaluation framework. Fourth, this study does not examine the dynamic effects of the policy. It has not investigated the differences in policy implementation effects across the short, medium, and long term, nor has it analyzed the lag characteristics of the policy’s impact. This oversight limits the understanding of the temporal trajectory and adaptive adjustment required for optimal policy intervention.
Policy recommendations are as follows:
To promote green transformation through sci-tech finance, it is necessary to design precise tools based on the characteristics of different regions. At the level of risk-sharing mechanisms, a special “Sci-Tech Finance-Green Transformation” risk compensation fund a special “Sci-Tech Finance-Green Transformation” risk compensation fund should be established. The fund’s capital contributions should be shared among the central government (30%), local government (30%), and participating financial institutions (40%). The compensation standard should be tiered, covering 70% of actual bad debt losses for projects with verified annual emission reduction exceeding 10%, and 50% for projects with reductions between 5% and 10%. A mandatory exit mechanism should be designed: if a funded project fails to meet half of its emission reduction target over two consecutive assessment periods, the financial institution must cease lending and the project is barred from future fund applications for three years. This fund is specifically targeted at green technology transformation projects of traditional industries in resource-based cities. For example, areas with both emission reduction potential and transformation difficulties, such as the upgrading of clean coal production technologies and the retrofitting of ultra-low emission equipment in thermal power plants, should be compensated according to the proportion of actual bad debt losses of the projects. By alleviating the risk concerns of financial institutions, it can guide them to expand the scale of credit lending to such projects, thus breaking the financing bottleneck of traditional high-carbon industries caused by “high risks and long return cycles”. Meanwhile, it is necessary to build a diversified green financing platform, and carry out targeted pilot projects of transition-specific loans in resource-based cities. The loan amount can be dynamically adjusted according to the emission reduction benefits of the projects, and supporting fiscal interest subsidy policies should be simultaneously implemented to directly reduce the financing costs of enterprises. This can not only alleviate the problem of “financial exclusion” faced by resource-based enterprises, which can struggle to obtain traditional credit support due to the insufficient mortgage value of high-carbon assets, but also promote their leap from “end-of-pipe treatment” to “full-process low-carbon transformation” through targeted capital injection.
Optimizing the transmission mechanism requires in-depth strengthening of the compatibility between technological innovation and financial support, and precise efforts targeting the core needs of different transformation stages. On the technological innovation front, efforts should be made to make breakthroughs in technologies unique to resource-based cities, and implement a combined incentive policy of “post-subsidy for R&D investment and intellectual property pledge financing”. Special subsidies should be given according to actual R&D expenses, and at the same time, intellectual property rights such as relevant technical patents and proprietary technologies should be included in the scope of pledge financing targets, with sci-tech financial institutions providing credit support. This will not only ease the financial pressure of enterprises in early-stage R&D, but also broaden financing channels through asset activation. On the energy transition front, a “special fund for renewable energy integration” should be established, with the total scale of the fund dynamically adjusted according to regional energy demand, and allocated in different tiers based on the exploitable potential of renewable energy such as solar energy, wind energy, and biomass energy in cities. For regions with superior resource endowments, the proportion of quotas will be increased to specially support the construction of integrated projects such as smart microgrids. Through targeted capital investment, the integration and upgrading of renewable energy systems will be promoted, and the process of replacing high-carbon energy sources will be accelerated.
Regional strategies should be fully based on the development foundation and transformation pain points of each region to build differentiated sci-tech finance support systems. The eastern region can take advantage of its mature financial market to select innovative forms such as linked products of carbon futures and sci-tech credit, and green project financing tools based on blockchain into the testing scope. By appropriately relaxing access thresholds and establishing error-tolerance and error-correction mechanisms, it can explore the integration path of financial technology and low-carbon transformation under the premise of controllable risks, and accumulate experience for tool innovation nationwide. For the central and western regions, as well as areas with low marketization, a key policy toolkit should be the construction of cross-regional sci-tech finance cooperation mechanisms. This involves establishing a dedicated cross-provincial sci-tech finance coordination committee, which will work to unify the credit standards and information sharing platforms for green technology projects across the region. By doing so, it aims to overcome the limitations of fragmented local financial markets, and facilitate the flow of capital from more developed eastern financial centers to green projects in these less developed areas. The central and western regions need to focus on the key bottleneck of cross-regional consumption of renewable energy, and jointly issue “regional collaborative green bonds”. The funds raised by the bonds will be specially used for the upgrading of cross-regional power grid infrastructure such as ultra-high-voltage transmission lines and smart grid dispatching systems. Resource-based cities should establish a dynamic adjustment mechanism that links transformation performance with financial support, and rigidly bind sci-tech financial support quotas with core transformation indicators such as the rate of decline in energy consumption per unit of GDP, the rate of decline in the proportion of coal consumption, and the intensity of investment in low-carbon technology R&D. Emphasis should be placed on carrying out adaptive skill training in carbon accounting, new energy operation and maintenance, etc., to break the constraints of human resources in the transformation process by improving the matching degree between the labor market and low-carbon industries.
We aim to leverage the mediating roles of innovation capacity, financing capacity, and energy consumption structure, clarify the transmission mechanism of sci-tech finance, and realize green high-quality economic development. Specifically, attaching great importance to the pivotal role of technological innovation in green and low-carbon development—by embedding financial platforms into the construction of industrial internet big data centers through information technology and facilitating the commercialization of innovative achievements—constitutes an innovative measure to enhance economic development. We should summarize the experience from pilot innovative city construction, strengthen institutional arrangements and designs related to digital technology innovation, further improve the pilot system of “local pilot projects–central summarization–local promotion”, and adopt context-specific collaborative innovation models integrating digital technology with traditional industries to support regional digital transformation. Additionally, it is crucial to respect intellectual property rights, strengthen the protection of intellectual property related to low-carbon innovative technologies, and guide various financial institutions to actively participate in the process of green production transformation. Consciously channeling more funds into the green technology industry, we need to strengthen the guiding role of fiscal technology expenditures on financial institutions and various types of capital, directing them to flow more into clean technologies and low-carbon industries. We should actively explore diversified financial service models and develop enterprises’ financing capacity through multiple channels. In the strategic layout of economic development, efforts should be made to scientifically promote the transformation of the energy consumption structure: while upgrading and renovating traditional industries, vigorously cultivate high-tech industries, popularize energy-saving technologies and measures, improve energy use efficiency, guide enterprises and residents to use energy rationally, and form a green and low-carbon energy consumption pattern. Furthermore, by optimizing the investment environment and providing convenient market access conditions, we can attract more foreign capital to flow into the Chinese market. We should attach importance to the technology spillover effects brought by foreign direct investment, encourage domestic enterprises to collaborate with foreign-funded enterprises, and learn from advanced technologies and management experiences. Based on the inherent development characteristics of different regions, we should implement differentiated sci-tech finance policies in light of local and temporal conditions, fully recognize the direct mechanism of action of sci-tech finance, and continuously improve institutional rationality to strengthen the indirect driving effect of central urban areas on surrounding regions, thereby enhancing the flexibility and inclusiveness of policy pilots. In the future selection of sci-tech finance pilot cities, we can leverage the inherent advantages of social development in eastern regions, the regulatory strengths of areas with strong environmental regulation intensity, and the financing advantages of regions with a high degree of marketization, align with the development goals of non-resource-based cities, and actively explore new sci-tech finance service models. This will effectively implement the integrated development of finance and technology and create a more favorable market environment.


Author Contributions

F.L.: Methodology (equal); Data curation (equal); Writing—review and editing (equal). Y.W.: Data curation (equal); Writing—original draft (equal). J.Q.: Writing—review and editing (equal). G.D.: Writing—review and editing (equal). All authors have read and agreed to the published version of the manuscript.

Funding

This work was supported by the Natural Science Foundation of China (72363021 and 12101279); the Fifth Batch of Flying Scholars in Gansu Province (2025–2027); Leading Talents of Gansu Province (2025–2027);Youth Doctoral Program for Entering Enterprises and Parks in Universities in Gansu Province (2026QB-053); the Double First-class Scientific Research Key Project of Gansu Provincial Department of Education (GSSYLXM-06); the Major Science and Technology Special Project Plan of Gansu Province (24ZDWA007); Gansu Provincial Department of Education College Teacher Innovation Fund Project (2026B-107); and Soft Science Special Project of Gansu Basic Research Plan (25JRZA094 and 26JRZA085).

Institutional Review Board Statement

Not applicable.

Informed Consent Statement

Not applicable.

Data Availability Statement

The original contributions presented in this study are included in the article. Further inquiries can be directed to the corresponding author.

Conflicts of Interest

The authors declare no conflicts of interest.

References

  1. Ali, W.; Gohar, R.; Chang, B.H.; Wong, W.K. Revisiting the impacts of globalization, renewable energy consumption, and economic growth on environmental quality in South Asia. Adv. Decis. Sci. 2022, 26, 75–98. [Google Scholar] [CrossRef]
  2. Arfaoui, N.; Yousaf, I. Impact of COVID-19 on volatility spillovers across international markets: Evidence from VAR asymmetric BEKK GARCH model. Ann. Financ. Econ. 2022, 17, 2250004. [Google Scholar] [CrossRef]
  3. Esmaeil, J.; Rjoub, H.; Wong, W.K. Do oil price shocks and other factors create bigger impacts on Islamic banks than conventional banks? Energies 2020, 13, 3106. [Google Scholar] [CrossRef]
  4. Li, G.; Wen, H. The low-carbon effect of pursuing the honor of civilization? A quasi-experiment in Chinese cities. Econ. Anal. Policy 2023, 78, 343–357. [Google Scholar] [CrossRef]
  5. Lee, C.C.; Li, X.; Yu, C.H.; Zhao, J. Does fintech innovation improve bank efficiency? Evidence from China’s banking industry. Int. Rev. Econ. Financ. 2021, 74, 468–483. [Google Scholar] [CrossRef]
  6. Dong, F.; Zhu, J.; Li, Y.; Chen, Y.; Gao, Y.; Hu, M.; Qin, C.; Sun, J. How green technology innovation affects carbon emission efficiency: Evidence from developed countries proposing carbon neutrality targets. Environ. Sci. Pollut. Res. 2022, 29, 35780–35799. [Google Scholar] [CrossRef] [PubMed]
  7. Gu, J. Sharing economy, technological innovation and carbon emissions: Evidence from Chinese cities. J. Innov. Knowl. 2022, 7, 100228. [Google Scholar] [CrossRef]
  8. Gao, P.; Wang, Y.; Zou, Y.; Su, X.; Che, X.; Yang, X. Green technology innovation and carbon emissions nexus in China: Does industrial structure upgrading matter? Front. Psychol. 2022, 13, 951172. [Google Scholar] [CrossRef] [PubMed]
  9. Zeng, S.; Li, G.; Wu, S.; Dong, Z. The impact of green technology innovation on carbon emissions in the context of carbon neutrality in China: Evidence from spatial spillover and nonlinear effect analysis. Int. J. Environ. Res. Public Health 2022, 19, 730. [Google Scholar] [CrossRef] [PubMed]
  10. Liu, H.; Song, Y. Financial development and carbon emissions in China since the recent world financial crisis: Evidence from a spatial-temporal analysis and a spatial Durbin model. Sci. Total Environ. 2020, 715, 136771. [Google Scholar] [CrossRef] [PubMed]
  11. Tao, M.; Sheng, M.S.; Wen, L. How does financial development influence carbon emission intensity in the OECD countries: Some insights from the information and communication technology perspective. J. Environ. Manag. 2023, 335, 117553. [Google Scholar] [CrossRef]
  12. Liu, X.; Liu, X. Can financial development curb carbon emissions? Empirical test based on spatial perspective. Sustainability 2021, 13, 11912. [Google Scholar] [CrossRef]
  13. Zhang, Y.J. The impact of financial development on carbon emissions: An empirical analysis in China. Energy Policy 2011, 39, 2197–2203. [Google Scholar] [CrossRef]
  14. Zhang, M.; Liu, Y. Influence of digital finance and green technology innovation on China’s carbon emission efficiency: Empirical analysis based on spatial metrology. Sci. Total Environ. 2022, 838, 156463. [Google Scholar] [CrossRef] [PubMed]
  15. Zhang, J.; Lyu, Y.; Li, Y.; Geng, Y. Digital economy: An innovation driving factor for low-carbon development. Environ. Impact Assess. Rev. 2022, 96, 106821. [Google Scholar] [CrossRef]
  16. Wang, Y.; Fang, X.; Yin, S.; Chen, W. Low-carbon development quality of cities in China: Evaluation and obstacle analysis. Sustain. Cities Soc. 2021, 64, 102553. [Google Scholar] [CrossRef]
  17. Ren, L.; Zhou, S.; Peng, T.; Ou, X. A review of CO2 emissions reduction technologies and low-carbon development in the iron and steel industry focusing on China. Renew. Sustain. Energy Rev. 2021, 143, 110846. [Google Scholar] [CrossRef]
  18. Feng, S.; Zhang, R.; Li, G. Environmental decentralization, digital finance and green technology innovation. Struct. Change Econ. Dyn. 2022, 61, 70–83. [Google Scholar] [CrossRef]
  19. Irfan, M.; Razzaq, A.; Sharif, A.; Yang, X. Influence mechanism between green finance and green innovation: Exploring regional policy intervention effects in China. Technol. Forecast. Soc. Change 2022, 182, 121882. [Google Scholar] [CrossRef]
  20. Wen, H.; Liu, Y. Can fintech lead to the collaborative reduction in pollution discharges and carbon emissions? Sustainability 2023, 15, 11627. [Google Scholar] [CrossRef]
  21. Yu, R.; Li, J. Does fintech influence sustainable development under natural resource constraints: Insights from270 Chinese cities. Resour. Policy 2024, 91, 104924. [Google Scholar] [CrossRef]
  22. Yan, C.; Mao, Z.; Ho, K.C. Effect of green financial reform and innovation pilot zones on corporate investment efficiency. Energy Econ. 2022, 113, 106185. [Google Scholar] [CrossRef]
  23. Qi, S.Z.; Zhou, C.B.; Li, K.; Tang, S.Y. Influence of a pilot carbon trading policy on enterprises’ low-carbon innovation in China. Clim. Policy 2021, 21, 318–336. [Google Scholar] [CrossRef]
  24. Fang, X.; Liu, M. How does the digital transformation drive digital technology innovation of enterprises? Evidence from enterprise’s digital patents. Technol. Forecast. Soc. Change 2024, 204, 123428. [Google Scholar] [CrossRef]
  25. Zhong, S.; Peng, L.; Li, J.; Li, G.; Ma, C. Digital finance and the two-dimensional logic of industrial green transformation: Evidence from green transformation of efficiency and structure. J. Clean. Prod. 2023, 406, 137078. [Google Scholar] [CrossRef]
  26. Tan, X.; Zhu, K.; Meng, X.; Gu, B.; Wang, Y.; Meng, F.; Liu, G.; Tu, T.; Li, H. Research on the status and priority needs of developing countries to address climate change. J. Clean. Prod. 2021, 289, 125669. [Google Scholar] [CrossRef]
  27. Tian, C.; Li, X.; Xiao, L.; Zhu, B. Exploring the impact of green credit policy on green transformation of heavy polluting industries. J. Clean. Prod. 2022, 335, 130257. [Google Scholar] [CrossRef]
  28. Shahbaz, M.; Sinha, A.; Raghutla, C.; Vo, X.V. Decomposing scale and technique effects of financial development and foreign direct investment on renewable energy consumption. Energy 2022, 238, 121758. [Google Scholar] [CrossRef]
  29. Zhu, Y.; Lin, Y.; Tan, Y.; Liu, B.; Wang, H. The potential nexus between fintech and energy consumption: A new perspective on natural resource consumption. Resour. Policy 2024, 89, 104589. [Google Scholar] [CrossRef]
  30. He, L.; Yuan, E.; Yang, K.; Tao, D. Does technology innovation reduce haze pollution? An empirical study based on urban innovation index in China. Environ. Sci. Pollut. Res. 2022, 29, 24063–24076. [Google Scholar] [CrossRef] [PubMed]
  31. Liu, Y.; Zhao, G.; Zhao, Y. An analysis of Chinese provincial carbon dioxide emission efficiencies based on energy consumption structure. Energy Policy 2016, 96, 524–533. [Google Scholar] [CrossRef]
  32. Li, J.; Ma, J.; Wei, W. A study on the regional differences in the energy carbon emission efficiency of China’s eight comprehensive economic zones. J. Quant. Tech. Econ. 2020, 37, 109–129. (In Chinese) [Google Scholar]
  33. Lin, B.; Li, Z. Towards world’s low carbon development: The role of clean energy. Appl. Energy 2022, 307, 118160. [Google Scholar] [CrossRef]
  34. Meng, M.; Qu, D. Understanding the green energy efficiencies of provinces in China: A Super-SBM and GML analysis. Energy 2022, 239, 121912. [Google Scholar] [CrossRef]
  35. Zeng, T.; Jiang, Y. Fintech and low-carbon urban development. Financ. Res. Lett. 2025, 79, 107229. [Google Scholar] [CrossRef]
  36. Jiang, T. Mediating and moderating effects in empirical studies of causal inference. China Ind. Econ. 2022, 5, 100–120. (In Chinese) [Google Scholar]
  37. Beck, T.; Levine, R.; Levkov, A. Big bad banks? The winners and losers from bank deregulation in the United States. J. Financ. 2010, 65, 1637–1667. [Google Scholar] [CrossRef]
  38. Fan, G.; Wang, X.; Zhang, L.; Zhu, H. Report on the relative process of marketization in various regions of China. Econ. Res. J. 2003, 3, 9–18+89. (In Chinese) [Google Scholar]
  39. Dani, R. One Economics, Many Recipes: Globalization, Institutions, and Economic Growth, Introductory Chapters; Princeton University Press: Princeton, NJ, USA, 2008; Volume 45, p. 3902. [Google Scholar]
  40. Chen, M.; Wang, Z.F. The impact of smart city construction on common prosperity: An empirical evaluation based on double machine learning. Mod. Financ. Econ. (J. Tianjin Univ. Financ. Econ.) 2024, 44, 20–36. (In Chinese) [Google Scholar]
Figure 1. Parallel test.
Sustainability 18 07079 g001
Figure 2. Probability distribution of TFIN coefficients after randomization.
Sustainability 18 07079 g002
Figure 3. Standardized deviation scatter plot.
Sustainability 18 07079 g003
Figure 4. Local Moran’s I scatter plot of China’s carbon emission efficiency in 2007 and 2022.
Sustainability 18 07079 g004
Table 1. Measuring index of carbon emission efficiency in prefecture-level cities.
Index Definition
InputCapital inputStock of fixed assets in prefecture-level cities
Energy inputTotal energy consumption of prefecture-level city
Labor inputTotal number of employees in prefecture-level cities
OutputExpected outputActual GDP of prefecture-level city in that year
Undesirable outputCO2 emissions of prefecture-level cities
Table 2. Descriptive statistical analysis.
Variable SymbolVariable NameSample SizeMeanSDMinMax
CECarbon emission efficiency45121.1100.5080.2113.56
TFINSci-tech45120.1230.3280.001.00
IndIndustrial structure45121.2640.6950.1810.60
UrUrbanization rate45120.5420.1640.121.18
EwEmployee compensation451210.7840.5464.5314.08
FdiForeign investment ratio45122.6475.6900.00217.90
DoiDegree of industrialization45126.5991.1143.009.84
LdrLoan-to-deposit ratio45120.6850.2410.067.08
Table 3. The impact of TFIN on CE.
(1)(2)(3)
CECECE
TFIN0.3668 ***0.3562 ***0.3322 ***
(16.3913)(14.9546)(13.9946)
Ind 0.0649 ***
(5.4941)
Ur −0.3015 ***
(−3.4172)
Ew 0.0029
(0.1437)
Fdi 0.0010
(1.1389)
Doi −0.1425 ***
(−8.1815)
Ldr 0.0300
(1.1933)
_cons1.0658 ***1.0655 ***1.9485 ***
(135.7827)(64.6850)(8.5074)
CityNoYesYes
YearNoYesYes
N451245124512
adj. R20.0560.0390.060
Note: (1) *, **, *** denote significance at the 1%, 5%, 10% statistical levels, respectively; (2) Values in parentheses are test p-values.
Table 4. PSM-DID to replace the regression results of the explained variables.
(1)(2)(3)
CEPCO2GTFP
TFIN0.1943 ***−1.3497 ***0.2659 ***
(3.3189)(−6.3087)(11.7767)
Ind0.0502−0.4124 ***0.0206
(0.6696)(−3.8614)(1.4742)
Ur0.3248 *−0.58810.0066
(1.8299)(−0.7484)(0.0784)
Ew0.19110.2599−0.0210
(1.5061)(1.3642)(−1.0838)
Fdi−0.0263 ***0.0211 ***0.0003
(−3.7290)(2.9780)(0.2741)
Doi−0.2081 ***−1.0681 ***−0.0663 ***
(−3.6846)(−6.7167)(−3.9427)
Ldr−0.3172−0.8476 ***−0.0608 **
(−1.5915)(−3.5620)(−2.5348)
_cons0.012914.6847 ***1.7019 ***
(0.0091)(7.0388)(7.7740)
CityYesYesYes
YearYesYesYes
N118447944432
adj. R20.8500.2730.231
Note: (1) *, **, *** denote significance at the 1%, 5%, 10% statistical levels, respectively; (2) Values in parentheses are test p-values.
Table 5. Regression results excluding interference from other environmental policies.
(1)(2)(3)
CECECE
TFIN0.1150 ***0.3472 ***0.2566 ***
(3.8710)(13.2017)(12.9302)
Ind0.0363 ***0.0597 ***0.0657 ***
(3.3588)(4.1072)(6.4333)
Ur−0.1462−0.2490 ***−0.2011 ***
(−1.5608)(−2.7506)(−2.7527)
Ew0.01540.01120.0158
(0.8953)(0.5981)(0.9129)
Fdi−0.0004−0.0084 ***0.0021 ***
(−0.1855)(−2.9402)(2.6078)
Doi−0.0899 ***−0.1202 ***−0.1068 ***
(−4.7935)(−6.6287)(−7.0296)
Ldr0.0502 **0.00090.0233
(2.0560)(0.0431)(1.1616)
_cons1.4087 ***1.7395 ***1.6182 ***
(6.6863)(8.0227)(7.5221)
CityYesYesNo
YearYesYesNo
City × YearNoNoYes
N254428804512
adj. R20.1260.106
Note: (1) *, **, *** denote significance at the1%, 5%, 10%statistical levels, respectively; (2) Values in parentheses are test p-values.
Table 6. Comparison of pilot policy differences.
Policy TypeCore ObjectivesSupporting Financial InstrumentsLow-Carbon Emission Reduction OrientationCore Differences
Sci-tech Finance PilotConnect the industrial chain of scientific and technological innovation with the financial capital chain, cover the entire industrialization cycle of enterprises, and foster science and innovation entities.Special loans for science and technology, intellectual property pledge financing, investment-loan linkage, risk compensation funds for scientific and technological innovation, science and technology insurance, and special bonds for technological innovationMedium and long-term systematic emission reduction: continuously cut carbon emissions through three channels, namely green technological innovation, energy structure optimization and industrial upgrading.The core policy lever lies in full-chain financing support for scientific and technological innovation. The financial instruments are specially tailored to fit the asset-light and high-risk characteristics of tech-innovative enterprises. Emission reduction is inherently embedded in the innovation process and covers all industrial sectors.
Low-carbon City PilotCoordinate regional carbon emission control, fulfill targets including carbon intensity reduction, dual control of energy consumption and phased carbon peaking tasks, and improve the carbon governance system.Green credit, carbon pledge financing, interest subsidies for low-carbon technological transformation, carbon funds, and carbon emission reduction support instrumentsShort-term direct carbon control: focus on energy-saving renovation of existing industries, terminal pollution treatment and deployment of renewable energy, with stock emission reduction as the priority.Carbon emission control is set as the primary goal. Financial instruments are only directed toward mature low-carbon transformation projects, with a lack of supporting financing mechanisms for start-up tech-innovative enterprises and weak incentives for innovation.
Smart City PilotCarry out the construction of urban digital infrastructure, digital governance and digital industry cultivation, so as to elevate the intelligent level of urban operation and management.Special loans for digital industries, special financing for computing infrastructure, and interest subsidies for digital transformationEmission reduction is merely an incidental benefit of digitalization without mandatory carbon emission reduction assessment indicators; energy conservation is achieved indirectly through intelligent energy consumption monitoring and digital dispatching.The core policy focus lies on digital infrastructure and digitalized urban governance. Financial instruments target computing power, platforms and smart city infrastructure, rather than technological research and development in real industries.
Table 7. Mediating effects test the regression results.
(1)(2)(3)(4)(5)
IniIneGrantsFeEs
TFIN0.0072 ***0.0673 *0.1152 ***0.1740 ***−0.0223 **
(9.7771)(1.7749)(3.1785)(11.5900)(−2.5491)
Ind0.00040.0916 ***0.01360.01180.0125 ***
(1.1683)(4.8578)(0.7523)(1.5872)(2.8708)
Ur−0.00240.8110 ***0.4417 ***−0.1748 ***−0.1678 ***
(−0.8933)(5.7553)(3.2776)(−3.1327)(−5.1607)
Ew0.0011 *0.0755 **0.0905 ***0.0141−0.0417 ***
(1.7135)(2.3300)(2.9192)(1.0952)(−5.5707)
Fdi0.0000−0.0037 **−0.0029 **−0.00050.0000
(0.5437)(−2.5187)(−2.0525)(−0.9267)(0.0517)
Doi0.0071 ***0.2839 ***0.3196 ***0.00390.0479 ***
(13.1359)(10.2041)(12.0115)(0.3528)(7.4644)
Ldr0.0013−0.02970.01021.7892 ***0.0060
(1.6225)(−0.7396)(0.2660)(112.6621)(0.6472)
_cons−0.0437 ***−0.2580−0.7345 **−0.10040.9546 ***
(1.9250)(33.7882)(−2.0993)(−0.6929)(11.3114)
CityYesYesYesYesYes
YearYesYesYesYesYes
N45124512451245124512
adj. R20.0860.8460.8720.7660.071
Note: (1) *, **, *** denote significance at the 1%, 5%, 10% statistical levels, respectively; (2) Values in parentheses are test p-values.
Table 8. Heterogeneity analysis results I.
(1)(2)(3)(4)
Eastern RegionCentral and Western RegionsAreas with Strict Environmental RegulationsAreas with Loose Environmental Regulations
CECECECE
TFIN0.3853 ***0.2410 ***0.3635 ***0.0555 *
(11.6645)(7.0720)(11.0318)(1.8487)
Ind0.0404 *0.0542 ***0.0811 ***0.0444 ***
(1.6935)(3.9016)(3.6208)(4.6714)
Ur−0.3020 ***−0.1244−0.1985−0.3386 ***
(−2.6229)(−0.9097)(−1.4784)(−3.8312)
Ew0.0456−0.00920.01730.0045
(1.0760)(−0.3981)(0.4362)(0.2781)
Fdi−0.00320.0017 *−0.0145 ***0.0020 ***
(−0.8700)(1.7413)(−3.4558)(3.2722)
Doi−0.0208−0.1083 ***−0.1272 ***−0.0694 ***
(−0.7638)(−3.9167)(−4.5126)(−4.0666)
Ldr−0.02640.0749 **0.0425−0.0640
(−0.7001)(2.2661)(1.3599)(−1.4302)
_cons0.8941 **1.6884 ***1.7625 ***1.4845 ***
(1.9992)(5.9750)(4.1078)(7.9565)
Chow test0.4529 ***0.3673 ***
CityYesYesYesYes
YearYesYesYesYes
N1888262426881824
adj. R20.0740.0950.0500.275
Note: (1) *, **, *** denote significance at the 1%, 5%, 10% statistical levels, respectively; (2) Values in parentheses are test p-values.
Table 9. Heterogeneity analysis results II.
(1)(2)(3)(4)
Areas with Lower Degree of MarketizationAreas with Higher Degree of MarketizationNon-Resource CityResource City
CECECECE
TFIN0.2284 ***0.3770 ***0.4248 ***−0.1127 ***
(9.5189)(9.2781)(13.4240)(−3.4854)
Ind0.0456 ***0.0911 ***0.1307 ***0.0290 ***
(4.3555)(3.9255)(4.9562)(3.2392)
Ur−0.4214 ***−0.2662 *−0.1698−0.2861 ***
(−4.7435)(−1.7798)(−1.2183)(−3.4716)
Ew0.0825 ***−0.0258−0.00260.0048
(2.9295)(−0.8939)(−0.0777)(0.2631)
Fdi0.0020 ***−0.0182 ***0.0020 *−0.0123 ***
(3.0187)(−3.6592)(1.7997)(−3.7310)
Doi−0.0903 ***−0.1845 ***−0.2006 ***−0.0635 ***
(−5.4360)(−5.5677)(−7.1555)(−3.8589)
Ldr0.0823 *0.01730.00910.0368 *
(1.6904)(0.5252)(0.2129)(1.6951)
_cons0.8356 ***2.5708 ***2.3196 ***1.4393 ***
(2.8313)(7.2223)(6.2705)(6.9477)
Chow test0.2171 *−0.5688 ***
CityYesYesYesYes
YearYesYesYesYes
N2304220827361776
adj. R20.1860.0430.0610.220
Note: (1) *, **, *** denote significance at the 1%, 5%, 10% statistical levels, respectively; (2) Values in parentheses are test p-values.
Table 10. Global Moran’s I of urban carbon emission efficiency from 2007 to 2022.
YearMoran’s IE(I)SD(I)Zp
2007−0.004−0.0040.005−0.0620.950
20080.014−0.0040.0053.7260.000
20090.014−0.0040.0053.5630.000
20100.029−0.0040.0056.3750.000
20110.032−0.0040.0057.0420.000
20120.033−0.0040.0057.1920.000
20130.024−0.0040.0055.3650.000
20140.023−0.0040.0055.1140.000
20150.022−0.0040.0054.8950.000
20160.020−0.0040.0054.6160.000
20170.029−0.0040.0056.3970.000
20180.033−0.0040.0057.0800.000
20190.041−0.0040.0058.7320.000
20200.050−0.0040.00510.3760.000
20210.053−0.0040.00511.0420.000
20220.026−0.0040.0055.8070.000
Table 11. Re-examination of spatial correlation based on spatial geographical weight matrix.
Test MethodTest IndextpResult
Wald TestSAR134.730.000It is not suitable to simplify it into spatial lag model and spatial error model.
SEM116.000.000
LR TestSAR134.830.000The spatial Dolby model is superior to the spatial lag model and the spatial error model.
SEM127.550.000
Hausman Test 27.060.003Using fixed effects.
LR TestCity37.350.000Spatial Durbin model with two-way fixed effects.
Year3900.10.000
Table 12. Spatial spillover effect of sci-tech finance on urban carbon emission efficiency I.
(1)(2)(3)
CECE_DirectCE_Indirect
TFIN0.3290 ***0.3767 ***−0.7657 ***
(18.3490)(15.0815)(−3.2368)
rho0.5355 ***
(6.1392)
Ind0.0871 ***0.0643 ***0.1585
(7.2227)(5.7456)(1.0615)
Ur−0.4365 ***−0.4661 ***2.4833 ***
(−6.3288)(−5.3193)(2.6096)
Ew0.0680 **0.01690.3586
(2.4357)(0.8942)(1.1423)
Fdi−0.0112 ***0.00060.0803 ***
(−5.0806)(0.6476)(3.8161)
Doi−0.0142−0.0171−1.1784 ***
(−0.8887)(−0.8081)(−6.4389)
Ldr0.06240.0589 **0.1704
(1.6331)(2.3339)(0.4049)
sigma2_e0.0357 ***
(47.4275)
CityYesYesYes
YearYesYesYes
N451245124512
Note: (1) *, **, *** denote significance at the 1%, 5%, 10% statistical levels, respectively; (2) Values in parentheses are test p-values.
Table 13. Spatial spillover effect of sci-tech finance on urban carbon emission efficiency II.
(1)(2)(3)
CECE_DirectCE_Indirect
TFIN0.4433 ***0.2255 ***0.2178 ***
(9.9149)(12.9228)(4.9862)
rho0.2649 ***
(10.3368)
Ind0.0996 ***0.0920 ***0.0076
(2.7173)(8.4443)(0.2180)
Ur−0.2988−0.2152 ***−0.0836
(−1.3495)(−3.5777)(−0.3853)
Ew−0.2001 *0.0698 ***−0.2700 ***
(−1.9362)(2.6484)(−2.7494)
Fdi−0.0549 ***−0.0060 ***−0.0489 ***
(−7.2250)(−3.0715)(−6.5876)
Doi−0.2807 ***−0.0715 ***−0.2092 ***
(−7.3108)(−5.3876)(−5.7527)
Ldr−0.2198 *−0.0318−0.1880
(−1.7400)(−0.8735)(−1.5874)
sigma2_e0.0345 ***
(47.2977)
CityYesYesYes
YearYesYesYes
N451245124512
Note: (1) *, **, *** denote significance at the1%, 5%, 10%statistical levels, respectively; (2) Values in parentheses are test p-values.
Table 14. Baseline regression based on the DML model.
(1)(2)(3)(4)
CECECECE
TFIN0.0481 **0.1877 ***0.0445 *0.1932 ***
(2.0514)(4.4875)(1.9239)(4.6644)
_cons−0.00950.0070 *−0.00980.0066 *
(−1.4948)(1.8311)(−1.5607)(1.7217)
Linear Terms of Control VariablesYesYesYesYes
Quadratic Terms of Control VariablesNoNoYesYes
CityNoYesNoYes
YearNoYesNoYes
N4512451245124512
Note: (1) *, **, *** denote significance at the 1%, 5%, 10% statistical levels, respectively; (2) Values in parentheses are test p-values.
Table 15. Causal inference via DML modeling.
(1)(2)(3)(4)(5)
Lasso
CE
Gradient Boosting
CE
Neural Network
CE
1:3
CE
1:7
CE
TFIN0.2859 ***0.1539 ***0.2115 ***0.1896 ***0.1692 ***
(9.6303)(5.2855)(7.7106)(5.2196)(3.7742)
_cons0.00070.00130.0200 ***0.0067 *0.0048
(0.1682)(0.2851)(6.0978)(1.6838)(1.2581)
Linear Terms of Control VariablesYesYesYesYesYes
Quadratic Terms of Control VariablesYesYesYesYesYes
CityYesYesYesYesYes
YearYesYesYesYesYes
N45124512451245124512
Note: (1) *, **, *** denote significance at the 1%, 5%, 10% statistical levels, respectively; (2) Values in parentheses are test p-values.
Disclaimer/Publisher’s Note: The statements, opinions and data contained in all publications are solely those of the individual author(s) and contributor(s) and not of MDPI and/or the editor(s). MDPI and/or the editor(s) disclaim responsibility for any injury to people or property resulting from any ideas, methods, instructions or products referred to in the content.