Article

Policy Implementation of Cultural-Tourism and the National Ecological Civilization Pilot Zone, Developing the Market, and Increasing Farmers’ Income


School of Economics, Liaoning University, Shenyang 110036, China
*
Author to whom correspondence should be addressed.
Sustainability 2026, 18(14), 7040; https://doi.org/10.3390/su18147040
Submission received: 24 April 2026 / Revised: 22 June 2026 / Accepted: 23 June 2026 / Published: 9 July 2026
(This article belongs to the Section Economic and Business Aspects of Sustainability)

Abstract

Based on county-level panel data from 2010 to 2023 covering 1991 counties, this study employs an Staggered Difference-in-Differences (DID) model integrated with double/debiased machine learning (DDML) and causal inference techniques. The objective of this paper is to assess whether and how the overlapping implementation of cultural-tourism integration (CTP) policies and the county-level National Ecological Civilization Pilot Zone (NECPZ) policy generates synergistic effects on rural residents’ income. The findings reveal that the policy overlap significantly promote farmers’ income. The synergy test shows that the synergy of these policies amplifies the effect of each individual policy and generates a “1 + 1 > 2” synergy effect. Mechanism analysis indicates that the policy overlap facilitates farmers’ income growth by enhancing the appeal and the development of the local tourism market. Heterogeneity analysis shows that the income-enhancing effect is more pronounced in counties with better public cultural services, stronger primary-level governance, and more advanced digital infrastructure. Furthermore, GDP growth rate, agricultural mechanization, and the industrial structure exert a nonlinear moderating effect on the policy effects. Based on these findings, the study proposes breaking down departmental and hierarchical barriers and building institutional synergy to transform ecological resources into economic value. According to local conditions, pilot projects should be prioritized in counties with stronger foundations, while guarding against the risk of diminishing marginal returns from excessive investment, so as to maximize policy synergies and promote fiscal efficiency.

1. Introduction

Activating the endogenous development momentum of rural areas is key to narrowing the urban–rural income gap. As the fundamental units of the national economy, counties serve as a nexus between rural revitalization and new-type urbanization. Endowed with abundant primary ecological resources—such as forests, farmland, and wetlands—they possess a natural advantage in pursuing green development [1]. However, these resources have long been caught in a dilemma: due to insufficient value recognition, ambiguous property rights, and limited market-based monetization channels, environmental protection has rarely translated into economic prosperity. The “Two Mountains” theory (“lucid waters and lush mountains are invaluable assets”), introduced in 2005, broke the binary opposition between environmental protection and economic growth. It established the green-productivity logic that “ecology is the economy, and protecting nature is development”, providing core theoretical guidance for realizing the market value of rural ecological resources [2]. Launched in 2013, the National Ecological Civilization Pilot Zone (NECPZ) policy explicitly designates counties as implementation units and moves beyond one-dimensional environmental protection. With ecological benefits for the people as its central objective, the policy aims to foster green industries to revitalize the rural economy and raise farmers’ income. The “Regulations on the Management of NECPZ” further incorporate the share of green industries and the growth rate of farmers’ income into the core evaluation system, thereby reinforcing a policy orientation that pursues synergy between ecological protection and economic development [3].
As a green development driver, cultural-tourism integration became a national strategy in 2009, and the comprehensive tourism framework in 2020 further emphasized counties’ coordinating role. The cultural-tourism industry is closely aligned with ecological civilization: drawing on its strong industrial linkages, high employment-generating capacity, and efficient value transformation, it converts counties’ ecological and cultural resources into economic drivers [4]. Since 2023, the annual Central Document No. 1 has stressed ecological governance and rural cultural-tourism integration, aiming to coordinate the development of the two for lasting effectiveness and thereby foster green economic growth and sustained increases in farmers’ incomes [5]. However, these two domains have long been administered by different departments—cultural-tourism integration under the Department of Culture and Tourism, and ecological civilization under the Department of Ecology and Environment. Prior to 2018, cultural-tourism integration policy had long been city-centered, whereas the NECPZ policy has always been rooted in county-based ecosystems [2]. This institutional fragmentation across departments and administrative levels has weakened policy synergy, raising critical questions: Does implementing both policies simultaneously create a trade-off between ecological protection and economic development? Can overlapping policies boost farmers’ incomes more effectively than a single policy? What are the mechanisms and boundaries of effectively co-implementing these two policies? Answering these questions is vital for raising farmers’ incomes, advancing the Beautiful China initiative, implementing rural revitalization, and achieving common prosperity.
Existing studies on the ecology–culture–tourism business model show that the coordinated development of ecology and cultural-tourism can promote farmers’ income growth in market practice [6], revealing an inherent synergy between ecological civilization policies and cultural-tourism integration policies [7]. However, current policy evaluations tend to focus on individual policies and overlook their interactions. Institutionally, these two types of policies do not operate independently; guided by the principle that lucid waters and lush mountains are invaluable assets, they are implemented as synergistic practices. The 14th Five-Year Plan for Ecological Civilization identifies ecotourism and other forms of cultural-tourism as key vehicles for realizing the value of ecological products, while the 14th Five-Year Plan for Cultural and Tourism Development stresses a positive interplay between cultural-tourism integration and ecological protection—together providing institutional guidance for coordinated implementation. Moreover, the two policies are highly aligned in spatial context (rural ecological areas), core beneficiaries (farmers), and value-realization logic, as both adopt the market-based realization of ecological and cultural resources as their central pathway. They therefore rest on a solid institutional and practical foundation for synergy [8]. Consequently, scientifically evaluating the overlapping and synergistic effects of these two policies is of considerable practical significance for optimizing the policy mix, saving cross-sector fiscal resources, reinforcing policy synergy, and ensuring precise and efficient implementation.
Building on this research context, this study employs panel data from over 2200 county-level administrative units across China from 2010 to 2023, employing a staggered difference-in-differences (DID) model, double/debiased machine learning (DDML), and causal inference methods, combined with mediation tests and heterogeneity analysis, to systematically evaluate how the combined implementation of the CTP policies and the NECPZ Policy affect farmers’ income growth. The marginal contributions of this paper are as follows: First, this study integrates two types of policies—those enacted at different administrative levels (municipal vs. county) and issued by different functional departments—into a unified analytical framework, enabling a systematic examination of their synergistic effects. The findings confirm that the synergy of co-implemented policies is significantly stronger than that of a single policy, revealing that institutional synergy is the key to converting ecological resources into economic benefits. This deepens the understanding of the practical pathway for advancing the Two Mountains concept. Second, methodologically, while previous studies have largely focused on the municipal or national level, this paper constructs indicators to measure the development of the cultural-tourism industry at the county level. It then explores the mechanisms through which co-implemented policies drive farmers’ income growth by enhancing tourism attractiveness and increasing the number of eco-cultural and tourism start-ups, thereby clarifying the transmission chain of policy empowerment → market development → farmers’ income increase. This provides a valuable methodological reference for subsequent evaluations and research in related fields. Third, this paper reveals the conditional and nonlinear nature of policy synergy effects across multiple dimensions—including public cultural services, primary-level governance, digital infrastructure, economic development, fiscal pressure, and industrial structure. This finding challenges the simplistic assumption that “more policies are always better”, and highlights the need to account for heterogeneous conditions and threshold effects in policy synergy. In fiscally constrained contexts, the conclusions can help local governments design tailored policy mix, avoid one-size-fits-all approaches, and achieve more targeted implementation and cost savings.

2. Literature Review

2.1. The Impact of National Ecological Civilization Pilot Zone (NECPZ) on Farmers’ Income

Building an ecological civilization is now a core strategic pillar of China’s sustainable development. The Regulations on NECPZ policy designates counties as key pilot units for integrating ecological protection with economic growth, requiring them to explore practical, ecology-first green development pathways that can yield replicable and scalable local models [9]. A growing body of research consistently finds that the NECPZ policy significantly boosts farmers’ incomes. Using county-level panel data from 2012 to 2022, Zhang (2025) show that the policy promote income growth by optimizing the industrial structure and attracting enterprise [10]. Drawing on microdata from the China Family Panel Studies (CFPS), Du Jiating (2026) finds that such pilot zones markedly accelerate the growth of rural households’ income [11]. From the perspective of the Beautiful China initiative, Song (2023) demonstrates that these zones enhance inclusive green growth and indirectly raise rural incomes by accelerating industrial restructuring, fostering eco-friendly industries, and improving local talent retention [12].

2.2. The Impact of Cultural-Tourism Integration Policy (CTP) on Farmers’ Income

Before 2000, China’s tourism primarily served diplomatic functions and earned foreign exchange, with its activities concentrated in a few major cities such as Beijing, Shanghai, and Xi’an, as well as at World Heritage sites. In 2009, the former Ministry of Culture and the National Tourism Administration jointly proposed the concept of “cultural-tourism integration”, yet its early implementation remained largely confined to cities and mature scenic areas. The establishment of the Ministry of Culture and Tourism in 2018 elevated this concept to a national strategy, marking a policy shift from a focus on “cities and scenic spots” to county-centered urban–rural coordination [13]. Extending the cultural-tourism administrative reform to the county level strengthened the governance of cultural-tourism integration, removed long-standing institutional barriers, and provided institutional support for county-level CTP policies [14]. As a significant driver of rural revitalization, cultural-tourism integration has drawn considerable attention for its income-boosting effects. Shen (2022) highlights that high-quality rural homestays generate economies of scale and spillover effects, thereby expanding farmers’ employment opportunities and raising their incomes [1]. From a digital-empowerment perspective, Zhao (2023) propose that integrating digital technology with agricultural and eco-civilization can diversify farmers’ income sources by improving the quality of agricultural supply and combining ecological agriculture with study tours [15].

2.3. The Impact of the Policy Synergy on Farmers’ Income Growth

Ecological civilization construction and cultural-tourism integration are not isolated fields of development; they share deep commonality and complementarity in conceptual foundations, goal orientations, and practical pathways. Conceptually, ecological civilization stresses that lucid waters and lush mountains are invaluable assets, advocating for generating economic value within ecological protection [16]. Cultural-tourism integration, meanwhile, activates the multiple values of natural resources and cultural heritage through the deep fusion of culture and tourism [6]. Both reject the binary opposition between development and protection, pursuing sustainable development rooted in harmony between humans and nature. In practice, the NECPZ policy sets ecological red lines and fosters a green institutional environment, while the CTP policy opens market channels for the marketization of ecological resources [13]. The former focuses on guarding the bottom line and optimizing the ecological base, whereas the latter centered on revitalizing resources and promoting income growth. The two empower each other, generating a virtuous cycle: ecological protection → cultural-tourism market activation → farmers’ income growth → ecological reinvestment [9].
This synergy of conceptual foundations, goal orientations, and practical pathways has given rise to new eco-cultural-tourism business formats, including forest tourism, wetland tourism, eco-vacations, health and wellness ecotourism, nature education and study tours, and farming culture experiences [9]. In recent studies, Zhong and Zeng (2026) demonstrate that forest ecotourism—through ecological experiences, nature education, and wellness services—achieves synergy between ecological protection and community economies [7]. Wetland eco-sightseeing and ecotourism vacations similarly conserve ecosystems while generating community income. Researchers further note that nature education and study tours integrate farmers into the benefit chain through community participation, imparting ecological knowledge to tourists and promoting sustainable livelihoods [6]. Moreover, research on leisure agriculture and cultural-tourism integration indicates that blending agricultural production, ecological landscapes, and tourism experiences helps improve green farming practices and rural tourism branding, ultimately raising farmers’ incomes [14].
Existing literature has confirmed, through studies on “ecology–culture–tourism” new business formats, that the synergy between ecological civilization construction and cultural-tourism integration promotes farmers’ income growth at the practical level. However, most of these studies focus on qualitative descriptions of business formats in specific cases, concentrating on development models or summaries of local experiences. They fail to examine the actual effects and transmission mechanisms of the ecological civilization and cultural-tourism policy mix at the governance efficiency level. This fragmented scope has two major limitations: it makes it difficult to capture the potential dividends of policy synergy, and it overlooks risks such as resource crowding-out, goal conflicts, or diminishing marginal returns that may arise between the two policies. Given increasingly tight fiscal constraints, scientifically evaluating the synergy between these two types of policies is crucial for optimizing public resource allocation and avoiding redundant investment and policy friction.

3. Theoretical Analysis and Hypothesis

3.1. The Direct Impact of Combined Implementation of CTP and the NECPZ Policies on Increasing Farmers’ Income

Existing research indicates that the CTP and NECPZ policies share both practical synergies and institutional foundations for coordination. These synergies amplify a single policy’s effect on farmers’ income through three mutually reinforcing mechanisms: (1) resource integration and cost sharing, (2) signal coordination and brand strengthening, and (3) behavioral incentives and multi-actor coordination. First, in terms of resource integration and cost sharing, establishing an NECPZ demands substantial upfront investment in environmental governance and infrastructure. Although such investments generate positive externalities [15,17], they seldom translate into immediate income for farmers. The CTP policy, in contrast, uses market mechanisms to bundle improved ecosystems and cultural assets into tourism products, thereby sharing the fixed costs of ecological protection and accelerating returns on these investments [18]. Second, the NECPZ acts as a certification that signals outstanding regional ecological quality, and the CTP policy amplifies this regional brand, reducing information asymmetry, attracting tourists and capital, and widening farmers’ income opportunities [19]. Third, environmental regulations and green subsidies steer local governments and enterprises toward eco-friendly industries, while cultural-tourism planning encourages farmers and enterprises to engage in green services. This interplay creates a dual dynamic of top-down institutional incentives and bottom-up market responses. For instance, in Hainan, combining pond-to-wetland restoration with birdwatching tourism has shifted farmers from traditional aquaculture to eco-tour guiding and homestay operations, significantly improving their income structure [15]. This example illustrates how the two policies can jointly reshape livelihoods. Aligned with this logic and the synergistic mechanisms outlined above, this paper proposes the following hypothesis:
H1. 
The combined implementation of CTP and NECPZ policies positively affects farmers’ income growth.

3.2. The Mechanism of Combined Implementation of CTP and NECPZ Policies in Increasing Farmers’ Income

3.2.1. The Mediating Role of Cultural-Tourism Market Attractiveness

Cultural-tourism integration serves both as a key pathway to unlocking the economic value of ecological resources and as a core link connecting national ecological civilization construction to rural household income growth. From the supply side, the National Ecological Civilization Pilot Zone and County Policy requires counties to strengthen ecological protection and environmental governance, thereby directly enhancing the aesthetic value and recreational functions of natural landscapes. The Cultural-Tourism Integration Policy encourages the exploration of local cultural resources and the development of cultural-tourism products [18]. The synergy of these two policies fosters a dual supply advantage of ecology and culture, promoting the planning and protection of scenic spots, as well as the investment and upgrading of star-rated hotels, thereby increasing the number of Points of Interest (POIs) associated with scenic spots and star-rated hotels. From the demand side, the policy synergy between culture–tourism integration initiatives and the NECPZ enhances a county’s brand reputation and tourist appeal. Heightened culture–tourism market attractiveness can fuel the growth of regional tourism spending, expanding employment and income-generating opportunities for farmers [19]. More importantly, this policy overlap significantly raises the potential value and monetization capacity of farmers’ assets and labor. It not only stimulates the local cultural-tourism market but also enables farmers to earn income through homestays, catering, handicraft sales, and by converting ecological agricultural products into tourism commodities [20]. On one hand, farmers use their houses, land, and labor in micro-entrepreneurial activities, generating operating income. On the other hand, rural tourism development substantially increases the rental and transfer value of idle assets such as housing and land, allowing farmers to obtain property income through leasing. Moreover, as the rural cultural-tourism market grows, farmers’ labor is no longer confined to traditional agriculture; they can obtain higher market-based returns by providing services such as tour guiding, catering, and cleaning. This diversifies their income sources and improves the liquidity of their assets and the mobility and bargaining power of their labor [21].
Based on the analysis above, the following assumptions are proposed:
H2. 
The combined implementation of cultural-tourism integration and the NECPZ policies boost farmers’ incomes by enhancing culture–tourism market attractiveness, as measured by indicators such as the market attractiveness of local scenic spots and the ratio of star-rated hotels.

3.2.2. The Mediating Role of Cultural-Tourism Market Development

From the perspective of industrial development, the integration of culture, tourism, and national ecological civilization initiatives can provide a favorable development environment and robust resource foundation for culture and tourism enterprises. On one hand, policies related to ecological conservation and culture–tourism integration in NECPZs offer targeted policy support and market-oriented guarantees, thereby incentivizing a greater number of market participants to engage in entrepreneurial activities and investment within the culture and tourism sector [22]. On the other hand, the First-Mover Economy concept can unleash the latent value of rural resources by incubating innovative rural projects and facilitating technological integration, which in turn drives the expansion and sustainable development of culture and tourism enterprises [1]. Driven by these dual mechanisms, the expanded scale and growth of culture and tourism enterprises deliver tangible socioeconomic benefits to rural households. The expansion of such enterprises generates substantial off-farm employment opportunities for rural residents. Empirical research has shown that the convergence of agriculture, culture, and tourism boosts farmers’ incomes primarily by expanding off-farm employment channels [23]. Newly established culture and tourism enterprises also create specialized positions in management, marketing, product development, and related fields, thereby broadening rural residents’ access to diverse off-farm employment options. Furthermore, the development of culture and tourism enterprises stimulates synergistic growth across upstream and downstream industries, including agricultural product processing and cultural and creative goods manufacturing. This industrial spillover effect further expands the range of income-generating channels available to farmers. Additionally, the rollout of culture and tourism projects is frequently accompanied by upgrades to rural infrastructure, such as paved roads, improved water supply systems, and enhanced internet access. These infrastructure improvements indirectly boost agricultural productivity and increase the added value of agricultural products [24]. Based on the analysis above, the following hypotheses are proposed:
H3. 
The combined implementation of cultural-tourism integration and the NECPZ policies boost farmers’ incomes by stimulating district- and county-level entrepreneurial activity and investment within the culture and tourism enterprise sector.
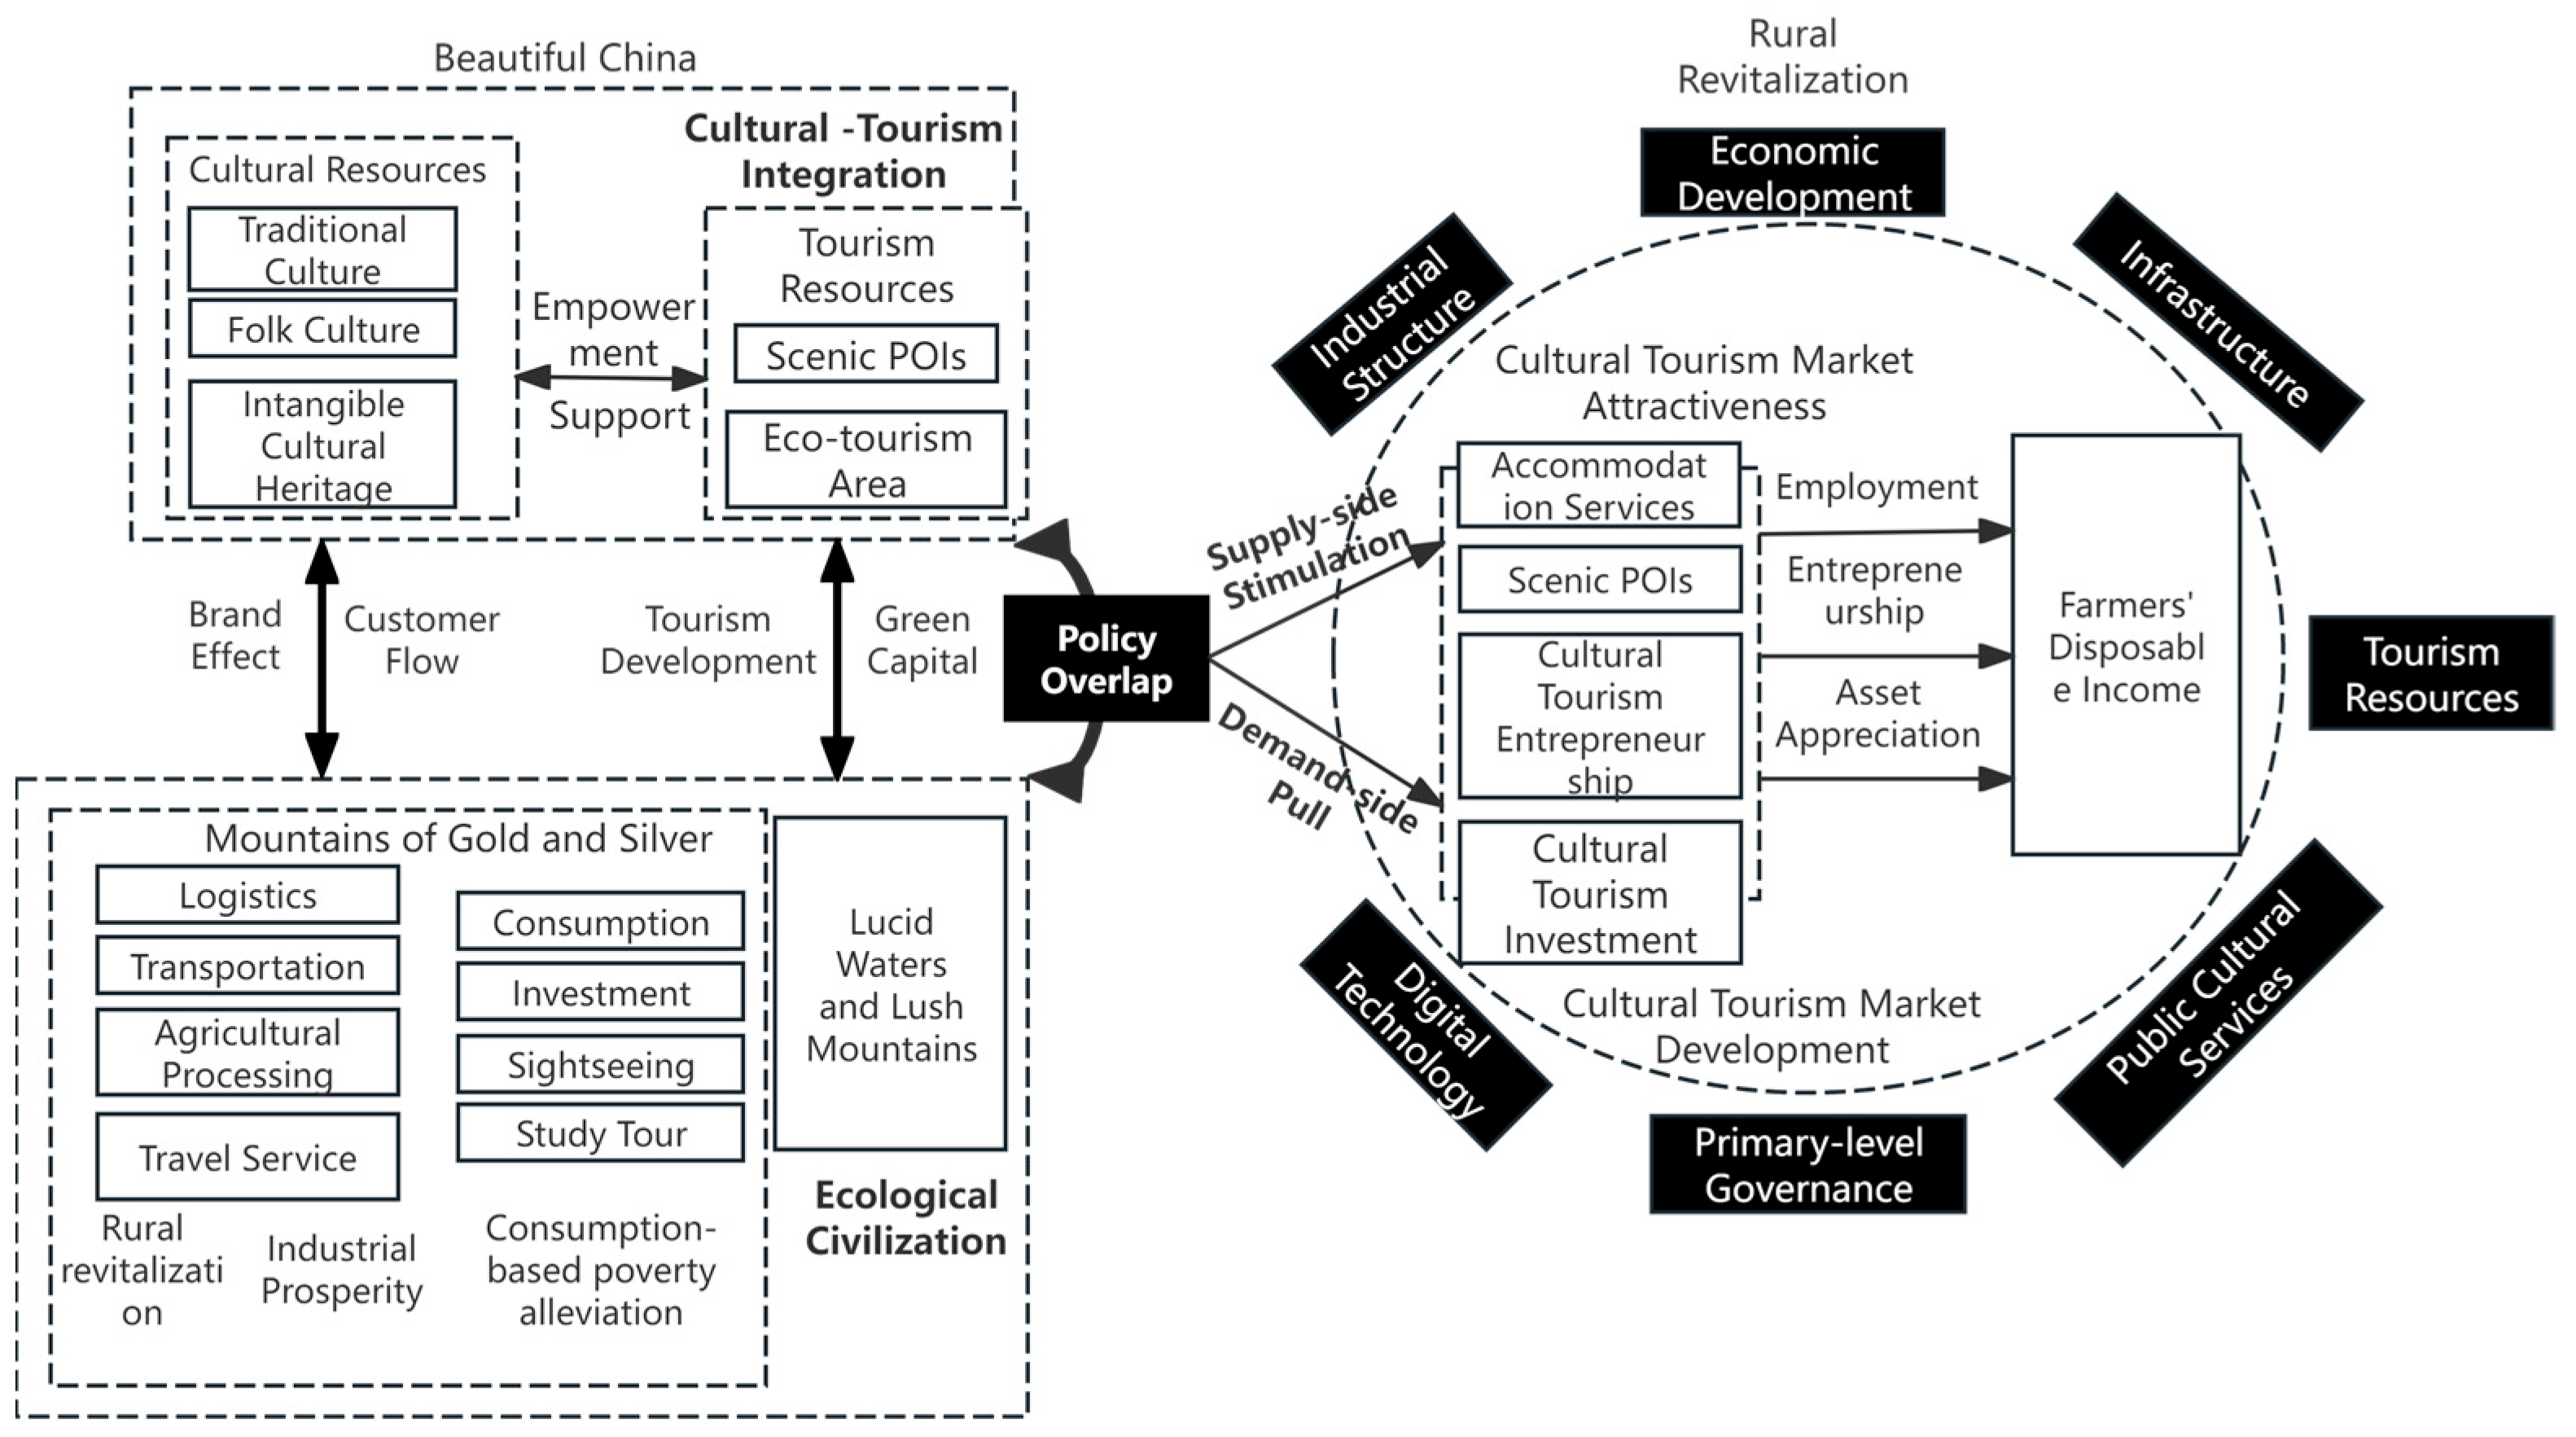
The theoretical model is as follows (Figure 1):

4. Model Construction and Variable Design

4.1. Empirical Procedure

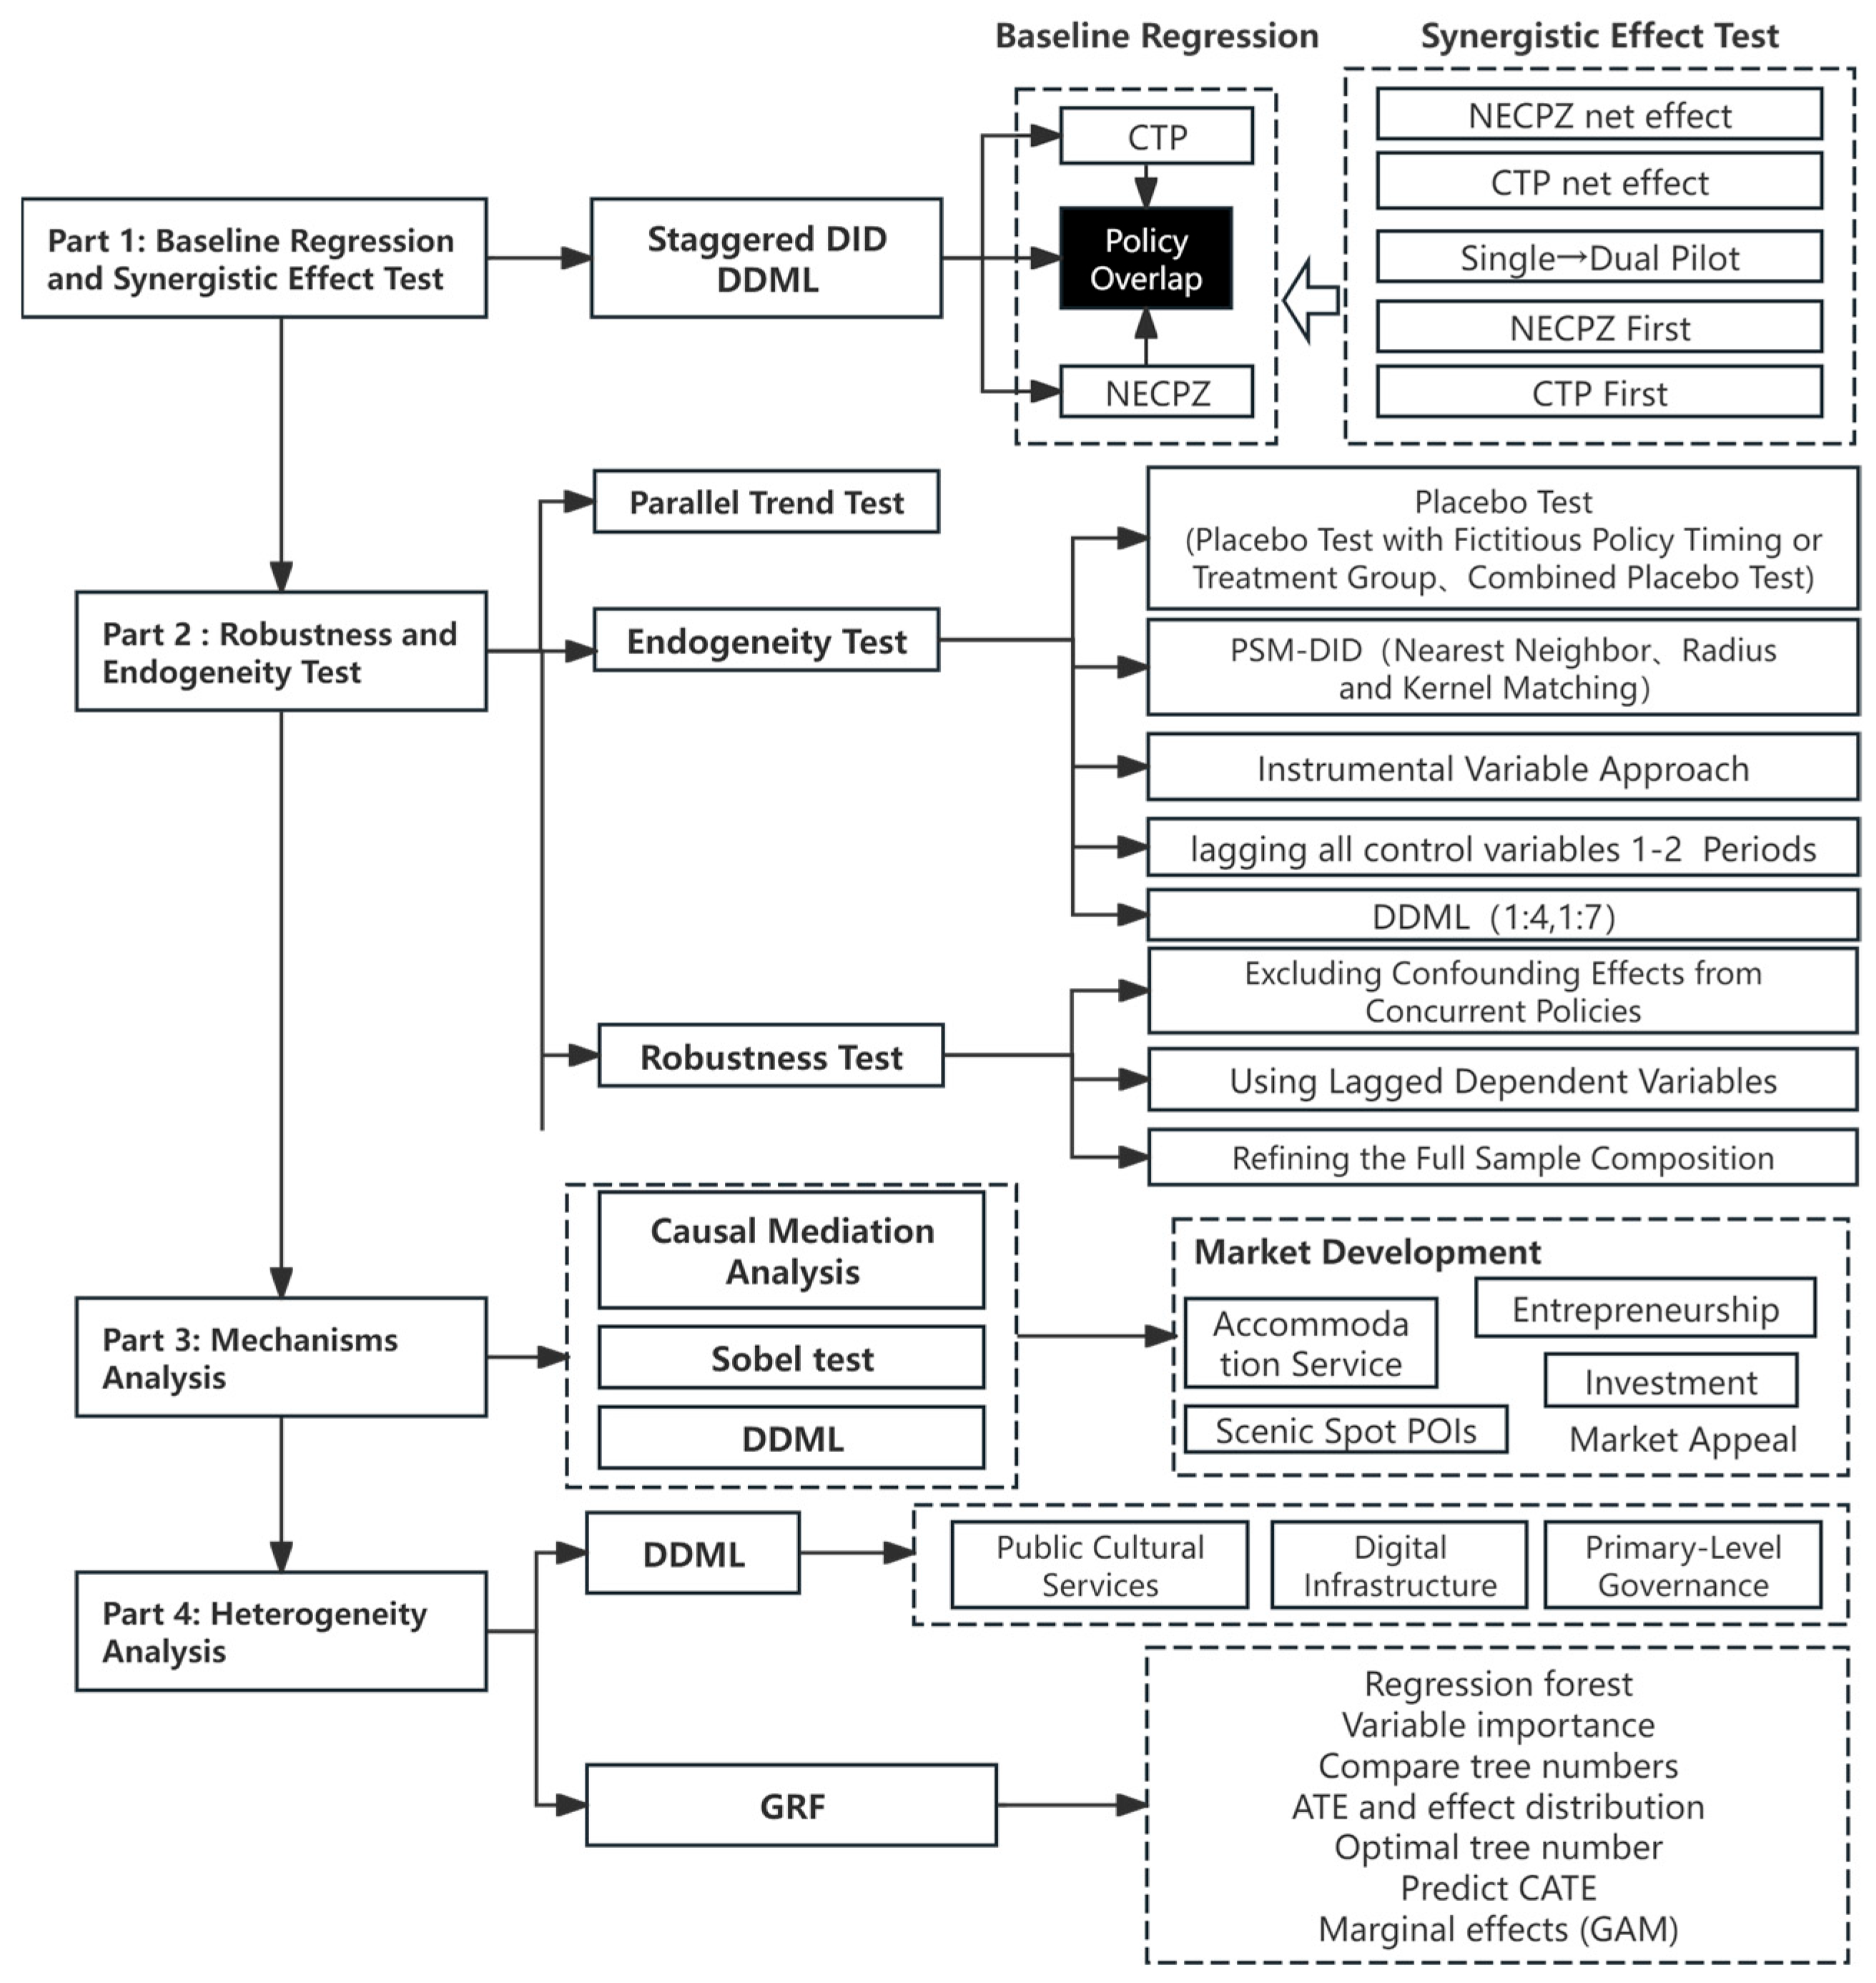
This study constructs a complete analytical framework by comprehensively employing multiple empirical estimation methods, thereby establishing a full empirical chain that covers effect identification, synergy effect verification, robustness testing, mechanism analysis, and heterogeneity exploration. The specific empirical procedure is illustrated in the following Figure 2.

4.2. Model Construction

Considering the potential overlapping effects of the pilot policies, the simultaneous implementation of the cultural-tourism integration and NECPZ policy is framed as a quasi-natural experiment. This analytical framework is designed to empirically examine the impact of the joint rollout of these two policies on farmers’ disposable income. To rigorously validate this causal relationship, an Staggered Difference-in-Differences (DID) model is constructed [11], with the specific specification formulated as follows:
RES it = α 0 + β 0 DID it + δ X it + μ i + ν t + ε it
In this regression specification:
-
i denotes the county, and t denotes the year.
-
RES it is the dependent variable, measuring farmers disposable income.
-
DID it is a dummy variable capturing the joint implementation of the cultural-tourism integration and the NECPZ policy. It is defined as treat 1 × post 1 × treat 2 × post 2 .
-
treat 1 is a dummy variable that equals 1 if a county is covered by the cultural-tourism integration policy, and 0 otherwise. treat 2 follows the same logic for the NECPZ initiative.
-
post 1 is a dummy variable that equals 1 for all years after the implementation of the cultural-tourism integration policy, and 0 for years prior to implementation. post 2 is defined analogously for the NECPZ initiative.
-
X it denotes a vector of time-varying county-level control variables.
-
ν t represents year fixed effects, μ i represents county fixed effects, and ε it is the stochastic disturbance term.
-
The coefficient β 0 captures the net causal effect of the simultaneous implementation of the cultural-tourism integration policy and the NECPZ initiative on farmers disposable income.
Traditional DID models typically assume that policy effects are homogeneous and that the relationship between control variables and the outcome variable is linear. However, the effects of policy implementation may exhibit complex nonlinear characteristics. Within the DDML framework, employing machine learning methods such as random forests allows researchers to better capture these interwoven nonlinear interactions among variables, thereby mitigating estimation bias arising from model misspecification. The model is specified as follows:
RES it = g 0 ( DID it , X it ) + U it
In Equation (2), g 0 ^ denotes the coefficient estimated from the residual terms. U it denotes the error term, with all other variables retaining the definitions specified in Equation (1). The implementation steps for the double machine learning (DML) model are as follows: first, use a machine learning algorithm (e.g., the random forest method) to estimate the propensity score P ( X ) = Pr ( D = 1 | X ) . This score denotes the probability of the simultaneous implementation of the cultural-tourism integration and the NECPZ policies, given the observed control variables X it . Next, within the DML framework to estimate the auxiliary function m 0 ( X ) of the outcome model, characterizing the marginal impact of control variables on the outcome variable. Second, calculate the residual of the treatment variable as D * ^ = D - P ^ ( X ) , and compute the residual of the outcome variable as Y * ^ = Y - m 0 ^ ( X ) . Third, use the estimated residuals to estimate the Average Treatment Effect (ATE) and the Conditional Average Treatment Effect (CATE):
θ ATE 0 ^ = E { g 0 ^ ( 1 , X ) { g 0 ^ ( 0 , X ) }
θ ATE 0 ^ = E { g 0 ^ ( 1 , X ) { g 0 ^ ( 0 , X ) | D = 1 }

4.3. Data Sources and Pre-Processing

4.3.1. Variable Definition and Data Sources

This subsection details the design and measurement of all variables employed in our empirical analysis, along with their respective data sources. To comprehensively capture the effects of the policy overlap on rural residents’ income, we organize the variables into four categories: the dependent variable, the core independent variable, seven control variables addressing county-level socioeconomic conditions, and four mechanism variables through which policy impacts may operate. Data for these variables are drawn from authoritative sources, including the China County Statistical Yearbook, the China Regional Economic Statistical Yearbook, official provincial statistical yearbooks, spatial POI data from Amap and Baidu Maps, and the Tianyancha enterprise registration database. The full variable definitions, units, and data sources are summarized in Table 1 below.
It should be noted that the CTP policy is measured at the prefecture-city level, while the NECPZ policy is measured at the county level. Despite this difference in administrative levels, the research design rests on clear historical and practical grounds. Historically, prefecture-level cities have long possessed more comprehensive supporting facilities for cultural-tourism and richer cultural resources. They took the lead in cultural-tourism integration and now serve as the core hubs connecting counties and cities in regional integration efforts [26]. Counties, by contrast, are rich in high-quality ecological resources which provide a solid foundation for eco-tourism value transformation. In market practice, tourism development has already crossed administrative boundaries: cities can offer platforms and visitor-flow support for county-level cultural-tourism through route design, joint promotion, and brand co-building, while high-quality ecological resources in counties enrich the cultural-tourism supply of prefecture-level cities and enhance overall regional appeal. Together, the two form a deeply coupled pattern characterized by “city empowerment, county-level implementation and carrying capacity, and regionally integrated coordination” [27]. Based on this, analyzing the synergistic effects of municipal CTP policies and county NECPZ policies not only aligns with the actual logic of development, but also accurately reveals the governance hierarchy of city–county coordination and synergy in the context of modernization. Given the policy evolution and data availability, this paper selects prefecture-level CTP policies and county/district-level NECPZ policies for a joint analysis.

4.3.2. Data Preprocessing and Pre-Treatment Covariate Balance

To meet the covariate balance requirement of the staggered DID framework, we pre-process all continuous control variables prior to estimation. GDP is transformed using second differences, FP using first differences, and both PP and RCNCTEs are taken in natural logarithms. All variables are further winsorized at the first and ninety-ninth percentiles to reduce outlier effects. Table 2 presents the balance test results for the pre-policy year 2016, with p-values from two-sample t-tests indicating no significant differences between treatment and control groups at the 5% level, thereby validating our preprocessing strategy. This set of transformed controls is consistently used in all subsequent regressions and robustness checks.

4.3.3. Construction of Mechanism Variables

This subsection details the construction of our mechanism variables. These variables are designed to capture the two primary channels—infrastructure development and entrepreneurial activities—through which the overlapping policies may influence rural residents’ income. Their specific construction procedures are as follows:
(1)
The Number of Scenic Spot POIs (NSS) and the Number of Star-rated Hotels (NSH): Points of Interest (POIs) are GIS locations representing discrete entities, such as scenic spots, restrooms, and other service facilities; their regional count is a recognized proxy for ecosystem service value [28]. To construct county-level longitudinal datasets on NSS, this study integrates APIs from Amap and Baidu Maps with targeted web crawling. After deduplication and coordinate calibration, we compiled annual scenic-spot counts for each county. For accommodation POIs, an initial screening retained entries tagged as hotel and star-rated hotel. The annual count of star-rated hotels for each county were then aggregated across the study period to form a consistent time-series dataset.
(2)
Number of Newly Registered Cultural-Tourism Enterprises and Registered Capital: Following the methodological framework established by Lin Song et al. (2023) [12], this study collected a dataset of approximately 280 million enterprise registration records covering mainland China from 1949 to 2023 via the Tianyancha database. To scientifically identify enterprises related to eco–culture–tourism integration, this paper adopts a two-step screening method combined with word frequency analysis to determine the final set of keywords, ensuring both coverage and accuracy.
-
Step 1 Broad initial screening: Drawing on common business scope descriptions of culture–tourism integration, a set of basic keywords (see the first row of Table 3) is chosen. All enterprises whose business scope includes at least one of these basic keywords are placed in a candidate sample. This step yields over 600,000 preliminarily relevant enterprises.
-
Step 2 Word frequency analysis and extraction of core keywords: Word frequency analysis is conducted on the business scopes of the more than 600,000 candidate enterprises. Keywords that are highly relevant to the eco–culture–tourism integration are retained to form the final keyword list. The extracted core keywords are listed in Table 3.
-
Step 3 Precise screening: Based on the extracted core keyword list, over 700,000 enterprises were precisely screened, yielding 372,654 enterprises. A firm was retained if its business scope contained any core keywords: Table 3 reports the keyword frequencies. Among the screened cultural-tourism enterprises, the basic keywords “tourism” (335,000 occurrences), “culture” (91,000), and “sightseeing” (155,000) had the highest frequencies, effectively capturing the fundamental scope of cultural-tourism integration. The core keywords fall into four categories: eco-tourism, cultural-tourism integration, agro-cultural-tourism integration, and leisure and sightseeing agriculture. Notably, “leisure agriculture” (249,000) and “rural tourism” (257,000) are the most frequent, pointing directly to the county-level cultural-tourism market of interest. Core terms such as “eco-tourism” (26,000) and “cultural-tourism” (22,000) show median frequencies. To ensure sample coverage, this study also retained some low-frequency keywords, including “intangible cultural heritage tourism” (3) and “eco-study tours” (3). All keywords correspond to actual business scopes, with no irrelevant noise.
After aggregating the 372,654 firms to the county–year level, this study constructs panel data on the number of newly registered enterprises (NCTEs) and total registered capital (RCNCTEs, in CNY 100 million). These two variables respectively capture the scale of capital inflows and entrepreneurial activity in the cultural-tourism sector, and they are sufficient to support causal inference methods such as DID and DDML. Table 4 presents the descriptive statistics of the variables.

5. Empirical Results and Analysis

5.1. Parallel Trend Test

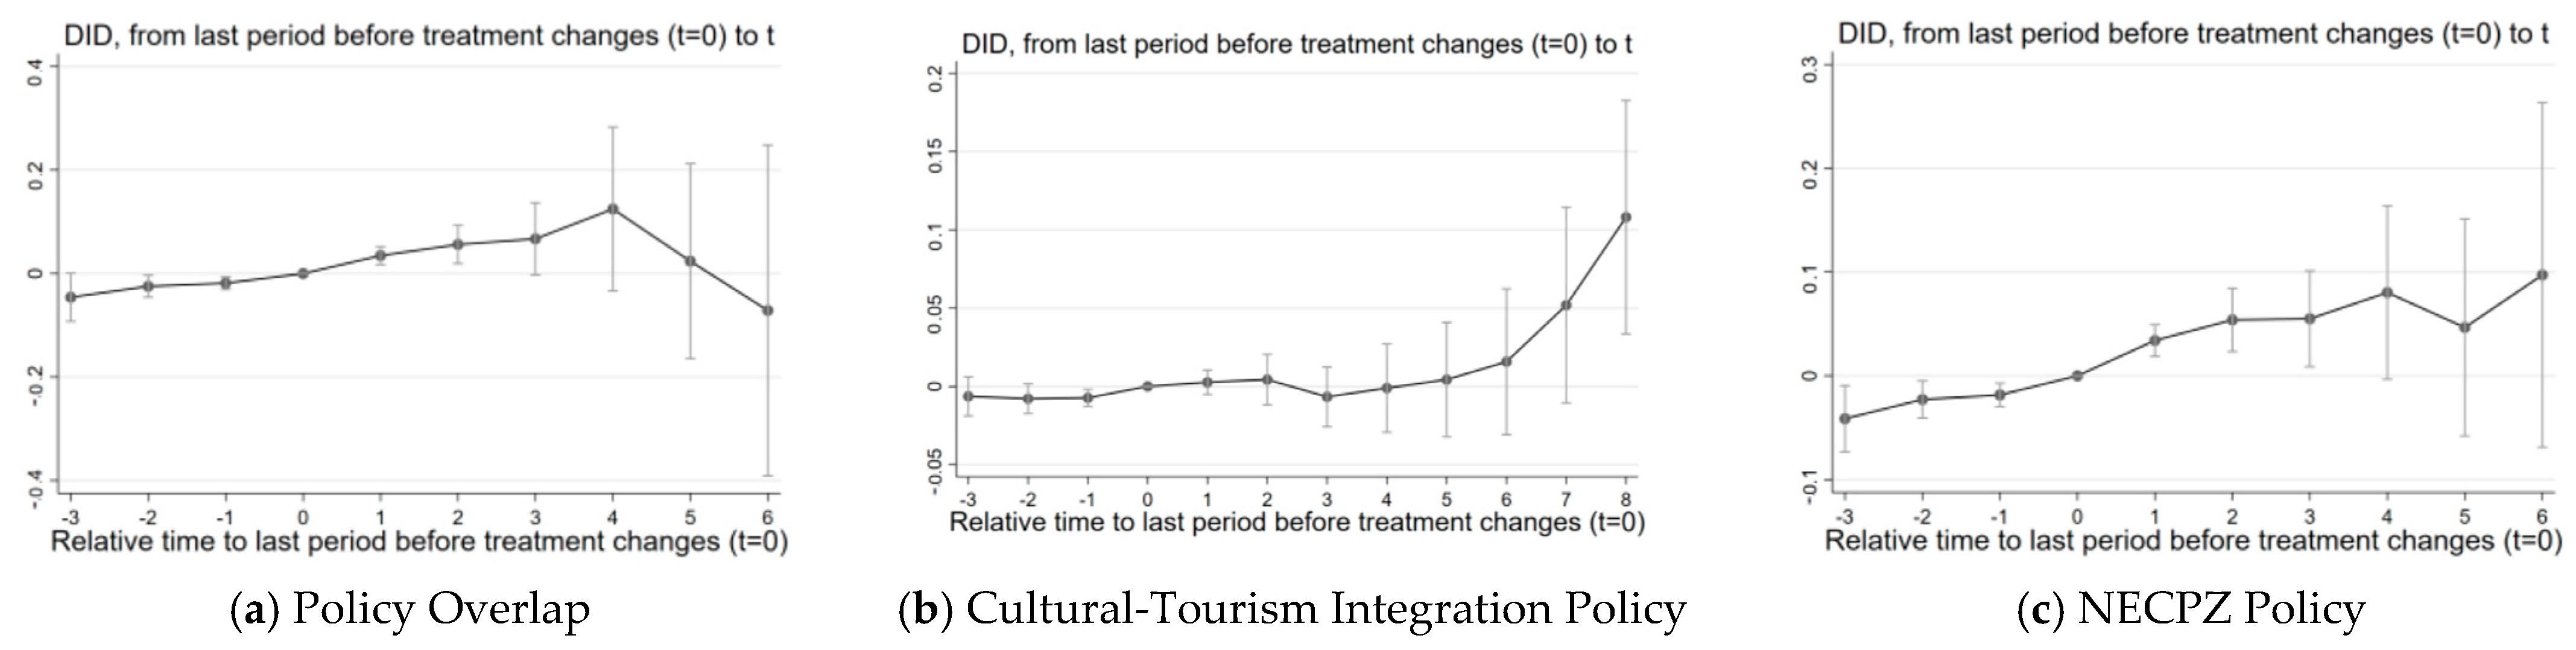
The validity of our staggered difference-in-differences (DIDs) model relies on two core identifying assumptions: the parallel trends assumption and the stable unit treatment value assumption (SUTVA). We perform two sets of diagnostic tests to verify these conditions. First, we test the parallel trends assumption using the event-study approach of Jacobson et al. [29]. As shown in Figure 3, the point estimates for all pre-treatment (lead) periods are statistically indistinguishable from zero, indicating no systematic divergence prior to the policy. By contrast, the point estimates for the post-treatment (lag) periods are consistently positive and statistically significant. Taken together, these results confirm that the parallel trends assumption holds, thereby justifying the use of the staggered DID framework in the subsequent empirical analysis.
Second, covariate balance is confirmed using 2016 pre-policy data (Table 2). For all seven covariates, the two-sample t-tests yield p-values far exceeding 0.10 (ranging from 0.315 to 0.917), indicating no significant pre-existing differences between treatment and control groups. The SUTVA is also satisfied given the independent municipal-level implementation. Collectively, these checks validate our staggered DID approach and support its causal findings.

5.2. Baseline Regression Results

Columns (1)–(3) of Table 5 report staggered DID estimates, and columns (4)–(6) present the DDML results. The coefficient in column (1) is 0.0955 and significant at the 1% level, indicating that implementing multiple policies simultaneously significantly boosts farmers disposable income. Columns (2) and (3) show that both the CTP policy and the NECPZ Policy have significantly positive coefficients, meaning each independently increases farmers’ income. Notably, the policy overlap effect yields the largest coefficient, demonstrating that policy overlap amplifies the individual effects of each policy.
For robustness, we re-estimate the model using the double/debiased machine learning (DDML) method [30]. This approach employs a partially linear model with five-fold cross-fitting, uses a random forest as the base learner, and corrects regularization bias through orthogonal moment conditions to produce semi-parametric unbiased estimates. The random seed is fixed at 42, and heteroskedasticity-robust standard errors are used; these settings apply to all subsequent DDML models unless noted otherwise. According to the results listed in columns (4)–(6). Under DDML, the policy overlap coefficient is 0.0717, notably larger than that of the cultural-tourism integration policy. This suggests that the synergistic effect of overlapping policies is more effective at raising farmers’ income than the CTP policy alone.

5.3. Testing the Synergistic Effect of Policy Overlap

To evaluate the synergistic effect of the dual pilots, i.e., whether the dual pilots have a stronger effect in promoting farmers’ income growth compared to single pilots, this study follows the approach of Zhao et al. (2023) [15] and adopts a grouped regression strategy to identify marginal effects step by step. The results are shown in Table 6.
To identify the marginal effect of a single policy, Column (1) excludes the samples from cultural-tourism integration pilot areas, retaining only the non-pilot areas and areas that implement solely the NECPZ policy; the regression coefficient reflects the net effect of this policy on farmers’ income growth. Column (2) excludes the samples from NECPZ pilot areas, and the regression coefficient captures the net effect of the CTP policy. To test whether the dual pilots have a better policy effect than single pilots, Column (3) excludes all non-pilot samples, using the dual pilots as the treatment group and single pilots as the control group. The regression coefficient then captures the net effect of changing from a “single pilot” to a “dual pilot” on farmers’ income growth in the region. The results show that the coefficient of policy overlap is 0.268, significant at the 1% level. This means that, compared with single pilot, transitioning to a dual pilot increases farmers’ income by an additional 26.8%, which is significantly higher than the marginal contribution of a single policy alone. Therefore, Hypothesis H1 is supported, i.e., the overlap of the two policies can generate a stronger policy effect.
To identify how policy implementation order affects marginal effects, Column (4) is estimated using only regions where the NECPZ policy was introduced first. Within this sample, areas that later adopted the CTP policy are assigned to the treatment group, and the rest form the control group. The estimate therefore captures the marginal effect of adding the CTP policy to counties already implemented NECPZ policy. Column (5) proceeds in reverse: it uses only regions where the CTP policy was implemented first, and treats those that subsequently established NECPZ as the treatment group, thereby identifying the marginal effect of adding the NECPZ policy. The regression result of Column (4) shows a coefficient of 0.01, which is not significant. The regression result of Column (5) shows a coefficient of 0.104, which is significant at the 1% level. This finding points to a strong order dependence in the synergistic effect of the two policies: establishing a cultural-tourism integration foundation first and then advancing ecological civilization construction significantly amplifies the income-enhancing effect, whereas reversing the order generates no detectable impact. A plausible explanation is that CTP policies involve developing cultural resources, tourism infrastructure, and destination branding, which enhances regional economic vitality and market recognition. When NECPZ is subsequently introduced, the already-functioning tourism base can accelerate the realization of ecological resources’ market value. Existing tourism routes can incorporate ecological protection highlights, and established tourist flows can help fund ecological maintenance. This “cultural-tourism paves the way, ecology follows through” pathway amplifies the marginal returns of the policy overlap. Conversely, if the NECPZ policy is implemented first, its focus on conservation, environmental governance, and green constraints may impose extra restrictions on a cultural-tourism sector that is still in its early stages, such as stricter development boundaries and tighter construction approvals, potentially stifling its growth.

5.4. Endogeneity Tests

5.4.1. Instrumental Variable Approach

To mitigate potential endogeneity biases arising from reverse causality between the explained variable and control variables, this study follows the methodological framework developed by Zou Fan et al. [31], by first lagging all control variables by one period and subsequently by two periods to perform endogeneity tests. In addition, we instrument the simultaneous implementation of CTP and NECPZ policies with the difference-in-differences (DID) interaction term of the Leisure Agriculture Demonstration County (LADC) policy. The LADC policy, an important form of eco-cultural-tourism integration, is highly correlated with the overlapping implementation of the two policies, and as a national-level pilot program, its timing and location are plausibly exogenous and do not directly affect rural residents’ income, thus satisfying the exogeneity condition for a valid instrument. The regression results are reported in Table 7.
The first-stage regression results show that the instrumental variables are significantly positive at the 1% level. The Anderson LM statistic of 158.84 (p < 0.01) confirms no underidentification, and The Cragg-Donald Wald F statistic is 146.8, which far exceeds the 10% critical value for weak instrument tests. These diagnostics indicate strong instrument relevance and no weak instrument bias. The endogeneity test yields a chi-square statistic of 38.719 (p < 0.01), rejecting exogeneity and supporting the use of the instrumental variable approach. In the second stage, the estimated coefficient for the DID is 1.015 (p < 0.01). The overall model F-statistic is 146.8 (p < 0.01), confirming joint significance. These results indicate that the policy overlap significantly increases rural residents’ per capita disposable income, reinforcing the robustness of the baseline findings after addressing endogeneity.

5.4.2. PSM-DID

Since the counties implemented the CTP policy or the NECPZ policies are selected by specific government criteria, the assumption of a random distributed policy shocks is not strictly met. To address potential endogeneity from non-random sample selection, this paper employs the Propensity Score Matching combined with Difference-in-Differences (PSM-DID) framework to conduct robustness tests. Specifically, three matching methods are applied: nearest neighbor, radius, and kernel matching. Post-matching regression results are reported in Columns (1) to (3) of Table 8. Furthermore, balance test results—omitted for brevity but available on request—demonstrate that the standardized mean bias for all covariates is substantially reduced after matching and the t-test fail to reject the null hypothesis of no systematic differences, confirming that covariate distributions are balanced across treatment and control groups. Hence, the only systematic difference between the groups is their exposure to the overlapping policies. Notably, the estimated DID coefficients are all statistically significant and positive, validating that the overlapping policies exerts a positive impact on rural residents’ per capita disposable income, a result consistent with the baseline regression.

5.4.3. DDML

To address potential endogeneity concerns stemming from suboptimal feature selection, model overfitting, or underfitting, this study adopts the DDML to conduct endogeneity tests. Specifically, we set the sample split ratios to 1:4 and 1:7, and deployed Lasso regression, Elastic Net prediction, Random Forest, and Ridge Regression method for estimating the main regression (with all other settings consistent with the baseline DDML model). The results presented in columns (4) to (7) of Table 8 demonstrate that the regression coefficients of the core explanatory variable are all statistically significant and positive at the 5% level. This finding confirms that the concurrent implementation of the cultural-tourism integration policy and the NECPZ policy exerts a robust positive impact on the growth of farmers’ incomes, which is consistent with the conclusions of the baseline regression.

5.5. Robustness Tests

5.5.1. Placebo Test

(1) Placebo Test with Fictitious Policy Timing: To exclude confounding effects from time trends or concurrent events, this paper follows the approach of Topalova [32] and artificially advances the actual policy implementation timing by 1, 2, 3, and 4 years, constructing four sets of placebo treatment shocks, and then re-estimates the baseline models using these fictitious shocks to check for spurious correlations. The coefficients of the placebo interaction terms corresponding to the 1-, 2-, 3-, and 4-year advanced timings are 0.0738, 0.0736, 0.0729 and 0.0732, respectively—all smaller than the baseline coefficient and decreasing as the fictitious policy timing is advanced further. This indicates that the estimated true policy effect is not driven by pre-existing time trends or anticipation effects, confirming the robustness of the baseline conclusion.
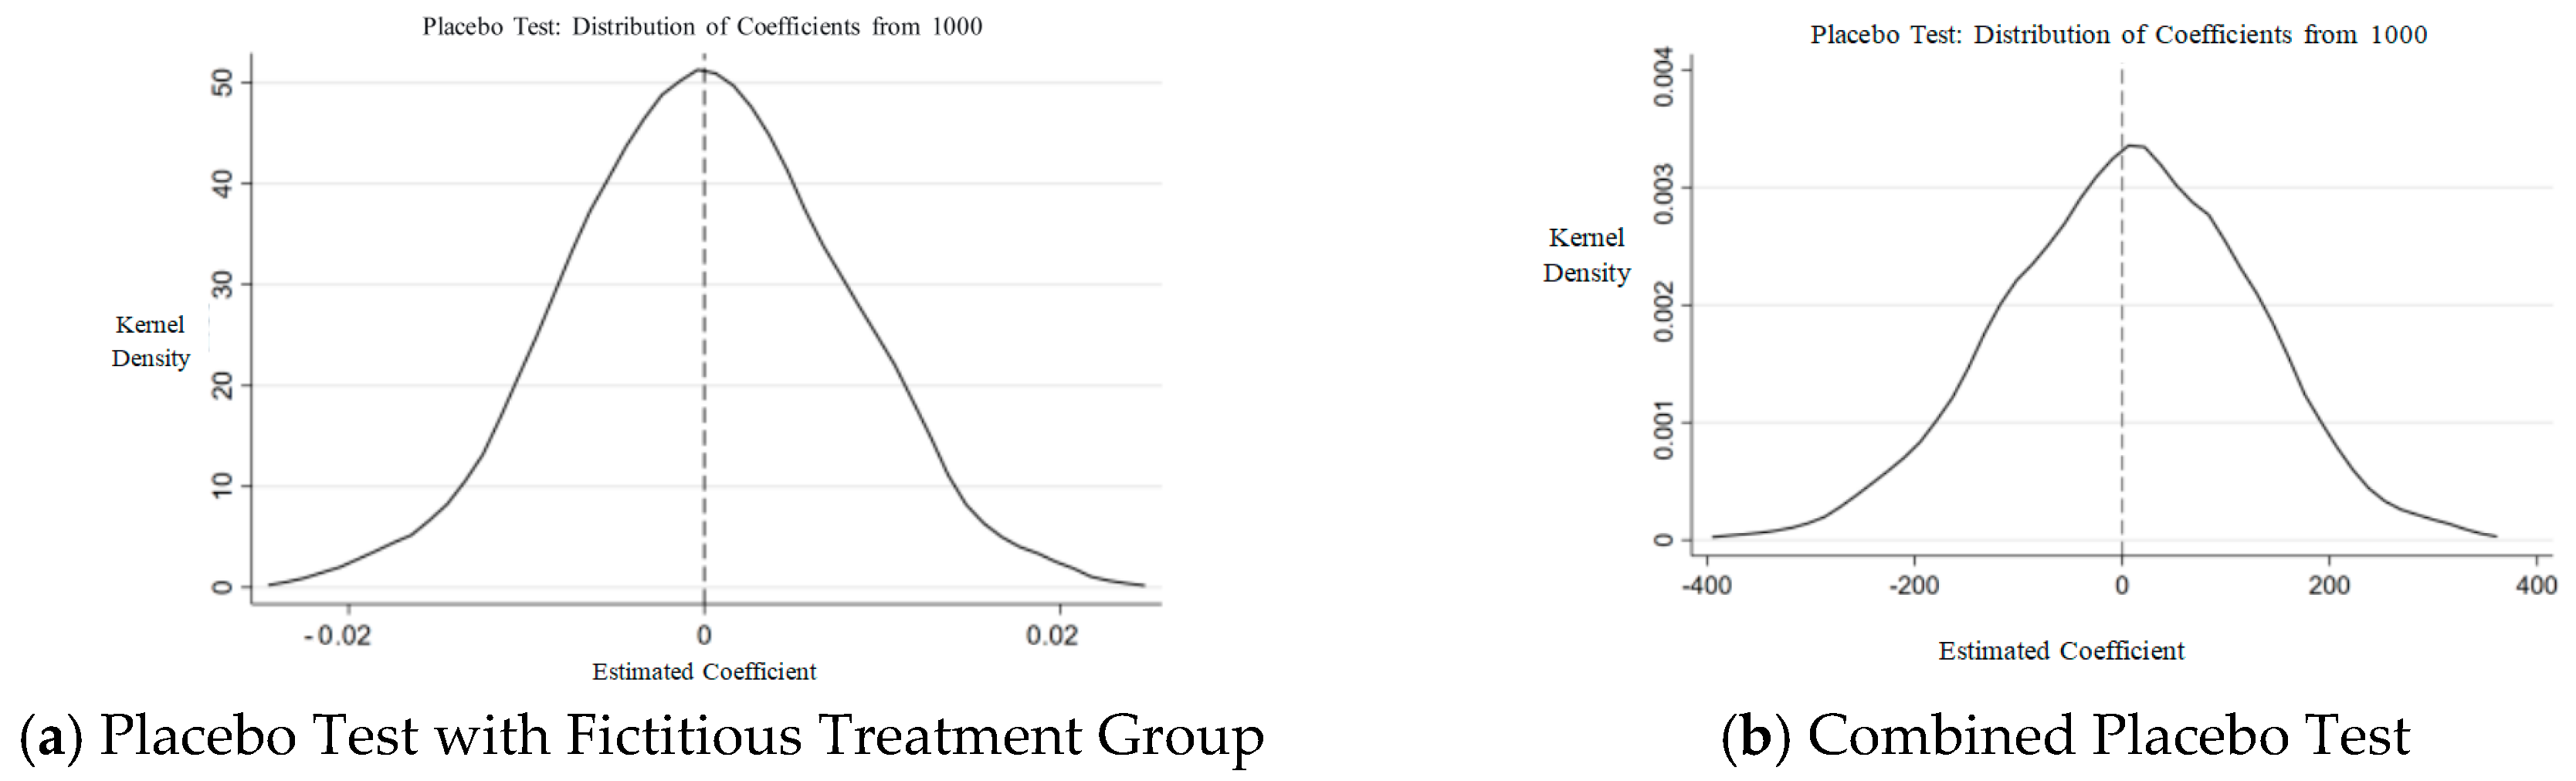
(2) Placebo Test with Fictitious Treatment Group: To mitigate interference from unobservable omitted variables or random factors, this study follows the approach of Cai et al. [33]. Specifically, this study randomly draws a subset of counties from the full sample, with the subset size matching that of the actual treatment group, to constitute the placebo treatment group. For the period of 2010–2023, each county in the placebo group is randomly assigned a distinct fictitious policy implementation year. We then construct a fictitious difference-in-differences (DID) variable to replace the actual policy variable and re-estimate the baseline model. This entire randomization and estimation procedure is repeated 1000 times to generate a distribution of counterfactual treatment effects. The validity of the estimated policy effect is assessed by plotting the kernel density of these counterfactual coefficients against the actual treatment effect coefficient from the baseline regression, as presented in Figure 4a.
(3) Combined Placebo Test: To further rule out the joint confounding effects stemming from unobserved county-specific and time-varying factors, we implement a combined placebo test. Keeping the baseline model specification and control variables, we first ensure the placebo treatment group has the same sample size as the actual treatment group and restrict fictitious policy years to the study window (2010–2023). Next, we randomly select an equal number of counties to form a counterfactual treatment group and assign them rando policy years. After constructing the counterfactual DID interaction term, we estimate the baseline model 1000 times. The validity of the estimated policy effect is verified by comparing the distribution of the 1000 placebo coefficients with the actual estimated coefficient via a kernel density plot, as presented in Figure 4b.
The kernel density plots in Figure 4a,b show that the pseudo-coefficients from the 1000 random simulations are symmetrically distributed around zero in a bell-shaped pattern, with their mean approaching zero. In contrast, the actual coefficient deviates significantly from the distribution range of the pseudo-coefficients, indicating that the fictitious policy shocks fail to yield a significant effect.

5.5.2. Bacon Decomposition and Heterogeneity-Robust Estimation

To mitigate potential estimation bias arising from treatment effect heterogeneity in the DID framework, this study first adopts the Bacon decomposition method to disentangle the heterogeneous sources of the policy’s treatment effects. The results (Table 9, Part 1) show that the 2 × 2 comparison using never-treated units as controls dominates with 96.21% of the total weight, yielding an average treatment effect of 0.0426. Comparisons using later-treated and earlier-treated controls receive only 3.2% and 0.59% of the weight, with effects of −0.0272 and 0.0329, respectively. Thus, the overall DID estimate is driven almost entirely by the never-treated contrast, implying that the baseline results do not depend on temporal comparisons and that any bias from treatment effect heterogeneity is minimal.
To further validate the robustness of our empirical findings against treatment effect heterogeneity, three heterogeneity-robust estimation methods are applied for validation purposes(Table 9, Part 2): the two-way fixed effects approach with heterogeneous treatment effects developed by de Chaisemartin and D’Haultfoeuille (2020) [34]; the panel data estimation method accounting for unobserved individual and time heterogeneity proposed by Wooldridge (2025) [35]; and the staggered difference-in-differences (DID) strategy introduced by Callaway and Sant’Anna (2021) [36]. Across all three estimation strategies, the coefficients of our core explanatory variables remain consistently positive and statistically significant (p < 0.05). This confirms that the positive impact of the simultaneous implementation of the CTP and NECPZ policies on farmers’ income growth is robust to treatment effect heterogeneity. This finding aligns with our baseline TWFE estimates and further corroborates that our core conclusions are not driven by heterogeneous treatment effects. Overall, these results indicate that, although the baseline TWFE estimator cannot completely rule out potential bias from treatment effect heterogeneity, the bias is limited and our main findings are sufficiently robust.

5.5.3. Additional Robustness Tests

(1)
Excluding Confounding Effects from Concurrent Policies: Considering that farmers’ income may be influenced not only by the policy overlap between CTP and the NECPZ policy, but also by parallel policies such as the New-type Urbanization Pilot Policy and the Urban-Rural Integrated Development Pilot Policy, this study incorporates dummy variables for these two Concurrent programs as control variables in the baseline model to conduct robustness testing. The empirical results demonstrate that the coefficient of the core explanatory variable remains significantly positive at the 1% level across all three specifications: the model with the New-type Urbanization Pilot Policy dummy, the model with the Urban-Rural Integrated Development Pilot Policy dummy, and the model including both dummies. This confirms that the baseline regression results remain statistically robust even after controlling for potential confounding effects from these parallel policies.
(2)
Using Lagged Dependent Variables: To further mitigate endogeneity arising from potential reverse causality between the dependent variable and the core explanatory variable, this study re-estimates the baseline model including one- and two- period lags of the dependent variable. In both specifications, the coefficient of the key explanatory variable remains significantly positive at the 1% level, confirming the robustness of the baseline regression results.
(3)
Refining the Full Sample Composition: Administrative division adjustments, including county-to-district and county-to-city conversions, can substantially reshape local fiscal resource allocation and the foundations of agricultural development, thereby exerting non-negligible impacts on farmers’ disposable income. To isolate the true effect of the core explanatory variable from such policy shocks, this study first excludes all observations that underwent administrative division adjustments during the sample period and re-estimate the baseline regression using this refined sample. The results confirm that the coefficient of the core explanatory variable remains positive and statistically significant at the 1% level, fully consistent with the initial baseline findings. (Complete regression outputs are omitted for brevity but available on request).

6. Analysis of Impact Mechanisms

To identify the mechanisms through which the overlapping effect of the two policies affects rural residents’ income, this study employs three methods for mediation analysis. First, we adopt the causal mediation analysis framework proposed by Imai et al. (2010) [37], which relies on the sequential ignorability assumption and estimates the average causal mediation effect (ACME) using linear regression models. Specifically, we implement the medeff command in Stata-17 (Hicks and Tingley, 2011) [38] with 1000 simulations and a random seed of 123 to ensure replicability. Second, we conduct the Sobel test (Sobel, 1982) [39] as a supplementary validation, which uses the product of coefficients from the mediator and outcome models and applies the delta method to compute the standard error of the indirect effect and to determine its significance. Finally, to address potential functional form misspecification and high-dimensional nonlinear influences inherent in traditional linear models, we further employ a DDML approach for robustness checks, with model specifications consistent with the baseline regressions. Consistent results across different methods indicate that the mediation pathway inference is reliable.

6.1. Analysis of the Mediating Effect of the Number of Scenic Spot POIs (NSS)

Column (1) of Table 10 reports the estimation results with NSS as the mediator. The decomposition from the causal mediation framework shows that the average causal mediation effect (ACME) along this path is 0.0249, significant at the 1% level; the direct effect of the policy overlap is 0.9132, and the total effect reaches 0.9382, with all effects statistically significant, indicating a significant mediating role of NSS. Furthermore, the DDML estimates indicates that the coefficient of the policy overlap is 48.9451, significant at the 1% level, and the Sobel test also confirms the significance of this mediating pathway. These results imply that the NECPZ policy enhances regional ecological quality and brand reputation, incentivizing local governments and market actors to increase investment in ecological conservation and development. Simultaneously, the CTP policy promotes tourism planning and resource integration, enabling more potential ecological resources to be designated as scenic spots. This expansion of carrying capacity, in turn, creates favorable conditions for raising farmers’ income.

6.2. Mediation Effect Analysis of the Number of Star-Rated Hotels (NSH)

Column (2) of Table 10 reports the test results with the NSH as the mediator. The causal mediation decomposition shows that the ACME along this path is 0.01966, significant at the 1% level; the direct effect of the policy is 0.5733, and the total effect is 0.7699, both significant at the 1% level, indicating that the NSH is an effective mediator. The DDML estimates show that the coefficient of the policy overlap is 1.2895, significant at the 5% level, and the Sobel test further verifies that this mediating pathway is significant. This result indicates that the brand effect of the NECPZ policy strengthens investment confidence, while the CTP policy, through planning guidance and financial support, incentivizes social capital to enter the tourism reception sector. The increase in NSH implies an upgraded reception capacity, which can extend tourists’ length of stay and increase per capita consumption, thereby converting visitor flows into farmers’ income.

6.3. Analysis of the Mediating Effect of New Registrations of Cultural and Tourism Enterprises (NCTEs)

Column (3) of Table 10 uses the NCTEs to measure market entity vitality. The causal mediation decomposition results show that the ACME along this path is 0.0786, significant at the 1% level; the direct and total effects of the policy are 0.6905 and 0.7691, respectively, both passing significance tests, indicating a clear mediation pattern. The DDML regression results show that the coefficient of the policy overlap is 11.3064, highly significant at the 1% level, and the Sobel test also proves that the mediating effect of NCTEs is significant. This demonstrates that the overlapping effect of the two policies, through agglomeration effects, can expand the number of cultural-tourism market entities, which is one of the core mechanisms for promoting farmers’ income growth. On the one hand, newly registered cultural-tourism enterprises create more job opportunities, absorbing surplus rural labor; on the other hand, they facilitate production–marketing linkages for local agricultural products and handicrafts, extend the agricultural value chain, and thereby broaden farmers’ income channels through multiple pathways.

6.4. Analysis of the Mediating Effect of Newly Registered Capital of Cultural and Tourism Enterprises (RCNCTEs)

Column (4) of Table 10 uses RCNCTEs to reflect the level of capital supply. The causal mediation decomposition shows that the ACME along this path is 0.01092, significant at the 1% level; the direct effect of the policy is 0.6599, and the total effect is 0.7692, both passing significance tests and indicating a clear mediation pattern. The DDML estimates show that the policy overlap effect is 0.4512, significant at the 1% level. Combined with the Sobel test results, confirming that the mediating effect of RCNCTEs is evident. This implies that expanding cultural-tourism investment and deepening the supply of market-based capital factors indirectly promote farmers’ income growth. On the one hand, increased cultural-tourism investment can be used to upgrade facilities, brand building, and business model innovation, thus raising the overall added value and competitiveness of the regional cultural-tourism industry. On the other hand, it allows farmers to diversify their income sources by engaging in tourism services, land transfers, and shareholding dividends.

7. Heterogeneity Analysis

To examine the heterogeneity of policy effects across different county-level characteristics, this study employs two complementary methods: DDML and generalized random forest (GRF). These two approaches form a mutually reinforcing heterogeneity testing system from two dimensions: predefined subgroup validation and data-driven exploration. First, we conduct subgroup DDML regressions based on indicators such as the level of public cultural services, primary governance capacity, and digital infrastructure, with model specifications consistent with the baseline regression. In addition, we employ generalized random forest (GRF) for data-driven heterogeneity exploration. GRF, proposed by Athey et al. (2019) [40], extends the classical random forest by using “honest estimation” to avoid overfitting bias, and it can accommodate high-dimensional control variables and nonlinear relationships [41]. By constructing a causal forest to estimate the conditional average treatment effect (CATE), GRF adaptively identifies important covariates that drive heterogeneity. Its advantages are twofold: first, data-driven feature selection objectively reveals the key sources of heterogeneity, avoiding the arbitrariness of manually specified subgroups; second, it accurately estimates individual treatment effects under complex heterogeneity scenarios, providing empirical evidence for identifying policy boundaries and enabling differentiated resource allocation.

7.1. Heterogeneity Analysis Based on DDML

7.1.1. Heterogeneity Test Based on Different Levels of Public Cultural Services

This study measures the county-level public cultural service level by combining three indicators: total public library collections (measured in 100,000-volume units), the number of sports venues, and the number of performing arts venues (theaters and cinemas). Given the county-level focus and the scale standards for small libraries, a collection of 100,000 volumes is treated as one eligible small library. The full sample is divided into high-level and low-level groups based on the mean value of this composite score. The regression results are presented in columns (1)–(2) of Table 11. In regions with a high level of public cultural services, the treatment effect of the policy overlap is 0.1052, statistically significant at the 1% level. In contrast, in regions with a low level of public cultural services, the effect is only 0.03088 and fails to pass the significance test. These results confirm that a well-established public cultural service system is critical to amplifying the policy’s impact on rural residents’ incomes. Such systems provide rich local cultural resources, diverse cultural engagement platforms, and accessible participation channels, thereby enhancing the policy’s income-raising effect. Conversely, regions with weak cultural foundations face structural barriers—limited resources and a narrow participation base—that prevent policy dividends from fully translating into tangible economic gains for rural populations.

7.1.2. Heterogeneity Test Based on Different Levels of Primary-Level Governance

Drawing on relevant studies, primary-level governance is measured by the density of primary-level governance units within a jurisdiction, defined as the total number of sub-district offices and villagers’ committees divided by the corresponding land area. The full sample is divided into high and low governance groups based on the mean value of this ratio. As shown in columns (3)–(4), the policy effect stands at 0.2742 (significant at the 1% level) in regions with strong governance, compared to just 0.03698 (not statistically significant) in those with weak governance. Primary-level governance encompasses residents committees’ executive, resource mobilization, and conflict coordination capacities. Areas with robust primary-level governance can more effectively implement policy plans, integrate funding and projects, and mobilize farmers’ participation, thereby amplifying the income-boosting effect of policies. In contrast, underdeveloped primary-level governance often suffers from organizational fragmentation and weak execution, hindering the effective rollout of policy initiatives.

7.1.3. Heterogeneity Test Based on Different Levels of Digital Infrastructure

Digital infrastructure development is operationalized using the number of broadband subscribers as a proxy variable. To examine heterogeneous policy impacts, the full sample is split into two subgroups—high and low digital infrastructure regions—using the annual average number of broadband subscribers as the grouping threshold. Columns (5) and (6) of the regression results reveal that the estimated policy effect stands at 0.1617 in high digital infrastructure regions, which is statistically significant at the 1% level. In contrast, the corresponding effect in low digital infrastructure regions is −0.01565 and is not statistically significant. This indicates that the policy effect is more pronounced in areas with well-developed digital infrastructure. From a mechanistic perspective, robust digital infrastructure alleviates information asymmetry, expands the market access of cultural and tourism products, and facilitates the integrated development of agriculture, tourism, and e-commerce. These channels collectively amplify the positive impact of the policy on rural households’ income growth.

7.2. Policy Effect Analysis Based on Generalized Random Forest Model (GRF)

This study constructs a causal forest model using the GRF package (version 2.3.0) in R [1]. A baseline regression forest is fitted with the package’s default hyperparameters. In contrast, the causal forest is automatically tuned—following the honest estimation and cross-validation approach of generalized random forests [42]—by specifying tune. parameters = “all” to minimize the out-of-bag mean squared error. The random seed is fixed at 1 to ensure reproducibility across all stochastic processes.

7.2.1. Analysis of the Average Treatment Effect of Overlapping Policies

Before using the causal forest to estimate the CATE, the number of trees in the forest must be determined. Theoretically, too few trees may lead to unstable estimates, while too many trees significantly increase computational costs with limited gains. To select the optimal number of decision trees, we evaluate the stability of ATE estimates across different tree counts (1000, 2000, 4000, and 8000). For each candidate tree count, a causal forest is trained and the ATE is calculated. The tree count whose ATE estimate is closest to the median of all candidate ATE estimates is then selected. As presented in Table 12, the ATE estimate stabilizes once the number of decision trees reaches 4000, with only negligible changes when increased to 8000. This confirms that 4000 is the optimal choice for the subsequent analysis. Under this specification, our estimates indicate that the implementation of the overlapping policy yields an ATE coefficient of 0.4912. This result suggests that the policy is associated with an average increase of approximately 49.12% in rural residents’ per capita disposable income.

7.2.2. Marginal Effect Analysis of Key Covariates

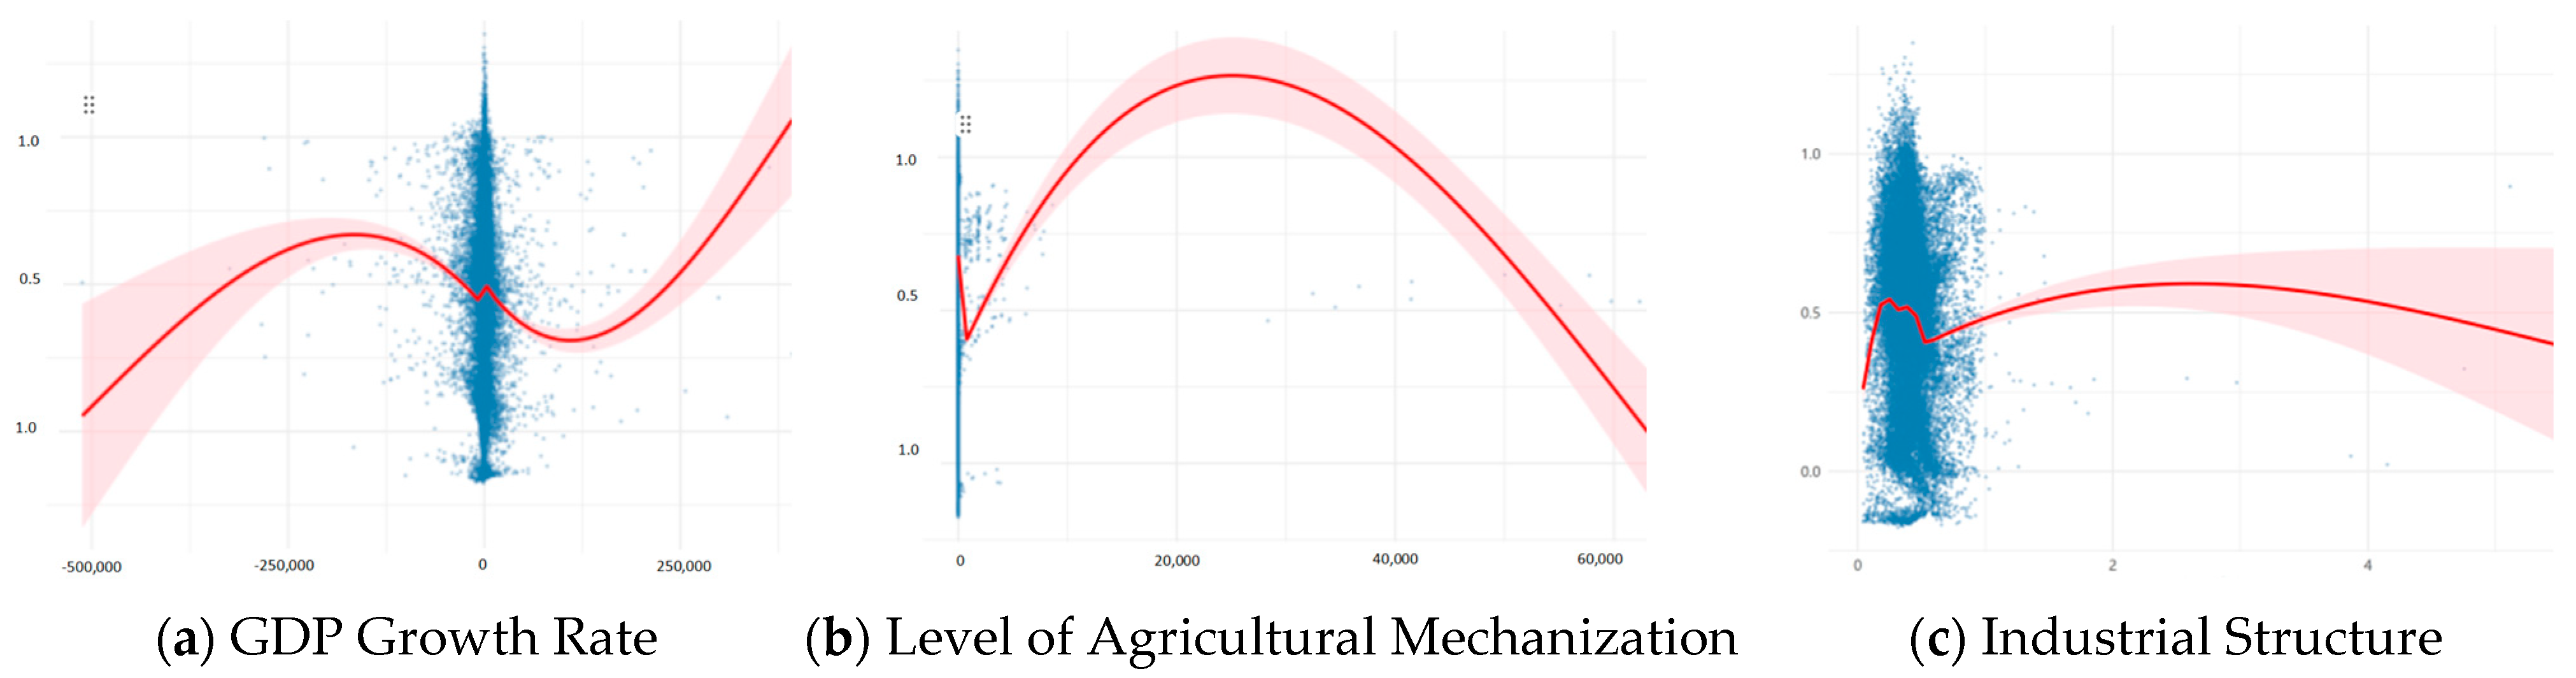
While the average treatment effect (ATE) of the policy has been estimated, the policy’s impact varies substantially across counties. Which covariates drive this heterogeneity, and how do they influence the magnitude of the treatment effect? To address these questions, we examine the marginal effects of key covariates on the treatment effect. As a preliminary step, we screen the original seven control variables using variable importance (split-based importance) obtained from a regression forest, and we retain only those covariates whose importance exceeds 20% of the average importance across all covariates. This screening yields three variables—GDP, level of agricultural mechanization (AML), and industrial structure—which then constitute our filtered covariate matrix. We next use the final causal forest to predict the CATE for each sample. For each selected important covariate, we draw scatter plots overlaid with smooth curves from generalized additive models (GAMs) to visualize its marginal effect and nonlinear characteristics.
Panels a,b and c of Figure 5 illustrate the nonlinear policy synergy across three moderators: GDP growth rate, agricultural mechanization (AML), and industrial structure. For GDP growth, the policy effect switches rapidly from negative to positive as growth accelerates and, once a threshold is exceeded, stabilizes at a relatively high level. This suggests that the income-enhancing synergy materializes only after economic expansion surpasses a certain threshold, whereas a sharp deceleration undermines it. Early mechanization frees labor for cultural-tourism activities, reinforcing the policy impact. Beyond the optimum, however, saturation triggers excessive labor out-migration and intensifies farmland–tourism spatial competition, leading to diminishing marginal returns. For industrial structure, the synergy shows a weak inverted-U pattern as the tertiary sector’s share grows. Initially, the service sector and cultural-tourism policies generate synergies that amplify the income effect. After a threshold, the industrial structure becomes rigid, with resources overly concentrated in urban services, causing marginal returns to decline gradually.
In sum, the policy synergy effect has an optimal range that varies across covariates: sustained moderate economic expansion, an appropriate level of agricultural mechanization, and a modest increase in the tertiary sector. When these conditions are met, they jointly magnify the income dividend. Conversely, when conditions turn unfavorable—through a severe economic slowdown, excessive mechanization, or an oversized service sector—they respectively give rise to widening regional disparities, labor drain, and industrial hollowing-out, which collectively produce diminishing marginal returns and weaken the enabling effect of the policy synergy.

8. Conclusions and Discussion

8.1. Research Conclusions

Based on county-level panel data from China spanning 2010 to 2023, this study employs staggered difference-in-differences (DID) and the difference-in-differences machine learning (DDML) model to examine the impact of the combined implementation of CTP policies and the NECPZ initiative on farmers’ income growth. Our key findings are as follows:
First, baseline DID estimates reveal that the policy overlap effect raises rural residents’ income by roughly 9.55% (≈0.129 standard deviations). The synergy test indicates that the coefficient of the overlapping dual-pilot policies is substantially larger than the net effect of either policy implemented alone, confirming a “1 + 1 > 2” synergistic effect. Moreover, the sequence of policy implementation matters: implementing the CTP policy before the NECPZ policy yields a more pronounced marginal effect than that of the reverse sequence, and thus unlocks synergy dividends more effectively.
Second, the mechanism test demonstrates that these overlapping policies enhance farmers’ income through two interconnected pathways. On the demand side, they strengthen counties’ tourism appeal by upgrading scenic spots and increasing star-rated hotels, thereby stimulating local tourism consumer demand. On the supply side, they nurture the local cultural and tourism market, fostering entrepreneurship and targeted investment by county-level cultural and tourism enterprises, ultimately enhancing the supply capacity of eco-cultural-tourism services.
Third, the heterogeneity analysis shows that the income-boosting effects is more pronounced in counties with higher-level of public cultural services, stronger primary-level governance, and more advanced digital infrastructure. Furthermore, contextual factors, including GDP growth rate, agricultural mechanization, and industrial structure, exhibit a nonlinear moderating effect on policy effect. This suggests that the income-enhancing effect does not increase monotonically with these factors; instead, each factor has an optimal range, and marginal returns diminish beyond certain thresholds.

8.2. Theoretical Implications

8.2.1. Extending the “The Two Mountains” Concept from Advocacy to Practice: Revealing the Crucial Role of Institutional Synergy in Ecological Value Transformation

Existing studies have primarily used the market logic of ecological resource valorization to demonstrate the feasibility of realizing the value of ecological products. This paper, however, adopts a policy-institutional perspective to reveal how the concurrent implementation of a municipal CTP policy and a county NECPZ policy creates a powerful cross-level synergy. By integrating these two policies—which operate across different administrative levels and functional departments—into a unified analytical framework, this paper finds that their combined effect is significantly greater than that of either policy alone. This synergy operates through a collaborative pattern of municipalities building platforms, counties supplying products, and regional integration, forming a virtuous cycle of ecological protection → cultural-tourism market facilitation → farmers’ income growth → ecological reinvestment. These findings indicate that institutional supply—especially vertical intergovernmental coordination and horizontal departmental collaboration—is the key to transforming ecological resources into economic advantages, and that realizing the “Two Mountains” concept requires not only an ecological foundation and market mechanisms but also institutional synergy that breaks down administrative hierarchies and departmental barriers, serving as the bridge from ecological value to economic value.

8.2.2. Revealing the Transmission Pathways Through Which Policy Overlap Promotes Farmers’ Income Growth, Providing Empirical Evidence for the Realization Path of the “Two Mountains” Concept

Existing policy evaluation literature has mostly focused on the effects of single policies, neglecting the interactions between policies and their underlying transmission pathways. Even when studies have researched the ecology–culture–tourism integration effect, they have been largely confined to single cases or localized analyses, limiting the generalizability of prior conclusions. This study conducts a systematic empirical analysis using panel data from more than 2200 counties from 2010 to 2023. Employing a multi-method empirical framework, it identifies dual mechanisms through which policy overlap boosts farmers’ income. On the demand side, the policy overlap creates a demand–pull effect by enhancing counties’ tourism appeal, manifested in more appealing scenic spots and an increase in supporting facilities such as star-rated hotels, which stimulate tourism consumption and create a market for providing tourism services. On the supply side, the policy synergy encourages entrepreneurship and investment in ecology–culture–tourism enterprises at the county level. Newly registered enterprises not only directly create non-agricultural employment opportunities but also drive the coordinated development of upstream and downstream industries, improving the supply capacity and quality of ecology–culture–tourism services. These two pathways reinforce each other, forming a complete transmission chain of policy empowerment → market development → farmers’ income growth. This methodological design provides operational guidance for indicator selection and causal identification reference for latter studies.

8.2.3. Revealing the Conditional Nature and Nonlinear Characteristics of Policy Effects, Moving Away from the Notion That “More Policies Are Better”, and Identifying the Conditional Boundaries of Policy Synergy in Practice

This paper finds that the income-enhancing effect of policy overlap for farmers is constrained by public cultural services, primary-level governance, and digital infrastructure—indicating that fully realizing these benefits depends on such conditions. Factors like economic growth rate, agricultural mechanization, and industrial structure show a nonlinear relationship with the policy effect, implying that policy synergy is not unconditionally beneficial but has optimal ranges and applicable boundaries. From the perspective of municipal–county synergy, only when counties possess adequate capacity for public cultural service delivery and supporting industrial conditions can the radiating and driving effects of eco-cultural-tourism integration be effectively translated into tangible income gains for rural residents. Conversely, over-reliance on municipal level policy input while county foundations remain weak may lead to diminishing marginal returns to the policy overlap. This finding corrects discussions of policy mix and policy density in public policy theory: excessive policy overlap or fiscal input beyond a region’s carrying capacity may weaken synergistic effects. Thus, the academic community should pay more attention to the heterogeneous conditions and threshold effects of policy synergy.

8.3. Practical Implications

8.3.1. Breaking Down Departmental and Hierarchical Barriers for Cross-Level, Cross-Sectoral Policy Synergy

This study finds that the combined effect of the municipal CTP policy and the county NECPZ policy is significantly greater than either policy alone, and that the effect depends on their implementation sequence. The implications suggest a two-pronged approach: establishing a cross-level, cross-sectoral synergy mechanism and adopting a sequential implementation strategy. First, local governments should replace fragmented governance with a regular communication and coordination mechanism between ecological-environmental and cultural-tourism departments. Specifically, municipal governments should embed eco-brand certification, tourism route planning, and visitor-flow management into the cultural-tourism framework, setting clear indicators to channel tourists toward NECPZ counties. Meanwhile, county governments should turn ecological conservation achievements into experiential, marketable tourism products and proactively tap into the marketing resources of municipal cultural-tourism platforms, creating a virtuous cycle: municipalities build platforms; counties supply products. Second, given limited resources, local governments may adopt a sequential “cultural-tourism first, ecology follows” strategy. By first using cultural-tourism integration to build brands, attract tourists, and establish distribution channels, they can cultivate demand for ecological products. The NECPZ initiative can then be introduced, enabling ecological achievements to quickly reach market channels and shortening the cycle from investment to value realization.

8.3.2. Smoothing Transmission Pathways on Both the Demand and Supply Sides to Fully Realize Policy Synergy

Mechanism analysis shows that policy overlap boosts farmers’ income through dual demand-pull and supply-push pathways. On the demand side, governments should increase promotion of scenic spots in NECPZ counties, using the appeal of the municipal brand to guide market entities, such as star-rated hotels, to expand into counties rich in ecological resources. This expansion improves tourism reception facilities and converts tourist flows into direct consumption. On the supply side, dedicated funds should be established to support cultural-tourism start-ups, lower market entry barriers and encourage young returnees and local talent to launch businesses such as homestays, farmhouses, and cultural and creative workshops. Skill training for practitioners should also be strengthened to improve service quality and reception capacity. By simultaneously attracting tourist flows and fortifying local supply capacity, the synergistic dividends of the two policies can be fully maximized.

8.3.3. Adapting Measures to Local Conditions: Identifying Applicable Contexts and Tailoring Policies Accordingly

Heterogeneity analysis shows that the effect of policy overlap is not uniform but rather conditioned by multiple factors, including public cultural services, primary-level governance, digital infrastructure, economic growth rate, agricultural mechanization, and industrial structure. Accordingly, when promoting policy overlap, local governments should prioritize counties with stronger public cultural services, primary-level governance, and digital infrastructure as pilot areas to achieve breakthroughs in synergy. For counties with weak foundations, up-front investment should address shortcomings before introducing the NECPZ policy. At the same time, caution is needed to avoid diminishing marginal returns from excessive investment—when economic growth rate, agricultural mechanization, or the share of tertiary industry exceeds certain thresholds, further implementation may reduce synergy effects. Local governments are advised to conduct preliminary assessments to identify their position on the inverted U-shaped curve and precisely calibrate policy inputs, thereby increasing efficiency.

8.4. Research Limitations and Outlook

First, regarding the indicator for measuring farmers’ income growth, this study primarily uses the per capita disposable income of rural residents as the dependent variable. Although this indicator is representative and comparable, it fails to capture changes in income structure, the equity of income distribution, or the sustainability of income. The comprehensive impact of policy overlap on farmers well-being still needs to be evaluated from multiple dimensions. Future research could incorporate factors such as the structure of farmers’ income, the degree of income inequality, consumption levels, subjective well-being, and satisfaction with ecological compensation into the evaluation system. This would enable a more comprehensive assessment of how policy overlap affects farmers overall welfare. Additionally, combining micro-level survey data from rural households can help verify whether policy dividends genuinely reach the most disadvantaged groups.
Second, there are limitations concerning the time window and sample scope. This study covers the period of 2010–2023, capturing the main policy implementation stages; however, some effects may involve longer time lags that this window cannot reveal. Moreover, although the nationwide county-level sample is large, the data remain at a macro level, masking substantial regional differences in resource endowments, development foundations, and implementation capacities. This makes it difficult to reflect local characteristics and micro-level mechanisms. Future research could use longer-term data to examine the long-term effects and sustainability of policy overlap. Alternatively, studies could narrow the focus to specific regions—such as nationally designated poverty-stricken counties, distinctive tourism counties, key ecological function zones, or contiguous areas with similar geographical and ecological features (e.g., the Yellow River Basin or the Yangtze River Basin)—for refined local analyses. Through in-depth case studies and household survey data, researchers can uncover specific obstacles, benefit distribution mechanisms, and farmers behavioral responses during policy implementation, thereby overcoming the limitations of macro-level data in explaining mechanisms.
Third, the measurement of cross-level policies can be further improved. This study assigns the municipal CTP policy treatment variable to the county level. While practically justified, this approach may obscure heterogeneity in policy benefits among counties within the same prefecture-level city. In reality, counties differ in transportation accessibility, tourism resource endowments, and local implementation capacity, absorbing municipal cultural-tourism policies very differently. By failing to capture this variation, the current analysis yields only a relatively macro-level estimate of the policy overlap effect. Future research could directly use county-level CTP policy and identify policy effects at the county level. Doing so would allow a more accurate evaluation of the overlapping effect of the two policies at the same administrative level and avoid the measurement bias caused by cross-level matching.
Fourthly, our analysis focuses on net income benefits, but it does not measure the costs that counties bear—such as administrative expenses, compliance costs, and opportunity costs from restricting traditional industries. Nor does it test environmental outcomes (e.g., biodiversity, water quality, air quality) or examine whether average income gains are equitably shared across different rural households. These three gaps are interconnected: a comprehensive policy assessment requires understanding who bears the costs, whether the environment truly improves, and how the benefits are distributed. To address these limitations, future studies could develop a joint evaluation framework that simultaneously tracks ecological and economic indicators to conduct a full cost–benefit analysis. In addition, collecting household-level panel data would allow researchers to examine income inequality and other distributional effects. Addressing these gaps will lead to a more comprehensive, equitable, and environmentally sound assessment of policy overlap.

Author Contributions

Conceptualization, M.J.; methodology, M.J.; software, M.J.; validation, Y.F.; formal analysis, M.J.; investigation, M.J.; resources, M.J.; data curation, Y.F.; writing—original draft preparation, M.J.; writing—review and editing, Y.F.; visualization, Y.F.; supervision, Y.F.; project administration, Y.F.; funding acquisition, M.J. All authors have read and agreed to the published version of the manuscript.

Funding

This research received no external funding.

Institutional Review Board Statement

Not applicable.

Informed Consent Statement

Not applicable.

Data Availability Statement

The datasets used and analyzed during the current study are available from the corresponding author on reasonable request.

Acknowledgments

Thanks to the judging experts and all members of our team for their insightful advice.

Conflicts of Interest

The authors declare that they have no known competing financial interests or personal relationships that could have appeared to influence the work reported in this study.

Abbreviations

CTPCultural-Tourism Integration Policy
NECPZNational Ecological Civilization Pilot Zone
DDMLDouble/Debiased Machine Learning
POIPoint of Interest
NSSNumber of Scenic Spot POIs
NSHNumber of Star-rated Hotels
NCTEsNumber of Newly Registered Cultural-Tourism Enterprises
RCNCTEsRegistered Capital of Newly Registered Cultural-Tourism Enterprises (in CNY 100 million)
ACMEAverage Causal Mediation Effect
CATEConditional Average Treatment Effect
ATEAverage Treatment Effect
GRFGeneralized Random Forest
GAMGeneralized Additive Model
LADCLeisure Agriculture Demonstration County
OPNOpenness to the outside world
FPFiscal Pressure
ISIndustrial Structure (share of tertiary industry value added)
AMLLevel of agricultural mechanization (proportion of mechanically harvested area)
PPRural Population (permanent resident population in rural areas, in ten thousand persons)
GDPGross Regional Product (in CNY hundred million)
TFAITotal Fixed Asset Investment (in CNY hundred million)

References

  1. Shen, J.; Chou, R.-J. Rural revitalization of Xiamei: The development experiences of integrating tea tourism with ancient village preservation. J. Rural. Stud. 2022, 90, 42–52. [Google Scholar] [CrossRef]
  2. Zhang, Y.; Xu, T. Can whole—region ecotourism construction help the region to obtain “clear waters and green mountains”and “gold and silver mountains” at the same time?—Case study of Fujian. J. Arid. Land Resour. Environ. 2023, 37, 185–193. [Google Scholar] [CrossRef]
  3. Li, Z.; Han, N.; Zhao, D. Lucid Waters and Lush Mountains Are Invaluable Assets: The Effect of National Ecological Civilization Demonstration Zone Construction on Farmers’ Income Growth. J. Financ. Econ. 2025, 51, 77–91. [Google Scholar] [CrossRef]
  4. Zhang, Z. Cultural and Tourism Integration: Research on the High-quality Development of Rural Tourism. Nanjing J. Soc. Sci. 2021, 7, 157–164. [Google Scholar]
  5. Liu, Y.; Xu, J.; Liu, Y. Research on the Coupling and Coordination Relationship between Ecological Environment and Cultural Tourism Industry in the Yellow River Basin. Econ. Probl. 2024, 2, 105–112. [Google Scholar] [CrossRef]
  6. Yu, Y.; Jiang, X. Unlocking the Integration Mechanism: How Digital Village Construction Promotes Agro-Cultural-Tourism Development through Rural E-Commerce. Res. Sq. 2026. [Google Scholar] [CrossRef] [PubMed]
  7. Zhong, L.; Zeng, Y. Ecotourism research of China in the past forty years: Progress and future development. Tour. Trib. 2026, 41, 158–174. [Google Scholar] [CrossRef]
  8. Zhao, Y.; Han, Z.; Zhang, R.; Zhong, J. Mechanism of Cultural Ecosystem Services on Cultural and Tourism Integration and Its Regional Practice: Taking Lyushunkou District of Dalian City as An Example. Econ. Geogr. 2024, 44, 211–221. [Google Scholar] [CrossRef]
  9. Xu, H.; Liu, J. Implications of “two mountains” theory on China’s green development. Chin. J. Urban Environ. Stud. 2019, 7, 1975008. [Google Scholar] [CrossRef]
  10. Zhang, Y.; Wang, C.A.; Liu, X.; Zhang, X.; Dagestani, A.A. Does the national ecological civilization pilot zone achieve a “win-win” circumstance for the environment and the economy: Empirical evidence from China. Appl. Econ. 2025, 57, 10771–10787. [Google Scholar] [CrossRef]
  11. Du, J.; Wei, Q.; Zhang, Z.; Gu, Q. Pilot Policy Overlap, Emerging Business Models, and Agricultural Development Resilience: A Quasi-Natural Experiment Based on a Staggered DID Model. Chin. J. Agric. Resour. Reg. Plan. 2026, 1–19. [Google Scholar] [CrossRef]
  12. Lin, S.; Gu, Y.; Si, X.; Yan, Y. County-level Entrepreneurship, Farmers’ Income Increase and Common Prosperity: An Empirical Study Based on Chinese County-level Data. Econ. Res. J. 2023, 58, 40–58. [Google Scholar]
  13. Chang, X.; Cheng, W.; Wang, H.; Chen, X.; Yang, Y.; Zhang, L. The Impact of National Ecological Civilization Pilot Zone Policy on Rural Residents’ Income—Evidence from Chinese Counties. Sustainability 2026, 18, 449. [Google Scholar] [CrossRef]
  14. Hu, H.; Yin, Y.; Xie, Y.; Cai, J.; Wang, C.; Zhang, W. Thematic Evolution and Transmission Mechanisms of China’s Rural Tourism Policy: A Multi-Level Governance Framework for Sustainable Development. Sustainability 2025, 17, 9187. [Google Scholar] [CrossRef]
  15. Zhao, X.; Xie, C.; Huang, L.; Wang, Y.; Han, T. How digitalization promotes the sustainable integration of culture and tourism for economic recovery. Econ. Anal. Policy 2023, 77, 988–1000. [Google Scholar] [CrossRef]
  16. Tang, M.; Xu, H. Cultural integration and rural tourism development: A scoping literature review. Tour. Hosp. 2023, 4, 75–90. [Google Scholar] [CrossRef]
  17. Lu, M.; Duan, Y.; Wu, X. Evaluation of the coupling and coordination degree of eco-cultural tourism system in the Jiangsu-Zhejiang-Shanghai-Anhui region. Ecol. Indic. 2023, 156, 111180. [Google Scholar] [CrossRef]
  18. Harfst, J.; Syrbe, R.U.; Kern, C.; Wirth, P.; Sandriester, J.; Pstrocka-Rak, M.; Dolzblasz, S. Cultural tourism and governance in peripheral regions. Int. J. Tour. Res. 2024, 26, e2733. [Google Scholar] [CrossRef]
  19. Qin, M. Optimization research on the integration development path of agricultural, cultural and tourism industries in Yijun County based on data analysis. J. Comb. Math. Comb. Comput. 2025, 127, 8169–8187. [Google Scholar]
  20. Zhao, Y.; Lu, Y.; Zhan, Q. Research on the Coupling Coordination and Obstacles Analysis of Cultural-Tourism Economy and Ecological Environment in the Middle Reach of the Yellow River Basin, China. Res. Sq. 2024. [Google Scholar] [CrossRef] [PubMed]
  21. Qiu, M.; Wang, Z.; Chen, Q.; Wang, J. Enhancing tourism carbon emission efficiency through cultural and tourism industry integration in china: Empirical evidence from industrial structure upgrading. Environ. Dev. Sustain. 2025, 1–29. [Google Scholar] [CrossRef]
  22. Cawley, M.; Gillmor, D.A. ‘Culture Economy’,‘Integrated Tourism’and ‘Sustainable Rural Development’: Evidence from Western Ireland. In Sustainable Rural Systems; Routledge: Abingdon, UK, 2016; pp. 145–159. [Google Scholar]
  23. Shi, L.; Liao, X. From poverty to common prosperity: An evaluation of agricultural-cultural-tourism integration and its impact on economic growth. Front. Sustain. Food Syst. 2025, 9, 1600264. [Google Scholar] [CrossRef]
  24. Qi, Y.; Ni, Q.; Zhang, J.; Han, J.; Ren, H. User-centric innovation strategies for cultural creative products in China’s rural tourism. PLoS ONE 2025, 20, e0319474. [Google Scholar] [CrossRef] [PubMed]
  25. Zhou, C.; Qin, L.; Wei, M. The Integration Policy of Culture and Tourism and the Development of the Tourism Industry: Effect Evaluation and Mechanism Testing. Tour. Trib. 2025, 1–23. [Google Scholar]
  26. Weaver, D.B. Peripheries of the periphery: Tourism in Tobago and Barbuda. Ann. Tour. Res. 1998, 25, 292–313. [Google Scholar] [CrossRef]
  27. Jamal, T.B.; Getz, D. Collaboration theory and community tourism planning. Ann. Tour. Res. 1995, 22, 186–204. [Google Scholar] [CrossRef]
  28. Zhang, J.; Zuo, L.; Liu, H.; Ma, R. Research on the evaluation of cultural ecosystem services value of desert tourism scenic area based on tourist perception: Taking tukai desert tourism scenic area as an example. Acta Ecol. Sin. 2025, 45, 5710–5722. [Google Scholar]
  29. Jacobson, L.S.; LaLonde, R.J.; Sullivan, D.G. Earnings losses of displaced workers. Am. Econ. Rev. 1993, 83, 685–709. [Google Scholar]
  30. Chernozhukov, V.; Chetverikov, D.; Demirer, M.; Duflo, E.; Hansen, C.; Newey, W.; Robins, J. Double/debiased machine learning for treatment and structural parameters. Econom. J. 2018, 21, C1–C68. [Google Scholar] [CrossRef]
  31. Fan, Z.; Li, Z. The Role of East and West Cooperation in Promoting County Economy’s High-quality Development from the Perspective of Balance: A Case Study of Pairing Assistance During the Poverty Alleviation Period. J. Nanjing Agric. Univ. (Soc. Sci. Ed.) 2023, 23, 77–90. [Google Scholar] [CrossRef]
  32. Topalova, P. Factor immobility and regional impacts of trade liberalization: Evidence on poverty from India. Am. Econ. J. Appl. Econ. 2010, 2, 1–41. [Google Scholar] [CrossRef]
  33. Cai, X.; Lu, Y.; Wu, M.; Yu, L. Does environmental regulation drive away inbound foreign direct investment? Evidence from a quasi-natural experiment in China. J. Dev. Econ. 2016, 123, 73–85. [Google Scholar] [CrossRef]
  34. de Chaisemartin, C.; D’Haultfoeuille, X. Two-way fixed effects estimators with heterogeneous treatment effects. Am. Econ. Rev. 2020, 110, 2964–2996. [Google Scholar] [CrossRef]
  35. Wooldridge, J.M. Two-way fixed effects, the two-way mundlak regression, and difference-in-differences estimators. Empir. Econ. 2025, 69, 2545–2587. [Google Scholar] [CrossRef]
  36. Callaway, B.; Sant’Anna, P.H. Difference-in-differences with multiple time periods. J. Econom. 2021, 225, 200–230. [Google Scholar] [CrossRef]
  37. Imai, K.; Keele, L.; Tingley, D. A general approach to causal mediation analysis. Psychol. Methods 2010, 15, 309. [Google Scholar] [CrossRef] [PubMed]
  38. Hicks, R.; Tingley, D. Causal mediation analysis. Stata J. 2011, 11, 605–619. [Google Scholar] [CrossRef]
  39. Sobel, M.E. Asymptotic confidence intervals for indirect effects in structural equation models. Sociol. Methodol. 1982, 13, 290–312. [Google Scholar] [CrossRef]
  40. Athey, S.; Tibshirani, J.; Wager, S. Generalized random forests. Ann. Statist. 2019, 47, 1148–1178. [Google Scholar] [CrossRef]
  41. Wager, S.; Athey, S. Estimation and inference of heterogeneous treatment effects using random forests. J. Am. Stat. Assoc. 2018, 113, 1228–1242. [Google Scholar] [CrossRef]
  42. Tibshirani, J.; Athey, S.; Sverdrup, E.; Wager, S. grf: Generalized Random Forests. R Package Version 2.0. 2. R Foundation for Statistical Computing. 2021. Available online: https://CRAN.R-project.org/package (accessed on 18 June 2026).
Figure 1. Theoretical model.
Sustainability 18 07040 g001
Figure 2. Multiple empirical procedures.
Sustainability 18 07040 g002
Figure 3. Parallel trend test. Note: Dashed lines denote the 95% confidence intervals of the estimated coefficients.
Sustainability 18 07040 g003
Figure 4. Placebo tests for policy effects. Note: The dashed vertical line indicates the true coefficient estimate obtained from the baseline DID regression.
Sustainability 18 07040 g004
Figure 5. Marginal effect analysis of key covariates. Note: The blue dots represent the estimated conditional average treatment effects (CATEs) for each individual observation (county-year), computed using the causal forest algorithm within the generalized random forest (GRF) framework (Athey et al., 2019) [40]. The solid red line depicts a GAM-smoothed fit of the CATE as a function of the corresponding covariate, with the pink shaded area denoting the 95% confidence interval. The confidence bands lie consistently above zero across most covariate values, indicating that the positive treatment effect is statistically significant and robust across a wide range of covariate levels.
Sustainability 18 07040 g005
Table 1. Overview of variables, definitions, and data Sources.
TypeAbbreviationData NameUnitDefinitionData Sources
Dependent VariableIncomeRural Resident IncomeCNY 10,000 Per capita disposable income of rural residents, reflecting their living standards and welfare after deductions.Inferred from China County Statistical Yearbook (https://www.stats.gov.cn/sj/, accessed on 12 July 2025);
China Economic Information Network (https://www.cei.cn/#qypd, accessed on 12 July 2025)
Independent VariableDIDPolicy Overlap Dummy-Dummy variable = 1 if a county is covered by both the Cultural-Tourism Integration Policy (CTP) and the National Ecological Civilization Pilot Zone (NECPZ) policy in a given year; =0 otherwise.Constructed from CTP and NECPZ policy data
CTPCultural-Tourism Integration Policy-Dummy variable = 1 for the year a county’s administering prefecture-level city first introduced the CTP policy and thereafter; =0 otherwise.Manually collected from prefecture-level city policy documents (following Zhou Chunbo et al., 2025) [25]
NECPZNational Ecological Civilization Pilot Zone/County Policy-Dummy variable = 1 for the year a county was officially designated as a NECPZ and thereafter; =0 otherwise.Manually collected from official lists from the Ministry of Ecology and Environment (https://www.mee.gov.cn/, accessed on 12 July 2025)
Control VariableGDPGross Regional ProductCNY 100 million Proxy for county-level economic development. The second-differenced form is used in analysis.Inferred from China County Statistical Yearbook (https://www.stats.gov.cn/sj/, accessed on 12 July 2025);
China Economic Information Network (https://www.cei.cn/#qypd, accessed on 12 July 2025)
OPNOpenness to the Outside WorldUSDDegree of regional openness, measured as the logarithmic form of county-level actually utilized foreign investment.
FPFiscal Pressure%Ratio of local general budgetary expenditures to revenues. The logarithmic form of the ratio is used, and the first difference is applied in analysis.
ISIndustrial Structure%Share of the tertiary industry’s added value in regional GDP, reflecting industrial structure optimization.
TFAIInvestment Scale (Total Fixed Asset Investment)CNY 100 million Total fixed asset investment at the county level, indicating capital formation and infrastructure capacity.
AMLLevel of Agricultural Mechanization%Proportion of mechanically harvested area to total cultivated area, representing agricultural development level.
PPRural Population10,000 personsPermanent resident population in rural areas. The natural logarithmic form is used in analysis.
Mechanism VariableNSSNumber of Scenic Spot POIsCountAnnual count of Points of Interest (POIs) related to scenic spots, serving as a proxy for ecosystem service value.Integrated from Amap (https://lbs.amap.com/, accessed on 12 July 2025) and Baidu Maps APIs (http://lbsyun.baidu.com, accessed on 12 July 2025) via web crawling
NSHsNumber of Star-rated HotelsCountAnnual count of POIs tagged as “star-rated hotels”, reflecting accommodation infrastructure.
NCTEsNumber of Newly Registered Cultural-Tourism EnterprisesCountAnnual count of newly registered enterprises identified as related to eco–culture–tourism integration using keyword screening.Tianyancha database (https://www.tianyancha.com, accessed on 12 July 2025)
RCNCTEsRegistered Capital of New Cultural-Tourism EnterprisesCNYTotal registered capital of newly registered enterprises identified as related to eco–culture–tourism integration.
Data Source Notes: For control variables, data are primarily drawn from the China County Statistical Yearbook, the China Regional Economic Statistical Yearbook, the National Bureau of Statistics, and official provincial statistical yearbooks. To address a few missing values, we supplement them with other authoritative materials to ensure a complete and continuous sample. For mechanism variables, spatial POI data were obtained by integrating application programming interfaces (APIs) from Amap and Baidu Maps, combined with targeted web crawling; enterprise registration data were sourced from the Tianyancha database.
Table 2. Pre-treatment covariate balance (2016, pre-policy).
Variable NameTreatment MeanControl MeanDifferencep-Value
OPN0.0074141 0.04964520.04223120.3434
IS0.4036264 0.4078146 0.0041882 0.5991
AML3.167055 2.03534 −1.1317150.7293
PP3.1834733.2159660.03249290.6129
FP0.1287712−0.3273033 −0.45607450.7687
GDP 6.18292−1.43444−7.6173610.3151
TFAI1.031896 1.027904 −0.003992 0.917
Note: p-values are from two-sample t-tests for equal means.
Table 3. Keyword frequency analysis.
TypeKey Words and Word Frequency
Basic KeywordsPerformance (12,386); Intangible Cultural Heritage (126); Historic Site (18); Tourist (2020); Cultural-Tourism (307); Scenic Spot (2412); Cultural and Creative Products (3918); Sightseeing (155,260); Tourism (335,582); Scenery (42); Tour Guide (320); Ticket (578); Experience (18,541); Folk Custom (6058); Culture (90,780)
Core KeywordsEco-tourismEco-tourism (26,384); Forest Tourism (866); Wetland Tourism (26); Grassland Tourism (36); Desert Tourism (43); Eco-sightseeing (9855); Eco-vacation (25); Forest Health and Wellness (464); Eco-study Tour (3); Nature Education (54); Green Tourism (22); Eco-cultural-Tourism (5)
Cultural -tourismCultural-Tourism (22,467); Folk Tourism (3638); Intangible Cultural Heritage Tourism (3); Red Tourism (295); Cultural Performance (92); Cultural Experience (686); Ancient Town Tourism (17); Ancient Village Tourism (10); Cultural-Tourism Integration (3); Cultural-Tourism Experience (2)
Agro-cultural-tourismLeisure Agriculture (249,356); Rural Tourism (257,077); Farming Culture (813); Rural Complex (1316); Agricultural Study Tour (21)
Leisure sightseeing agricultureSightseeing Agriculture (12,721); Agricultural Park (28); Flower Sightseeing (44); Fruit and Vegetable Picking (20,681); Agricultural Experience (233); Leisure Agriculture Park (12); Leisure Sightseeing Agriculture (2901)
Table 4. Descriptive statistical analysis.
TypeVariableObsMeanStd. DevMinMax
Dependent VariableINCOME31,0941.3132790.74033340.29053.803
Control VariableOPN31,0940.00481270.01183541.00 × 10−60.092
IS31,0940.40711660.13879280.11949440.8657485
AML31,0932.18957110.453950.004707396.21739
PP30,9933.2223491.029904.942521
FP31,0940.06067341.709019−7.4198738.136872
TFAI31,0941.0056040.65756620.07681353.889916
GDP31,094−0.18126785.298841−155.7546158.4782
Mediating VariablesNSS31,09469.69127101.75511609
NSH29,7579.03360616.800870102
NCTEs31,0947.18862213.91275089
RCNCTEs28,9897.8135322.0140092.07944212.21305
Note: To rigorously satisfy the covariate balance requirement in the staggered difference-in-differences (DiDs) framework, we pre-processed all continuous control variables as follows: GDP was taken in second differences (i.e., twice-differenced), FP was taken in first differences (once-differenced), and both PP and RCNCTEs were transformed using the natural logarithm. To mitigate the influence of extreme outliers, all variables were winsorized at the first and ninety-ninth percentiles. In all subsequent baseline regressions and robustness checks, unless otherwise explicitly stated, the set of control variables strictly follows the list reported in this table.
Table 5. DID regression.
Variable(1)(2)(3)(4)(5)(6)
DDLDDML
Policy OverlapCTPNECPZ Policy OverlapCTPNECPZ
DID0.0955 ***
(0.0111)
0.0179 ***
(0.0051)
0.0919 ***
(0.0098)
0.0717 **
(0.02606)
0.0359 ***
(0.00785)
0.08147 ***
(0.021)
Obs30,98830,98830,98830,99230,99230,992
Control VariablesYESYESYESYESYESYES
Quadratic Terms of Control VariablesNONONOYESYESYES
County Fixed EffectsYESYESYESYESYESYES
Year Fixed EffectsYESYESYESYESYESYES
Adjusted R20.88770.88750.8878
Notes: Standard errors clustered at the province level are in parentheses. **, and *** denote statistical significance at the 5%, and 1% levels, respectively. All regressions include the same set of control variables and two-way fixed effects as the baseline model.
Table 6. The policy synergistic effect test.
Variable(1)(2)(3)(4)(5)
NECPZ 0.0762 ***
(0.0145)
CTP0.0175 ***
(0.00500)
Policy Overlap0.268 ***
(0.043)
0.010
(0.028)
0.104 ***
(0.102)
Control VariablesYESYESYESYESYES
County Fixed EffectsYESYESYESYESYES
Year Fixed EffectsYESYESYESYESYES
Obs21,008 29,995642151525,714
Adjusted R20.9010.8890.97330.93160.8919
Notes: *** denotes significance at the 1% level, respectively. Standard errors are in parentheses.
Table 7. Instrumental variable estimation results.
Variable(1)(2)(3)(4)
Lagged One PeriodLagged Two PeriodFirst StageSecond Stage
DID0.074 ***
(0.012)
0.099 ***
(0.011)
1.015 **
(0.172)
IV10.059 ***
(0.005)
Control VariablesYESYESYESYES
County Fixed EffectsYESYESYESYES
Year Fixed EffectsYESYESYESYES
F-valueF (1, 28,493) = 146.80
Anderson canon. corr. LM statistic158.84 ***
Cragg-Donald Wald F 146.80
Endogeneity test 38.719 ***
Note: The underidentification test and overidentification test report p-values. ** p < 0.05, *** p < 0.01.
Table 8. PSM-DID and DDML methods.
Variable(1)(2)(3)(4)(5)(6)(7)
PSM-DIDDDML
Nearest NeighborRadius MatchingKernel MatchingLasso RegressionElastic NetRandom ForestRidge Regression
DID0.096 **
(0.047)
0.195 ***
(0.022)
0.054 ***
(0.016)
Sample Split (1:4)0.0955 ***
(0.01823)
0.09553 ***
(0.01824)
0.0717 **
(0.02606)
0.3662 ***
(0.02899)
Sample Split (1:7)0.1003 ***
(0.018024)
0.1004 ***
(0.01825)
0.0667 **
(0.02579)
0.3639 ***
(0.02917)
Control VariablesYESYESYESYESYESYESYES
Quadratic Terms of Control VariablesNONONOYESYESYESYES
County Fixed EffectsYESYESYESYESYESYESYES
Year Fixed EffectsYESYESYESYESYESYESYES
Obs197130,75030,90730,99230,99230,99230,992
Adjusted R20.980.42350.9831
Notes: ** and *** denote significance at the 5% and 1% levels, respectively. Standard errors are in parentheses.
Table 9. Diagnostic tests for heterogeneous treatment Effects
Part 1 Bacon Decomposition
2 × 2 DID Control Group TypeAverage Treatment EffectWeight
Using “Later-Treated Group” as Control3.2%−0.0272
Using “Earlier-Treated Group” as Control0.59%0.0329
Using “Never-Treated Group” as Control96.21%0.0426
Part 2 Heterogeneity-Robust Estimation
MethodCoefficientStandard Error
de Chaisemartin and D’Haultfoeuille (2020) [34]0.05053 **0.01776
Wooldridge (2025) [35]0.152 ***0.041
Callaway and Sant’Anna (2021) [36]0.109 ***0.017
Note: *** p < 0.01, ** p < 0.05.
Table 10. Mediation mechanism analysis.
Variables(1)(2)(3)(4)
NSSPSHNCTEsRCNCTEs
DDLACME0.02494 ***0.1966 ***0.0786 ***0.1092 ***
Direct Effect0.9132 ***0.5733 ***0.6905 ***0.6599 ***
Total Effect0.9382 ***0.7699 ***0.7691 ***0.7692 ***
Obs29,66330,99230,99230,992
Control VariablesYESYESYESYES
DDMLDID48.9451 ***
(5.2791)
1.2895 **
(0.5227)
11.3064 ***
(1.1673)
0.4512 ***
(0.06499)
Obs30,99230,99230,99230,992
Control VariablesYESYESYESYES
Quadratic Terms of Control VariablesYESYESYESYES
County Fixed EffectsYESYESYESYES
Year Fixed EffectsYESYESYESYES
Sobel TestThe mediating effect is significantThe mediating effect is significantThe mediating effect is significantThe mediating effect is significant
Notes: **, and *** denote significance at the 5%, and 1% levels, respectively. Standard errors are in parentheses. All regressions include the control variables, county fixed effects, and year fixed effects as specified. Sobel tests (via sgmediation2) confirm that the indirect effects through NSS, PSH, NCTEs, and RCNCTEs are all significant at the 1% level, supporting partial mediation given that the direct effects remain significant.
Table 11. Heterogeneity analysis by subgroups.
(1)(2)(3)(4)(5)(6)
VariablesPublic Cultural ServicesPrimary-Level GovernanceDigital Infrastructure
HighLowHighLowHighLow
DID0.1052 **
(0.04342)
0.03088
(0.0317)
0.2742 ***
(0.06976)
0.03698
(0.02898)
0.16173 ***
(0.048)
−0.01565
(0.0298)
Obs604324,949719923,79310,44620,648
Control VariablesYESYESYESYESYESYES
Quadratic Terms of Control VariablesYESYESYESYESYESYES
County Fixed EffectsYESYESYESYESYESYES
Year Fixed EffectsYESYESYESYESYESYES
Notes: ** and *** denote significance at the 5% and 1% levels, respectively. Standard errors are in parentheses.
Table 12. The average treatment effect of the overlapping policies.
INCOMEINCOMEINCOMEINCOME
Treatment Effect0.49030.48830.49120.492
ClusteringYESYESYESYES
Control VariablesYESYESYESYES
Number of Trees1000200040008000
MethodCausal ForestCausal ForestCausal ForestCausal Forest
Disclaimer/Publisher’s Note: The statements, opinions and data contained in all publications are solely those of the individual author(s) and contributor(s) and not of MDPI and/or the editor(s). MDPI and/or the editor(s) disclaim responsibility for any injury to people or property resulting from any ideas, methods, instructions or products referred to in the content.