Scale Dependence and Nonlinear Effects of Urban Functional Zone Form on Carbon Emission Intensity: Evidence from Yangtze River Delta Agglomeration

Abstract
1. Introduction
2. Literature Review
2.1. UFZ Form Indicators
2.2. Scale Effects
3. Material and Methods
3.1. Material
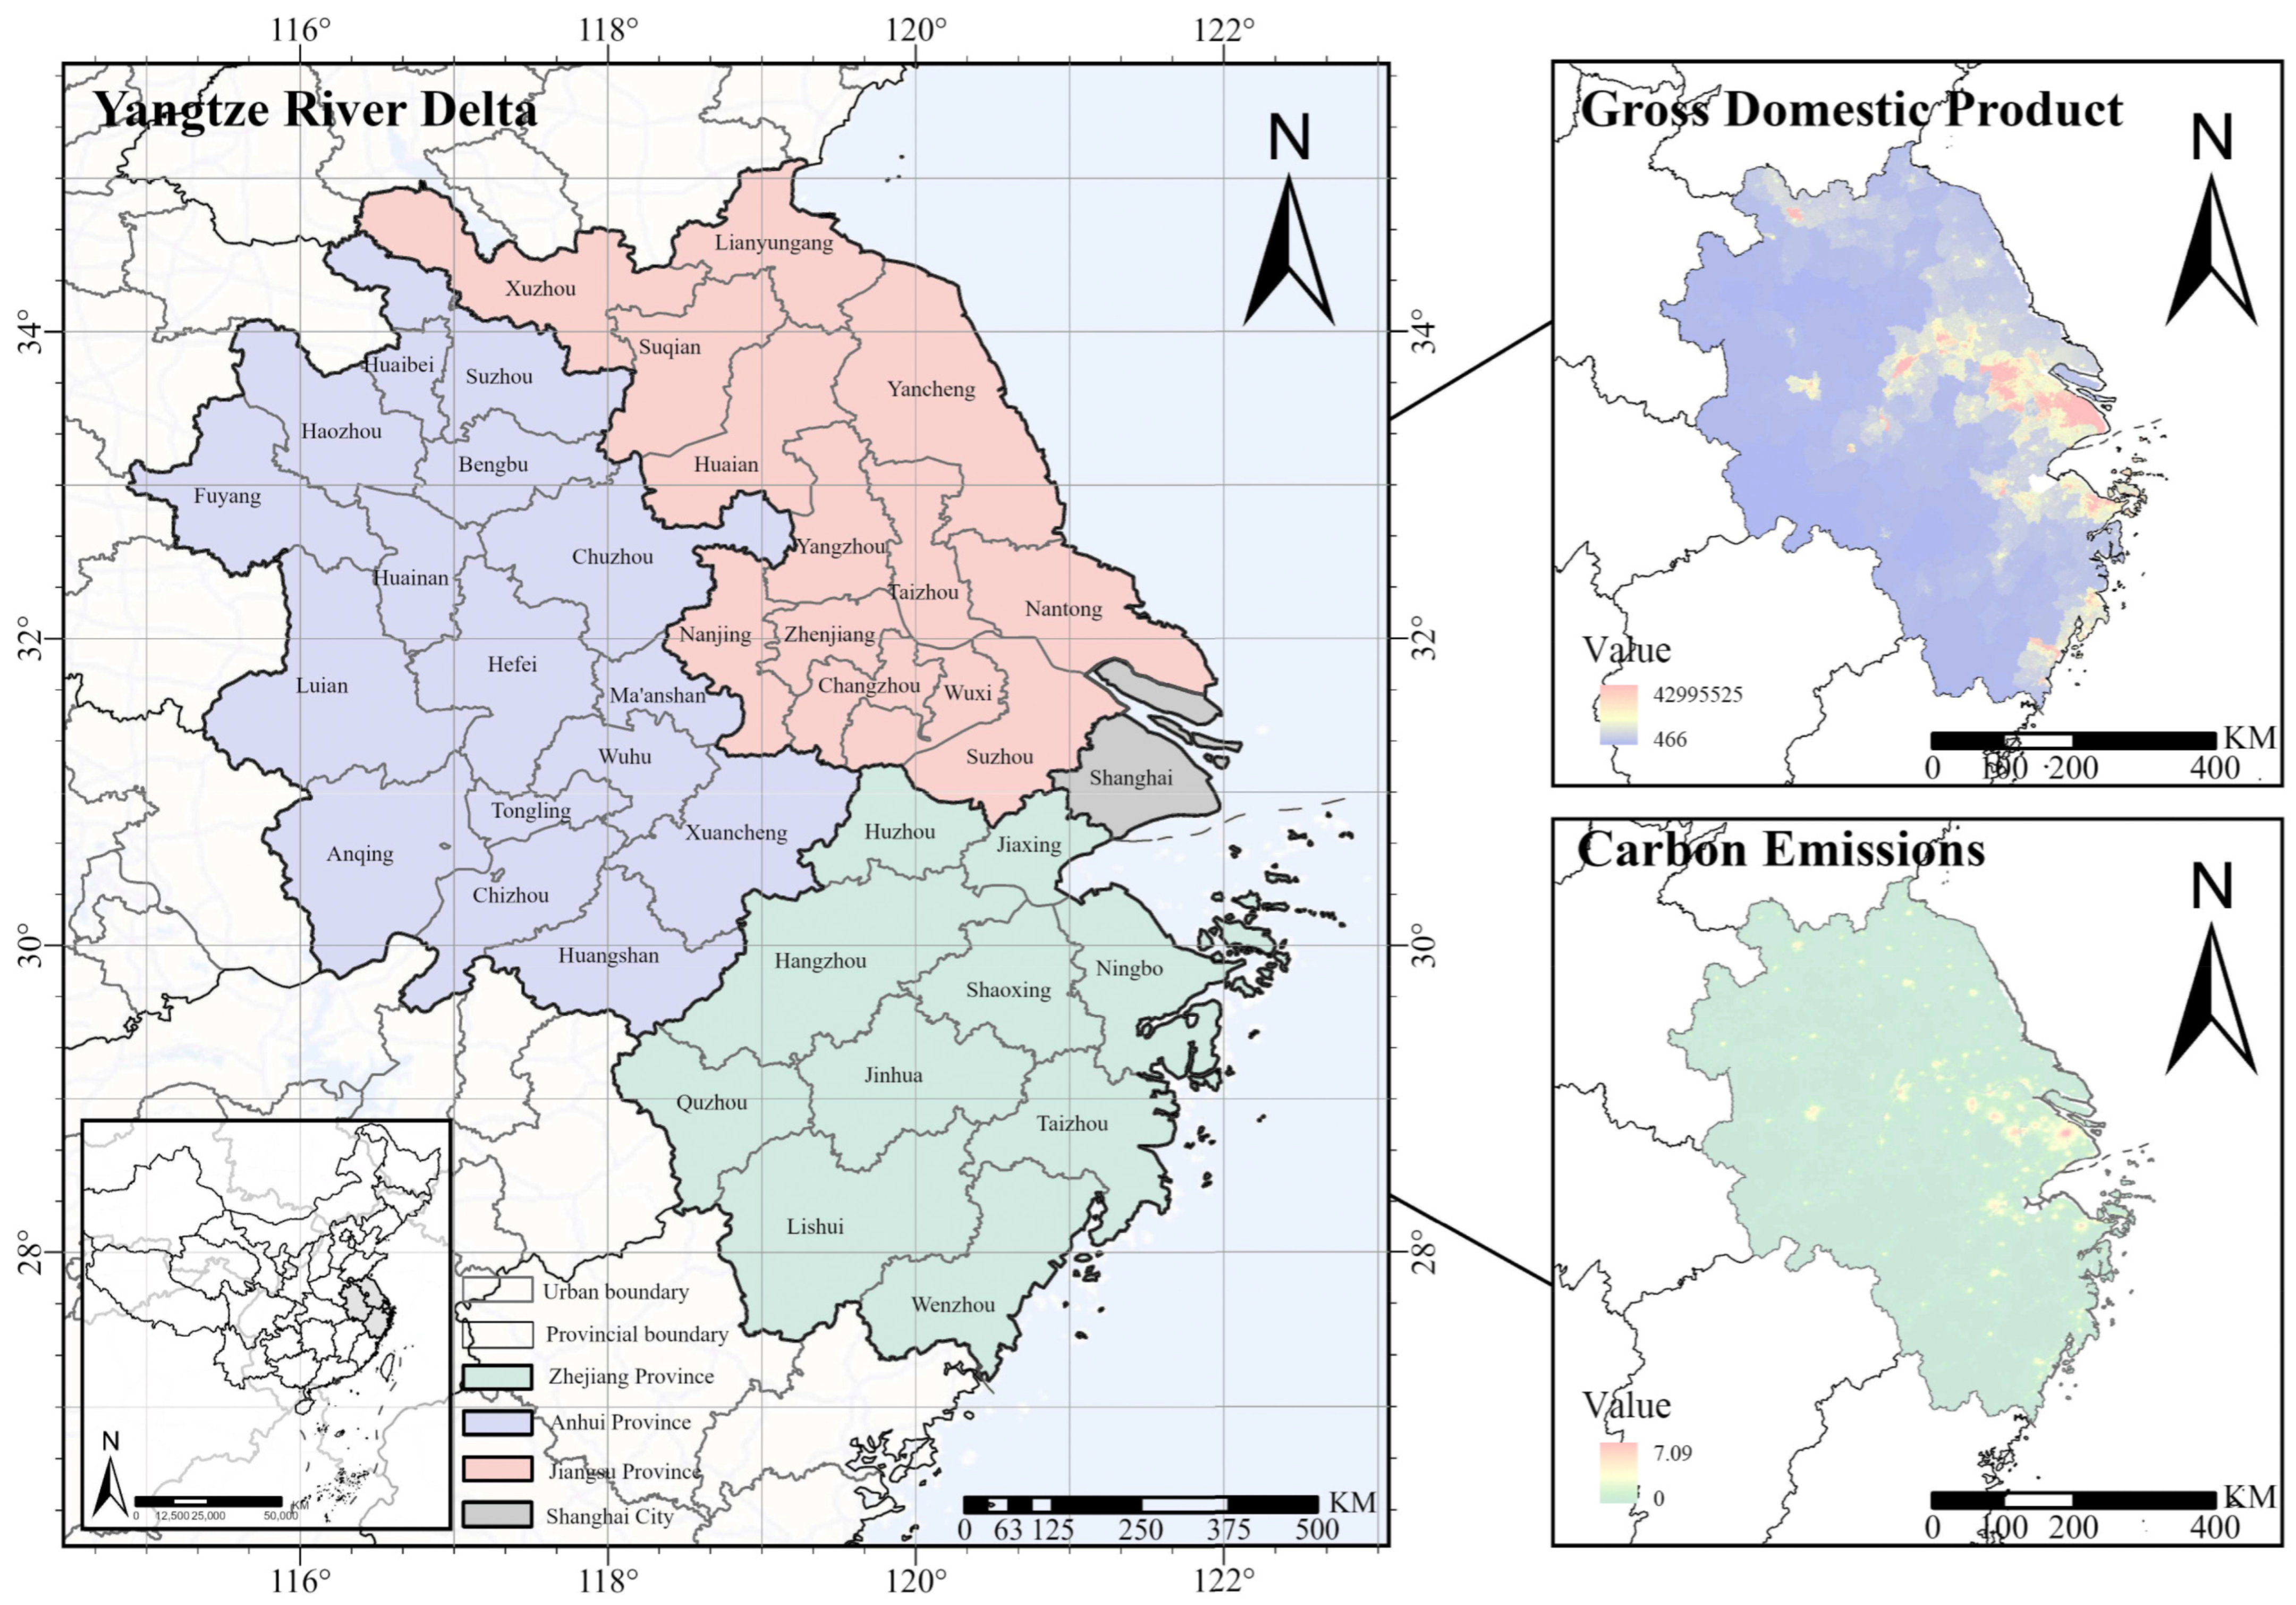
3.1.1. Study Area
3.1.2. Data Sources and Preprocessing
- (1)
- CEI calculation:
- (2)
- POI Classification:
3.2. Methodology
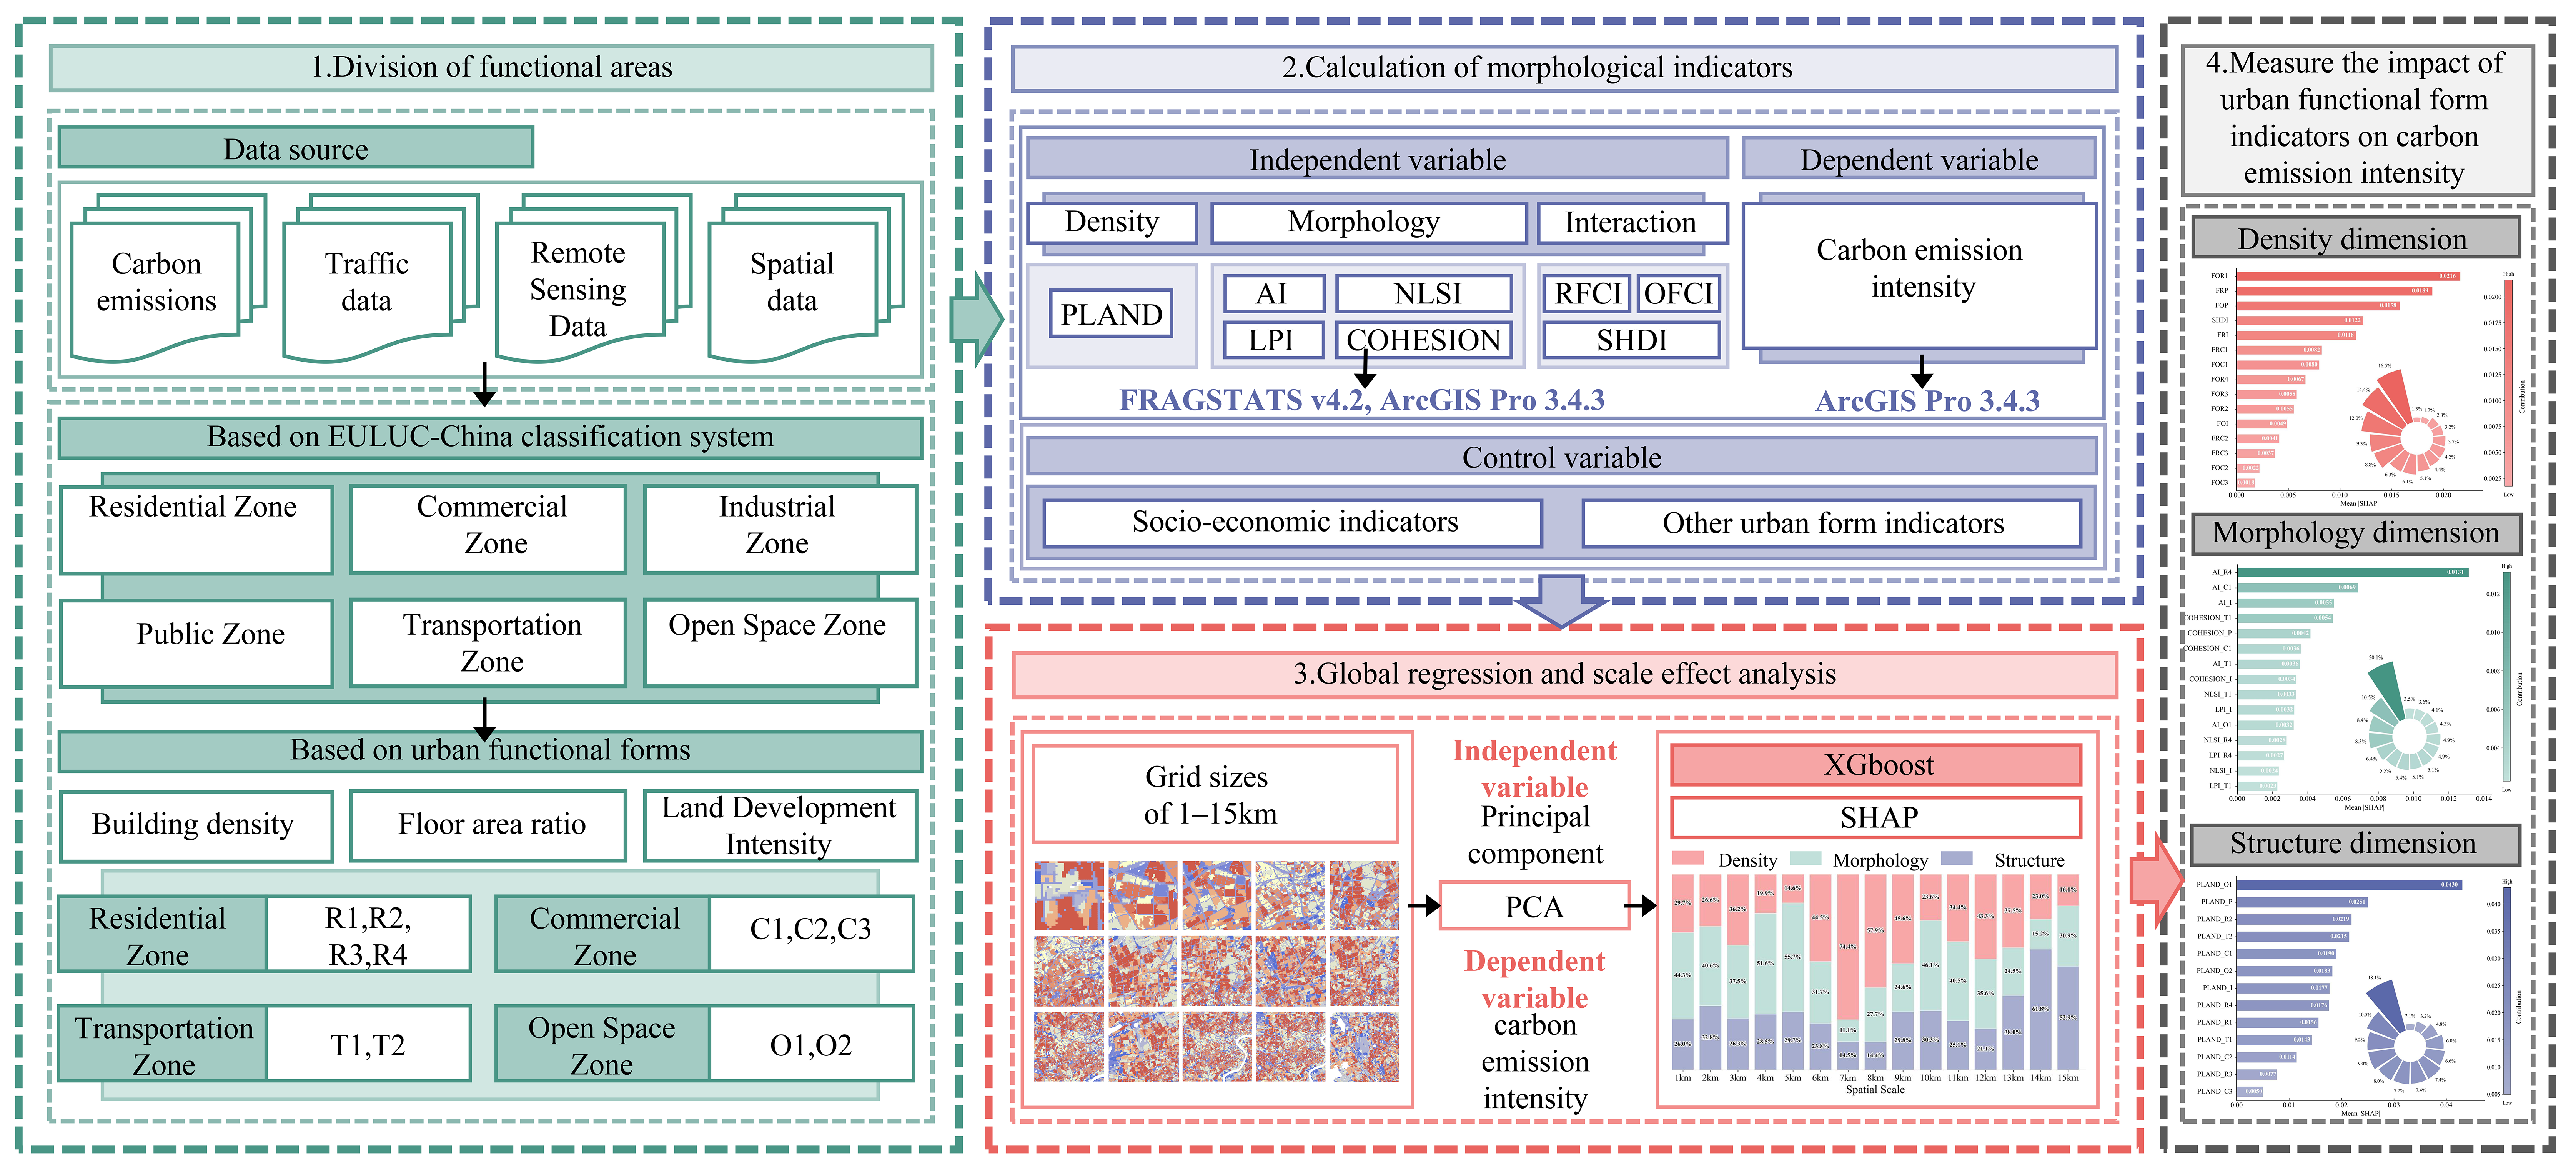
3.2.1. Research Process
3.2.2. Delimitation of UFZ Types
3.2.3. CEI
3.2.4. Measurement of UFZ Form Indicators
3.2.5. Scale Effect Analysis
3.2.6. Nonlinear Impact Characteristics
4. Results
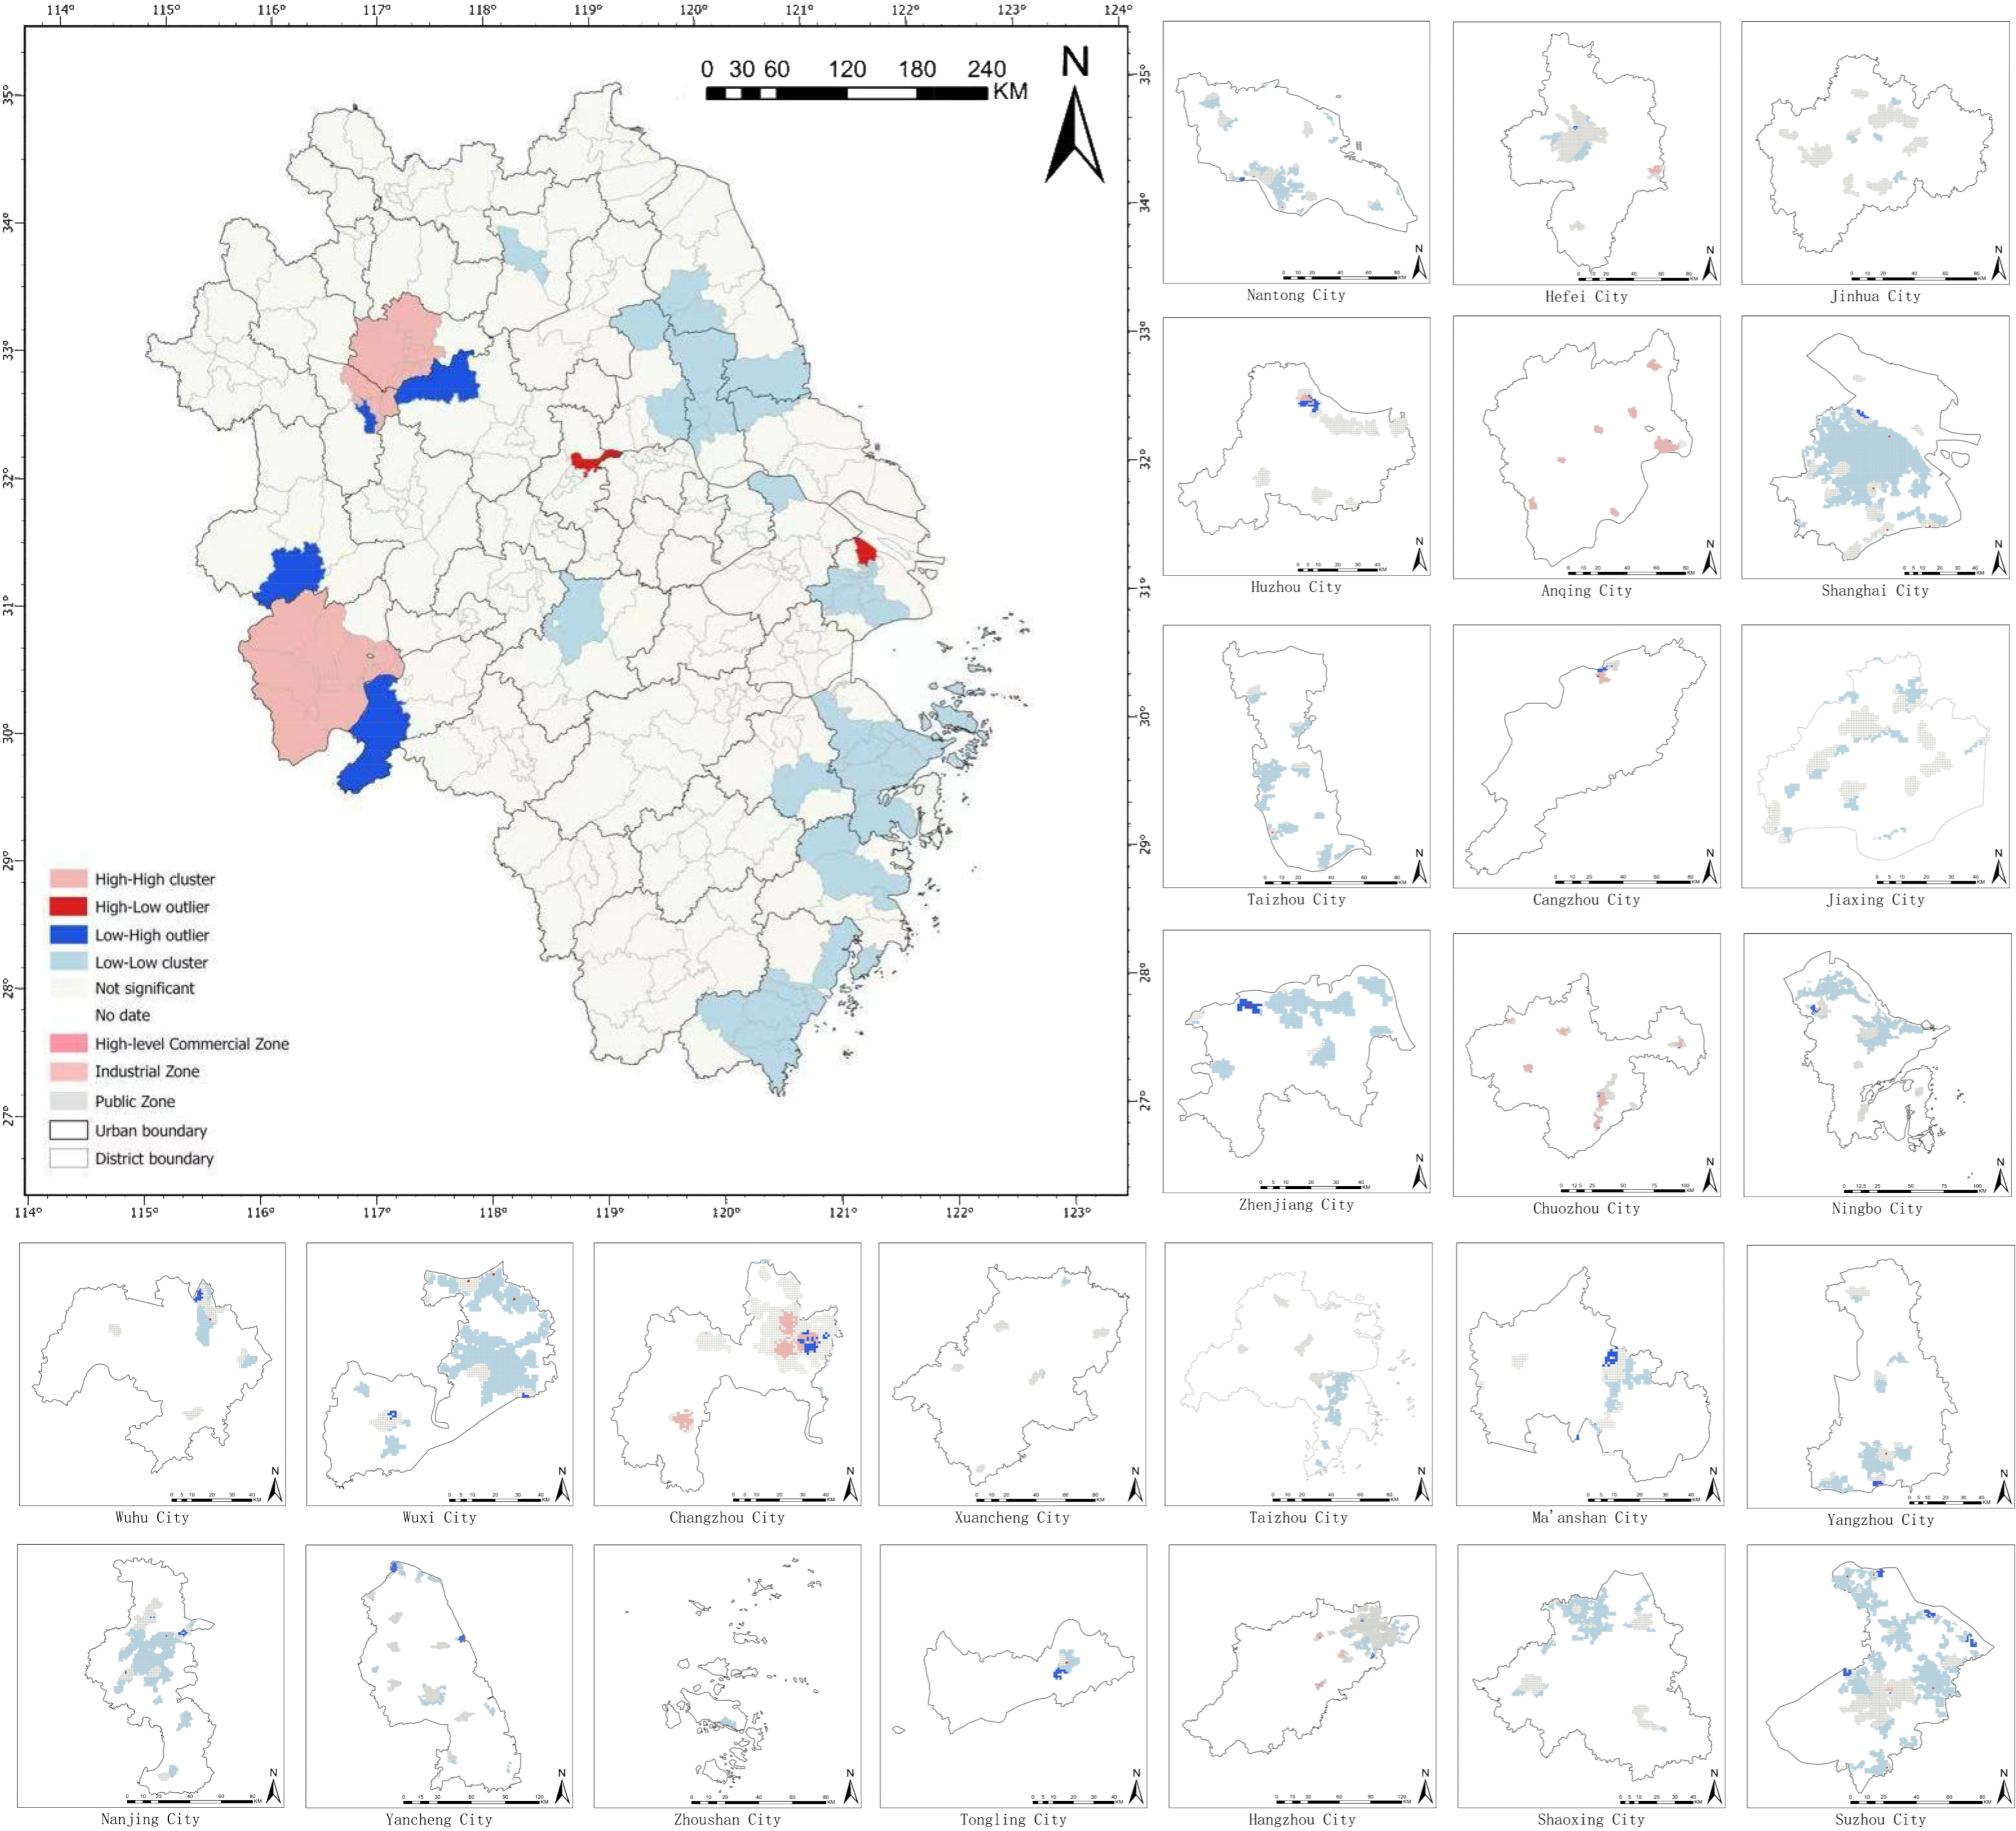
4.1. Identification of UFZ
4.2. Characteristics of CEI
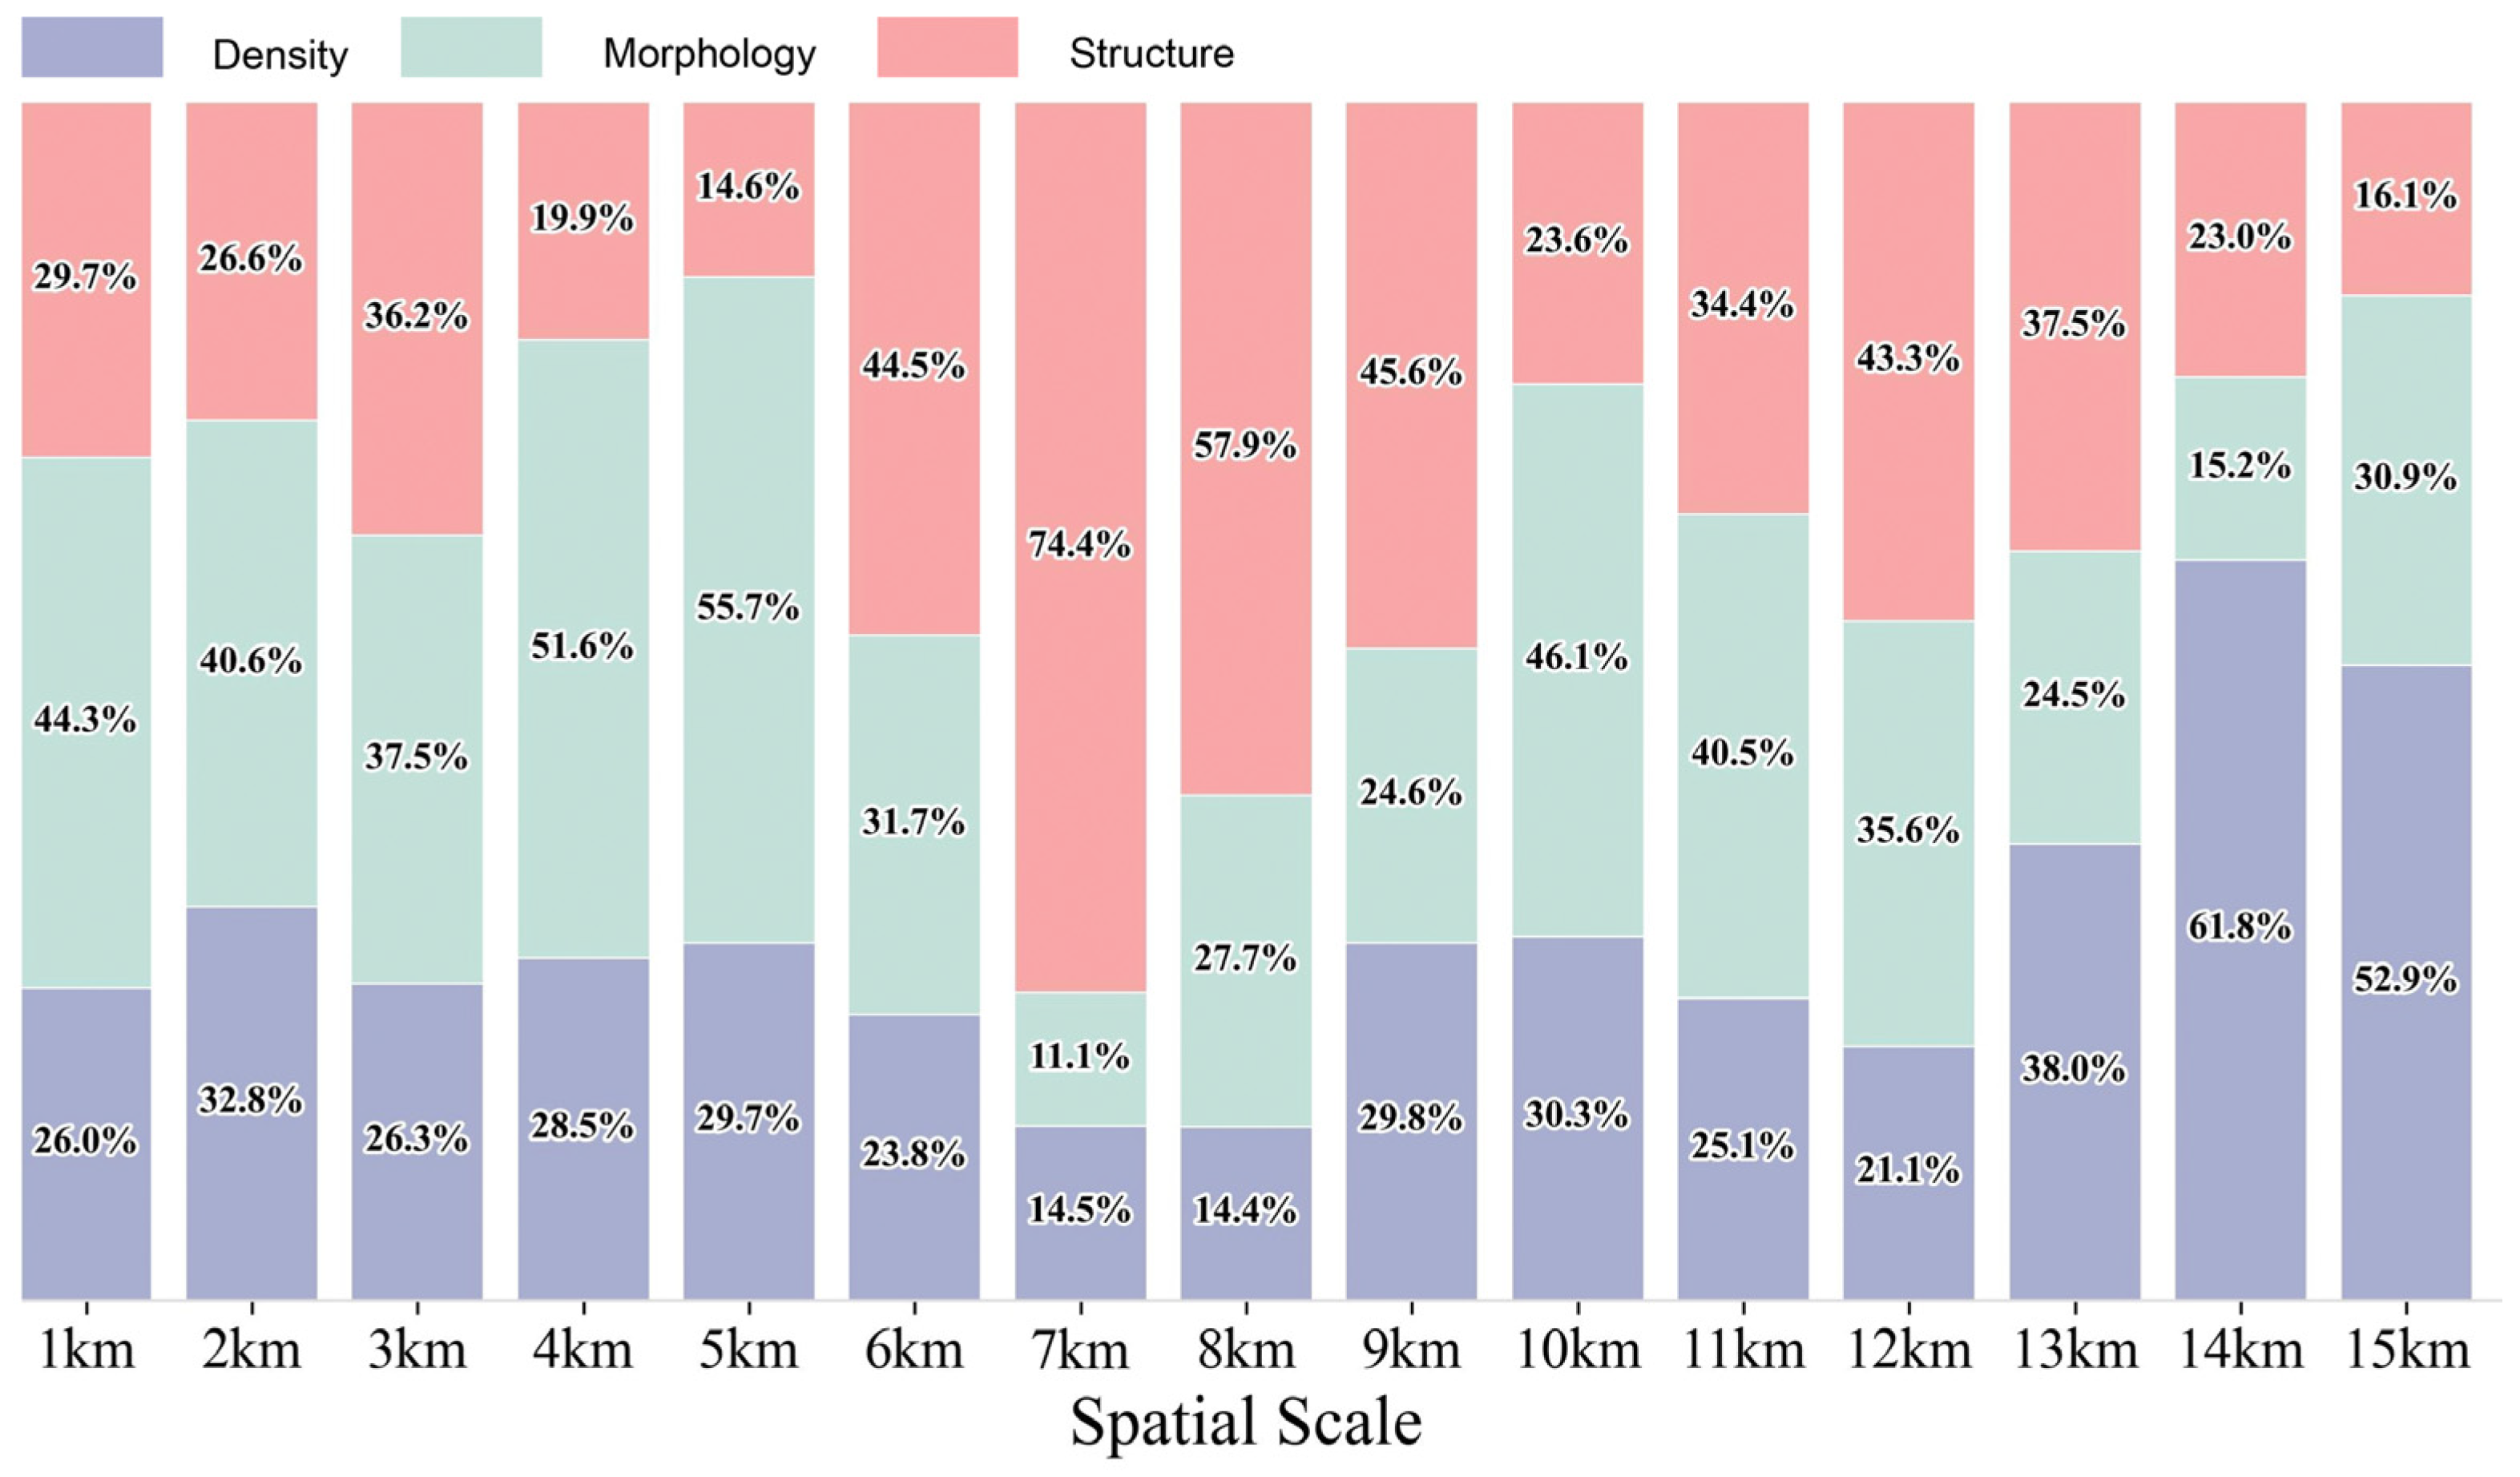
4.3. Scale-Dependent Characteristics
4.4. Nonlinear Patterns of UFZ Form on CEI
5. Discussion
5.1. Scale Effects of UFZ Form on CEI
5.2. Impact Characteristics of UFZ Form on CEI
5.2.1. Effects of Density-Related Indicators on CEI
5.2.2. Effects of Morphology-Related Indicators on CEI
5.2.3. Effects of Structure-Related Indicators on CEI
5.3. Differences in the Effects of UFZ Form on CEI Between Core and Peripheral Cities
5.4. Policy Implications
- (1)
- At the scale of the built-up urban area, priority should be given to regulating UFZ density. In particular, careful control over the proportions of green space, public service land, and residential land is essential to avoid carbon increases induced by excessive development intensity. Within this framework, a moderate expansion of plaza-type open spaces, together with improvements in transport infrastructure, can help alleviate excessive economic concentration and mitigate congestion along major transport corridors.
- (2)
- At finer neighborhood or district scales, planning strategies should focus on the aggregation and connectivity of different functional land uses. Controlling the clustering intensity of residential and CZs, while simultaneously establishing well-structured transport networks, can enhance spatial connectivity and reduce carbon emissions associated with traffic congestion and inefficient mobility patterns.
- (3)
- At larger subregional scales, inter-zonal relationships and land-use compositional diversity become increasingly important. Carbon emission intensity at this scale is particularly sensitive to the configuration of open spaces. Strengthening spatial linkages between open spaces, public service facilities, and low-density mid-rise residential areas can partially offset the negative environmental impacts of urban expansion. In addition, promoting land-use diversity within a reasonable range can enhance overall development quality and generate positive environmental effects, although the risks associated with excessive diversification should also be carefully managed.
- (4)
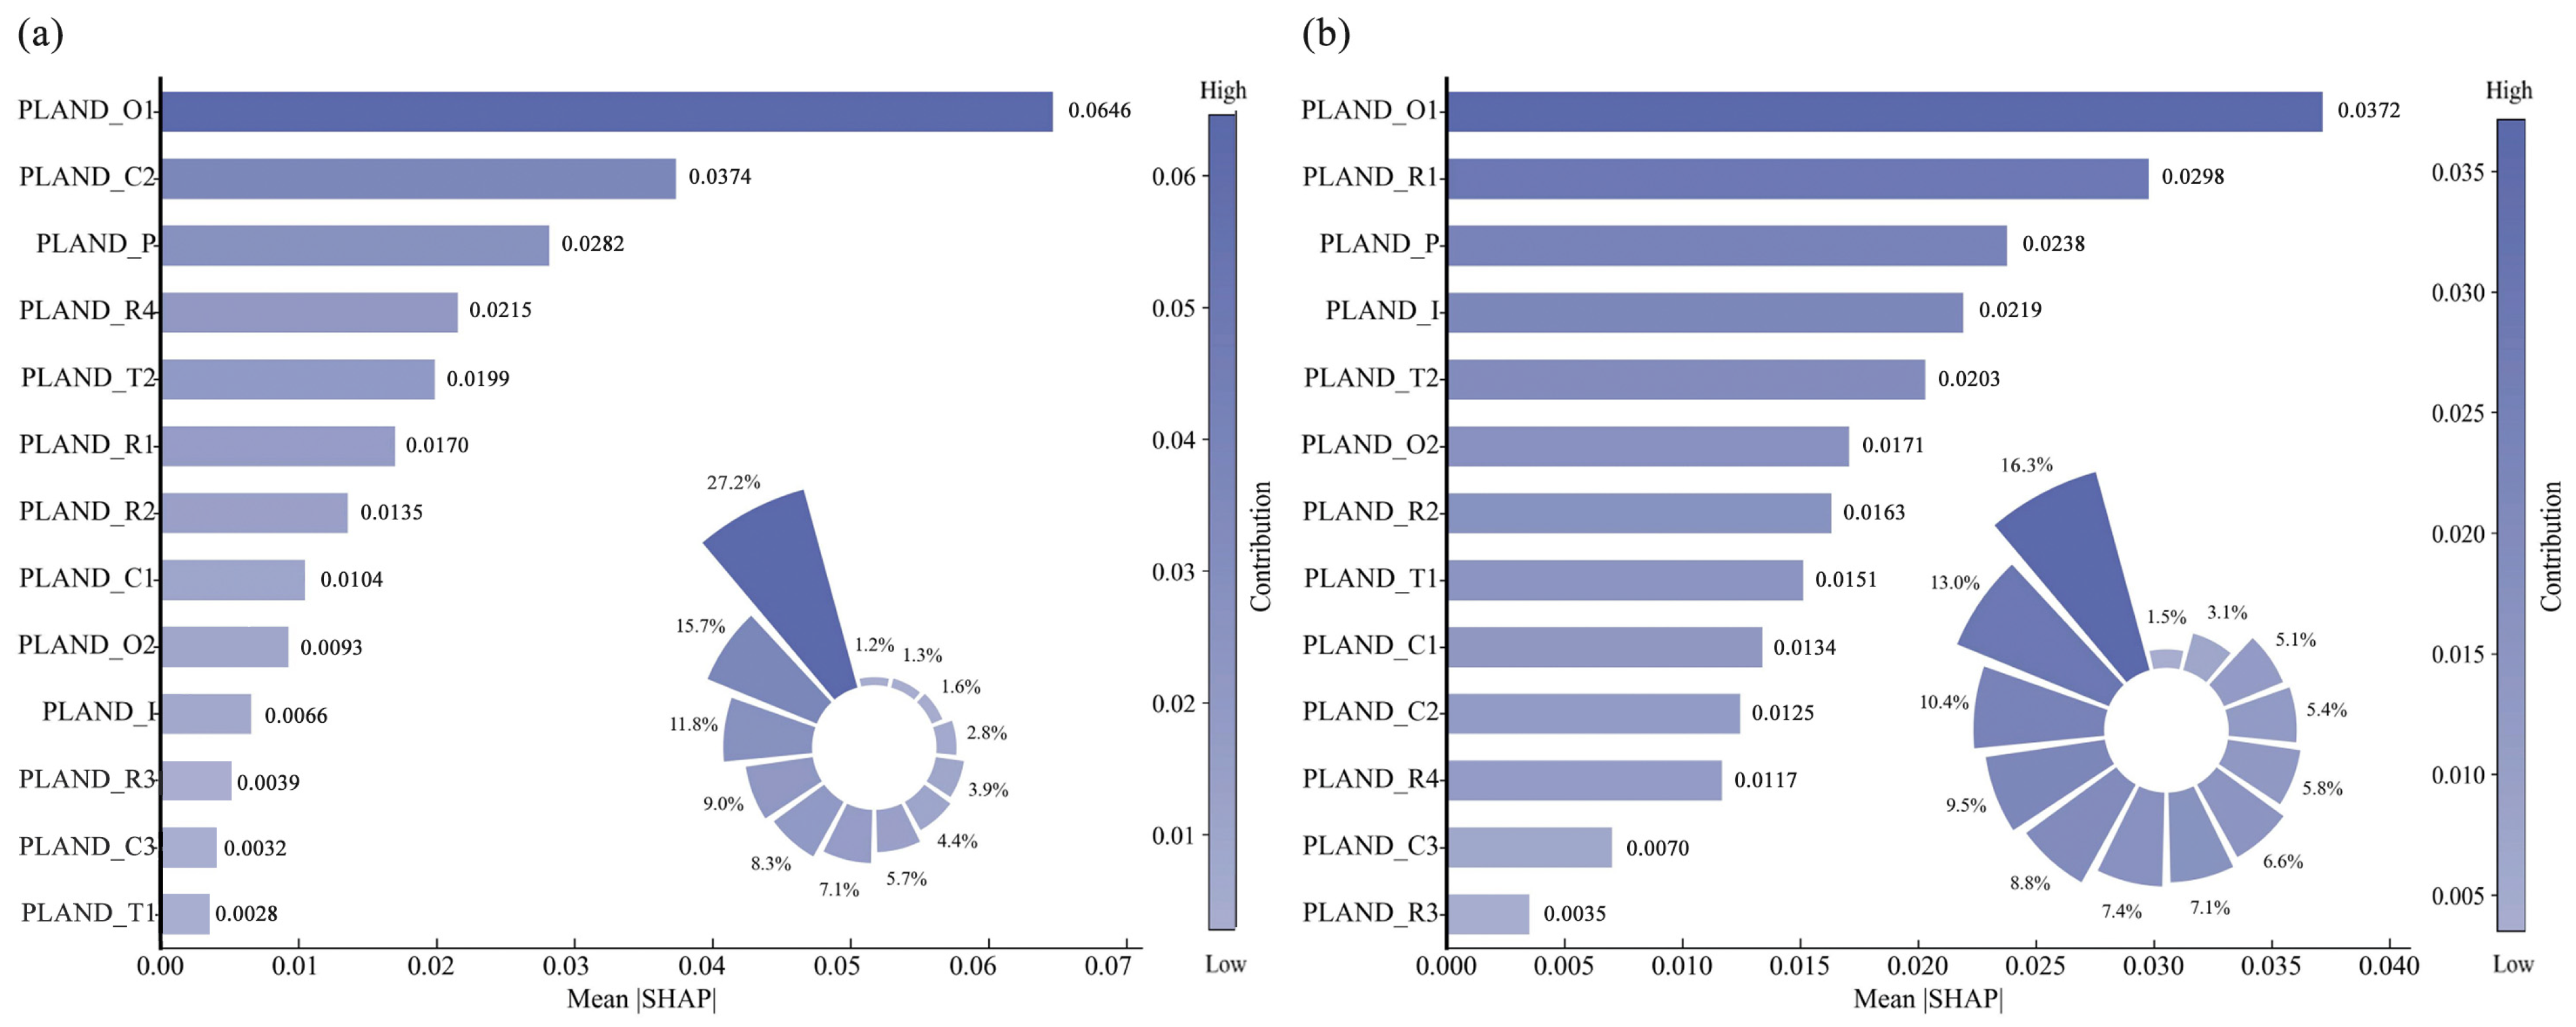
- For core cities, carbon emission intensity is mainly driven by a limited number of key UFZ types and their spatial organization. Policy design should therefore emphasize refined and targeted regulation of critical land-use categories, focusing on improving the efficiency of green spaces, commercial areas, and public service land, as well as optimizing spatial coordination among major UFZs.
- (5)
- In peripheral cities, carbon emission intensity is jointly shaped by multiple UFZs and their interactions. Policy interventions should prioritize the coordinated allocation of residential, green, public service, and transport land. Measures such as promoting jobs–housing balance, improving transport network structures, and controlling disorderly spatial expansion are crucial for reducing energy consumption associated with daily travel and production activities.
6. Conclusions
- (1)
- The effects of UFZ form on CEI exhibit strong scale dependency. Based on the dimensional contribution ratios derived from the PCA results, the density dimension shows a pattern that remains relatively stable at smaller scales and then increases with scale expansion, whereas the morphology and structure dimensions display distinct U-shaped and inverted U-shaped relationships with spatial scale. Their explanatory power peaks at grid sizes of 14 km, 5 km, and 7 km, respectively, with contribution shares of 61.8 percent, 55.7 percent, and 74.4 percent at their optimal scales. The divergence in optimal scales across dimensions reflects a clear spatial transition from localized morphological effects to mid-scale functional configuration effects, and ultimately to large-scale land-use composition effects.
- (2)
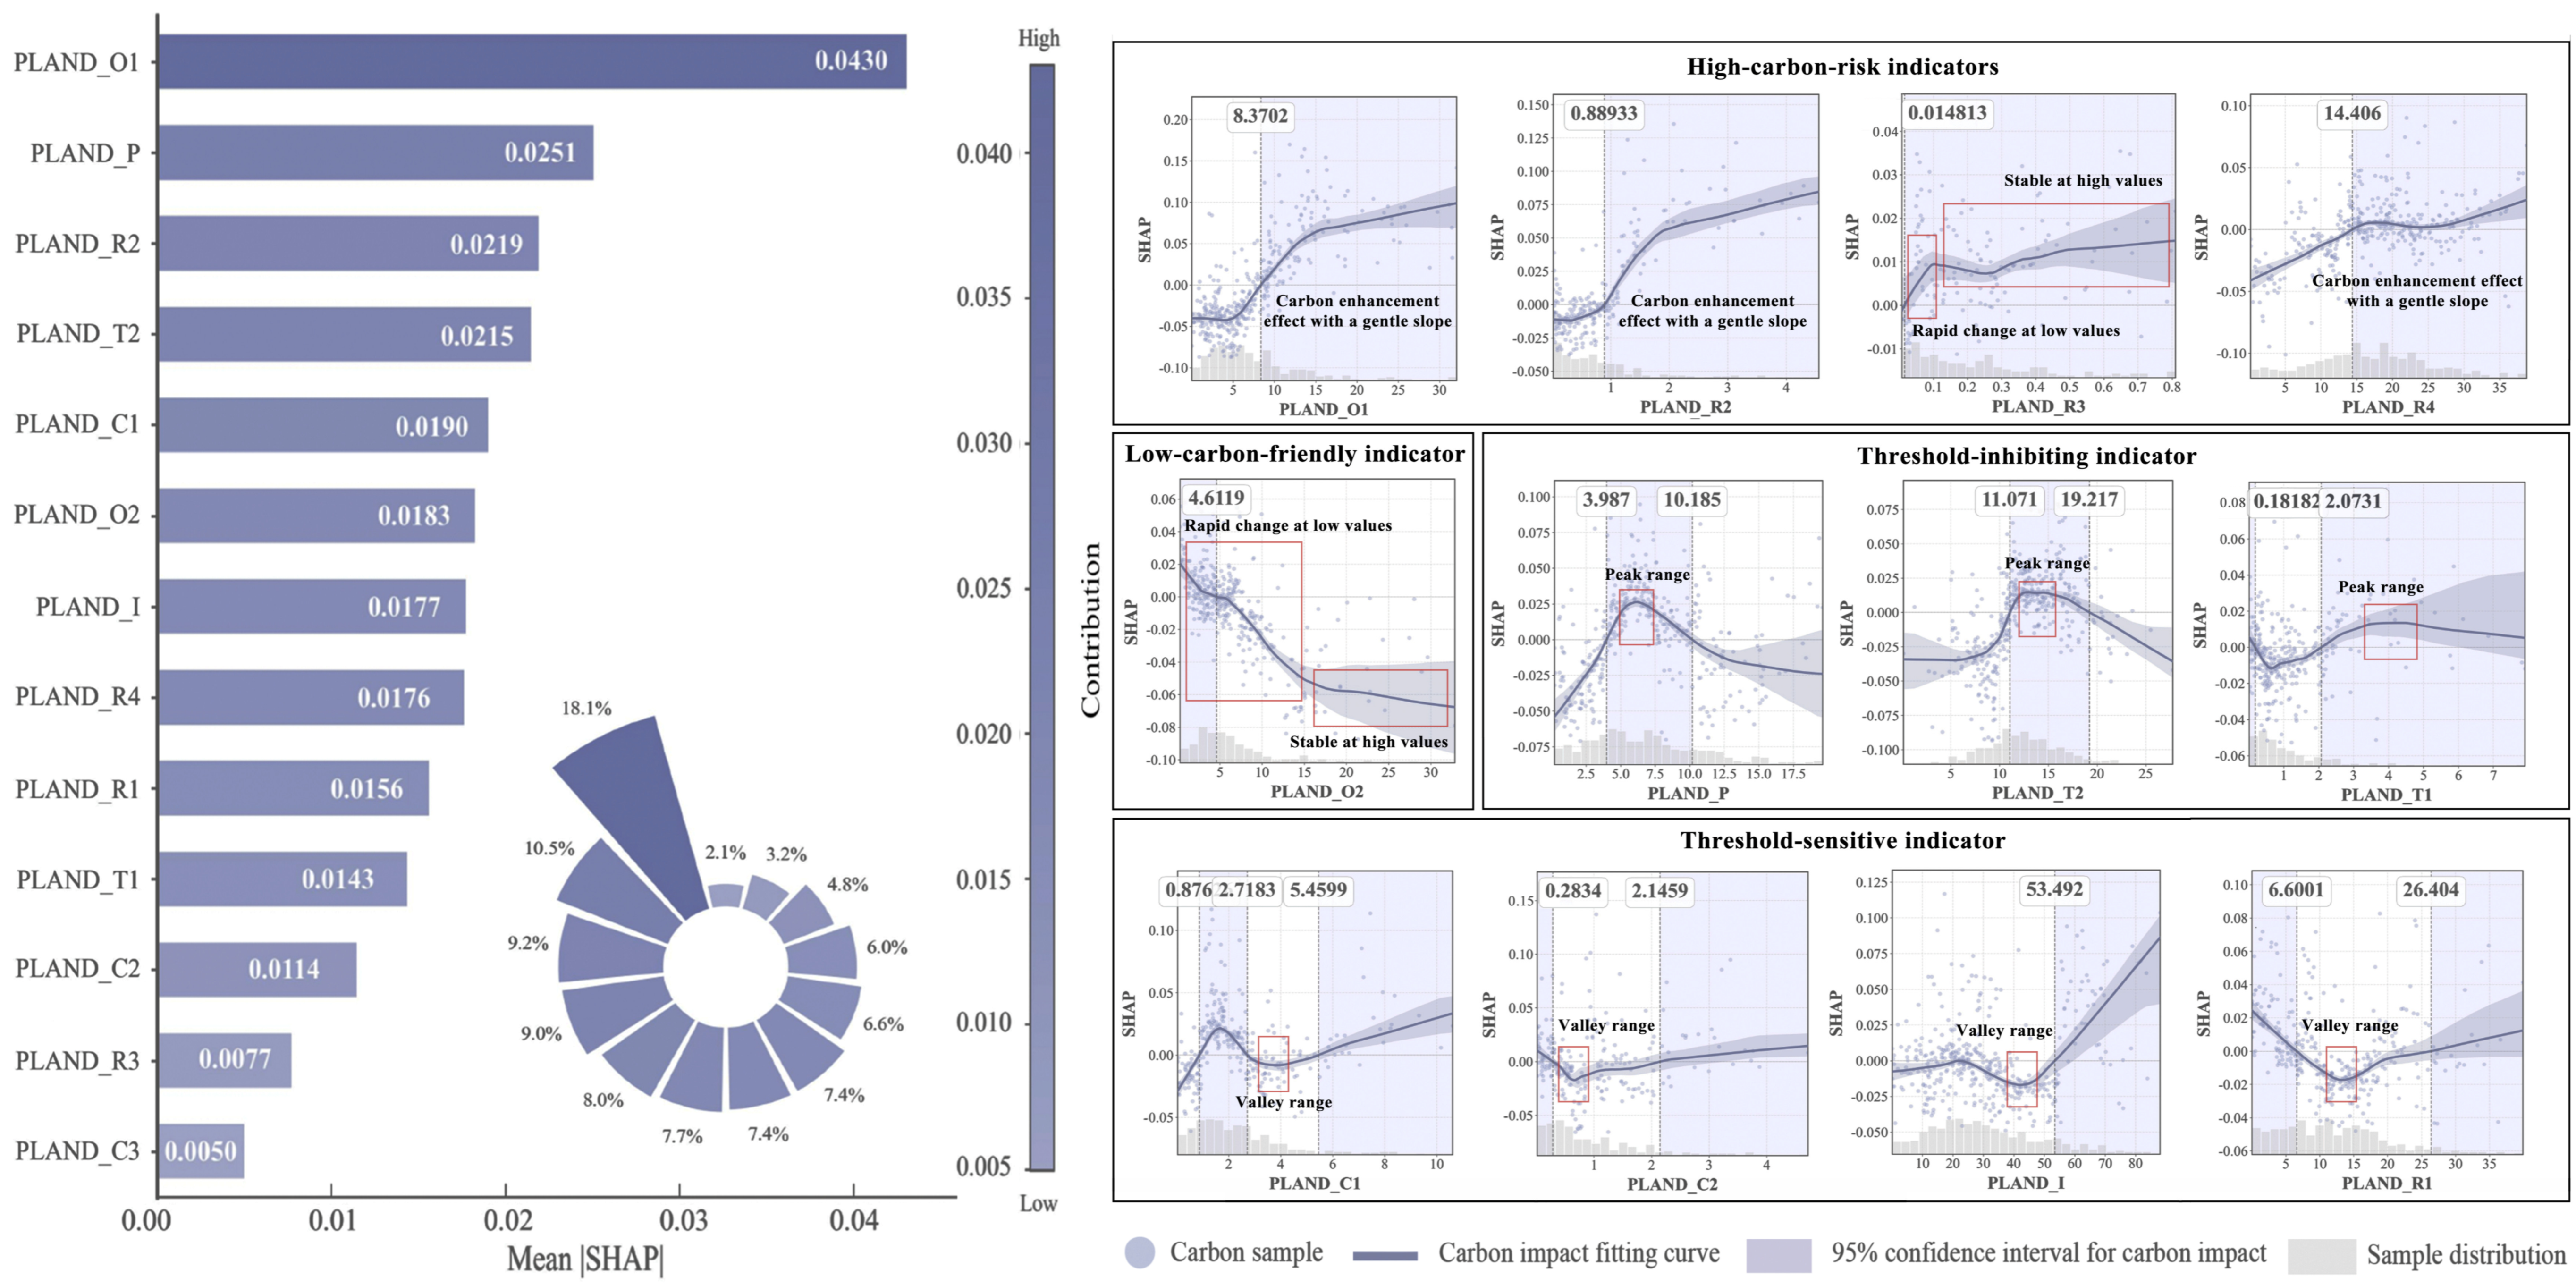
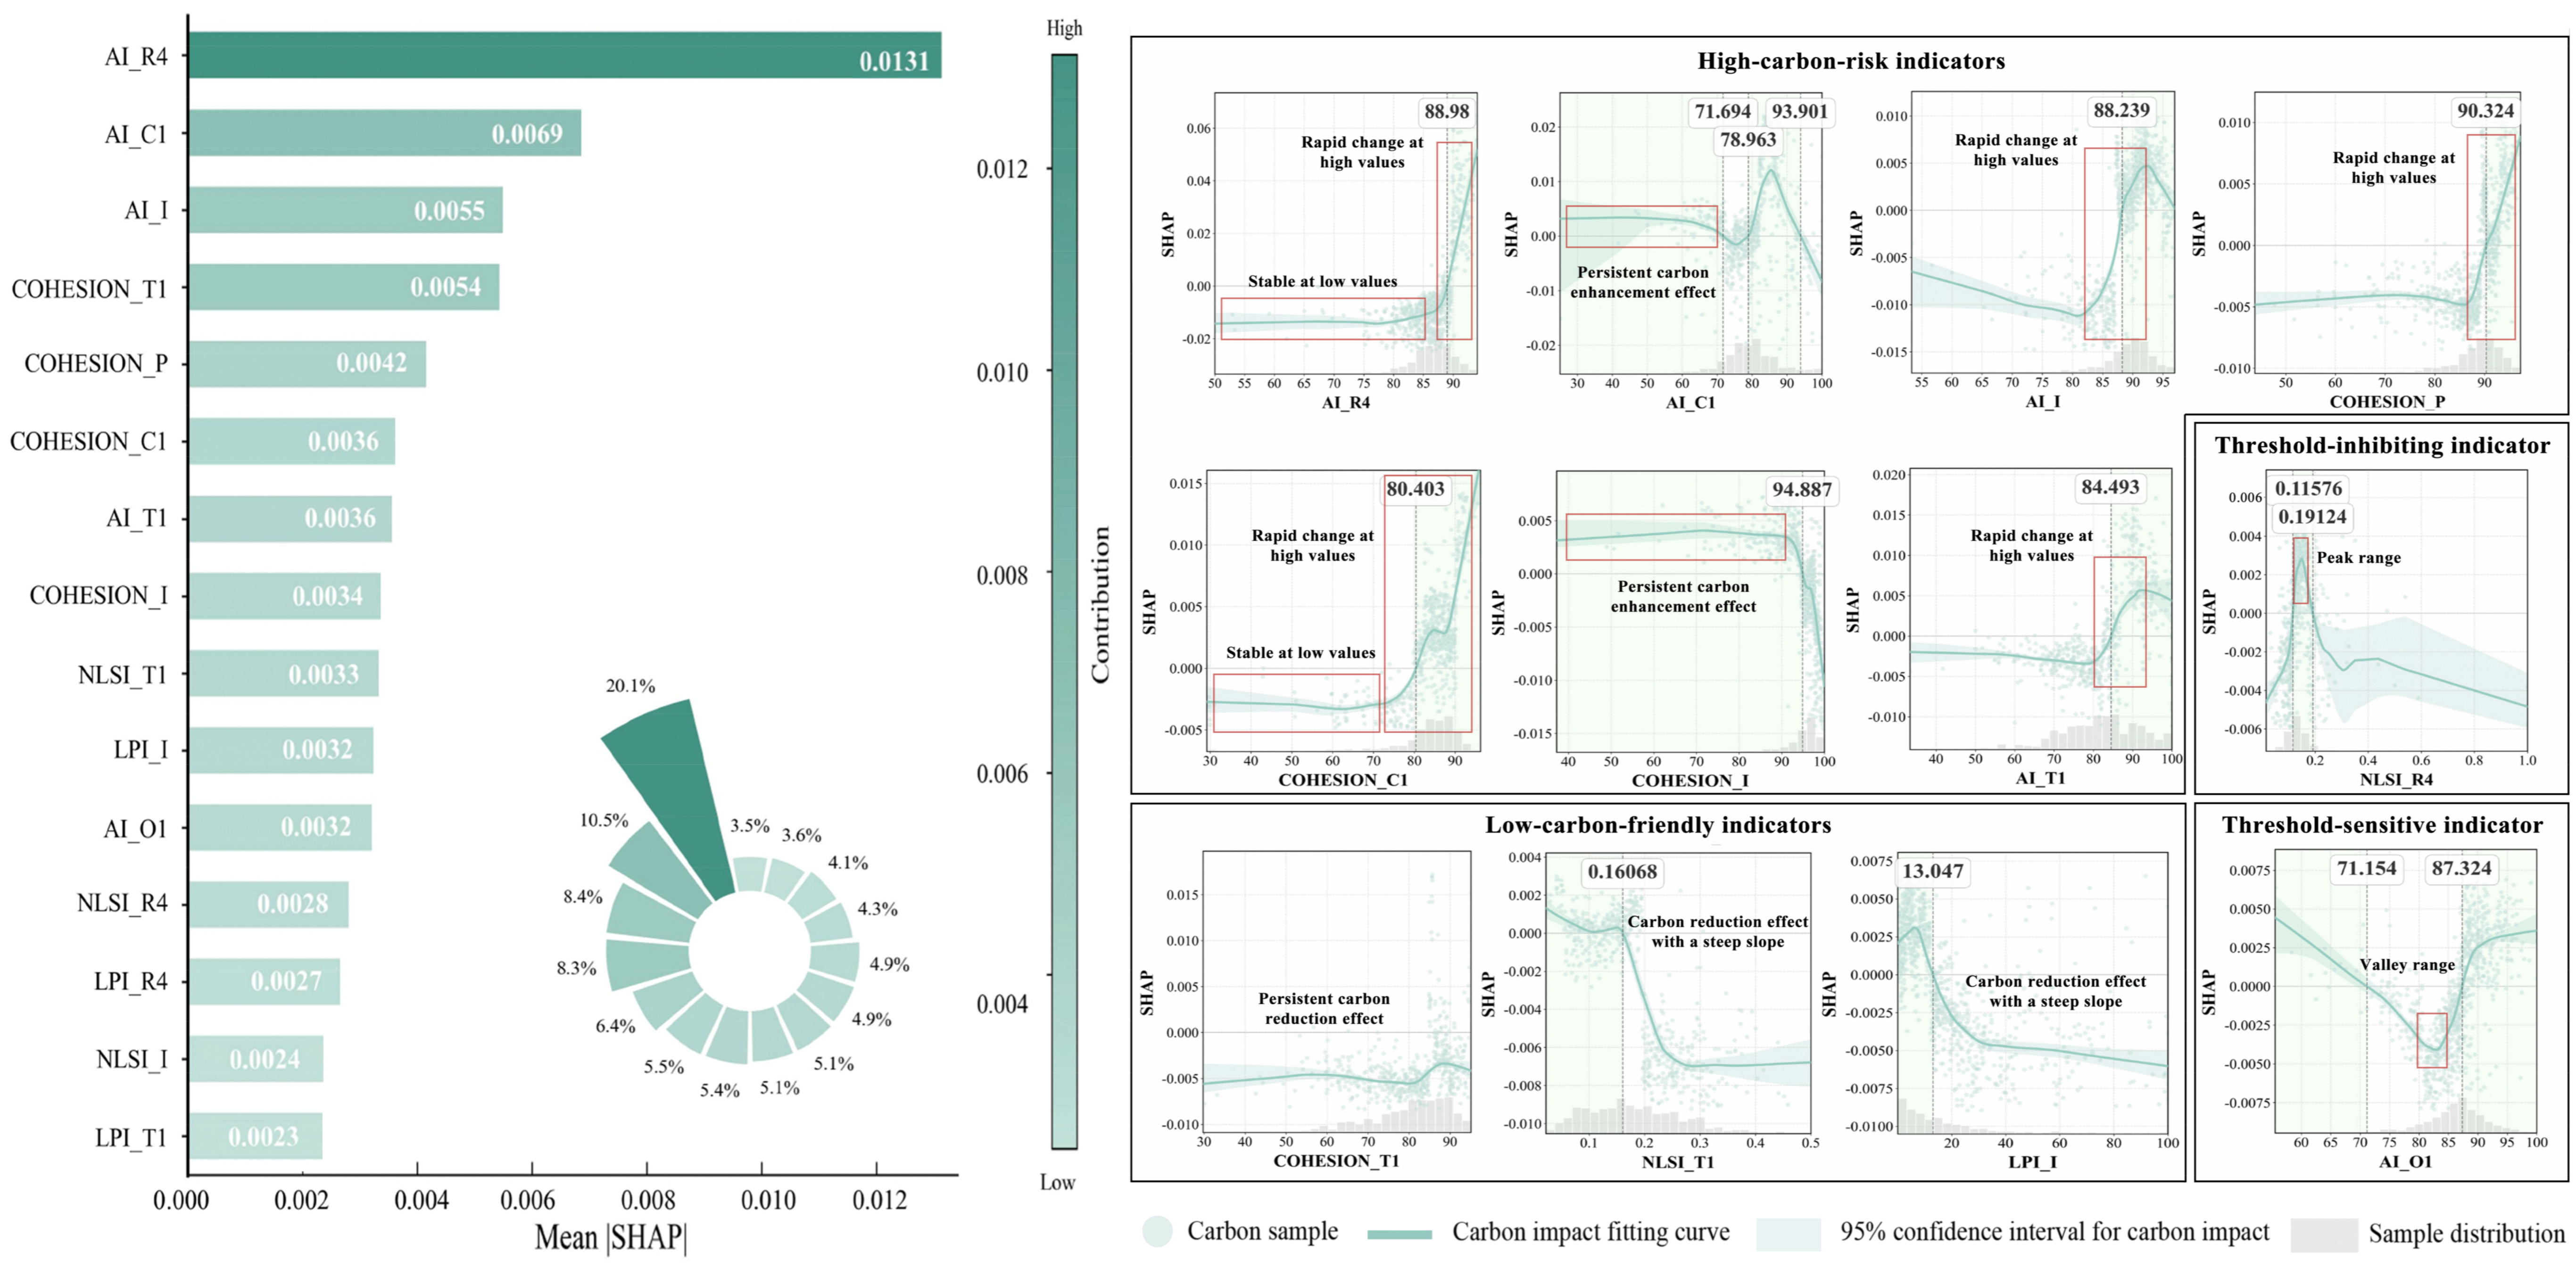
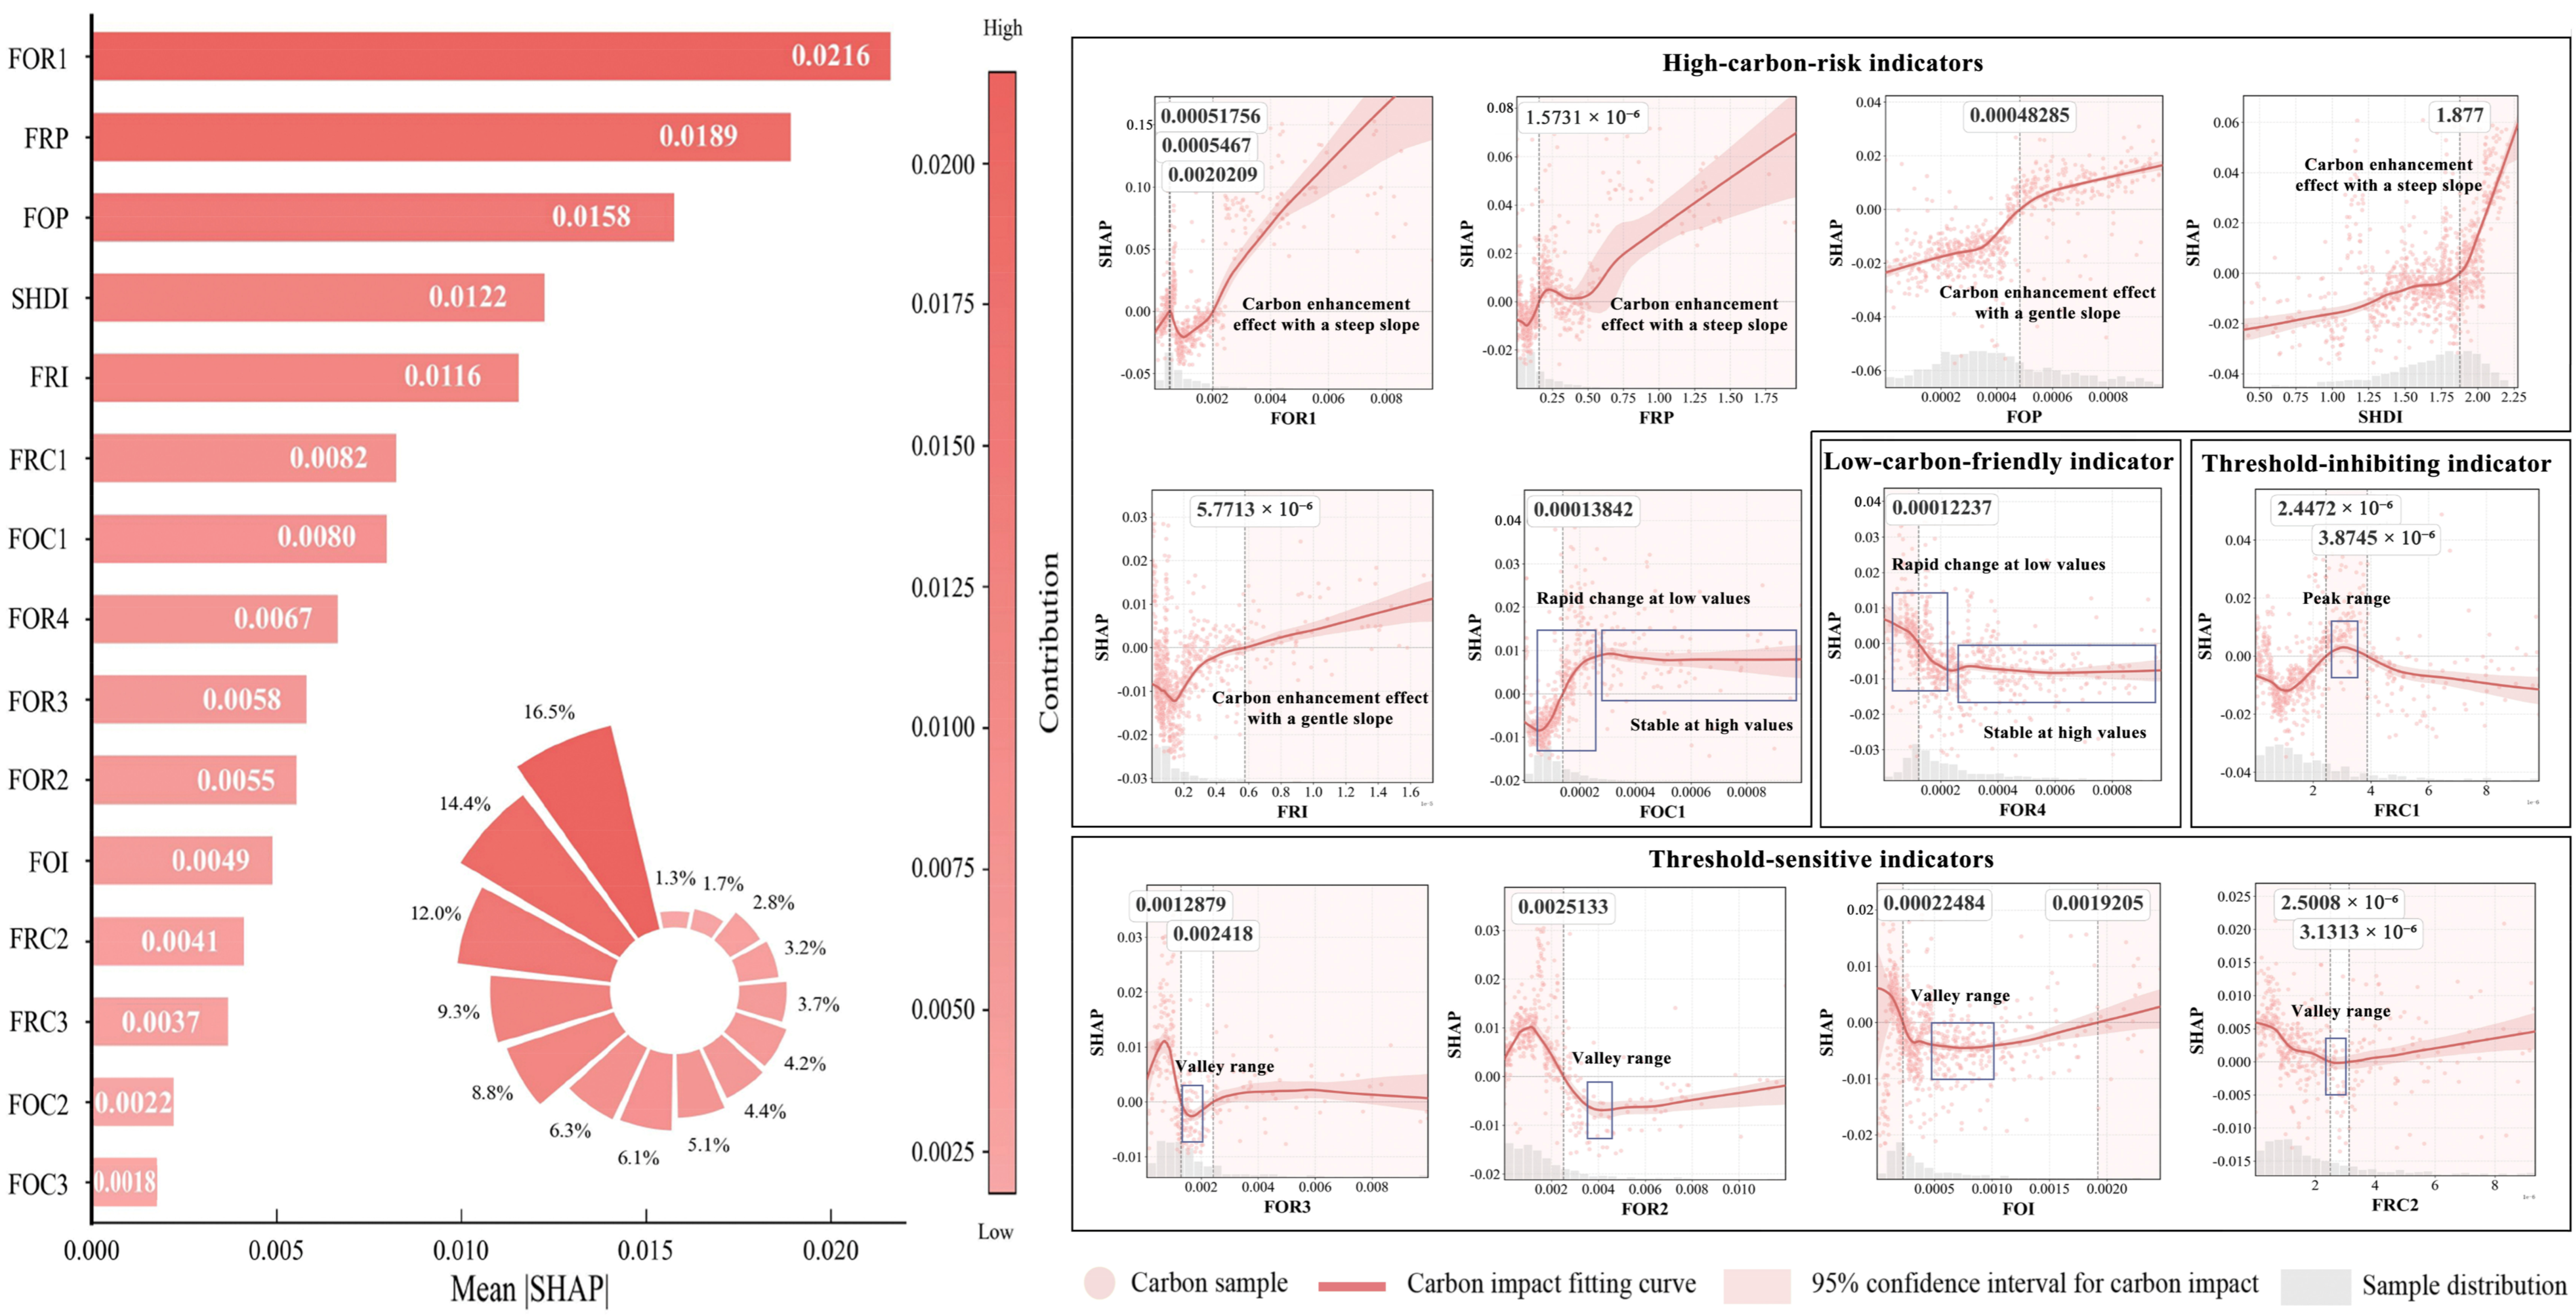
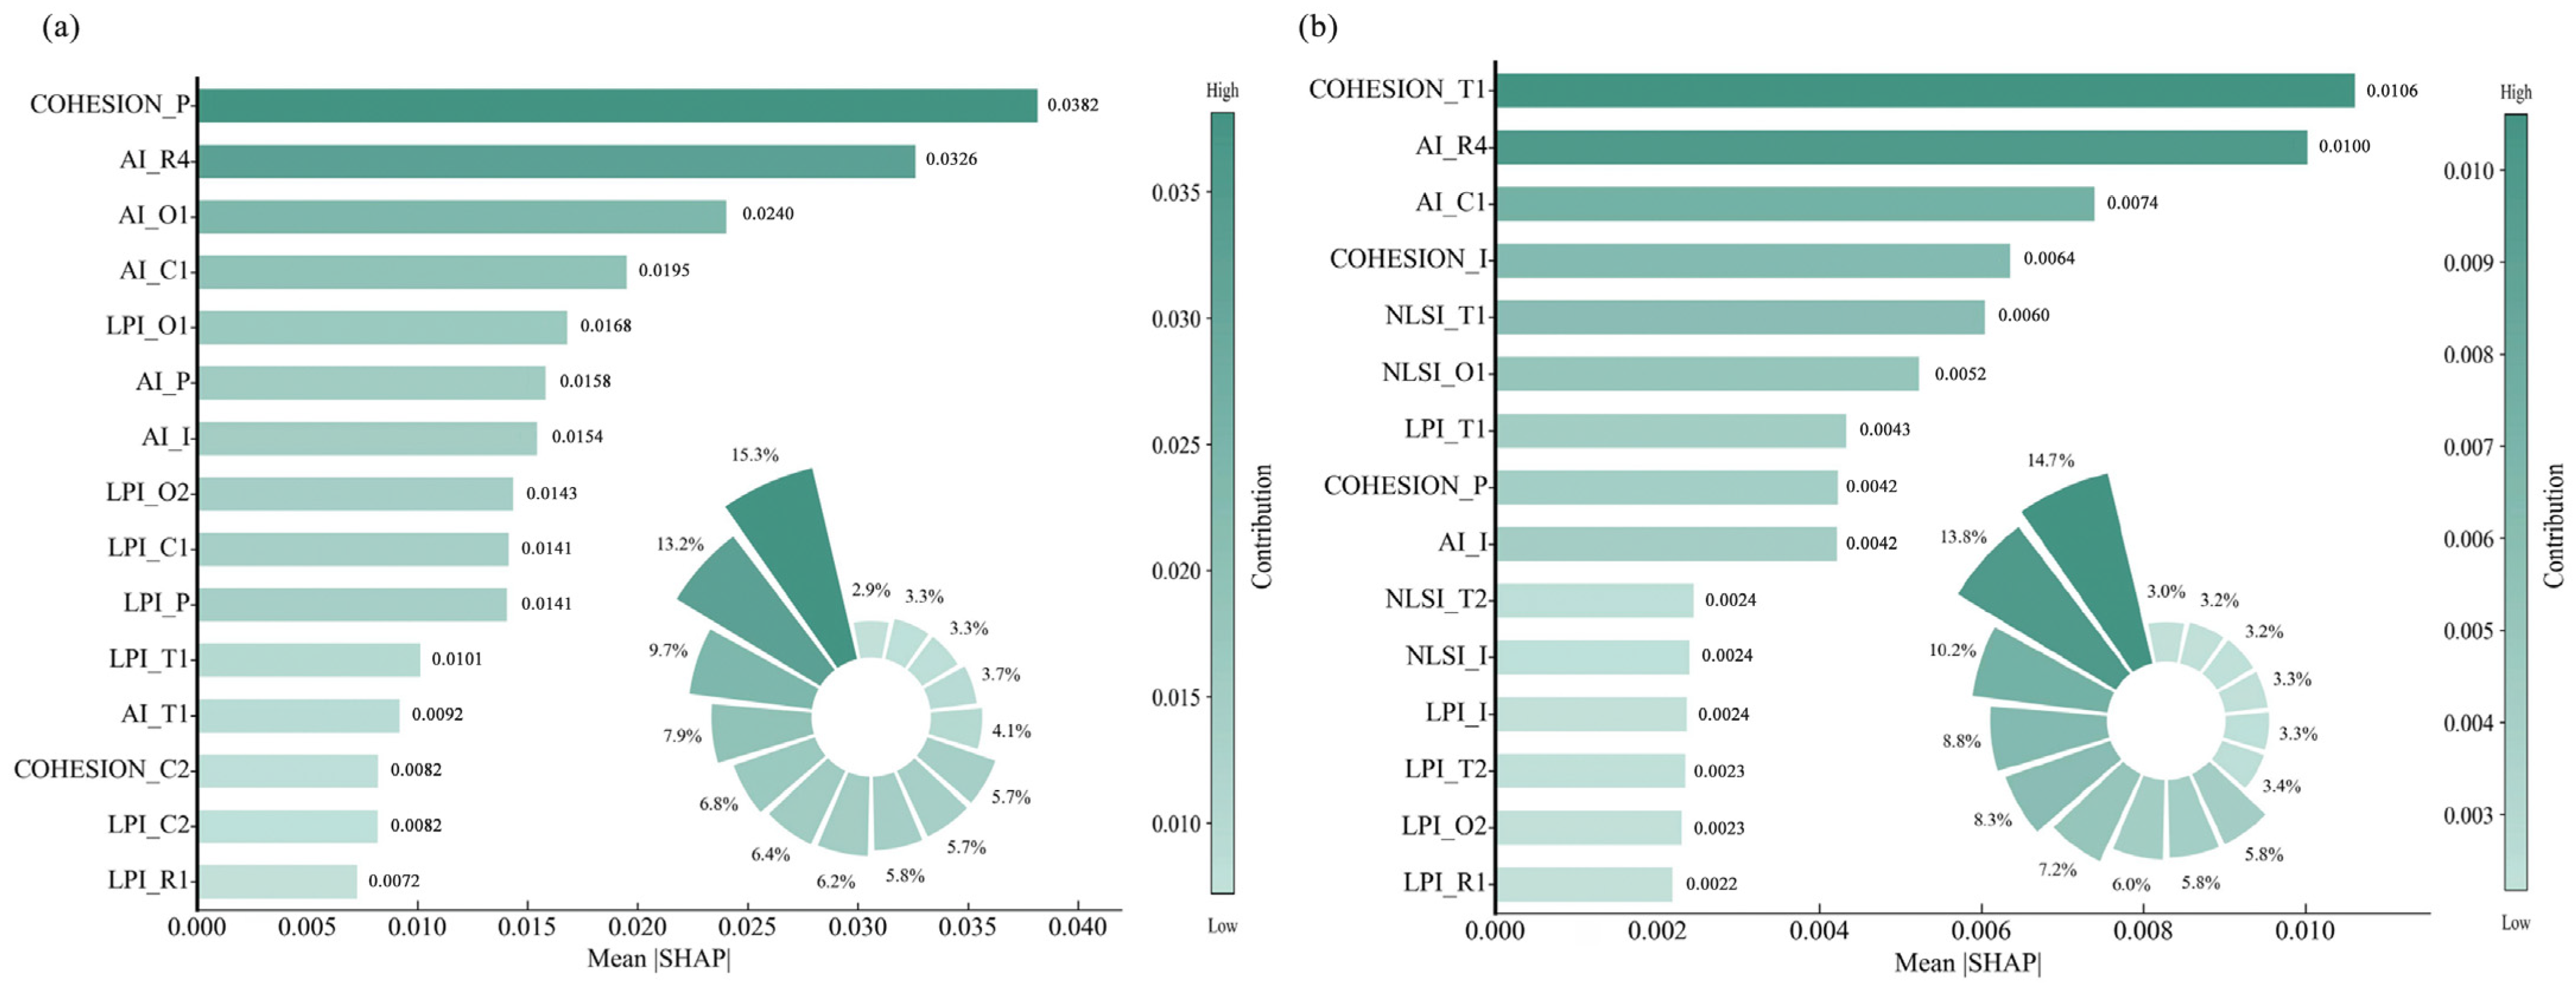
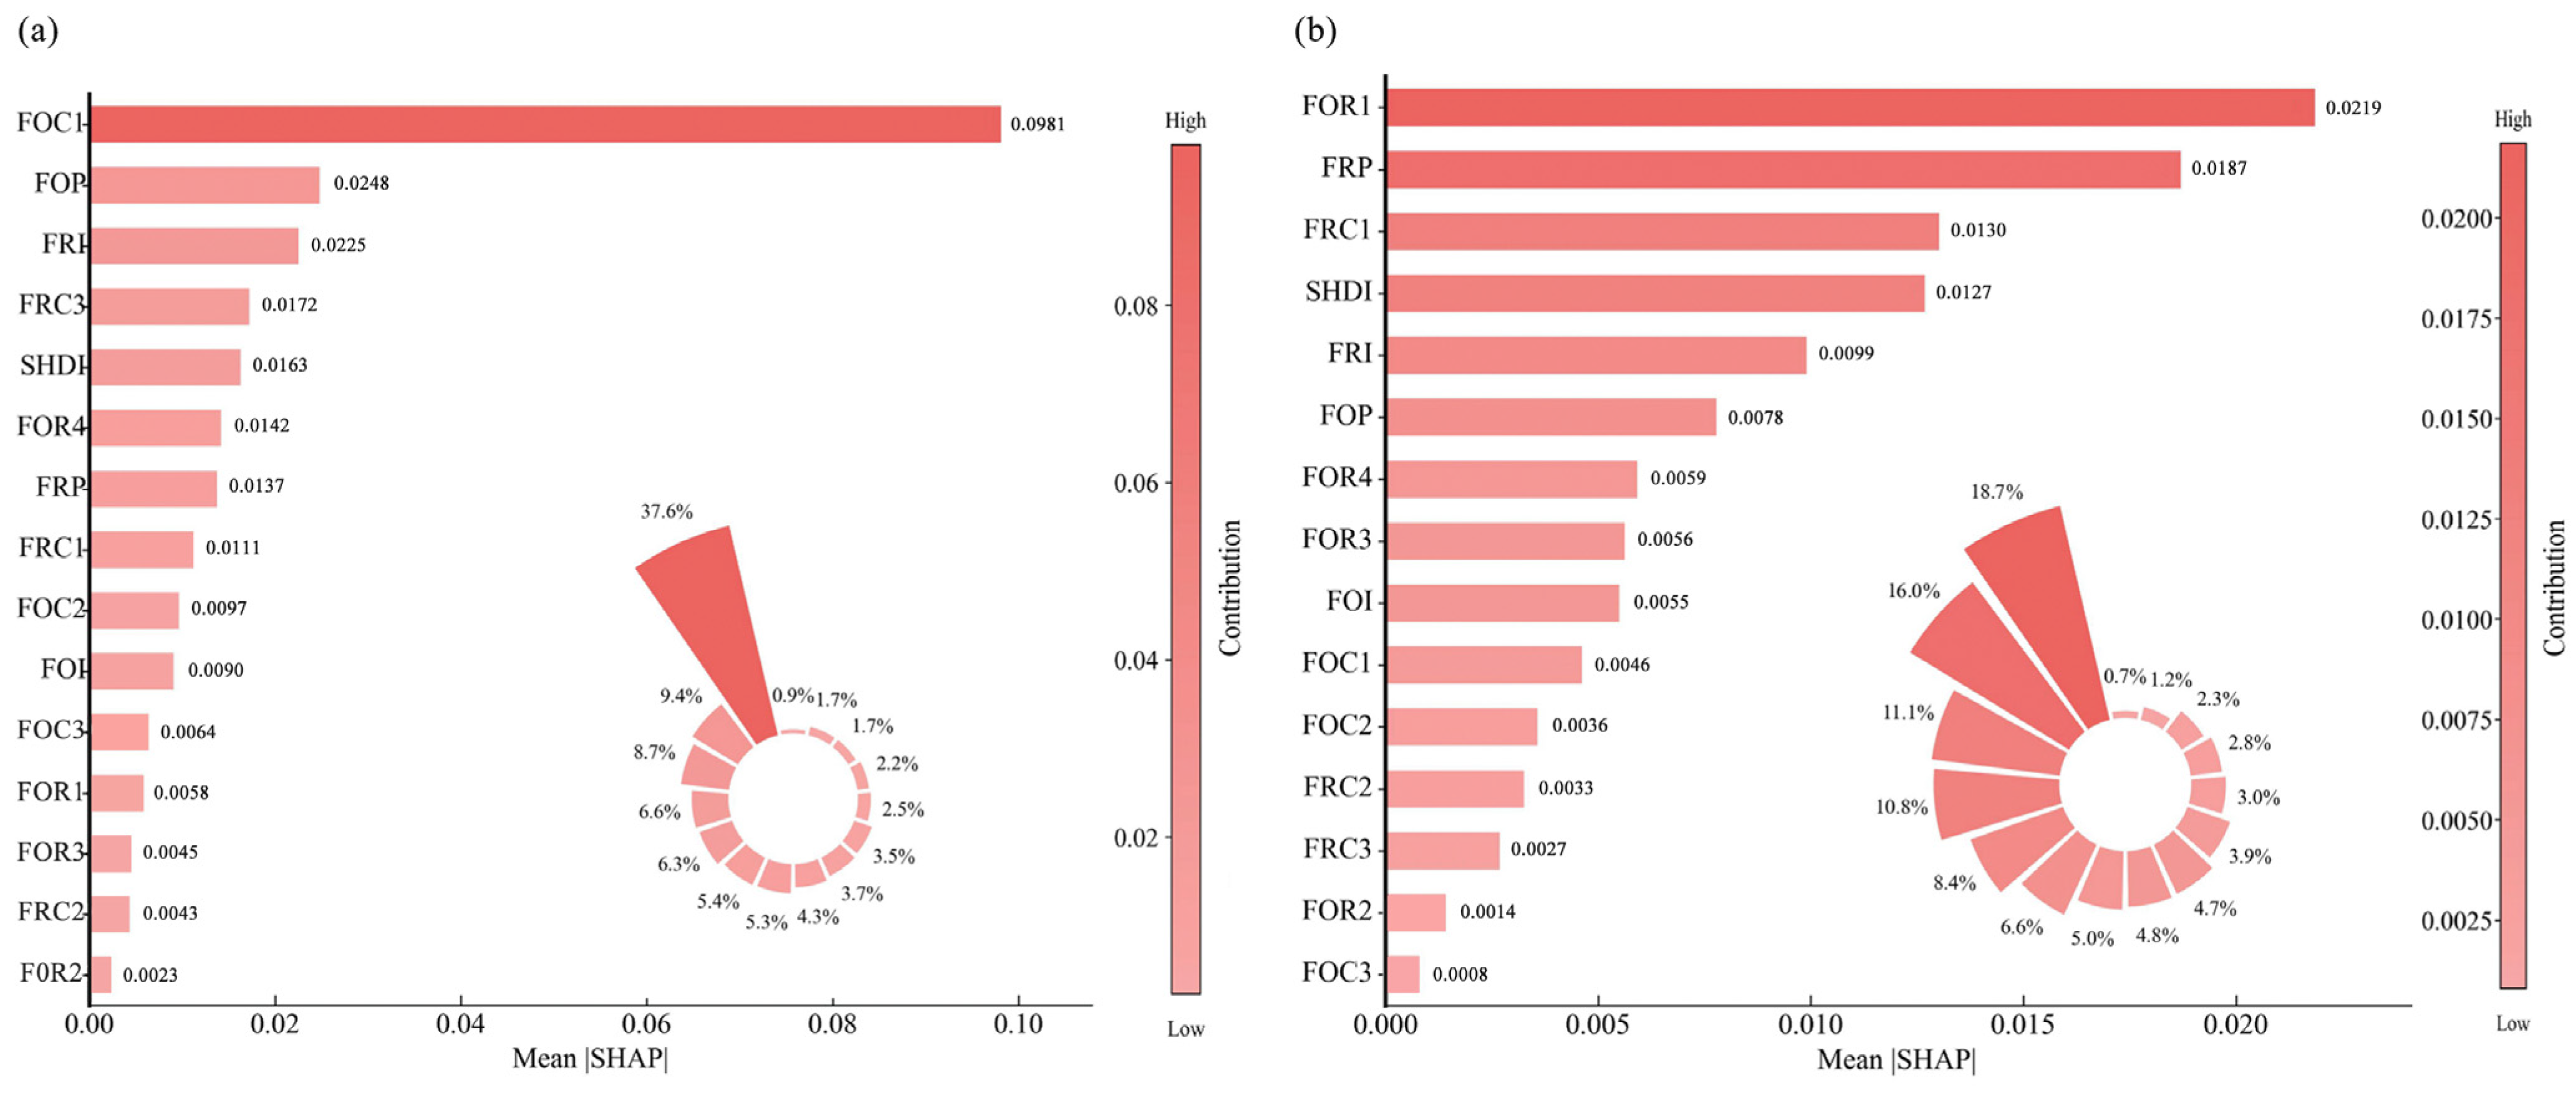
- UFZ with similar functional attributes and difference in building and green space configuration exert differentiated impacts on CEI. Within the density dimension, O1Z, PZ, and R2Z emerge as the most influential UFZ. In the morphology dimension, although identical indicators do not exhibit uniform effects across all UFZs, COHESION and AI consistently show the strongest explanatory power for CEI. In the structure dimension, FOX generally exerts a stronger influence than FRX. Overall, FOR1, FRP, and FOP show particularly pronounced effects on carbon emissions, while SHDI also plays an important role.
- (3)
- The impacts of UFZ form on CEI vary by zone type, with most indicators displaying nonlinear patterns and threshold-based sign reversals. Indicators such as PLAND, AI, and COHESION, as well as structural indicators including FOX, FRX, and SHDI, exhibit carbon mitigation effects within certain ranges. However, these effects are subject to diminishing marginal returns and may reverse into carbon-increasing impacts once critical thresholds are exceeded. This finding highlights the necessity of threshold-based and fine-grained regulation of UFZ form rather than uniform or monotonic control strategies.
Author Contributions
Funding
Institutional Review Board Statement
Informed Consent Statement
Data Availability Statement
Acknowledgments
Conflicts of Interest
Abbreviations
| CEI | Carbon emission intensity |
| UFZ | Urban functional zone |
| MAPU | Modifiable areal unit problem |
| YRD | Yangtze River Delta |
| GDP | Gross Domestic Product |
| NDVI | Normalized Difference Vegetation Index |
| POI | Point of Interest |
| SHAP | Shapley additive explanations |
| PCA | Principal component analysis |
| UDI | Urban Development Intensity |
| RZ | Residential Zone |
| R1Z | High-density mid- and low-rise residential Zone |
| R2Z | Low-density mid- and high residential Zone |
| R3Z | High-density mid- and high residential zone |
| R4Z | Low-density mid- and low-rise residential zone |
| CZ | Commercial zone |
| C1Z | Other commercial zone |
| C2Z | Individual commercial zone |
| C3Z | High-level commercial zone |
| IZ | Industrial zone |
| PZ | Public zone |
| TZ | Transportation zone |
| T1Z | Transportation road zone |
| T2Z | Transportation facilities zone |
| OZ | Open space zone |
| O1Z | Open green space zone |
| O2Z | Open square space zone |
| PLAND | Percentage of landscape |
| NLSI | Normalized landscape shape index |
| AI | Aggregation index |
| LPI | Largest patch index |
| COHESION | Patch cohesion index |
| FCI | Functional compactness index |
| RFCI | Residential functional compactness index |
| OFCI | Open space functional compactness index |
| SHDI | Shannon’s diversity index |
| VIF | Variance inflation factor |
| LOWESS | Locally weighted scatterplot smoothing |
References
- Tollefson, J. IPCC climate report: Earth is warmer than it’s been in 125,000 years. Nature 2021, 596, 171–172. [Google Scholar] [CrossRef] [Scilit]
- Hansen, J.; Lebedeff, S. Global trends of measured surface air temperature. J. Geophys. Res. 1987, 92, 13345–13372. [Google Scholar] [CrossRef] [Scilit]
- Leisner, C.P. Review: Climate change impacts on food security- focus on perennial cropping systems and nutritional value. Plant Sci. 2020, 293, 110412. [Google Scholar] [CrossRef] [Scilit] [PubMed]
- Pata, U.K. Renewable energy consumption, urbanization, financial development, income and CO2 emissions in Turkey: Testing EKC hypothesis with structural breaks. J. Clean. Prod. 2018, 187, 770–779. [Google Scholar] [CrossRef] [Scilit]
- Seto, K.C.; Fragkias, M.; Guneralp, B.; Reilly, M.K. A meta-analysis of global urban land expansion. PLoS ONE 2011, 6, e23777. [Google Scholar] [CrossRef] [Scilit] [PubMed]
- Ouyang, X.; Lin, B. Carbon dioxide (CO2) emissions during urbanization: A comparative study between China and Japan. J. Clean. Prod. 2017, 143, 356–368. [Google Scholar] [CrossRef] [Scilit]
- Tian, Y.; Yin, K.; Lu, D.; Hua, L.; Zhao, Q.; Wen, M. Examining Land Use and Land Cover Spatiotemporal Change and Driving Forces in Beijing from 1978 to 2010. Remote Sens. 2014, 6, 10593–10611. [Google Scholar] [CrossRef] [Scilit]
- Jia, X.; Zhang, Y.; Tan, R.R.; Li, Z.; Wang, S.; Wang, F.; Fang, K. Multi-objective energy planning for China’s dual carbon goals. Sustain. Prod. Consum. 2022, 34, 552–564. [Google Scholar] [CrossRef] [Scilit]
- Zhao, X.; Ma, X.; Chen, B.; Shang, Y.; Song, M. Challenges toward carbon neutrality in China: Strategies and countermeasures. Resour. Conserv. Recycl. 2022, 176, 105959. [Google Scholar] [CrossRef] [Scilit]
- Ou, J.; Liu, X.; Li, X.; Chen, Y. Quantifying the relationship between urban forms and carbon emissions using panel data analysis. Landsc. Ecol. 2013, 28, 1889–1907. [Google Scholar] [CrossRef] [Scilit]
- Qiliang, M.; Linlu, L.; Wenyan, J. Industrial policy and spatial arrangement of land leasing in China: A case of Jiangsu Province. Cities 2023, 139, 104401. [Google Scholar] [CrossRef] [Scilit]
- Yang, Y.; Xie, B.; Lyu, J.; Liang, X.; Ding, D.; Zhong, Y.; Song, T.; Chen, Q.; Guan, Q. Optimizing urban functional land towards “dual carbon” target: A coupling structural and spatial scales approach. Cities 2024, 148, 104860. [Google Scholar] [CrossRef] [Scilit]
- Jiang, Y.; Long, Y.; Liu, Q.; Dowaki, K.; Ihara, T. Carbon emission quantification and decarbonization policy exploration for the household sector—Evidence from 51 Japanese cities. Energy Policy 2020, 140, 111438. [Google Scholar] [CrossRef] [Scilit]
- Sun, C.; Zhang, Y.; Ma, W.; Wu, R.; Wang, S. The Impacts of Urban Form on Carbon Emissions: A Comprehensive Review. Land 2022, 11, 1430. [Google Scholar] [CrossRef] [Scilit]
- Shi, F.; Liao, X.; Shen, L.; Meng, C.; Lai, Y. Exploring the spatiotemporal impacts of urban form on CO2 emissions: Evidence and implications from 256 Chinese cities. Environ. Impact Assess. Rev. 2022, 96, 106850. [Google Scholar] [CrossRef] [Scilit]
- Fang, C.; Wang, S.; Li, G. Changing urban forms and carbon dioxide emissions in China: A case study of 30 provincial capital cities. Appl. Energy 2015, 158, 519–531. [Google Scholar] [CrossRef] [Scilit]
- Rahman, M.M.; Sultana, N.; Velayutham, E. Renewable energy, energy intensity and carbon reduction: Experience of large emerging economies. Renew. Energy 2022, 184, 252–265. [Google Scholar] [CrossRef] [Scilit]
- Zhou, B.; Zhang, C.; Song, H.; Wang, Q. How does emission trading reduce China’s carbon intensity? An exploration using a decomposition and difference-in-differences approach. Sci. Total Environ. 2019, 676, 514–523. [Google Scholar] [CrossRef] [Scilit] [PubMed]
- Dong, F.; Hu, M.; Gao, Y.; Liu, Y.; Zhu, J.; Pan, Y. How does digital economy affect carbon emissions? Evidence from global 60 countries. Sci. Total Environ. 2022, 852, 158401. [Google Scholar] [CrossRef] [Scilit] [PubMed]
- Ji, Q.; Li, C.; Makvandi, M.; Zhou, X. Impacts of urban form on integrated energy demands of buildings and transport at the community level: A comparison and analysis from an empirical study. Sustain. Cities Soc. 2022, 79, 103680. [Google Scholar] [CrossRef] [Scilit]
- Mussawar, O.; Mayyas, A.; Azar, E. Built form and function as determinants of urban energy performance: An integrated agent-based modeling approach and case study. Sustain. Cities Soc. 2023, 96, 104660. [Google Scholar] [CrossRef] [Scilit]
- Iungman, T.; Khomenko, S.; Barboza, E.P.; Cirach, M.; Goncalves, K.; Petrone, P.; Erbertseder, T.; Taubenbock, H.; Chakraborty, T.; Nieuwenhuijsen, M. The impact of urban configuration types on urban heat islands, air pollution, CO(2) emissions, and mortality in Europe: A data science approach. Lancet Planet Health 2024, 8, e489–e505. [Google Scholar] [CrossRef] [Scilit] [PubMed]
- Shang, S.; Du, S.; Du, S.; Zhu, S. Estimating building-scale population using multi-source spatial data. Cities 2021, 111, 103002. [Google Scholar] [CrossRef] [Scilit]
- Ma, X.; Yang, J.; Sun, D.; Zhang, R.; Xiao, X.; Xia, J. Fine allocation of sectoral carbon emissions at block scale and contribution of functional zones. Ecol. Inform. 2023, 78, 102293. [Google Scholar] [CrossRef] [Scilit]
- Huang, Y.; Li, S.; Lin, J.; Zheng, L.; Zhuang, C.; Guan, C.; Guo, Y.; Zhuang, Y. Nonlinear and threshold effects of urban building form on carbon emissions. Energy Build. 2025, 329, 115243. [Google Scholar] [CrossRef] [Scilit]
- Li, G.; Wang, W.; Li, B.; Duan, Z.; Hu, L.; Liu, J. Spatiotemporal simulation of blue-green space pattern evolution and carbon storage under different SSP-RCP scenarios in Wuhan. Sci. Rep. 2025, 15, 4017. [Google Scholar] [CrossRef] [Scilit] [PubMed]
- Lan, T.; Shao, G.; Xu, Z.; Tang, L.; Dong, H. Considerable role of urban functional form in low-carbon city development. J. Clean. Prod. 2023, 392, 136256. [Google Scholar] [CrossRef] [Scilit]
- Lee, D.; Robertson, C.; Ramsay, C.; Pyper, K. Quantifying the impact of the modifiable areal unit problem when estimating the health effects of air pollution. Environmetrics 2020, 31, e2643. [Google Scholar] [CrossRef] [Scilit]
- Anderson, W.P.; Kanaroglou, P.S.; Miller, E.J. Urban Form, Energy and the Environment: A Review of Issues, Evidence and Policy. Urban Stud. 1996, 33, 7–35. [Google Scholar] [CrossRef] [Scilit]
- Qi, J.; Xiong, W.; Li, J.; Zheng, J.; Ye, Q.; Hu, M. Investigating non-linear and synergistic effects of urban functional zone morphology on land surface temperature. Sustain. Cities Soc. 2025, 130, 106546. [Google Scholar] [CrossRef] [Scilit]
- Xing, X.; Shi, W.; Wu, X.; Liu, Y.; Wang, X.; Zhang, Y. Towards a more compact urban form: A spatial-temporal study on the multi-dimensional compactness index of urban form in China. Appl. Geogr. 2024, 171, 103368. [Google Scholar] [CrossRef] [Scilit]
- Murathan, E.K.; Manioğlu, G. Impact of urban form on energy performance, outdoor thermal comfort, and urban heat island: A case study in Istanbul. Energy Build. 2025, 345, 116109. [Google Scholar] [CrossRef] [Scilit]
- Zhang, W.; Huang, B.; Luo, D. Effects of land use and transportation on carbon sources and carbon sinks: A case study in Shenzhen, China. Landsc. Urban Plan. 2014, 122, 175–185. [Google Scholar] [CrossRef] [Scilit]
- Huo, T.; Li, X.; Cai, W.; Zuo, J.; Jia, F.; Wei, H. Exploring the impact of urbanization on urban building carbon emissions in China: Evidence from a provincial panel data model. Sustain. Cities Soc. 2020, 56, 102068. [Google Scholar] [CrossRef] [Scilit]
- Liu, Z.; Xu, Q.; Lyu, S.; Yang, R.; Wan, Z. A Review of the Impact of Urban Form on Building Carbon Emissions. Buildings 2025, 15, 2604. [Google Scholar] [CrossRef] [Scilit]
- Fleischmann, M.; Romice, O.; Porta, S. Measuring urban form: Overcoming terminological inconsistencies for a quantitative and comprehensive morphologic analysis of cities. Environ. Plan. B Urban Anal. City Sci. 2020, 48, 2133–2150. [Google Scholar] [CrossRef] [Scilit]
- An, Y.; Wen, G.; Fan, M.; Zhao, P.; Sun, J.; He, M.; Bao, H.; Li, Y.; Li, N.; Zhang, F.; et al. Towards sustainable urban development: Decoding the spatiotemporal relationship between urban spatial structure and carbon emissions. Carbon Balance Manag. 2025, 20, 17. [Google Scholar] [CrossRef] [Scilit] [PubMed]
- Feng, T.; Zhou, B. Impact of urban spatial structure elements on carbon emissions efficiency in growing megacities: The case of Chengdu. Sci. Rep. 2023, 13, 9939. [Google Scholar] [CrossRef] [Scilit] [PubMed]
- Hong, S.; Hui, E.C.-m.; Lin, Y. Relationship between urban spatial structure and carbon emissions: A literature review. Ecol. Indic. 2022, 144, 109456. [Google Scholar] [CrossRef] [Scilit]
- Wu, J.; Jones, K.B.; Li, H.; Loucks, O.L. Concepts of Scale and Scaling; Springer: Dordrecht, The Netherlands, 2006; pp. 3–15. [Google Scholar]
- Moran, P.A.P. Notes on Continuous Stochastic Phenomena. Biometrika 1950, 37, 17–23. [Google Scholar] [CrossRef] [Scilit] [PubMed]
- Tan, G.; Zhang, X.; Xiong, S.; Sun, Z.; Lei, Y.; Wang, H.; Du, S. Assessing the impacts of urban functional form on anthropogenic carbon emissions: A case study of 31 major cities in China. Ecol. Indic. 2024, 167, 112700. [Google Scholar] [CrossRef] [Scilit]
- Huang, X.; Wang, Y. Investigating the effects of 3D urban morphology on the surface urban heat island effect in urban functional zones by using high-resolution remote sensing data: A case study of Wuhan, Central China. ISPRS J. Photogramm. Remote Sens. 2019, 152, 119–131. [Google Scholar] [CrossRef] [Scilit]
- Liu, Y.; Zhang, W.; Liu, W.; Tan, Z.; Hu, S.; Ao, Z.; Li, J.; Xing, H. Exploring the seasonal effects of urban morphology on land surface temperature in urban functional zones. Sustain. Cities Soc. 2024, 103, 105268. [Google Scholar] [CrossRef] [Scilit]
- Tu, Y.; Chen, B.; Zhang, T.; Xu, B. Regional Mapping of Essential Urban Land Use Categories in China: A Segmentation-Based Approach. Remote Sens. 2020, 12, 1058. [Google Scholar] [CrossRef] [Scilit]
- Liu, H.; Huang, B.; Zhan, Q.; Gao, S.; Li, R.; Fan, Z. The influence of urban form on surface urban heat island and its planning implications: Evidence from 1288 urban clusters in China. Sustain. Cities Soc. 2021, 71, 102987. [Google Scholar] [CrossRef] [Scilit]
- Chen, Y.; Huang, L. Modeling growth curve of fractal dimension of urban form of Beijing. Phys. A Stat. Mech. Its Appl. 2019, 523, 1038–1056. [Google Scholar] [CrossRef] [Scilit]
- Qiao, J.; Li, Y.; Yu, J. Administrative-led urbanization and urban carbon emission intensity: Evidence from city-county merger in China. Energy Econ. 2024, 136, 107615. [Google Scholar] [CrossRef] [Scilit]
- Lan, T.; Shao, G.; Xu, Z.; Tang, L.; Sun, L. Measuring urban compactness based on functional characterization and human activity intensity by integrating multiple geospatial data sources. Ecol. Indic. 2021, 121, 107177. [Google Scholar] [CrossRef] [Scilit]
- Zhang, Y.; Wang, Y.; Ding, N.; Yang, X. Spatial Pattern Impact of Impervious Surface Density on Urban Heat Island Effect: A Case Study in Xuzhou, China. Land 2022, 11, 2135. [Google Scholar] [CrossRef] [Scilit]
- Chertow, M.R. The IPAT Equation and Its Variants. J. Ind. Ecol. 2000, 4, 13–29. [Google Scholar] [CrossRef] [Scilit]
- Chen, T.; Guestrin, C. XGBoost: A Scalable Tree Boosting System. In Proceedings of the 22nd ACM SIGKDD International Conference on Knowledge Discovery and Data Mining, San Francisco, CA, USA, 13–17 August 2016; Association for Computing Machinery: New York, NY, USA, 2016; pp. 785–794. [Google Scholar] [CrossRef] [Scilit]
- Xu, C.; Xiong, W.; Zhang, S.; Shi, H.; Wu, S.; Bao, S.; Xiao, T. Research on the Nonlinear Relationship Between Carbon Emissions from Residential Land and the Built Environment: A Case Study of Susong County, Anhui Province Using the XGBoost-SHAP Model. Land 2025, 14, 440. [Google Scholar] [CrossRef] [Scilit]
- Shlens, J. A Tutorial on Principal Component Analysis. Int. J. Remote Sens. 2014, 51. [Google Scholar]
- Zaki, A.; Przewoźna, P.; Matczak, P.; Witkowski, M.; Kuchcik, M.; Jabkowski, P. Principal component analysis and fuzzy clustering for neighborhood-scale urban morphology-based thermal hazard assessment. Sustain. Cities Soc. 2026, 147, 107551. [Google Scholar] [CrossRef] [Scilit]
- Han, D.; An, H.; Wang, F.; Xu, X.; Qiao, Z.; Wang, M.; Sui, X.; Liang, S.; Hou, X.; Cai, H.; et al. Understanding seasonal contributions of urban morphology to thermal environment based on boosted regression tree approach. Build. Environ. 2022, 226, 109770. [Google Scholar] [CrossRef] [Scilit]
- Davtalab, M.; Byčenkienė, S. Synergistic effects of spatial urban form on PM2.5 concentration and urban heat islands: A multi-scale explanatory machine learning. J. Clean. Prod. 2026, 538, 147226. [Google Scholar] [CrossRef] [Scilit]
- Li, Y.; Zhang, Y.; Wu, Q.; Xue, R.; Wang, X.; Si, M.; Zhang, Y. Greening the concrete jungle: Unveiling the co-mitigation of greenspace configuration on PM2.5 and land surface temperature with explanatory machine learning. Urban For. Urban Green. 2023, 88, 128086. [Google Scholar] [CrossRef] [Scilit]
- Meng, J.; Han, W.; Yuan, C. Seasonal and multi-scale difference of the relationship between built-up land landscape pattern and PM2.5 concentration distribution in Nanjing. Ecol. Indic. 2023, 156, 111079. [Google Scholar] [CrossRef] [Scilit]
- Li, S.; Sun, Z.; Wen, R.; Yang, H.; Li, J.; Chen, T.; Zheng, Y.; Zhu, N. Spatiotemporal patterns and the influence mechanism of urban landscape pattern on carbon emission performance: Evidence from Chinese cities. Sustain. Cities Soc. 2025, 118, 106042. [Google Scholar] [CrossRef] [Scilit]
- Wang, S.; Zeng, X.; Huang, Y.; Li, X. Analysing urban local cold air dynamics and climate functional zones using interpretable machine learning: A case study of Tianhe district, Guangzhou. Sustain. Cities Soc. 2024, 114, 105731. [Google Scholar] [CrossRef] [Scilit]
- Wang, X.; Li, Z.; Kee, T. Spatial and temporal correlation between green space landscape pattern and carbon emission—Three major coastal urban agglomerations in China. Urban Clim. 2024, 58, 102222. [Google Scholar] [CrossRef] [Scilit]
- Belgiu, M.; Drăguţ, L. Random forest in remote sensing: A review of applications and future directions. ISPRS J. Photogramm. Remote Sens. 2016, 114, 24–31. [Google Scholar] [CrossRef] [Scilit]
- Zhang, J.; Cui, P.; Song, H. Impact of urban morphology on outdoor air temperature and microclimate optimization strategy base on Pareto optimality in Northeast China. Build. Environ. 2020, 180, 107035. [Google Scholar] [CrossRef] [Scilit]
- Boeing, G.; Pilgram, C.; Lu, Y. Urban street network design and transport-related greenhouse gas emissions around the world. Transp. Res. Part D Transp. Environ. 2024, 127, 103961. [Google Scholar] [CrossRef] [Scilit]
- Liu, Y.; Wu, Y.; Zhu, X. Industrial clusters and carbon emission reduction: Evidence from China. Ann. Reg. Sci. 2024, 73, 557–597. [Google Scholar] [CrossRef] [Scilit]
- Tang, H.; Qiu, H.; Yang, Y. Thermal environment disparities across 11 cities in the greater bay area: Nonlinear relationships and urban greening-based solutions. Sustain. Cities Soc. 2025, 133, 106867. [Google Scholar] [CrossRef] [Scilit]
- Zhang, S.; Ding, J.; Zheng, H.; Wang, H. Does spatial functional division in urban agglomerations reduce negative externalities in large cities? Evidence from urban agglomerations in China. Heliyon 2023, 9, e20419. [Google Scholar] [CrossRef] [Scilit] [PubMed]
- Zhang, S.; Miao, X.; Zheng, H.; Chen, W.; Wang, H. Spatial functional division in urban agglomerations and carbon emission intensity: New evidence from 19 urban agglomerations in China. Energy 2024, 300, 131541. [Google Scholar] [CrossRef] [Scilit]





| Category | Name | Time | Source | Resolution |
|---|---|---|---|---|
| Carbon emissions | ODIAC2024 | 2023 | https://lpdaac.usgs.gov/products/mod11a1v061/ (accessed on 10 January 2026) | 1 km |
| Remote Sensing Data | Annual China Land Cover Dataset | 2023 | https://doi.org/10.5281/zenodo.8176941 | 30 m |
| Landsat Collection 2 Level-2 | 2023 | https://www.usgs.gov/landsat-missions (accessed on 10 January 2026) | 30 m | |
| Grid data | Kilometer Grid Dataset of Spatial Distribution of China’s GDP | 2020 | http://www.resdc.cn/ (accessed on 10 January 2026) | 1 km |
| VIIRS Nighttime Lights | 2023 | https://eogdata.mines.edu/products/vnl/ (accessed on 10 January 2026) | 500 m | |
| NDVI Dataset | 2023 | https://lpdaac.usgs.gov/products/mod13q1v061/ (accessed on 10 January 2026) | 30 m | |
| LandScan | 2023 | https://landscan.ornl.gov/ (accessed on 10 January 2026) | 1 km | |
| Vector data | Vector road map | 2023 | https://openmaptiles.org/ (accessed on 10 January 2026) | – |
| China Multi-Attribute Building | 2022–2024 | https://doi.org/10.1038/s41597-025-04730-5 | 0.3–1 m | |
| POI data | 2023 | https://lbs.amap.com/api/webservice/guide/api (accessed on 10 January 2026) | – |
| Primary Function Category | Secondary Functional Category |
|---|---|
| Residential Zone, RZ | High-density mid- and low-rise residential Zone, R1Z |
| Low-density mid- and high-rise residential Zone, R2Z | |
| High-density mid- and high-rise residential Zone, R3Z | |
| Low-density mid- and low-rise residential Zone, R4Z | |
| Commercial Zone, CZ | Other Commercial Zone, C1Z |
| Individual Commercial Zone, C2Z | |
| High-level Commercial Zone, C3Z | |
| Industrial Zone, IZ | Industrial Zone, IZ |
| Public Zone, PZ | Public Zone, PZ |
| Transportation Zone, TZ | Transportation road Zone, T1Z |
| Transportation facilities Zone, T2Z | |
| Open Space Zone, OZ | Open green space Zone, O1Z |
| Open square Space Zone, O2Z |
| Components | Indicators | Abbr. | Formula | Descriptions |
|---|---|---|---|---|
| Density | Percentage of Landscape | Percentage of the area of a given UFZ type relative to the total patch area. | ||
| Morphology | The largest patch index | Percentage of the largest patch area of a given UFZ type relative to the total patch area. | ||
| Normalized Landscape Shape Index | Normalized measure of patch edge complexity within a UFZ. | |||
| Aggregation Index | Degree of aggregation of patches of the same type within a UFZ. | |||
| Patch Cohesion Index | Connectivity and cohesion of patches within a UFZ. | |||
| Structure | Residential Functional Compactness Index | RFCI | Composite indicator quantifying UFZ compactness, where FRX denotes the spatial interaction between residential human activity intensity and that of another zone. | |
| Open space Functional Compactness Index | OFCI | Degree of functional coupling between urban green and open spaces and other UFZ, where FOX denotes the spatial interaction between ecosystem service intensity of green and open spaces and human activity intensity in another zone. | ||
| Shannon’s Diversity Index | SHDI | Diversity of different patch types within a UFZ. |
| Scale (km) | Cumulative Variance Contribution Rate | Maximum VIF Value | ||
|---|---|---|---|---|
| Density | Morphology | Structure | ||
| 1 | 73.78% | 70.02% | 69.12% | 6.01 |
| 2 | 75.71% | 70.11% | 71.08% | 4.74 |
| 3 | 75.78% | 70.26% | 72.58% | 4.25 |
| 4 | 78.40% | 71.74% | 73.13% | 3.89 |
| 5 | 80.19% | 72.17% | 70.99% | 3.62 |
| 6 | 77.13% | 71.61% | 76.12% | 3.69 |
| 7 | 78.66% | 72.64% | 74.87% | 3.49 |
| 8 | 80.37% | 73.38% | 77.08% | 3.96 |
| 9 | 79.97% | 73.52% | 77.42% | 3.98 |
| 10 | 80.63% | 73.44% | 74.58% | 3.3 |
| 11 | 81.99% | 73.02% | 75.66% | 5.26 |
| 12 | 82.12% | 74.98% | 77.97% | 4.2 |
| 13 | 80.54% | 74.60% | 81.41% | 5.24 |
| 14 | 83.08% | 75.57% | 83.14% | 6.26 |
| 15 | 80.27% | 75.03% | 79.64% | 5.36 |
Disclaimer/Publisher’s Note: The statements, opinions and data contained in all publications are solely those of the individual author(s) and contributor(s) and not of MDPI and/or the editor(s). MDPI and/or the editor(s) disclaim responsibility for any injury to people or property resulting from any ideas, methods, instructions or products referred to in the content. |
© 2026 by the authors. Licensee MDPI, Basel, Switzerland. This article is an open access article distributed under the terms and conditions of the Creative Commons Attribution (CC BY) license.
Share and Cite
Xu, W.; Wei, M.; Zuo, M.; Liu, J. Scale Dependence and Nonlinear Effects of Urban Functional Zone Form on Carbon Emission Intensity: Evidence from Yangtze River Delta Agglomeration. Sustainability 2026, 18, 7036. https://doi.org/10.3390/su18147036
Xu W, Wei M, Zuo M, Liu J. Scale Dependence and Nonlinear Effects of Urban Functional Zone Form on Carbon Emission Intensity: Evidence from Yangtze River Delta Agglomeration. Sustainability. 2026; 18(14):7036. https://doi.org/10.3390/su18147036
Chicago/Turabian StyleXu, Wanyi, Mingzhen Wei, Minghao Zuo, and Junnan Liu. 2026. "Scale Dependence and Nonlinear Effects of Urban Functional Zone Form on Carbon Emission Intensity: Evidence from Yangtze River Delta Agglomeration" Sustainability 18, no. 14: 7036. https://doi.org/10.3390/su18147036
APA StyleXu, W., Wei, M., Zuo, M., & Liu, J. (2026). Scale Dependence and Nonlinear Effects of Urban Functional Zone Form on Carbon Emission Intensity: Evidence from Yangtze River Delta Agglomeration. Sustainability, 18(14), 7036. https://doi.org/10.3390/su18147036